Article

Framework Integrating Lossy Compression and Perturbation for the Case of Smart Meter Privacy

1
Department of Electrical Power Systems, Helmut Schmidt University Hamburg, 22043 Hamburg, Germany
2
School of Electrical and Information Engineering, Tianjin University, Tianjin 300072, China
3
Department of Engineering Science, Oxford University, Oxford OX1 2JD, UK
*
Author to whom correspondence should be addressed.
Electronics 2020, 9(3), 465; https://doi.org/10.3390/electronics9030465
Submission received: 28 February 2020 / Revised: 6 March 2020 / Accepted: 7 March 2020 / Published: 10 March 2020
(This article belongs to the Special Issue Grid Integration of Decentralized Generation Plants)

Abstract

:
The encoding of high-resolution energy profile datasets from end-users generated by smart electricity meters while maintaining the fidelity of relevant information seems to be one of the backbones of smart electrical markets. In the end-user sphere of smart grids, specific load curves of households can easily be utilized to aggregate detailed information about customer’s daily activities, which would be attractive for cyber attacks. Based on a dataset measured by a smart meter installed in a German household, this paper integrates two complementary approaches to encrypt load profile datasets. On the one hand, the paper explains an integration of a lossy compression and classification technique, which is usable for individual energy consumption profiles of households. On the other hand, a perturbation approach with the Gaussian distribution is used to enhance the safety of a large amount of privacy profiles. By this complete workflow, involving the compression and perturbation, the developed framework sufficiently cut off the chance of de-noising attacks on private data and implement an additional, easy-to-handle layer of data security.

1. Introduction

This paper develops and investigates two methodologies to encode power profile datasets, which could be used to supervise the electrical grid or to evaluate the network status. Because smart grids, smart homes, grid stability monitoring or the development of new energy services are based on fine-grained and high bandwidth datasets, the raising amount of meters in low and medium voltage grids or facilities are generating and transferring a bulk of data. Furthermore, these high-granulated energy data streams could be utilized to provide new services to energy consumers, utilities or service providers by analyzing and forecasting their load demand [1]. That is why smart meter data are a crucial enabler in the frame of smart grids. An oncoming widespread roll-out of smart meter results in three main problems: (I) the regulations and concepts of privacy are currently badly defined and changing only slowly, (II) the process of data input, aggregation, management and merging requires a vast amount of human and computational resources and (III) the complexity of information extraction possibilities and the major negative influence on privacy have not been fully conceived [1,2].
These present and future challenges, especially problems (II) and (III), could be addressed by the following approaches. However, this development and evolution induces massive privacy concerns. In [3], the relevance of smart meter data privacy and the reasons for protecting private information are analyzed. It was demonstrated that already in the 1990s, individual information could be separated from household load profiles. The used so-called NILM—non-intrusive load monitoring technique, illustrated the appliance information, which could be used to collect sleepwake-cycles or the presence of people [4,5].
This paper addresses the issue of morphing data streams in the context of encoding. The focus of this paper are energy consumption profiles, but it should be possible to apply the approaches on other test cases. Out of the scope is the technical background of the implementation or any kind of novel privacy–utility tradeoff solution. Both approaches just focus on the continuous communication over a/many bandlimited (e.g., finite human or computational capacity) channel(s) with a cyber attack during this transmission.
Section 2 describes related work of data compression, perturbation and typical approaches to protect privacy in smart meter data. The first approach, including four different lossy compression approaches and the classification, is explained in Section 3. This section outlines two already known and two enhanced lossy compression methodologies. Considering the temporal feature of the dataset, it also explains the (long short-term memory) LSTM classification technique to determine the resulting encoding approach. The second approach, which uses perturbation and a Gaussian distribution encoding to protect the privacy of household owners, is presented in Section 4. This approach questions the privacy-preserving capability of a random value perturbation. The key matrices and the test case of the paper are introduced in Section 5. Performance results are given in Section 6. In the end, the conclusion and an outlook are drawn in Section 6. A general overview of this paper structure is shown in Figure 1.

2. State of the Art

2.1. Data Compression in General

A general overview of data compression methods for several types of compression may be found in [6,7,8,9,10]. Focusing on audio (e.g., FLAC and MPEG-Audio-Layer 3), text (e.g., Huffman coding and RLE), image (e.g., PNG) and video (e.g., AASC) compression, all of the methodologies are classified into lossless and lossy techniques. Lossless ones achieves an identical dataset after the decompression [7]. Lossy ones generate better compression results by losing information. When the compressed data is decompressed, the result is not fully matching with the original stream. Due to the volume of datasets in smart grids that will be required for load prediction, transmission or storage in the future, higher compression ratios may be required.
Different methodologies have been developed to compress smart meter or smart grid data streams [2,10,11,12,13]. Lossless compression techniques like the Huffman coding or Lempel–Markov algorithm achieve performances of average compression ratios (CRs) between 5:1 and 20:1 [3,14]. All lossless compression techniques show that smart meter raw data are well compressible [2]. Lossy compression techniques reach much higher ratios, especially the WT (wavelet transformation) and SVD (singular value decomposition) or SAX (symbolic aggregation approximation in [15]). Sacrificing irrelevant information, the aims of those techniques are compressing data to retain the most valuable specifications of the original data (ideally) [3]. That is why this paper uses different lossy compression techniques, which reach the above mentioned aims and are considered more promising in the presented cases.

2.2. Protection of Privacy Power Usage

Protecting the individual privacy as a consumer of electricity can be divided into three clusters: (A) data distortion algorithms, (B) load concealing methodologies based on batteries and (C) data aggregation protocols.
The approaches of (A) deform power usage streams directly and take into account the PUTO (privacy–utility trade-off) as well. The theoretical background of PUTO was presented in [1,16,17], respectively. Reference [18] introduces a batch and an online scheme for time-series power usage data based on this framework. They show that companies are not capable of tracing individual household load profiles, nor of charging the owner or estimating power states accurately.
BLH (battery-based load hiding) algorithms are interfering with the appliance load profiles or power usage by using batteries. Typical BLH algorithms are NILL (non-intrusive load leveling by [19]) and BE (best effort by [20]). However, these approaches have disadvantages: the counting costs of the hardware, the decrease of the battery lifespan due to a frequent charging and discharging of the energy storage and the charging rate is usually restricted due to the battery capacity.
By using cluster (C): cryptographic protocols, a significant data aggregation is achieved as well. These methodologies protecting the privacy by combining the total ciphertext. Power grid utilities record multiple users’ total power habits without knowing user’s exact load profile by using PKHE (public key based homomorphic encryption by [21]) or HE (homomorphic encryption by [22]). The general limitations of data aggregation protocols are e.g., the IT-complex, unstable protocol or the data resolution of the output [23].

2.3. Compression Approaches for Privacy Power Usage

Different reports analyze the influence of granulation (a relevant part of the compression methodologies) on smart meter privacy. This leads to the result that the privacy of smart meter load profiles can be increased by decreasing the resolution [24]. In the special case of using lossy compression methodologies to raise the privacy, Refs. [25,26,27] analyze the individual user’s control over access to their end-user data in different granulated resolutions. For example, Ref. [26] analyses different options of the wavelet transform, creating multi-resolution representations of 400 end-user profiles with a sampling interval of 15 min. By using multiple keys, different granularity’s of the wavelet transform are enciphered and different compression ratios are saved. No other lossy methodologies have been analyzed so far.

2.4. Perturbation with Gaussian Distribution Encoding

There are different methodologies which are implemented by adding random noise to the data. The aim is to take care of the individual data points by distortion and preserving the underlying distribution properties at a macroscopic level. Some of them are techniques for association rule learning [28], learning decision trees [29] or other approaches using different perturbation methods of noising the input information [30,31,32]. All of these do not consider the distribution of the original data, which would be used to achieve a higher accuracy.
Basic forms of multiplicative noise perturbation are the multiplication of each data point by a random number that has a truncated Gaussian distribution (with mean value one x ¯ and small variance σ ). This seems to be good if the data disseminator only wants to make minor changes to the logarithmic approach and the original dataset. Another methodology transforms by logarithmizing and adding Gaussian noise (noise with the property predefined multivariate). The taken antilog of the data assures higher security but maintains the data utility in the logarithmic scale [33]. The primary contribution of the second approach is to provide an explicit filtering procedure, based on the random Gaussian noise without maintaining the input data, to estimate the original data values.

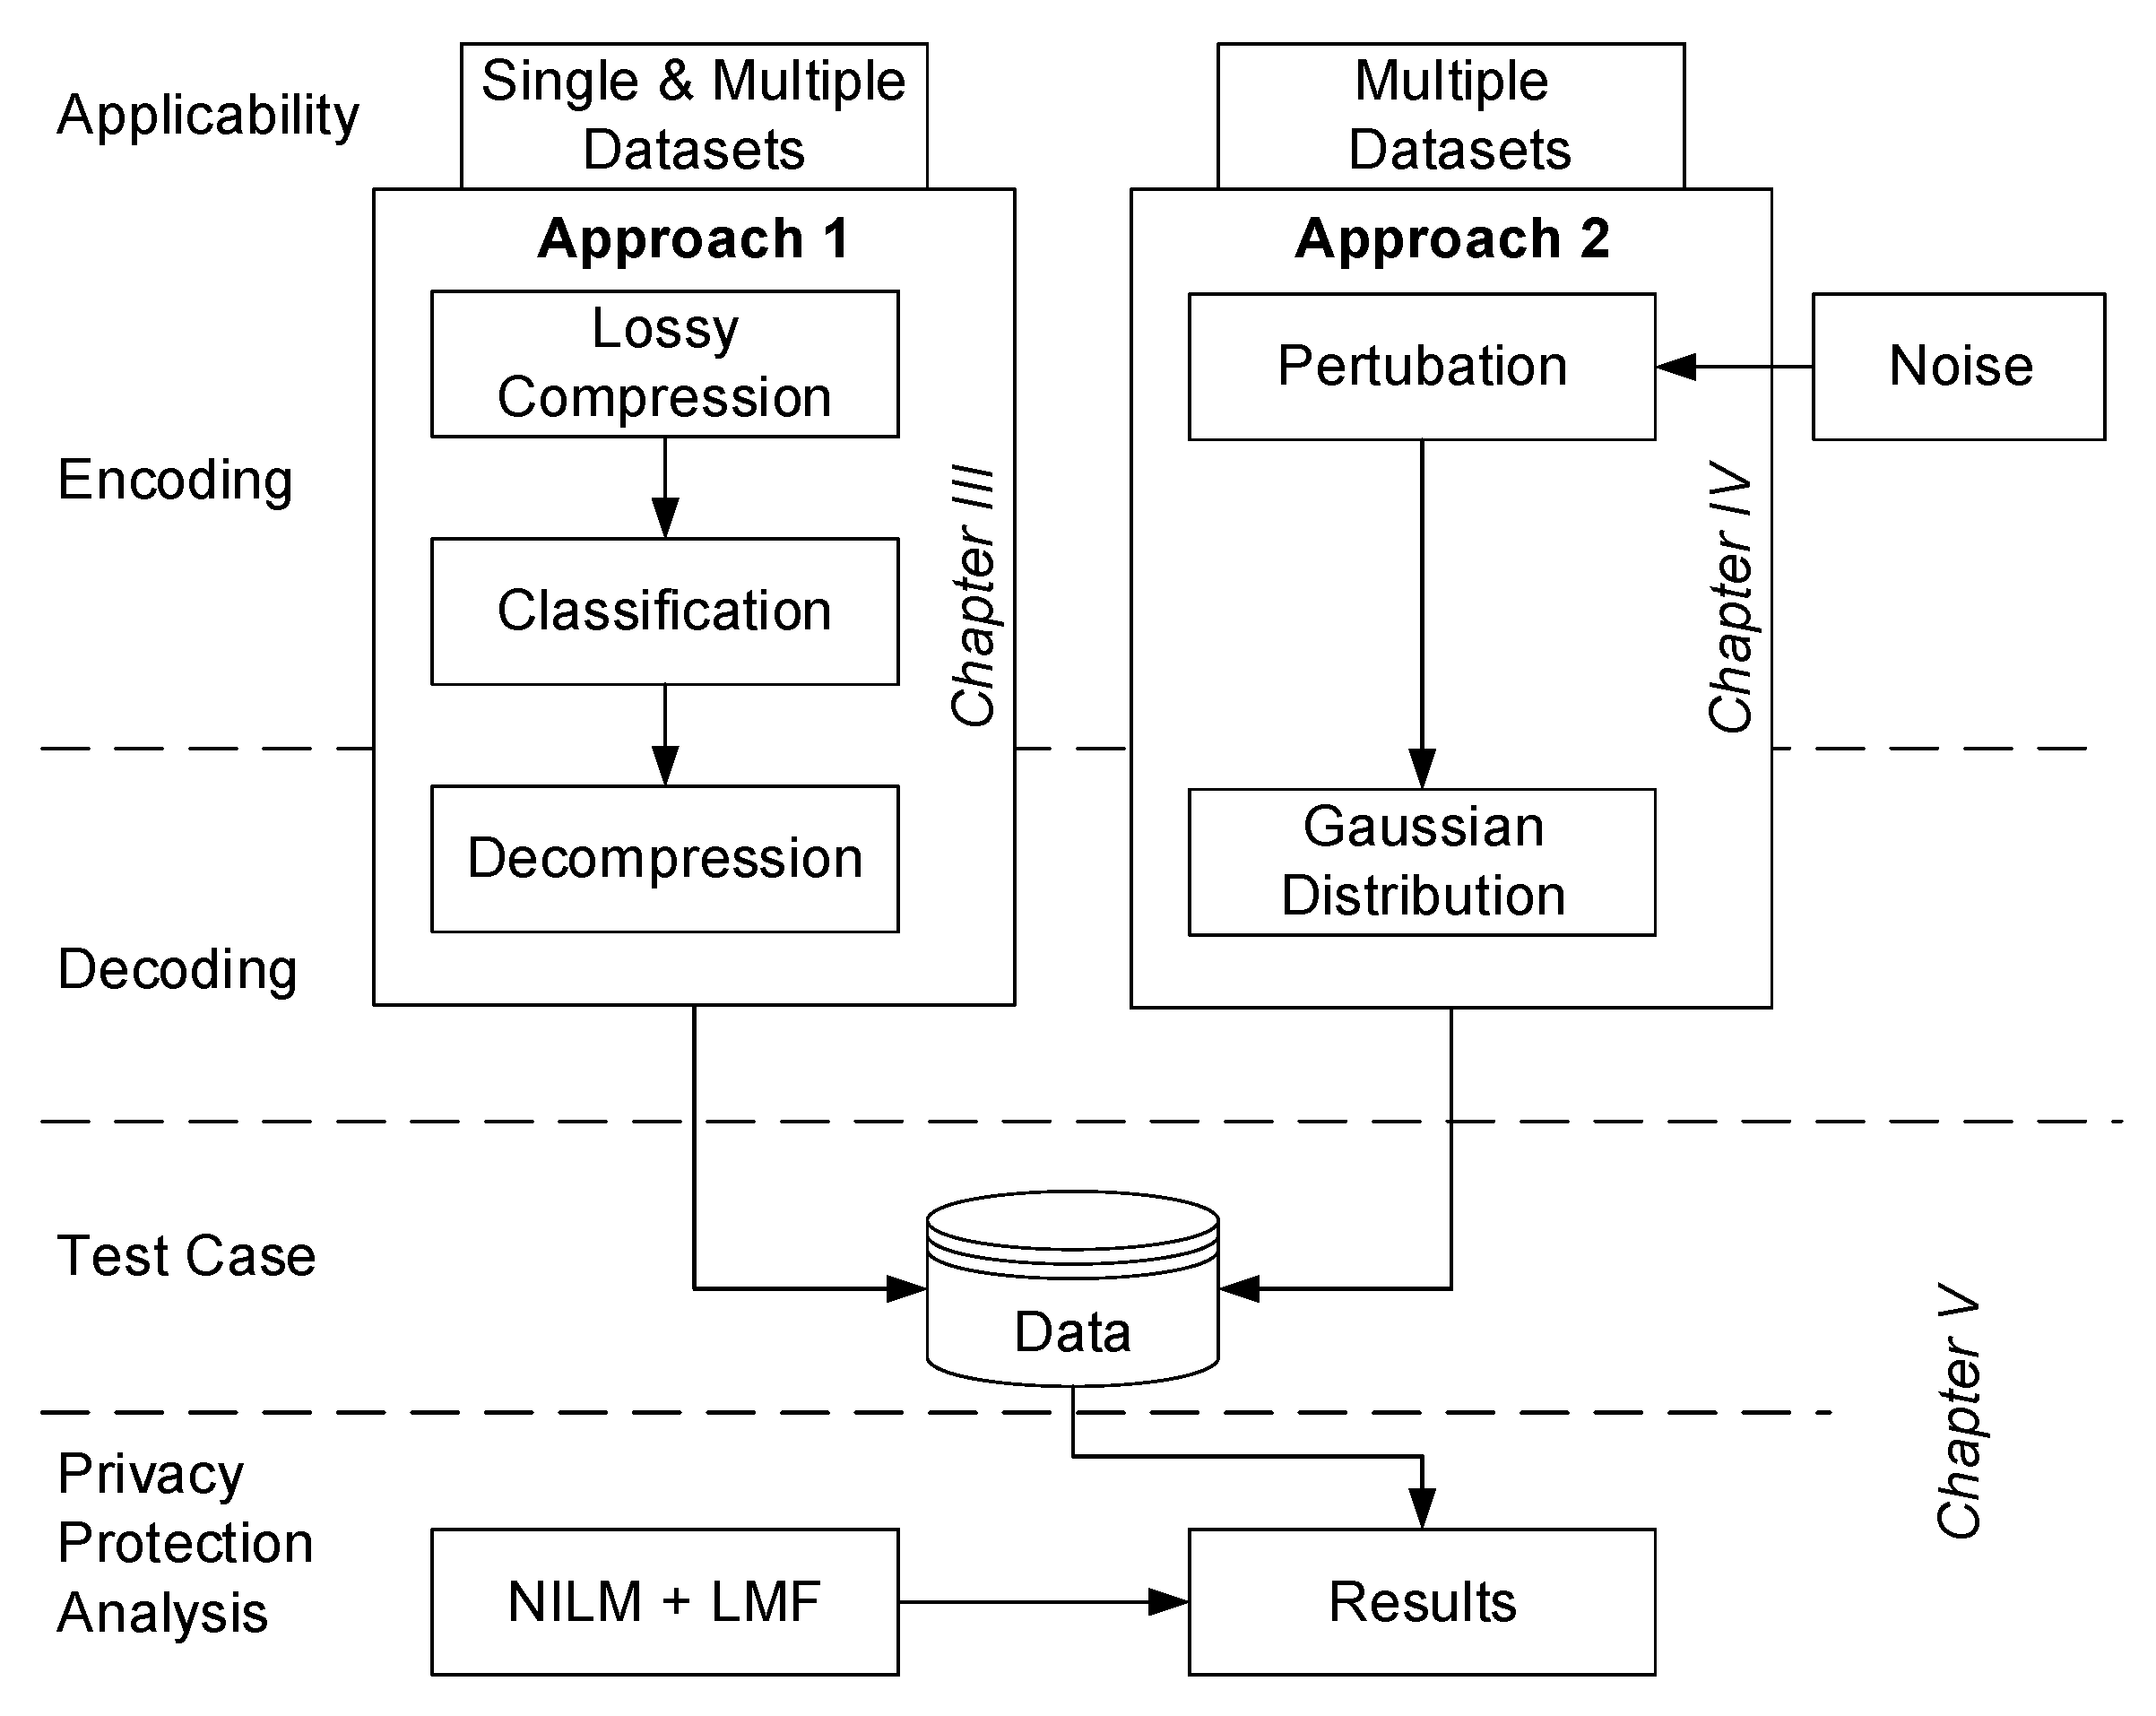
3. Approach 1: Compression and Classification Based Smart Meter Privacy

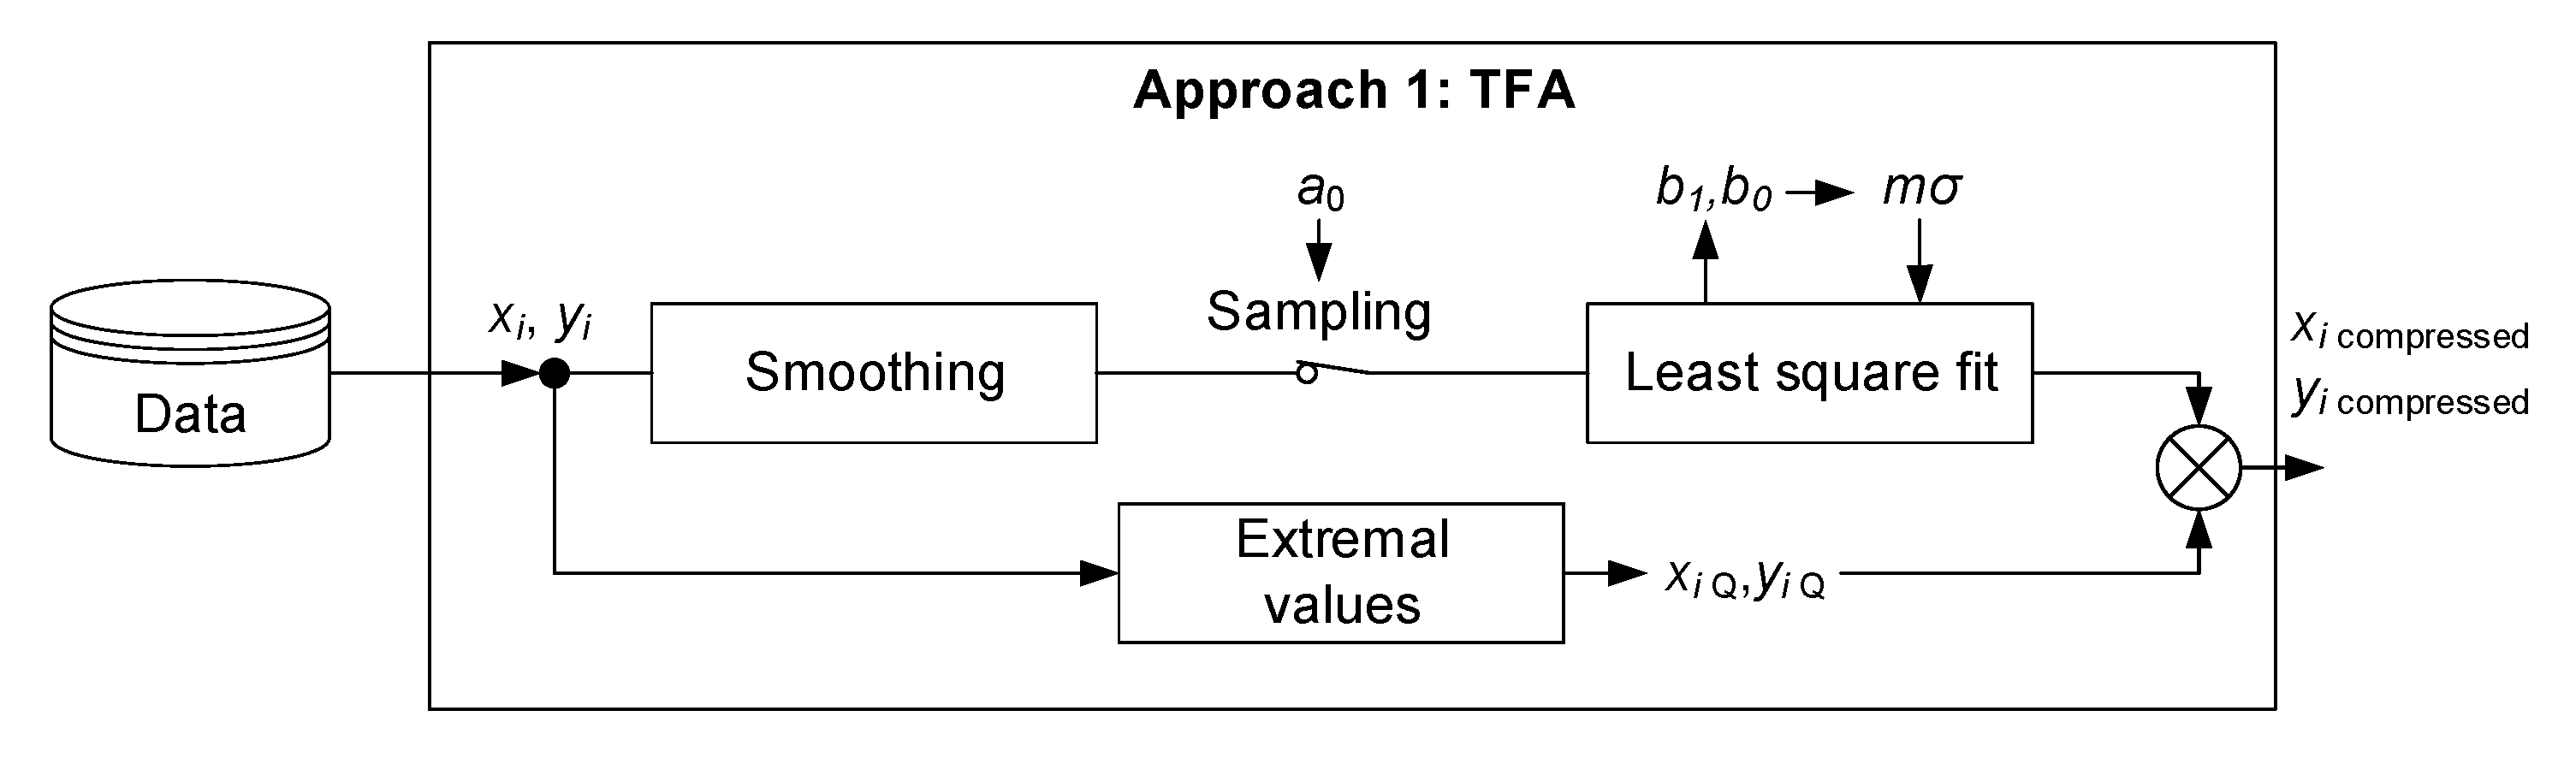
3.1. Lossy Compression Methodologies

3.1.1. Triangular Function Algorithm (TFA)

The first compression methodology is called the TFA (triangular function algorithm). It encloses the following steps. (I) Import the whole dataset and choose preferred percentiles (e.g.,: Q 1 , Q 99 ). (II) Determine percentiles and store these data points y i Q , x i Q , . The remainder of the dataset will be smoothed by the moving average filter. (III) Read a step width of a 0 data points. (IV) Perform a least square fit Λ to generate the intercept b 0 and slope b 1 , see Equation (1).
Λ = i = 1 a 0 y i b 1 x i + b 0 2
(V) Read the next data point y i and check if its value is within ±m σ (unbiased standard deviation σ with factor m) of the predicted values in Equation (2). If yes, jump to (III), otherwise start a new segment and go to (IV).
y i = b 1 x i + b 0
(VI) In order to complete the algorithm, insert percentiles ( y i Q , x i Q ) after the compression of the complete dataset. A schematic overview of the approach is shown in Figure 2. A detailed explanation of a simplified methodology of this TFA can be found in [34].

3.1.2. Rectangular Function Algorithm (RFA)

The decomposition of data stream into the sum of RFs (rectangular functions) is another lossy methodology. A dataset of an smart electricity meter power profile (power y ( t ) ) can be split into its mean values y ¯ ( a ) with the time intervals T I ( a ) in Equation (3). As a result, the approximated function y ˜ ( t ) of y ( t ) has less data, see Equation (4).
y ¯ ( a ) = 1 T I ( a ) t 0 ( a ) T I ( a ) 2 t 0 ( a ) + T I ( a ) 2 y ( t ) d t
y ˜ ( t ) = a = 1 N y ¯ ( a ) · Π t t 0 ( a ) T I ( a ) Π ( t ) = 0 , if t > t 0 ( a ) + 1 2 T I ( a ) 1 , if t t 0 ( a ) + 1 2 T I ( a )
Depending on changes in the load profile, the time interval T I ( a ) = t ( a + 1 ) t ( a ) might be fixed or not. For each interval T I ( a ) , the centroid of the rectangular function is t 0 ( a ) , see Equation (5).
t 0 ( a ) = t 0 ( 1 ) = T I ( 1 ) 2 , if a = 1 l = 1 a T I ( l ) + T I ( a ) 2 , if a 1
The compression is then generated by the values of p ¯ ( a ) and T I ( a ) , which has be stored in the right numeric order through the Equations (3) and (5). The filter and the detection level σ affect the information loss and the compression ratio.

3.1.3. Singular Value Decomposition (SVD)

SVD (singular value decomposition) is used to split a m × n dataset (smart meters x time stamp) DS into three matrices in Equation (6). Σ is a diagonal matrix whose elements are the SVs (singular values). U is the matrix of all smart meter data points and V is the matrix of the time stamps. The reconstruction of compressed datasets while ignoring small singular values in Σ results in the compression.
DS m × n = U m × m Σ m × n V n × n T

3.1.4. Wavelet Transform (WT)

A WT (wavelet transform) can orthogonally decompose a time series into scaling and wavelet coefficients [35,36]. The compression ratio depends on the deletion of trivial data points and it changes due to the DW (Daubechies’ wavelets), thresholds and levels of decomposition (LoD). For further explanation, please see [3].

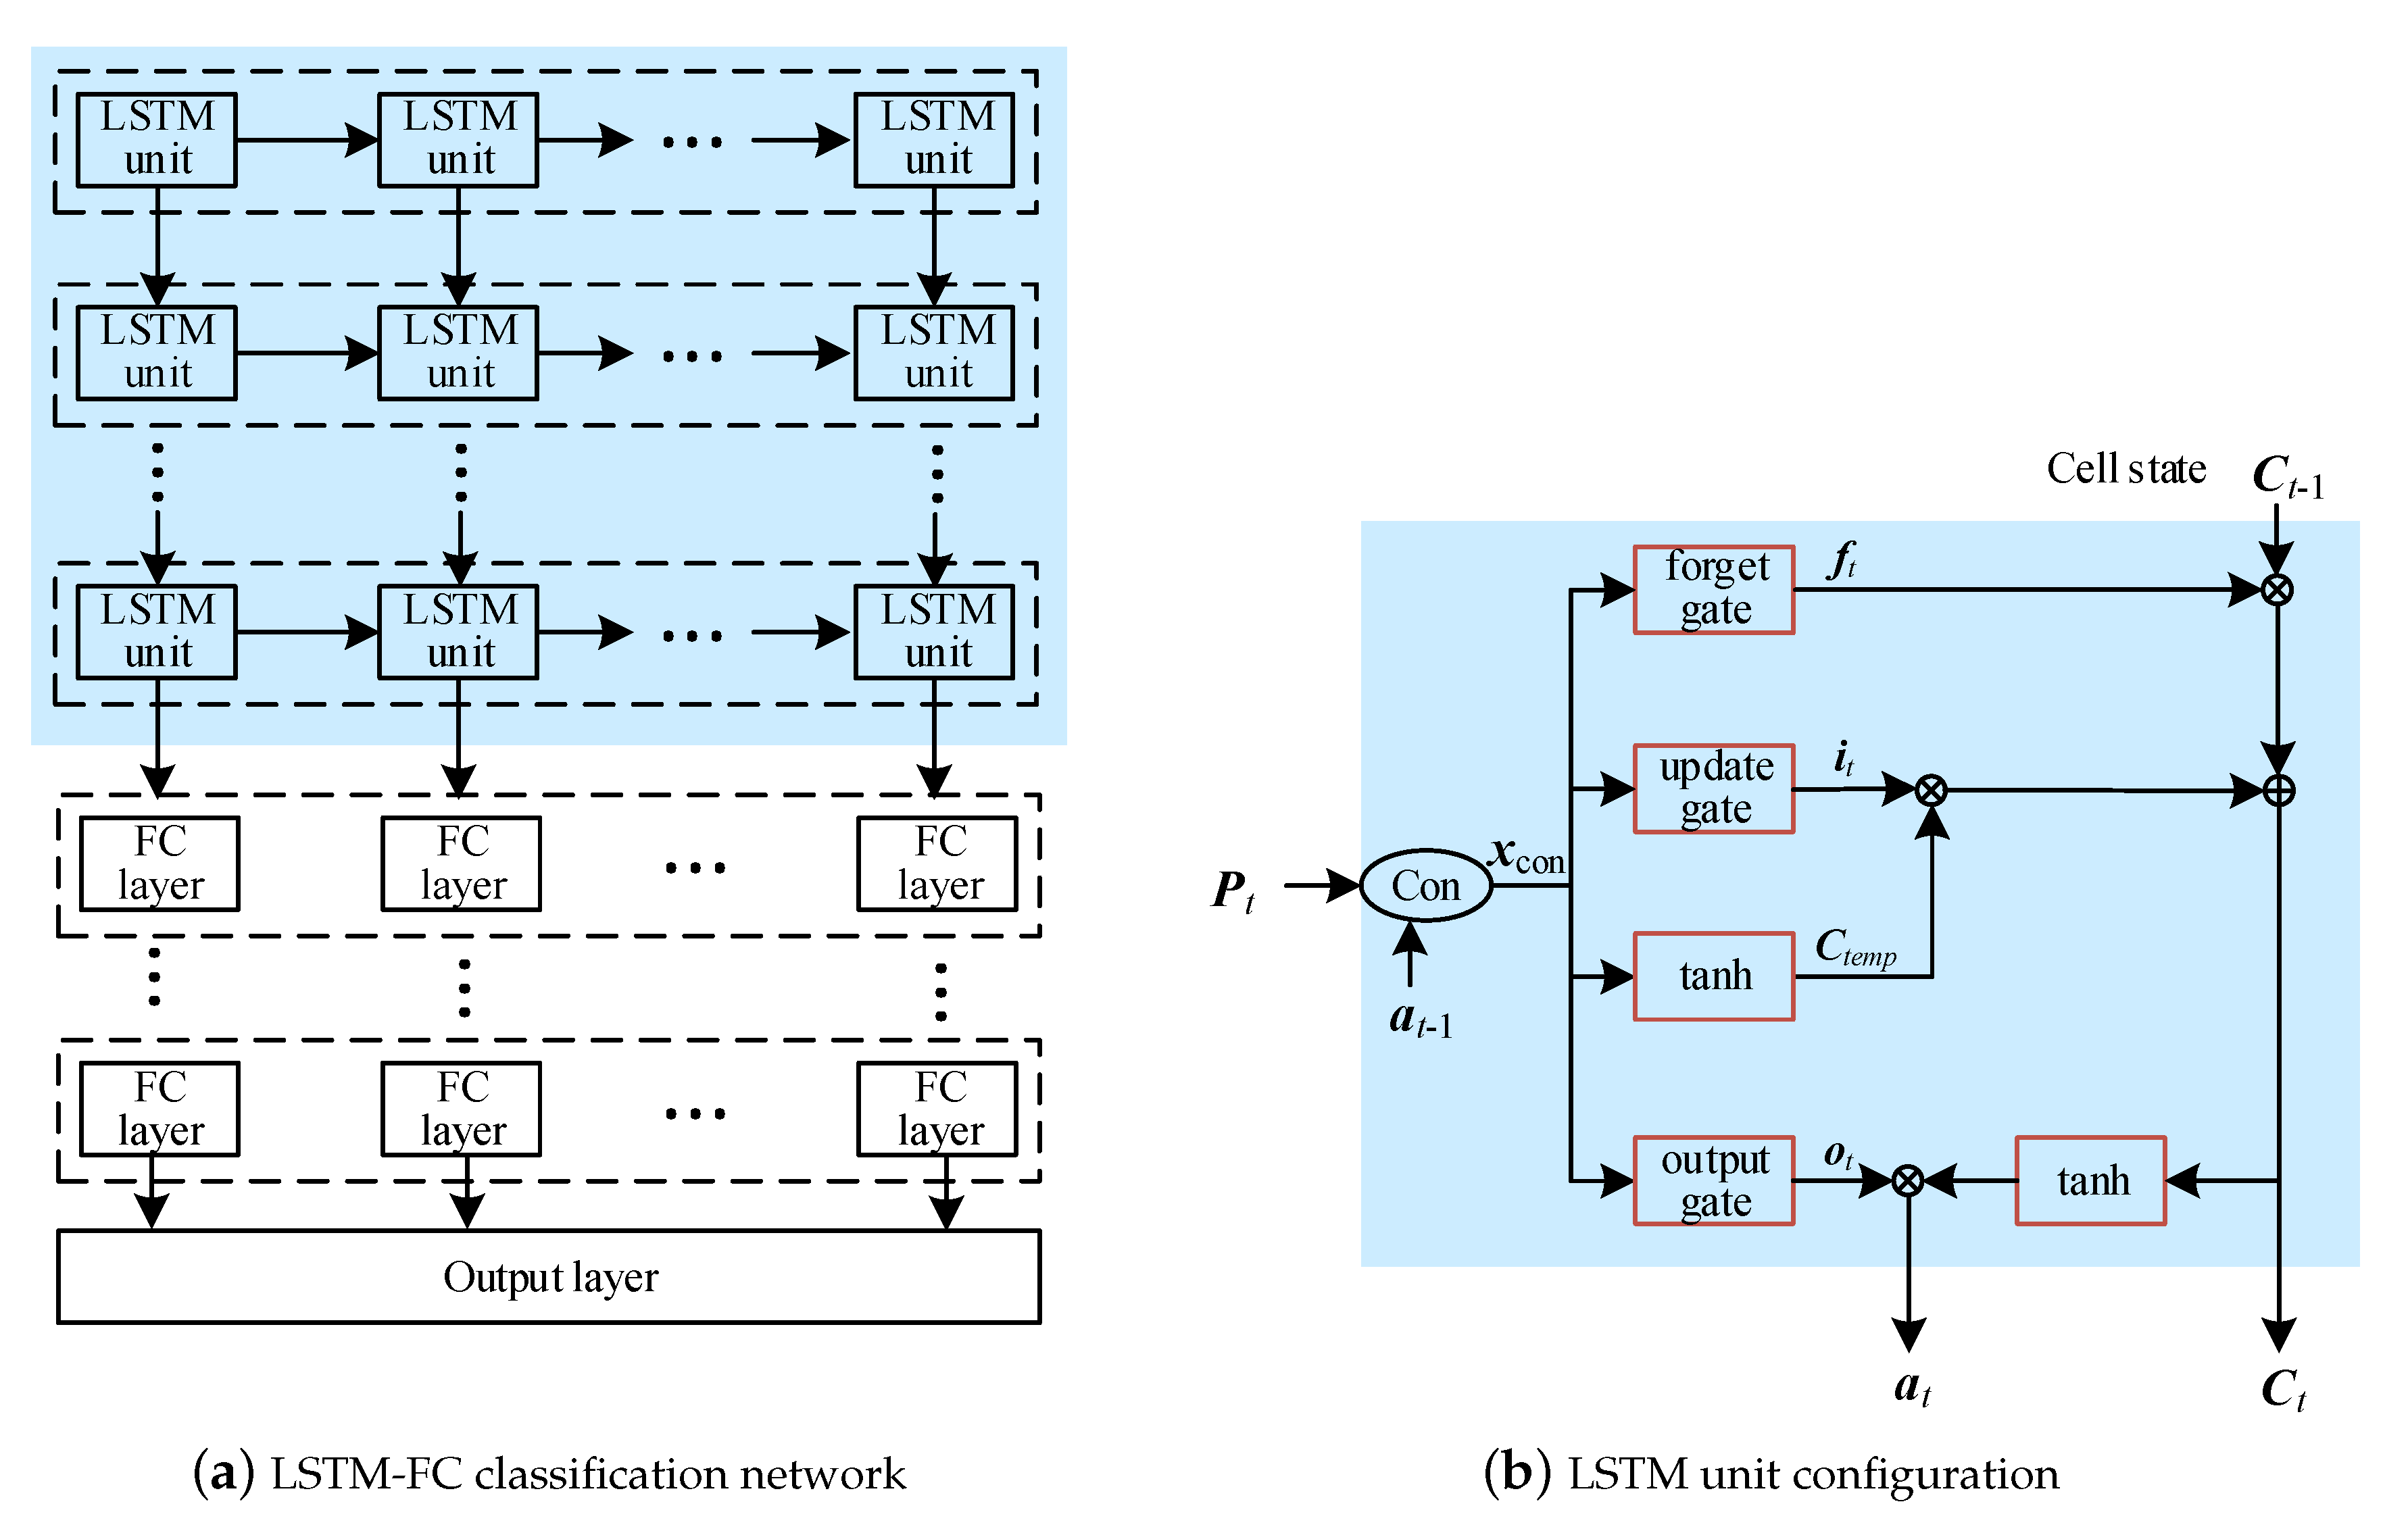
3.2. Classification of the Compressed Dataset

Among the presented four lossy compression methods, a classification step is imperative to determine the best methodology. A temporal classification is carried out in order to find the suitable algorithm for the encoding of the dataset. This step is carried out before each dataset is transferred to the utilities or grid owner. The current section describes the classification methodology employed. By classifying and transmitting data based on classification results, the privacy of user information can be secured.
As an example, considering the large dimension of energy profile datasets from end-users, the temporal LSTM (long short-term memory) network is deployed for the classification of the compressed dataset. The natural recurrent feature empowers the LSTM network for the classification task. As a widespread framework for the sequential signal classification and processing, the LSTM network is the variant of RNN (recurrent neural network) which is appropriate to classify sequential events with long interval and delay in time series. Since TFA, RFA, SVD and WT are employed for the lossy compression, the difference of various methods could be caught by the memory cell of the LSTM network. Figure 3a shows the structure of an LSTM-FC (fully connected) classification network which contains multiple LSTM layers and FC (fully connected) layers. The structure of the LSTM cell comprises the forget gate, update gate and output gate, which is shown in Figure 3b. The output of each gate varies between 0 and 1. 0 denotes discard, while 1 indicates the information should be included.
As a recurrent neural network, the feature of previous power disturbance a t 1 is sequentially transmitted to the next identification process obtaining the next gate input x c o n in Equation (7), which is the input of three gates.
x c o n = a t 1 p t T
According to the input x c o n , the forget gate drops the unnecessary message in the cell via weight W f and bias b f
f t = σ ( W f x c o n + b f )
where σ is the sigmoid activation function of the three gates. The current feature is weighted by the update gate, contributing to the new cell state
C t e m p = tanh ( W c x c o n + b c )
i t = σ ( W u x c o n + b u )
C t = i t × C t e m p + f t × C t 1
where tanh ( x ) = ( e x e x ) / ( e x + e x ) , × is the Hadamad product. The identified temporal characteristic is then packed accumulating through the output gate
o t = σ ( W o x c o n + b o )
a t = o t × tanh ( C t )
After the LSTM layer, FC layers should be constructed to transform the output vector dimension of LSTM layer. Besides, the softmax function is utilized at the top of the network to transform the output of FC layer into the probability distribution for further event classification:
y j = s o f t m a x ( a j ) = P ( a j a )
where a is the output vector of the FC layer and a j is the j t h element, n is the number of one-hot encoding states. By the output of this temporal classification approach, the difference of various compression methodologies could be figured out for the encoding preparation.

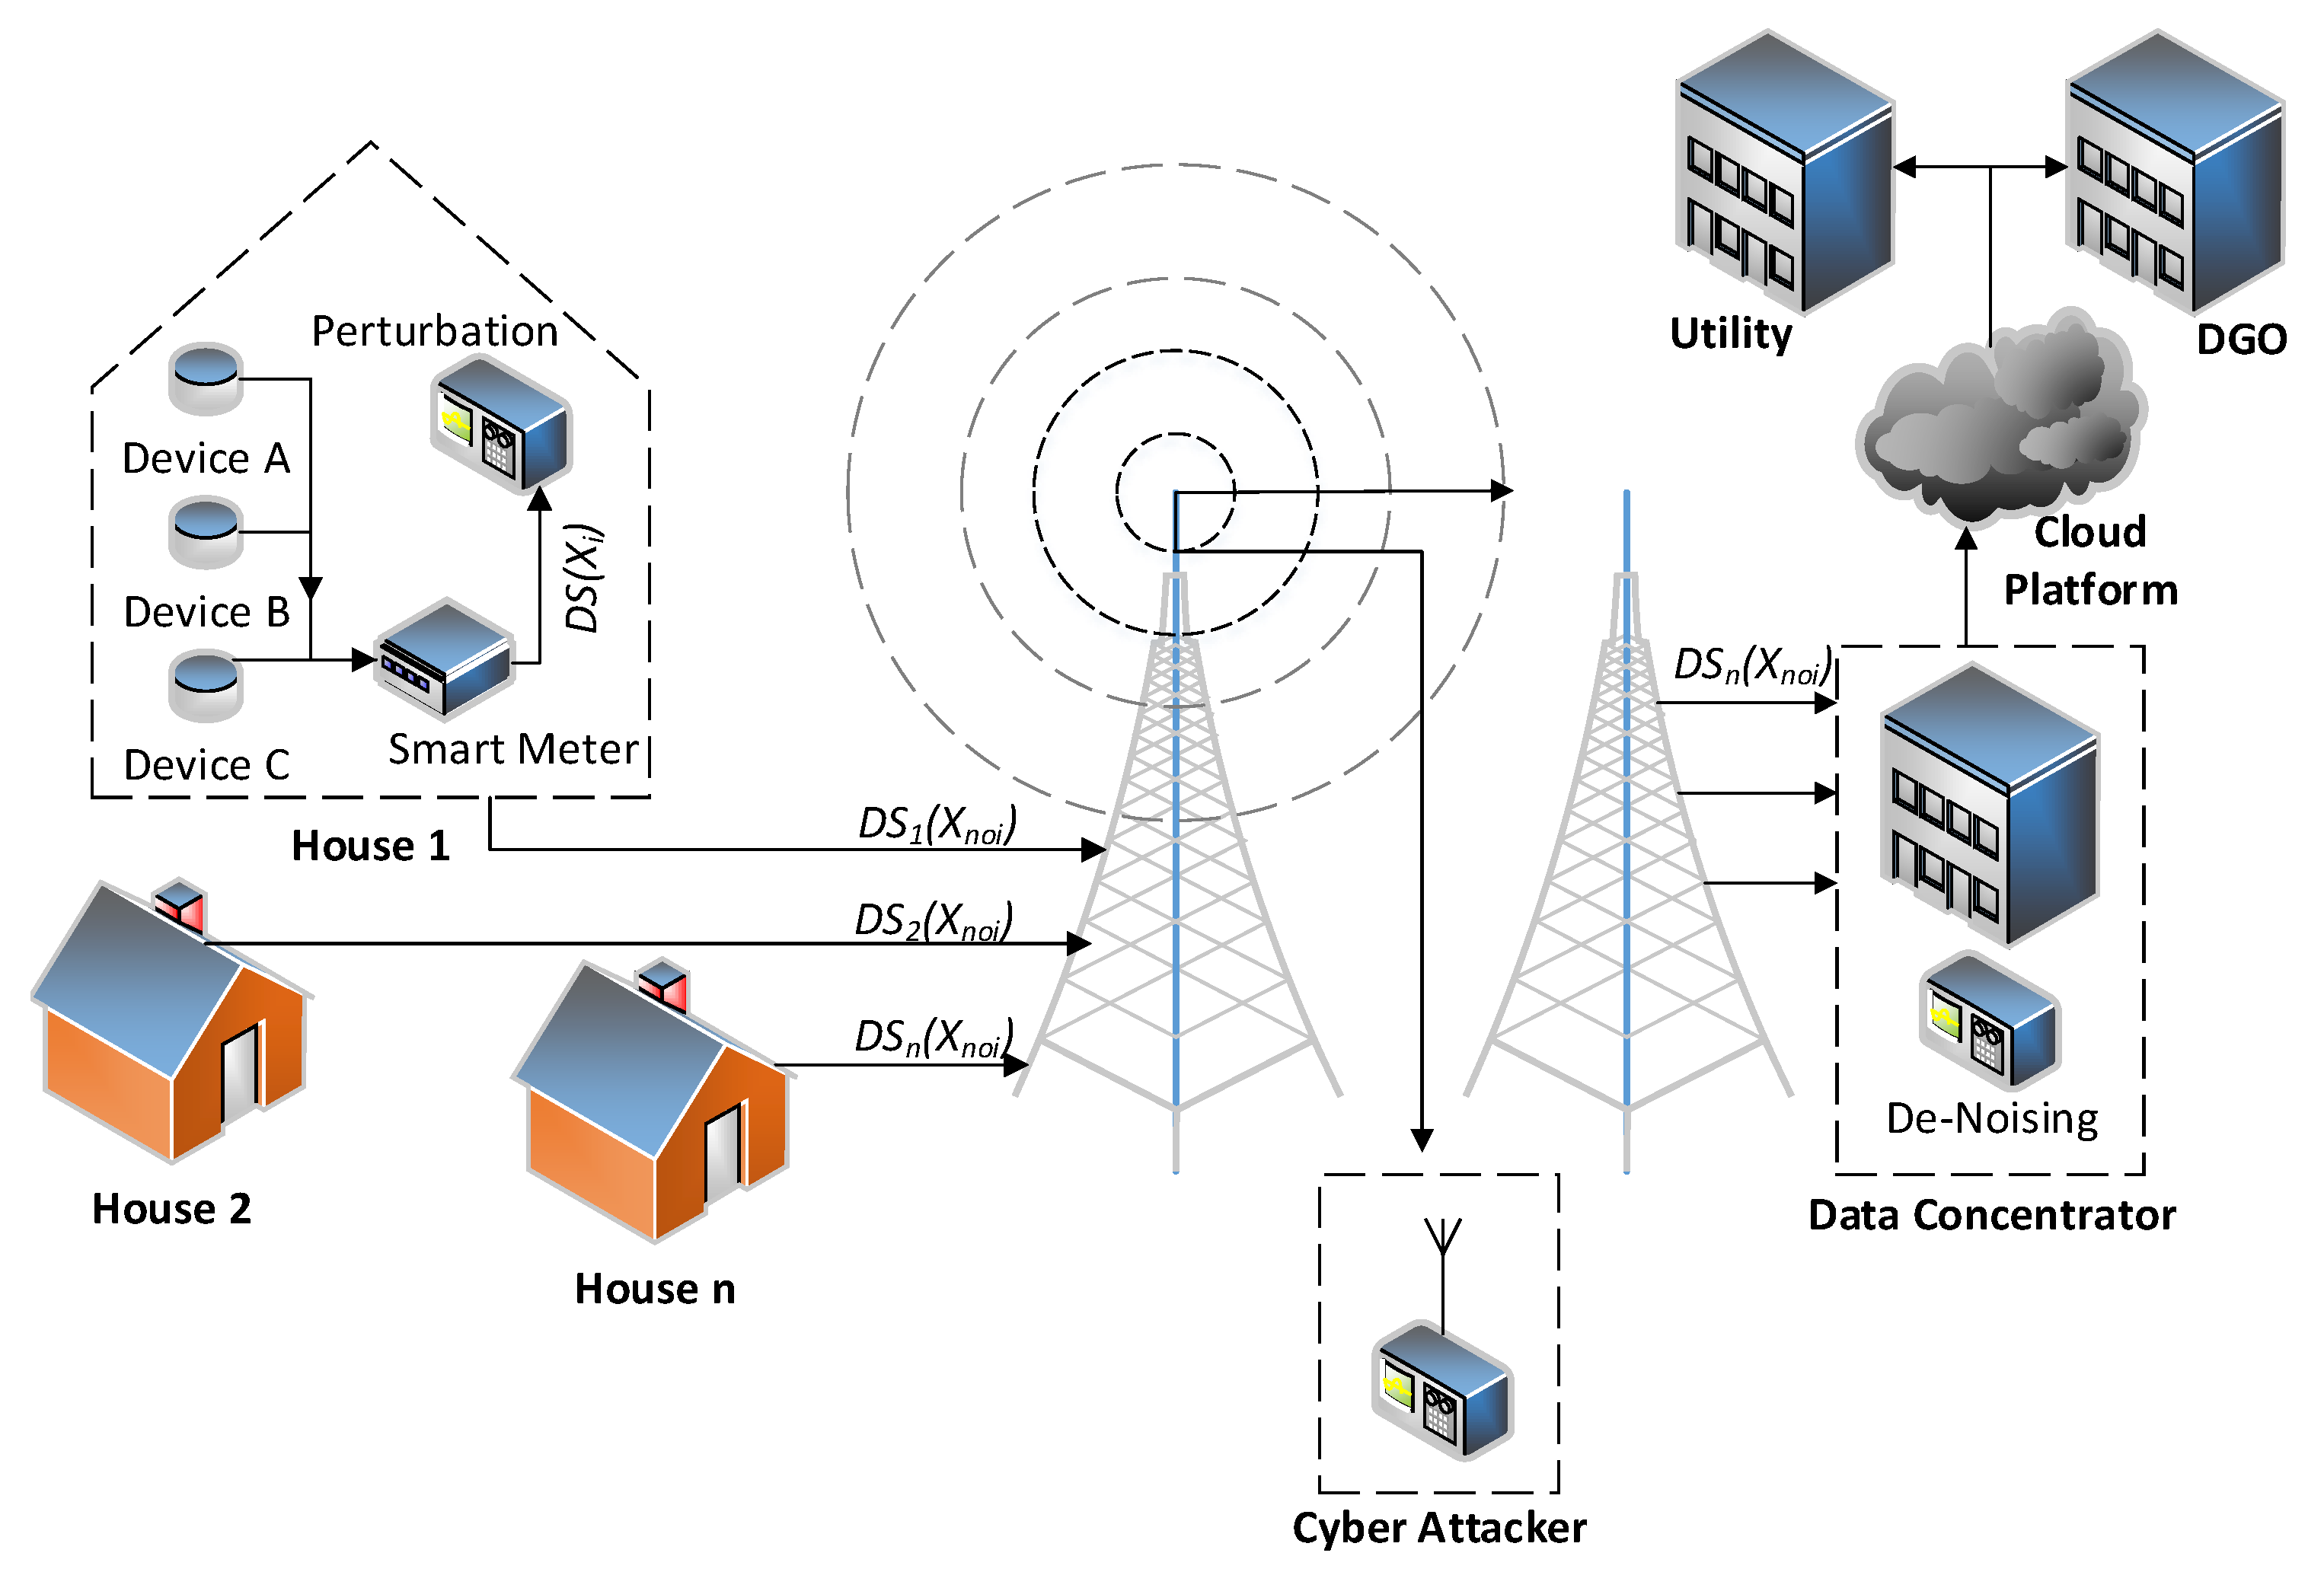
4. Approach 2: Perturbation with Gaussian Distribution Based Smart Meter Privacy

4.1. General Approach

The second approach goes the different way to encode datasets. While in the first approach, each smart meter profile was encrypted and transmitted individually by a combination of compression and classification, the Gaussian distribution approach (GDA) uses the effect of the central limit theorem. It states that the sum of a number (with a sample average S n ) of i.d.d. random variables X 1 , , X n of size n with E [ X i ] = μ and finite variances σ 2 will converge a distribution to a Gaussian distribution N ( 0 , σ 2 ) as the number of variables grows rapidly, see Equation (15). That means, it tries to preserve data privacy by adding random noise. However, the approach needs to take care that the random noise should preserve the main information from the data stream, so that the patterns can still be accurately estimated.
n S n μ d N 0 , σ 2
Therefore, the power consumption profile of a privacy household, generated by a smart meter, is intentionally perturbed by mean values of a randomly generated disturbance. This random disturbance quantity V Noi is generated by Equation (17). The following equations show the averaging of all meter values S ¯ all of k t h household dataset D S k (sample sequence u k [ 1 ] , u k [ 2 ] ,…, u k [ i ] and time steps n), including a so-called disturbance scaling factor f DSF .
S ¯ all = 1 n i = 1 n u k [ i ]
V Noi : = S ¯ all · f DSF ; + S ¯ all · f DSF
It is also possible to generate a perturbation V Noi by a randomly chosen range or value. Equation (18) describes the implementation of this permanent interference, which is done on every single data point of every smart meter dataset D S k , p e r t (sample sequence u k , p e r t [ 1 ] , u k , p e r t [ 2 ] ,…, u k , p e r t [ i ] ).
u k , p e r t [ i ] = u k [ i ] + V Noi
After the transmission of the noisy data, the output can no longer be recognized as a useful dataset with individual information by cyber attackers.
Following the assumption of the limit theorem, combining a large amount of noisy data causes the averages to converge over the time of a Gaussian distribution. The receiving company (e.g., the distribution grid operator, DGO) gets a dataset from the data concentrator, which contains information about all merged energy data streams generated by all supervised households. On the one hand, this makes a specific extraction of electricity consumption-based events impossible. On the other hand, the company still has accurate information to supervise the electrical grid or develop innovative energy services. An overview of the GDA is shown in Figure 4.

4.2. Comparison to Approach 1

Both approaches are used to encrypt datasets, in this case household load profiles. While the first approach can encrypt both individual and multiple household load profiles, the second approach has to meet certain conditions in order to guarantee sufficiently high encryption results. In addition to the presence of a large number of profiles, which can be encrypted, this also includes a high noise factor, which generates the privacy and security of the transmitted information.
Both approaches need and encode electrical power consumption profiles from smart meters. Furthermore, they cannot be combined or used consecutively, since both the transmission process and the decoding lead to different results. The decoding in approach 1 serves to restore the individual data records, including individual losses (one of the requirements of the lossy compression algorithms). This loss of information is irreversible. The de-cryption of data that was converted according to approach 2 occasions to an outcome dataset which represents the mean values of all datasets/energy profiles that represents the mean values of all datasets involved. A return to individual load profiles which can be assigned to the individual households or its profiles is no longer possible. The process is irreversible.

5. Evaluation

The background of the paper includes the main players of this scenario; the households (with their datasets), the electrical utility companies or the DGO (and an affiliated service provider) and the cyber attacker, illustrated in Figure 4. The smart meter of the household owner transmits the distorted power data to the utility company, that could provide real-time electricity price, charge the user or offers some service to the household (service procvider). The cyber attacker could link into the data transmission between these players [18].
From the point of view of privacy protection, the user wishes to veil the power usage information, which can be linked to their daily routine or private concerns. For example, the power consumption of television may leak user’s favorite telecasts and television patterns, or the power consumption of bedroom light may leak user’s bedroom privacy [18].

5.1. Description of Evaluation and Key Metrics

This paper evaluates the proposed scheme by using three aspects: compression approaches, protection of privacy and reconstruction of the dataset.
First, the compression approach is the focus of the evaluation. To define the best approach in the case of data privacy, a new so-named O T F (optimal transmission factor) is implemented in Equation (19). This value describes the arithmetic product between the classification accuracy A c c (see Section 3.2) and the compression ratio C R . The OTF indicates the optimal compression approach, which transmits the minimal amount of data points of a dataset DS ( i ) with the highest accuracy to the decoding point.
O T F DS ( i ) = A c c DS ( i ) · C R DS ( i )
C R DS ( i ) = size of the input dataset size of the dataset after compression
A c c DS ( i ) = number of correct predictions number of all predictions
Following the definition of Equation (20), values less than 1 indicate expansion whereas values greater than 1 imply compression. Equation (21) is the general metric for evaluating classification models. In this case, it describes the proportion of correct prediction results among the number of predictions or cases examined, and is named the Rand-Index [37].
To measure the protection of privacy, this paper uses the NILM process in combination with a statistical interference attack. The NILM process is an extraction of features conceptualization that investigates the privacy-preserving effects of the approach. Due to the frequent usage of the NILM by utility companies to obtain appliance-specific information and analyze the current status of an energy grid, this approach is appropriate [38]. Typically, the information or the end-user’s power consumption profile, is split into profiles of different household devices to obtain operational time and power (voltages and current) [4]. In our case, we extract ON/OFF features from the original and distorted dataset. The pre-defined threshold is set to 0.3 kW, to dig out the original features (all features: A F ) and the extracted features of the compressed/distorted dataset (distorted features: D F ).
Hereinafter, a simple de-noising scheme demonstrates the effectiveness of the proposed privacy preserving approaches. The LMF (linear mean filter) attenuates the noise influence of the two approaches. In Equation (22), the perturbation approach (approach 2) averages cumulative values, here the GDA values u k , pert [ i ] and weight indicating w [ i ] with the windowing size of 2 L + 1 .
u k [ j ] = i L j i + L ( u k [ i ] + V Noi [ i ] ) · w [ i ]
The de-noised signal ( u k [ j ] , j = 1 , 2 , . ) will be used to derive the individual energy consumption profile by the attacker [39].

5.2. Dataset

The dataset was logged during a field study of one of the biggest German distribution grid owners. Starting in 2013 up to December 2015, the utility installed smart meters in representative households, businesses and community facilities. On the one hand, the study examined how renewable energies can be more easily integrated into the low-voltage grid. On the other hand, it was examined how the generation of renewable energies and consumption can be better coordinated. This paper employs the recorded household data streams. The main properties of this measurement event are shown in Table 1.
The measuring system consists of a load profile meter with remote readout (4-quadrant counter) with registered power measurement (smart meter) and a communication unit (Gateway). In addition to the active and reactive power, the frequency as well as the voltages and currents of all three conductors were recorded. In total, around 10 million data tuple ( P HH ( t ) , t ) of more than 90 households with a sampling rate of 15 min are measured, traced and stored.

6. Results and Discussion

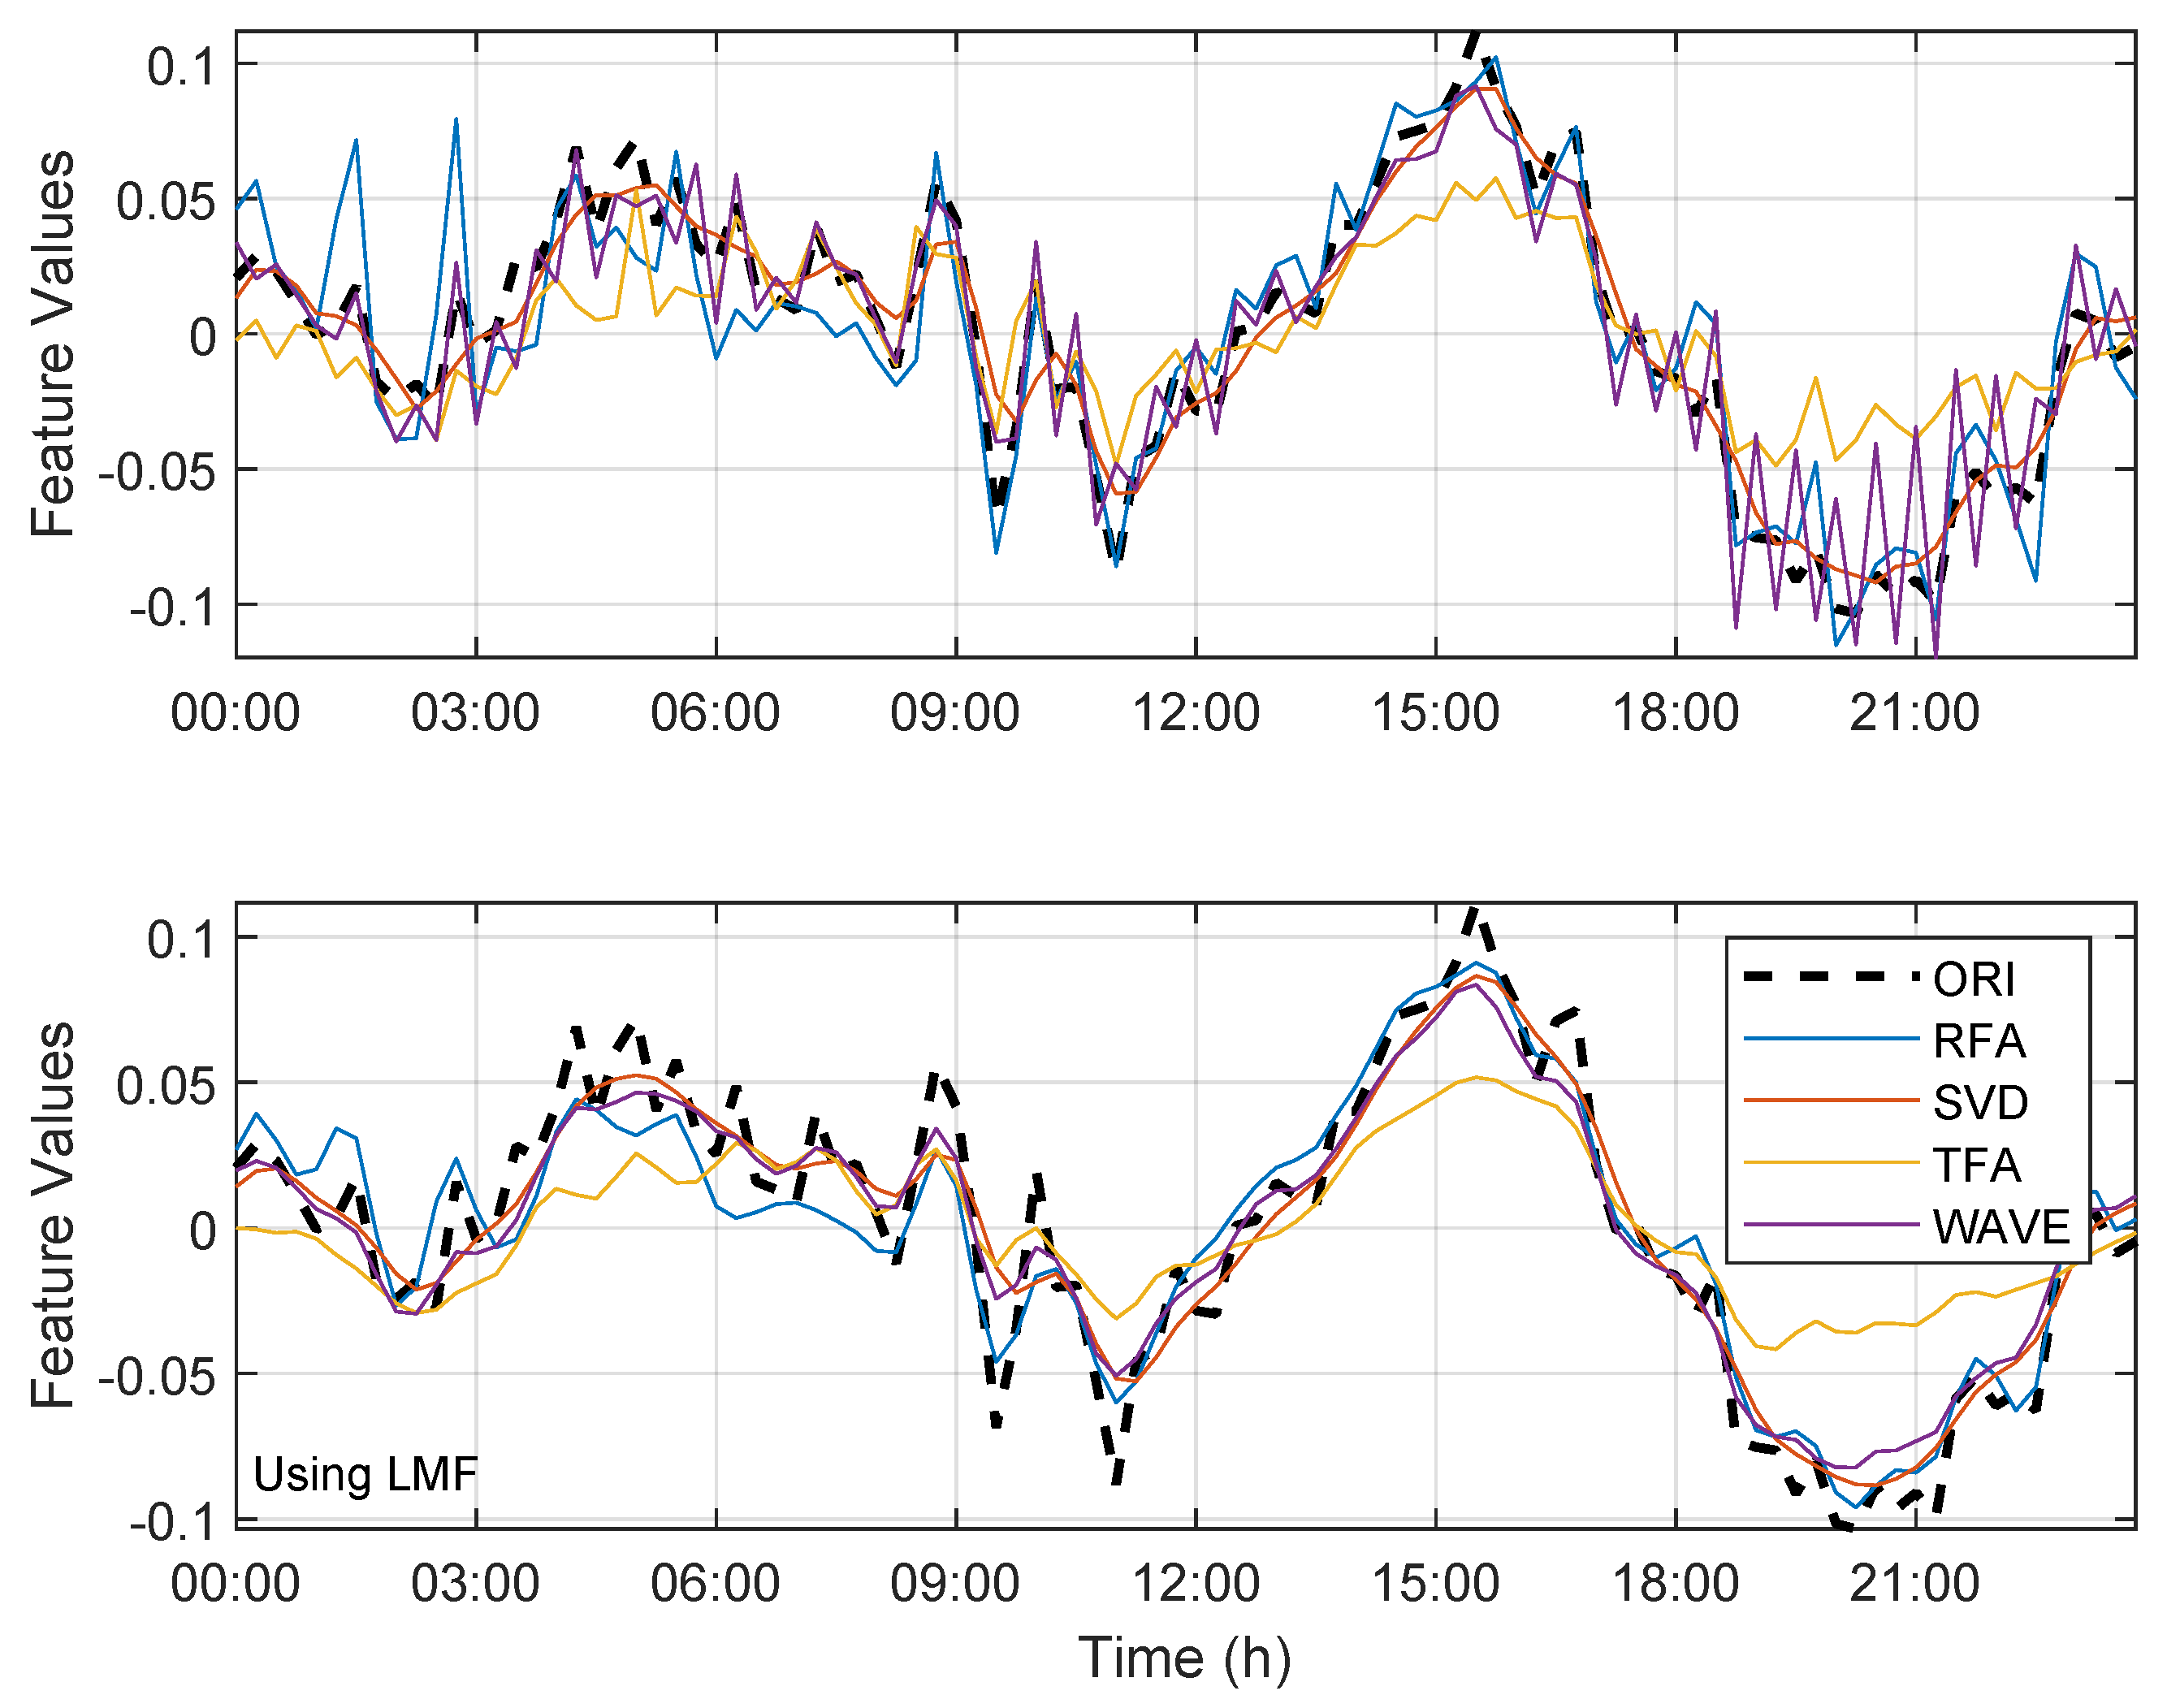
6.1. Approach 1: Compression and Classification Approach

Table 2 shows the results of the compression and classification step of the original dataset DS . The compression ratio C R ¯ DS is the arithmetic mean value over all smart meters.
To generate comparable privacy protection results, every lossy algorithm targets a C R DS ¯ of 20:1. Following that, the classification starts to evaluate the optimal lossy methodology with a two-layer LSTM network. This is employed with 64 neurons in each layer, while the last layer is a fully connected network with four neurons. The hidden state and the cell state of the LSTM are initialized with 0. The last FC layer utilizes the softmax function to classify the probability of the four compression datasets. According to the four outputs of the FC, the classification result is reflected based on the maximum output value. For the training of the whole neural network, this approach uses the cross entropy loss function with the Adam optimization tool. The learning rate is 0.001. Randomly sampling ten samples from each method, the LSTM-FC classification network for the class determination imports each sample of 100 points. After the 14th epoch learning, the values of four outputs are shown in Figure 5.
It can be found that the probability ratios of TFA in Figure 5a is much higher than those of RFA, SVD and WT. For any sample, their component in TFA reaches around 0.4117, while the probability of RFA and SVD methods account for 23.04 % and 25.98 % , respectively. The WT method contributes the least among those four approaches with only 9.81 % . Therefore, for these four compression methods, the TFA and WT can be respectively treated as two unique groups, that have the largest and the smallest likelihoods. In the meantime, the RFA and SVD form one group with similar probability ratios. According to the definition of A c c DS in Equation (21), the accuracy of classification index is listed in Table 2. The RFA and WT generate the highest index with A c c DS = 0.70 , while SVD and TFA follow them with 0.69 and 0.68, respectively.
Based on the aim, the privacy protection, it should not be possible to de-crypt the compressed and classified data during transmission to the recipient or the company using the NILM algorithm. Therefore, Table 3 shows the results of the approach 1.
Approach 1 results show that no features can be determined. The extracted ON/OFF features of the distorted dataset show that a third party (the attacker) cannot obtain detailed privacy related information on any kind of basis. With a mean AF/DF-alignment of <0.01%, due to the changing time step resolution (extraction percentiles, compression ratio and lossy methodology, depending on the classification results) the thresholds are completely different. The result of the subsequent LMF is negligible.
Depending on the outcome of Table 3, another test case is investigated. If the cloud platform is attacked by the cyber attacker after the decompression of the dataset, matches of 78.74% up to 80.97% are achieved. In this additional test case, the use of LMF by the attacker also does not change anything (−0.4%, on average) significantly in the results. However, the customers privacy and personal data are not fully protected. The RFA methodology produces the best OTF = 14.28 with the shortest compression time t ( C R DS ¯ ) = 1.7 s, see Table 2). This lossy technique produces the best results after the decompression attack with 78.74% and 79.29%, shown in Table 3 of the additional test case. That is why the RFA seems to be the best lossy compression technique for encoding single or multiple energy profile datasets. To generate the computational time, this proposed data compression methodologies has been implemented using MATLAB and performed on a PC Intel core i5-3210M processor, 2.50 GHz with 4 GB of RAM.
Figure 6 is long-term averaging, where the features of the power consumption traces and the features of all different approaches from all periods are averaged. This is implemented to obtain the daily power usage pattern of the customer and shows an overview of the results of the NILM detection. In Figure 6, between 00:00–03:00 o’clock the RFA results differ strongly from the original ones. The minimal ratio of distorted features to all features from Table 3 (DF/AF) results in weak feature recovery outcome during the transmission attack (Figure 6).

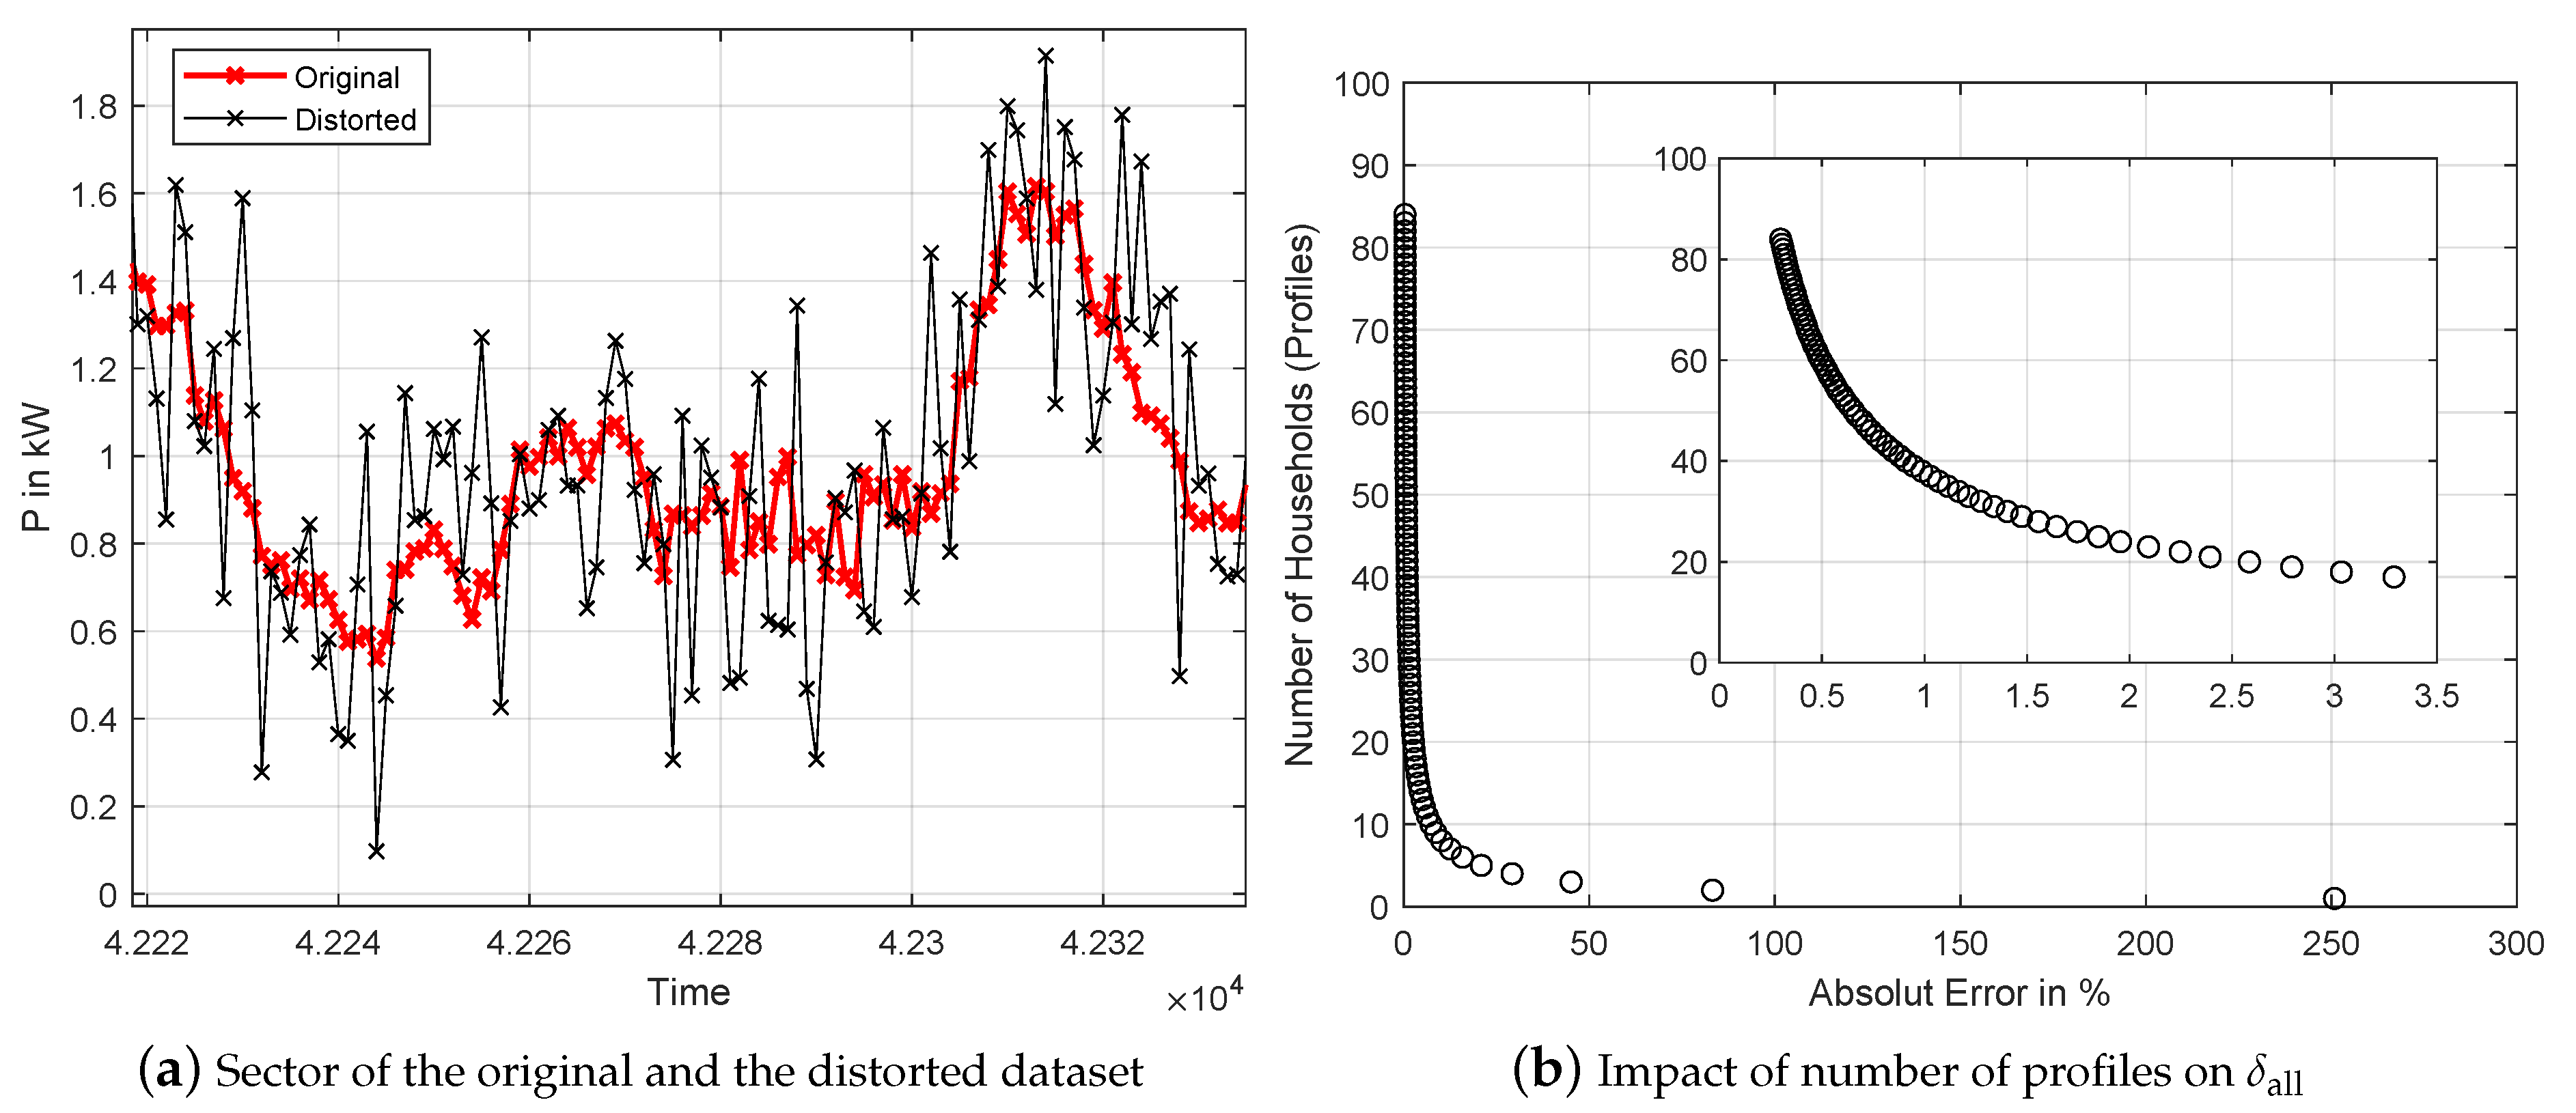
6.2. Approach 2: Gaussian Distribution Approach

For an example, a comparison between the input and the distorted dataset with DSF = 5 is presented in Figure 7a. This figure gives an impression about the impact of the distortion on the data stream. The distorted datasets of all households will be sent to the data collector.
The reconstruction of the dataset shows the accuracy of the privacy-preserving approach. The loss of information could be measured by comparing the reconstructed data matrix DSR , with their rows—time steps and columns—smart meter m × n , with the original one DS . This is defined as the MPE (mean percentage error).
M P E = 1 m · n i = 1 m j = 1 n DS ( i , j ) DSR ( i , j ) DS ( i , j ) · 100
In the test case, the approach generates a MPE = 0.38% and an absolute error δ all = 0.29% over all 108,000 data points. The performance results of the permutation’s GDA depending on the DSF and MPE. δ all is the Σ of the absolute or percentage difference between the original and the disturbed data points. The impact of the amount of data profiles on the δ all is shown in Figure 7b with 37 datasets δ all > 1%.
This value is regarded as the limit for the reconstruction of a usable dataset. Therefore, with a comparable amount of data points, the number of different (household) profiles should be available to use in this approach. If the attacker has no knowledge about the exact noise sample that was used for distortion, the original profile of one or more households is impossible to be recovered. Since this test case use relatively large DSF, conventional de-noising techniques (like long-term averaging schemes) are not able to de-crypt sensitive information.
After the perturbation, the number of features extracted with NILM decreases rapidly and it varies from the original dataset substantially, shown in Table 3. With additive LMF de-noising, more features can be extracted. Using LMF, the number of features is closer to the original one, but the minimal ratio of AF/DF makes the feature recovery still useless. Figure 8 shows the perturbation results of one day on average. The difference between the original and the distorted dataset, and their feature extraction is significant.

7. Conclusions

The concerns of privacy impose very important constraints for the future deployment of smart metering and smart grid networks. Because the amount of data collected from future smart meters will be orders of magnitude more than data collected from current meters. This data could easily be mined, as demonstrated by NILM and other techniques. In this paper the authors have attempted to address the smart metering privacy issue by anonymizing the identity of individual power datasets through different services.
The simulation results on real household datasets show that both techniques strengthen the individual privacy. Both approaches generate a protection in a way that the used NILM and LMF technique is disabled to identify running data streams. On the one hand, the first approach uses different lossy compression techniques with an LSTM classification network to encode power profile dataset of individual energy consumers. The best results are generated by the RFA and WT technique. The second one is a development of a simple perturbation technique, which can be de-noised by using the Gaussian distribution. The application of the last approach is limited and may be applied over many smart meter profiles only. Both approaches achieve high protection results (0.01–4.1%), also after the implementation of an additional de-noising scheme (0.05–14.1%), of the private information. Further, the attack analysis indicates that the key to the security offered by the approaches is the amount of datasets the attackers can steal. Some of the lossy approaches seems to be too slow in execution to be useful in the daily encoding routine.
Over all, the authors note that the proposed approaches may not offer sufficient smart metering privacy protection. However, the introduced approaches do contribute an additional and end-user friendly layer of data security.
Experimental evaluations of these approaches with bigger datasets, other real individual or simulated power consumption datasets could confirm the practicality and usability of this proposed scheme.

Author Contributions

M.P. modeled the two approaches, as well as helped in validating with simulation, topology, data analysis and original draft preparation. C.D. modeled the LSTM and determined the probability. C.D. contributed to review and editing. F.G. developed and validated one compression methodology. M.M. and M.F.M. supported the development of the perturbation approach. All of them, M.S. and C.D. also supported the draft preparation. M.M., H.J. and D.S. provided resources and supervision. All authors have read and agreed to the published version of the manuscript.

Funding

This research received no external funding.

Conflicts of Interest

The authors declare no conflict of interest.

Abbreviations

The following abbreviations are used in this manuscript:
AFAll Features
DFDistorted Features
DGODistribution Grid Operator
FCFully Connected
GDAGaussian Distribution Approach
LSTMLong Short-Term Memory
NILMNon-Intrusive Load Monitoring
OTFOptimal-Transmission-Factor
RFARectangular Function Algorithm
SVDSingular Value Decomposition
TFATriangular Function Algorithm
WTWavelet Transform

References

  1. Rajagopalan, S.; Sankar, L.; Mohajer, S.; Poor, V. Smart meter privacy: A utility-privacy framework. In Proceedings of the 2nd IEEE International Conference on Smart Grid Communications, Brussels, Belgium, 17–20 October 2011. [Google Scholar]
  2. Unterweger, A.; Engel, D. Resumable load data compression in smart grids. IEEE Trans. Smart Grid. 2015, 6, 919–929. [Google Scholar] [CrossRef]
  3. Wen, L.; Zhou, K.; Yang, S.; Li, L. Compression of smart meter big data: A survey. Renew. Sustain. Energy Rev. 2018, 91, 59–69. [Google Scholar] [CrossRef]
  4. Hart, G. Nonintrusive appliance load monitoring. Proc. IEEE 1992, 80, 1870–1891. [Google Scholar] [CrossRef]
  5. Lisovich, M.; Mulligan, D.; Wicker, S. Inferring personal information from demand-response systems. IEEE Secur. Priv. 2010, 8, 11–20. [Google Scholar] [CrossRef]
  6. Storer, J. Data Compression: Methods and Theory; Computer Science Press, Inc.: New York, NY, USA, 1988. [Google Scholar]
  7. Salomon, D.; Motta, G. Handbook of Data Compression, 5th ed.; Springer Science & Business Media: London, UK, 2010. [Google Scholar]
  8. Blelloch, E. Introduction to Data Compression; Computer Science Department, Carnegie Mellon University: Pittsburgh, PA, USA, 2010. [Google Scholar]
  9. Pu, I. Fundamental Data Compression; Butterworth-Heinemann: Oxford, UK, 2005. [Google Scholar]
  10. Tate, J. Preprocessing and Golomb–Rice Encoding for Lossless Compression of Phasor Angle Data. IEEE Trans. Smart Grid. 2016, 7, 718–729. [Google Scholar] [CrossRef]
  11. Kraus, J.; Pavel, S.; Kukačka, L. Optimal data compression techniques for smart grid and power quality trend data. In Proceedings of the 2012 IEEE 15th International Conference on Harmonics and Quality of Power, Hong Kong, China, 17–20 June 2012. [Google Scholar]
  12. Wang, Y.; Chen, Q.; Kang, C.; Xia, Q.; Luo, M. Sparse and Redundant Representation-Based Smart Meter Data Compression and Pattern Extraction. IEEE Trans. Smart Grid 2017, 32, 2142–2151. [Google Scholar] [CrossRef]
  13. Unterweger, A.; Engel, D. Lossless compression of high-frequency voltage and current data in smart grids. In Proceedings of the IEEE 2016 International Conference on Big Data, Washington, DC, USA, 5–8 December 2016; IEEE: New York, NY, USA, 2016; pp. 3131–3139. [Google Scholar]
  14. Ringwelski, M.; Renner, C.; Reinhardt, A.; Weigel, A.; Turau, V. The hitchhiker’s guide to choosing the compression algorithm for your smart meter data. In Proceedings of the 2012 IEEE International Energy Conference and Exhibition (EnergyCon’12), Florence, Italy, 9–12 September 2012; pp. 935–940. [Google Scholar]
  15. Notaristefano, A.; Chicco, G.; Piglione, F. Data size reduction with symbolic aggregate approximation for electrical load pattern grouping. IET Gener. Transm. Distrib. 2013, 7, 108–117. [Google Scholar] [CrossRef]
  16. Du Pin Calmon, F.; Fawaz, N. Privacy against statistical inference. In Proceedings of the 2012 50th Annual Allerton Conference on Communication, Control, and Computing (Allerton 2012), Monticello, IL, USA, 1–5 October 2012; pp. 1401–1408. [Google Scholar]
  17. Sankar, L.; Rajagopalan, S.; Mohajer, S. Smart meter privacy: A theoretical framework. IEEE Trans. Smart Grid 2013, 4, 837–846. [Google Scholar] [CrossRef]
  18. Erdogdu, M.; Fawaz, N.; Montanari, A. Privacy-utility tradeoff for time-series with application to smart-meter data. In Proceedings of the AAAI 2015 Workshop on Computational Sustainability, Austin, TX, USA, 25–26 January 2015. [Google Scholar]
  19. McLaughlin, S.; McDaniel, P.; Aiello, W. Protecting consumer privacy from electric load monitoring. In Proceedings of the 18th ACM Conference on Computer and Communications Security, Chicago, IL, USA, 7–21 October 2011; pp. 87–98. [Google Scholar]
  20. Kalogridis, G.; Efthymiou, C.; Denic, S.; Lewis, T.; Cepeda, R. Privacy for smart meters: Towards undetectable appliance load signatures. In Proceeding of the 2010 First IEEE International Conference on Smart Grid Communications (SmartGridComm), Gaithersburg, MD, USA, 4–6 October 2010; pp. 232–237. [Google Scholar]
  21. Garcia, F.; Jacobs, B. Privacy-friendly energy-metering via homomorphic encryption. In International Workshop on Security and Trust Management; Springer: Berlin/Heidelberg, Germany, 2010; pp. 226–238. [Google Scholar]
  22. Erkin, Z.; Tsudik, G. Private computation of spatial and temporal power consumption with smart meters. In Applied Cryptography and Network Security, Proceedings of the International Conference on Applied Cryptography and Network Security, Singapore, 6–9 June 2006; Springer: Berlin/Heidelberg, Germany, 2012; pp. 561–577. [Google Scholar]
  23. Im, J.; Kwon, H.; Jeon, S.; Lee, M. Privacy-Preserving Electricity Billing System Using Functional Encryption. Energies 2019, 12, 1237. [Google Scholar] [CrossRef] [Green Version]
  24. Eibl, G.; Engel, D. Influence of data granularity on smart meter privacy. IEEE Trans. Smart Grid 2015, 6, 930–939. [Google Scholar] [CrossRef]
  25. Engel, D.; Eibl, G. Multi-Resolution Load Curve Representation with Privacy-preserving Aggregation. In Proceedings of the IEEE Innovative Smart Grid Technologies (ISGT), Lyngby, Denmark, 6–9 October 2013; pp. 1–5. [Google Scholar]
  26. Engel, D. Wavelet-based Load Profile Representation for Smart Meter Privacy. In Proceedings of the IEEE PES Innovative Smart Grid Technologies (ISGT’13), Washington, DC, USA, 24–27 February 2013; pp. 1–6. [Google Scholar]
  27. Engel, D.; Eibl, G. Wavelet-Based Multiresolution Smart Meter Privacy. IEEE Trans. Smart Grid 2016, 99, 1–12. [Google Scholar] [CrossRef]
  28. Evfimievski, S. Randomization techniques for privacy preserving association rule mining. SIGKDD Explor. 2002, 4, 43–48. [Google Scholar] [CrossRef]
  29. Agrawal, R.; Srikant, R. Privacy-preserving data mining. In Proceedings of the ACM SIGMOD Conference on Management of Data, Dallas, TX, USA, 16–18 May 2000; pp. 439–450. [Google Scholar]
  30. Chen, K.; Liu, L. A random rotation perturbation approach to privacy data classification. In Proceedings of the IEEE International Conference on Data Mining (ICDM), Houston, TX, USA, 27–30 November 2005; pp. 589–592. [Google Scholar]
  31. Kargupta, H.; Datta, S.; Wang, Q.; Sivakumar, K. Random data perturbation techniques and privacy preserving data mining. Knowl. Inf. Syst. 2005, 7, 387–414. [Google Scholar] [CrossRef]
  32. Huang, Z.; Du, W.; Chen, B. Deriving private information from randomized data. In Proceedings of the ACM SIGMOD Conference, Baltimore, MD, USA, 14–16 June 2005; pp. 37–48. [Google Scholar]
  33. Kim, J.J.; Winkler, W.E. Multiplicative Noise for Masking Continuous Data; Technical Report Statistics 2003-01; Statistical Research Division, US Bureau of the Census: Washington, DC, USA, 2003. [Google Scholar]
  34. Clements, A.; McCulloch, M.; Nixon, K. Low-loss, high-compression of energy profiles. In Proceedings of the International Conference IEEE Renewable Energy Research and Applications (ICRERA), Palermo, Italy, 22–25 November 2015. [Google Scholar]
  35. Ning, J.; Wang, J.; Gao, W.; Liu, C. A wavelet-based data compression technique for smart grid. IEEE Trans. Smart Grid 2010, 2, 212–218. [Google Scholar] [CrossRef]
  36. Aprillia, H.; Yang, H.; Huang, C. Optimal Decomposition and Reconstruction of Discrete Wavelet Transformation for Short-Term Load Forecasting. Energies 2019, 12, 4654. [Google Scholar] [CrossRef] [Green Version]
  37. Rand, W. Objective criteria for the evaluation of clustering methods. J. Am. Stat. Assoc. 1971, 66, 846–850. [Google Scholar] [CrossRef]
  38. Makonin, S.; Wang, Z.J.; Tumpach, C. The Rainforest Automation Energy Dataset for Smart Grid Meter Data Analysis. Data 2018, 3, 8. [Google Scholar] [CrossRef] [Green Version]
  39. He, X.; Xinwen, Z.; Jay Kuo, C.-C. A distortion-based approach to privacy-preserving metering in smart grids. IEEE Access 2013, 1, 67–78. [Google Scholar]
Figure 1. Proposed framework and approach of the paper.
Electronics 09 00465 g001
Figure 2. General process from uncompressed to compressed dataset.
Electronics 09 00465 g002
Figure 3. Temporal LSTM (long short-term memory)-FC (fully connected) classification network (a) and unit configuration (b).
Electronics 09 00465 g003
Figure 4. Schematic illustration of the data transmission system, using the example of approach 2.
Electronics 09 00465 g004
Figure 5. Probability of the TFA (triangular function algorithm) (a), RFA (rectangular function algorithm) (b), SVD (singular value decomposition) (c) and WT (wavelet transformation) method (d).
Electronics 09 00465 g005
Figure 6. Feature detection results of approach 1 (mean values over one day), top: without LMF (linear mean filter), bottom: using the LMF.
Electronics 09 00465 g006
Figure 7. Results of approach 2.
Electronics 09 00465 g007
Figure 8. Feature detection of the approach 2 (mean values over one day).
Electronics 09 00465 g008
Table 1. Properties of the dataset.
Properties Smart Meter
Smart meter, read out from remote location109
Time series resolution15-min
Transferred accounting dataActive energy
Transferred energy network data U , I , f , P , Q
Transmission techniqueGSM, GPRS
Transmitted data (daily)157,248 data points
Table 2. Results of compression, classification and OTF (optimal transmission factor).
TFARFASVDWT
C R DS ¯ 20.120.420.520.4
time ( C R DS ¯ )35.6 s1.7 s38.1 s4.3 s
A c c DS 0.680.700.690.70
O T F DS 13.6714.2814.1514.28
Table 3. NILM (non-intrusive load monitoring) results of privacy protection analysis.
DF/AFDF/AF after LMF
Original100.00%-
Approach 1: Attack during transmission
TFA, RFA, SVD, WT<0.01%<0.05%
Approach 1: Attack after decompression
TFA80.29%79.88%
RFA78.74%79.29%
SVD79.27%79.65%
WT80.97%79.45%
Approach 2: Attack during transmission
DSF = 54.10%14.84%

