1. Introduction
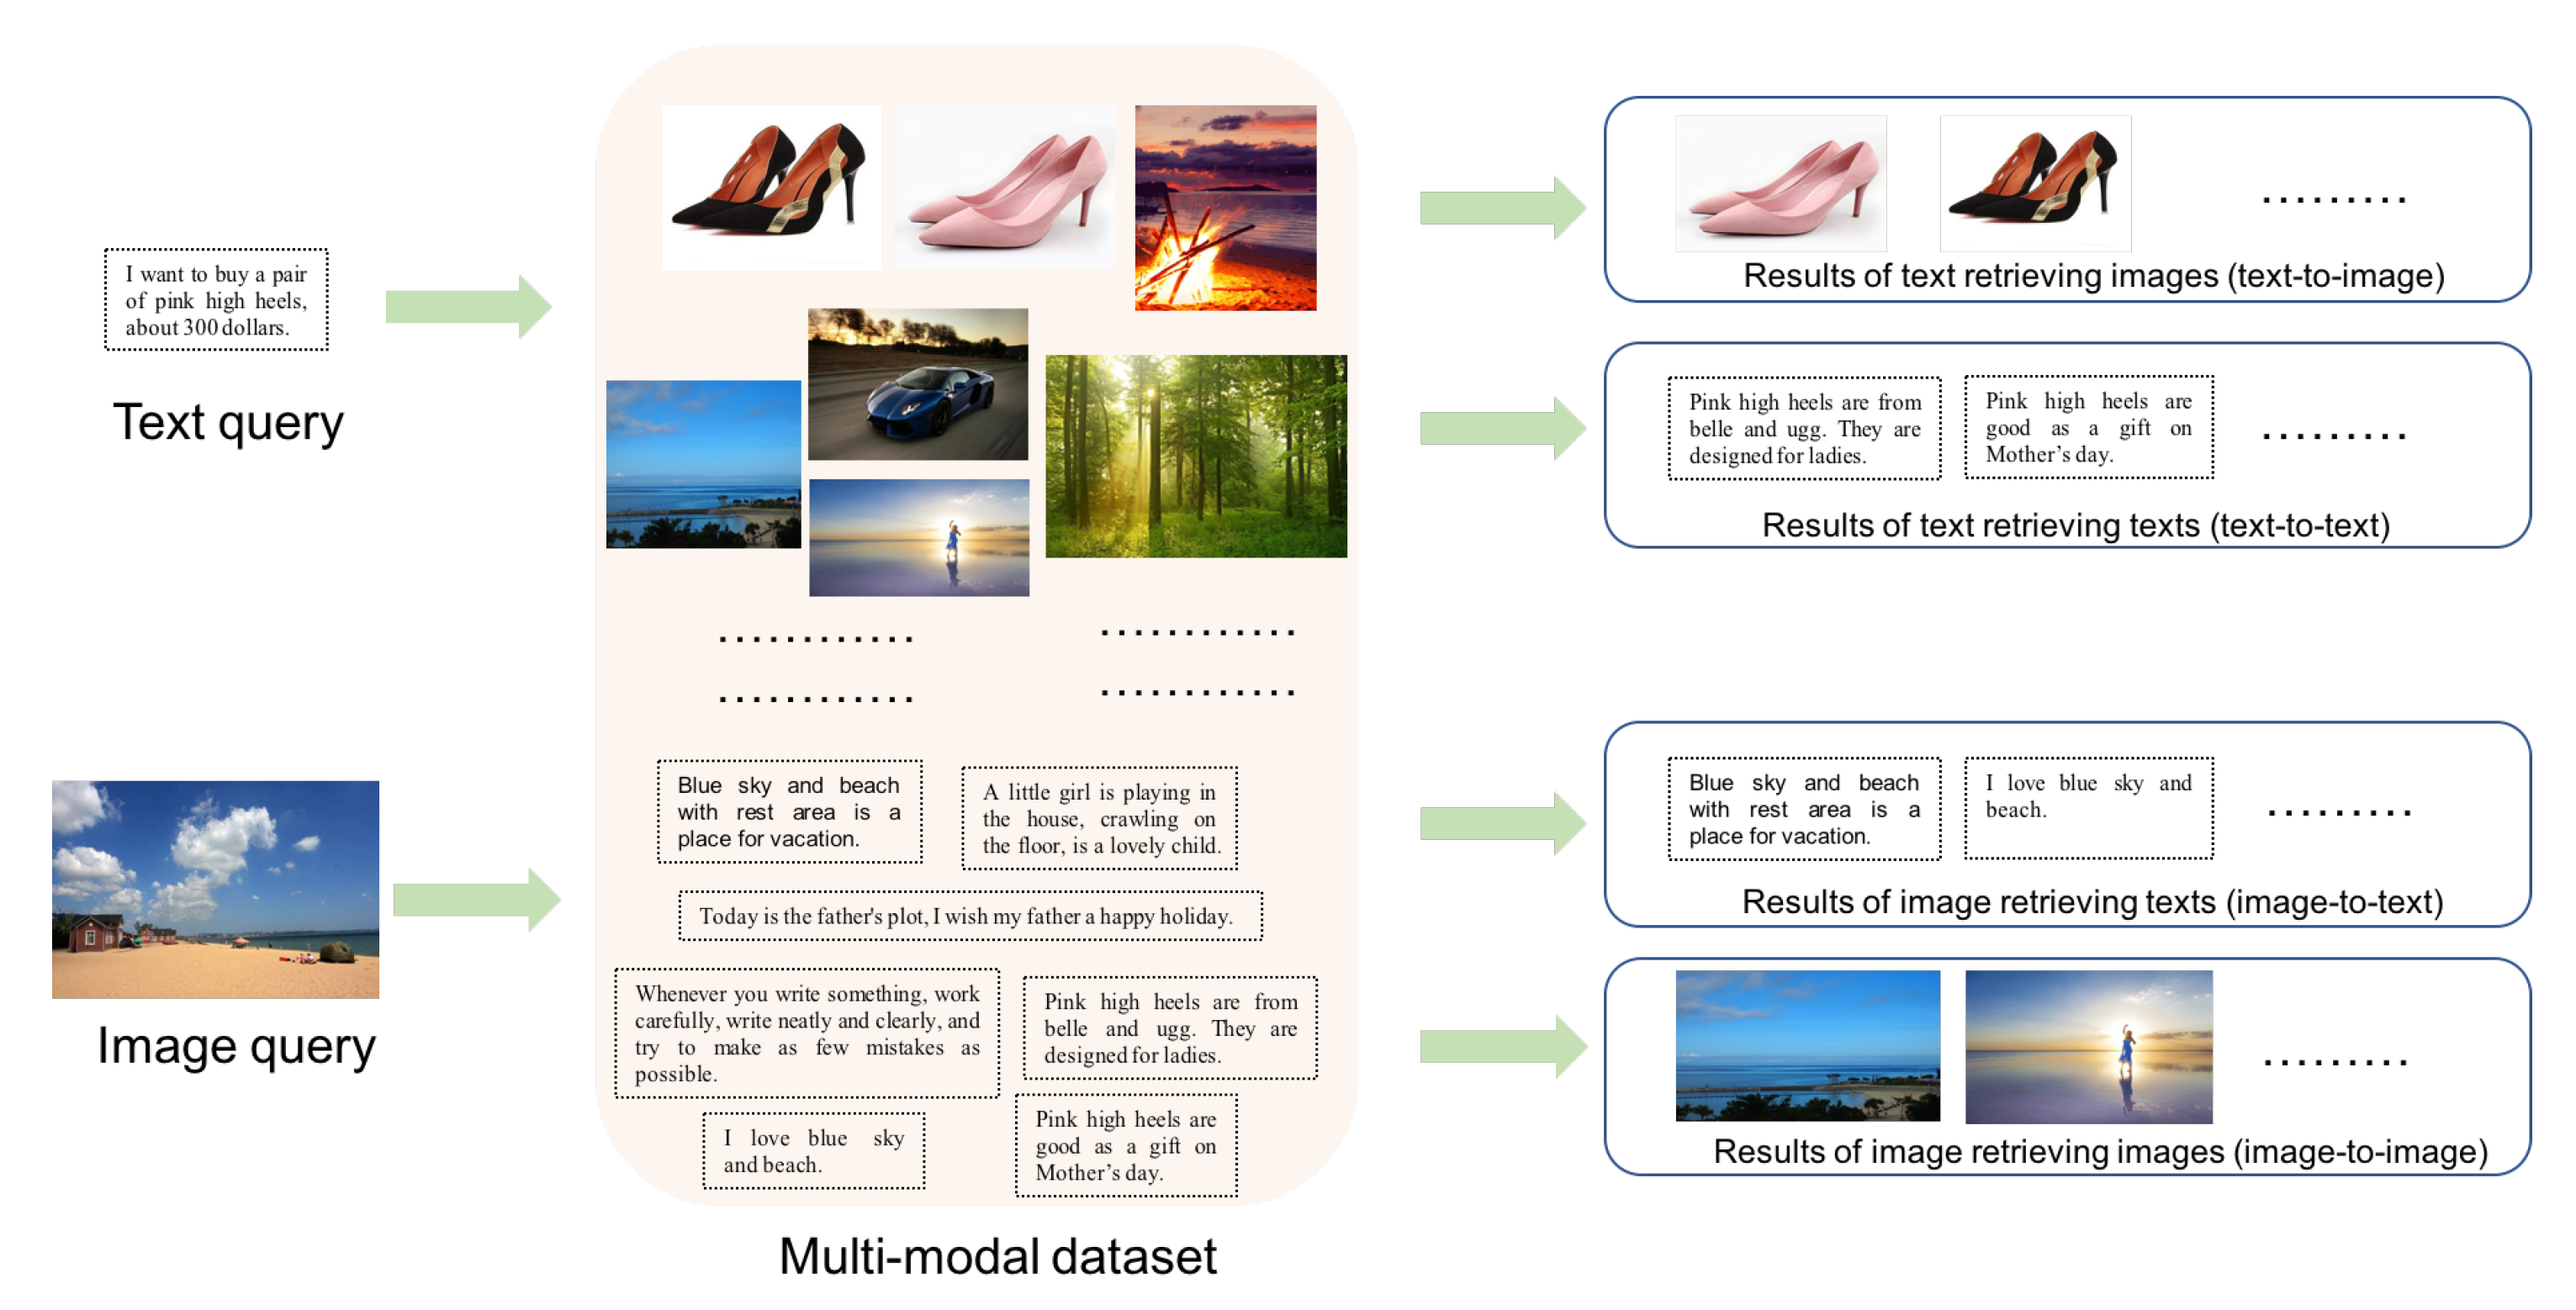
With the development of Internet and social media, people could come into contact with massive data from various modalities (e.g., image, text, audio, video, etc.) in daily lives. Multi-modal retrieval has become an important application scenario. For example, when a web user types into a textual description about “Obama”, the user usually expects to obtain related textual news of “Obama” and his images to best illustrate him. More image and text retrieval examples are shown in
Figure 1. At the top in
Figure 1, taking a text as query to retrieve the multi-modal dataset, related images, or texts are returned as the results, which are called text-to-image and text-to-text tasks respectively. At the bottom in
Figure 1, taking an image as query, related texts or images are returned as the results, called image-to-text and image-to-image tasks, respectively. As we all know, traditional retrieval intra single modal data are often achieved by nearest neighboring search. However, heterogeneous data from different modalities are represented with distinct data distribution and different feature dimensions, thus they can’t be compared directly by traditional methods for such inter-modal retrieval tasks (text-to-image and image-to-text).
A straightforward solution is to model the joint distribution over the data of different modalities by projecting the heterogeneous data into a common subspace, in which heterogeneous data can be compared directly then multi-modal retrieval could be achieved. Typical methods learn two linear projections for two modalities respectively by maximizing the correlation [
1,
2] or minimizing the distance of one-to-one corresponding inter-modal data [
3]. Nonlinear projections are further learned in deep learning models [
4,
5,
6,
7] with the corresponding relationship. Besides the correspondence, category information has been introduced into learning the discriminative common subspace to further narrow the gap between heterogeneous data in multi-view discriminant analysis [
8,
9,
10] and canonical correlation analysis with clusters or labels [
11,
12,
13]. These methods learn proper similarity or distance for multi-modal data. Most of them consider the pairwise correlation between corresponding data or instances belonging to the same class, but they don’t consider the correlation of dissimilar data directly.
Metric learning is to learn metric functions that satisfy pairwise must-link/cannot-link distance/similarity constraints or triplet-based distance/similarity constraints. It has been widely studied during the past few decades and has been developed in multi-modal retrieval. A lot of methods [
14,
15,
16] have been proposed to learn common representations with linear metrics for multi-modal data by forcing the distances of inter-modal dissimilar data larger than similar data. Along with deep learning, deep metric learning has been developed in many visual understanding tasks [
17], such as face recognition, image classification, visual search, visual tracking, person re-identification, and multi-modal matching. In the multi-modal task, hierarchical nonlinear transformations of deep neural network (DNN) [
18,
19,
20,
21] are utilized to learn the common multi-modal representations, in which the parameters of DNN for different modalities are optimized by modeling the similar and dissimilar constraints to preserve cross-modal relative ranking information. These methods are still based on hand-crafted image features, which are not optimal for multi-modal retrieval task since the stage of feature extracting and the stage of common representation learning are separated.
In recent studies [
22,
23,
24], multi-modal data are embedded as low-dimensional representations via two different deep models and learned into a shared latent space at the top layers by pulling inter-modal similar points together while separating dissimilar points far away. They learn multi-layer nonlinear transformations to align heterogeneous data based on a binary similar or dissimilar inter-modal relationship, whereas they ignore the intra-modal correlation of multi-modal data, which has been verified effective in subspace learning methods [
8,
10,
25,
26,
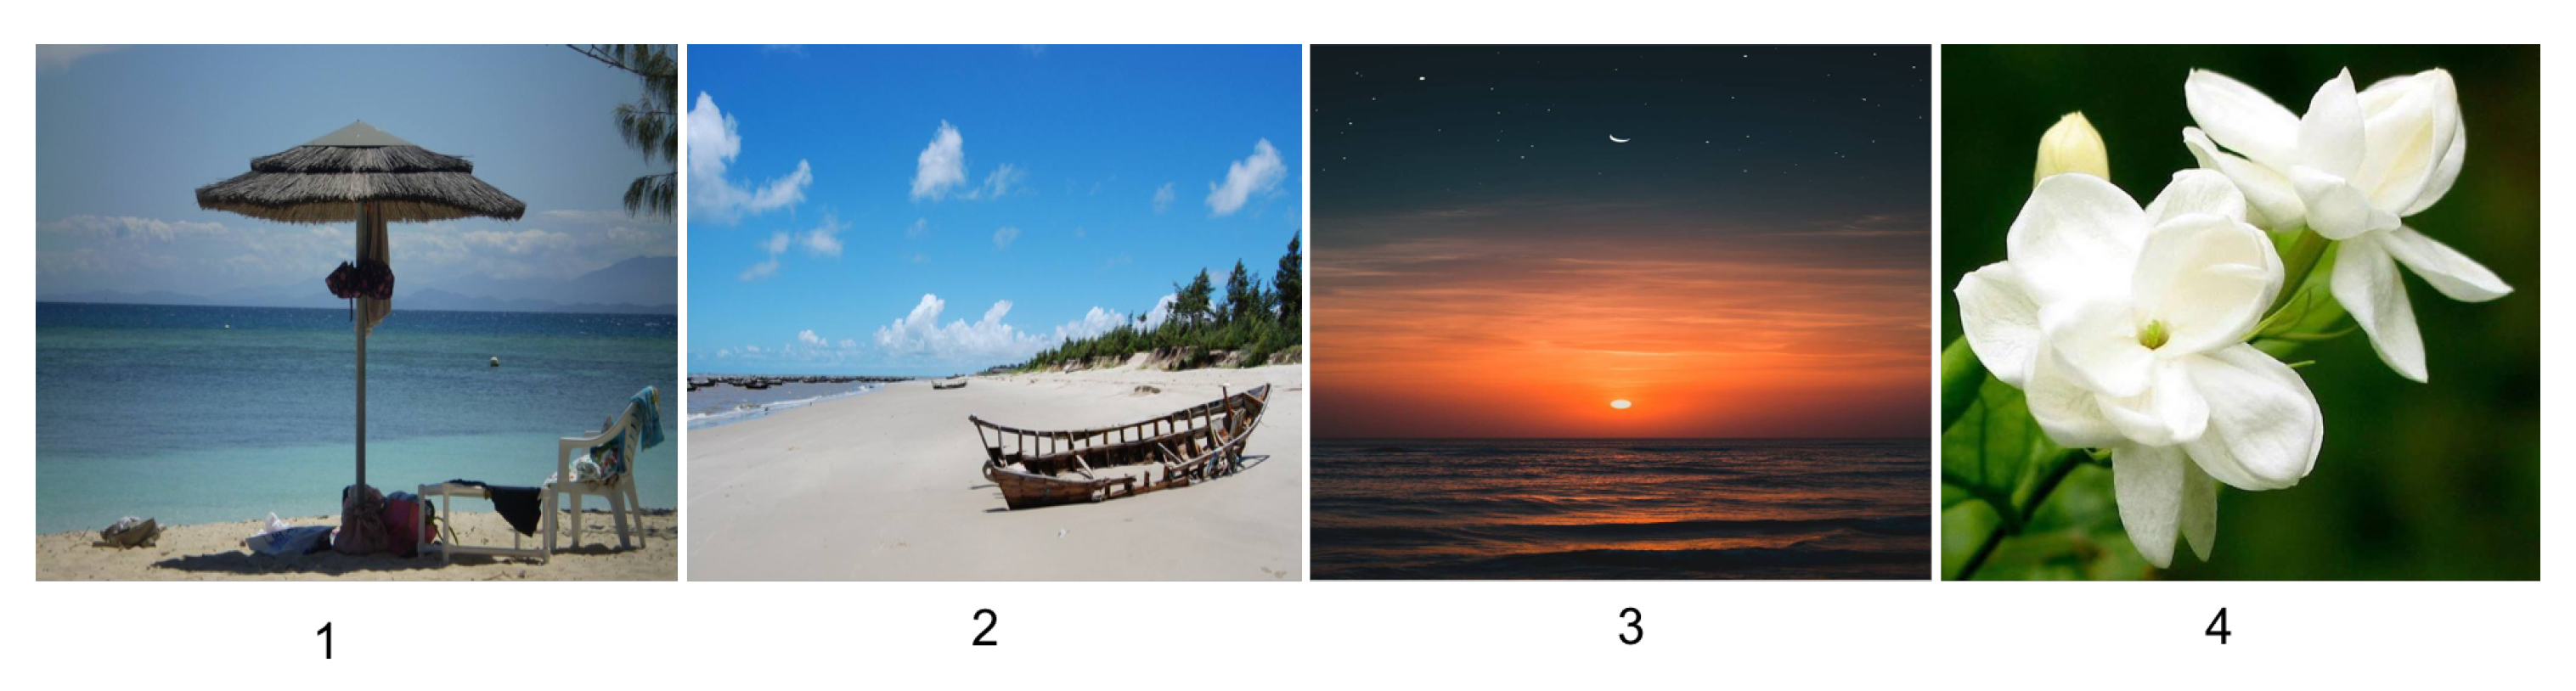
27]. In addition, a multi-scale semantic relationship is ignored in these methods, which consist of multi-scale similarities between inter-modal data and intra-modal data. Among inter-modal data, as shown in
Figure 2, image 1 vs. text “blue sky and beach with rest area is a good place for vacation” are best matching, images 2 and 3 vs. the text are similar somewhat, whereas image 4 vs. the text are dissimilar. Among intra-modal data, as shown in
Figure 2, images 1 vs. 2 are more similar than images 1 vs. 3; meanwhile, images 1, 2, and 3 are irrelevant to image 4.
In this paper, we propose Deep Multi-modal Metric Learning with Multi-Scale correlation (MS-DMML) for image and text retrieval. We design a deep model with two branches to learn common representations from raw heterogeneous data, where one branch is for image modality with stacked convolutional and fully-connected layers, and another branch is for text modality with stacked fully-connected layers. Inter-modal and intra-modal correlations are incorporated as loss function to train the deep model, in which the distances between both inter-modal and intra-modal instances are optimized to be consistent with multi-scale semantic relationship. In other words, image–text data with larger similarity are forced closer; meanwhile, dissimilar data are separated.
Figure 3 illustrates the framework of our method. Experimental on three widely-used datasets are conducted and the results demonstrate the effectiveness of our MS-DMML method on four kinds of retrieval tasks, i.e., image-to-text, text-to-image, image-to-image, and text-to-text. The contributions are summarized as follows:
We propose a deep multi-modal metric learning method for image–text retrieval, in which two network branches are simultaneously learned as metric functions to measure the image–text distances according to multi-modal semantic relationship. Compared to most existing linear projection methods [
2,
3] and multilayer perception based on hand-crafted features [
18,
20], the proposed method effectively learns the comparable representations for heterogeneous data in an end-to-end way.
The semantic relationship between multi-modal data are formulated in a multi-scale similarity way as shown in
Figure 2, rather than one-to-one correspondence [
2,
3] or binary similarity [
15,
22,
23,
24], which could force the deep network to learn fine-grained multi-modal distances and significantly improve retrieval performance.
We utilize the multi-scale semantic similarity to construct inter-modal and intra-modal correlations, which are incorporated to train the deep network. Our method benefits from combining inter-modal and intra-modal correlations, and achieves good performances on the four kinds of retrieval tasks.
2. Related Work
Our work is closely related to existing works on subspace learning, multi-modal metric learning, and deep learning for multi-modal retrieval. In this section, we briefly review the representative methods.
Typical methods in subspace learning is to learn two linear transformations for multi-modal data to project them into a common subspace, such as Canonical Correlation Analysis (CCA) [
1], which projects heterogeneous data as comparable low-dimensional representations by maximizing the corresponding inter-modal correlation. CCA has many extensions and varieties [
2,
9,
11,
12,
13]. Rasiwasia et al. [
2] performed the classification on CCA learned representations and regarded the classification probabilities as the common features. Multi-view CCA [
12] extends CCA to align the third view of high-level semantics with both image view and text view. Ranjan et al. [
13] proposed multi-label CCA with multi-label annotations to form the semantic inter-modal relationship rather than one-to-one correspondence. Rasiwasia et al. [
11] proposed cluster CCA to pair all points from one modality within a class with all points from the other modality in the same class and learn the projections using standard CCA. Sharma el al. [
9] proposed generalized multi-view analysis with discriminative information by maximizing covariance between the cross-modal exemplars from the same class, which is a generalized and supervised extension of CCA. Partial Least Square (PLS) [
28] learns the linear mapping from one modality to another modality such that the covariance between latent scores of the two modalities is maximized. Cross-modal Factor Analysis (CFA) [
3] learns two orthogonal transformation spaces where pairwise inter-modal data are projected as close to each other as possible. These methods could be extended to kernel version to provide nonlinear feature representations, such as kernel CCA used for cross-modal retrieval by Hardoon et al. [
29].
Besides the inter-modal correlation, there are several subspace learning methods utilizing intra-modal correlation when learning common representations. Song et al. [
25] explored both inter-modal and intra-modal consistency to learn hash functions to map multi-modal data into the common Hamming space. Hu et al. [
26] proposed iterative multi-view hashing to preserve the within-view similarity and the between-view correlations. Zhen et al. [
27] proposed co-regularized hashing based on a boosted co-regularization framework with intra-modality and inter-modality loss. Kan et al. [
8] formulated multi-view discriminant analysis by maximizing the between-class variations and minimizing the within-class variations of the learnt embeddings from both intra-view and inter-view perspectives. Jing et al. [
10] proposed multi-view feature learning to process the supervised correlation information of samples with each view and between all views. Inspired by these shallow subspace learning methods, we explore both inter-modal and intra-modal correlations to learn deep distance metrics for heterogeneous data in this paper.
Numerous metric learning methods have been proposed in recent years, as a survey on metric learning for feature vectors and structured data in [
30]. For example, Xing et al. [
31] learnt a distance metric on points to respect their similar and dissimilar relationship. Large margin nearest neighbor classification method [
32] learns a Mahalanobis distance metric with a goal that the k nearest neighbors always belong to the same class while examples from different classes are separated by a large margin. These methods are designed for a single kind of data; meanwhile, there has been a lot of metric learning methods for multi-modal data. A passive-aggressive model for image retrieval [
14] method projects images into text space and ranks the relevant images appearing above the irrelevant images with text query by large margin learning. A bi-directional cross-media semantic representation model [
15] optimizes the bi-directional list-wise ranking loss with a discriminative latent space embedding by the structural large margin learning. Huo et al. [
16] proposed to optimize the performances under the receiver operating characteristic curve when learning the metric transformations for multi-modal data. Most of these methods learn linear distance metrics according to binary similarity constraints. However, we employ a deep learning method to learn multi-modal distances with multi-scale semantic constraints in this paper.
In recent years, deep learning has become an active research topic and shown strong nonlinear learning ability. Inspired by the improvement of deep neural network in single model retrieval, researchers have also attempted to apply deep models to multi-modal retrieval. Ngiam et al. [
4] proposed a deep multimodal auto-encoder model to learn representations for coupled speech audio and videos of the lips. A deep Restricted Boltzmann Machine [
5] is constructed by using separate latent models for each modality and a shared layer to learn the joint distribution of heterogeneous data. Andrew et al. [
6] presented deep CCA, a deep learning method to learn complex projections for different modalities such that the resulting representations are highly correlated. Furthermore, Yan et al. [
7] proposed an end-to-end learning scheme based on deep CCA. Feng et al. [
33] utilized correspondence auto-encoder (Corr-AE) to correlate the hidden representations of two uni-modal auto-encoders. Wei et al. [
34] proposed DeepSM to construct deep models for multi-modal data to learn the probabilities of classification as semantic common representations. These methods are typical deep multi-modal learning methods. However, they do not take into account dissimilar pairs directly, and thus tend to produce false positives in multi-modal retrieval tasks.
One recent direction emerging from deep learning community is adding the metric learning loss on top layers using the constraints on distances of heterogeneous data. Liong et al. [
18] proposed deep coupled metric learning for cross-modal matching with multi-layer nonlinear transformations to map samples from different modalities into a shared latent feature subspace by minimizing the intra-class variation and maximizing the inter-class variation. Huang et al. [
19] integrated quadruplet ranking loss and semi-supervised contrastive loss for modeling cross-modal semantic similarity in the deep model. Luo et al. [
20] proposed learning to rank with nonlinear mapping functions for cross-modal data by using the self-paced learning with diversity. Peng et al. [
21] adopted a two-stage learning based on deep neural network, in which intra-modal and inter-modal correlation are simultaneously modeled for feature learning and common representation learning stages, respectively. However, these methods are still based on hand-crafted features or features extracted with a trained deep model.
More recently, the common representations and feature extracting for multi-modal data are simultaneously learnt in an end-to-end deep metric learning model. Zhang et al. [
22] constructed cross-modal ranking loss and within-modal discriminant loss to unify the training of two heterogeneous networks, deep residual network (ResNet) over images, and long short-term memory over sentences. Carvalho et al. [
23] proposed a double-triplet scheme for both the retrieval loss and the class-based loss to train a dual deep neural network. Marin et al. [
24] proposed to maximize the cosine similarity between positive recipe-image pair and minimize it between all non-matching recipe-image pairs, and incorporate additional semantic regularization through high-level classification. Wang et al. [
35] proposed feature projector to generate common representations and confuse modality classifier, and they imposed triplet constraints on the feature projector. The losses for these methods are constructed based on binary similarity of inter-modal data (similarity and dissimilarity). Compared with these methods, multi-scale similarities are utilized to construct inter-modal and intra-modal semantic correlations, which are then combined to learn the deep distance metrics in this paper. The learned distances between multi-modal data would be fine-grained and reflect the multi-scale semantic relations conversely.
3. Deep Multi-Modal Metric Learning with Multi-Scale Correlation
In this section, we give the details of the proposed method. Two deep networks are designed as feature extracting and common representation learning for image and text modalities respectively, as shown in the left part in
Figure 3, and distance constraints of inter-modality and intra-modality are constructed to be consistent with multi-scale semantic similarity, as shown in the right part in
Figure 3.
The multi-modal dataset consists of two modalities with
M image instances and
N text instances, which is denoted as
.
denotes image data, where
represents the
m-th raw image with three-channel RGB pixel values, and
is the category vector of the image and its dimension is the number of all categories in the dataset.
denotes text data, where
is bag-of-words representation and its dimension is the number of all words appearing in whole text dataset.
is category vector for the text. In contrast to CCA and its related methods [
1,
3,
28], our solution does not need strictly one-to-one corresponding multi-modal data, thus
M is not required to equal to
N.
3.1. Deep Networks for Image and Text Modalities
Our network architecture consists of two branches that map each modality, i.e., image and text, into a common representation space, where the distances can be directly compared, as shown in
Figure 3.
ResNet [
36] promotes neural networks to a much deeper architecture and gains the accuracy from the considerably increased depth. Extensive works [
22,
23,
24] have validated that ResNet can learn the most superior deep features for images in multi-modal retrieval tasks. Therefore, we apply ResNet-101 in an image branch to exploit the significant features implied in image data, which is pre-trained on ImageNet and fine-tuned in our experiments. On top of ResNet-101, we design stacked fully-connected layers to map image features into common representations, which will be compared with text representations. The outputs with 2048 dimensions before a classification layer of ResNet-101 are fed into the fully-connected network. All fully-connected layers are followed with nonlinear activation. The output of the last fully-connected layer is represented as
for the
m-th image
.
In the text branch, the stacked fully-connected layers are utilized to learn feature representations. Input text is firstly represented as a bag-of-words vector and fed into the deep network. Compared to an image branch with a large number of convolution layers and stacked fully-connected layers, the deep architecture for text is simple. Convolution operation is usually used to extract image features due to it being possible to capture a strong spatial neighbor relationship. Text consists of many unordered words in some multi-modal retrieval scenarios, such as in datasets [
37,
38], thus we employ fully-connected operation rather than convolution to process bag-of-words vectors. Furthermore, semantic information is generally related with objects or categories, which are usually represented by nouns, that is, words could provide high-level semantic information relative to image pixels. Therefore, we believe that the relatively simple network is capable of extracting text representations for multi-modal retrieval. The fully-connected layers are followed with nonlinear activation, and the final output is denoted as
for text
.
The outputs of the last fully-connected layers for image and text are then normalized with
where the squared sums of
and
both equal to 1. The
normalization operation is in favor of comparing the distances of multi-modal data on the same scale.
3.2. Multi-Scale Metric Learning
When learning deep metrics to project the heterogeneous data into the comparable representations, inter-modal and intra-modal correlations are built on semantic relations between multi-modal data. We propose to measure the semantic relations by the category vectors of multi-modal instances in a multi-scale similarity way, as shown in
Figure 2. Inter-modal and intra-modal multi-scale similarity between the
m-th instance and the
n-th instance are defined as
where
denotes the transpose of vector
x.
is inter-modal semantic similarity,
is similarity for image modality, and
is for text similarity. In most existing work mentioned in
Section 2, a semantic relationship between instances is binary (similar and dissimilar), where the similar instances share at least one category, while the dissimilar instances do not share any category. In our method, we refine the similar relationship to multi-scale and represent it with a real value (i.e., Equations (
3)–(5)). If two instances are labelled with more common categories, the similarity value is closer to 1. Expect to learn the distance metrics between image and text modality so that the instances with larger semantic similarity value can be pulled closer to each other.
The loss of inter-modal multi-scale correlation is thus formulated as
where
and
are the normalized feedforward outputs of the deep networks of image and text modalities, respectively. If the inter-modal instances are with larger similarity
, the square distance
should be smaller. It has a trivial solution with all metrics set to 0, thus a dissimilarity constraint is needed. If
, which denotes that the image and the text are without common category labels, and the distance between the
p-th image and the
q-th text should be larger than a constant
c. By minimizing
to optimize the deep model, the learned distances between inter-modal data are fine-grained and would be consistent with the multi-scale semantic constraint. However, not all dissimilar inter-modal instances could satisfy the hard constraints, so the slack variable is introduced into the inter-modal loss as
where
and
are the trade-off parameters between the multi-scale similarity and dissimilarity, and
. The inter-modal loss function is then equivalent to the following equation:
where function
is set to 1 if
x is equal to 0, otherwise
is set to 0.
Besides the inter-modal correlation, intra-modal correlation among multi-modal data could promote the multi-modal retrieval performances, which is also formulated as metric learning with a multi-scale semantic relationship:
where
represents the multi-scale similarity of the
m-th image and the
n-th image. By optimizing
, more similar images are pulled closer and dissimilar images are separated. In addition, the same loss is defined for text modality as follows:
where
represents the multi-scale similarity of the
m-th text and the
n-th text. In addition, more similar texts are pulled closer and dissimilar texts are separated by minimizing
.
By combining Equations (
8)–(
10), we could get the following loss to train the two deep network branches for image and text modalities,
where
,
, and
are the trade-off parameters between the inter-modal and intra-modal correlation constraints, and
. By optimizing this weighted loss, our model could represent multi-modal data in a common space, in which their distances satisfy multi-scale semantic constraints. Thus, our method could reduce the heterogeneous and semantic gap between multi-modal data.
The optimization is to minimize the loss by fine-tuning ResNet and learning the multiple nonlinear transformations from sketch for image and text modalities. In training, we compute semantic similarity values
,
and
by the given training dataset, and take the derivatives of objective function
L with respect to
and
. The gradients are then back propagated to
normalization, fully-connected layers and ResNet successively according to chain rule. We employ Adam [
39] to update parameters with gradients. In tests, comparable representations are firstly extracted from raw images and texts with the trained deep model; then, the representations are used to achieve the four kinds of retrieval tasks by distance computing and ranking.
4. Experiments
4.1. Dataset and Measurement
NUS-WIDE contains 269,498 images and corresponding tags, which are associated with 81 multi-label categories as ground truth, 1.8 on average for each image–text pair. Text annotations are represented with 1000-dimension bag-of-words vectors, and each text annotation has 7.8 words on average. We drop those pairs containing images without any category label or text annotation. We randomly select 20,000 image–text pairs for training and 2000 for validation from the training list provided by [
37]. In addition, we randomly select 10,000 for test from the test list provided by [
37].
MIR Flickr consists of 1 million images from the social photography website Flickr, where images are released under the Creative Commons License. Among the 1 million images, 25,000 have been annotated using 24 labels including categories such as bird, tree, people, indoor, sky, and night. A stricter labeling was done for 14 classes where an image was annotated with a category only if that category was salient. This leads to 38 multi-label categories, and 4.7 labels on average for each image. The images are all accompanied by user assigned tags on the Flickr website. We process all tag words and obtain the most frequent 2000 words as the bag to represent text modality, and each text has 6.3 words on average. We remove the images without tags or labels from the 25,000 images and 21,093 are remained. We random select 9093 for training, 2000 for validation, and 10,000 for test.
Wikipedia consists of 2866 image–text pairs from 10 categories such as history, art, biology, and literature. Each image and text belong to one category. We process all texts and obtain the most frequent 2000 words as the bag to represent text modality, and each text has about 106 words on average. We separate the training set 2173 pairs provided by [
2] into 1973 for training and 200 for validation, and use 693 pairs provided by [
2] for tests.
Mean Average Precision (mAP) is adopted for performance evaluation. The Average Precision (AP) of a query is computed by
where
R is the number of retrieved results,
denotes the precision of the top
r retrieved items,
if the
r-th retrieved result is relevant, and
, otherwise. mAP score is the mean of AP on all queries.
4.2. Implementation Details
For image modality, we utilize the pre-trained ResNet-101 to extract features from raw RGB images. The short edge of each image is firstly scaled to 256, and the long edge is proportionately scaled. The central region of images with size of
are then randomly cropped into
as the inputs fed into the deep model. The outputs with 2048 dimensions before classification layer are fed into fully-connected layers for learning the common representations with texts. For text modality, bag-of-words vectors are taken as inputs into fully-connected layers; thus, the input layer of text modality is with 1000 neural units for NUS-WIDE and 2000 for both MIR Flickr and Wikipedia. The numbers of fully-connected layers are both 2 for image and text branches. The number of neural units of hidden layer is 1024 and that of output layer is 256. Nonlinear activation function for the fully-connected layers is RELU. The outputs of images and texts are
normalized and then used to compute the loss of inter-modality and intra-modality with multi-scale semantics. The parameters for all fully-connected layers are initialized with random values sampled from a normal distribution with mean of zero and standard deviation of
. Learning rate is set to
. We train the model for 20 epochs with batch size 64. In a batch, we compute the correlations between any two samples; thus,
inter-modal and
intra-modal semantic correlation pairs are produced for training when processing the batch data to update the parameters of deep network. The parameter
c in Equations (
8)–(
10) is set to 1. Other parameters
,
,
,
, and
are selected by grid search on validation datasets in the following experiments.
4.3. Validation on Inter-Modal and Intra-Modal Correlations
To validate the influence of inter-modal and intra-modal correlation on retrieval performances, we vary the value of parameter
from 0 to 1 with step 0.2 and set
in experiments. We report the representative mAP scores with
on validation datasets in
Table 1, where
and
are fixed as
and
, respectively. The parameters with
mean that our model is individually trained with intra-modal correlation and
mean training with inter-modal correlation, thus called MS-DMML-Intra and MS-DMML-Inter, respectively. Our full model MS-DMML is set with the parameters
in this experiment.
On three datasets, the performances of MS-DMML-Intra on image-to-text and text-to-image are respectively on NUS-WIDE, on MIR Flickr, and on Wikipedia. They are obviously lower than that of MS-DMML and MS-DMML-Inter, which indicates that the intra-modal correlation is not enough for inter-modal retrieval tasks. The performances of MS-DMML-Inter on image-to-text and text-to-image are respectively on NUS-WIDE, on MIR Flickr, and on Wikipedia, which are as close as the performances of MS-DMML. It shows that the inter-modal correlation is useful for an inter-modal retrieval task. The performances of MS-DMML-Inter on text-to-text on the three datasets respectively , are lower than that of MS-DMML-Intra with , which shows that intra-modal correlation is suitable for intra-modal retrieval tasks. The performances of MS-DMML are, respectively on NUS-WIDE, MIR Flickr, and Wikipedia datasets on average, which are the best among MS-DMML-Inter and MS-DMML-Intra. This validates that the performances of multi-modal retrieval tasks benefit from combining the inter-modal and intra-modal correlations. All of the following experiments are based on settings.
4.4. Validation Multi-Scale Correlation
In this section, we validate the effectiveness of multi-scale semantic correlation on validation datasets.
On NUS-WIDE, the value of multi-scale similarity (i.e., Equations (
3)–(5)) for deep metric learning is between 0 and 1. The similarity of two instances without common category is represented as 0, and the similarity of two instances with one or more common categories is represented as larger than 0. However, the two cases are the binary semantic relationship in most existing methods [
22,
23,
24]. To simulate the binary setting, we thus simplify our model by setting the similarity value as 0 if it is 0 and setting the value as 1 if it is larger than 0. The simplified model is called MS-DMML-bin. We compare the proposed full model with MS-DMML-bin and vary parameter
from 0.2 to 0.8 with step 0.2. The representative mAP scores with
are shown in
Table 2. With
, the retrieval performances on four tasks of MS-DMML are respectively
, and the average value is
, which is higher than the average performance of MS-DMML-bin with
. With
, the average performance of MS-DMML (
) is also higher than that of MS-DMML-bin (
). The results show multi-scale semantic correlation can improve the performance of multi-model retrieval.
MIR Flickr is also a multi-label dataset, on which the semantic similarity setting is the same as that on NUS-WIDE, and we compare the full model MS-DMML with MS-DMML-bin on MIR Flickr. The mAP scores with
are shown in
Table 2. With
, the retrieval performances on four tasks of MS-DMML are respectively
, and the average value is
, which is higher than the average performance of MS-DMML-bin with
. With
, the average performance of MS-DMML (
) is also higher than that of MS-DMML-bin (
). The results also show the effectiveness of multi-scale semantic correlation for promoting the multi-model retrieval.
Wikipedia is a single-label dataset; we thus compare it with the simplified version of our model, which only considers the correspondence of inter-modal data. If an image and text are one-to-one corresponding, the similarity is set to 1, otherwise 0. The simplified model is called MS-DMML-bin. The mAP scores with
are shown in
Table 2. With
, the retrieval performances on four tasks of MS-DMML are respectively
, and the average value is
, which is obviously higher than the average performance of MS-DMML-bin with
. In addition, with
, the average performance of MS-DMML (
) is also obviously higher than that of MS-DMML-bin (
). The results show label information is really helpful for multi-modal retrieval, and our method could also process single-label data by incorporating the category information into similarity for learning semantic common representations.
From the results, we can obtain that the average performances of MS-DMML with are close to on NUS-WIDE and Wikipedia, and the average performance with () is higher than with () on MIR Flickr. This might be due to the number of average labels of MIR Flickr being more than that of NUS-WIDE and Wikipedia; therefore, the weight of similarity item should be relatively small to form a trade-off between the multi-scale similarity and dissimilarity items. However, for the three datasets could achieve a good performance; thus, we fix the parameters for all of the following comparison experiments.
4.5. Comparison with Others
MS-DMML is compared with several state-of-the-art methods, PLS [
28], CCA [
2], CFA [
3], 3V-CCA [
12], ml-CCA [
13], DeepSM [
34], and Recipe [
24]. PLS, CCA, CFA, 3V-CCA, and ml-CCA are shallow correlation learning methods; thus, we use the 2048-dimensional visual features extracted with pre-trained ResNet-101 to learn the common representations for the five methods for fair comparison. The textual input of all methods is bag-of-words representations. DeepSM and Recipe methods are designed as end-to-end cross-modal learning frameworks, while the same deep neural networks are used in our experiments for fair comparison except following inevitable differences. DeepSM utilizes the classification probabilities of image and text data to form semantic mapping vectors for retrieval, where the dimensions of the learnt common semantic vectors are the number of categories, i.e., 81 for NUS-WIDE, 38 for MIR Flickr, and 10 for the Wikipedia dataset. The units numbers of the top fully-connected layers in deep neural networks are thus replaced with the corresponding 81, 38, and 10 for three datasets respectively when learning a DeepSM model. For all other methods, the common features learnt are of 256 dimensions. For PLS, CCA, CFA, 3V-CCA, ml-CCA, and DeepSM, inner product (IP) and Euclidean distance (ED) are both used as distance measurement to rank the retrieved data since their learnt representations are not normalized. For the Recipe method, cosine is used as distance measurement since cosine distances are used when learning the model in the paper [
24]. For our method MS-DMML, inner product and Euclidean distance are equal since
normalization is used before computing the inter-modal and intra-modal multi-scale constraints in our method. All experimental results are obtained on a test set of the three datasets.
The mAP performances with
of these methods on NUS-WIDE are reported in
Table 3. The performances of three end-to-end deep methods, DeepSM, Recipe, and MS-DMML are better than that of PLS, CCA, CFA, 3V-CCA, and ml-CCA, which shows the designed fully-connected networks are effective to learn the common representations of multi-modal data in an end-to-end framework. 3V-CCA and ml-CCA are multi-label supervised methods, whose performances are better than PLS, CCA, and CFA, three correlation methods with one-to-one correspondence. Our method achieves
mAP score on average of four retrieval tasks, which outperforms DeepSM’s performances,
got with inner product and
with Euclidean distance. This is due to 256-dimensional feature representations of our method stronger than 81-dimensional, classification representations obtained by DeepSM. Recipe uses classification loss as a regularization to learn the pairwise similarity/dissimilarity correlation between inter-modal data, whereas multi-scale similarity and intra-modal correlation are not considered in Recipe. This may be the reason that our method outperforms Recipe method with
and
average performances, respectively.
The mAP performances with
of these methods on MIR Flickr are reported in
Table 4. The performances of three deep methods, DeepSM, Recipe, and MS-DMML are better than that of PLS, CCA, CFA, 3V-CCA, and ml-CCA, which also shows the effectiveness of end-to-end learning frameworks. 3V-CCA and ml-CCA are slightly lower than CCA and CFA. The anomalous performances might due to 3V-CCA and ml-CCA excessively focusing on the correspondence of multi-modal similar data (or the data of the same class), whereas ignoring the dissimilarity data, since category labels of MIR Flickr are relatively abundant to make an overdose of the similar data. Leveraging on metric learning, our method could adjust the proportion of dissimilarity constraint by parameter
, as the results of parameter experiment in
Table 2, in which our model achieves better performance with
than with
. This validates the importance of dissimilar constraint, whereas it is ignored by most supervised subspace learning methods such as 3V-CCA and ml-CCA. Our method achieves an
mAP score on average of four retrieval tasks, which outperforms DeepSM’s performances (
got with inner product and
with Euclidean distance), and outperforms the Recipe method (
on average). This validates multi-scale semantic correlations of intra-modality and inter-modality are conducive to multi-modal retrieval.
The mAP performances with
of these methods on Wikipedia are reported in
Table 5. The performances of deep methods, DeepSM, Recipe, and MS-DMML are better than that of PLS, CCA, CFA, 3V-CCA, and ml-CCA, which is the same as on NUS-WDIE and MIR Flickr. Supervised methods 3V-CCA and ml-CCA are better than PLS, CCA, and CFA on this single-label dataset. Our method achieves
mAP score on average of four retrieval tasks, which outperforms DeepSM’s performances (
got with inner product and
with Euclidean distance). This is due to 256-dimensional feature representations of our method stronger than 10-dimensional classification representations of DeepSM. Recipe achieves
performance on average, which is worse than our method. This validates the semantic relationship and intra-modal correlation are helpful on single-label multi-modal dataset.
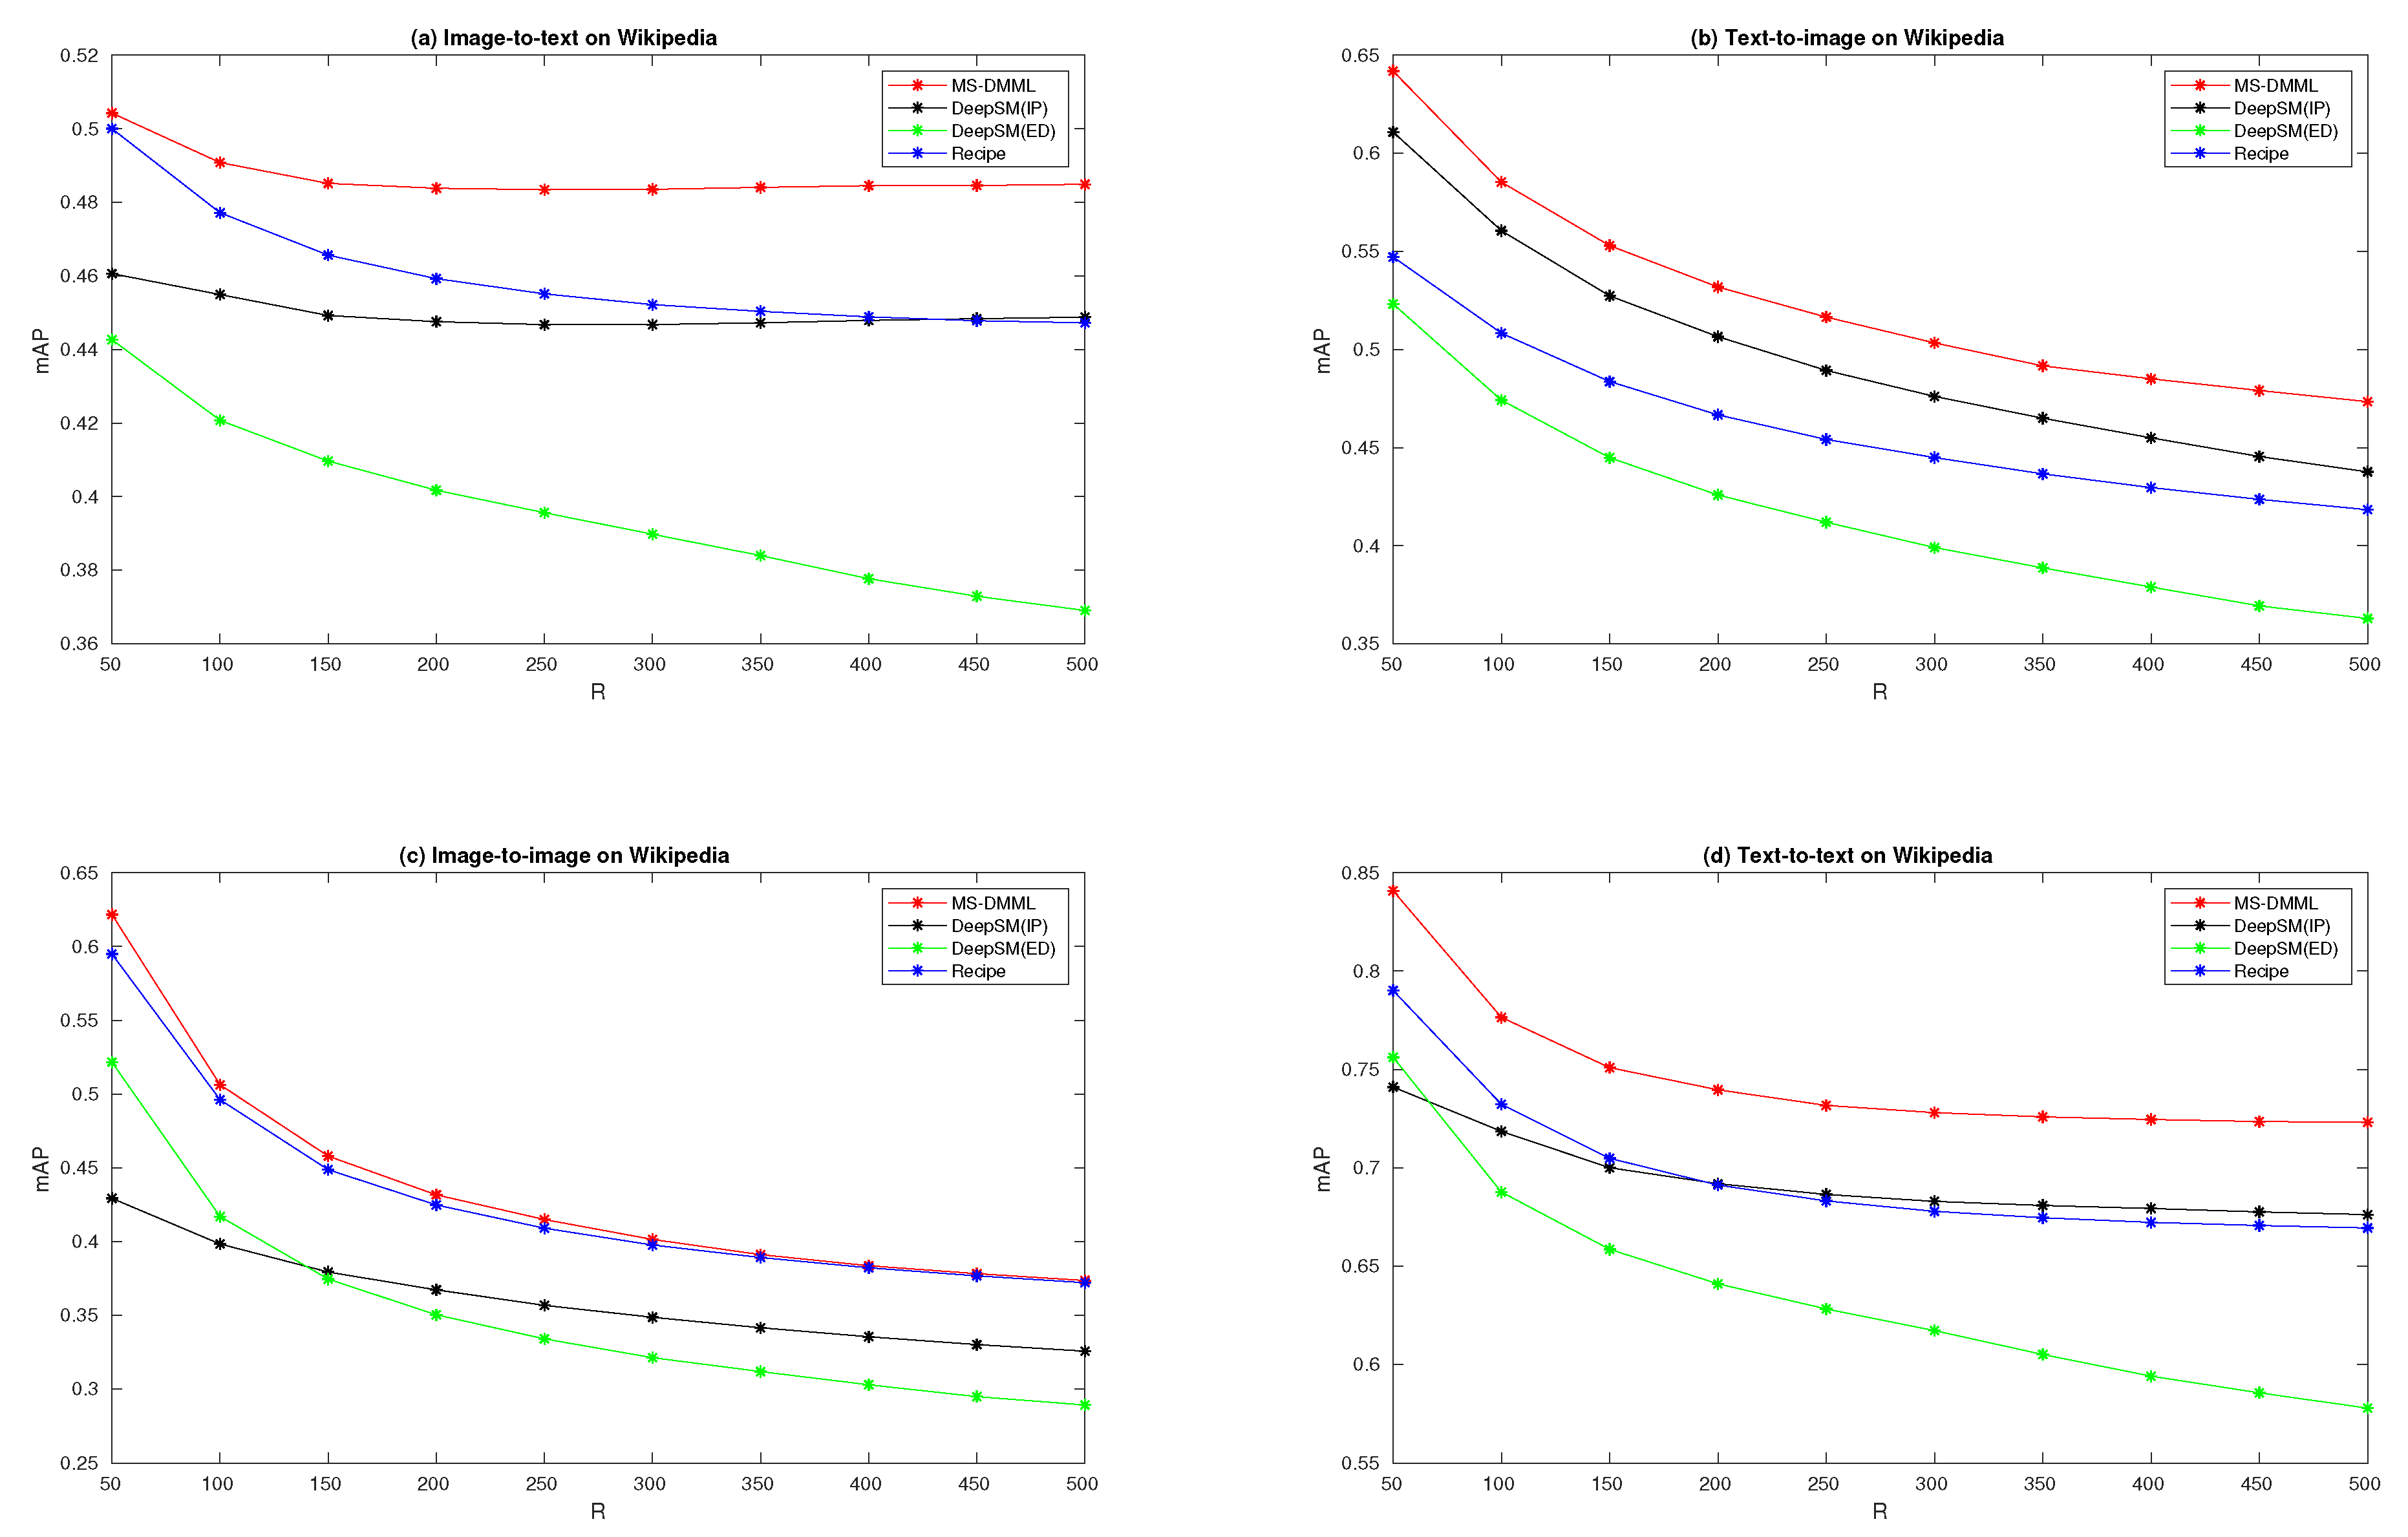
4.6. Performance Curves
We vary the number of retrieved results
R from 50 to 500 with step 50 and plot the 10 mAP scores on the curves in
Figure 4,
Figure 5 and
Figure 6 for three datasets. We compare MS-DMML with two end-to-end deep methods DeepSM and Recipe in this section. The red curves in the figures are mAP performances of our method MS-DMML. The black and green curves are mAP scores of DeepSM ranking with inner product and Euclidean distance. The blue curves are mAP scores of Recipe method.
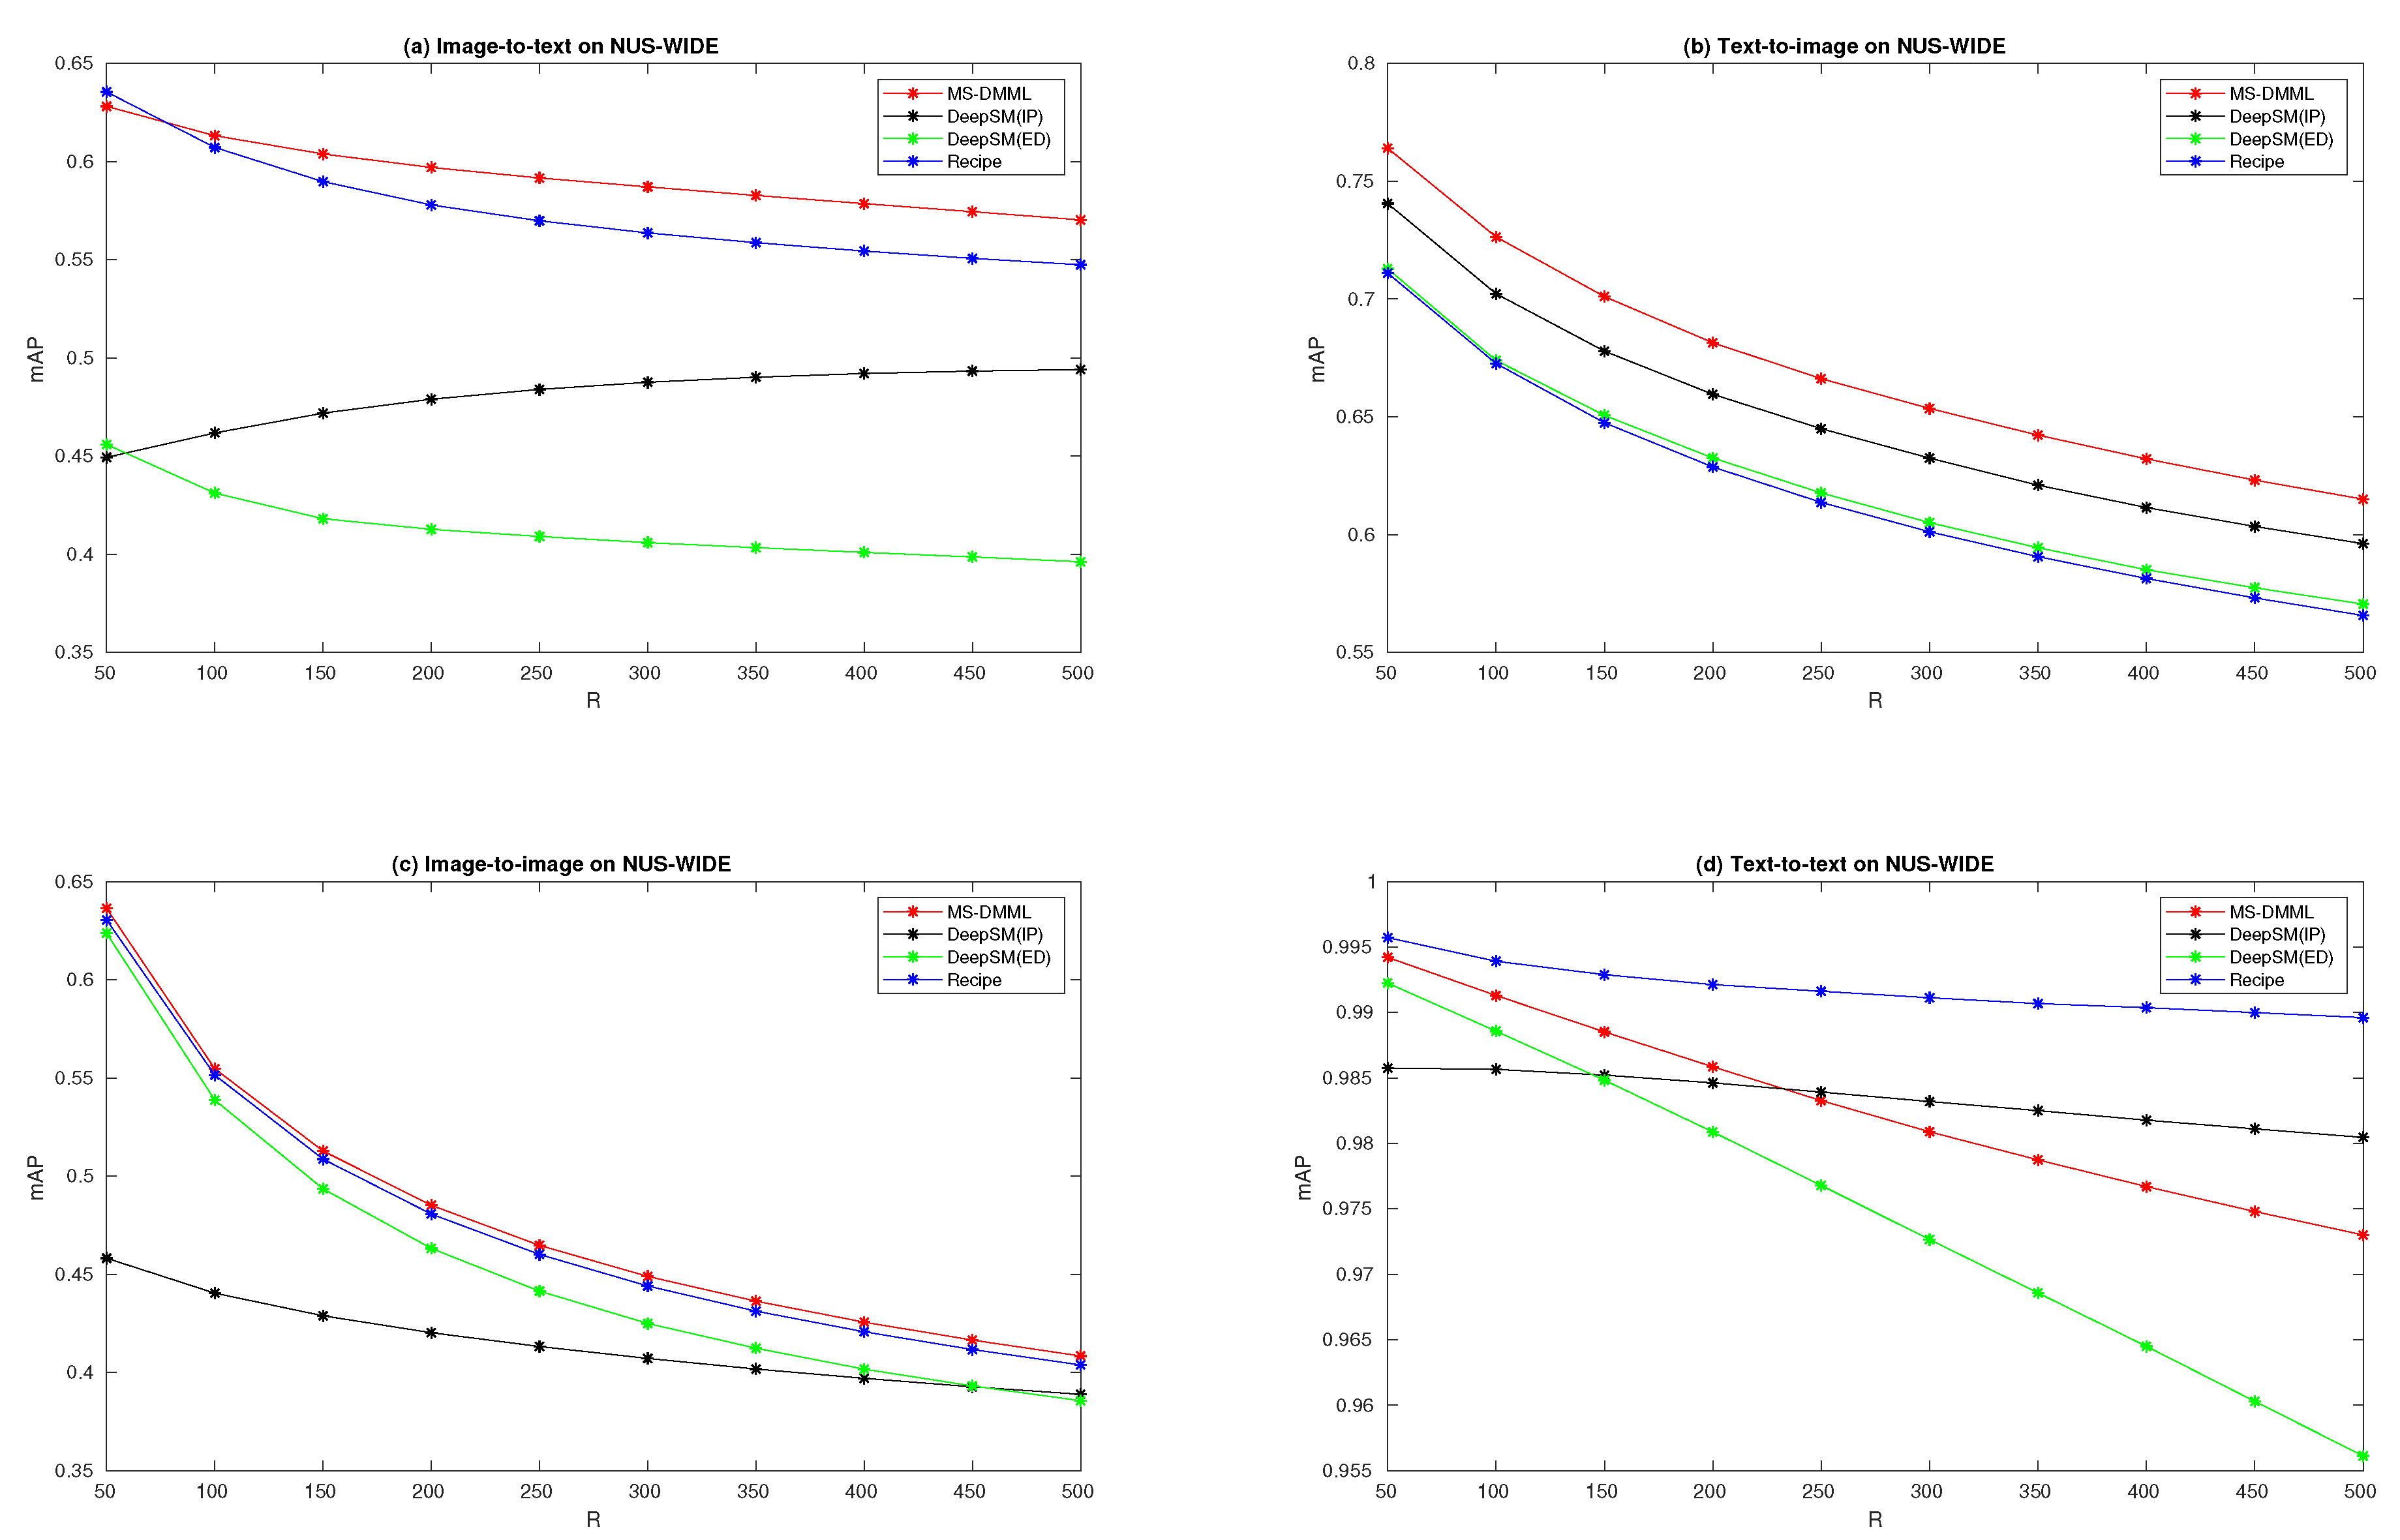
In
Figure 4, the performance curves on NUS-WIDE are plotted for four retrieval tasks. Sub-figure (a) is for an image-to-text retrieval task, from which we can see that the curve of MS-DMML is above others except at the first point with
. From sub-figures (b) and (c) for text-to-image and image-to-image retrieval tasks, we can obtain that our method outperforms DeepSM and Recipe. On sub-figure (d) for a text-to-text retrieval task, though the performances over
are achieved by our method, the curve of MS-DMML is below that of Recipe and DeepSM with
. In
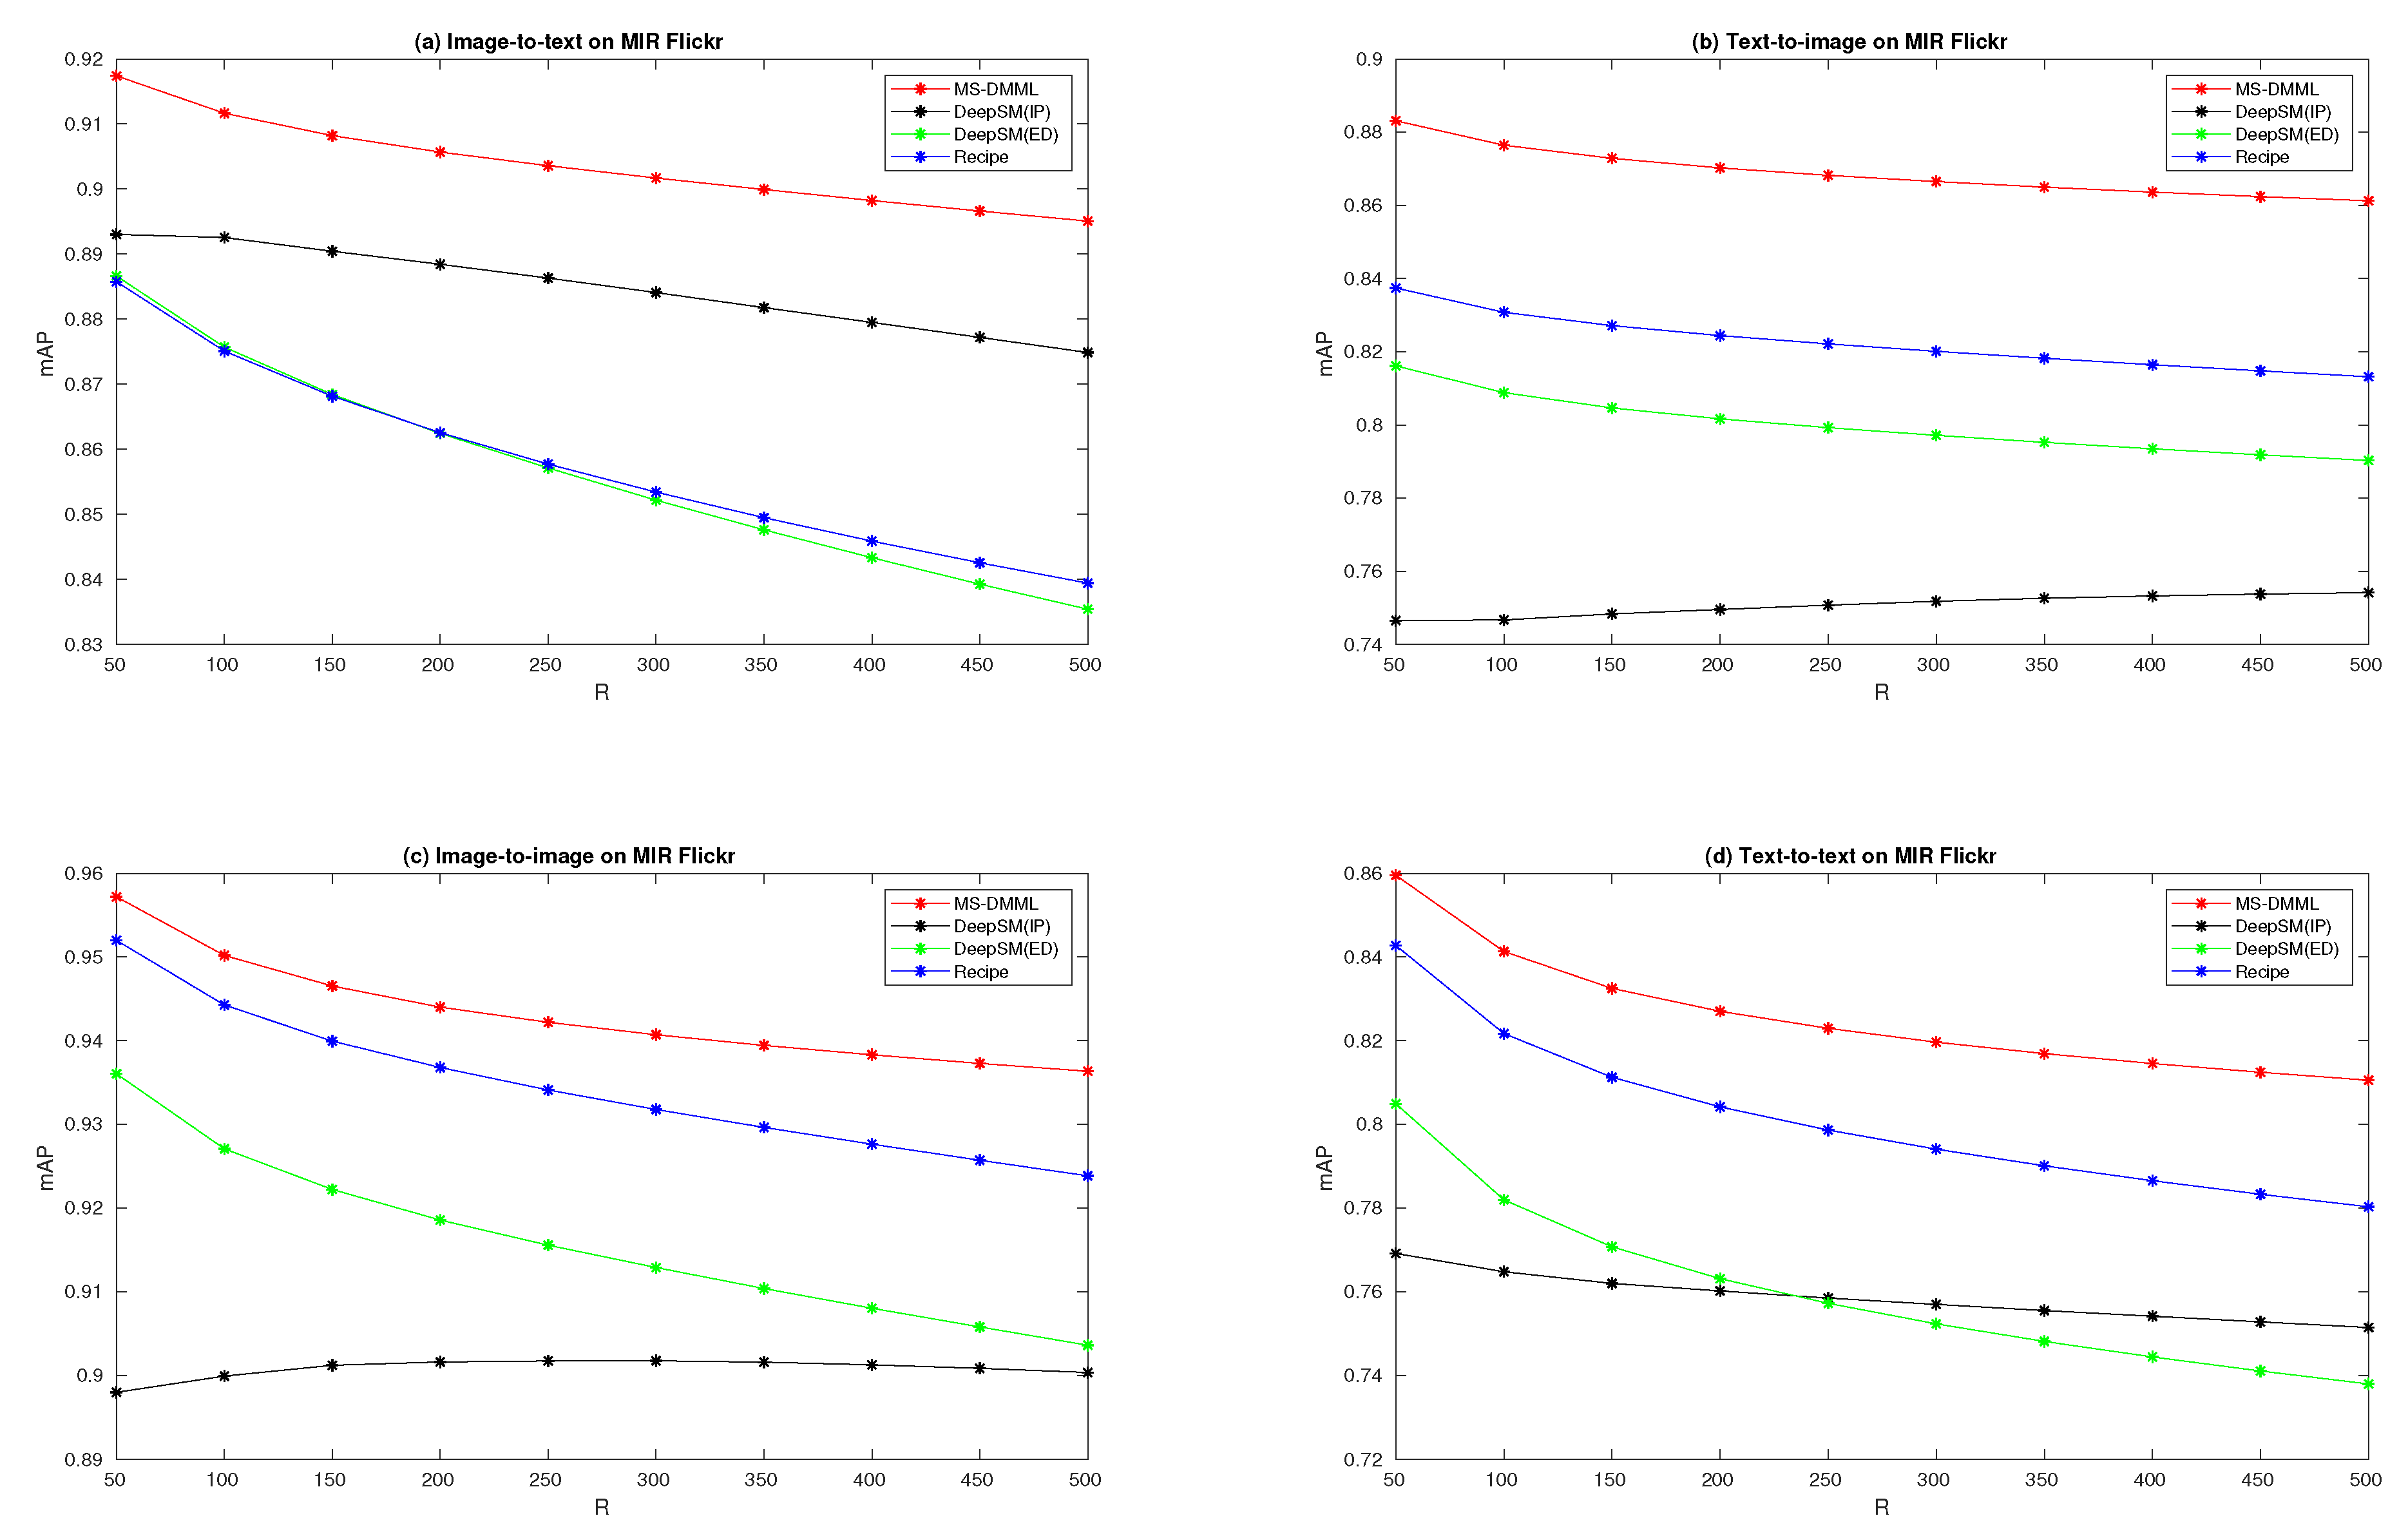
Figure 5, the performance curves on MIR Flickr are plotted for four retrieval tasks. From the four sub-figures, we can see that all red curves are above others. It shows that MS-DMML outperforms DeepSM and Recipe methods on four kinds of multi-modal retrieval tasks. In
Figure 6, the performance curves on Wikipedia are plotted for four retrieval tasks. From sub-figure (c) for an image-to-image task, we can see that the performance of MS-DMML is slightly higher than that of the Recipe method. From the other three sub-figures, we can see that our method outperforms DeepSM and Recipe methods prominently with
R from 50 to 500. These curves validate that the performances of MS-DMML are robust regardless of how many retrieval results are considered for computing mAP.
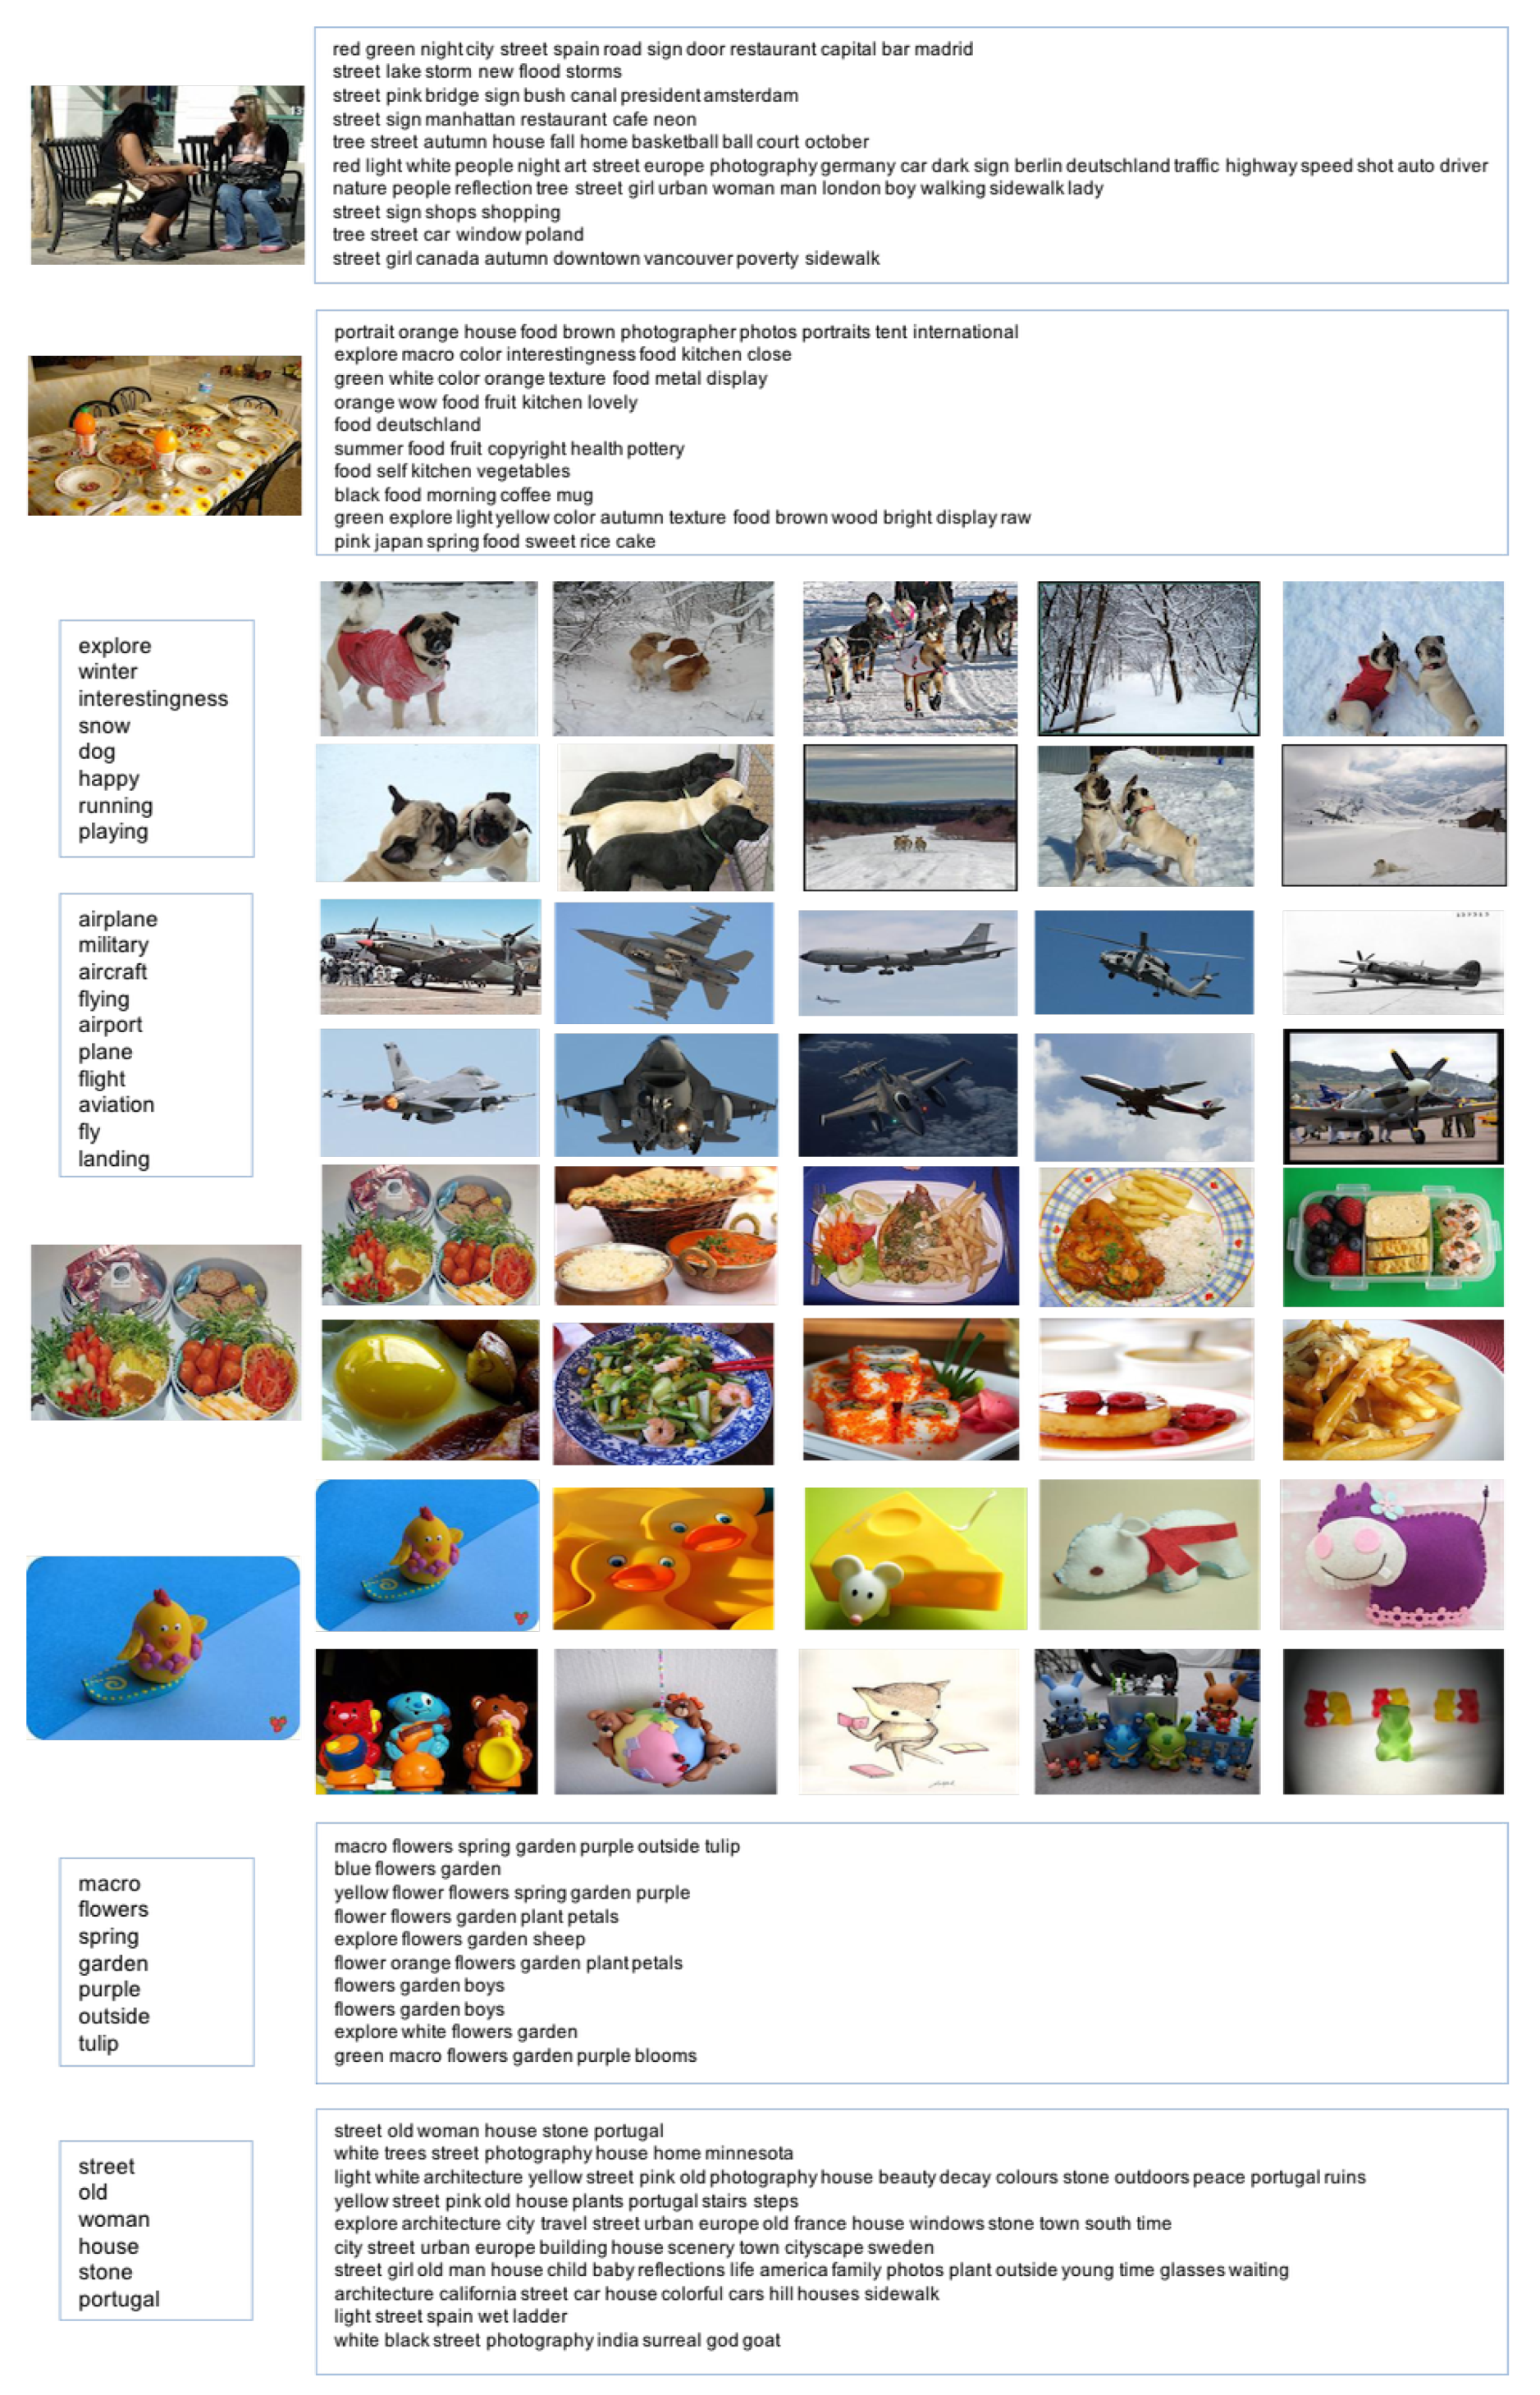
4.7. Retrieval Examples
Examples of retrieval results on NUS-WIDE and MIR Flickr obtained with our method are shown in
Figure 7 and
Figure 8, respectively. The left side of each retrieval task is the query and the right side is the top 10 ranked results, and each textual result is listed at one line. Take the retrieval results on NUS-WIDE in
Figure 7 as example. At the second line, querying with the image of semantic “food on table” are returned with 10 textual results, which almost contain relevant words “food, kitchen, orange, and cake” to the query. At the fourth line, querying with a textual document of “airplane military aircraft flying airport plane flight aviation fly landing”, the top 10 ranked images all well illustrate the textual information. At the fifth and sixth lines, querying with the images of semantic “food” and “cartoon yellow duck” respectively, the top 10 ranked images are all relevant; meanwhile, their appearances do not all look the same, which shows the effectiveness of modeling semantic correlation with supervised information in our method. Take the retrieval results on MIR Flickr in
Figure 8 as example. At the second line, querying with a building image, the top 10 ranked results are listed on the right, and the fifth “fireworks” and sixth “hdr 500” are not relevant. At the fourth line, querying with “portrait light baby woman pregnant zen pregnancy mom”, the top 10 results are about “women” whereas not related to “pregnant”. This may be an improved direction to deal with irrelevant semantics in relevant data. At the fifth and sixth lines, querying with the images of semantic “flower” and “two persons walking” respectively, the top 10 ranked images are all relevant but not all the same at appearances, which is also observed on NUS-WIDE and shows that our model could retrieve diversified images with relevant semantics.


