Article

Thermal Analysis of a Parallel-Configured Battery Pack (1S18P) Using 21700 Cells for a Battery-Powered Train

1
Department of Electrical Engineering, Chungnam National University, Daejeon 34134, Korea
2
Smart Electrical & Signaling Division, Korea Railroad Research Institute, Uiwang-si 16105, Korea
3
Department of Mechanical Engineering, Yeungnam University, Gyeongsan-si 38541, Korea
*
Authors to whom correspondence should be addressed.
Electronics 2020, 9(3), 447; https://doi.org/10.3390/electronics9030447
Submission received: 9 February 2020 / Revised: 3 March 2020 / Accepted: 4 March 2020 / Published: 6 March 2020
(This article belongs to the Special Issue Challenges of Battery Management System)

Abstract

:
In this study, the thermal behavior of a 1S18P battery pack is examined based on the power demand during train propulsion between two stations. The proposed thermal prediction model is classified into Joules heating with equivalent resistance, reversible heat, and heat dissipation. The equivalent resistances are determined by 5% of the state of charge intervals using the hybrid pulse power characterization test. The power demand profile during train propulsion between two stations is provided by the Korea Railroad Research Institute. An experiment is conducted to examine the 1S18P battery pack thermal behavior during the propulsion between two stations. A comparison of the simulation and experiment results validated the proposed thermal model.

1. Introduction

Recently, lithium-ion batteries have emerged as alternative power sources for commercial transportation applications, such as battery powered trains and electrical vehicles (EV), due to their power and energy densities. Conventional railways have also benefited from the improved performance of electrified trains. However, a conventional electrified train cannot be operated prior to the train cable installation. Furthermore, diesel traction has remained common on rural areas. A battery-powered train can lead to savings with respect to train cable installation.
For transportation applications, such as EV and battery-powered trains, lithium-ion batteries are formed into battery packs to satisfy the required power and energy density. To satisfy the application requirements, batteries are densely packed due to the limited space available for mounting batteries. Closely compacted batteries have suffered problems from the important characteristics of a battery, such as voltages, capacity, and lifetime, which are easily affected by temperature. Furthermore, improper thermal management causes thermal problems, such as overheating and thermal runaway [1,2,3]. Therefore, thermal analysis of battery packs has attracted increasing attention.
Currently, diverse thermal analyses have been developed for single lithium-ion cell and battery pack [4,5,6,7,8]. The heat generation equation was examined based on the general energy balance equation [9]. Batteries correspond to containers of electrochemical reactions which generate heat during charge and discharge due to electrochemical polarization, resistive heating, and enthalpy changes [10]. There are studies regarding the electrochemical thermal model of lithium-ion batteries [11,12,13]. However, electrochemical thermal model require chemical parameters which are hard to examine. Therefore, a simplified electro-thermal model was introduced and classified the heat generation term into reversible heat and Joule heat. An electrochemical reaction (including polarization and entropy change) generates reversible heat. Joule heating occurs due to the resistance during the transfer of ions and electrons. A simplified thermal model of a lithium-ion battery was examined by Onda et al. [9]. Equivalent resistances are obtained by state of charge (SOC) intervals and employed for Joule heating. Additionally, entropy change is measured at different SOCs and applied to reversible heat [14]. Table 1 and Table 2 are definitions and descriptions of abbreviation and symbols used in this paper.
In addition to the Joule heat generation and reversible heat generation, heat dissipation is an important factor for the thermal analysis of lithium-ion batteries. Heat dissipation is a heat transfer mechanism due to ambient conditions. Heat dissipation of batteries can be distinguished by natural convection and forced convection. Most battery thermal management systems use a cooling system with forced convection to maintain an optimal temperature operation range for the batteries [15]. Only a few studies have employed a cooling system involving natural convection [16].
Studies on the thermal analysis of lithium-ion batteries for a single cell and battery pack have concentrated on the constant discharge and charge current. However, the load current in most applications varies with respect to time. In this study, a standard load profile of a battery powered train is introduced, and thermal prediction of a 1S18P lithium ion battery pack is examined under the power demand profile during the train propulsion between two stations. The proposed battery pack thermal model under varying loads is validated via comparing simulations and experimental results.

2. Electro-Thermal Model of a Lithium-Ion Battery and Battery Pack

2.1. Lithium-Ion Battery Heat Generation

There are two heat source terms during the charge/discharge of a lithium-ion battery. Equation (1) shows Qcell, which is the total amount of generated heat from charging/discharging and corresponds to the summation of the Joule heat generation and reversible heat generation. As shown in Equation (2) Q j o u l e denotes the Joules heating, which is also termed as resistive heating. Specifically, i denotes the charge or discharge current and Req denotes the equivalent resistance of a lithium-ion battery. Another heat source corresponds to reversible heat (Qrev). Specifically, reversible heat denotes the result of exothermic and endothermic reactions during the charge and discharge. An exothermic reaction occurs during the discharging condition while endothermic reaction occurs during the charging condition [17]. Equation (3) corresponds to a reversible heat equation, Tcell denotes the temperature of the cell, ΔS denotes the entropy change, n denotes the number of electrons during the charge and discharge intercalation process inside the cell, and F denotes the Faraday constant (96485.3329 C/mol). The direct measurement of the chemical parameters, such as entropy change, number of electrons, and Faraday constant, is difficult and time-consuming work. However, numerous studies have identified the combined value of ΔS, n, and F by intervals of SOC [17,18,19,20].
Qcell = Qjoule + Qrev
Q J o u l e s = i 2 · R e q
Q r e v = i · T c e l l · Δ S / ( n · F )
Q d i s s = A · h ( T c e l l T a m b )
Q t o t a l = Q c e l l + Q d i s s

2.2. Heat Dissipation

2.2.1. Forced Convection on Cylinder in Cross Flow

Heat measured by the thermocouple ( Q t o t a l ) during the battery discharge/charge corresponds to the summation of generated heat from the cell (Qcell) and heat dissipation ( Q d i s s ) by the environment condition. Equation (4) shows the heat dissipated by the ambient temperature ( T a m b ) and experiment environment condition from Qcell. Where, A denotes the heat transfer area and heat transfer coefficient ( h ) corresponds to a variable that changes based on the ambient condition. Equation (4) corresponds to the heat transfer version of Newton’s law and implies that the heat loss of the body is commensurate with the temperature difference between the body and surrounding environment [20,21,22].
In this study, we conducted an experiment in a convective climate chamber. The calculation of h under the forced convection condition is suitable. With respect to a 21700 lithium-ion battery, cylinder forced heat convection calculation was employed. Equations (6a) to (6d) show the calculation of the heat transfer coefficient of a cylindrical lithium-ion battery. In Equation (6a), D denotes the diameter of the cylinder. The Nusselt number ( N u ) for the heat transfer coefficient calculation can be determined using the Prandtl number (Pr) and Reynolds number (Re). In Equation (6b), C and r denote the unit less correlation variables that change with the value of the Re, which are listed in Table 3. The parameters for the Pr and Re calculation are listed in Table 4 [23]. The thermal properties of the air and the battery are also listed in Table 4 [24,25,26,27].
h = N u · k / D
N u = C · R e r · P r 0.33
P r = v / a
R e = U d · D / v

2.2.2. Forced Convection on Flat Plate, Averaged Transfer

Generated heat in lithium-ion batteries dissipates through the surface in contact with the air around the batteries. Air flows inside of the chamber to maintain temperature. With respect to the 21700 lithium-ion battery pack, flat plate forced heat convection calculation was employed for the battery pack boundary condition. Forced convection on the sides of the battery pack is shown in Equation (7a) to (7d). In this study, Re is calculated to be < 500,000, indicating laminar flow patterns resulting from forced convection. In Equation (7a), L denotes length of the side plate [23,24].
h = N u · k / L
N u = 0.664 · R e 0.5 · P r 0.33
P r = v / a
R e = U d · L / v

3. Experiment Setup

In this section, the test equipment used in this paper is listed. Having an error in the experimental results is general due to the multiplicity of testing equipment types, varying ranges of measurement. Uncertainties of experiment measurements are affected by the test conditions [28]. In this paper, however, only uncertainty of the experiment devices is considered, and other errors are ignored.

3.1. Cell Level Experiment Setup

The cell level experiment setup is shown in Figure 1. To obtain the electrical characteristics, such as capacity and equivalent resistance, of a 30T 21700 cell (NMC), MACCOR 4300K/8ch battery testing equipment (MACCOR, Oklahoma city, USA) was employed. A 30T single cell experiment was conducted in the LCH-11 convective climate chamber (JEIO TECH, Daejeon, Korea) and the temperature was maintained at 25 °C. Before the electrical characterization test, the cell was soaked at 25 °C for 3 h. The battery tester was controlled by the computer and data was logged at a sampling time of 0.1 s to the computer.

3.2. Pack Level Experiment Setup

The experiment of 1S18P battery pack requires a high current output range. Figure 2 shows experiment setup of pack level experiment. A IGBT700-15V200A battery test system (Neware, Shenzhen, China) was used to cycle the conducted battery pack. The battery pack experiment was conducted in the TH-G convective climate chamber (JEIO TECH, Daejeon, Korea) and the temperature was maintained at 45 °C. The fluctuation and variation at 45 °C was ±0.3–1 °C. Before the power demand profile test, the cell was soaked at 45 °C for 3 h. The temperature response during the test was logged to LR8400 (HIOKI, Nagano, Japan) in 0.1 s of data sampling time.

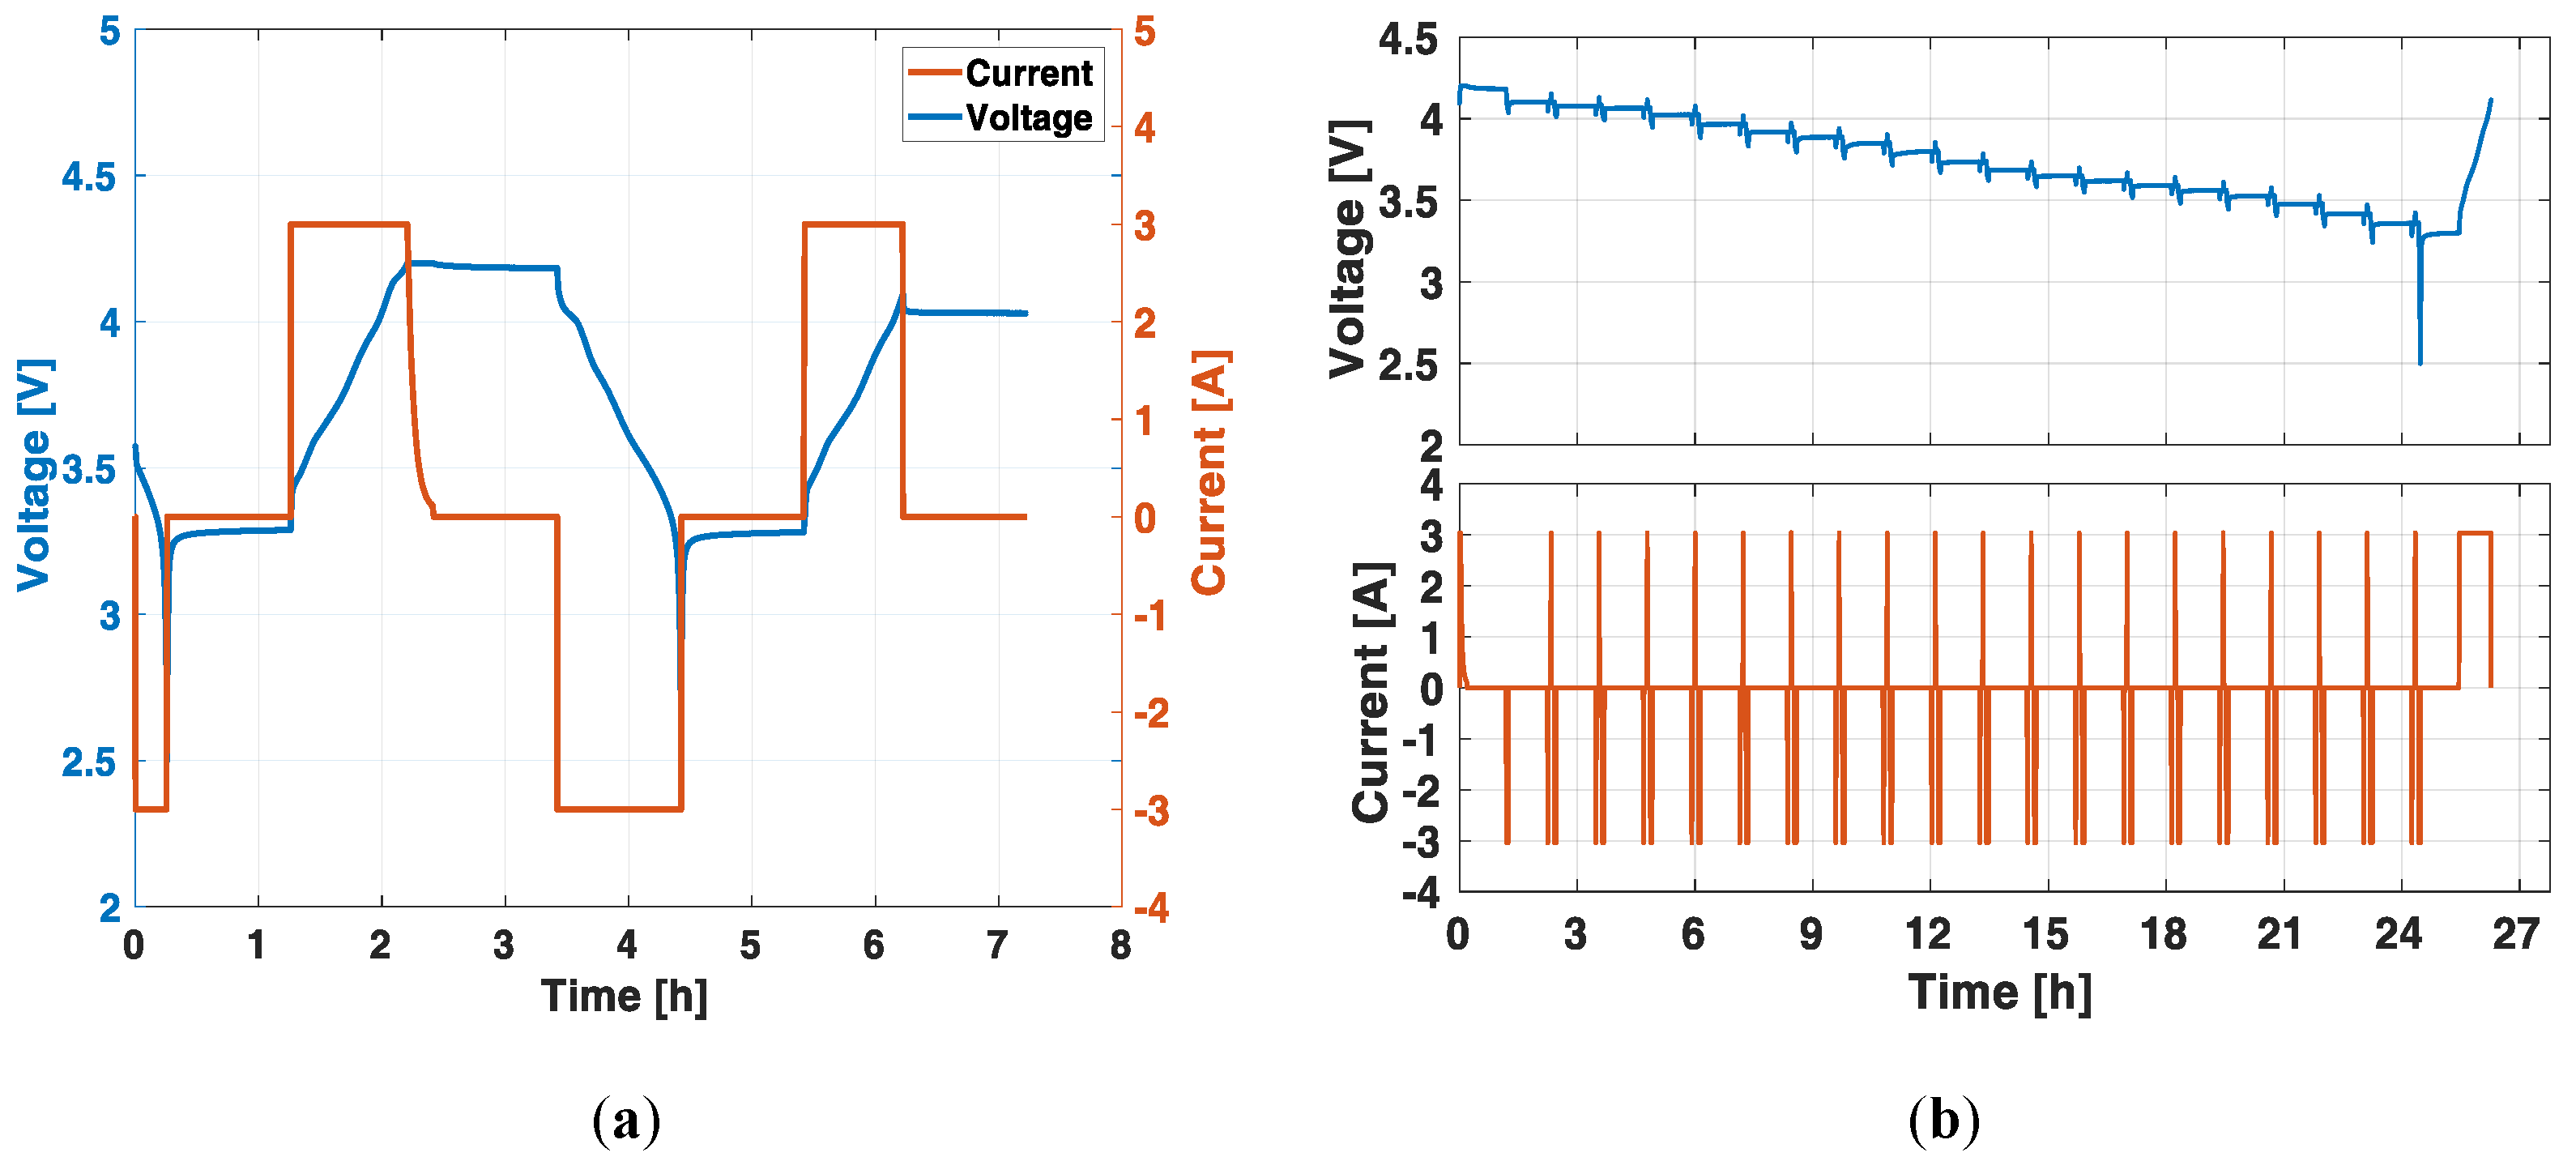
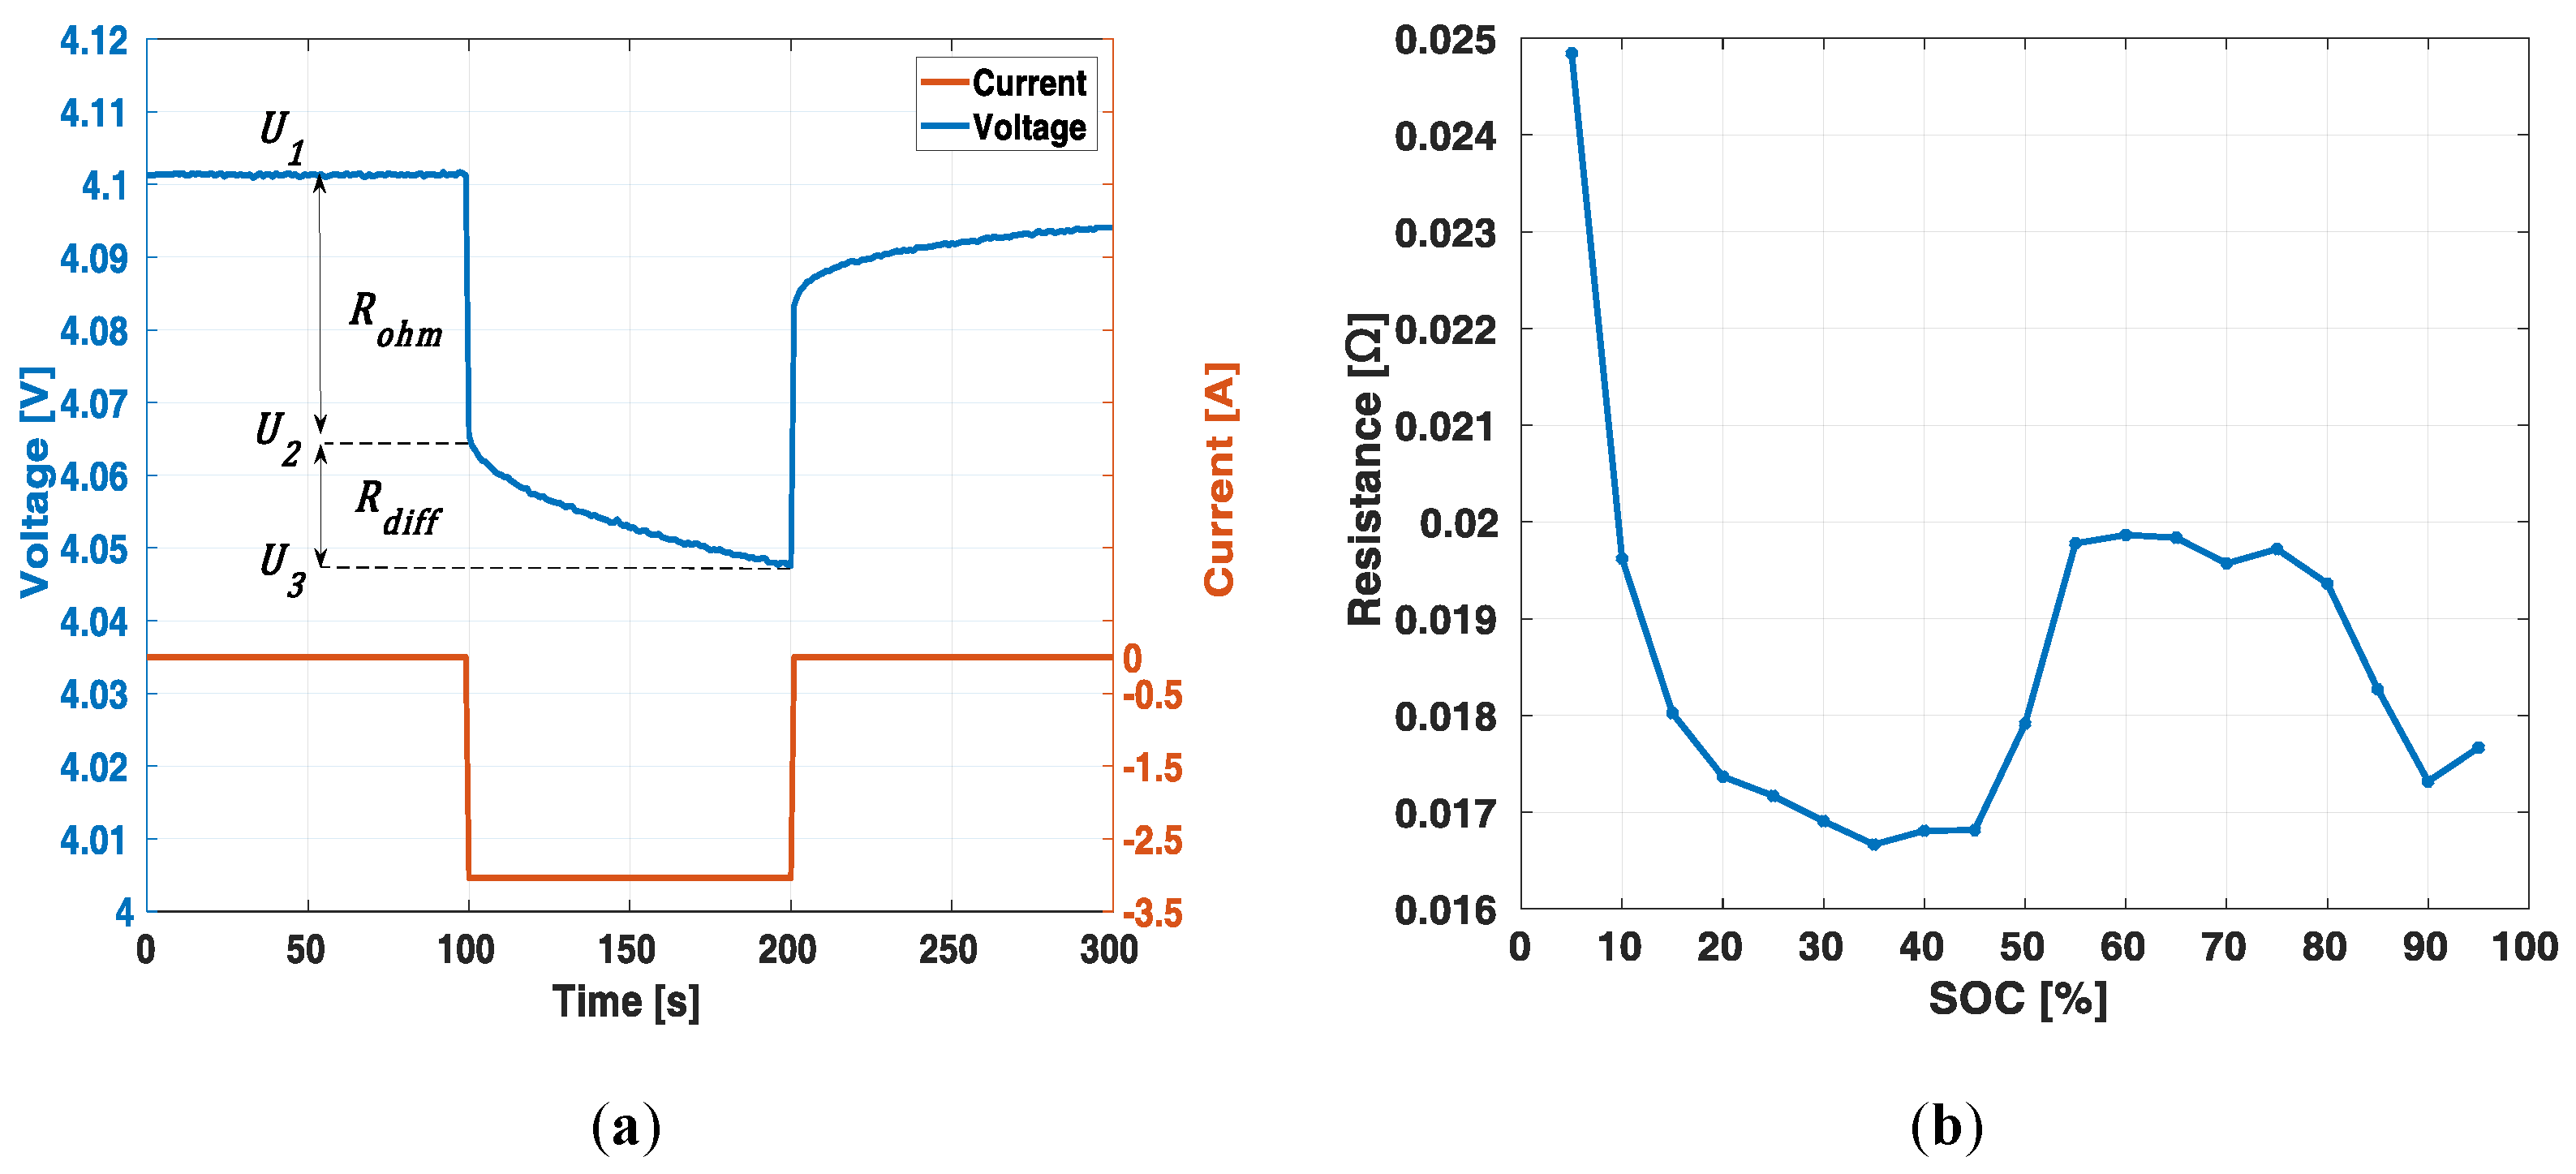
4. Electrical Characteristic Test

The electrical characteristic tests of the target cell should be performed in advance to employ the proper parameters for Joule heat generation. The equivalent resistance, R e q , can be obtained from the battery electrical characteristic experiment. In this study, the electrical characteristic experiments of a cell were performed in a chamber maintained at constant temperature of 25 °C to terminate the instability of the ambient temperature. Two electrical characteristic experiments, namely the capacity test and the hybrid pulse power characterization (HPPC) test, were performed. Based on 30T 21700 battery specification, in [29], the battery exhibited a charge cut-off voltage of 4.2 V and discharge cut-off voltage of 2.5 V. As shown in Figure 3a, the cell was fully discharged with 1 C-rate (3 A) until it reached 2.5 V. After the voltage reached 2.5 V, the cell rested for 1 h, and then was charged to 4.2 V via a constant current-constant voltage (CC-CV; CC: charge to 4.2 V with a constant current; CV: reduced applied down to 100 mA while maintaining 4.2 V). From the fully charged state, the cell was discharged to 2.5 V with 1 C-rate, and this was followed by 1 h of rest prior to charging to SOC 80%. The capacity test result indicated that the 21700 30T exhibits 3.03568 Ah of discharge capacity. The discharge capacity calculation is given in Equation (8). As follows:
D i s c h a r g e   C a p a c i t y = i d t .
After the capacity test, the actual 1C-rate can be defined. In this case, 3.03568 A corresponded to 1C-rate for the HPPC test. The C-rate is the rate of the battery being discharged. It is defined as the discharge or charge current divided by nominal rated capacity in one hour. The HPPC test can determine the internal resistance of a lithium-ion battery by intervals of SOC. In this study, the HPPC test was performed to identify R e q , which corresponds to the parameter of Joule heat generation. The HPPC profile is shown in Figure 3b. Following CC-CV charging to 4.2 V, a 5% decrease in SOC was achieved, and this was followed by a rest period of 1 h before 10 s of charge and discharge pulse. Furthermore, 5 min of rest time was set between the two pulses. The entire HPPC test followed SOC 5% discharge, rest (1 h), HPPC (discharge pulse), rest (5 min), HPPC (charge pulse), rest (5 min), and the procedure was repeated until 2.5 V was reached at the SOC 5% discharge step.
Figure 4a,b show the resistance computational method from the HPPC discharge pulse and its result. The specific computational methods of Req are mentioned in Equations (9a)–(9c). The Req of a lithium-ion battery can be classified as the ohmic resistance ( R o h m ) and diffusion resistance ( R d i f f ). The Req corresponds to the summation of R o h m and R d i f f . The obtained equivalent resistance contains resistance terms, including the charge transfer resistance and polarization resistance of the chemical reaction inside a lithium-ion battery [30]. Additionally, Req is verified as a proper parameter for Joule heat generation [31]. The open circuit voltage before the HPPC discharge pulse corresponds to U 1 , and U 2 denotes the dropped voltage at the moment of the discharge. After 10 s of discharge pulse, U3 is obtained. Figure 4b shows the V/I - Req, as derived by Equations (9a)–(9c).
R o h m = U 1 U 2 i
R d i f f = U 2 U 3 i
R e q = R o h m + R d i f f

5. Battery Pack Train Propulsion Load Profile Experiment

In this study, an 1S18P battery pack comprised of 18 Li-ion 21700 cylindrical cells was examined for thermal prediction under a propulsion profile. The fabricated battery pack is shown in Figure 5a, and the temperature was measured on the left side of the battery pack cells which comprised the side of the battery pack. Figure 5b shows the temperature measurement points and the direction that the wind was blowing. Specifically, the 1S18P train propulsion experiment was conducted in a chamber maintained at temperature of 45 °C. Based on the international battery standards for transportation, the minimum temperature condition for lithium-ion batteries was set to over 40 °C [32]. The general standards on lithium-ion battery tests are well briefed and organized in [33,34]. Numerous standards of EV load profiles, such as dynamic stress test (DTS) [35], urban dynamometer driving schedule (UDDS) [36], and new European driving cycle (NEDC) [37,38] were introduced. However, there is a paucity of standard propulsion load profiles in the case of battery-powered trains.
Figure 6a is the power demand profile for the train to operate between two stations provided by the Korea Railroad Research Institute. The power demand profile is a profile that is adapted to a 1S18P battery pack capacity. At the start-up acceleration phase in the power demand profile, the batteries are discharging, and the train repeats the acceleration and coasting process during the journey to the next station. In the coasting phase, the batteries are set to the charge mode. Prior to when the train arrives at station 2, regenerative power can be obtained on the de-acceleration phase. After the train arrives at station 2, additional charge is conducted to compensate power.
The voltage, current, and temperature of the 1S18P battery pack under the power demand profile are shown in Figure 6b–d. As shown in Figure 6d, the measured temperatures at location #8 and #9 are 1 °C lower on average. The wind blowing direction can be assumed to be blown from the front side of the battery pack. Also, the temperature at location #1 is measured lower than the measured temperatures at #2 to #5 but higher than the temperatures at #6 to #9. We assumed that weak wind is also blown from the back side of the battery pack. In the simulation study, measured temperatures at 0 s are employed as the initial temperature conditions of the batteries and the air surrounding the batteries.

6. Mesh Generation

In this paper, commercial simulation software COMSOL was used. Figure 7 shows a constructed mesh using tetrahedral elements. The mesh was built in sequence of physics-controlled mesh by the software. We built 581,679 elements in 0.05587 of the minimum element quality (maximum element size: 0.00378 m; minimum element size: 0.00113 m; maximum element growth rate: 1.15; curvature factor: 0.6; resolution of narrow regions: 0.7). The constructed mesh quality does not significantly affect the simulation result.

7. Simulation Results and Validation

In this study, thermal behavior of a lithium-ion battery pack is examined under the condition of the train propulsion load profile between two stations. The temperature of the lithium-ion battery was predicted via the proposed model mentioned in the previous section. The heat source term of a lithium-ion battery was classified into Joule heat and reversible heat. The Joule heat was calculated based on R e q obtained from the HPPC test, and the reversible heat was calculated via simplified parameters from previous studies [16,18,19]. The experiment was conducted in a forced convection chamber and the temperature was maintained at 45 °C. Commercial finite element modeling software COMSOL was used to validate the proposed model. In the simulation, the 44.73 °C air was assumed to be blown from the front and back side of the battery pack and set to 5 m/s and 1 m/s. Figure 8a,b illustrate the temperature distribution results at 120 s of the battery pack simulation. Figure 8b shows the cross-section of z-axis on the half of the battery height.
The temperature distribution shows an increase in the temperature along the y-axis except for the rear part of the battery pack. The simulation result indicates that the front and rear part of the battery pack were more affected by the heat dissipation than the side parts of the battery pack. The experiment and simulation results at the temperature measuring points were compared. The applied current at the battery pack (shown in Figure 6c) reached over 150 A at the peak. However, because the battery pack consisted of 18 parallel batteries, the current applied to the single cells can be simplified by dividing the current applied to the battery pack by 18.
Figure 9 shows the temperature comparison between the simulation and experiment. As shown in Figure 9 the total heat generated during the first 100 s exceeded that in the last 100 s. The first phase of the propulsion profile corresponds to the start-up acceleration, which demands power. Thus, the batteries were discharged at the first phase. Therefore, the temperature raise for the first 100 s is larger than the last 100 s because the reversible heat corresponds to the exothermal process during the discharge while the reversible heat corresponds to the endothermic process. The simulation result shown in Figure 8b indicates that temperature reached the highest value at the second and third row from the back side of the battery pack. A strong wind from the front side of the battery mainly dissipated the generated heat from the front part of the battery pack. A weak wind, blown from the back side direction of the battery pack, mainly dissipated the generated heat of the last row of the battery pack.
The proposed thermal prediction model was valid under the varying current conditions and different initial temperatures between the batteries. The results from the simulation exhibited a temperature distribution similar to the experiment. Increases in the total generated heat were observed during the discharge process due to the exothermic process in reversible heat generation. Finally, the proposed thermal model indicated that the temperature prediction was in a reasonable error range. A comparison between the experiment and simulation results showed the validity of the proposed simulation model.

8. Conclusions

In this study, a train propulsion profile was introduced, and the heat generation of the 1S18P battery pack was examined under the propulsion profile. The proposed heat generation model was classified into Joule heat and reversible heat. The equivalent resistance as a function of SOC was applied to the Joule heating parameter. In the study, the HPPC test was conducted to obtain the equivalent resistance. The reversible heat was calculated with the parameters from the conventional studies. Thus, standard train propulsion power demand profile was introduced. Conventional studies have concentrated on thermal analysis under a constant load current profile. In this paper, the introduced thermal model indicated the feasibility of thermal prediction under the power demand profile during train propulsion between two stations. The temperatures of cells which comprised the battery pack were predicted under less than a 0.5 °C error.

Author Contributions

T.K. contributed to the main idea of this article and wrote the paper. S.P., P.-Y.L. and I.-H.C. provided the experiment data. J.K. and K.Y. revised the paper. All authors have read and agreed to the published version of the manuscript.

Funding

This work is supported by the Korea Electric Power Corporation: R19XO01-45, and National Research Foundation of Korea: NRF-2018R1C1B6004482.

Acknowledgments

This work was supported by the projects of the Korea Electric Power Corporation (R19XO01-45) and was supported by the National Research Foundation of Korea (NRF) grant funded by the Korea government (MSIT) (No. NRF-2018R1C1B6004482).

Conflicts of Interest

The authors declare no conflict of interest.

References

  1. Sato, N. Thermal behavior analysis of lithium-ion batteries for electric and hybrid vehicles. J. Power Sources 2001, 99, 70–77. [Google Scholar] [CrossRef]
  2. Bandhauer, T.M.; Garimella, S.; Fuller, T.F. A critical review of thermal issues in lithium-ion batteries. J. Electrochem. Soc. 2011, 3, R1–R25. [Google Scholar] [CrossRef]
  3. Lisbono, D.; Snee, T. A review of hazards associated with primary lithium and lithium-ion batteries. Process Saf. Environ. Prot. 2011, 89, 434–442. [Google Scholar] [CrossRef]
  4. Pals, C.R.; Newman, J. Thermal Modeling of the Lithium/Polymer Battery: I. Discharge Behavior of a Single Cell. J. Electrochem. Soc. 1995, 142, 3274. [Google Scholar] [CrossRef]
  5. Pals, C.R.; Newman, J. Thermal Modeling of the Lithium/Polymer Battery: II. Temperature Profiles in a Cell Stack. J. Electrochem. Soc. 1995, 142, 3282. [Google Scholar] [CrossRef]
  6. Santhanagopalan, S.; Guo, Q.; Ramadass, P.; White, R.E. Review of models for predicting the cycling performance of lithium ion batteries. J. Power Sources 2006, 152, 620–628. [Google Scholar] [CrossRef]
  7. Smith, K.; Wang, C.Y. Power and thermal characterization of a lithium-ion battery pack for hybrid-electric vehicles. J. Power Sources 2006, 160, 662–673. [Google Scholar] [CrossRef]
  8. Onda, K.; Ohshima, T.; Nakayama, M.; Fukuda, K.; Araki, T. Thermal behavior of small lithium-ion battery during rapid charge and discharge cycles. J. Power Sources 2006, 158, 535–542. [Google Scholar] [CrossRef]
  9. Rao, L.; Newman, J. Heat-generation rate and general energy balance for insertion battery system. J. Electrochem. Soc. 1997, 144, 2697–2704. [Google Scholar] [CrossRef]
  10. Lin, X.; Stefanopoulou, A.G.; Perez, H.E.; Siegel, J.B.; Li, Y.H.; Anderson, R.D. Quadruple adaptive observer of the core temperature in cylindrical Li-ion batteries and their health monitoring. In Proceedings of the 2012 American Control Conference, Montréal, QC, Canada, 27–29 June 2012; pp. 578–583. [Google Scholar]
  11. Akhoundzadeh, M.H.; Raahemifar, K.; Panchal, S.; Samadani, E.; Haghi, E.; Fraser, R.; Fowler, M. A conceptualized hydrail powertrain: A case study of the Union Pearson Express route. World Electr. Veh. J. 2019, 10, 32. [Google Scholar] [CrossRef] [Green Version]
  12. Panchal, S.; Dincer, I.; Agelin-Chaab, M.; Fraser, R.; Fowler, M. Design and simulation of a lithium-ion battery at large C-rate and varying boundary conditions through heat flux distributions. Measurement 2018, 116, 382–390. [Google Scholar] [CrossRef] [Green Version]
  13. Panchal, S.; Rashid, M.; Long, F.; Mathew, M.; Fraser, R.; Fowler, M. Degradation testing and modeling of 200 Ah LiFePO4 battery. SAE Techn. Pap. 2018. [Google Scholar] [CrossRef]
  14. Viswanathan, V.V.; Choi, D.; Wang, D.; Xu, W.; Towne, S.; Williford, R.E.; Zhang, J.G.; Liu, J.; Yang, Z. Effect of entropy change of lithium intercalation in cathodes and anodes on Li-ion battery thermal management. J. Power Sources 2010, 195, 3720–3729. [Google Scholar] [CrossRef]
  15. Lyu, Y.; Siddique, A.R.M.; Majid, S.H.; Biglarbegian, M.; Gadsden, S.A.; Mahmud, S. Electrical vehicle battery thermal management system with thermoelectric cooling. J. Energy Rep. 2019, 5, 822–827. [Google Scholar] [CrossRef]
  16. Huang, H.H.; Chen, H.Y.; Liao, K.C.; Young, H.T.; Lee, C.F.; Tien, J.Y. Thermal-electrochemical coupled simulations for cell-to-cell imbalances in lithium-iron-phosphate based battery packs. Appl. Therm. Eng. 2017, 123, 584–591. [Google Scholar] [CrossRef]
  17. Saito, Y.; Kanari, K.; Takano, K. Thermal studies of a lithium-ion battery. J. Power Sources 1997, 68, 451–454. [Google Scholar] [CrossRef]
  18. Zhao, R.; Gu, J.; Liu, J. An investigation on the significance of reversible heat to the thermal behavior of lithium ion battery through simulations. J. Power Sources 2014, 266, 422–432. [Google Scholar] [CrossRef]
  19. Lai, Y.; Du, L.; Ai, L.; Cheng, Y.; Tang, T.; Jia, M. Insight into heat generation of lithium ion batteries based on the electrochemical-thermal model at high discharge rates. Int. J. Hydrog. Energy 2015, 40, 13039–13049. [Google Scholar] [CrossRef]
  20. Davidzon, M.I. Newton’s law of cooling and its interpretation. Int. J. Heat Mass Transf. 2012, 55, 5397–5402. [Google Scholar] [CrossRef]
  21. Tong, W.; Somasundaram, K.; Bigersson, E.; Mujumdar, A.S.; Yap, C. Thermo-electrochemical model for forced convection air cooling of a lithium-ion battery module. Appl. Therm. Eng. 2016, 99, 672–682. [Google Scholar] [CrossRef]
  22. Yoo, K.; Kim, J. Thermal behavior of full-scale battery pack based on comprehensive heat-generation model. J. Power Sources 2019, 433, 226715. [Google Scholar] [CrossRef]
  23. Homan, J.P. Heat Transfer, 7th ed.; McGraw Hill Book Company: New York, NY, USA, 1990; pp. 281–303. [Google Scholar]
  24. Schlichting, H.; Gersten, K. Boundary Layer Theory, 8th ed.; Springer: Berlin, Germany, 2000; pp. 3–33. [Google Scholar]
  25. Werner, D.; Loges, A.; Becker, D.J.; Wetzel, T. Thermal conductivity of Li-ion batteries and their electrode configurations—A novel combination modelling and experimental approach. J. Power Sources 2017, 364, 72–83. [Google Scholar] [CrossRef]
  26. Pennstate College of Engineering. Available online: https://www.me.psu.edu/cimbala/me433/Links/Table_A_9_CC_Properties_of_Air.pdf (accessed on 25 February 2020).
  27. Drake, S.J. Thermal Conduction and Heat Generation Phenomena in Li-Ion Cells. Ph. D. Thesis, The University of Texas at Arlington, Arlington, TX, USA, December 2014. [Google Scholar]
  28. Idaho National Laboratory. Available online: https://avt.inl.gov/sites/default/files/pdf/battery/uncertainty_report_vol2_03_03.pdf (accessed on 3 March 2020).
  29. Imrbatteries. Available online: https://www.imrbatteries.com/content/samsung_30T.pdf (accessed on 26 February 2020).
  30. Barai, A.; Uddin, K.; Widanage, W.D.; Mcgordon, A.; Jennings, P. A study of the influence of measurement timescale on internal resistance characterization methodologies for lithium-ion cells. Nat. Sci. Rep. 2018, 8, 21. [Google Scholar] [CrossRef] [PubMed]
  31. Kang, T.; Yoo, K.; Kim, J. Irreversible heat generation based electro-thermal modeling and its experiment validation of the 18,650 cylindrical cells. In Proceedings of the 10th International Conference on Power Electronics-ECCE Asia, BEXCO, Busan, Korea, 27–30 May 2019. [Google Scholar]
  32. Ruiz, V.; Pfrang, A.; Kriston, A.; Omar, A.; Van den Bossche, P.; Boon-Brett, L. A review of international abuse testing standards and regulations for lithium ion batteries in electric and hybrid electric vehicles. Renew. Sustain. Energy Rev. 2018, 81, 142–145. [Google Scholar] [CrossRef]
  33. Batterystandards.info. Available online: https://www.batterystandards.info/sites/batterystandards.info/files/general_overview_part1.pdf (accessed on 23 January 2020).
  34. Batterystandards.info. Available online: https://www.batterystandards.info/sites/batterystandards.info/files/general_overview_part2.pdf (accessed on 23 January 2020).
  35. Idaho National Laboratory. Available online: https://avt.inl.gov/sites/default/files/pdf/battery/usabc_manual_rev2.pdf (accessed on 23 January 2020).
  36. United States Environment Protection Agency. Available online: https://www.epa.gov/vehicle-and-fuel-emissions-testing/dynamometer-drive-schedules (accessed on 23 January 2020).
  37. The International Council on Clean Transportation. Available online: https://theicct.org/sites/default/files/publications/ICCT_EU_fuelconsumption2_workingpaper_2012.pdf (accessed on 23 January 2020).
  38. The International Council on Clean Transportation. Available online: https://theicct.org/sites/default/files/publications/ICCT_LaboratoryToRoad_2014_Report_English.pdf (accessed on 23 January 2020).
Figure 1. The 21700 30T cell level experiment setup.
Electronics 09 00447 g001
Figure 2. The 1S18P (21700 30T) battery pack level experiment setup.
Electronics 09 00447 g002
Figure 3. The electrical characteristic experiment: (a) 21700 30T single cell capacity test profile; (b) 21700 30T single cell HPPC test profile.
Electronics 09 00447 g003
Figure 4. Electrical equivalent resistance: (a) Electrical resistance computation from HPPC test’s discharge pulse; (b) SOC – V/I plot
Electronics 09 00447 g004
Figure 5. The 1S18P battery and temperature measurement points: (a) the experiment setup to measure temperature under the train power demand profile; (b) the locations of the thermocouples (red dots) attached to the battery pack for temperature measurements.
Electronics 09 00447 g005
Figure 6. The 1S18P battery pack test experiment results under the train propulsion profile: (a) the power demand profile during propulsion between two stations; (b) the voltage response of the 1S18P battery pack under the propulsion profile; (c) the current response of the 1S18P battery pack under the propulsion profile; (d) the temperature responses measured at locations #1–#9 of the 1S18P battery pack under the propulsion profile.
Electronics 09 00447 g006
Figure 7. Tetrahedral-element mesh for battery pack heat generation simulation.
Electronics 09 00447 g007
Figure 8. Simulation of the temperature distribution of the 1S18P battery pack: (a) the temperature distribution of the 1S18P battery pack under the train propulsion profile; (b) the temperature distribution of the cross-section of z-axis on the half of the battery height.
Electronics 09 00447 g008
Figure 9. A comparison of between the simulation and experimental results according to the measurement points.
Electronics 09 00447 g009
Table 1. List of abbreviations.
AbbreviationDefinition
EVElectric vehicle
SOCState of charge
NMCLiNiMnCoO2
HPPCHybrid pulse power characterization
CC-CVConstant current-constant voltage
DTSDynamic stress test
UDDSUrban dynamometer driving schedule
NEDCNew European driving cycle
21700Cylindrical lithium-ion battery dimension
Table 2. List of symbols.
SymbolDescription
Q t o t a l Heat measured by thermocouple
QcellTotal generated heat in a lithium ion-battery
Q j o u l e Joule heating
QrevReversible heating
Q d i s s Heat dissipation
iLoad current
ReqEquivalent resistance
R o h m Ohmic resistance
R d i f f Diffusion resistance
TcellBattery temperature
ΔSEntropy change
nNumber of electrons
FFaraday constant
hHeat transfer coefficient
AHeat transfer area
DDiameter of cylinder
LLength of plate
NuNusselt number
PrPrandtl number
ReReynolds number
C and rUnit less correlation variables for Re calculation
Table 3. Correlation between the Reynolds number and the correlation variables C and r.
ReCr
0.4–40.9890.330
4–400.9110.385
40–40000.6830.466
4000–40,0000.1930.618
40,000–40,00000.02660.805
Table 4. Thermal properties of battery and air for thermal analysis.
ParameterValueUnit
BatteryDensity2615.7kg/m3
Specific heat1605J/kg-K
Thermal conductivity3W/m-K
Air
(at 45 °C)
Kinematic viscosity, v19.3979 × 10−6m2/s
Thermal diffusivity, a24.165 × 10−6m2/s
Thermal conductivity, k27.44 × 10−3W/m-K
Velocity (strong wind), Ud5 (front), 1 (back)m/s

