Article

HIL-Assessed Fast and Accurate Single-Phase Power Calculation Algorithm for Voltage Source Inverters Supplying to High Total Demand Distortion Nonlinear Loads

1
Electric Engineering Department, Polytechnic University of Catalonia (EEBE-UPC), 08019 Barcelona, Spain
2
Energy Teknik Department, Aalborg University (ET-AAU), 9220 Aalborg, Denmark
*
Author to whom correspondence should be addressed.
Electronics 2020, 9(10), 1643; https://doi.org/10.3390/electronics9101643
Submission received: 4 September 2020 / Revised: 21 September 2020 / Accepted: 24 September 2020 / Published: 7 October 2020

Abstract

:
The dynamic performance of the local control of single-phase voltage source inverters (VSIs) can be degraded when supplying to nonlinear loads (NLLs) in microgrids. When this control is based on the droop principles, a proper calculation of the active and reactive averaged powers (P–Q) is essential for a proficient dynamic response against abrupt NLL changes. In this work, a VSI supplying to an NLL was studied, focusing the attention on the P–Q calculation stage. This stage first generated the direct and in-quadrature signals from the measured load current through a second-order generalized integrator (SOGI). Then, the instantaneous power quantities were obtained by multiplying each filtered current by the output voltage, and filtered later by utilizing a SOGI to acquire the averaged P–Q parameters. The proposed algorithm was compared with previous proposals, while keeping the active power steady-state ripple constant, which resulted in a faster calculation of the averaged active power. In this case, the steady-state averaged reactive power presented less ripple than the best proposal to which it was compared. When reducing the velocity of the proposed algorithm for the active power, it also showed a reduction in its steady-state ripple. Simulations, hardware-in-the-loop, and experimental tests were carried out to verify the effectiveness of the proposal.

1. Introduction

The Smart Grid, as a concept, can be defined in terms of its outcomes as an electrical system that operates in an efficient manner, that provides a reliable energy supply and a power quality for the needs of a digital economy, that demonstrates a resilient performance against uncertainties or grid faults, and that integrates a large variety of distributed energy resources (DERs) in the conventional electrical grid, especially renewable energy sources (RESs), according to the Department of Energy of the United States [1] and the European Commission [2]. In addition, following the United Nations Sustainable Development Goals [3], the energy supply must be affordable, reliable, sustainable, and accessible for all users, especially when involving DERs based on RESs, as can be seen in References [4,5]. These DERs can be composed of a mixture of energy production units, energy storage systems (ESSs), and loads that operate jointly in clusters that are connected or not to the main electrical grid infrastructure [6]. This set of interconnected distributed energy resources and loads operating as a single entity that is connected or not to the grid is known as a microgrid (MG), according to References [7,8]. Other similar definitions and analyses of MGs’ signal remarkable aspects, such as their electrical boundaries, the energy flow between DERs when sharing loads, and the islanded and grid-connected operation [9,10,11,12]. A specific type of MGs is the hybrid renewable MG (HRMG), which can be based on RESs and conventional generators to provide supply reliability against the intermittent nature of some RESs, such as photovoltaic, wind, and tidal energy, as seen in References [13,14,15,16]. These HRMGs also contribute to the desired resiliency of the grid in front of strong perturbations. The energy sources present in the MGs are usually interfaced with an AC bus through parallelized voltage source inverters (VSIs). When operating in islanded or connected mode, the MGs’ control is generally achieved through a hierarchical structure based on three levels of control [17,18,19]. At the tertiary level of control, the primary purpose is to manage the power injection to the grid according to economic and efficiency optimization parameters or the regulatory framework. The secondary level of control coordinates all the MG elements through the AC bus voltage amplitude and frequency. Finally, a primary level of control is achieved for the self-regulation of the VSI inside of an MG in islanded or grid-connected mode. The variables employed here for the regulation are the amplitude and frequency of the AC bus voltage and the phase-shift between this voltage and the injected current. This control is usually performed without intercommunication, and the time of response can reach the order of milliseconds. In contrast, the secondary and tertiary levels need a reliable intercommunication layer, and response times are substantially higher. In Reference [20], the impact of the lack of intercommunication between the distributed generators at all levels of control was analyzed by comparing diverse control methods, i.e., consensus-based, agent-based, decomposition-based, finite-time convergence control, aperiodic sampling, sliding mode control, and droop-based control. From these techniques, the droop-based methods presented some remarkable advantages: They do not require intercommunication, they offer a low cost of implementation, and they are suitable for grid-connected and islanded modes of operation [6,18,19,20]. These qualities facilitate the use of droop-based methods in the local control for both hierarchically and non-hierarchically controlled DC, three-phase MGs [17,18,21], or single-phase MGs [22,23,24]. The VSIs droop-operated contribute to the MG resilience, since they can be employed to stabilize the AC bus voltage and frequency with proper control. However, in the case of a VSI supplying to nonlinear loads in islanded mode, slow responses and degradation of power quality have been reported [20,25]. Therefore, the objective of this work was to contribute to the enhancement of the dynamic performance of droop-based single-phase VSI when supplying to nonlinear loads by doing the following:
  • Improving the velocity of the transient response of the averaged power calculation.
  • Improving the steady-state accuracy of the averaged power calculation.
This paper is organized as follows: In Section 2, the droop-based control techniques suitable for linear or nonlinear loads are described. Then, a single-phase VSI system supplying to a characterized nonlinear load (NLL) is presented in Section 3. Section 4 presents a set of averaged active and reactive power (P–Q) calculation algorithms, and Section 5 describes the novel proposed method. The results of Matlab/Simulink simulations are presented in Section 6, to compare the dynamic performances of the different calculation algorithms. Section 7 gives the results of hardware-in-loop (HIL) tests to assess the simulation results. The results of the experimental tests for the evaluation of the proposal are provided in Section 8.

2. Droop-Based Local Control Techniques against Nonlinear Loads

The droop-based local control VSIs, which are parallelized for sharing loads, need to calculate P–Q to generate the sinusoidal references to follow, as can be seen in References [17,26,27,28,29,30]. Moreover, considering a mainly inductive line transmission is desirable for the P–Q calculations and has yielded beneficial results in low-voltage systems [18,30,31,32,33].
The calculation of the P–Q parameters is fundamental for these droop-operated VSIs. When functioning in islanded mode, single-phase MGs are weaker in terms of stability, as compared with three-phase VSI-based systems, especially when sharing NLLs. In these conditions, accurate and fast calculations of P–Q become crucial [34,35]. Different solutions for the calculation of single-phase P–Q can be found in the literature. It is usual to see that, for the P–Q calculations, a voltage signal delayed 90° to the measured one in the point of common coupling (PCC) is employed. After that, the instantaneous active and reactive powers are calculated and later conditioned to obtain the P–Q parameters. For the in-quadrature voltage, one method consists of applying a transport delay by digital means without filtering the signal in magnitude [36,37]. Other approaches are based on the p-q theory, which implies a dq-Synchronous Reference Frame technique [38,39]. In this case, it is also acquired the in-quadrature signal of the PCC current. Moreover, second-order generalized integrators (SOGIs) were used thanks to their low-pass filter capability (SOGI-LPF), as in References [40,41]. Coming up next, the calculations of the instantaneous power quantities signals are conditioned for the extraction of the averaged active power (P), and the averaged reactive power (Q). One method consists of the application of SOGI-LPF [42]. Thus, a better strategy for improving the transient response against abrupt load changes is performed by adding a final stage for removing the double frequency power components, either with a final low-pass filter (LPF) stage in Reference [41] or without final LPF [35]. In the same conditions, in Reference [43] a different approach based on the discrete Fourier Transformation was utilized for directly obtaining P and Q. All of these strategies have in common that were only designed for droop-operated single-phase VSI sharing linear loads, introducing a significant delay that constraints the velocity of the response in front of abrupt load changes. The common goal of all those techniques is to obtain accurate and fast P–Q calculations to enhance the robustness of the parallelization of VSIs when sharing loads. Then, in Reference [35], it was proposed a method that introduced a pre-filtering of the measured current before the calculation of the instantaneous powers that resulted in being faster in front of NLL. This pre-filtering was achieved by the band-pass filter (BPF) capability of a double SOGI approach (DSOGI), followed by the remotion of the double frequency power components like Reference [34], but without the LPF final stage. The fastest solution from those benchmarked was [35], but at the cost of increased complexity in the calculation scheme and a worsening of the reactive averaged power calculation. The algorithm was designed based on the high distortion of the NLL, increasing the signal conditioning blocks with respect to previous proposals. Thus, the NLL was presented as a highly polluted in harmonics current, but was not quantitatively characterized.
The algorithm proposed in this work is designed by firstly characterizing the NLL accordingly to the well-known standard IEEE std 519-2014 [44]. Consequently, the topology of the calculation structure is modified, and the conditioning signal blocks are reduced with respect to Reference [35]. The objective is to obtain a faster and more accurate calculation of the P–Q parameters.

3. Description of the System under Test: VSI Supplying to a Nonlinear Load

Figure 1 represents a basic scheme of a single-phase MG topology containing two VSI sharing an NLL. The block “P–Q Power Calculation” is the research object of this paper. The voltage vo(t) and the current io(t) are measured at the PCC when the switches S0 and S1 are open. The averaged active and reactive power, P and Q, are respectively calculated in the “P–Q Power Calculation” block from these measurements. Then a voltage reference vref(t) is generated. Later, the inner control loops based on [45] employ this reference and finally generate a pulse-width modulation (PWM) for the switching of the H-Bridge.
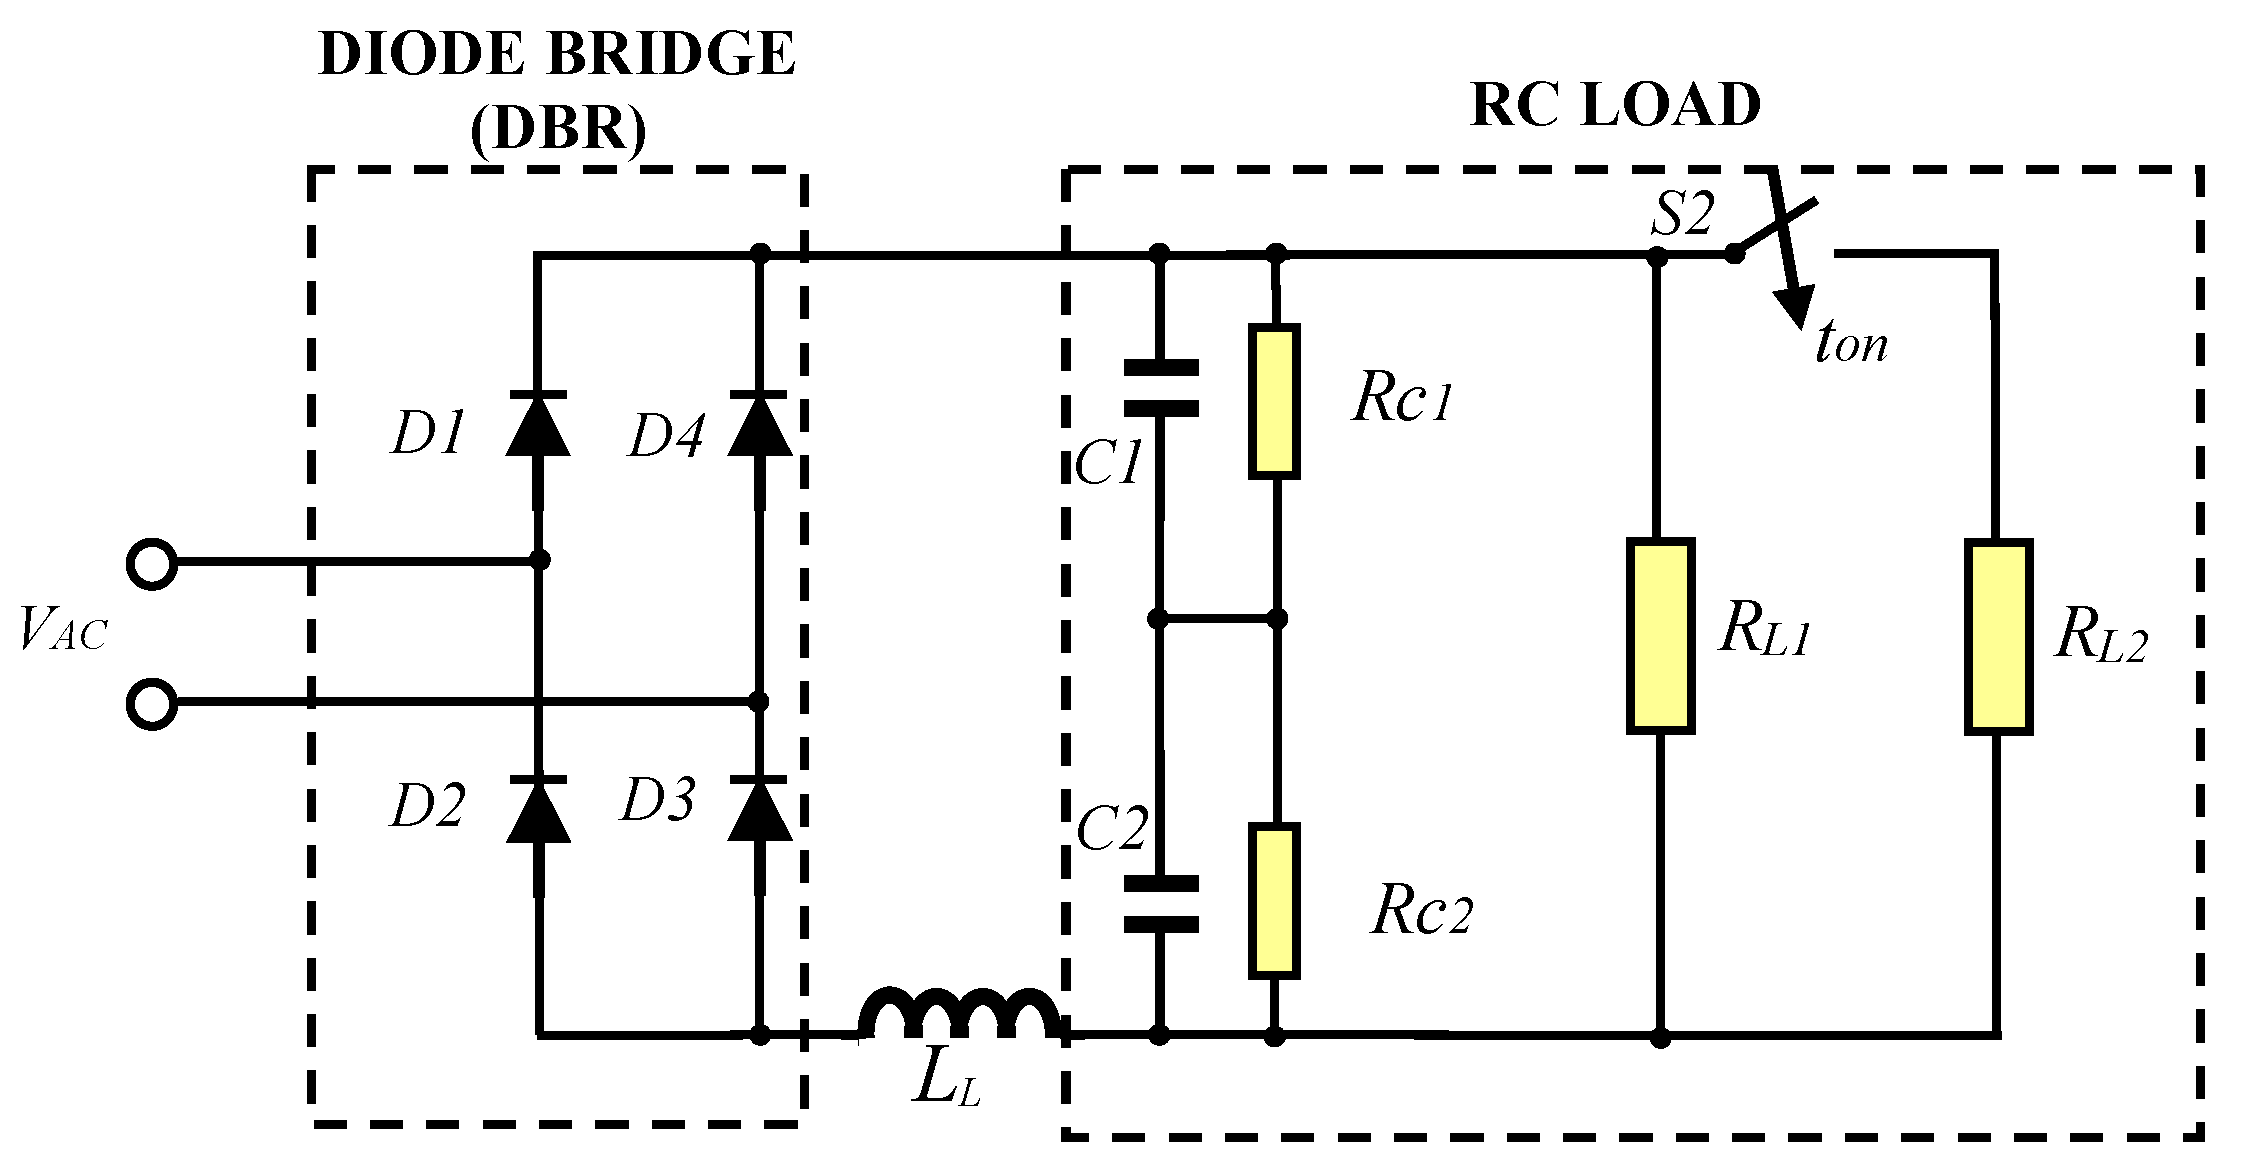
The NLL is a load which voltage–current characteristic is not linear. Different types of NLLs are found in the literature, which may be classified as attending different criteria. They are either characterized only considering the V–I characteristic [46], or based on power quality parameters associated with the active, reactive, and distorted power [47] or on the measured current [48]. In References [49,50], the classification is focused on the harmonic components only present in the current through the NLL. Similarly, Reference [51] studies an NLL accordingly to its current harmonic components and its total harmonic distortion in the current. The NLL study in Reference [52] is based on the frequency spectrum and the total harmonic distortion in voltage. The particular NLL load of this work (ZNL) consists of an unbalanced diode-bridge rectifier (DBR) that supplies power to a resistive–capacitive (R–C) load, shown in Figure 2. The R–C load parameters are listed in Table 1 and are characterized accordingly to power quality parameters listed in Table 2, based on IEEE std 519-2014 [44]:
After reaching a steady-state, the switch S2 closes at t = ton, triggering an abrupt change in the value of P and Q.
This load is the same as the one employed in Reference [35], and the voltage measured in the PCC follows Expression (1). The current in the PCC can be described by (2), and draws a highly distorted waveform:
v o ( t ) = V o · s i n ( w o · t )
i o ( t ) = I D C + I 0 · s i n ( ω o t φ o ) + h = 2 N I h · s i n ( h · ω o · t φ h )
where Vo and Io are the voltage and current amplitudes, respectively; ω o is the fundamental frequency of the system (100π rad/s); φ o is the phase-shift between the fundamental components of the voltage and the current; h is the harmonic index; Ih is the amplitude of the harmonic components of the intensity; and the phase-shift φ h corresponds to each current harmonic component. The term I D C corresponds to a DC offset present in the load current.
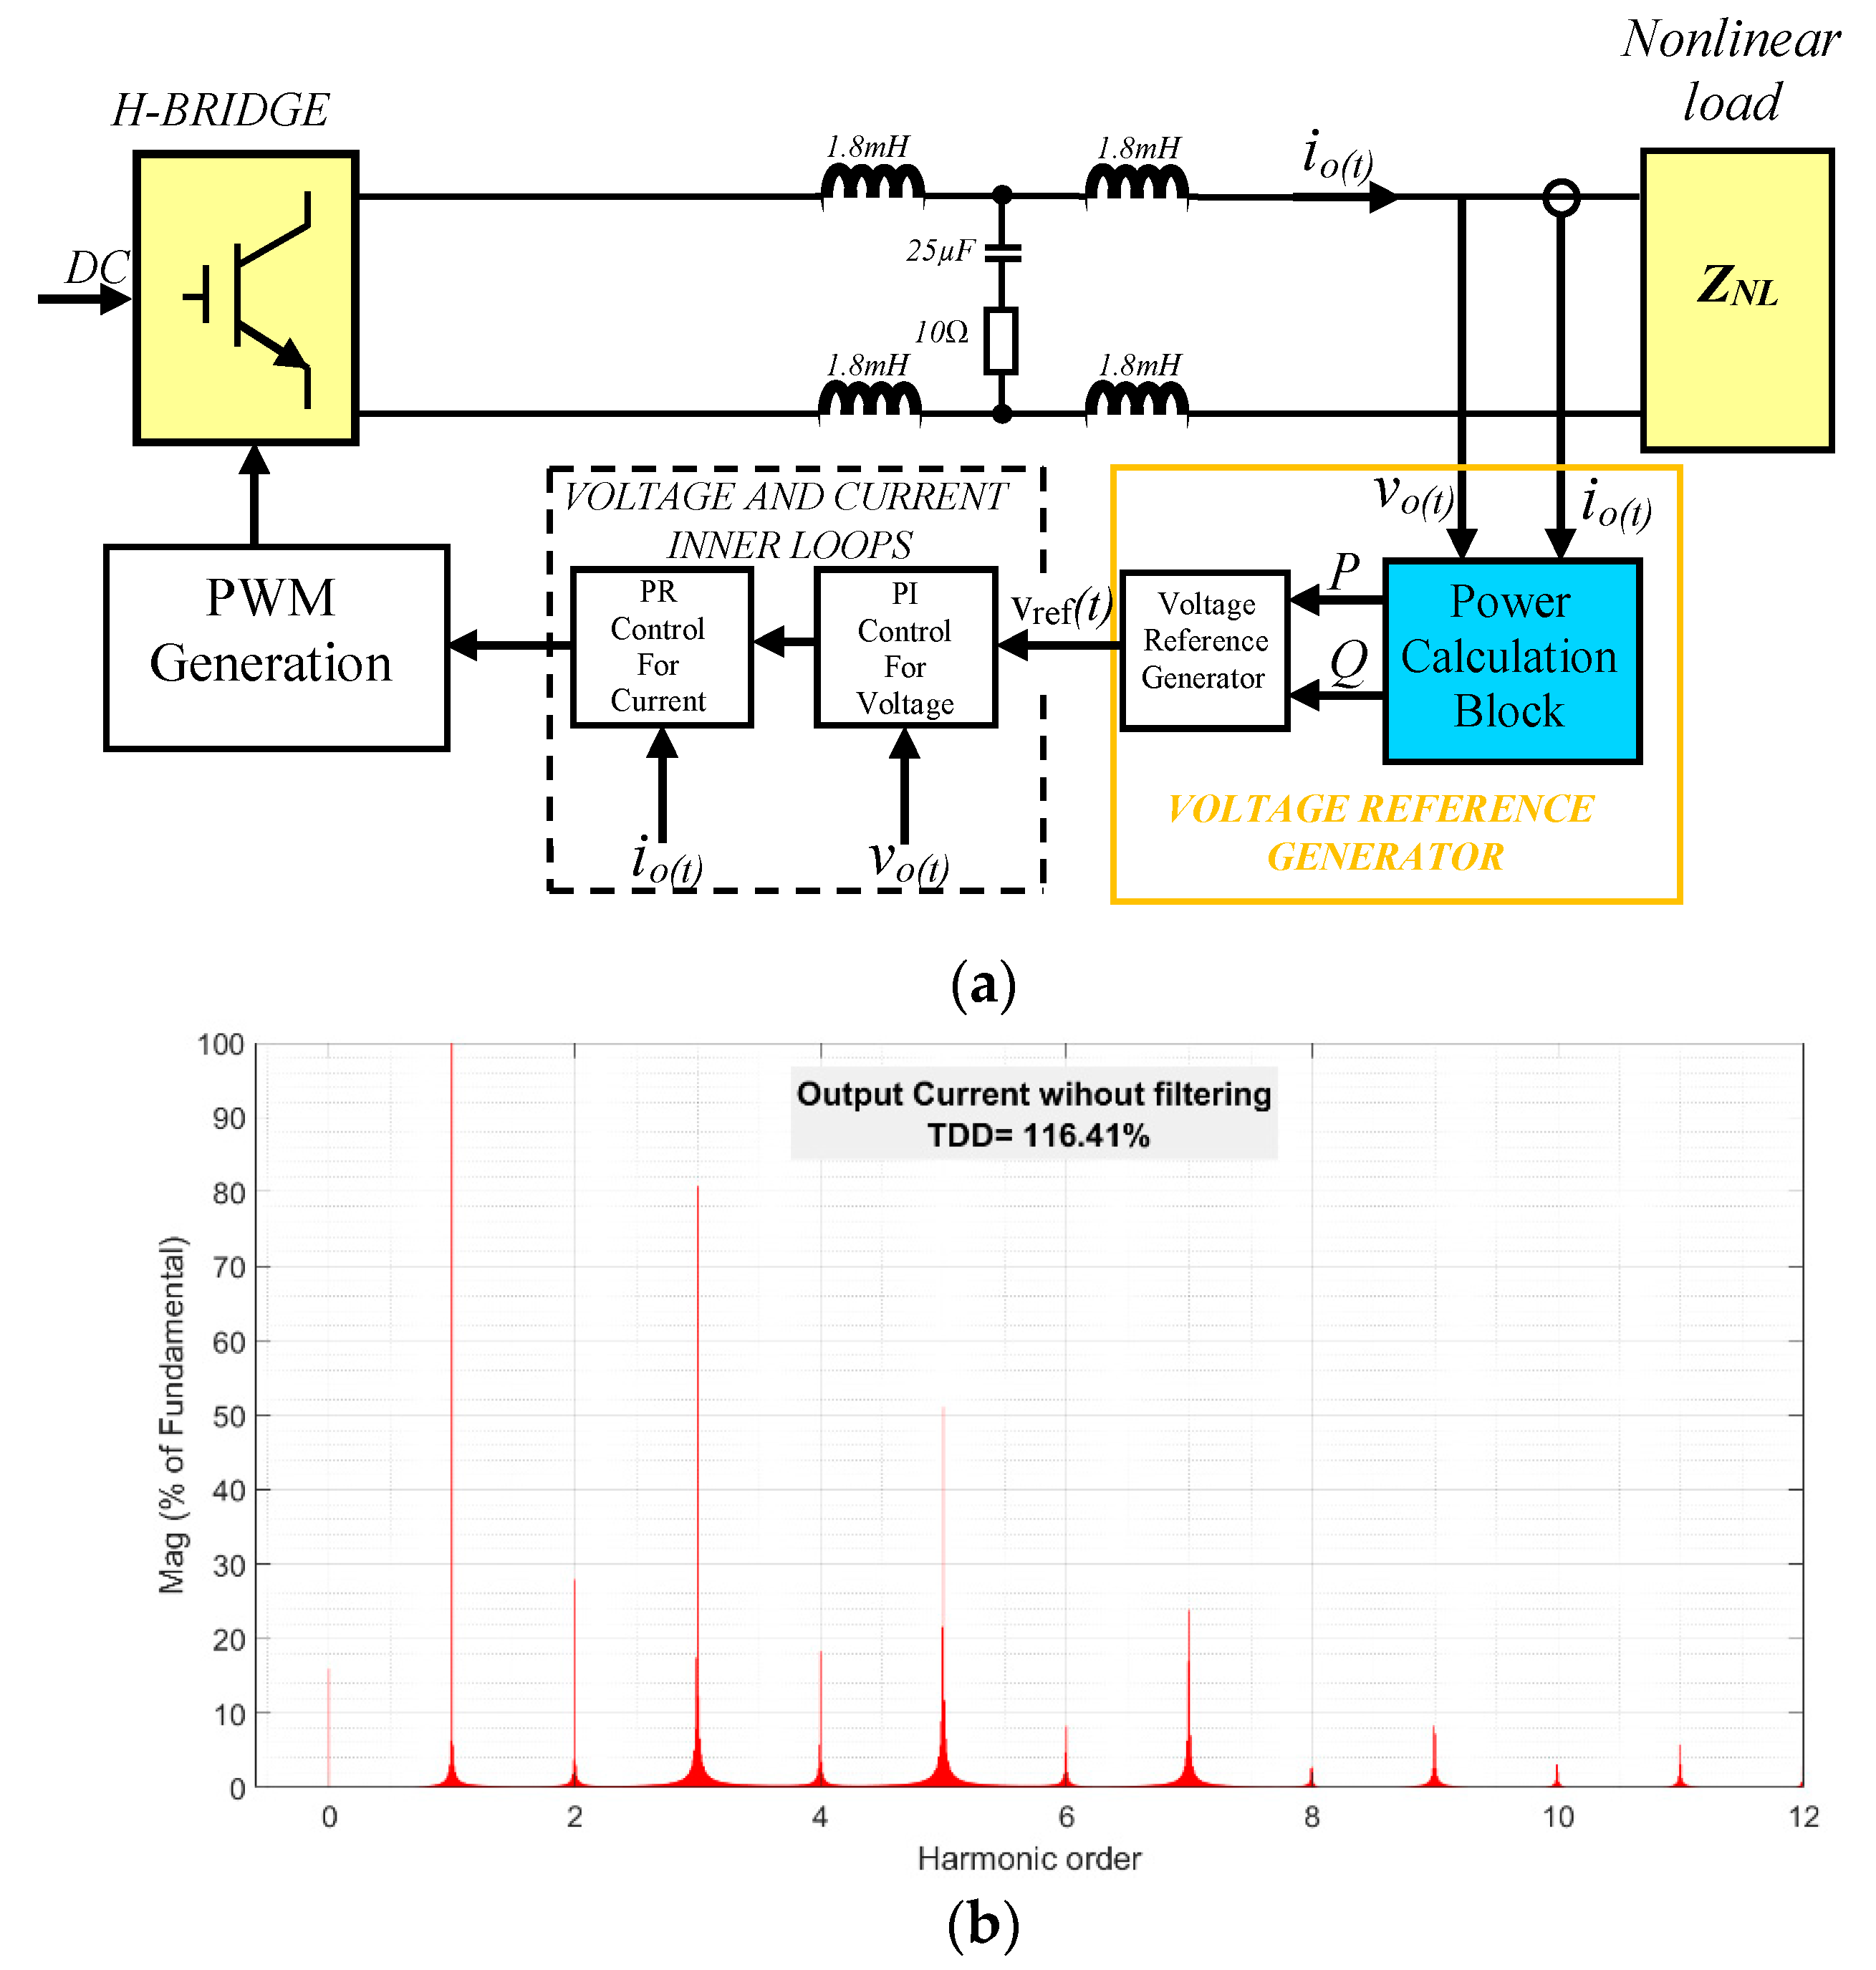
Figure 3a detailed the local control structure for a single-phase VSI supplying the NLL of Figure 2. This model is based on References [45,53], and this work only focuses on the block named “POWER CALCULATION BLOCK,” that generates the voltage reference for the voltage and current inner loops. Those consist of a proportional-integral (PI) block for the voltage and a proportional-resonant (PR) loop for the current. A final stage for the PWM for the switching of an H-bridge is shown.
Figure 3b displays the harmonic distribution of the measured current. Regarding the recommended limitations in [44], the individual harmonic distortion in the current (THDi) and the total distortion demand (TDD) are out of limits. Moreover, a DC component in (2) and pictured in Figure 3b is not allowed by Reference [44]. Finally, the individual harmonic distortion in voltage, THDv, and its total harmonic distortion, THD, are within limits. Table 2 summarizes this characterization of ZNL:

4. P–Q Calculation Algorithms

The droop equations for a mainly inductive system are as follows:
ω = ω n m · P
V = V n n · Q
where ω is the calculated angular frequency of the system, V the calculated voltage amplitude, V n is the rated value for the voltage, ω n is the frequency rated value, and m and n are the droop coefficients. With these parameters, it is generated the sinusoidal voltage reference v r e f ( t ) necessary for the inverter inner control loops of Figure 3a:
v r e f ( t ) = V · s i n ( ω · t )
The calculation of P–Q is done as follows, in the time domain:
p ( t ) = v o ( t ) · i o ( t ) = P + p ˜ ( t ) + v o ( t ) · h 1 N I h · s i n ( h · ω o · t φ h )
P = 1 2 V o · I o · c o s ( φ o )
p ˜ ( t ) = 1 2 V o · I o · c o s ( 2 ω 0 · t φ o )
where (6) is the calculated active instantaneous power [38], P is the averaged active power in (7), and a double frequency pulsating component, p ˜ ( t ) , is represented by (8). For the instantaneous reactive power calculation, an in-quadrature signal for the voltage is employed, represented by (9). Then an instantaneous reactive power quantity is calculated:
v o q ( t ) = V o · s i n ( ω o · t π 2 )
q ( t ) = v o q ( t ) · i o ( t ) = Q + q ˜ ( t ) + v o q ( t ) · h 1 N I h · s i n ( h · ω o · t + φ h )
Q = 1 2 V o · I o · s i n ( φ o )
q ˜ ( t ) = 1 2 V o · I o · s i n ( 2 ω 0 · t φ o )
where q(t) is the instantaneous reactive power, (10), Q is the averaged reactive power in (11), and q ˜ ( t ) is a double frequency component. Only in Reference [35], the highly distorted load current was pre-filtered prior to the instantaneous power calculations in (6) and (10), using a DSOGI approach and its BPF capability. Thus, the LPF of a SOGI was employed as a quadrature signal generator (QSG) delaying in π 2 rad the voltage signal. The BPF and LPF transfer functions for a SOGI are described in (13) and (14), respectively:
H d ( s ) = 2 ξ ω s s 2 + 2 ξ ω s + ω 2  
H q ( s ) = 2 ξ ω 2 s 2 + 2 ξ ω s + ω 2
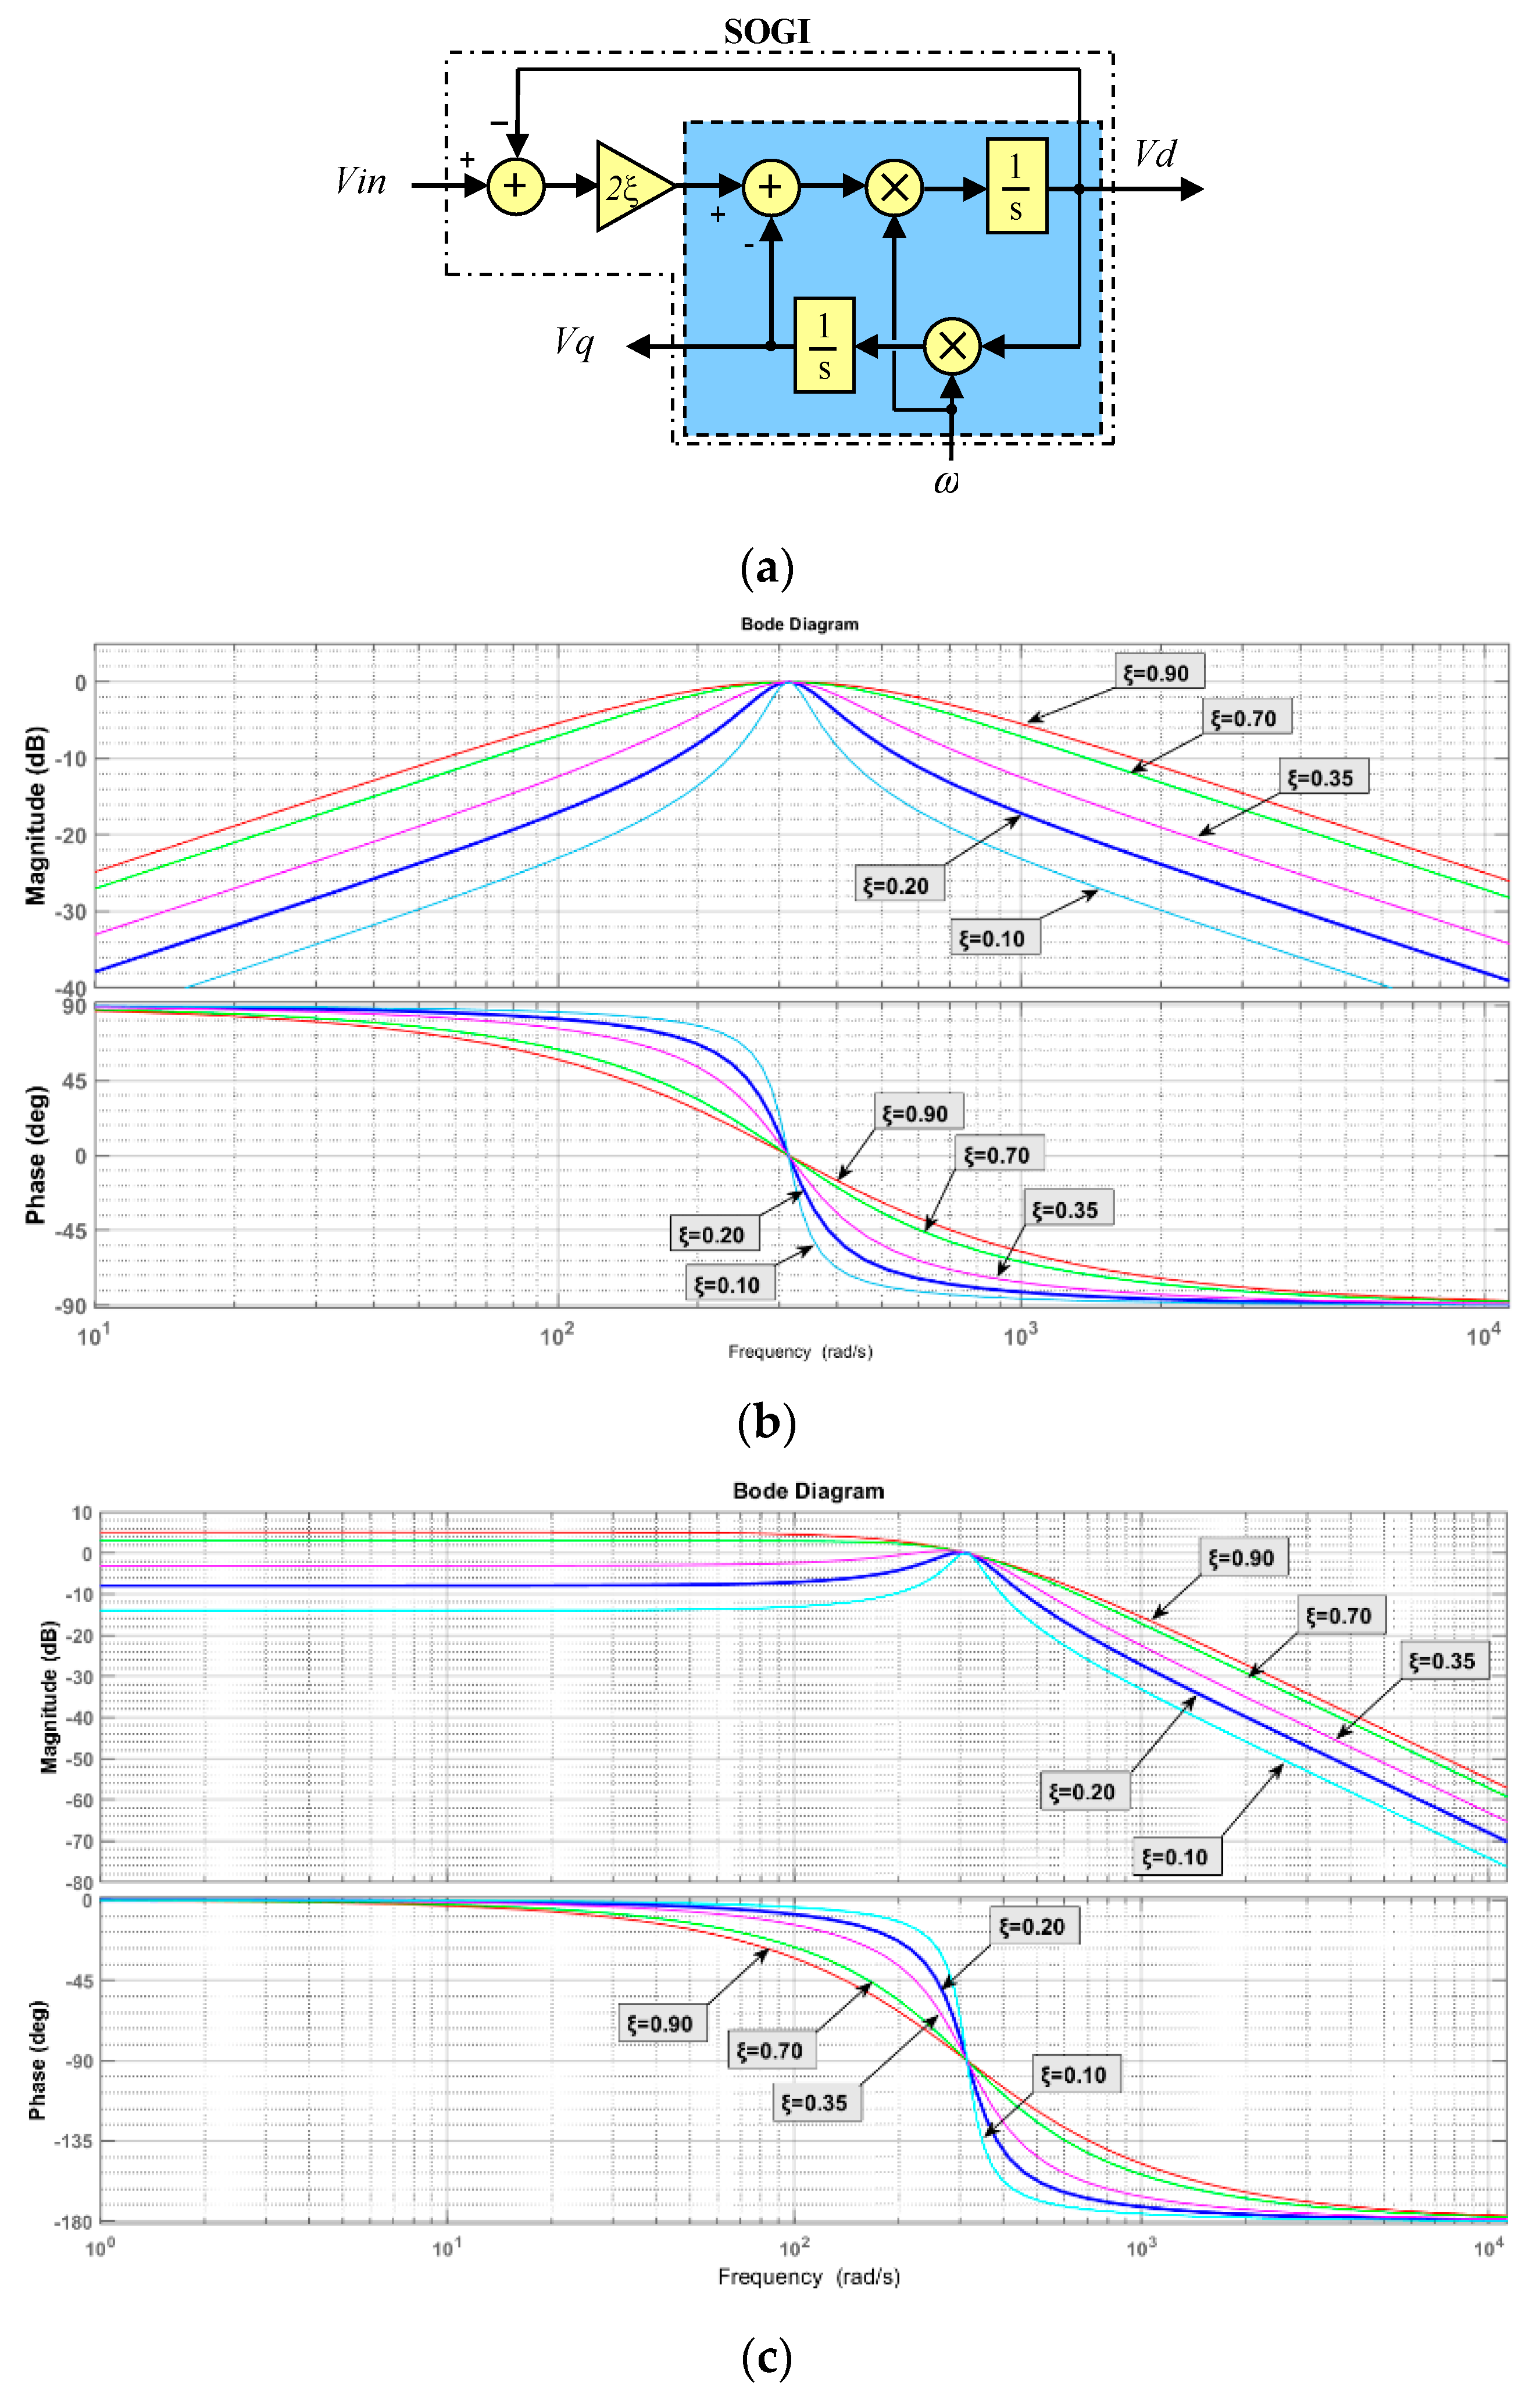
where ξ is the damping factor, and ω   is the center frequency of the system. Figure 4 shows the structure of a SOGI, with its BPF and LPF magnitude and phase Bode plots.
In Figure 4b, the SOGI-BPF is more selective while reducing the damping factor. The same occurs with its LPF capability. The attenuation presents a rate of −30 dB/decade for the BPF and −60 dB/decade for the LPF. However, the LPF transfer function presents a drawback in attenuation for frequencies below the fundamental.
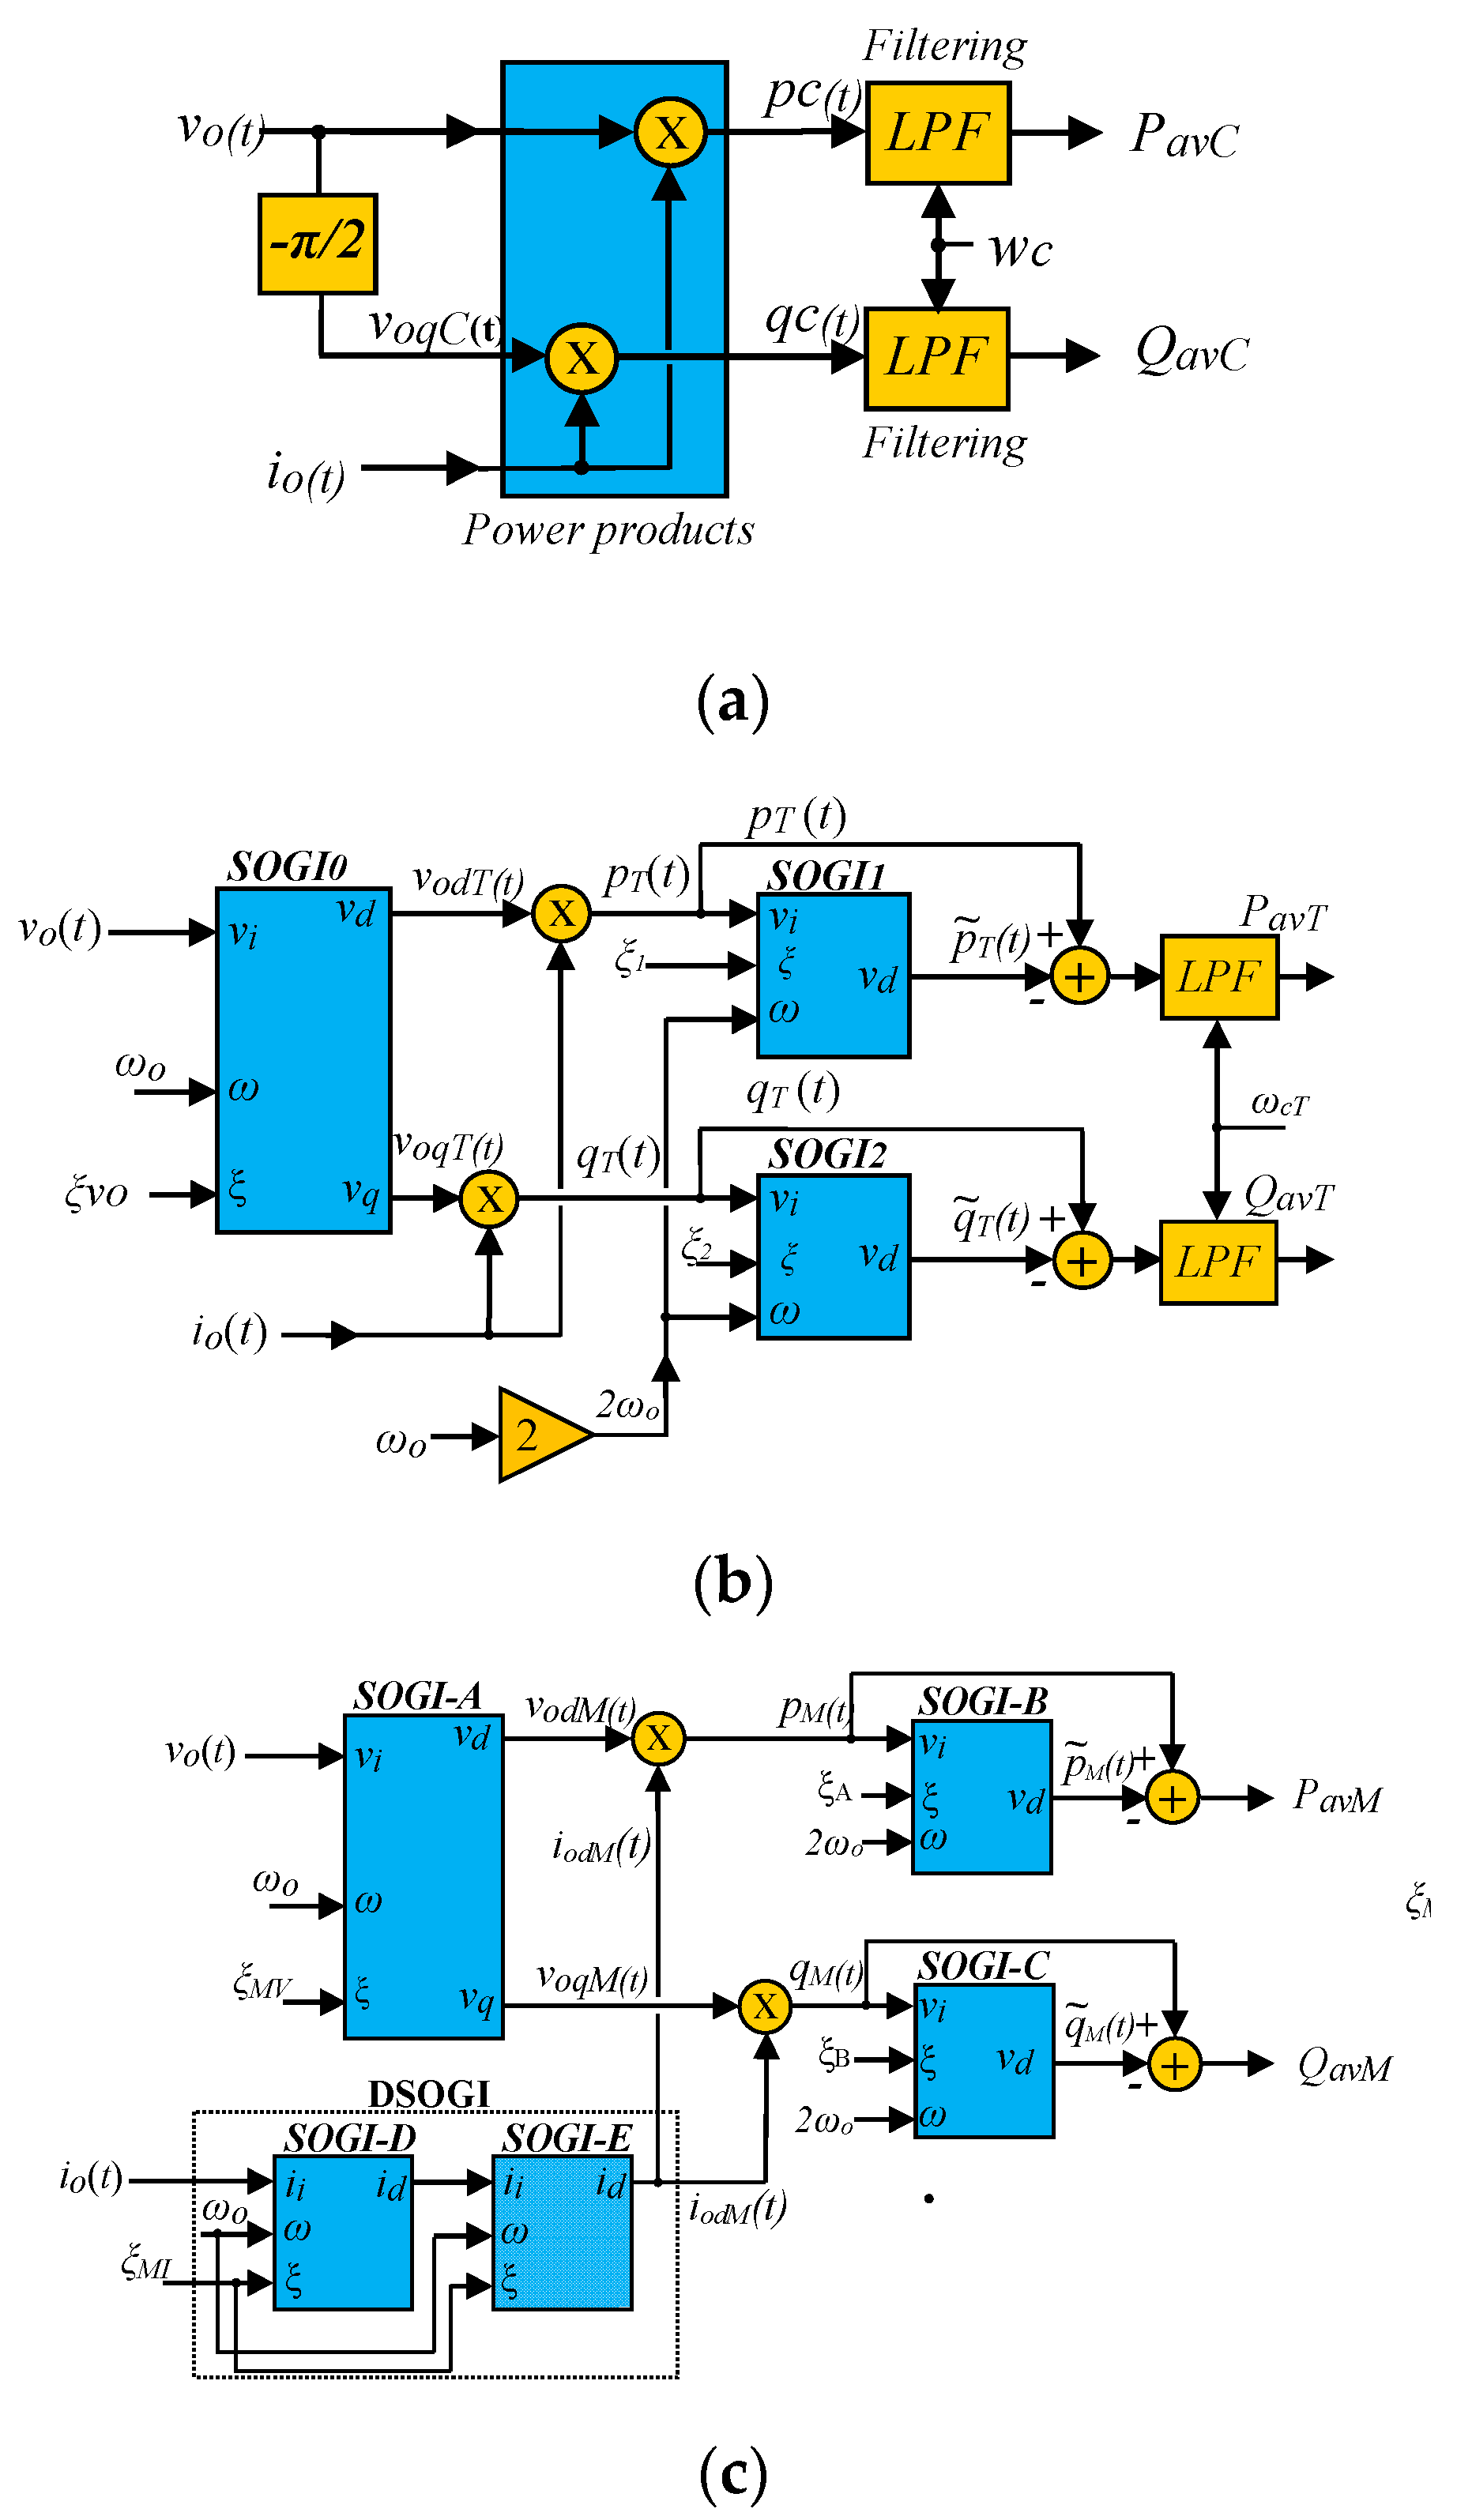
The following Figure 5 shows three averaged active and reactive power calculation:
The obtained averaged active powers are named as PavC, PavT, and PavM, for Figure 5a–c, respectively. In the same manner, the averaged reactive powers are named as QavC, QacT, and QavM.
In Figure 5a, v o q C ( t ) is the π 2 delayed voltage signal, as described in (9), achieved by using a time-delay block [47]. In Figure 5b,c, a SOGI-LPF was employed as QSG for the obtention of v o q T ( t ) and v o q M ( t ) , as well as BPF for the direct component of the voltage.
The next common stage of the three calculation algorithms consists of obtaining the instantaneous active and reactive powers, as described in (6) and (10). Note that the measured current is directly applied, except in Figure 5c, where it utilizes a BPF for the current [35].
In Figure 5a, Pavc and Qavc are obtained after an LPF stage. On Figure 5b, the oscillatory double frequency components are extracted by a SOGI-BPF tuned at 2 ω 0 and then removed from the calculated instantaneous powers. Lastly, an LPF similar to Figure 5a is employed to reduce the steady-state ripple. The latest algorithm in Figure 5c also removes the double frequency components but eludes the final LPF stage.
Besides, Figure 5 shows the increasing complexity of the algorithms, especially Figure 5c, when supplying to the NLL in Reference [35]. Therefore, the next section proposes a novel algorithm that calculates in a faster manner the averaged active power and, in a more accurate manner, the averaged reactive power, while reducing the complexity of the calculation scheme.

5. Proposed P–Q Calculation Algorithm

The proposed algorithm for the calculation of P–Q is presented in Figure 6. This new algorithm is intended to ease the dynamic performance of the system by reducing the settling-time during abrupt load changes.
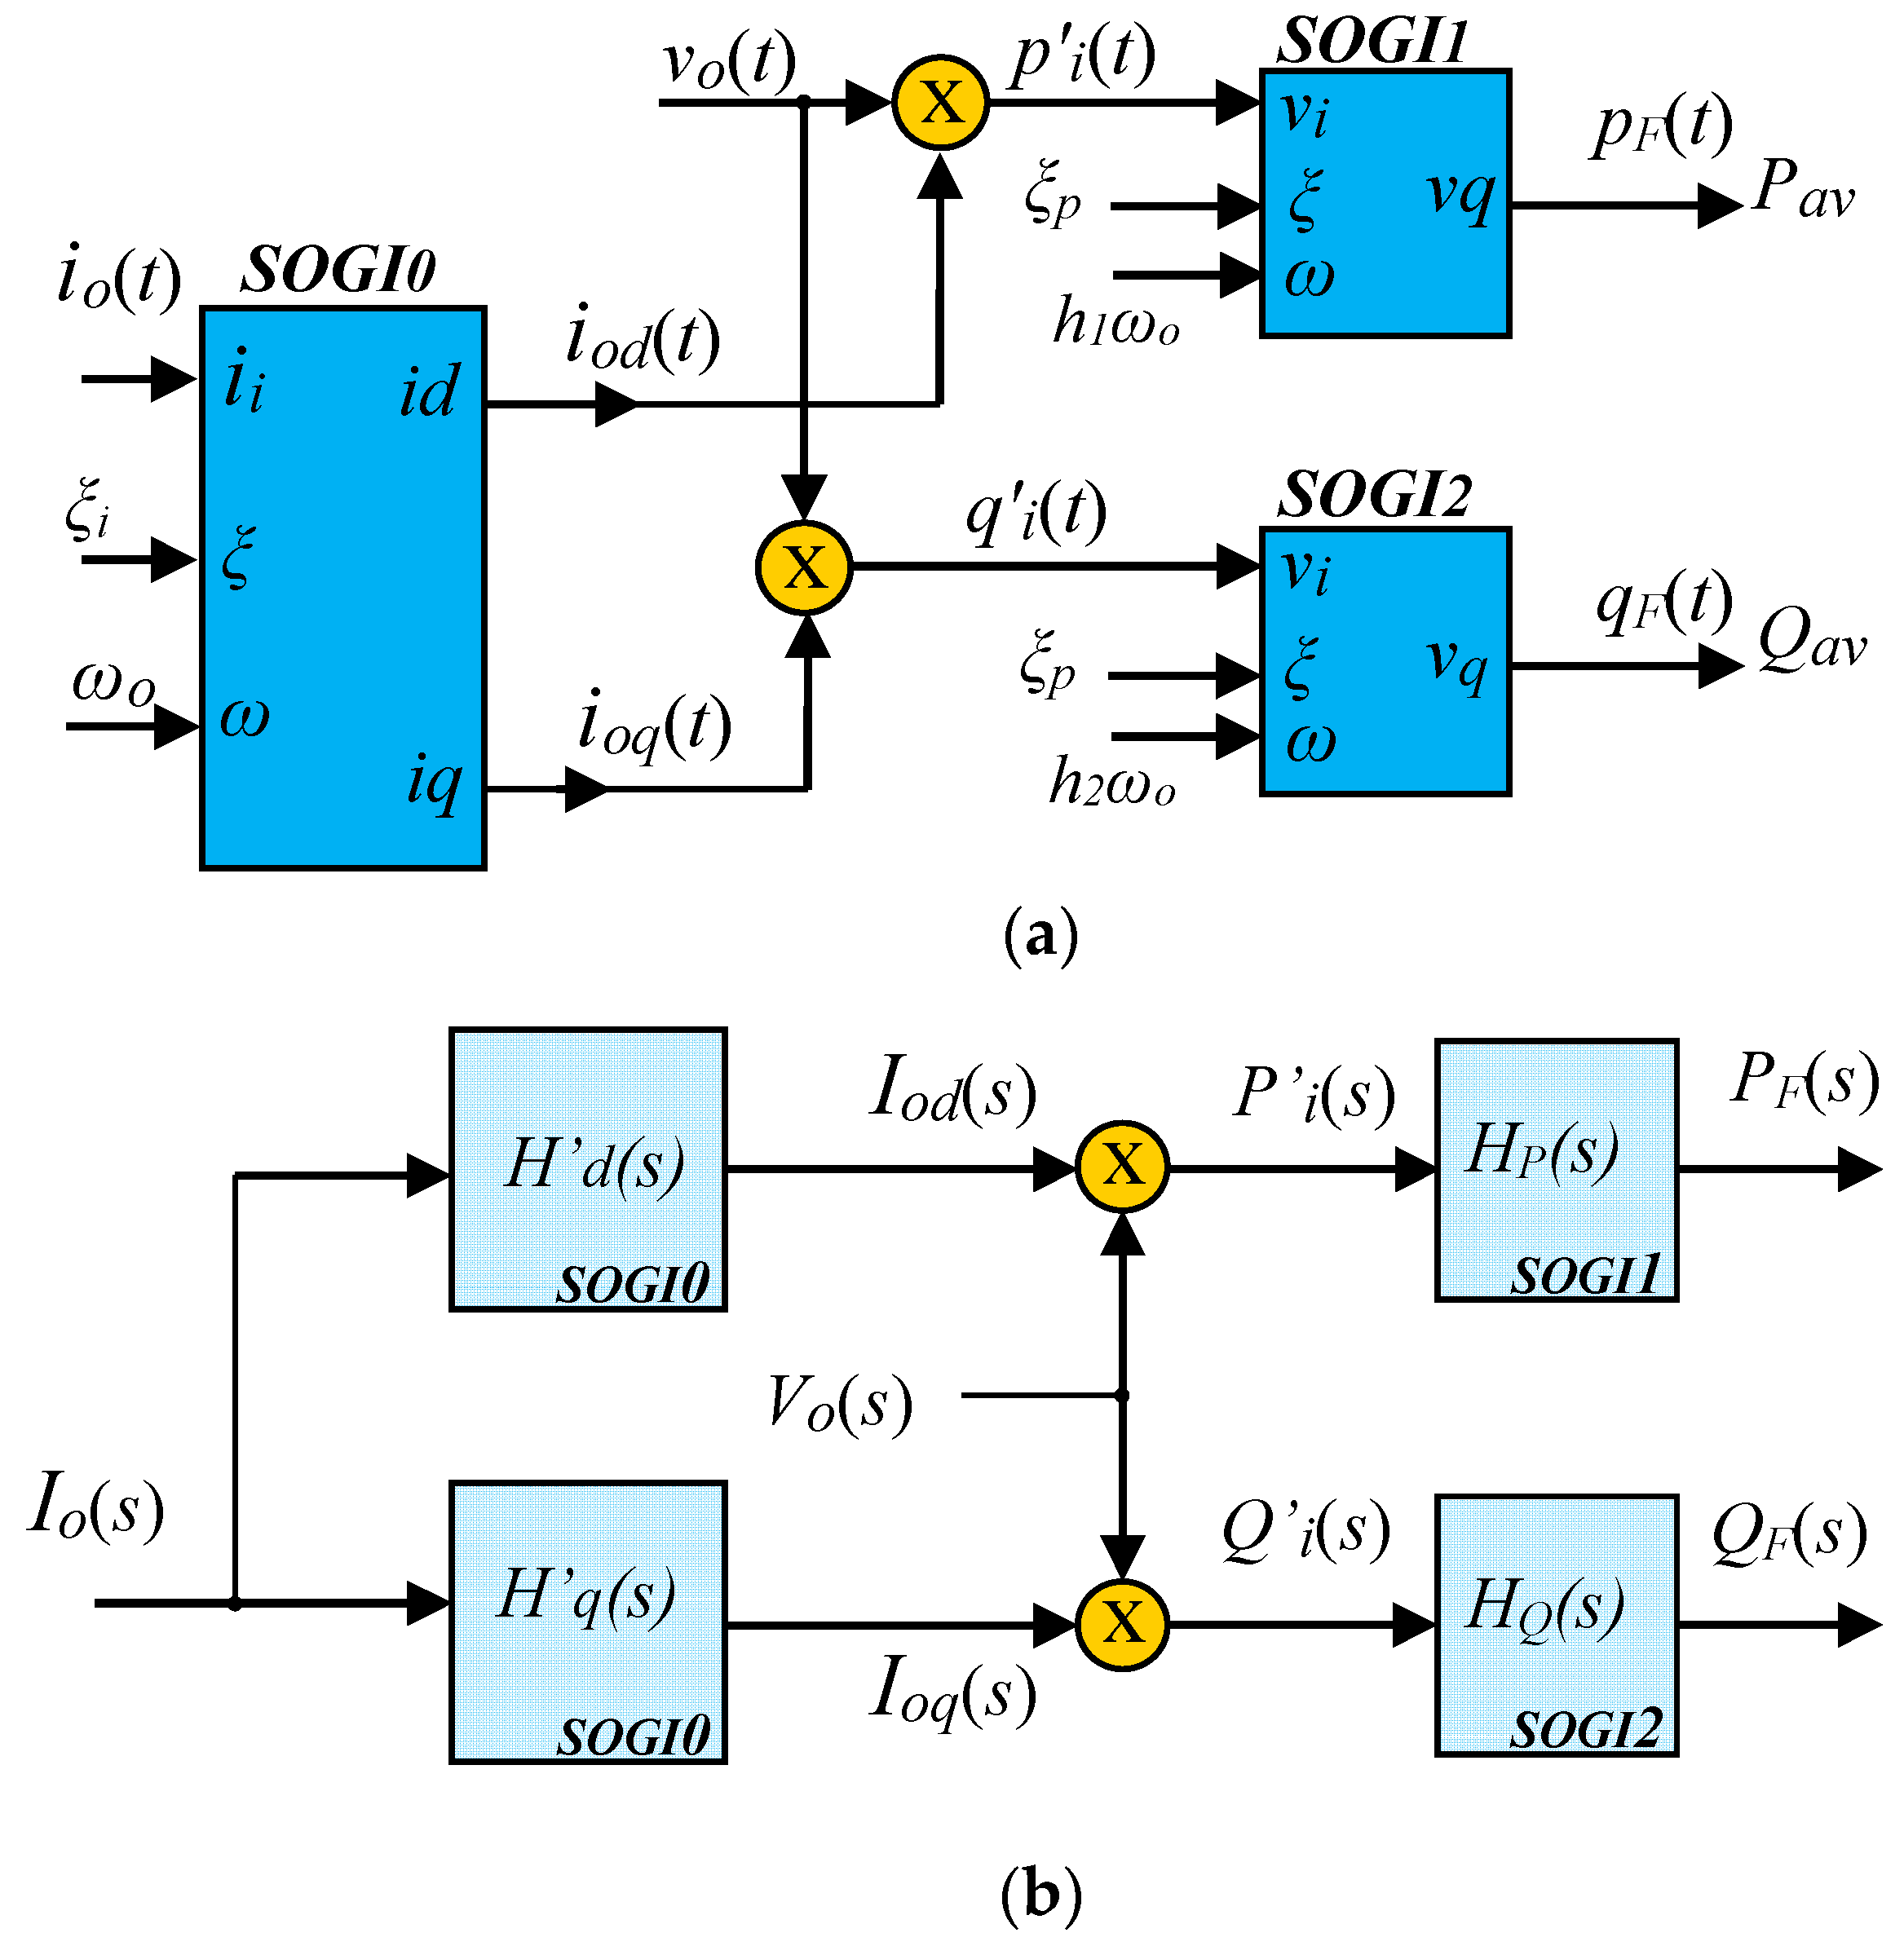
Figure 6a shows that the measured current, i o ( t ) , is conditioned through SOGI-0, obtaining a BPF filtered component, i o d ( t ) , and an LPF filtered component, i o q ( t ) . Then, each current component is directly multiplied by the voltage, computing the instantaneous active power, p i ( t ) , and the instantaneous reactive power, q i ( t ) . Those quantities are expected to contain the averaged active and reactive powers Pav and Qav, respectively, plus a certain amount of undesired harmonic components, similarly to Reference [35] and following Equations (6) and (10). Therefore, a final LPF stage is applied to each instantaneous power to acquire active and reactive quantities with the lesser possible steady-state harmonics. Those last active and reactive power quantities are, respectively, p F ( t ) and q F ( t ) , and contain the desired Pav and Qav. Comparing this scheme to those pictured in Figure 5, note that the voltage signal is not conditioned due to the specific NLL characterized according to Table 2. The proposed scheme also presents fewer signal conditioners and control parameters than in Reference [35], in Figure 5c, showing a simplified calculation structure.
Figure 6b is the frequency-domain analytical representation of the calculated quantities and the transfer functions for each SOGI employed in Figure 6a. The signals reported in this scheme are the Laplace Transform of those indicated in Figure 6a: I 0 ( s ) = L { i 0 ( t ) } , I 0 d ( s ) = L { i 0 d ( t ) } , I 0 q ( s ) = L { i 0 q ( t ) } , V 0 ( s ) = L { v 0 ( t ) } ,   P i ( s ) = L { p i ( t ) } , Q i ( s ) = L { q i ( t ) } , P F ( s ) = L { p F ( t ) } , and Q F ( s ) = L { p F ( t ) } . Analytically, the LPF and BPF transfer functions of SOGI0 are represented, respectively, by H d 0 ( s ) and H q 0 ( s ) :
H q 0 ( s ) = 2 ξ i ω 0 2 s 2 + 2 ξ i ω 0 s + ω 0 2  
H d 0 ( s ) = 2 ξ i ω 0 s s 2 + 2 ξ i ω 0 s + ω 0 2  
Those are tuned at ω 0 , and their selectivities are controlled through the damping factor, ξ i . Hence, the direct and the in-quadrature filtered currents, i o d ( s ) and i o q ( s ) , respectively, are as follows:
i o d ( s ) = ( 2 ξ i ω o · s s 2 + 2 ξ i ω o · s + ω 0 2 ) i o ( s )
i o q ( s ) = ( 2 ξ i ω o 2 s 2 + 2 ξ i ω o · s + ω 0 2 ) i o ( s )
and the time-domain expressions are:
i o d ( t ) = I 0 · s i n ( ω o t φ o ) + h 1 N   I d h · s i n ( h · ω o · t φ d h )
i o q ( t ) = I 0 · s i n ( ω o t φ o π 2 ) + h 1 N I q h · s i n ( h · ω o · t φ q h )
where h 1 is a harmonic index. For (19), I d h is the harmonic amplitude, and φ d h is its phase-shift. In (20), I q h is the harmonic amplitude and φ q h , is its phase-shift. Note that I d h I q h and φ d h φ q h .
Later, following the scheme in Figure 6a, the instantaneous active and reactive powers, p i ( t ) and q i ( t ) , are as follows:
p i ( t ) = P a v + v o ( t ) · h 1 N I d h · s i n ( h · ω o · t φ d h )
q i ( t ) = Q a v + v o ( t ) · h 1 N I q h · s i n ( h · ω o · t + φ q h )
P i ( s ) = L { p i ( t ) }
Q i ( s ) = L { q i ( t ) }
Pav and Qav are the averaged active and reactive power outputs, respectively. P i ( s ) and Q i are the domain frequency expression of (21) and (22), related in Figure 6b.
Therefore, for SOGI1 and SOGI2, they utilize their LPF capability as follows:
H P ( s ) = ( 2 ξ p h 1 2 ω o 2 s 2 + 2 ξ p h 1 ω o s + h 1 2 ω o 2 )
H Q ( s ) = ( 2 ξ p h 2 2 ω o 2 s 2 + 2 ξ p h 2 ω o s + h 2 2 ω o 2 )
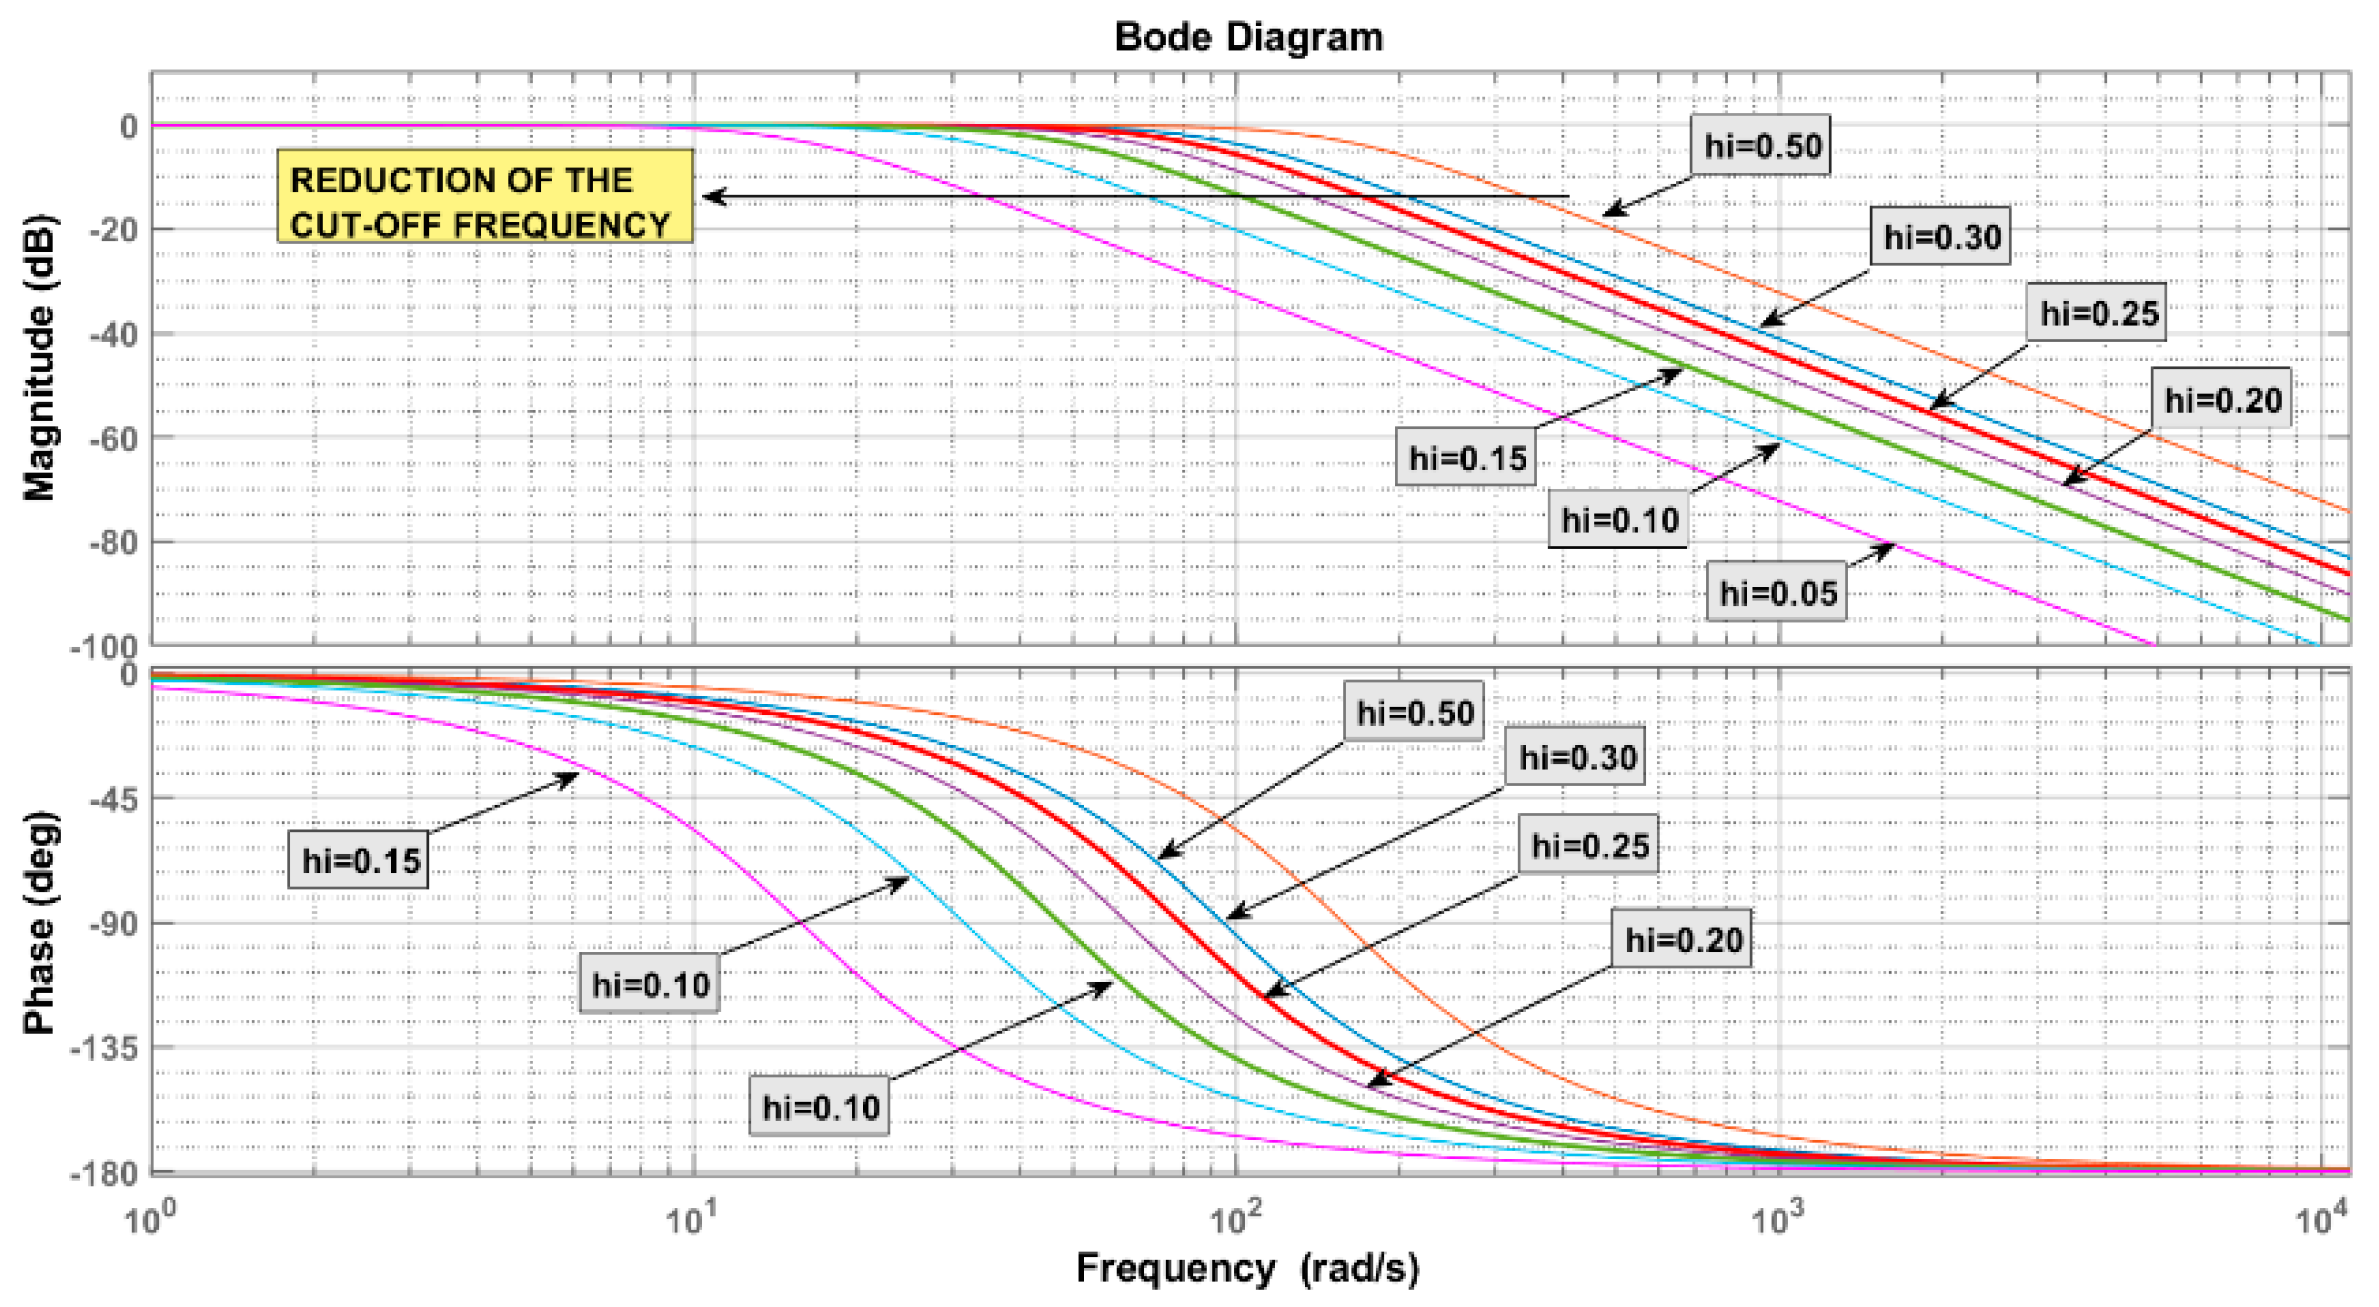
where H P ( s ) and H Q ( s ) are the transfer functions for the LPF capability of SOGI1 and SOGI2, respectively. Note that both transfer functions are essentially the same, only differentiated by the h1 and h2 coefficients. Those coefficients ( h 1 , h 2 ) [ 0.05 , 0.5 ] are employed for the attenuation of subharmonics reducing the SOGI1 and SOGI2 LPF cutoff frequencies. Next, Figure 7 shows their magnitude and phase plots. For the sake of simplicity, h 1 = h 2 = h i :
Then, P F ( s ) and Q F ( s ) are the result of the filtering of (23) and (24) by their respective LPF-SOGI:
P F ( s ) = P i ( s ) · H P ( s )
Q F ( s ) = Q i ( s ) · H Q ( s )
Finally, back to the time domain, the following can be found:
p F ( t ) = L 1 { P F ( s ) } = P a v + k = 1 X p k ( t )
q F ( t ) = L 1 { Q F ( s ) } = Q a v + k = 1 X q k ( t )
The expressions p F ( t )   and q F ( t ) contain Pav and Qav. The parameter k is a harmonic index similar to h in (21), being p k ( t ) and q k ( t ) the undesired oscillatory components. For the attenuation of those, SOGI1 is tuned at a frequency ω = h 1 ω 0 and SOGI2 at ω = h 2 ω 0 . Low values for h1 and h2 will lead to a substantial reduction of these components. The next section includes simulations to study the values of ξ P , ξ i , h1, and h2 for a more accurate and faster calculation of the P–Q parameters.

6. Simulation Results

The proposed algorithm is simulated to compare its dynamic performance against the structures shown in Figure 5, with an abrupt load change after closing S1. A similar steady-state ripple for the active power calculation is set as a reference for the analysis. The parameters of the simulations are listed in Table 3.
In Reference [35], it was demonstrated that the more suitable algorithm in the presence of an NLL was the calculation of PavM. The following figure shows a family of Pav plots after varying its control parameters and comparing it against PavM.
Figure 8a shows a family of Pav plots varying, 0.1 ξ i 0.7075 , while keeping constant h 1 = 0.25 and ξ p = 0.7075 . It can be seen that, when increasing the damping factor, the transient response is faster. However, there is an undesired overshoot when ξ i   > 0.2. Therefore, the fastest configuration avoiding the overshoot is the one with ξ i   = 0.2.
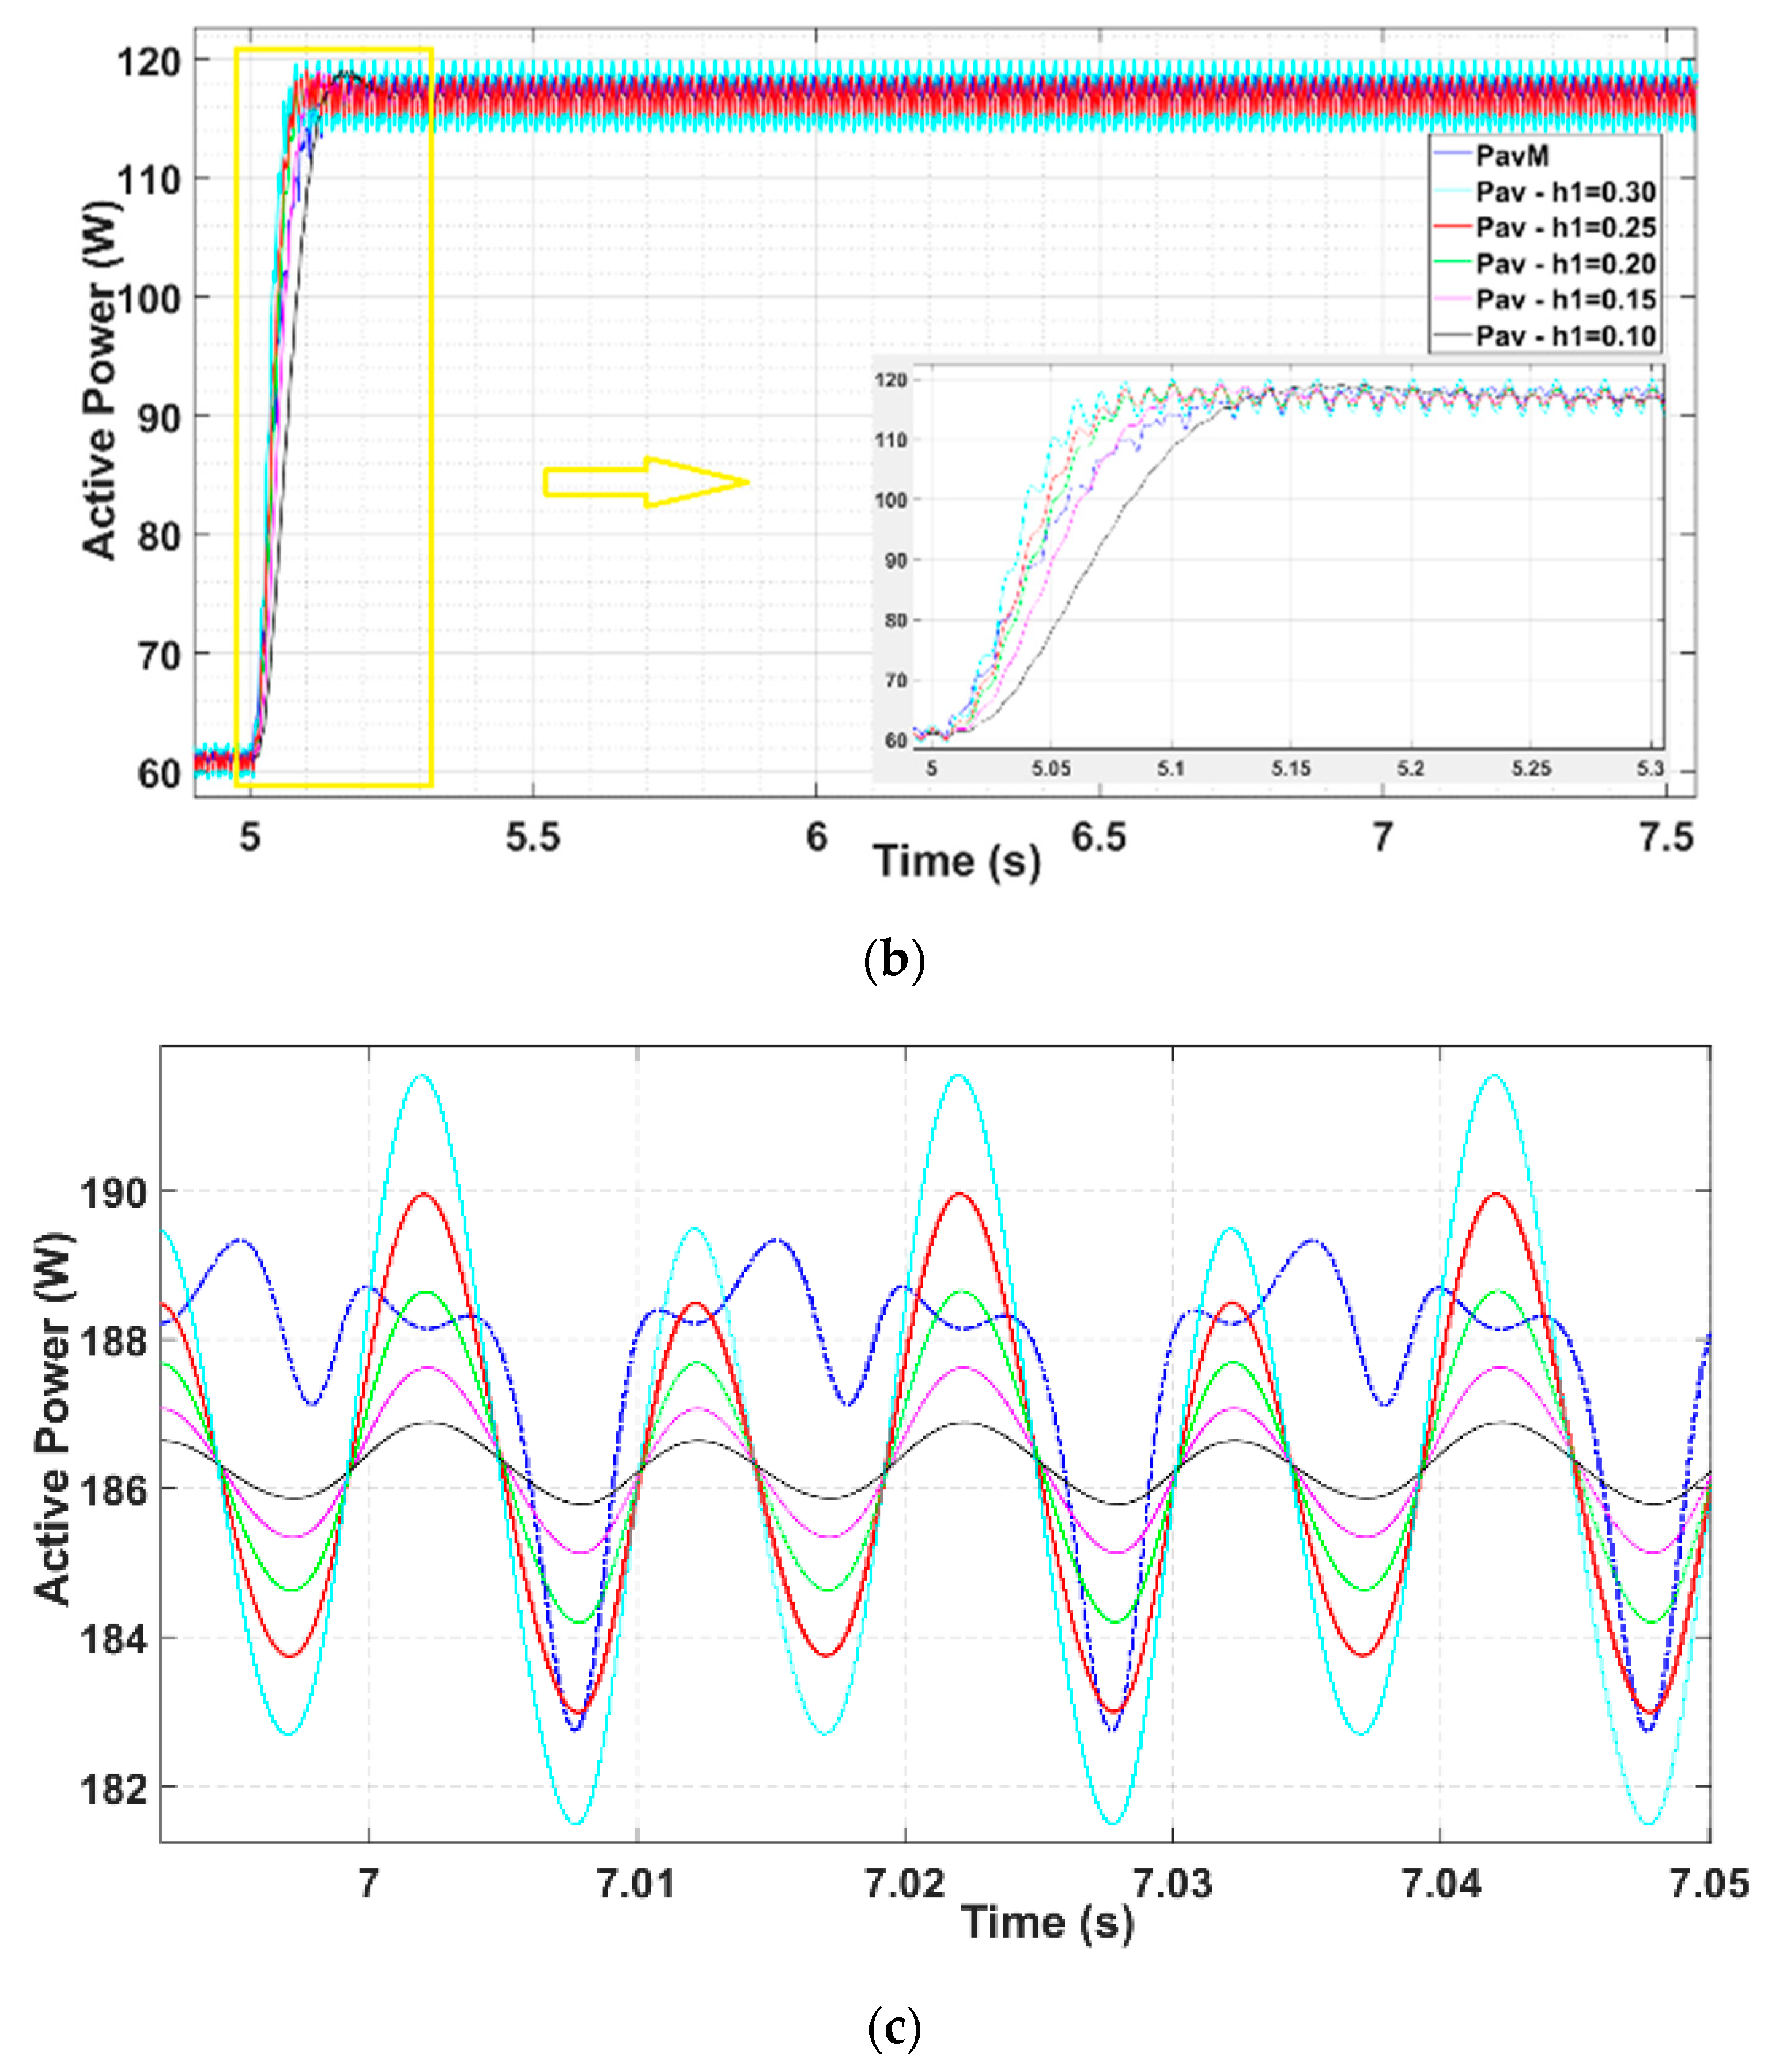
Figure 8b shows the comparison between PavM and a family of Pav calculations, varying h 1   from 0.1 to 0.30 and ξ i   = 0.2. It can be observed how the rapidity of the proposed calculation is reduced when h1 is increased. For h 1 = [ 0.1 , 0.15 ] the Pav transient results slower concerning PavM, and the steady-state ripple results smoother. When h 1 0.2 , the velocity of the transient increases, as well the ripple in steady-state. Only for h 1 = 0.25 , it results in being faster, without introducing a remarkable overshoot. At higher values of h 1 , it presents an undesired ripple in steady-state and an overshoot that is better to avoid.
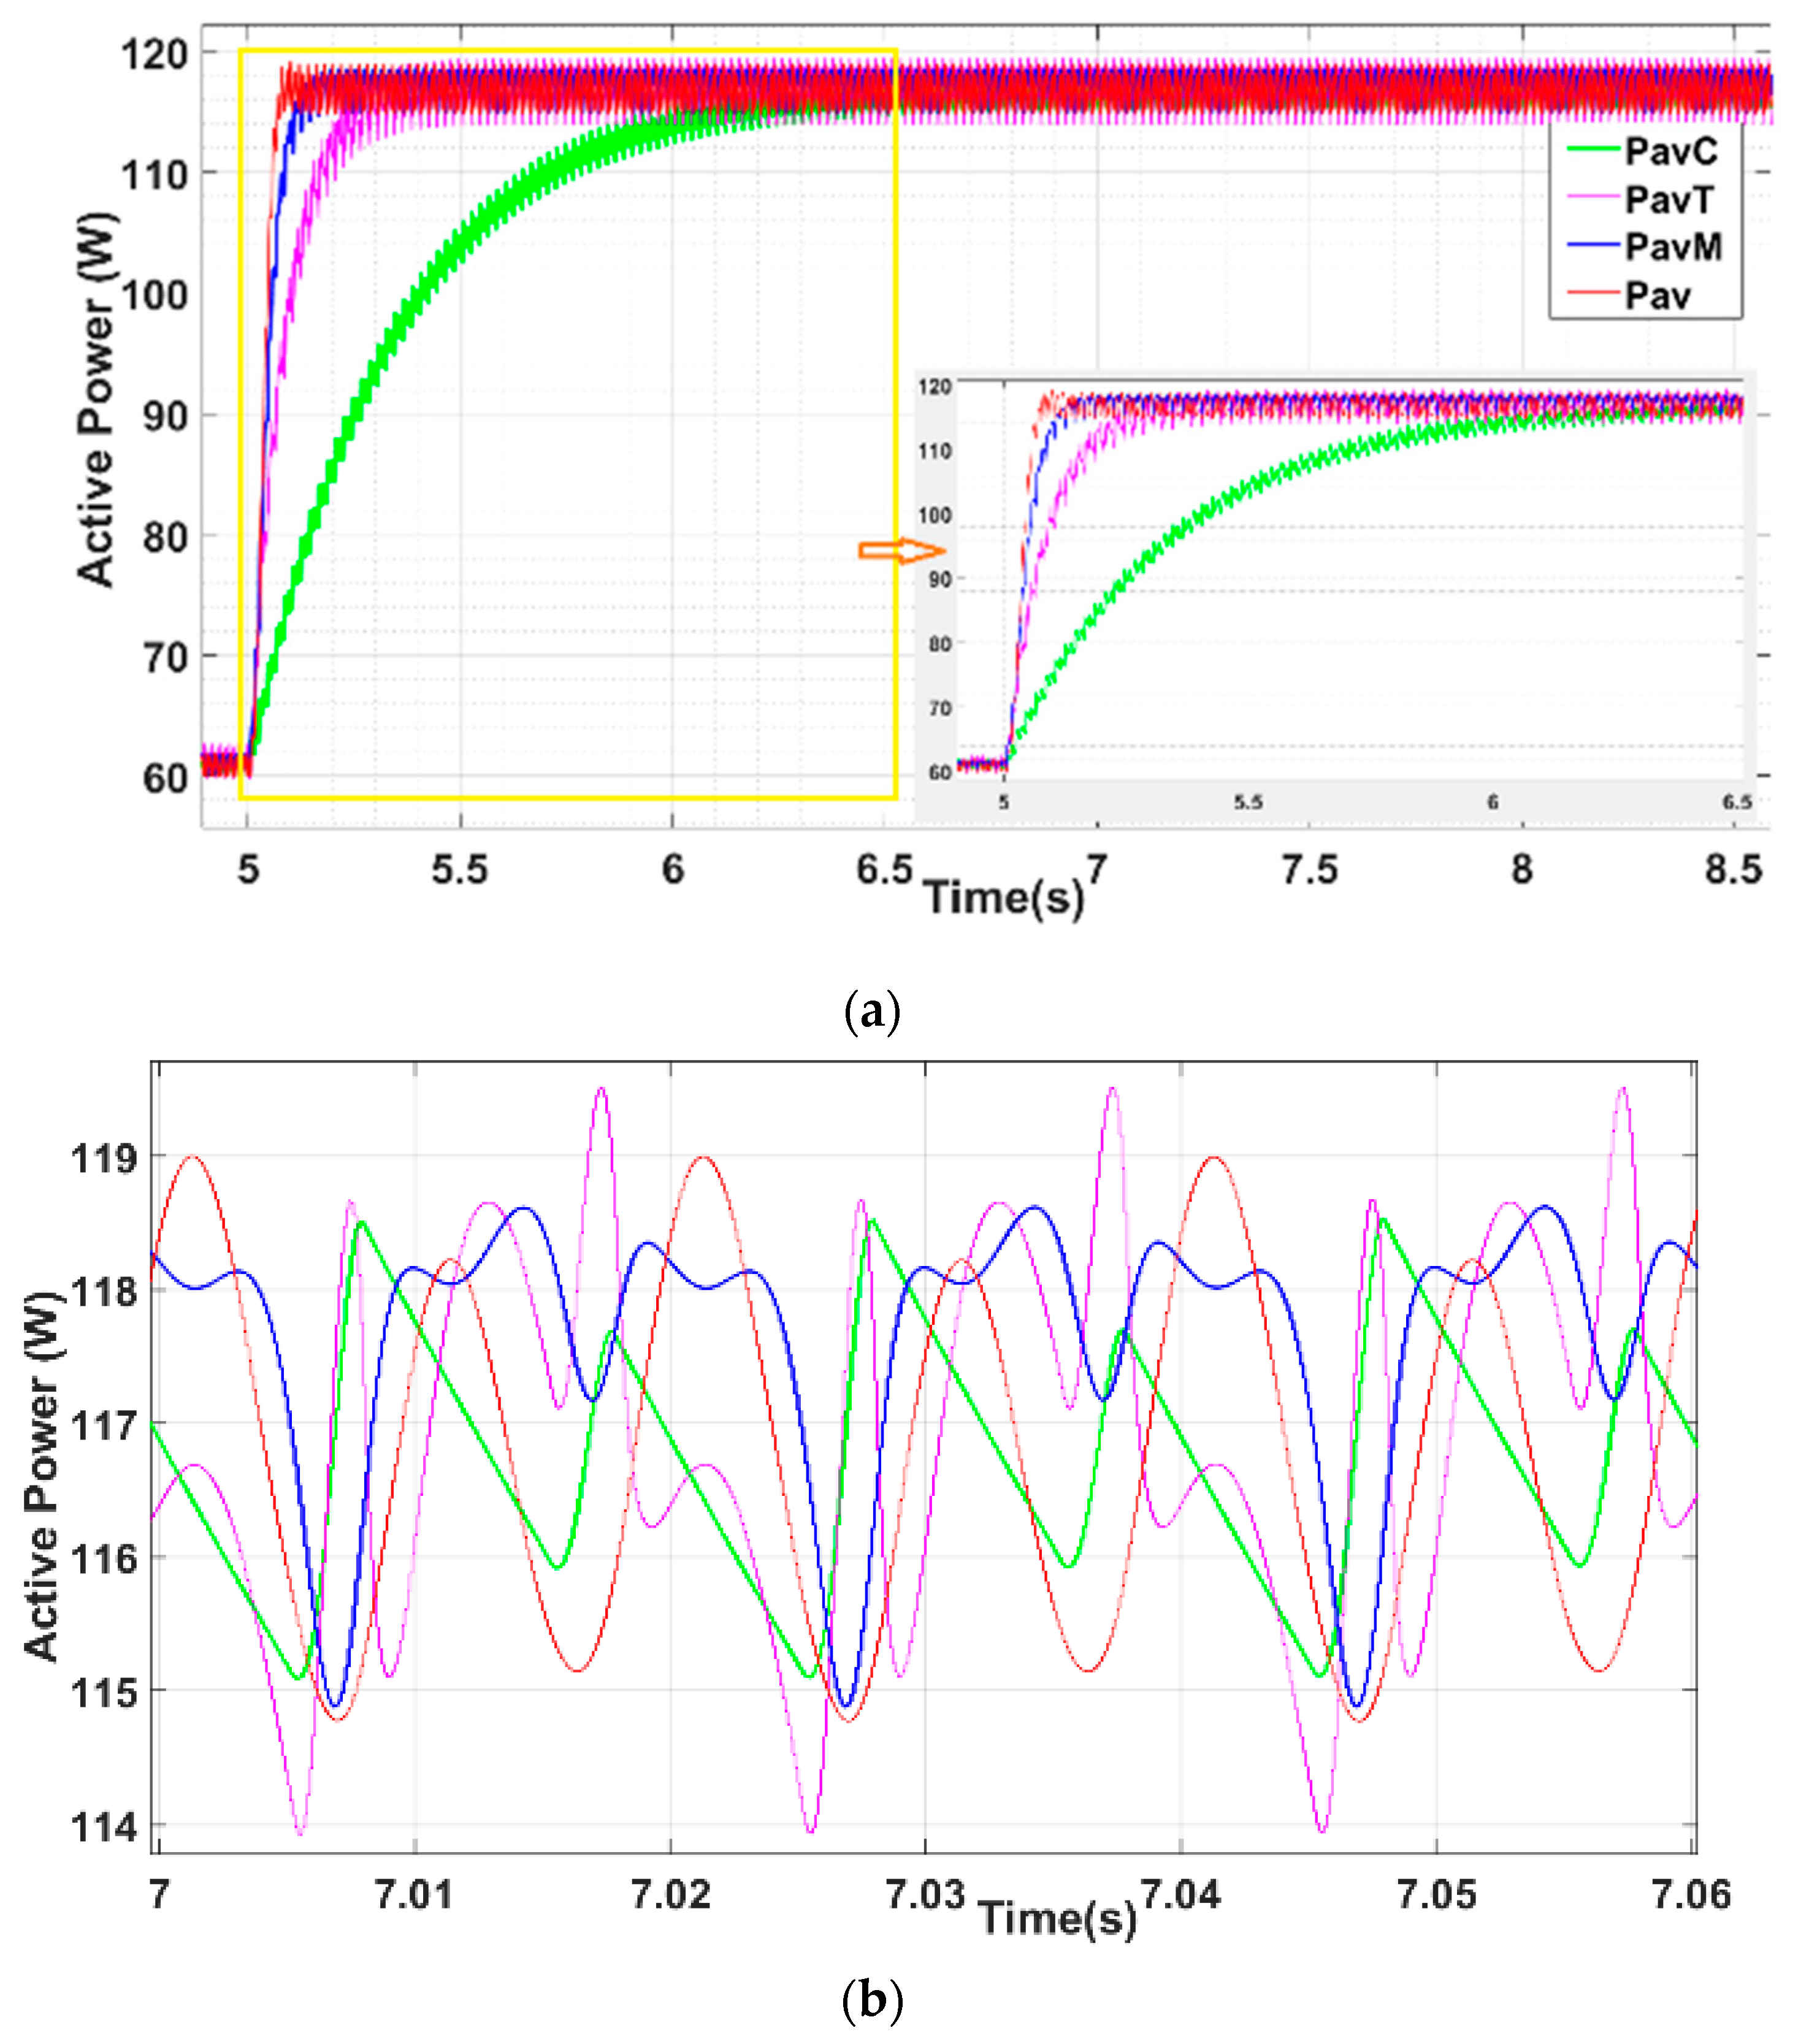
Figure 9a shows the calculation of PavC, PavT, and PavM, compared with the proposed Pav with ξ i   = 0.2. and h 1 = 0.25 . Figure 9b is the detail of the steady-state ripple, where it can be seen that the fastest algorithm, Pav, shows a similar ripple to the other algorithms. In these conditions, the calculation of Pav results faster than PavM. Therefore, these parameters were chosen for the study of the employed for this last simulation.
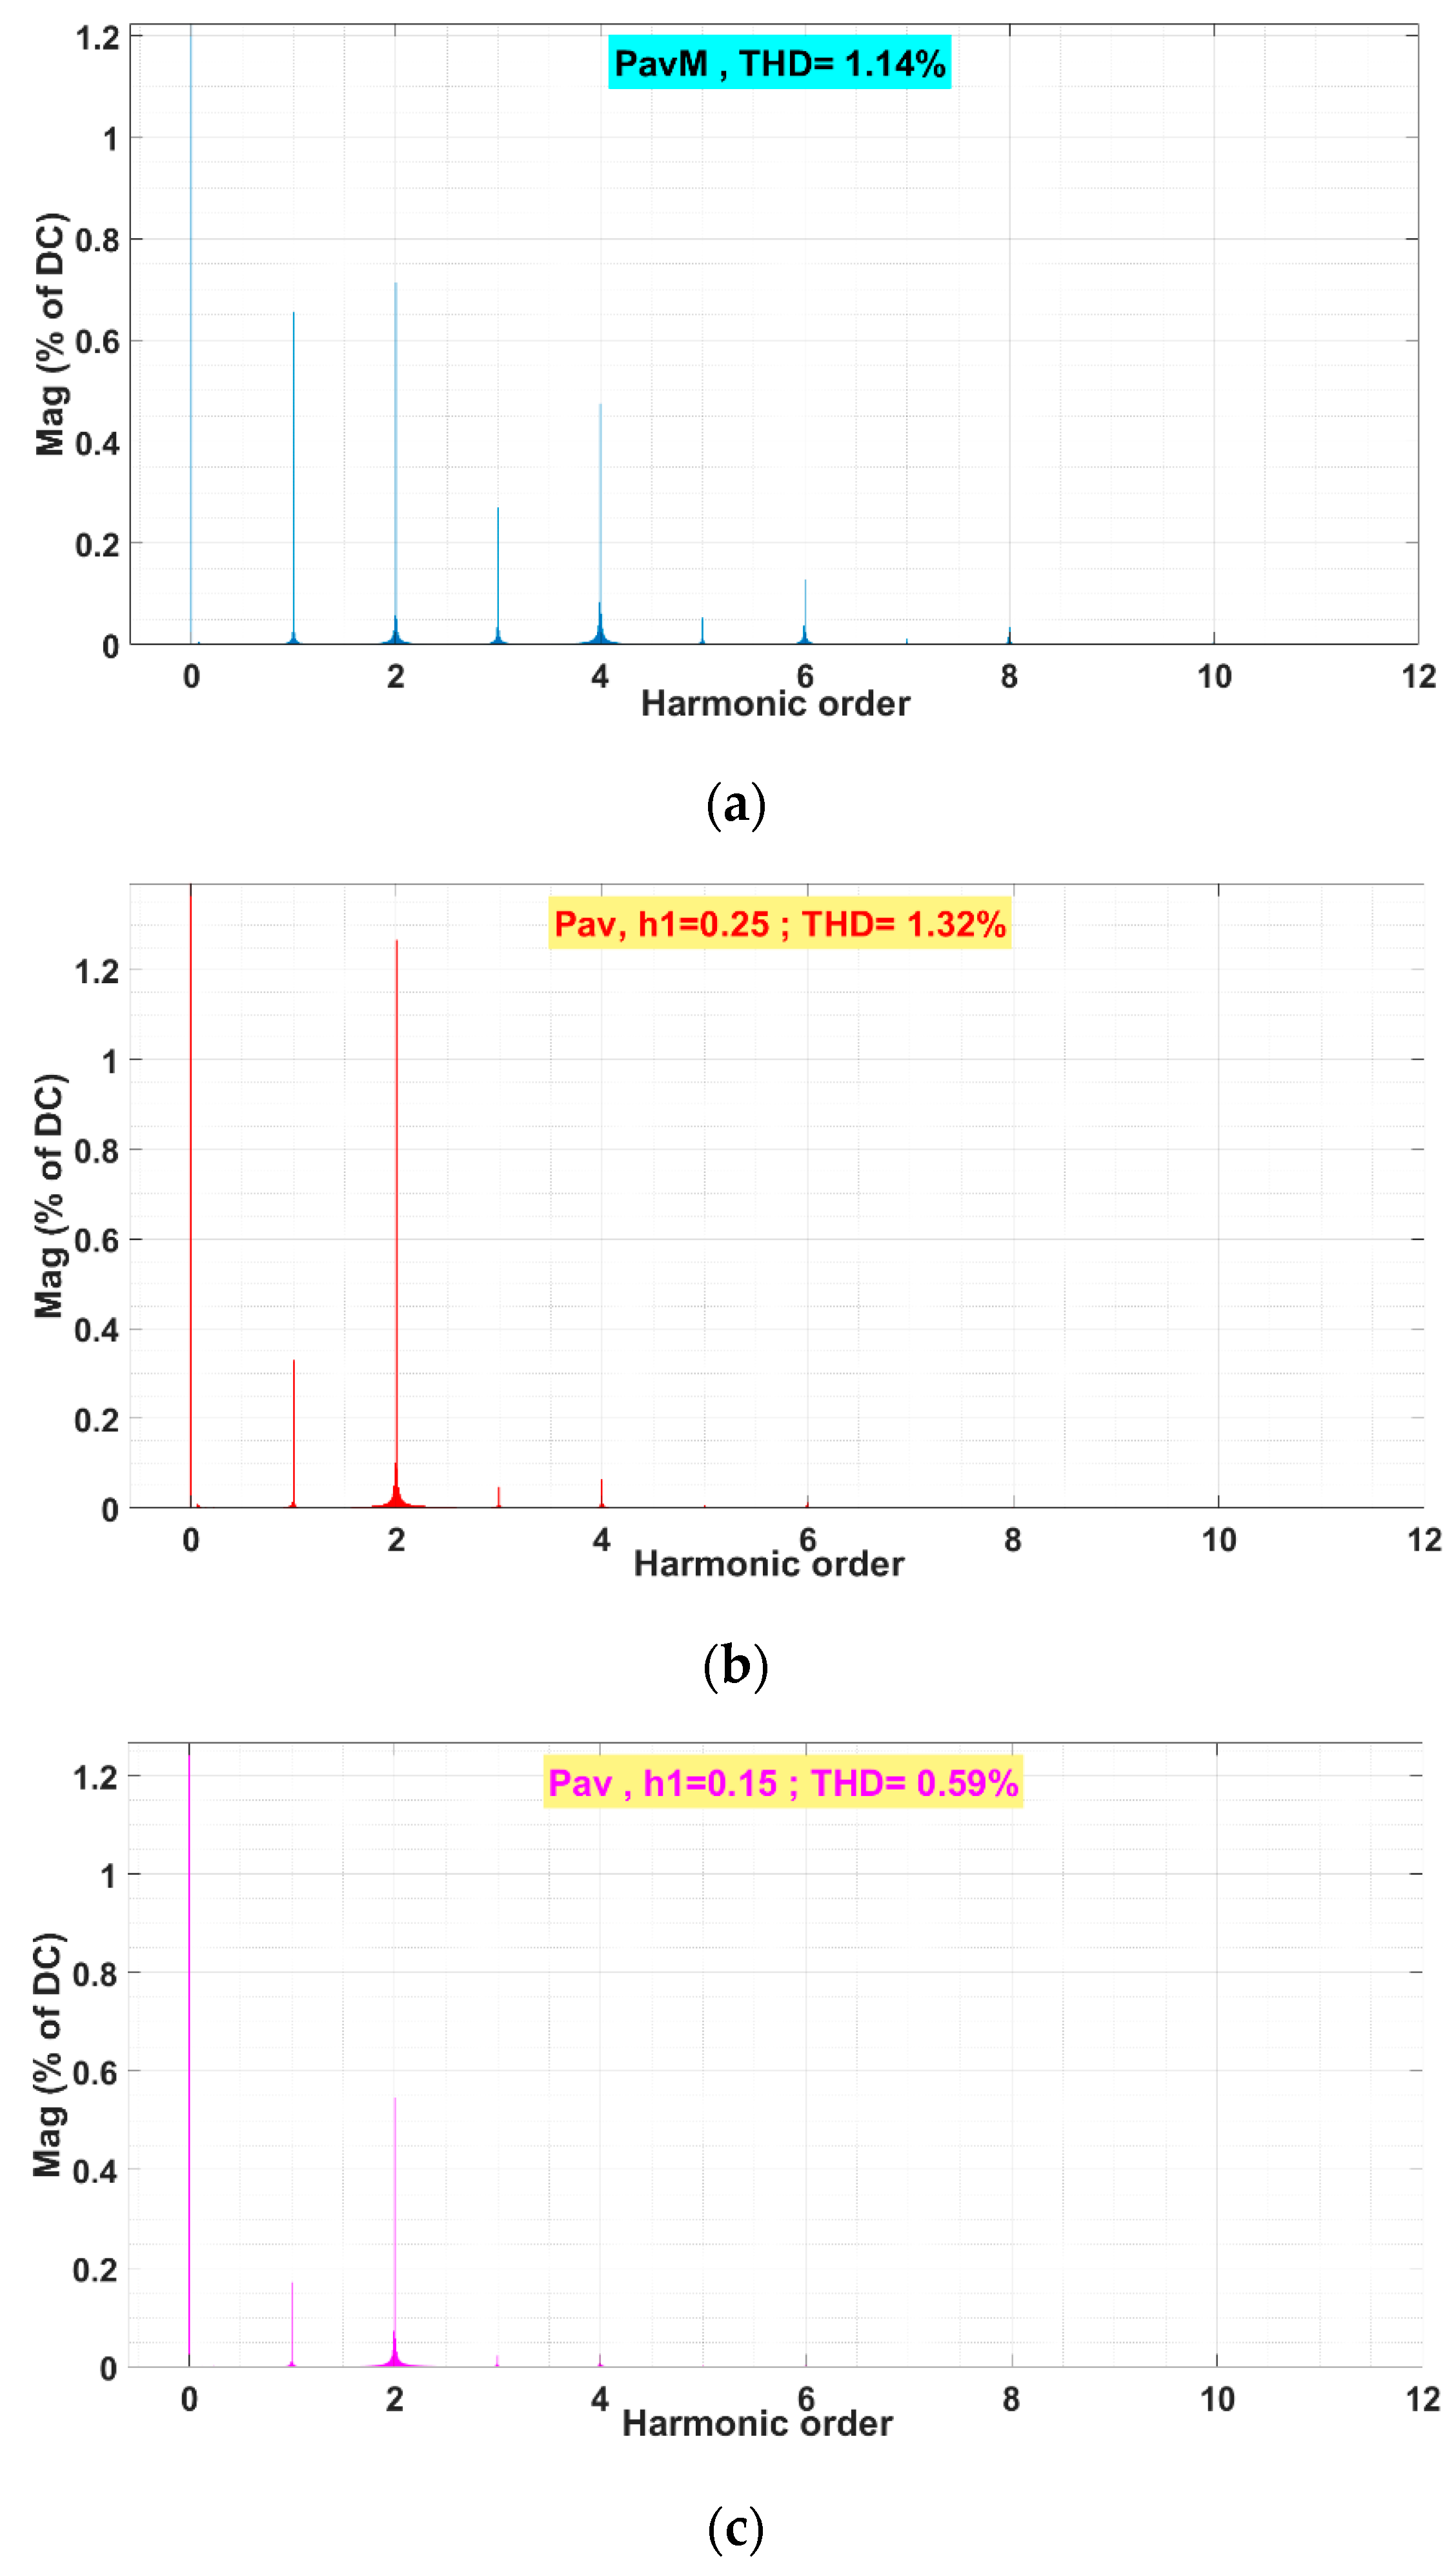
In Figure 10, the spectrum and the steady-state THDs of Pav and PavM are compared. From the observation of Figure 9 and Figure 10, it is deduced that, for 0.15 h 1 < 0.25 , there is a family of Pav calculations that result to be faster and more accurate than PavM.
The study of the reactive power quantities is done with h2 = 0.1, ξ p = 0.7075 and with ξ i   = 0.2. Figure 11 shows the calculation of Qav, QavM, QavT, and QavC when the abrupt load change occurs.
Figure 11a shows that QavM is the worst option in terms of steady-state ripple when supplying the NLL. Moreover, Qav presents a similar time response than QavM and the lowest steady-state ripple (see Figure 11b). Thus, similarly to the active power calculation, if the transient time needs to be reduced, that will succeed at the cost of a higher ripple. Nevertheless, although the reactive power calculation is necessary for the droop control, a variation of less than 10 VAr barely influences the droop reference generation due to the nature of the NLL. Considering the calculated mean value of Pav and Qav, it can be extracted a power factor (PF) equals to 0.9976. If the value of Qav increases up to 35 VAr, then PF = 0.9928. Although the load has not been characterized according to the PF, it indicates that the reactive power variations in mean value barely influence its value.
Then, it is deduced that the proposed calculation method for Pav can be faster than PavM for a range of values of ξ i and h1, keeping ξ p   = 0.7075. Moreover, when increasing the SOGI1-LPF capability, it maintains a better or similar settling-time while reducing the steady-state ripple. Thus, when Pav reaches a similar settling-time of that of PavM by reducing the h1 parameter, the THD falls from 1.32% to 0.59% (Figure 10). The commented results are shown in Table 4:
As it can be seen in Table 4, Pav settling-time is 37.5% shorter than PavM when ξ i = 0.2   a n d   h 1 = 0.25 with a similar ripple (Figure 11c). The time-delay for both calculations is almost the same, 38 ms for PavM and 40 ms for Pav. Then, when h 1 = 0.15 , the THD falls drastically down to 0.59% while keeping an 18% shorter settling-time. However, in this last case, the time-delay is higher in 20% for the Pav calculation concerning PavM. For this final reason, the chosen set of parameters for comparing Pav against PavM is are ξ i = 0.2 ,   ξ p = 0.7075 ,   h 1 = 0.25 .
On the other hand, the simulation results for the reactive power calculation algorithms are compared in Table 5, in terms of settling-time and comparing its steady-state ripple through a THD, with respect to the DC component analysis.
Table 5 shows how the conventional droop method, QavC, is the best option for reducing steady-state ripple in reactive power. However, its settling-time is the worst with a value of 780 ms. On the other hand, the best time is achieved by the QavM algorithm but at the cost of a higher THD = 7.85%. The conclusion is that the calculation of Q is more accurate through the proposed algorithm, with similar transient velocity. Therefore, the chosen set of parameters for the proposed algorithm is as follows:
ξ i = 0.2   ,   ξ p = 0.7075 ,   h 1 = 0.25   and   h 2 = 0.1
The next section pretends to assess the obtained results from the carried out simulations.

7. Hardware in the Loop Assessment

For the assessment of the proposed algorithm, HIL tests are carried out. Those tests compare the calculation of PavM and QavM against Pav and Qav with the chosen parameters from the simulations.
For this purpose, a real-time interface platform based on dSPACE 1006© (dSPACE Inc.50131 Pontiac Trail Wixom, MI, USA 48393-2020) digital platform is operated. The control structure presented in Figure 2 is firstly discretized in Matlab/Simulink/SimPowerSystems© (The MathWorks Inc., Natick, MA, USA) and then compiled in C code for its download in the dSPACE. Moreover, this RTI platform supports the model libraries of physical/electrical plants from Matlab/Simulink/SimPowerSystems© (The MathWorks Inc., Natick, MA, USA). Those libraries correspond to the modeled H-bridge, the LCL filter, and the NLL under test. The electronic central unit (ECU) of the dSPACE compiles the control algorithms on its multiprocessor core. The control-desk software permits the configuration and control of the tests, acting as a human–machine interface. The switching frequency of 10 kHz for the VSI is emulated, setting the sample time at Ts = 100 µs. Note that the discretization of the integrators employed in the SOGI has been achieved through a third-order method:
T s 12 · 5 z 3 16 z 2 + 23 z 1 1 z 1
A first HIL Test-1 is then carried out to compare the proposed algorithm against PavM, PavT, and PavC. The parameters for Pav are listed in Table 6.
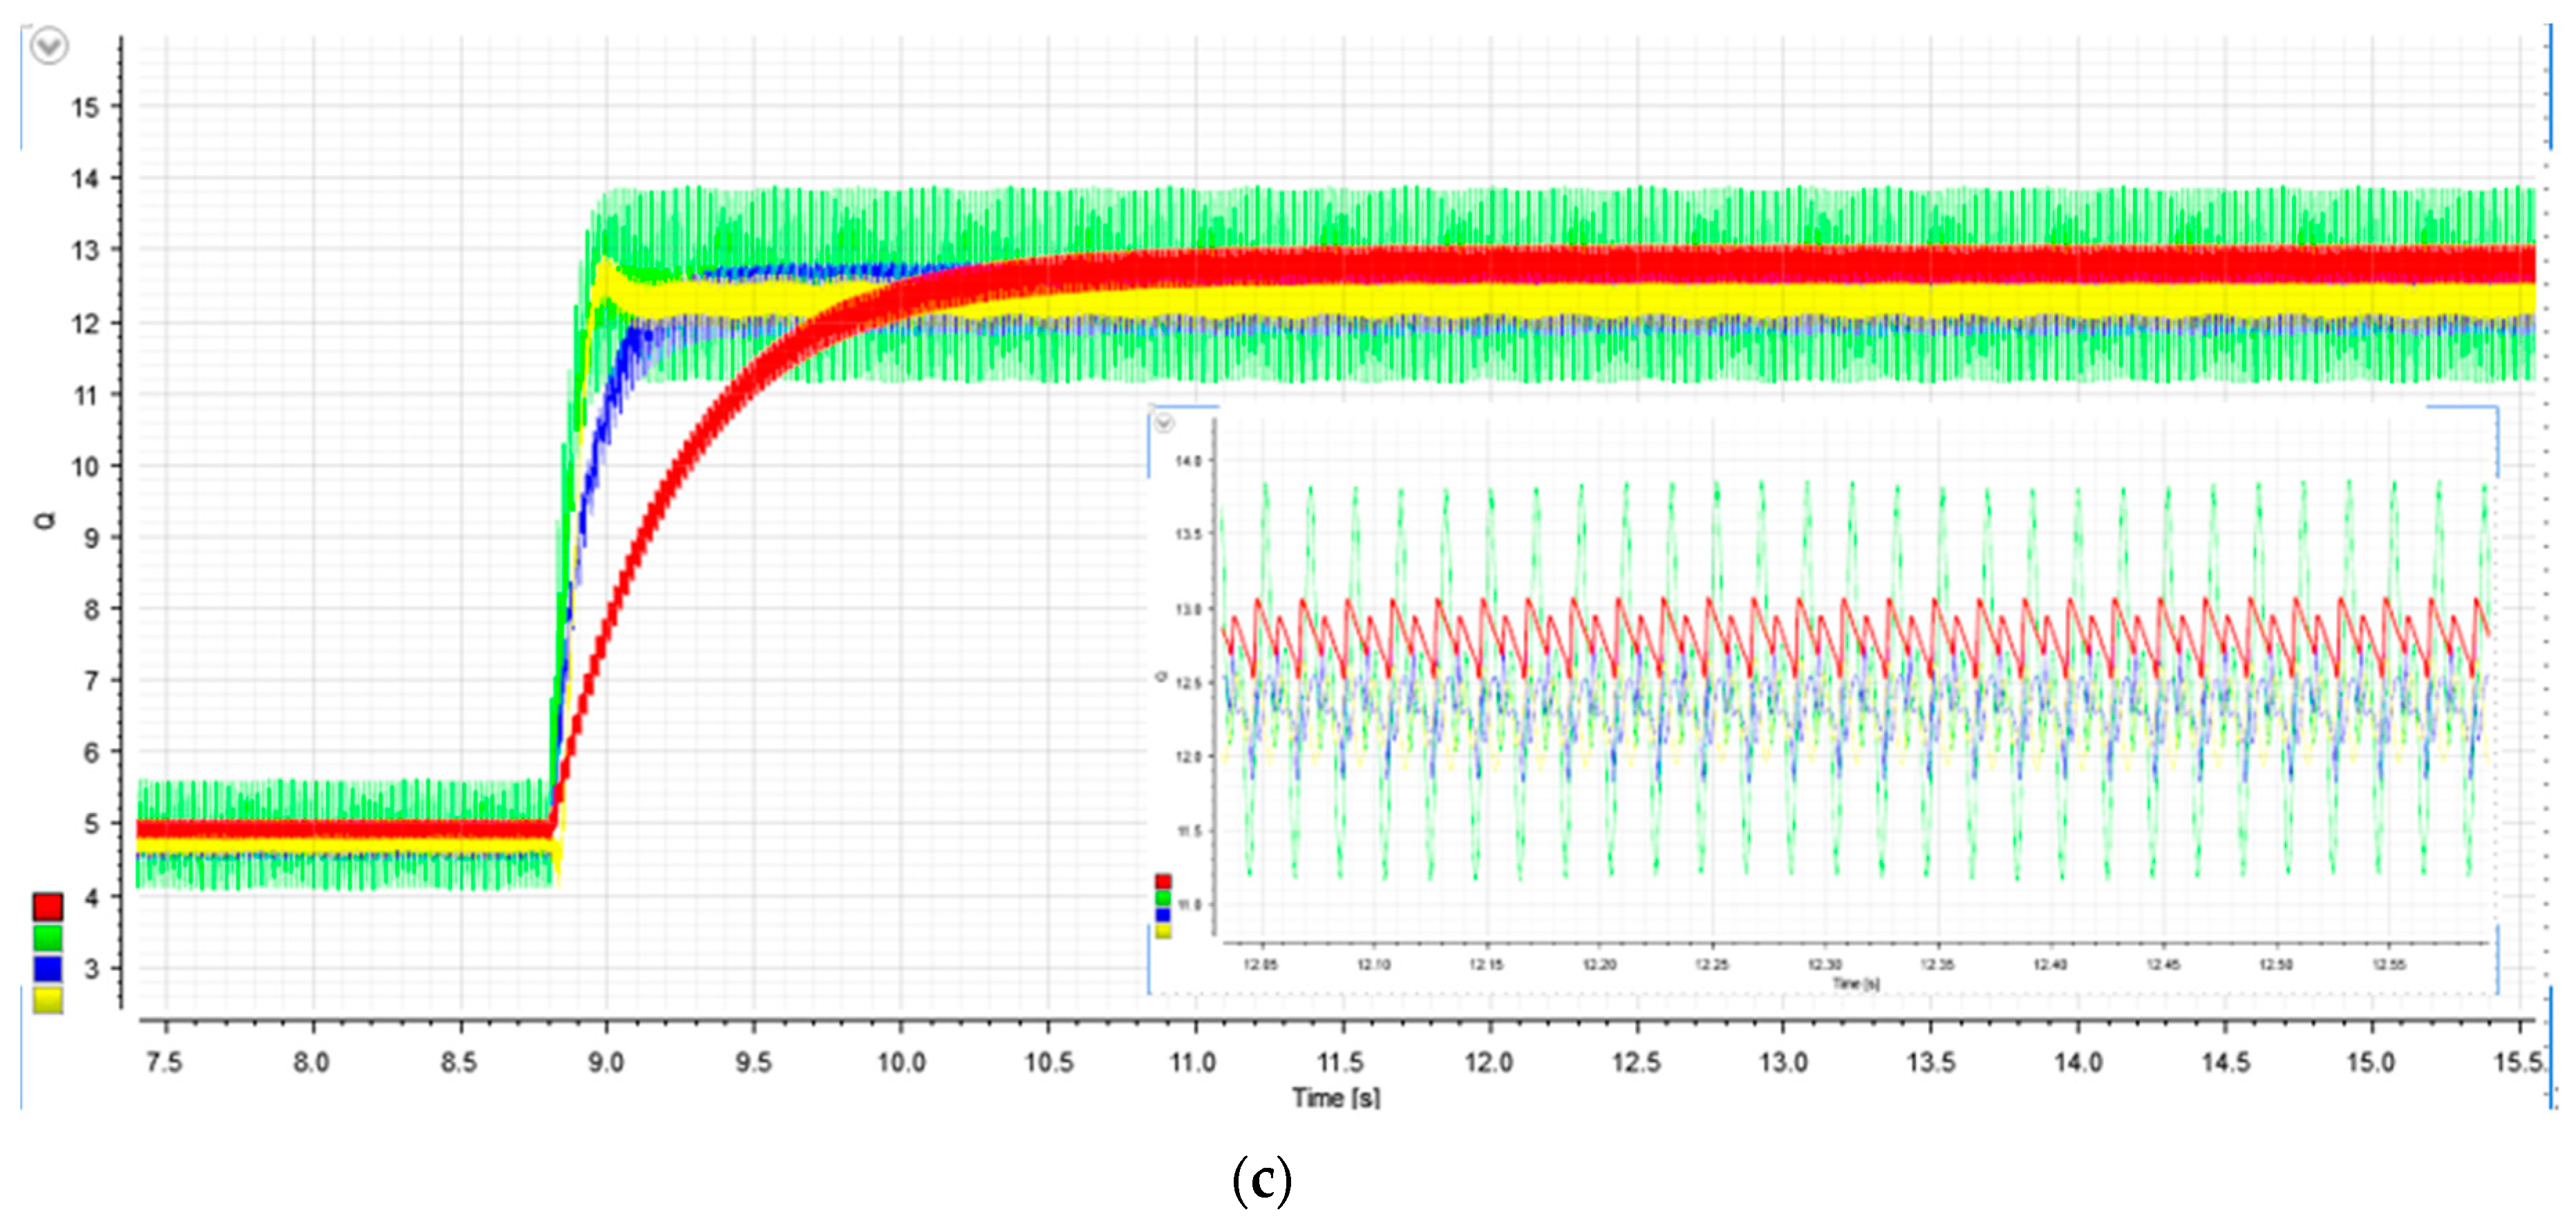
Figure 12 shows the load current plots; the active and reactive power after an abrupt load change is done manually.
Figure 12a corresponds to the current in the asymmetric NLL, with peaks of +2.85A and −1.8A after the load step.
Then, in Figure 12b, Pav is compared against PavM, PavT, and PavC. The shortest transient response corresponds to Pav, while the steady-state ripple is kept constant.
Figure 12c shows the transient response for the calculated reactive powers. There, it can be appreciated that the response rapidity is similar between Qav and QavM. Moreover, the lowest steady-state ripple corresponds to Qav. The relevant comparison here is between the proposed algorithm and that based on Reference [35]. The results are exposed in Table 7.
The settling-time for Pav is shorter in 35.7% with respect to PavM, similar to the simulation results with the same control parameters. The time-delay was found to be similar for Pav and PavM. However, in the reactive power, this time-delay is larger for Qav than for QavM, even when the Qav settling-time is a 7.1% minor than QavM.
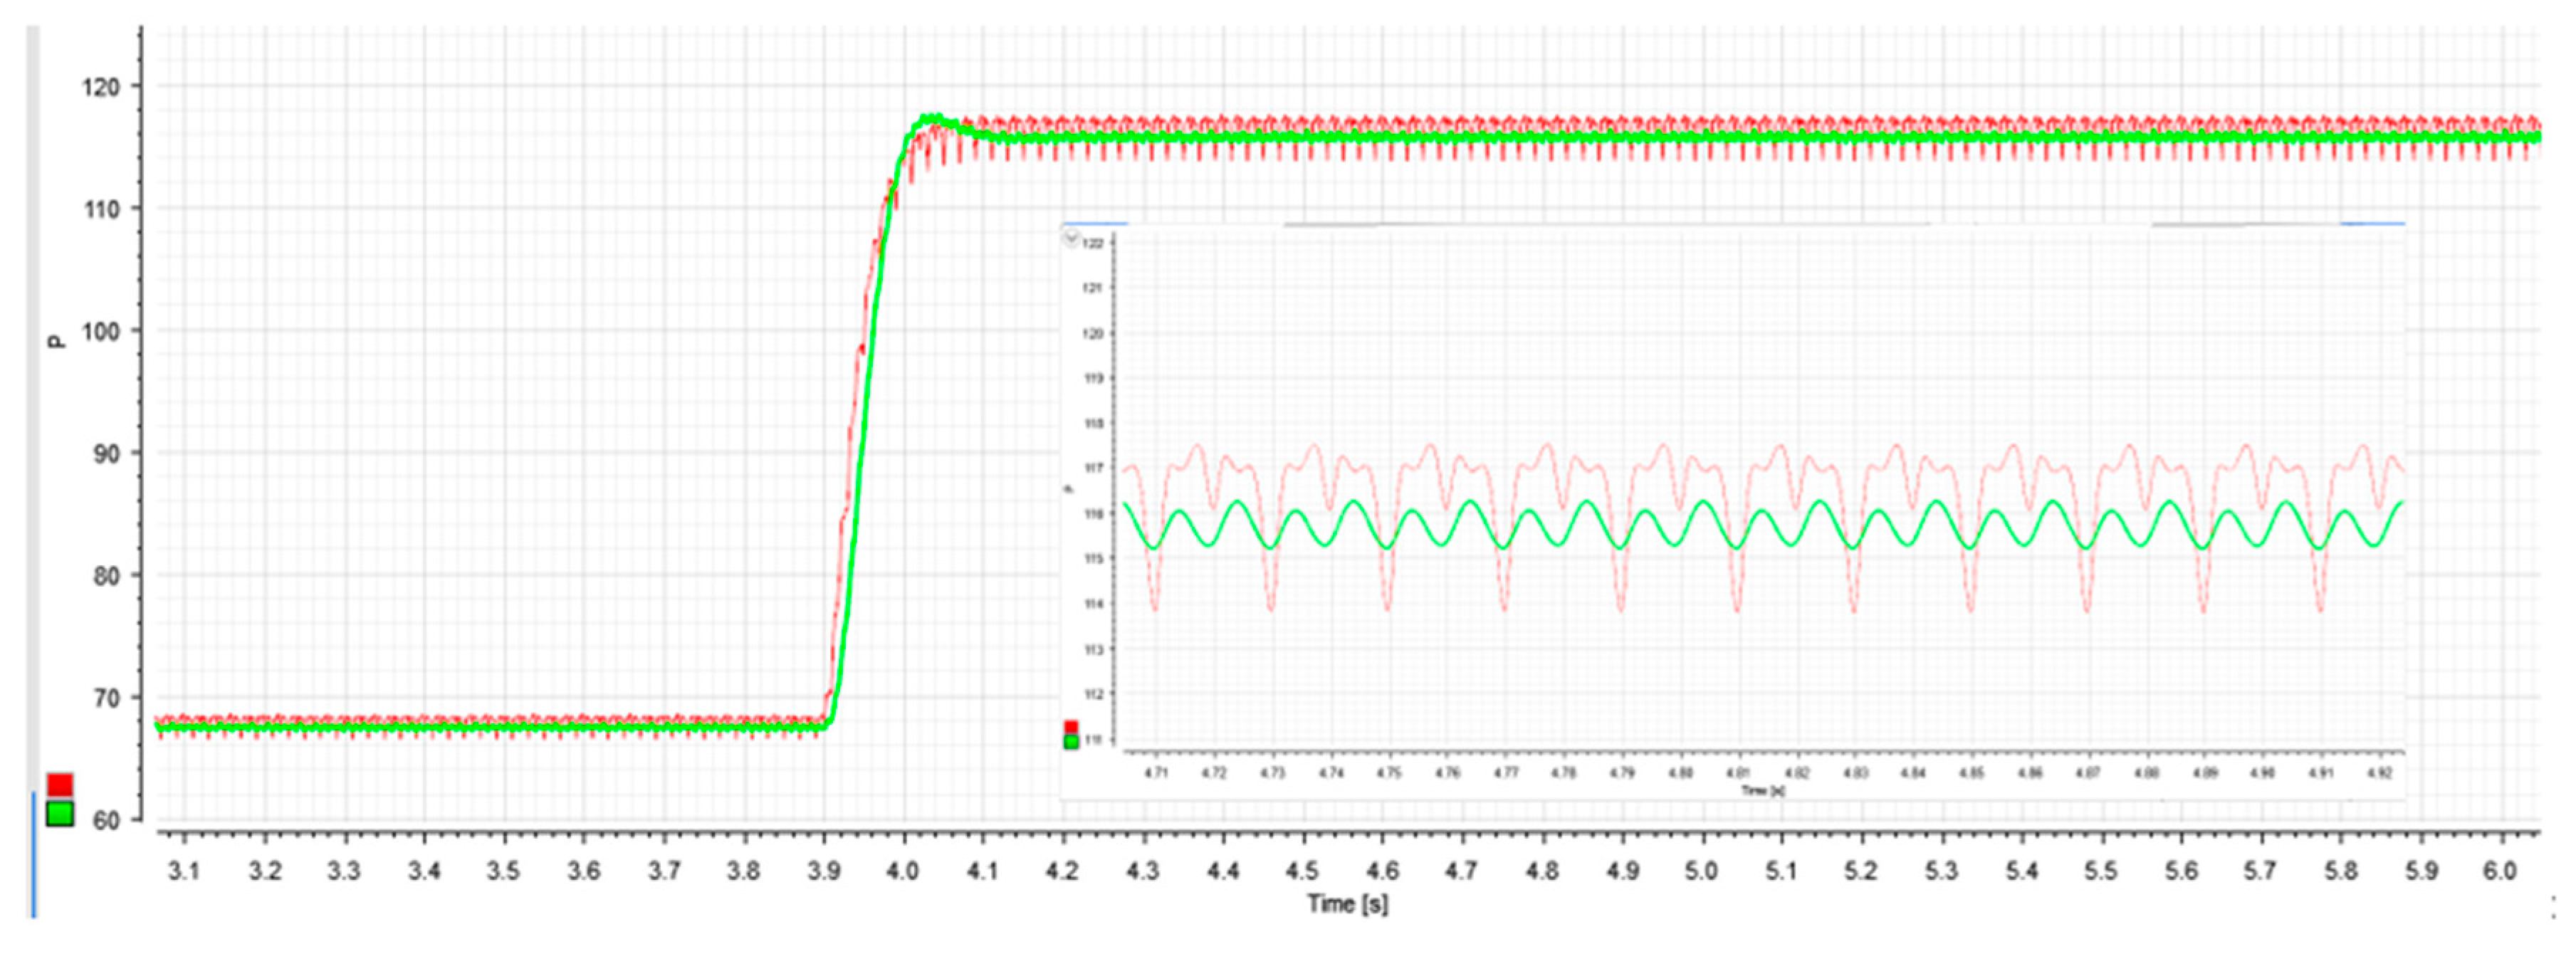
A second HIL Test-2 is carried out, reducing the h1 to 0.15 for Pav, to assess the simulation tests achieved in this sense. Figure 13 shows the active power responses during an abrupt load change.
Figure 13 shows that a low h1 coefficient in Pav allows a smaller steady-state ripple while maintaining a similar settling-time both for active and reactive powers, Figure 13 and Figure 12c, respectively. However, the time-delay for Pav is 50 ms, superior to the reported 40 ms in Table 7 for PavM.

8. Experimental Results

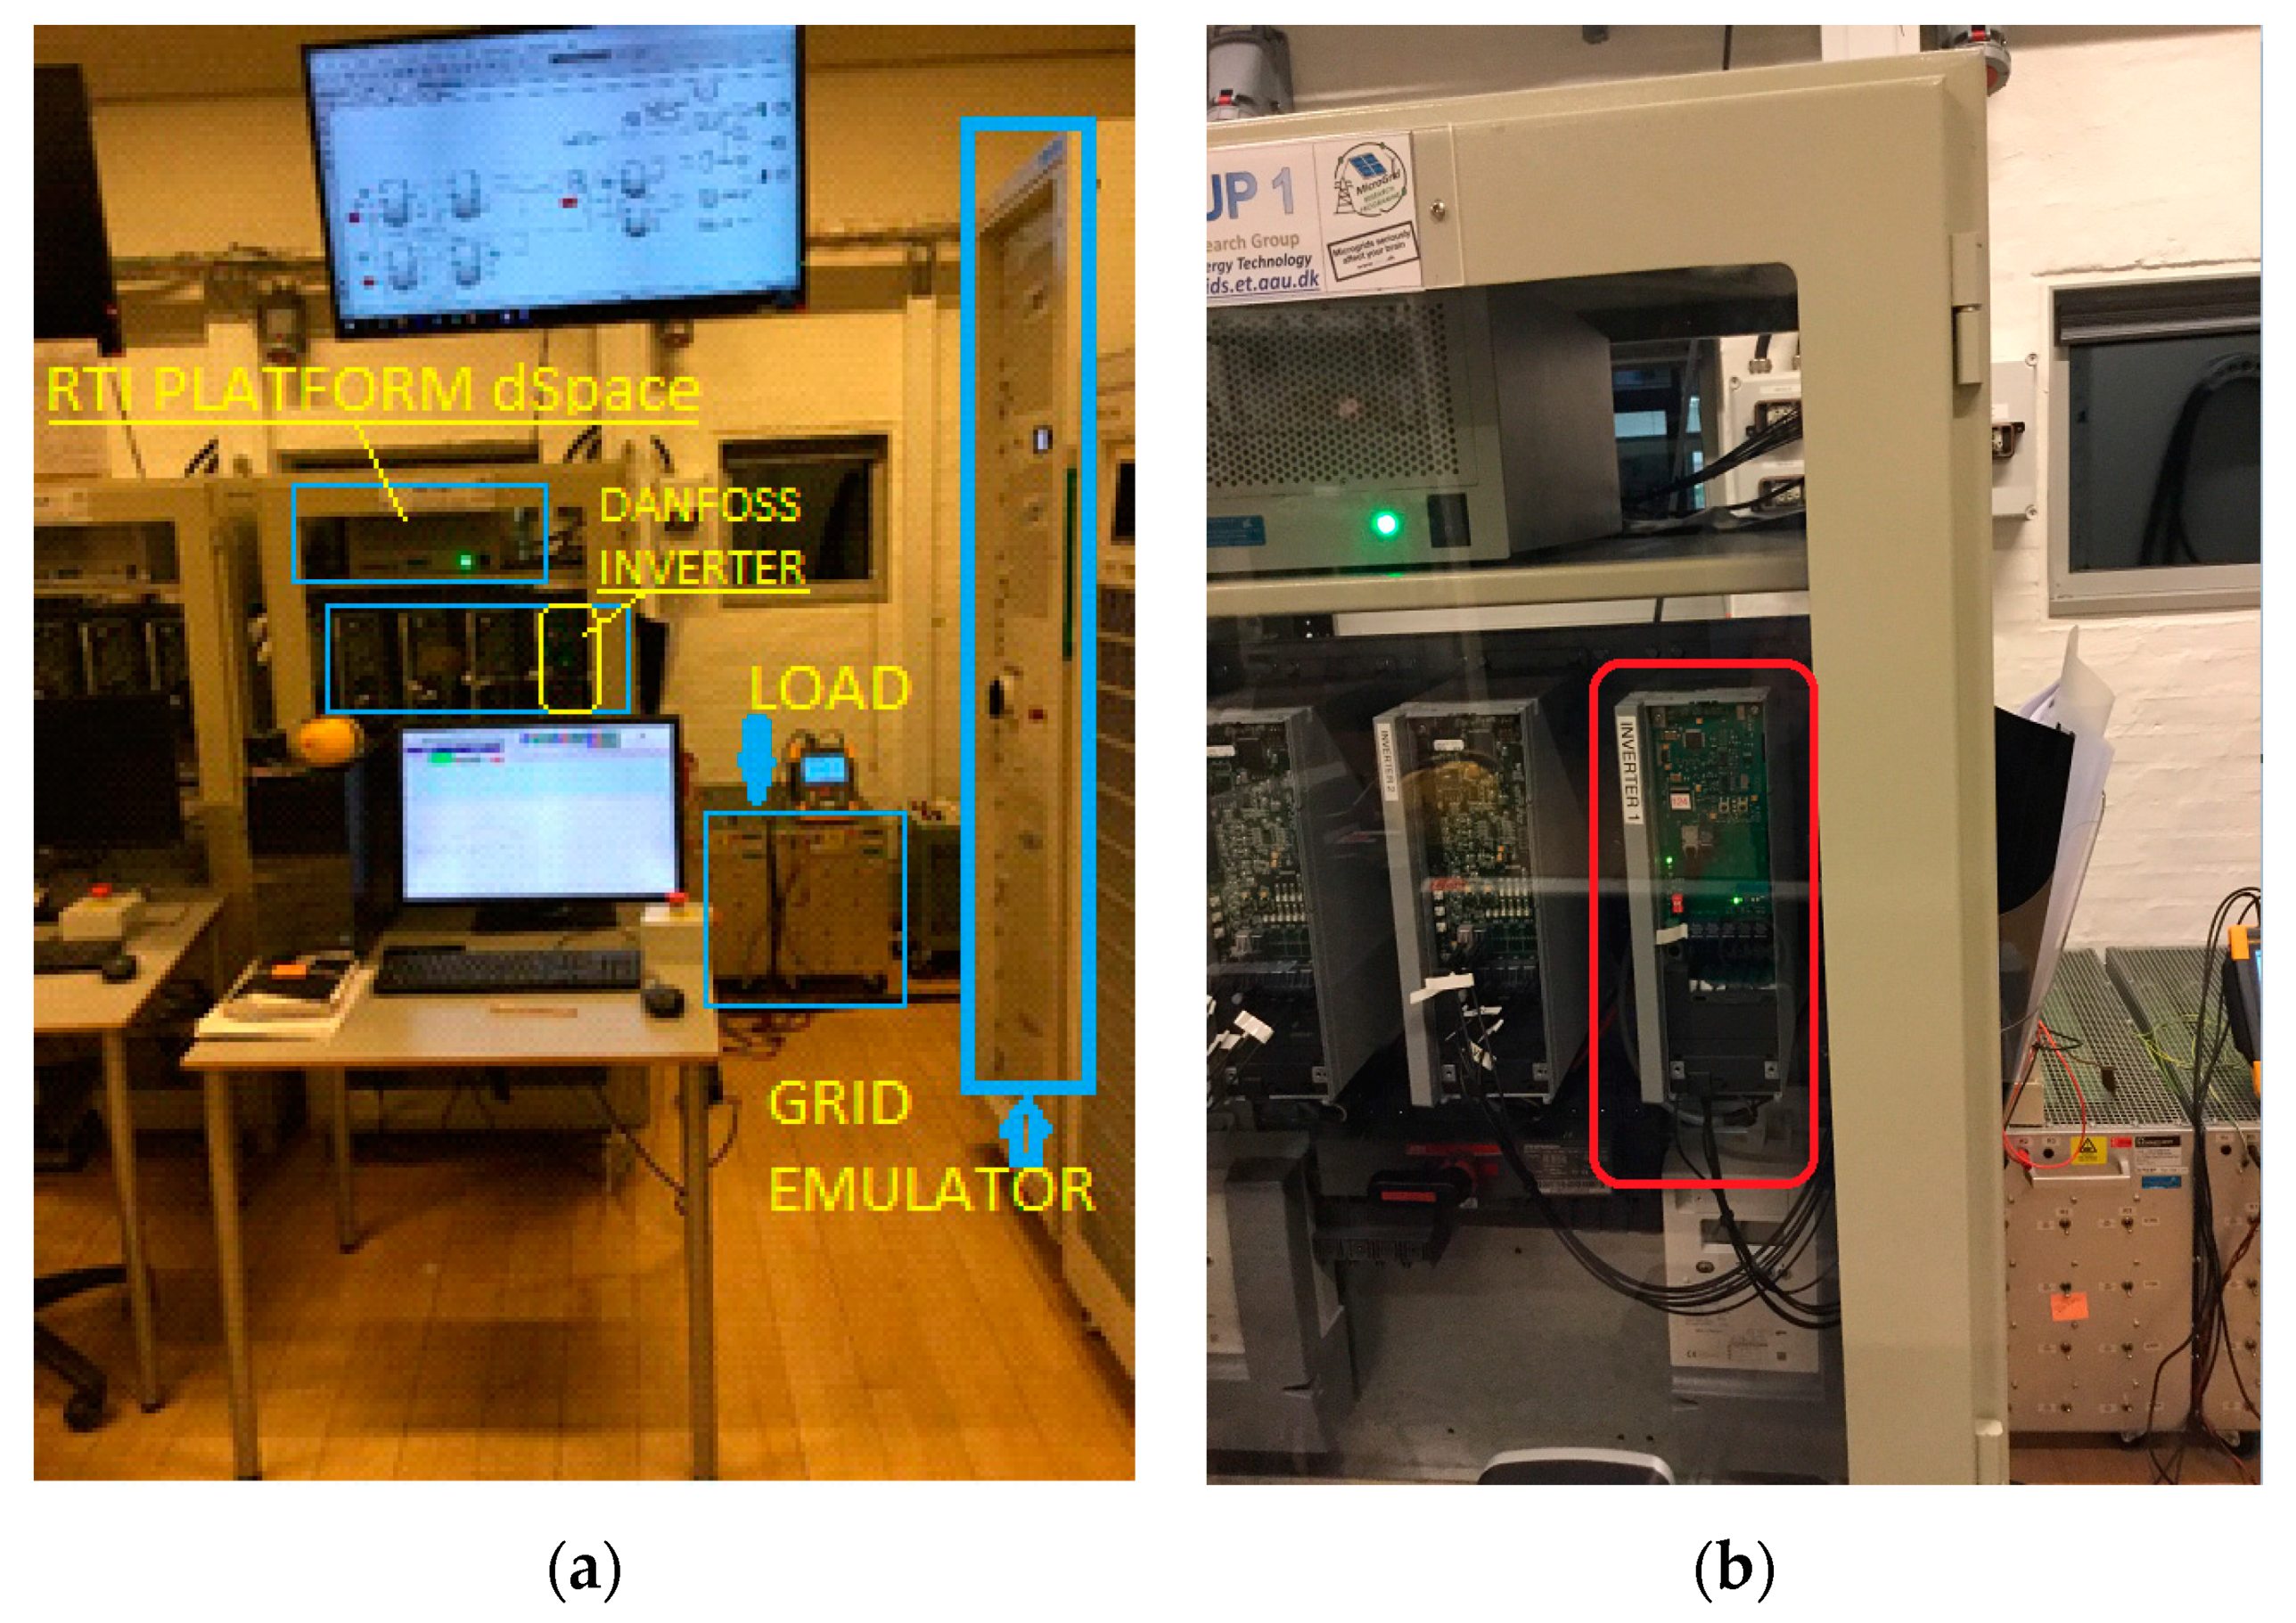
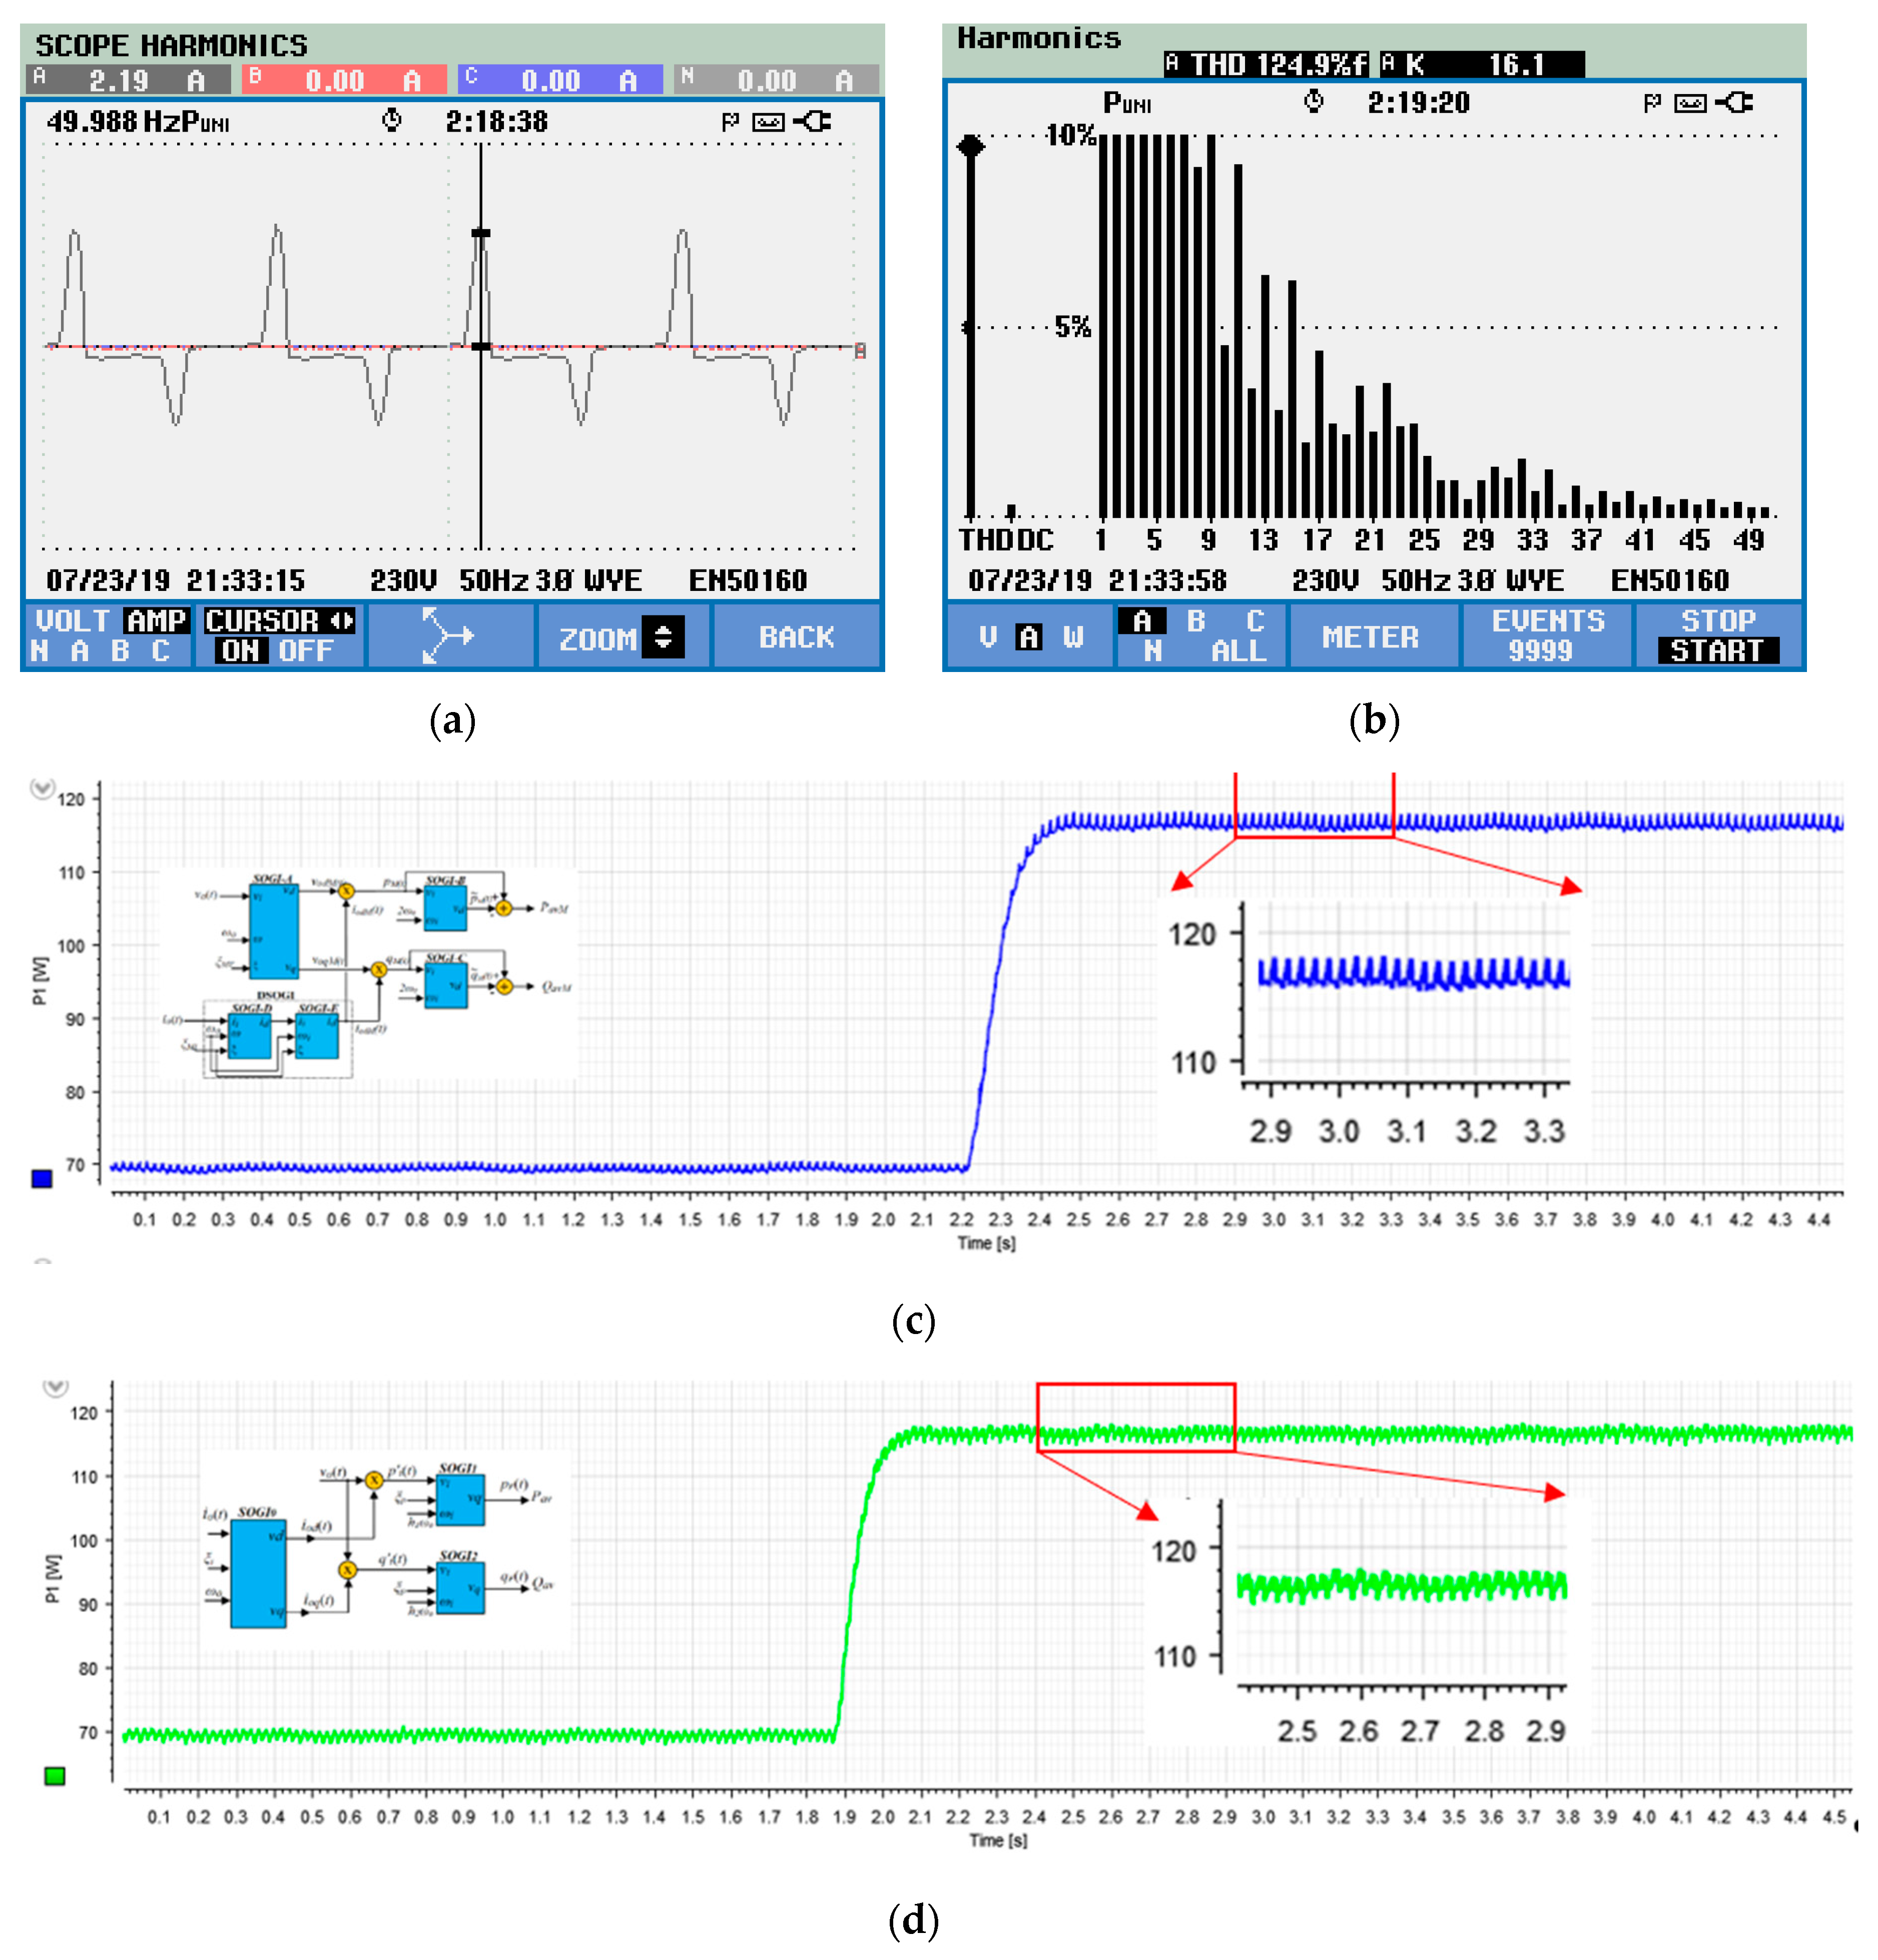
An experimental test was carried out, employing the load described in Table 2. The experimental setup is prepared to evaluate the model simulated and HIL-assessed for the active power calculation in the presence of a measured TDD = 124.9% in current at the PCC. The experimental setup is shown in Figure 14. It is composed of a VSI Danfoss© FC302, 2.2 kW rated, interfaced to a real-time dSPACE 1006 platform, for the switching signals for the H-bridge and the measured parameters. The current of the NLL was monitored by using a Fluke 435-II Power Quality and Energy Analyzer. The power calculation algorithms tested correspond to PavM and Pav. The results obtained are displayed in Figure 15 and Table 8.
First of all, the load draws an asymmetrical current, as shown in Figure 15a, with +2.19A/−1.46A peak values. The difference between the measured and the simulated and HIL tested current is due to power losses in the whole system.
Figure 15b shows the harmonic spectrum measured by employing a Fluke 435-II Power Quality and Energy Analyzer, which yields a TDD = 124.9%, compatible with the simulated in Figure 3b.
Figure 15c presents the PavM calculation, with the detail of the steady-state ripple. In the same manner, Figure 15d shows the proposed Pav calculation, with the detail of its steady-state ripple. Note that the transient for Pav results faster than for PavM, as expected. The measured settling-times are exposed in Table 8, along with the simulation and HIL results for active power.
The Simulation, the HIL test and experimental results for the settling-time in active power calculation are resumed in Table 8. The results compared here correspond to the Pav and PavM keeping the same steady-state ripple. The proposed Pav results to be 37.5% faster than PavM in the Simulation, 35.7% in the HIL tests, and 30% in the experimental test. The settling-time measured in the experimental test is a 40% higher than the obtained in the simulation, for Pav. In contrast, the measured settling-time for the HIL test is 16.67% higher than the simulated for Pav. Those differences are attributed to the 3rd order integrator employed both in HIL and the experimental setup. For the experimental setup, it may be considered latencies due to the internal communications and data acquisition boards, as well as nominal values biases of components and energy losses.

9. Conclusions

The proposed method enhances the dynamical performance in terms of rapidity and accuracy of the droop-based local control, which degrades in the presence of NLLs like the employed in this work, which was characterized considering IEEE std 519–2014. Only PavM demonstrated its suitability in the presence of NLL in Reference [35], focusing the calculation effort on the obtention of the fundamental component of the current and avoiding a final LPF stage. However, this previous work did not differentiate types of NLL. Oppositely, the proposed method characterizes the NLL, and then the algorithm architecture is decided. Thus, the implemented algorithm results less complex than those compared with, when supplying an NLL.
The proposed algorithm was compared with the previously studied algorithms and assessed through Matlab/Simulink simulation and a HIL test. Finally, an experimental test for the active power Pav and PavM was carried out to evaluate the proposed model. The main conclusions after analyzing the simulation, HIL, and experimental results are summarized as follows, in terms of transient response velocity and steady-state accuracy:
Velocity:
  • Reduction of settling-time in 30% for the calculation of Pav with respect to PavM [35] while keeping a similar steady-state ripple (Table 8).
Accuracy:
  • Active Power: Reduction in 47.78% of the steady-state calculated THD with respect to DC in the simulations for Pav, when the settling-time is similar (Table 4).
  • Reactive Power: Reduction in 68.66% of the steady-state calculated THD with respect to DC in the simulations for Qav, when the settling-time is similar (Table 5).
As expected, the settling-time for the Pav calculation during an abrupt load change resulted in being smaller than the other compared methods. Moreover, from Table 8, it can be seen how the relative reduction of settling-time was preserved in all the scenarios, i.e., between 30% and 37.5%. That leads to a faster operation in the droop controlled VSI in the presence of high TDD NLLs, which points to an increase in single-phase MG stability when sharing NLLs.
Concerning the enhancement of the accuracy, it is noteworthy that the calculation of Qav results to be more accurate than the other methods, see Table 5. Regarding the active power calculation, the steady-state ripple can be smoother by reducing the settling-time for Pav, see Figure 8b and Figure 13.
Future investigations are intended to study the same issues when other NLL types are present, considering a well-known standard as IEEE std 519–2014. Further studies are also planned for the parallelization of single-phase VSI against different types of NLL to study its dynamic performance and control stability.

Author Contributions

Investigation, simulation results, and writing—original draft, J.E.M., Y.G., and J.M.; methodology and formal analysis, J.E.M., Y.G., J.M., H.M., and J.M.G.; writing—review and editing, J.E.M., Y.G., J.M., and H.M.; writing—response to reviewers, J.E., Y.G., and H.M.; software design, J.E.M., Y.G., J.M., and M.L.; laboratory setup, HIL, and experimental results, J.E.M., Y.G., and M.L.; data curation, J.E.M. and M.L.; laboratory organization and supervision, Y.G., M.L., and J.M.G. All authors have read and agreed to the published version of the manuscript.

Funding

This research received no external funding

Conflicts of Interest

The authors declare no conflict of interest.

References

  1. U.S. Department of Energy. The Smart Grid: An Introduction; DOE: Washington, DC, USA, 2003. [Google Scholar]
  2. European Commission; Directorate-General for Research. European Technology Platform SmartGrids: Vision and Strategy for Europe’s Electricity Networks of the Future; Office for Official Publications of the European Communities: Luxembourg, 2006. [Google Scholar]
  3. Sustainable Development Goal 7 (SDG). Available online: https://sustainabledevelopment.un.org/sdg7 (accessed on 4 September 2020).
  4. Kumar, N.M.; Chopra, S.S.; Chand, A.A.; Elavarasan, R.M.; Shafiullah, G. Hybrid Renewable Energy Microgrid for a Residential Community: A Techno-Economic and Environmental Perspective in the Context of the SDG7. Sustainability 2020, 12, 3944. [Google Scholar] [CrossRef]
  5. Manoj Kumar, N.; Ghosh, A.; Chopra, S.S. Power Resilience Enhancement of a Residential Electricity User Using Photovoltaics and a Battery Energy Storage System under Uncertainty Conditions. Energies 2020, 13, 4193. [Google Scholar] [CrossRef]
  6. Kumar, S.A.; Subathra, M.S.P.; Kumar, N.M.; Malvoni, M.; Sairamya, N.J.; George, S.T.; Suviseshamuthu, E.S.; Chopra, S.S. A Novel Islanding Detection Technique for a Resilient Photovoltaic-Based Distributed Power Generation System Using a Tunable-Q Wavelet Transform and an Artificial Neural Network. Energies 2020, 13, 4238. [Google Scholar] [CrossRef]
  7. Ton, D.T.; Smith, M.A. The U.S. Department of Energy’s Microgrid Initiative. Electr J. 2012, 25, 84–94. [Google Scholar] [CrossRef]
  8. Lasseter, R.H. Microgrids. In Proceedings of the 2002 IEEE Power Engineering Society Winter Meeting, New York, NY, USA, 27–31 January 2002; pp. 305–308. [Google Scholar]
  9. Ali, A.; Li, W.; Hussain, R.; He, X.; Williams, B.W.; Memon, A.H. Overview of Current Microgrid Policies, Incentives and Barriers in the European Union, United States and China. Sustainability 2017, 9, 1146. [Google Scholar] [CrossRef] [Green Version]
  10. IEEE Power and Energy Society. IEEE Power and Energy Society. IEEE Standard for the Specification of Microgrid Controllers. In IEEE Std 2030.7; IEEE: Piscataway, NJ, USA, 2017; pp. 1–43. [Google Scholar]
  11. Cigré. Microgrids 1 Engineering, Economics, & Experience; WG C6.22; Cigré: Paris, France, 2015; ISBN 9782858733385. [Google Scholar]
  12. Carpintero-Rentería, M.; Santos-Martín, D.; Guerrero, J.M. Microgrids Literature Review through a Layers Structure. Energies 2019, 12, 4381. [Google Scholar] [CrossRef] [Green Version]
  13. De Oliveira Costa Souza Rosa, C.; Costa, K.A.; Christo, E.D.S.; Bertahone, P.B. Complementarity of Hydro, Photovoltaic, and Wind Power in Rio de Janeiro State. Sustainability 2017, 9, 1130. [Google Scholar] [CrossRef] [Green Version]
  14. Kanase-Patil, A.B.; Saini, R.; Sharma, M. Integrated renewable energy systems for off grid rural electrification of remote area. Renew. Energy 2010, 35, 1342–1349. [Google Scholar] [CrossRef]
  15. Shan, Y.; Hu, J.; Liu, M.; Zhu, J.; Guerrero, J.M. Model Predictive Voltage and Power Control of Islanded PV-Battery Microgrids With Washout-Filter-Based Power Sharing Strategy. IEEE Trans. Power Electron. 2020, 35, 1227–1238. [Google Scholar] [CrossRef]
  16. Angelopoulos, A.; Ktena, A.; Manasis, C.; Voliotis, S. Impact of a Periodic Power Source on a RES Microgrid. Energies 2019, 12, 1900. [Google Scholar] [CrossRef] [Green Version]
  17. Rocabert, J.; Luna, A.; Blaabjerg, F.; Rodriguez, P. Control of Power Converters in AC Microgrids. IEEE Trans. Power Electron. 2012, 27, 4734–4749. [Google Scholar] [CrossRef]
  18. Guerrero, J.M.; Vasquez, J.C.; Matas, J.; De Vicuna, L.G.; Castilla, M. Hierarchical Control of Droop-Controlled AC and DC Microgrids—A General Approach Toward Standardization. IEEE Trans. Ind. Electron. 2011, 58, 158–172. [Google Scholar] [CrossRef]
  19. De Brabandere, K.; Vanthournout, K.; Driesen, J.; Deconinck, G.; Belmans, R. Control of microgrids. In Proceedings of the 2007 IEEE Power Engineering Society General Meeting, Tampa, FL, USA, 24–28 June 2007; pp. 1–7. [Google Scholar]
  20. Aghaee, F.; Dehkordi, N.M.; Bayati, N.; Hajizadeh, A.; Dehkordi, M. Distributed Control Methods and Impact of Communication Failure in AC Microgrids: A Comparative Review. Electronics 2019, 8, 1265. [Google Scholar] [CrossRef] [Green Version]
  21. Zhang, L.; Chen, K.; Chi, S.; Lyu, L.; Cai, G. The Hierarchical Control Algorithm for DC Microgrid Based on the Improved Droop Control of Fuzzy Logic. Energies 2019, 12, 2995. [Google Scholar] [CrossRef] [Green Version]
  22. Ranjbaran, A.; Ebadian, M. A power sharing scheme for voltage unbalance and harmonics compensation in an islanded microgrid. Electr. Power Syst. Res. 2018, 155, 153–163. [Google Scholar] [CrossRef]
  23. Tavakoli, A.; Sanjari, M.J.; Kohansal, M.; Gharehpetian, G.B. An innovative power calculation method to improve power sharing in VSI based micro grid. In Proceedings of the Iranian Conference on Smart Grids, Tehran, Iran, 24–25 May 2012; pp. 3–7. [Google Scholar]
  24. Golestan, S.; Joorabian, M.; Rastegar, H.; Roshan, A.; Guerrero, J.M. Droop based control of parallel-connected single-phase inverters in D-Q rotating frame. In Proceedings of the 2009 IEEE International Conference on Industrial Technology, Gippsland, Australia, 10–13 February 2009; pp. 1–6. [Google Scholar]
  25. Arbab-Zavar, B.; Palacios-Garcia, E.J.; Vasquez, J.C.; Guerrero, J.M. Smart Inverters for Microgrid Applications: A Review. Energies 2019, 12, 840. [Google Scholar] [CrossRef] [Green Version]
  26. Wang, X.; Qing, H.; Huang, P.; Zhang, C. Modeling and Stability Analysis of Parallel Inverters in Island Microgrid. Electronics 2020, 9, 463. [Google Scholar] [CrossRef] [Green Version]
  27. Kim, J.-H.; Lee, Y.-S.; Kim, H.-J.; Han, B.-M. A New Reactive-Power Sharing Scheme for Two Inverter-Based Distributed Generations with Unequal Line Impedances in Islanded Microgrids. Energies 2017, 10, 1800. [Google Scholar] [CrossRef] [Green Version]
  28. Toub, M.; Bijaieh, M.M.; Weaver, W.W.; Robinett, R.D.; Maaroufi, M.; Aniba, G. Droop Control in DQ Coordinates for Fixed Frequency Inverter-Based AC Microgrids. Electronics 2019, 8, 1168. [Google Scholar] [CrossRef] [Green Version]
  29. Ren, B.; Sun, X.; Chen, S.; Liu, H. A Compensation Control Scheme of Voltage Unbalance Using a Combined Three-Phase Inverter in an Islanded Microgrid. Energies 2018, 11, 2486. [Google Scholar] [CrossRef] [Green Version]
  30. Ma, J.; Wang, X.; Liu, J.; Gao, H. An Improved Droop Control Method for Voltage-Source Inverter Parallel Systems Considering Line Impedance Differences. Energies 2019, 12, 1158. [Google Scholar] [CrossRef] [Green Version]
  31. Yang, N.; Paire, D.; Gao, F.; Miraoui, A.; Liu, W. Compensation of droop control using common load condition in DC microgrids to improve voltage regulation and load sharing. Int. J. Electr. Power Energy Syst. 2015, 64, 752–760. [Google Scholar] [CrossRef]
  32. Guerrero, J.; Matas, J.; Vicuna, L.G.; Castilla, M.; Miret, J. Decentralized Control for Parallel Operation of Distributed Generation Inverters Using Resistive Output Impedance. IEEE Trans. Ind. Electron. 2007, 54, 994–1004. [Google Scholar] [CrossRef]
  33. Yao, W.; Chen, M.; Matas, J.; Guerrero, J.M.; Qian, Z. Design and Analysis of the Droop Control Method for Parallel Inverters Considering the Impact of the Complex Impedance on the Power Sharing. IEEE Trans. Ind. Electron. 2011, 58, 576–588. [Google Scholar] [CrossRef]
  34. El Mariachet, J.; Matas, J.; de la Hoz, J.; Al-Turki, Y.; Abdalgader, H. Power Calculation Algorithm for Single-Phase Droop-Operated Inverters Considering Nonlinear Loads. Renew. Energy Power Qual. J. 2018, 1, 710–715. [Google Scholar] [CrossRef]
  35. El Mariachet, J.; Matas, J.; Martin, H.; Li, M.; Guan, Y.; Guerrero, J.M. A Power Calculation Algorithm for Single-Phase Droop-Operated-Inverters Considering Linear and Nonlinear Loads HIL-Assessed. Electronics 2019, 8, 1366. [Google Scholar] [CrossRef] [Green Version]
  36. Wang, H.; Yue, X.; Pei, X.; Kang, Y. A new method of power calculation based on parallel inverters. In Proceedings of the IEEE EPE-PEMC, Novi Sad, Serbia, 28–30 October 2009; pp. 1573–1576. [Google Scholar]
  37. Yu, W.; Xu, D.; Ma, K.A. Novel Accurate Active and Reactive Power Calculation Method for Paralleled UPS System. In Proceedings of the APEC, Singapore, 15–16 November 2009; pp. 1269–1275. [Google Scholar]
  38. Akagi, H.; Watanabe, E.; Aredes, M. Instantaneous Power Theory and Application to Power Conditioning; Wiley-IEEE Press: Piscataway, NJ, USA, 2007; pp. 5–28. [Google Scholar]
  39. Gao, M.; Yang, S.; Jin, C.; Ren, Z.; Chen, M.; Qian, Z. Analysis and experimental validation for power calculation based on p-q theory in single-phase wireless-parallel inverters. In Proceedings of the 2011 Twenty-Sixth Annual IEEE Applied Power Electronics Conference and Exposition (APEC), Fort Worth, TX, USA, 6–11 March 2011; pp. 620–624. [Google Scholar]
  40. Matas, J.; Castilla, M.; De Vicuna, L.G.; Miret, J.; Vasquez, J.C. Virtual Impedance Loop for Droop-Controlled Single-Phase Parallel Inverters Using a Second-Order General-Integrator Scheme. IEEE Trans. Power Electron. 2010, 25, 2993–3002. [Google Scholar] [CrossRef]
  41. Tolani, S.; Sensarma, P. An improved droop controller for parallel operation of single-phase inverters using R-C output impedance. In Proceedings of the 2012 IEEE International Conference on Power Electronics, Drives and Energy Systems (PEDES), Bengaluru, India, 16–19 December 2012; pp. 1–6. [Google Scholar]
  42. Cardoso, T.D.; Azevedo, G.M.S.; Cavalcanti, M.C.; Neves, F.A.S.; Limongi, L.R. Implementation of droop control with enhanced power calculator for power sharing on a single-phase microgrid. In Proceedings of the 2017 Brazilian Power Electronics Conference (COBEP), Juiz de Fora, Brazil, 19–22 November 2017; pp. 1–6. [Google Scholar]
  43. Yang, Y.; Blaabjerg, F. A new power calculation method for single-phase grid-connected systems. In Proceedings of the 2013 IEEE International Symposium on Industrial Electronics, Taipei, Taiwan, 28–31 May 2013; pp. 1–6. [Google Scholar]
  44. IEEE Power and Energy Society. IEEE Recommended Practice and Requirements for Harmonic Control in Electric Power Systems. In IEEE Std. 519-2014 (Revision of IEEE Std. 519-1992); IEEE: Piscataway, NJ, USA, 2014; pp. 1–29. [Google Scholar]
  45. Guan, Y.; Guerrero, J.M.; Zhao, X.; Vasquez, J.C.; Guo, X. A New Way of Controlling Parallel-Connected Inverters by Using Synchronous-Reference-Frame Virtual Impedance Loop—Part I: Control Principle. IEEE Trans. Power Electron. 2015, 31, 4576–4593. [Google Scholar] [CrossRef] [Green Version]
  46. Kullarkar, V.T.; Chandrakar, V.K. Power Quality Analysis in Power System with Non Linear Load. Int. J. Electr. Eng. 2017, 10, 33–45. [Google Scholar]
  47. Stošović, M.A.; Stevanović, D.; Dimitrijević, M. Classification of nonlinear loads based on artificial neural networks. In Proceedings of the 2017 IEEE 30th International Conference on Microelectronics (MIEL), Nis, Serbia, 9–11 October 2017; pp. 221–224. [Google Scholar]
  48. Salam, S.M.; Uddin, M.J.; Hannan, S. A new approach to develop a template based load model that can dynamically adopt different types of non-linear loads. In Proceedings of the 2017 International Conference on Electrical, Computer and Communication Engineering (ECCE), Cox’s Bazar, Bangladesh, 16–18 February 2017; pp. 708–712. [Google Scholar]
  49. Kneschke, T.A. Distortion and power factor of nonlinear loads. In Proceedings of the 1999 ASME/IEEE Joint Railroad Conference (Cat. No.99CH36340), Dallas, TX, USA, 15 April 1999; pp. 47–54. [Google Scholar]
  50. Shabbir, H.; Rehman, M.U.; Rehman, S.A.; Sheikh, S.K.; Zaffar, N. Assessment of harmonic pollution by LED lamps in power systems. In Proceedings of the 2014 Clemson University Power Systems Conference, Clemson, SC, USA, 11–14 March 2014; pp. 1–7. [Google Scholar]
  51. Normanyo, E. Mitigation of Harmonics in a Three-Phase, Four-Wire Distribution System using a System of Shunt Passive Filters. Int. J. Eng. Tech. 2012, 2, 761–774. [Google Scholar]
  52. Shahl, S.I. Simulation and Analysis Effects of Nonlinear Loads in the Distribution Systems. Int. J. Sci. Eng. Res. 2019, 10, 888–892. [Google Scholar]
  53. Micallef, A.; Apap, M.; Cyril, S.S.; Guerrero, J.M.; Vasquez, J.C. Reactive Power Sharing and Voltage Harmonic Distortion Compensation of Droop Controlled Single Phase Islanded Microgrids. IEEE Trans. Smart Grid 2014, 5, 1149–1158. [Google Scholar] [CrossRef]
Figure 1. Simplified scheme of a single-phase voltage source inverter (VSI) (Inv. #1) sharing a nonlinear load with a second inverter (Inv. #2), showing the Reference Generator Block that contains the active and reactive averaged powers (P–Q) calculation and the voltage reference generator for the pulse-width modulation (PWM) and control (CTRL) block (PWM + CTRL).
Electronics 09 01643 g001
Figure 2. Nonlinear load ZNL, consisting of an unbalanced diode-bridge rectifier that supplies to an R–C load, based on Reference [35].
Electronics 09 01643 g002
Figure 3. Scheme of a VSI with the existing approaches and the load’s distorted current: (a) block scheme of a single-phase VSI, showing the inner control loops of current and voltage, fed with the voltage reference generated by utilizing the Voltage Reference Generator block, based on References [45,53]; (b) nonlinear current harmonic distribution for ZNL without filtering, after S0 is turned on.
Electronics 09 01643 g003
Figure 4. Structure of second-order generalized integrator (SOGI) and bode diagrams with various damping factors: (a) structure of a SOGI with its damping factor, ξ , and center frequency, ω , where V in is the input signal, Vd the direct output signal, filtered by a band-pass filter (BPF); Vq the in-quadrature output signal, filtered by a low-pass filter (LPF). (b) Magnitude and phase Bode plots for BPF in (13), varying ξ from 0.1 to 0.9. (c) The magnitude and phase Bode plots for LPF in (14) varying ξ from 0.1 to 0.9.
Electronics 09 01643 g004
Figure 5. Three averaged active and reactive power calculation: (a) conventional droop P–Q calculation; (b) advanced P–Q calculation based on the schemes and algorithms reported in Reference [41]; and (c) P–Q calculation based on Reference [35].
Electronics 09 01643 g005
Figure 6. Proposed P–Q calculation algorithm scheme: (a) proposed algorithm scheme consisting of pre-filtering of the current, with only a SOGI, and a SOGI-LPF stage for each of the instantaneous powers calculated; (b) frequency-domain analytical representation for the proposed algorithm.
Electronics 09 01643 g006
Figure 7. Magnitude and phase bode plots for the LPF capability of SOGI1 and SOGI2, through the variation of hi.
Electronics 09 01643 g007
Figure 8. A family of Pav plots after varying its control parameters: (a) plot of the proposed calculation of active power, varying the damping factor of SOGI0 and keeping constant h1 = 0.25 and the damping factors of SOGI1 and SOGI2 at ξ p = 0.7075 ; (b) Pav varying h 1   from 0.1 to 0.30 with ξ i   = 0.2 and ξ p   = 0.7075, PavM in blue dot line, and Pav during the transient step load; (c) steady-state ripple for each calculated Pav, compared with PavM (blue dot line).
Electronics 09 01643 g008aElectronics 09 01643 g008b
Figure 9. Active power transient after abrupt load change at t = 5 s, and its detail in steady-state: Pav (red), PavM (blue), PavT (magenta), and PavC (green). (a) Transient after the load step. (b) Steady-state ripple of the calculated active powers.
Electronics 09 01643 g009
Figure 10. THD with respect DC component calculated, in steady-state, for (a) PavM; (b) Pav with h1 = 0.25; and (c) Pav with h1 = 0.15.
Electronics 09 01643 g010
Figure 11. Reactive power plots for Qav (red), QavM (blue), QavT (magenta), and QavC (green): (a) transient response detail and (b) steady-state ripple detail after load step.
Electronics 09 01643 g011
Figure 12. Active and reactive averaged power calculation, when an abrupt load change occurs, through HIL emulation employing a dSPACE-RTI setup at Aalborg Microgrid Laboratory: (a) NLL current; (b) active power calculation, Pav (yellow), PavM (green), PavT (blue), PavC (red), and their steady-state ripple detail; (c) reactive power calculation and its steady-state ripple detail; Qav (yellow), QavM (green), QavT (blue), and QavC (red).
Electronics 09 01643 g012aElectronics 09 01643 g012b
Figure 13. HIL active averaged power calculation, when an abrupt load change occurs, through HIL emulation, using a dSPACE-RTI setup at Aalborg Microgrid Laboratory: active power calculation, Pav (green), PavM (red), and its steady-state ripple detail.
Electronics 09 01643 g013
Figure 14. Experimental setup at the intelligent Microgrid Laboratory in Aalborg University, Denmark: (a) complete experimental setup and (b) detail of the Danfoss© single-phase inverter.
Electronics 09 01643 g014
Figure 15. (a) Measured current at point of common coupling (PCC) through Fluke Power Analyzer, configured to single-phase employing Channel A; (b) THD of the measured current, calculated using Fast Fourier Transform; (c) PavM Active power calculation and dynamic performance during an abrupt load change, as well as its detail for the steady-state ripple; (d) proposed Pav Active power calculation and dynamic performance during an abrupt load change, as well as its detail for the steady-state ripple.
Electronics 09 01643 g015
Table 1. Parameters for ZNL.
ParameterValue
RonD1-D3/RonD2-D40.01 Ω/1 Ω
LL/C1 = C284 µH/470 µF
RC1 = RC2/RL1 = RL237 kΩ/1560 Ω
Table 2. Characterization of ZNL considering IEEE std 519-2014 [44].
ParameterValue
Individual THDv; Total THD<5%; <8%
Individual THDi>4% for 3 < odd harmonic < 11 >1% for even harmonics
Total TDD in current>5%
Table 3. Simulation parameters.
ParameterValue
V o 311 V
w o 100 π rad/s
TDD for io(t)116.41%
ξ i / ξ p 0.1 to 0.7075/0.7075
h 1 0.10 to 0.30 (in steps of 0.05)
h 2 0.10
ω C ; ω C T 0.74 π rad/s; 2.20 π rad/s
ξ v 0 / ξ 1 = ξ 2 0.7/1
ξ M V / ξ M I / ξ A = ξ B 0.7/0.14/1
C1 = C2/ RC1 = RC2470 µF/37 kΩ
RL1 = RL2 = RL3 = RL41.8 mH; 0.01 Ω
RC BRANCH25 µF; 1 Ω
SWITCHING FREQUENCY, fs10 kHz
Table 4. THD, settling-time, and time-delay for the simulation of Pav.
Calculated THDSettling-Time (ms)/% Reduction with Respect to PAVMTime-Delay (ms)/% Increasing with Respect to PAVM
P a v M 1.13%12038
P a v
ξ i = 0.2
h 1 = 0.25
1.32%75/32%40/5%
P a v
ξ i = 0.2
h 1 = 0.15
0.59%90/18%50/20%
Table 5. Settling-time and THD for the simulation of reactive power algorithms.
Reactive Power Calculation AlgorithmCalculated THDSettling-Time (ms)Reduction of THD with Respect to QavM
Q a v M 7.85%140Not applicable
Q a v : ξ i = 0.2   h i = 0.25 ; h 2 = 0.1 2.46%15068.66%
Q a v T 3.49%25055.64%
Q a v C 1.87%78076.18%
Table 6. Pav and Qav parameters for the hardware-in-loop (HIL) tests.
Test ξ i ξ p h 1 ; h 2
HIL TEST-10.20.70750.25; 0.10
HIL TEST-20.20.70750.15; 0.10
Table 7. Settling-time and time-delay for active and reactive power.
HIL Calculation AlgorithmSettling-Time (ms)Time-Delay (ms)
P a v 9038
P a v M 14040
Q a v 13050
Q a v M 14045
Table 8. Simulation, HIL, and experimental results for active power.
AlgorithmSettling-Time Matlab (ms)/(%Reduction)Settling-Time HIL (ms)/(%Reduction)Settling-Time Experimental (ms)/(%Reduction)
Pav75/37.5%90/(35.7%)125/(30%)
PavM120140180