1. Introduction
In China’s animal husbandry, the sheep industry is a sunrise industry after the dairy industry. In 2017, there are 302.3 million living sheep for sale, which is an increase of 1% over 2016. China produced 4.7 million tons of mutton, an increase of 2.3% over 2016. The number of living sheep in China reached the highest in 2015, reaching 311.7 million [
1]. The data of agricultural production activities (the quantity of living sheep and mutton) is from China Agricultural Statistical Yearbook 2018 and China Statistical Yearbook 2018 [
2,
3]. As one of the most important sources of meat protein in people’s daily life, the quality and safety of the mutton has been more and more widely concerned in society [
4,
5]. How to make sure the quality and safety of mutton sheep supply chain in a living state and avoid the death of living sheep and the loss that is caused by excessive stress because of the adverse environment need to be studied from multiple perspectives, such as the preservation method, transportation technology, and information processing of the mutton sheep.
Living sheep transportation is a key link in the supply chain of the sheep for meat. The most important task is to avoid the death of sheep during the transportation and the damage that is caused by excessive stress in sheep. However, there are few studies regarding how to reduce the stress response and changes in mutton quality during transportation. At present, the transportation of living sheep is mainly carried out under the condition of large and crowded trucks. The transportation environment is easily deteriorated due to the influence of breathing and metabolism of living sheep. If it is not cleaned in time, thn it will produce stress symptoms of sheep and cause illness, even death. Therefore, the safe transportation of mutton sheep has always been a major problem in the market of mutton sheep. In general, the key issue of the live sheep supply chain is how to improve the sheep survival rate during transportation. Neglecting the management of live sheep transportation will not only cause huge economic losses, but it will also pose a serious threat to people’s food safety.
Wearable sensing technology is a new but exciting field for domestic animals [
6,
7,
8,
9,
10]. In sheep, activity monitors help to provide objective measurement tools, and veterinary observation is the only source of information [
10]. The whole process of living sheep trade and transportation needs to be based on high-efficiency bio-perception technology. As the research on China’s sheep transportation is relatively late, living sheep physiological monitoring technology and multi-source sensing technology are relatively backward. Its quality and safety management lacks a systematic and normative nature, which makes the technical level of live transportation equipment of mutton sheep low. On the other hand, the traditional system only pays attention to monitoring the single ambient temperature, and it fails to meet the needs for real-time physiological detection of living sheep. The scientific problems to be solved are how to realize the monitoring and optimization of micro-environment parameters in live sheep transport, and to explore the deep connection between the stress response of live sheep and the changes of the transport microenvironment. The measurement of transport stress is a challenge. Usually, the veterinarian measures heart rate before and after transportation to estimate the stress during the whole process. However, data that were obtained by this method are discontinuous, so it is impossible to get the real stress situation during transportation. The method that is presented in this paper can continuously acquire physiological data, so it can more accurately reflect the stress situation during transportation.
Some studies investigated the wearable monitoring system for small animals, such as dogs, horses, cows (
Table 1). The long-term goal of collecting data on canine activity is to effectively capture and interpret canine behavioral responses to environmental stimuli [
11]. Due to the ability of multielement sensors and an advanced computer processing system, it is possible to specifically identify itching behaviors, such as scratches and shaking heads [
10]. Andrea Guidi presented a wearable sensing system in favor of the heart rate real-time monitoring in horses [
12]. Hirofumi Nogami developed wearable wireless sensor nodes to automatically measure the body temperature of a calf [
13]. Claudia Arcidiacono improved real-time monitoring system and analyzed cow’s walking behavior [
14]. C. Arcidiacono collects data from wearable sensors that were fixed to cow collars and defined and developed a threshold for real-time classification of eating and standing behavior [
15]. Miura used a wearable wireless miniature sensor for monitoring the surface temperature of ventral tail on cattle and detected their estrus [
16]. The biggest difference between these studies and the one that is presented in this paper is that the physiological signals acquired by wearable devices are used here to show the sheep stress during transportation. The technical characteristics of these studies generally use one or two parameters. It is not comprehensive in the transport stress of sheep. What is more, these studies were not available for sheep or other animals.
Sheep are very active and defensive at work, especially suffering the invasion of foreign matter, such as contact electrodes. Therefore, the stress monitoring system needs to be not only resistive, but also robust. It is a challenging task to reliably record the heart rate and skin temperature of sheep during static posture and dynamic activity in the indoor and outdoor environment in the way perceived below. Our current first step is to improve the hardware of the photoplethysmogram (PPG) to more efficiently integrate and develop more miniature, accurate, and reliable PPG monitoring equipment outside of the common laboratory and veterinary environment, especially during dynamic transportation. It is necessary to apply a master–slave wireless monitoring system by integrating Bluetooth and IoT technologies to reduce the discomfort of sheep. The master–slave system included one master unit and slave units that can quickly carry out the self-organize networking through the Bluetooth network [
17,
18]. The novelty and significance of this work included:
Wearable stress monitoring system for sheep basic physiological characteristics (such as the heart rate and skin temperature) and environmental information that is based on the IoT multi-sensor platform.
A non-contact and non-destructive monitoring method for the management of sheep transportation.
The combination of wireless communication and data storage reflecting in the close cooperation of the master and slave units.
2. Materials and Methods
2.1. System Overview for WSMS
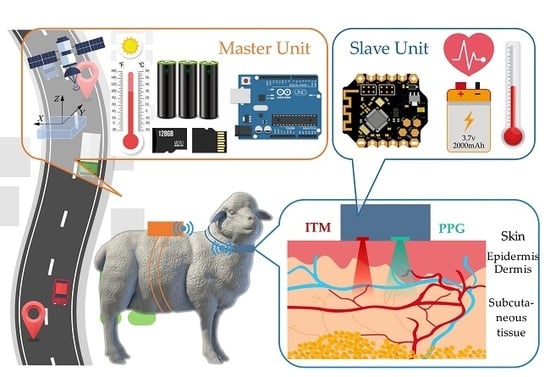
The Wearable Stress Monitoring System (WSMS) included two interrelated components: a master unit fixed into an adjustable elastic band that is mounted on the back of the sheep behind the two front legs around the rib cage, and a slave unit hung on the sheep around the neck (
Figure 1).
To evaluate the performance of the monitoring system, we congregated it to a wearable multi-sensor processing platform that is integrated into two adjustable elastic bands that wrap around the front legs and chest behind the neck. The platform included two parts: one was the master unit and the other was the slave unit. As the core-processing unit, the master unit retrieved the sensor signals and transmitted them through the wireless communication protocol in the Texas Instruments system-on-chip (cc2540), so that it could be connected with the slave unit through the Bluetooth low power (BLE) v4.0 standard for 2.4 GHz (
Figure 2). The analog output of the monitoring system was directly linked to an analog to digital converter (ADC) with 12-bit, which has eight communication channels. We recruited 60 sheep of the same size, breed, and hair density (same age and approximate weight) in Chao Yang city, Liao Ning province in order to carry out this research. The Institutional Animal Care and Use Committee at the China Agricultural University approved the protocol of this experiment. In order to systematically, comprehensively, and accurately grasp the changing rules, the physiological characteristics of the mutton sheep (including sex, age, weight, health, and transportation experience) that can influence test results should be avoided. Six male sheep (10% of the total) were selected as the test samples for the sheep transport stress test.
Table 2 shows the basic data. Each sample has not been transported by the truck before. When considering the effects of external conditions, such as disease on heart rate variability, all of the samples were confirmed to be healthy and free of cardiovascular and cerebrovascular diseases by veterinary diagnosis. Test samples were required to keep adequate sleep before the test. What is more, the sheep should keep no fatigue symptoms and emotional stability. Not allowed to eat or drink exciting foods containing caffeine, alcohol, and other drugs that affect blood pressure and heart rate recently.
2.2. Data Collection
The WSMS included two kinds of data: the biological sign sensing data and the environment sensing data. Heart rate and infrared temperature sensors in the slave unit measured the biological sign sensing data, including heart rate (HR) and skin temperature (ST). Corresponding sensors in the master unit measured transportation environment sensing data, including Global Positioning System (GPS), triaxle acceleration, ambient temperature, and humidity. The HR and ST signals were both acquired by an external interrupt based on the slave microcontroller. After analog to digital conversion, each HR analog signal was sent by the transmitter in the slave unit and then received by the receiver in the master unit, which sent the digital pulses of sensing data to the master microcontroller. Specifically, the sampling interval between pulse signals that were sent by the receiver was analyzed through the external interrupt timer and it provided a time base for heart rate calculation [
19]. Similarly, the ST signal was acquired by the A/D converter of the slave microcontroller, and was then sent to the master microcontroller through the wireless communication [
19,
20]. Transferring wireless data through a generic Universal Synchronous/Asynchronous Receiver/Transmitter (USART) serial communication protocol. For a variety of serial protocols, the USART peripherals were asynchronously configured with a baud rate of 9600 bps [
19,
21]. In addition, data of HR and ST were stored in the Micro Secure Digital Memory (Micro SD) card for permanent record while using the Serial Peripheral Interface (SPI) communication protocol [
19]. However, the sensing data of transportation environment were obtained by the A/D converter in the master microcontroller. Then directly stored in the Micro SD Card without wireless communication.
2.3. Sensors
Our sensors in the slave unit included a heart rate sensor and a skin temperature sensor, which focused on the physiological information of the sheep.
There are three traditional heart rate measurement methods: (1) to extract from the electrocardiogram (ECG) signal. It needs professional large-scale monitoring medical equipment that has to hold the sheep still; (2) to calculate from the blood pressure measurement. This method also has to keep the sheep without moving; and, (3) Photoplethysmogram (PPG). The first two methods will limit the sheep’s activity usually by tying legs down and making the sheep feel nervous, which increase the sheep’s physical and psychological discomfort. Accordingly, we used PPG, which is characterized by simple method, convenient wearing, and high reliability. The basic principle of photoelectric volume method is to measure pulse and blood oxygen saturation by using sheep tissue to cause different light transmittance when the blood vessels beat. The sensor is composed of light source and photoelectric converter. Light sources generally use light-emitting diodes with specific wavelengths that are selective in regards to arterial oxygenated hemoglobin (HbO
2) and hemoglobin (Hb). When the light beam passes through the sheep’s peripheral blood vessels outside the body, the light transmittance of the light beam changes due to the change of arterial pulsating hyperemia volume. At this time, the light that is reflected by the sheep’s tissue is received by the photoelectric converter, converted into an electrical signal, and amplified and output. Since the pulse is a signal that changes periodically with the beating of the heart, and the volume of arterial vessels also changes periodically, the change period of electrical signal of the photoelectric converter is the pulse rate. Meanwhile, according to the definition of oxygen saturation, it can be expressed as:
where
means arterial oxygen saturation.
is the oxygenated hemoglobin concentration.
is the hemoglobin concentration.
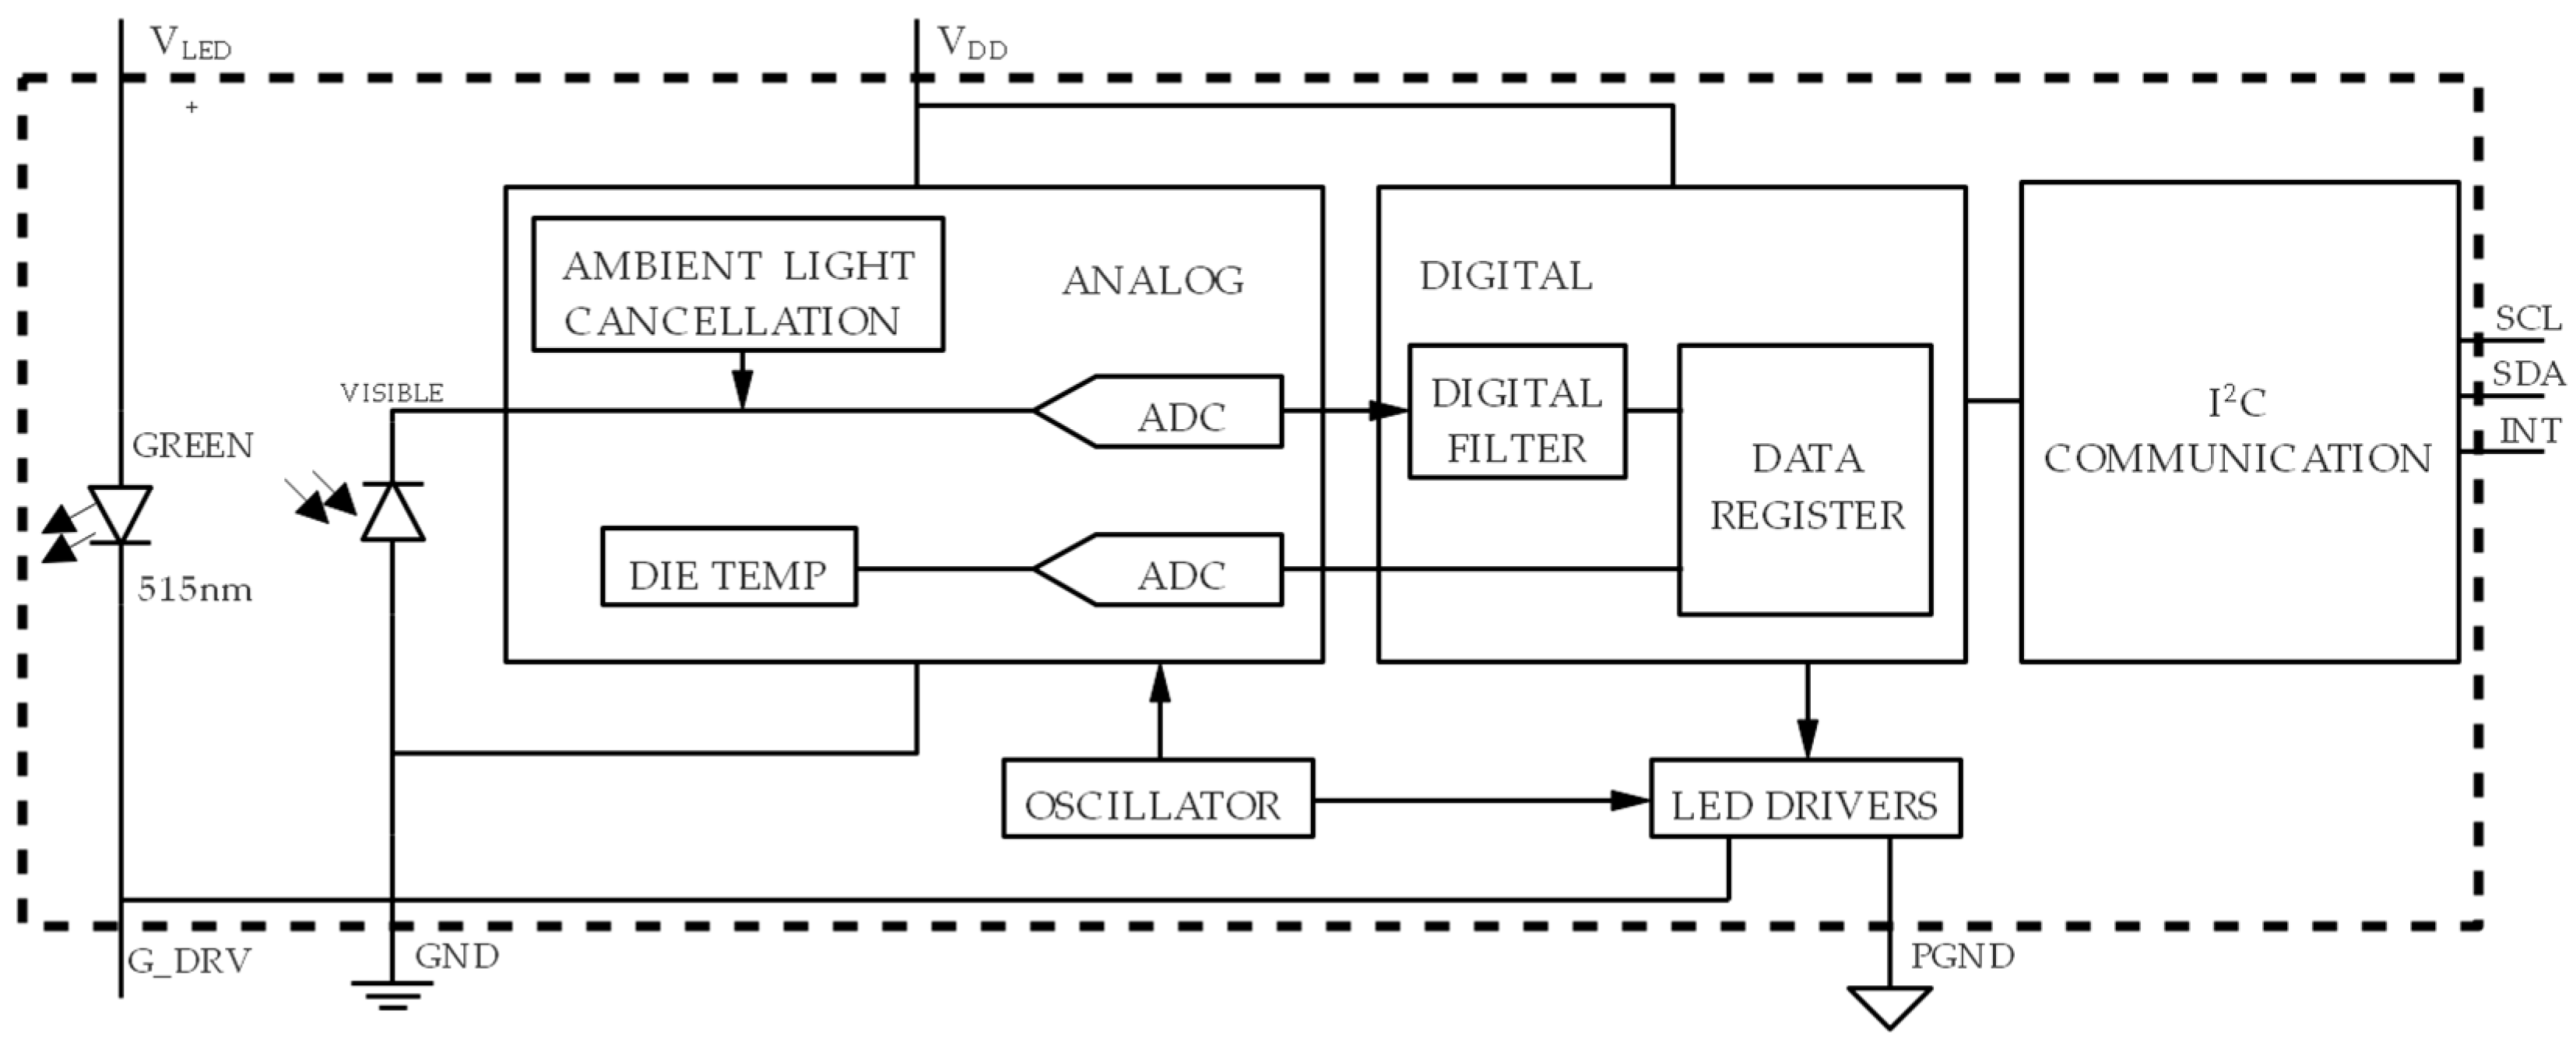
In this paper, the heart rate sensor used a green LED chip (Kingbright, Walnut, CA, USA, AM2520) with a peak wavelength of 515 nm, while the optical receiver used a chip (Avago, City of San Jose, State of California, USA, APDS-9008), which is an environmental photoreceptor with a wavelength range of 500 nm to 610 nm [
22,
23,
24,
25] (
Figure 2 and
Figure 3). The peak wavelength of AM2520 is in the range of the APDS-9008, which is the reason why we choose AM2520 as the LED. In addition, since the frequency band of the pulse signal is generally between 0.05 and 200 Hz, the signal amplitude is very small, generally at the millivolt level, and it is easy to be interfered by various noise signals. Accordingly, a low-pass filter and an amplifier composed of an operational amplifier MCP6001 are used behind the sensor to amplify the signal 330-fold. At the same time, a partial voltage resistor is adopted to set the direct current (DC) bias voltage as 1/2 of the power supply voltage, so that the single chip microcomputer can collect the amplified signal well.
Infrared temperature measurement is a non-contact technology, with a small size for convenient carrying (
Figure 3). What is more, it is safer and stronger than the traditional mercury thermometers for storage. Especially for living sheep, such a moving object is the first choice. The production of infrared radiation is due to the movement of charged particles. Hence, when the temperature of the object is higher than absolute zero, it will produce the energy wave of infrared. The relationship between infrared radiation capability and object temperature satisfies Stefan–Boltzmann law:
where, E is the radiant power and the unit is joule;
is the radiation coefficient of the object; the proportional coefficient
is a constant; and, the absolute temperature T is in kelvin. According to this law, the absolute temperature can be deduced from the radiant power, radiation coefficient, and proportional coefficient, and then the temperature of the object can be determined. The temperature of the object and the temperature of the sensor itself form the output signal. The formula can be obtained, as follows:
where, A is a constant, which is related to the structure of the sensor;
is the temperature of the object; and,
is the temperature of the sensor. All units of the temperature are in kelvin.
The temperature acquisition module chip of this system is MLX90615. Firstly, this module chip is digital and non-contact. Secondly, this module is high-precision. At the same time, the size of this module chip is little enough to be wearable (see
Figure 3). The formula for converting the temperature of the readout object into Celsius (degree) is:
Reading the measured temperature sensor data in the random access memory (RAM) of the chip, where the address is 0x07. in the address is temperature of the object and the output ratio is 0.02° K/LSB.
The emissivity of the sensor is a parameter that represents the infrared radiation of different materials. When measuring the temperature, the infrared radiation characteristics of the measured object are different, due to the different materials. The emissivity was set in the chip as the initial value 1. In use, modifying this parameter can compensate the error of different measured objects. For this research, the emissivity needs to be changed as 0.98. In MLX90615, the programmable emissivity is located at the address 0x03 in the EEPROM and it needs to be converted by a formula, where
is the emissivity (set as 0.98 here). The result obtained by the following formula is 0x3EB8.
The field of view is described by a relation between object-sensor distance (D), object size (S), and field of view angle (FOV), as follows [
26]:
For MLX90615, the nominal FOV is 100° [
27]. Accordingly, its distance-to-spot ratio parameter is
.
The sensors in the slave unit included a GPS sensor, a temperature and humidity sensor and a three-axis accelerometer, which focused on the transport environment information of the sheep. We used the u-blox 6 GPS module for GPS positioning. This chip is compatible with 3.3 V/5 V voltage level, making it convenient to connect various single-chip microcomputer systems. The GPS module uses the NMEA 0183 protocol, which is a common criteria developed by the National Marine Electronics Association for the standardized management of the marine electronic equipment. Currently, it has become the standard protocol of RTCM (Radio Technical Commission for Maritime services) for GPS navigation equipment [
28]. For environment temperature and humidity, we used the DHT22 sensor to obtain a 0–100% humidity reading, with an accuracy of 2–5%, and for a −40 to 80 °C temperature reading with an accuracy of ±0.5 °C. It needed 3 to 5 V power supply. For monitoring vibration, we used Bosch BMA220, which was an ultra-compact triaxle, low-g acceleration sensor board with I2C interface that was designed to meet the needs of low-power consumer applications. The acceleration range was ±2 g/±4 g/±8 g/±16 g [
29]. Power supply was 2.0–3.6 V.
2.4. Electric Circuitry for WSMS
Figure 4 shows the block diagram of the whole WSMS units. The WSMS units included a master unit and a slave unit. We defined the master unit as the device that had the core processing capabilities, such as acquiring data, processing data, and recording data. We defined the slave unit as the device that was responsible for collecting data and sent data to the master unit. The master and slave units were usually one-to-many. It meant that more than one slave units could transmit data to one master unit. The reason why this article adopted the master-slave unit method was to reduce the size of the data collection device as much as possible.
The slave unit contained an eight-bit AVR microcontroller-ATmega328P (Microchip Technology Inc., Chandler, AZ, USA). In order to store and run the microcontroller programs, there was 32 KB flash memory, 2048 bytes of SRAM memory also with 1024 bytes of EEPROM memory in the slave AVR chip [
30]. It had 8 I/O ports for communicating with the sensors. Two eight-bit timers and one 16-bit timer were for interrupts. The peripheral had two SPI communication ports that were based on the USART protocol [
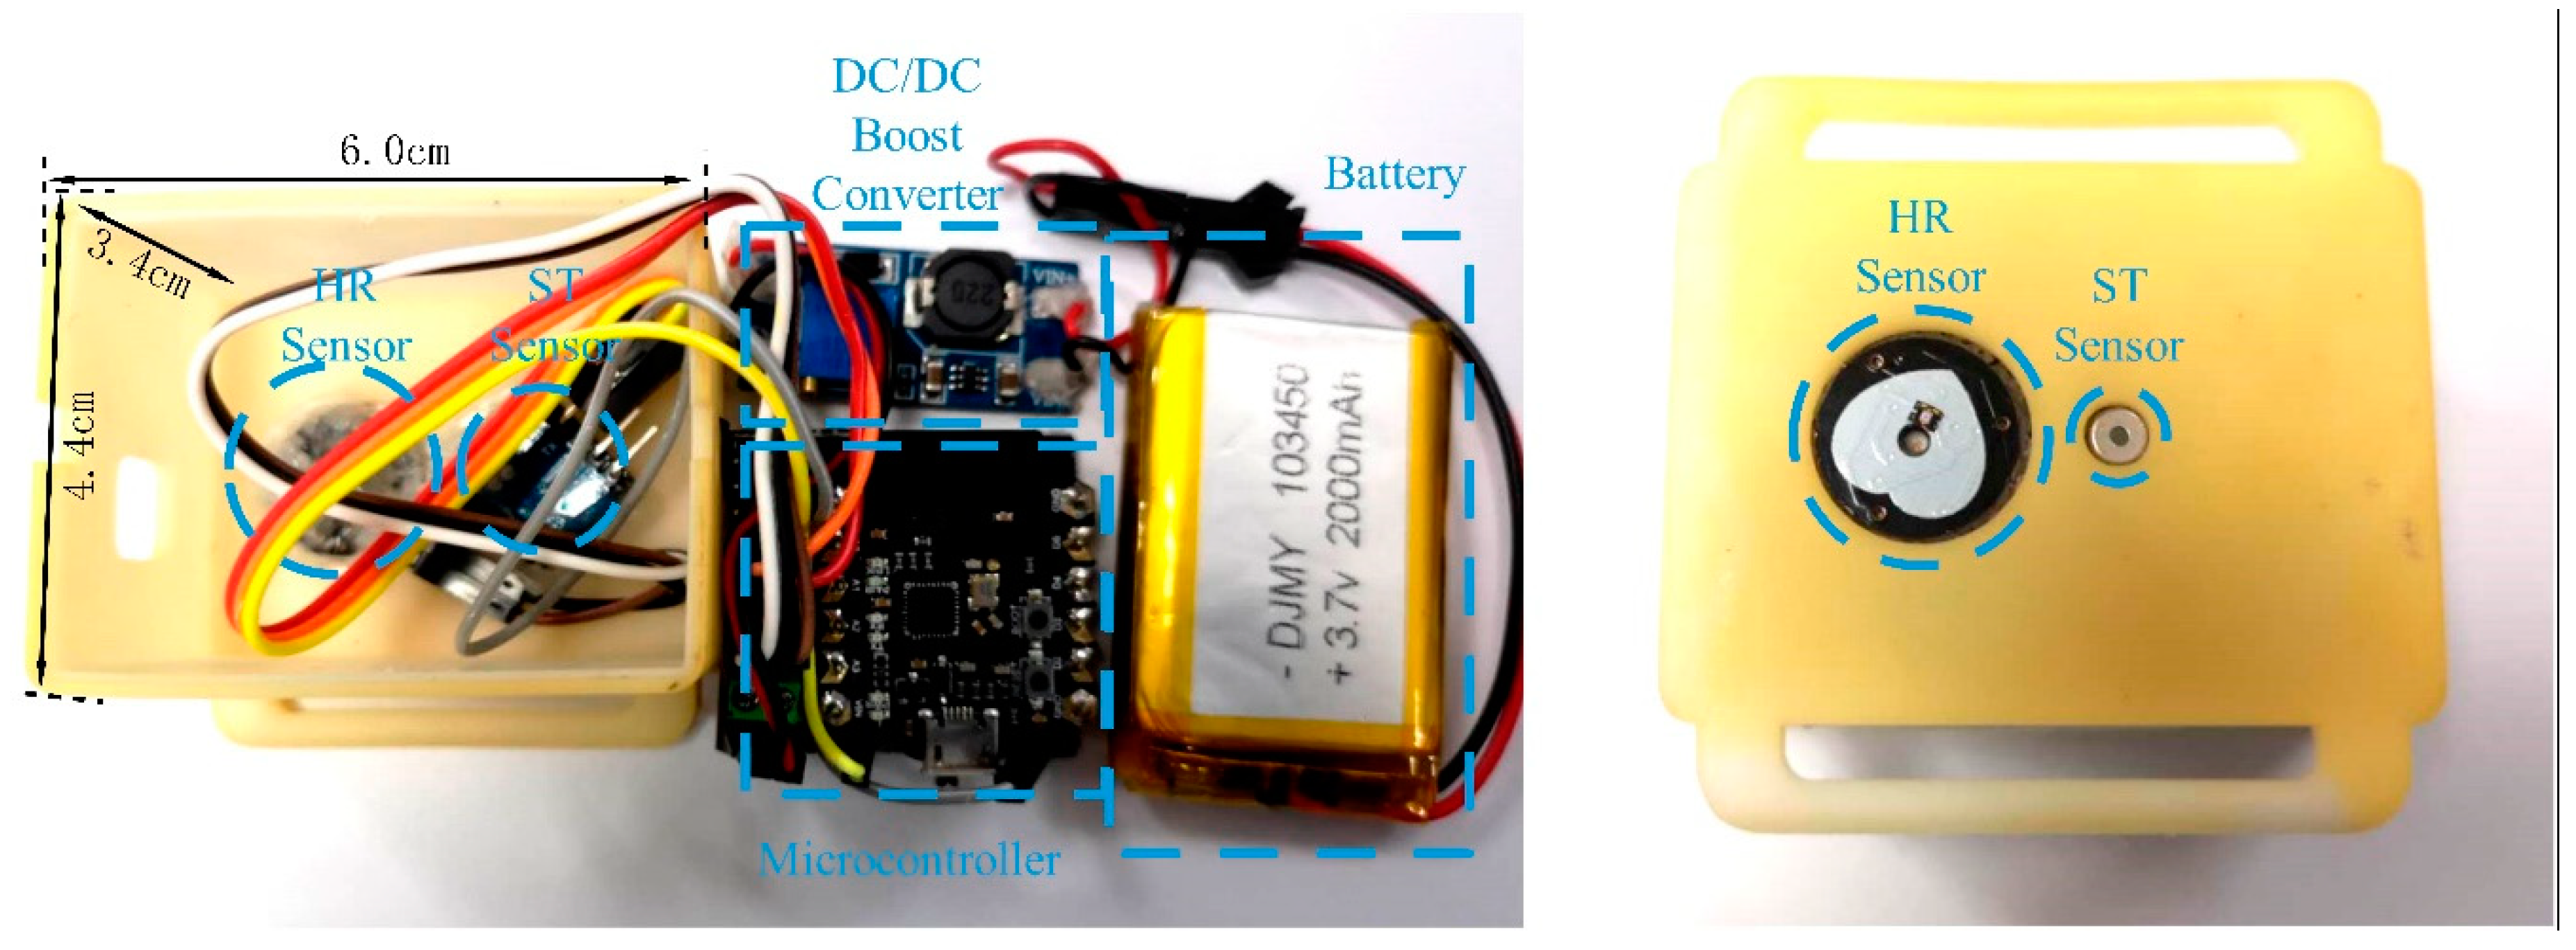
31]. In order to realize the function of wireless communication, we configured an extra Bluetooth v4.0 RF Transceiver CC2540 (Texas Instruments, Dallas, TX, USA) with the transfer protocol of IEEE 802.15.4 standard in the 2.4 GHz band with a baud rate of 250 kbps. The slave unit was 6.0 cm long, 4.4 cm wide, 3.4 cm thick, and weighed 134 g. The casing had a weight of approximately 32 g.
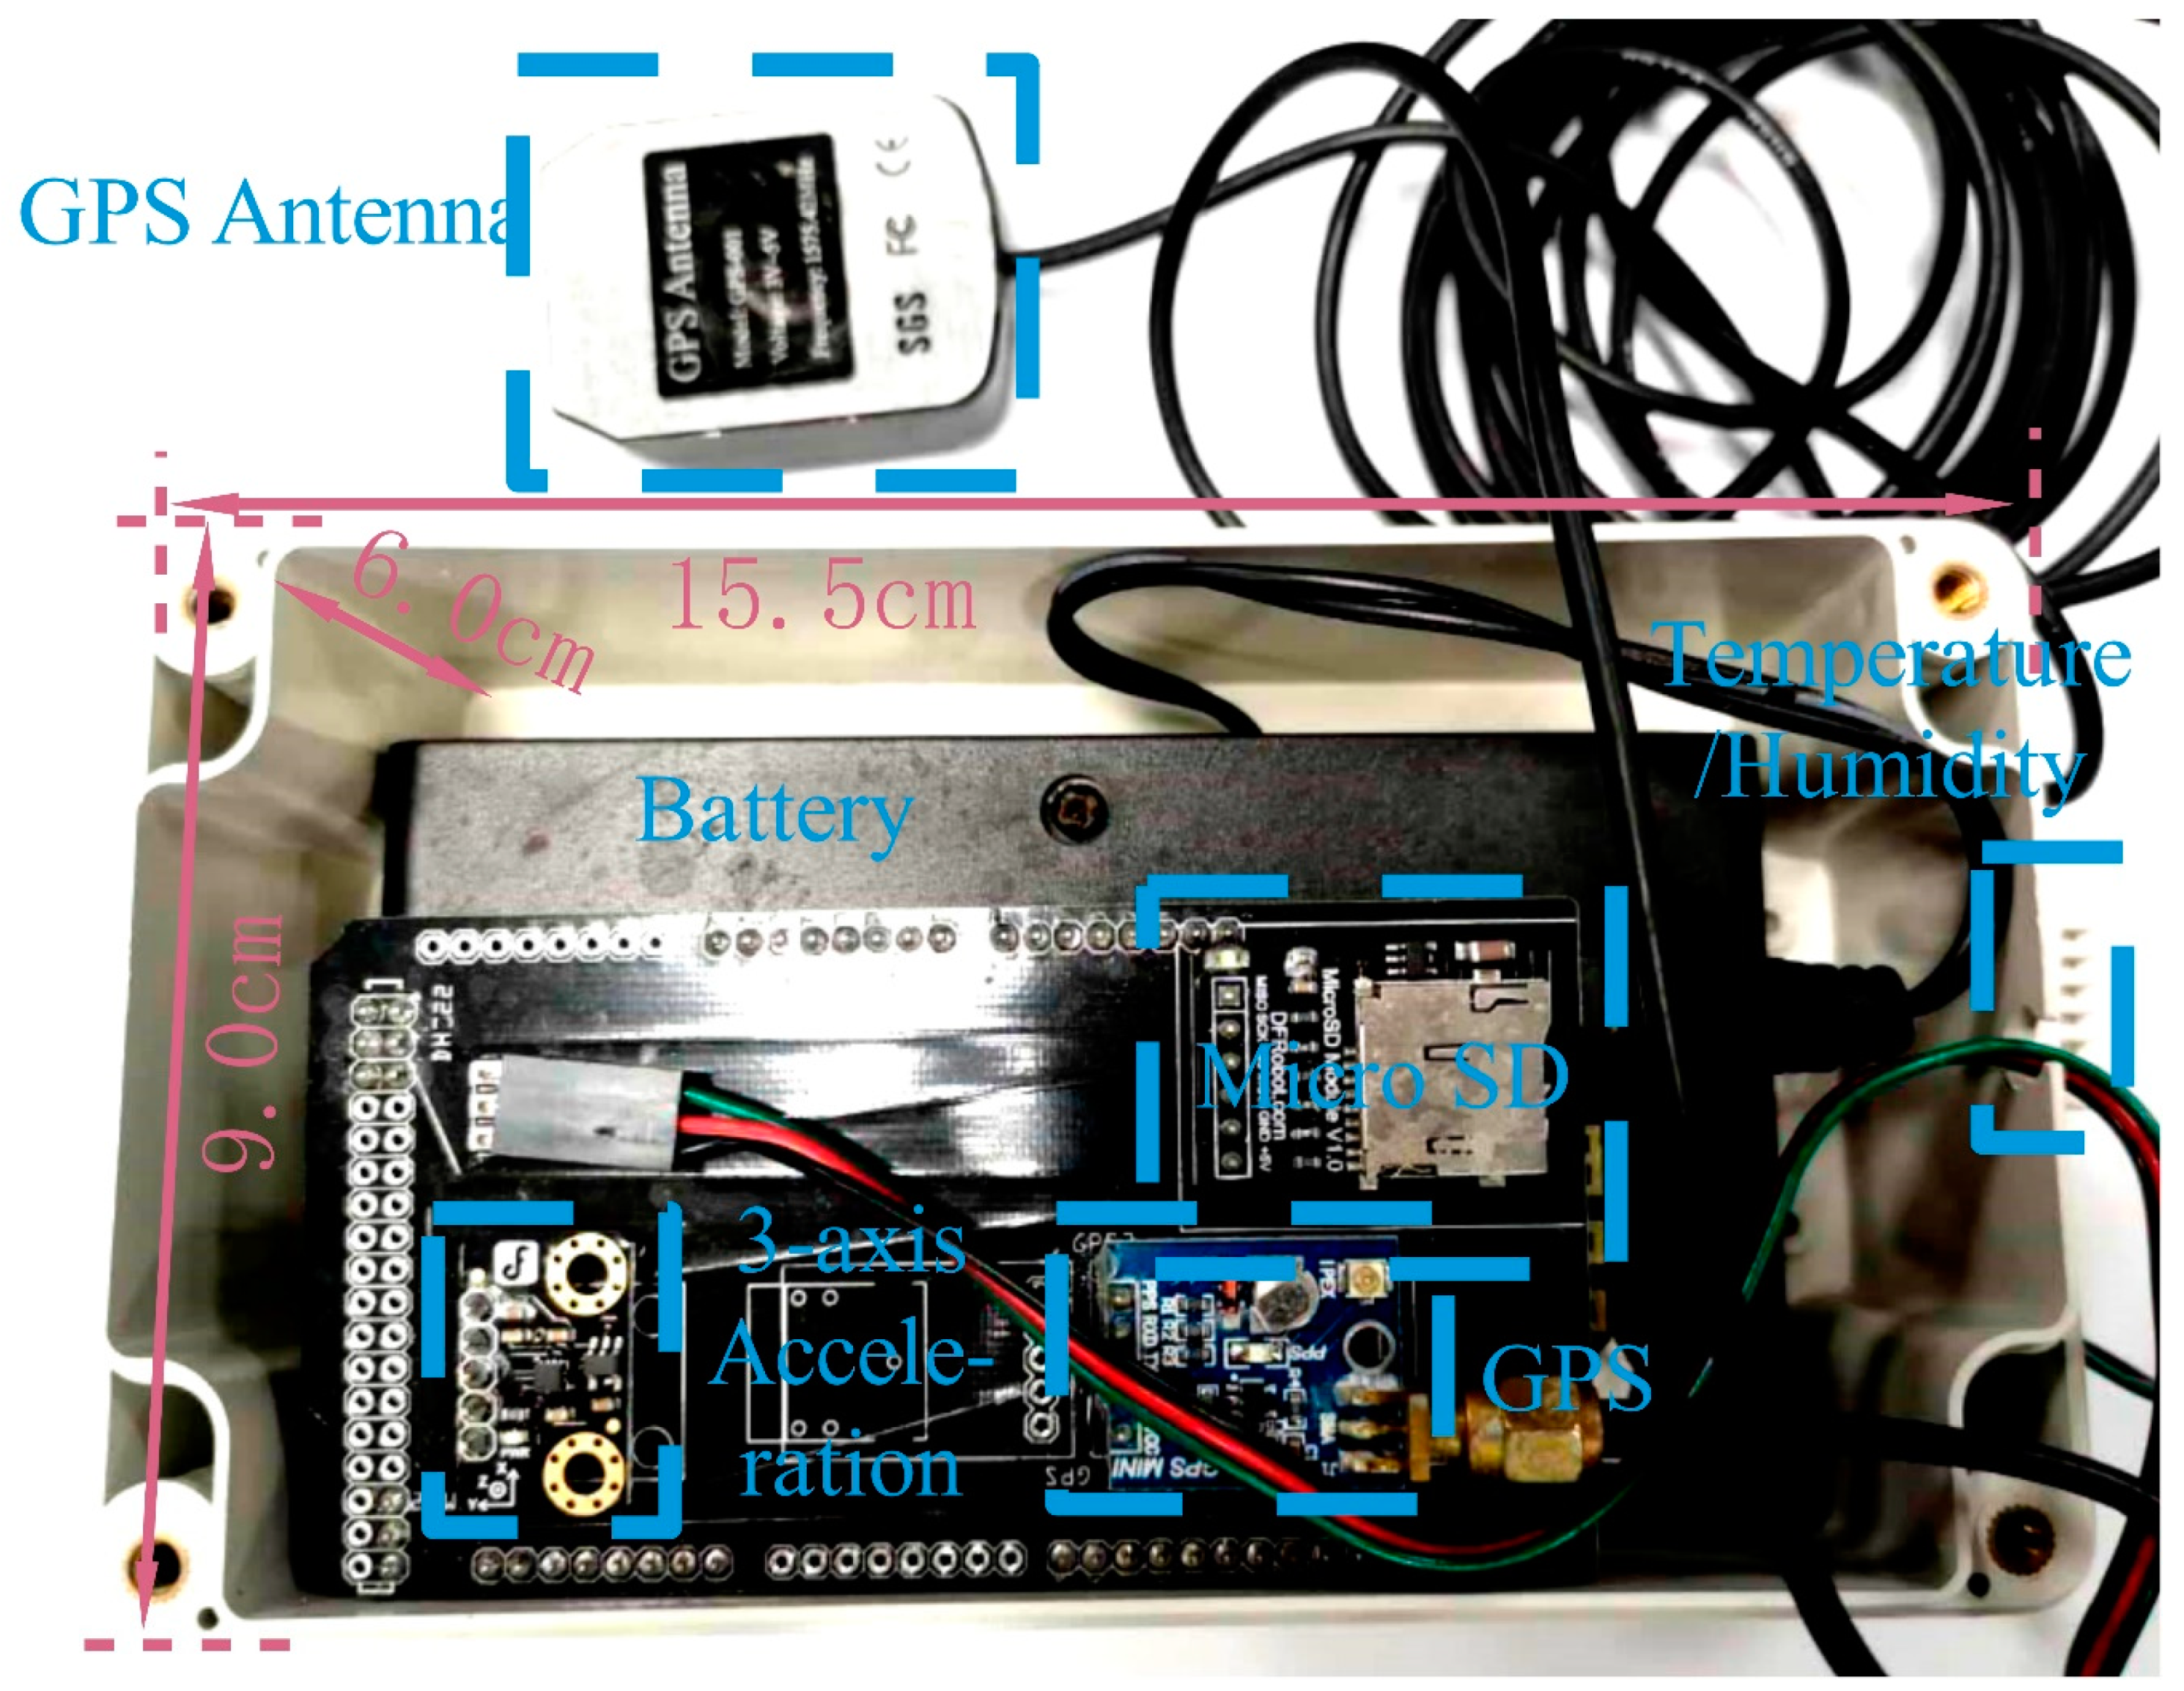
The master unit contained an 8-bit AVR microcontroller-ATmega2560P (Microchip Technology Inc., Chandler, AZ, USA). The master unit could be regarded as an aggregation node, so the performance and the storage space of the microcontroller should be better than the slave microcontroller. There was 256 KB flash memory, 8192 bytes of SRAM memory, and 4096 bytes of EEPROM memory in the master AVR chip for storing and running the microcontroller programs. It also had 8 I/O ports for communicating with the sensors. Two eight-bit timers and four 16-bit timers were used for interrupts. The peripheral had 5 SPI communication ports based on the USART protocol. We also configured an extra Bluetooth v4.0 RF Transceiver CC2540 (Texas Instruments, Dallas, TX, USA) with the transfer protocol of IEEE 802.15.4 standard in the 2.4 GHz band with a baud rate of 250 kbps for wireless communication. The master unit was responsible for recording and storing all the data by a Micro SD card which had a storage of 4 GB (maximum was 256 GB). The master unit was 15.5 cm long, 9.0 cm wide, 6.0 cm thick, and weighed 360 g. The casing had a weight of about 108 g.
All of the operations of the slave and master units were controlled by each microcontroller program, including data acquisition, transmission, processing, and storage. The programs downloaded in both slave and master microcontrollers (firmware) were developed through the Arduino v1.8.4 platform. When considering the issue of software compatibility, the latest version v1.8.8 was not recommended. The Arduino firmware has pre-configured all of the hardware parameters, including interrupts, A/D converter settings, digital/analog input and output (I/O) pins, timers, and communication peripherals [
19,
32]. It should be noted that the corresponding firmware board should be selected when downloading the programs since the master and slave units had different microcontrollers. The slave microcontroller should choose the Uno board, however, the master microcontroller should choose the Mega board.
The microcontroller would create a text file with the name defined in the program and the data written into the file for permanent recording once all of the peripherals (communication protocols, A/D converters, and interrupts) were configured and activated. In fact, there were four text files in the Micro SD Card. HR and ST data were stored in one file. Ambient temperature and humidity information were stored in one file. GPS positioning data is stored in a separate file. The last file stored data for three-axis acceleration. Tabs (“/t”) separated each variable data. Users could activate the transmission mode and monitor data in real time by remotely controlling during data acquisition and recording. Viewing data through the Windows 10® (version 1809, online, Redmond, WA, USA) interface.
2.5. Multidimensional Sampling
The slave unit was attached to the sheep for acquiring HR and ST physiological sensing data. We placed the slave unit on an elastic belt and attached them on the neck of the sheep. In order to measure HR and ST, the slave unit should be close to the exposed skin area of the neck, so that the sensor probe could detect the skin surface. The master unit was mounted on the back of the living sheep to expose the GPS antenna and the temperature and humidity sensor probe. The master unit should be placed horizontally, so that the initial axes of the three-axis acceleration were consistent.
2.6. Heart Rate Variability Time-Domain Analysis
The measurement of heart rate variability (HRV) is a non-invasive technique that has been proven to be very useful in humans for both research and clinical studies concerned with psychiatric and psychological disorders. Over the past decade, HRV has been increasingly available for animal research to analyse changes in sympathovagal balance that are related to diseases and psychological and environmental stressors [
33]. Heave and roll heart rate and HRV analyses suggested physiological stress responses as a result of sheep transport [
34,
35,
36]. Based on previous research, we assume HRV to be a valuable physiological indicator for stress load in animals [
37,
38]. The analysis of the heart rate variability (HRV) started from the photoplethysmogram (PPG). We extracted the time series of HRV from the PPG.
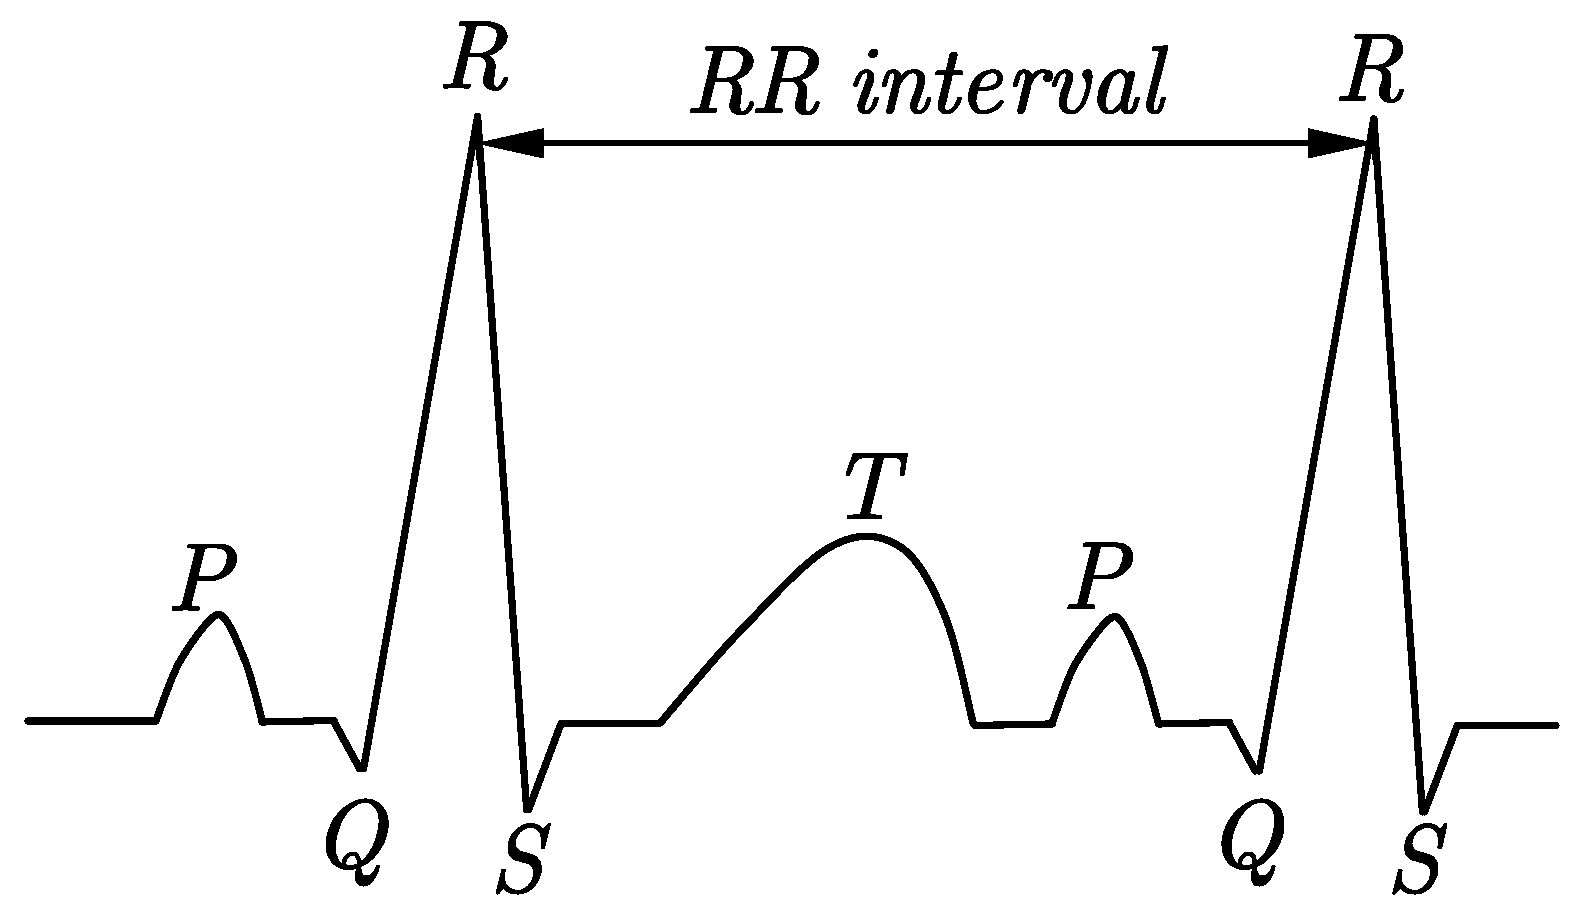
Figure 5 shows the normal sheep PPG signal waveform. Each cardiac cycle includes P, QRS, and T-wave. The QRS complex is a name for the combination of three of the graphical deflections seen on a typical photoplethysmogram. The R waveform in the QRS complex is steep and has high amplitude, which is often used as a marker in PPG feature detection. The time interval between two adjacent R waves is called the RR interval, which is used to indicate the time gap of the heart’s successive heartbeats [
39]. The small variation of the RR interval between consecutive heartbeats stands for the HRV.
The analysis method of HRV is based on RR interval measurement. This paper utilized time-domain measures to evaluate stress. We selected five typical time-domain HRV parameters. One is the mean value of
(MR), which is the most evident measure. The second one is the standard deviation of
(SDNN), which means the difference between shortest and longest RR interval. The third one is the root mean square of the sum of the squares of differences between adjacent RR intervals (RMSSD). The fourth one is the number of the adjacent RR intervals whose differences are over 50 ms divided by the total number of RR intervals. The last one is the coefficient of variation (CV), which is the MR divided by SDNN [
39,
40]. We assumed that sheep refreshed the pressure level every ten minutes [
39]. We computed them, as follows:
where
denotes the value of
RR interval and N is the total number of successive RR intervals.
is the mean value of RR intervals.
is the number of the adjacent RR intervals whose differences are over 50 ms. Five indicators reflect different characteristics of the HRV. SDNN is used to assess the overall change of the HRV. RMSSD reflects the fast-changing component of the HRV, which is related to the high-frequency components in the spectrum. PNN50 reflects the heartbeat cycle-by-heartbeat variation. The coefficient of variation marks the degree of variation.
3. Results and Discussion
Figure 6 shows the designed slave unit.
Figure 7 shows the designed master unit. These sizes and qualities of the device were suitable for small animals, just like sheep. What is more, the full use of the device did not require surgical or invasive procedures, thereby minimizing the stress on the subject animal. With the help of one 2000 mAh lithium battery (3.7 V) in slave unit, the data acquisition time could reach 16 h. With the help of eight nickel-metal hydride rechargeable batteries (per 1.2 V and 3500 mAh) in the master unit (total 9.6 V and 28,000 mAh), the master unit running time could reach 20 h. The battery’s power limited the working hours of the device. The data collection interval for all of the continuous variables was one sample per second. Meanwhile, the device reached a peak of current, which was approximately 100 mA. In terms of power consumption, the current could be reduced to 60 mA, when the chip was turned on low power mode. This feature limited the choice of the power supply adequate to the equipment.
In general, the design of the WSMS uses a ATmega328 low-power microcontroller with one Static Random-Access Memory (SRAM) storage module (2 Mb), a u-blox six GPS receiver, a APDS-9008 pulse sensor, a MLX90615 infra-red thermometer, a DHT20 humidity and temperature sensor, and a BMA220 three-axis accelerometer (
Figure 7) [
41]. The low energy consumption CC2540 2.4 GHz Bluetooth v4.0 as a BLE communication protocol allowed for wireless data communication from 2402 to 2480 MHz, with an output power of 0 dBm [
42]. We chose Received Signal Strength Indication (RSSI) for signal strength and signal transmission distance test. Field tests have shown that this configuration could expect a communication range of approximately 20 m (
Figure 8).
After two pre-experiments and four long-term tests, the WSMS exhibited strong anti-interference ability and robustness. The system could run stably for at least 16 h and the collected data was coherent with little packet loss (0.5%). The designed system had the prominent feature in the combination of wireless communication and data storage, reflected in the close cooperation of the master-slave units. The non-destructive measurement method of small-volume slave unit and wireless communication could reduce the anxiety of the sheep as much as possible. The WSMS acquired a physiological signal by Bluetooth communication and evaluated the effects of the transport stress, thus helping to improve sensing data quality and allowing real-time data acquisition during the whole transportation. We added the power consumption and cost analysis of the system (
Table 3). Although the power-save mode of the microcontroller has low power consumption, the sensors, especially GPS, have massive power consumption. The whole cost of the system is less than 45 dollars.
In order to make sure the validity of the acquired data from WSMS, we used a professional veterinary monitor (Surgivet V9204, USA) for comparative analysis experiments.
Table 4 shows the average value, standard deviation, and variation coefficient of the standard deviation of the HR and ST data by the test equipment (WSMS: slave unit + master unit) and control equipment (veterinary monitor equipment) during the measurement experiments.
From the experimental results, it showed no significant difference in the HR and ST average values between the test and control equipment (
Table 4). In addition, it was easy to observe that the HR value was not only higher than the normal value (70 to 80 bpm), but also the ST value was higher than the normal value (35.5 to 36.5 °C) because of the transportation. The test equipment acquired ST data in a different way that was non-contact and non-destructive other than a thermometer. The traditional method for body temperature detection was to insert the thermometer into the anus of a live sheep. It would significantly increase the stress response of the sheep. Data was acquired in the test equipment (slave unit + master unit) and control equipment (veterinary monitor equipment and thermometer) during the two collection periods of the verification phase. Additionally, there was no significant difference in the average HR and ST between the data acquisition device and the data collection cycle. It indicated that the accuracy and stability of the equipment met the actual requirements.
After the experimental data collation and analysis, we acquired the physiological signal changes of the live sheep during transportation.
Figure 9 shows the continuous monitoring devices of the sheep for about a seven hour period. The measurement data was acquired by the WSMS every second. Before analyzing the PPG signal, the 380-min PPG signal that was collected during the test required segmentation. For the convenience of research and analysis, the 380-min PPG data was divided into 38 segments, each segment was 10 min, and recorded as 1th, 2th, …, 38th period. The control PPG data that were acquired before transportation were marked as the 0th period. Accordingly, the control 0th period and 38th period was determined as the comparison between before transportation and after transportation. Five time-domain features (MR, SDNN, RMSSD, pNN50, and CV) were selected to describe the stress status of living sheep during transportation.
Figure 10 shows the RR interval data of the 38 time periods that were obtained by. According to the calculation formula (6)~(10), the MR, SDNN, RMSSD, pNN50, and CV values of each time period were obtained. A normality test is a formal procedure that involves testing whether a particular data follows a normal distribution. The Kolmogorov–Smirnov (KS) test is the most common normality test procedures available in statistical software, such as Origin Pro 2018 [
43,
44]. Five indicators from 0th to 38th periods were tested for normality while using the Kolmogorov–Smirnov method (
Table 5). At a significant probability of 0.05, the five features are all significantly derived from the normal distribution population (P > 0.05). The student t test is any statistical hypothesis test, in which the test statistic follows the student t distribution under the null hypothesis [
45,
46]. Subsequently, the features of the comparison period before and after transportation were under the student t-test, and
Table 6 shows the test results. According to the table, there was a significant difference between before and after transportation (P < 0.05).
From the variation curve of
Figure 10, the trend of the five time-domain features was obvious: MR, SDNN, RMSSD, pNN50, and CV had an increasing trend with the longer transportation time, and it had a randomness due to the change of road conditions. The MR of time-domain generally showed an upward but unstable trend with the time increasing during the transportation. It means that the average RR intervals of sheep gradually increased during transportation, and the heart beat gradually slowed down. When compared with the quiet 0th period, the sheep were scared with increasing heart beats when they were artificially loaded onto the truck. Therefore, the MR value curve decreased in the 1th and 2th period. As familiar with the transportation environment, the MR increased during the 3th to 5th period. When adapted to the transportation, it showed a tendency to increase slowly. However, due to the transportation environment and road conditions, the MR values did not significantly fluctuate and were unstable. SDNN could reflect the deepening process of stress in living sheep. From
Figure 10c, SDNN significantly rose during transportation, indicating that the stress level of living sheep was increasing, the same as RMSSD. For pNN50 and CV, it reflected the overall variation of HRV. In general, through the analysis of five time-domain features, we obtained the HRV changes of live sheep during transportation, thus showing the change of transport stress.
The correlations between variables can be measured with the use of different indices (coefficients). Pearson’s coefficient of correlation was discovered by Bravais in 1846 [
47]. Pearson’s correlation coefficient is a measure of the strength of the linear relationship between two variables [
48,
49]. By the Pearson’s correlation coefficient test (
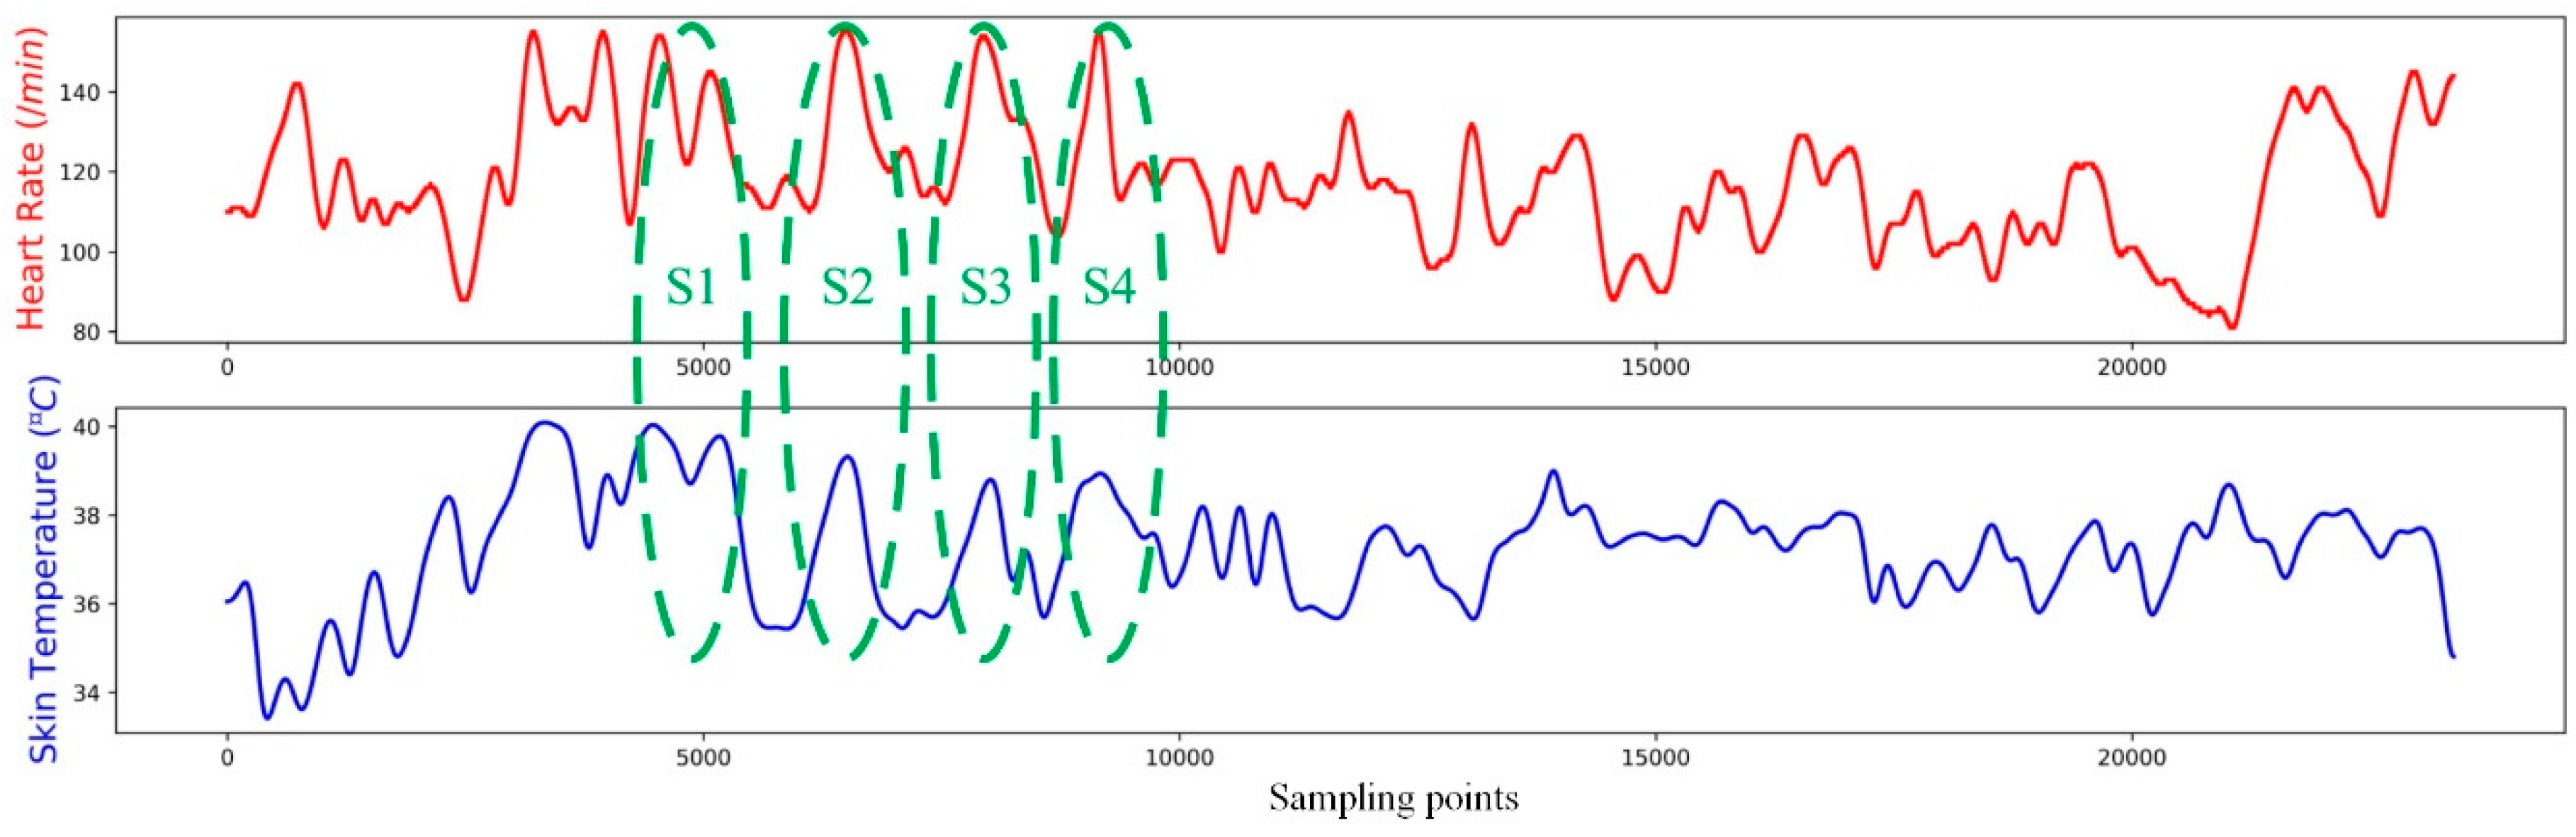
Table 7), we could obtain this conclusion that, for the whole transportation, the direction and strength of correlation between heart rate and skin temperature is weakly positive (
ρ = 0.2342). However, for a few specific stages, such as S2/S3, it is a high positive correlation between HR and ST (
ρ > 0.7). For S1/S4, it is a moderate positive correlation (0.5 <
ρ < 0.7). In general, HR has a certain statistical correlation with ST. The increase in heart rate leads to an increase in skin temperature during stage 1 to 4 (
Figure 11). The reason for the change in heart rate might be the bumps and vibrations on the road during transportation.
This designed Wearable Stress Monitoring System (WSMS) is tailor-made for mutton sheep according to the actual situation of mutton sheep transportation. More robust studies regarding transportation conditions are needed with appropriate methodology in terms of the number of animals involved, acquisition, and analysis techniques implied, before being compatible with other animals. Accordingly, at this stage, the system is not guaranteed to be compatible with other animals.


