Technical Note

Dynamic Performance Evaluation of Various GNSS Receivers and Positioning Modes with Only One Flight Test

1
School of Aerospace Engineering, Sejong University, 209 Neungdong-ro, Gwangjin-gu, Seoul 05006, Korea
2
Future Aircraft Research Division, Korea Aerospace Research Institute, Daejeon 34133, Korea
*
Author to whom correspondence should be addressed.
Electronics 2019, 8(12), 1518; https://doi.org/10.3390/electronics8121518
Submission received: 20 November 2019 / Revised: 5 December 2019 / Accepted: 7 December 2019 / Published: 11 December 2019
(This article belongs to the Special Issue Sensor-Based Navigation and Control with Applications)

Abstract

:
The performance of global navigation satellite system (GNSS) receivers in dynamic modes is mostly assessed using results obtained from independent maneuvering of vehicles along similar trajectories at different times due to limitations of receivers, payload, space, and power of moving vehicles. However, such assessments do not ensure valid evaluation because the same GNSS signal environment cannot be ensured in a different test session irrespective of how accurately it mimics the original session. In this study, we propose a valid methodology that can evaluate the dynamic performance of multiple GNSS receivers in various positioning modes with only one dynamic test. We used the record-and-replay function of RACELOGIC’s LabSat3 Wideband and developed a software that can log and re-broadcast Radio Technical Commission for Maritime Services (RTCM) messages for the augmented systems. A preliminary static test and a drone test were performed to verify proper operation of the system. The results show that the system could efficiently evaluate the performances of stand-alone, differential GNSS, and real time kinematics positioning for three GNSS receivers in two different positioning modes by repeatedly re-radiating the recorded signals acquired through only one flight. Our proposed system is expected to be useful in evaluating dynamic navigation performance accurately and conveniently in a valid manner.

1. Introduction

GNSS signals transmitted by medium Earth orbit (MEO) satellites [1] are easily affected by noise and errors during propagation through atmospheric layers [2]. In addition to errors and noise, the GNSS positioning performance completely depends on various factors, such as the positioning mode, receiver location, signal reception time, satellite geometry, and constellation [3]. Because of these vulnerabilities and dependency to signal environments, field testing with real signals before applying the high-accurate applications is very important to analyze whether their navigation and position will work as planned in the real world.
The performance of GNSS is generally assessed through long-term static positioning error analysis for several hours or even days [4]. In such analyses, although all the signal environments are not strictly controlled, the effects of uncontrolled environments in a statistical sense are not so overwhelming that the long-term processing and analysis distort the original performance of GNSS receivers. Static test environments allow sufficient power, time, and space for the comparison of the performance of various GNSS receivers simultaneously under the same conditions (e.g., satellite signal environment). Static tests also enable direct analysis of errors in a position domain because they are generally performed based on precisely surveyed known positions.
On the other hand, performance assessments during dynamic tests are very difficult and non-standardized. Unlike the static test, the space and power are very limited in dynamic vehicles, and thus, simultaneous test sessions or exactly same trajectories cannot be guaranteed. In particular, the maximum operating time of an unmanned aerial vehicle (UAV) is very short (less than 30 min), and its space and payload are not sufficient to carry multiple GNSS receivers. Satellite visibility, ionospheric [5,6] and tropospheric effects, and noise levels generally change with time. Even if the time correlation of GNSS signals between multiple test sessions is high, different trajectories or attitudes might induce large differences in GNSS signal quality. Post-processing RINEX (receiver independent exchange format) data from various receivers can be one of the good options for evaluating the characteristics of receiver measurements in a dynamic environment [7,8]. This method is suitable for evaluating the measurement quality of each receiver and for analyzing the performance of known or newly developed algorithms, but it has limitations in evaluating the performance of commercial receivers whose detailed positioning algorithms are not disclosed.
In order to analyze the GNSS navigation performances of dynamic systems such as UAV applications, it is very important to ensure validity of evaluation by providing the exact same dynamic environments for all the receivers or modes. To overcome the limitations of the dynamic test, several radio frequency (RF) record-and-replay approaches have been suggested and applied to a test driving [9,10]. This testing approach represents an effective and efficient method of testing stand-alone hardware receivers in a dynamic mode, but it cannot be applied for high-performance positioning modes, which require additional correction information to the GNSS RF signals.
In this study, we propose a practical methodology that provides the same signal environments to different receivers and various augmented navigation modes to meet emerging and increasingly high expectations of users. For system implementation, we used RACELOGIC LabSat 3 Wideband [11], recording and replaying GNSS signals (e.g., GPS L1, L2, and L5) as suggested by previous research. In addition, our proposed “RTCM Logger and Broadcaster” software stores Radio Technical Commission for Maritime Services (RTCM) [12,13] messages and feeds them to multiple GNSS receivers to evaluate the differential GNSS (DGNSS) [14,15] or real-time kinematic (RTK) [16] performance as well as stand-alone GNSS performance. We also analyze whether pseudorange and carrier phase measurements from live and replayed signals are both equivalent, which can explain the repeatability of the position solutions.
The remainder of this paper is structured as follows. In Section 2, the suggested methodology and the developed system are introduced. Section 3 shows the results of preliminary static tests to verify the GNSS performance evaluation system. The evaluation system was used for a drone flight test, and its performance assessments for multiple GNSS receivers and various positioning modes are described in Section 4. The discussions and conclusions are given in Section 5.

2. Method and System Implementation

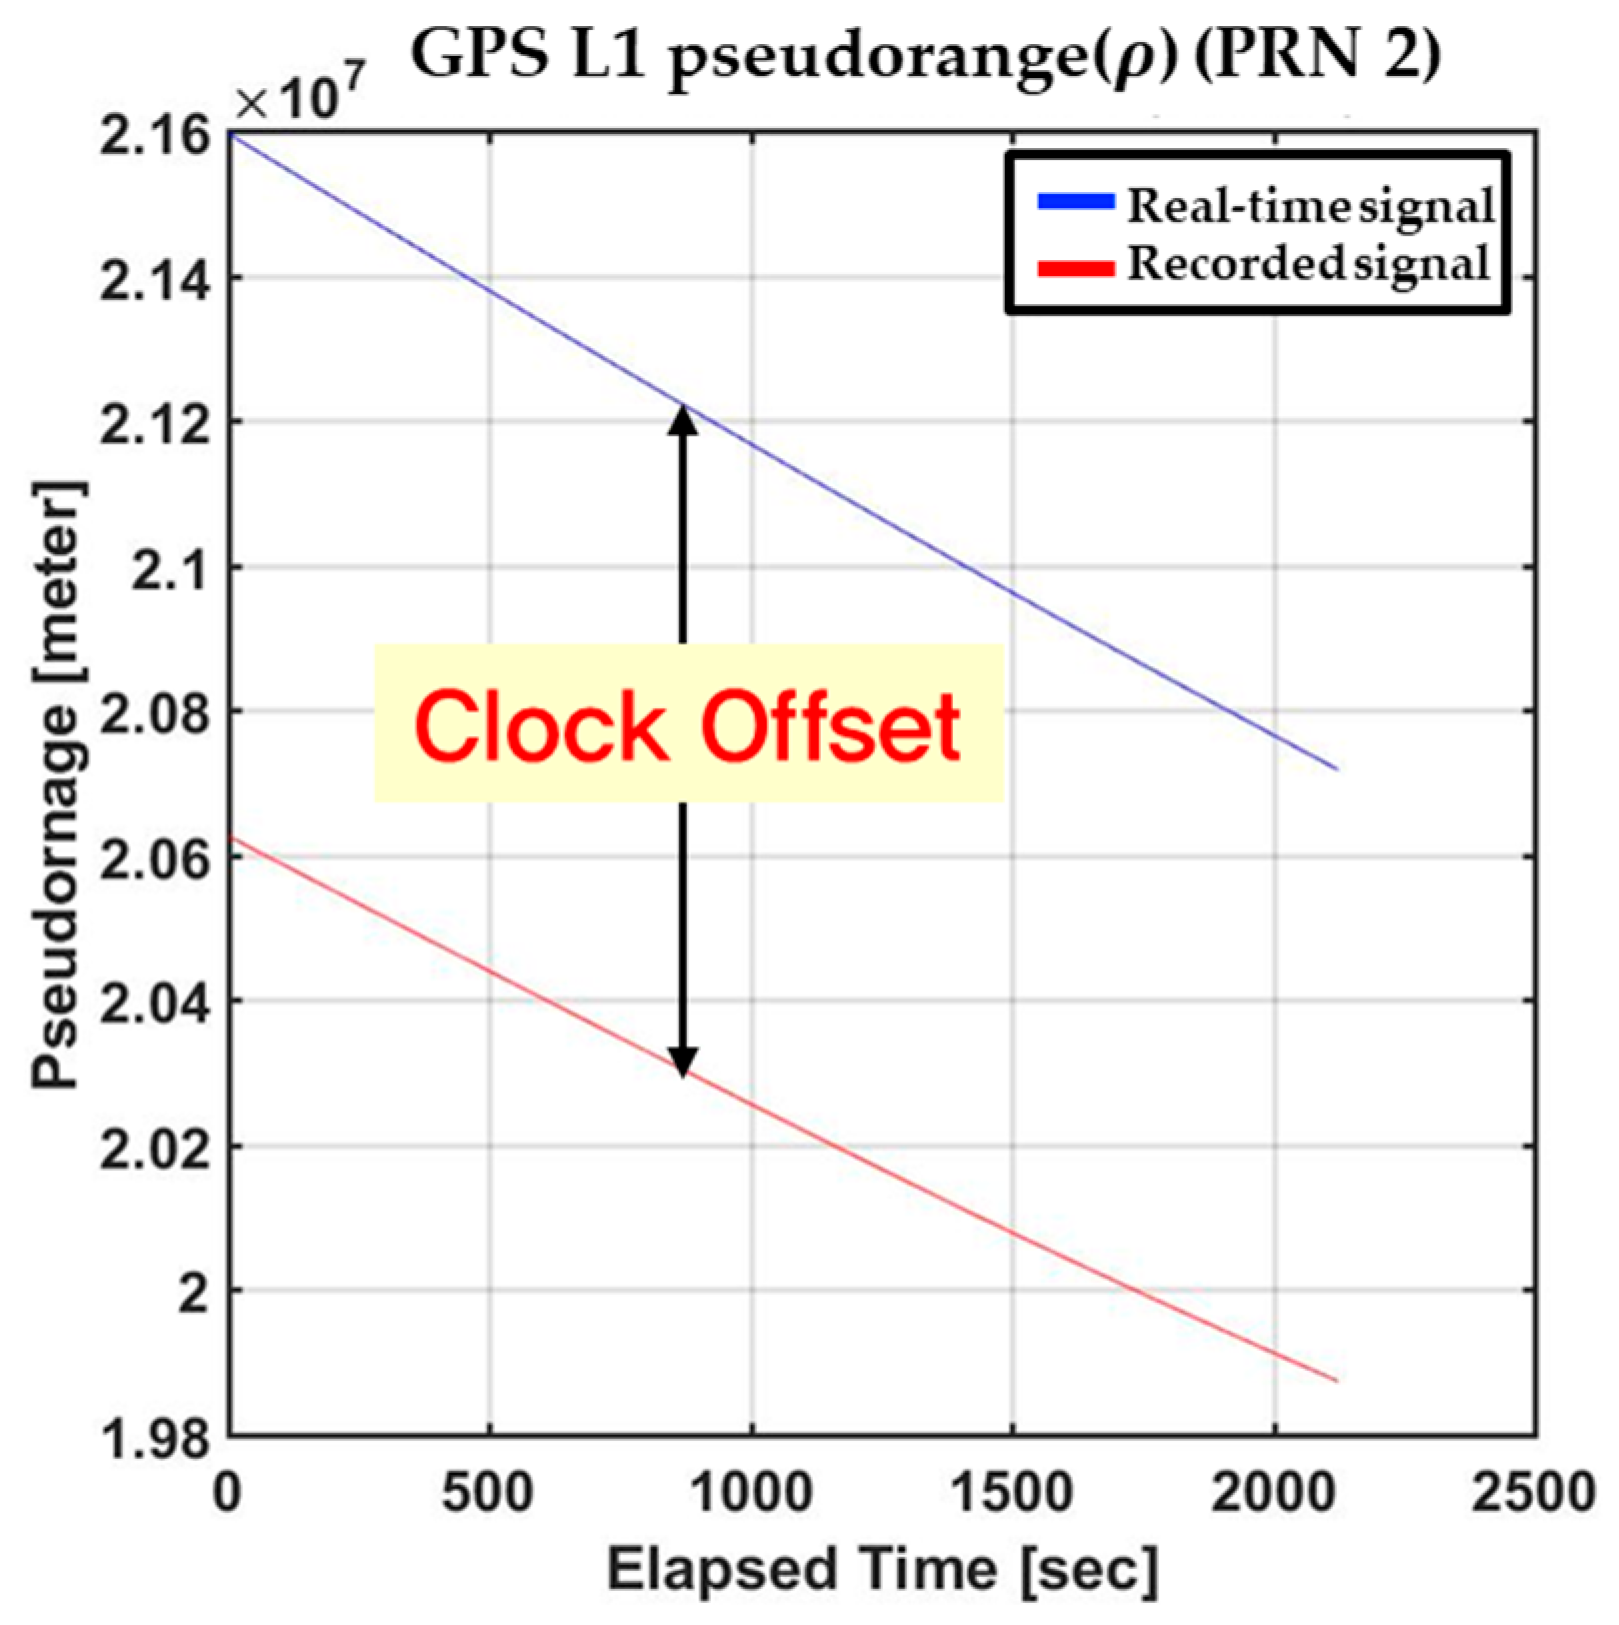
2.1. GNSS Signal Recording and Replaying

Because repeatable and controllable signals cannot be ensured for every test session in dynamic testing under live-sky conditions, the ability to exhaustively field-test products in real-world conditions is necessary for developers of location-aware chipsets, devices, and systems before launching them. When budgets and time are both under pressure, they inevitably select simulators, but simulators cannot anticipate the full richness and variety of real-world conditions. In this sense, the record-and-replay method, which is derived from software-defined radio (SDR) paradigm [17], is one of the easy and efficient means of characterizing new high-performing product performance in the real world by providing a combination of realism and repeatability, which is ideal for performance verification.
In this study, we used RACELOGIC’s LabSat 3 Wideband, which can record and replay GNSS signals. LabSat 3 supports multi-frequency GNSS signals, such as GPS L1/L2/L5, GLONASS G1/G2/G3, Galileo E1/E5/E6, BeiDou B1/B2/B3, QZSS L1/L2/L5, and SBAS L1/L5 anywhere and anytime without the need for connecting to a desktop or laptop computer [11]. This device is suitable for the purpose of our verification methodology, i.e., providing the same signal environment to all GNSS receivers for which the performance is to be evaluated. The simulation or validation test is based on the replay functionality of similar devices, but most are for representing the resilience of their algorithms or devices to increasing GNSS vulnerabilities, such as jamming, spoofing [18,19,20], multipath [21], and interferences.

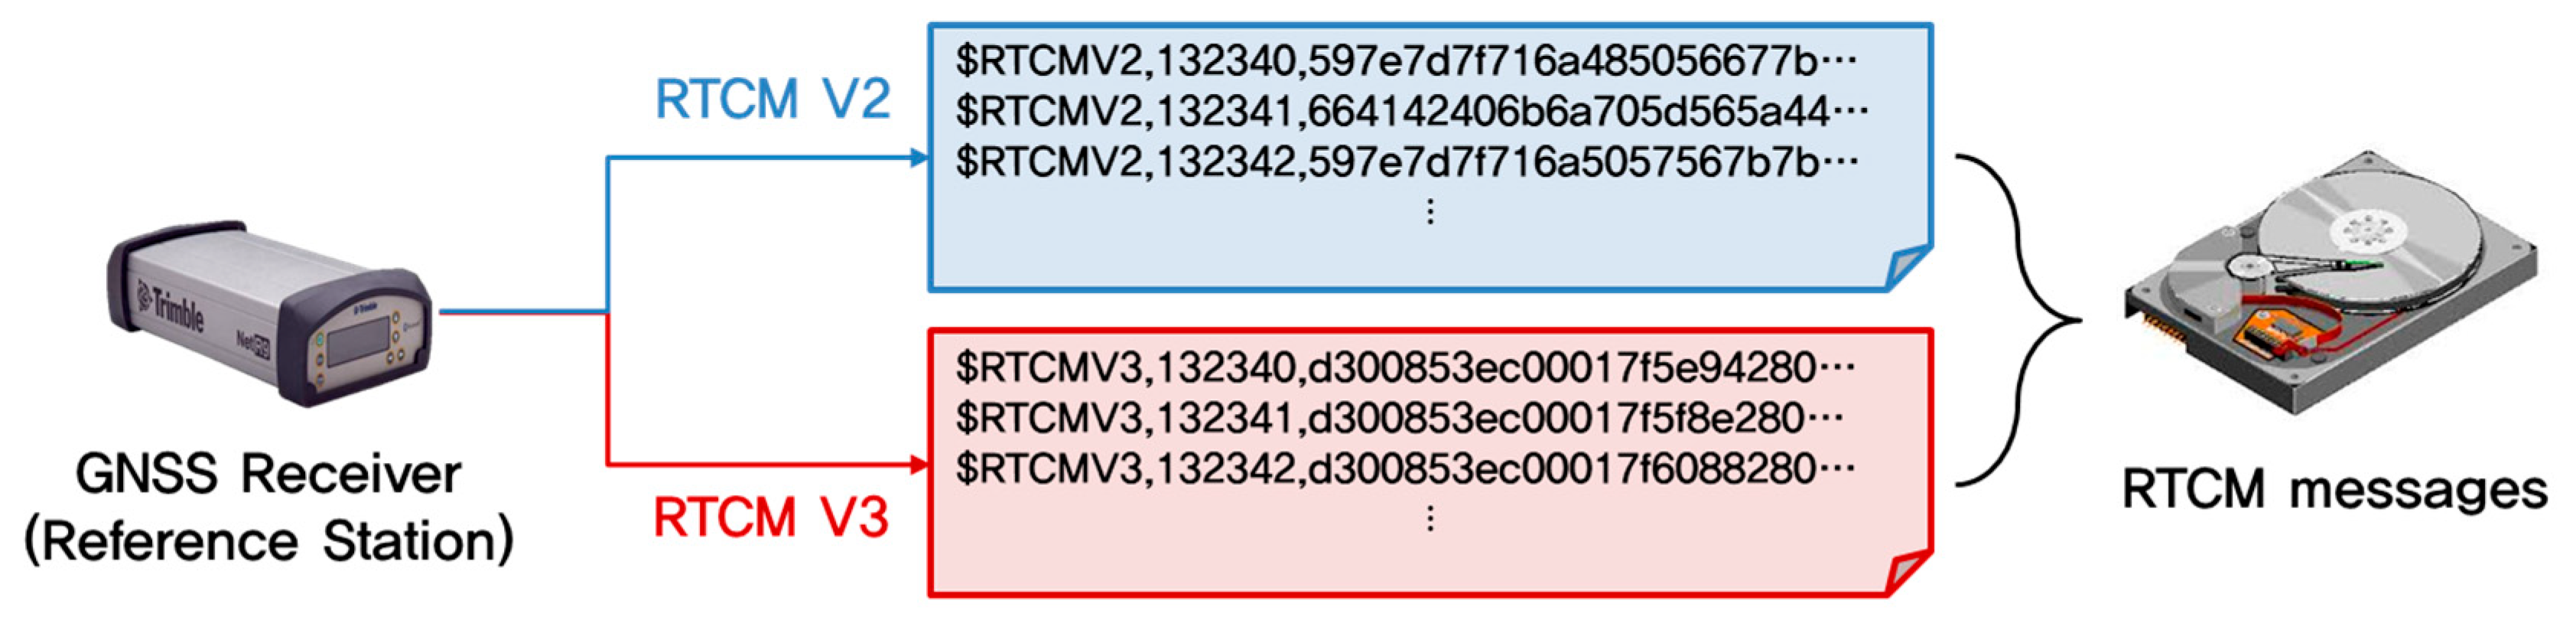
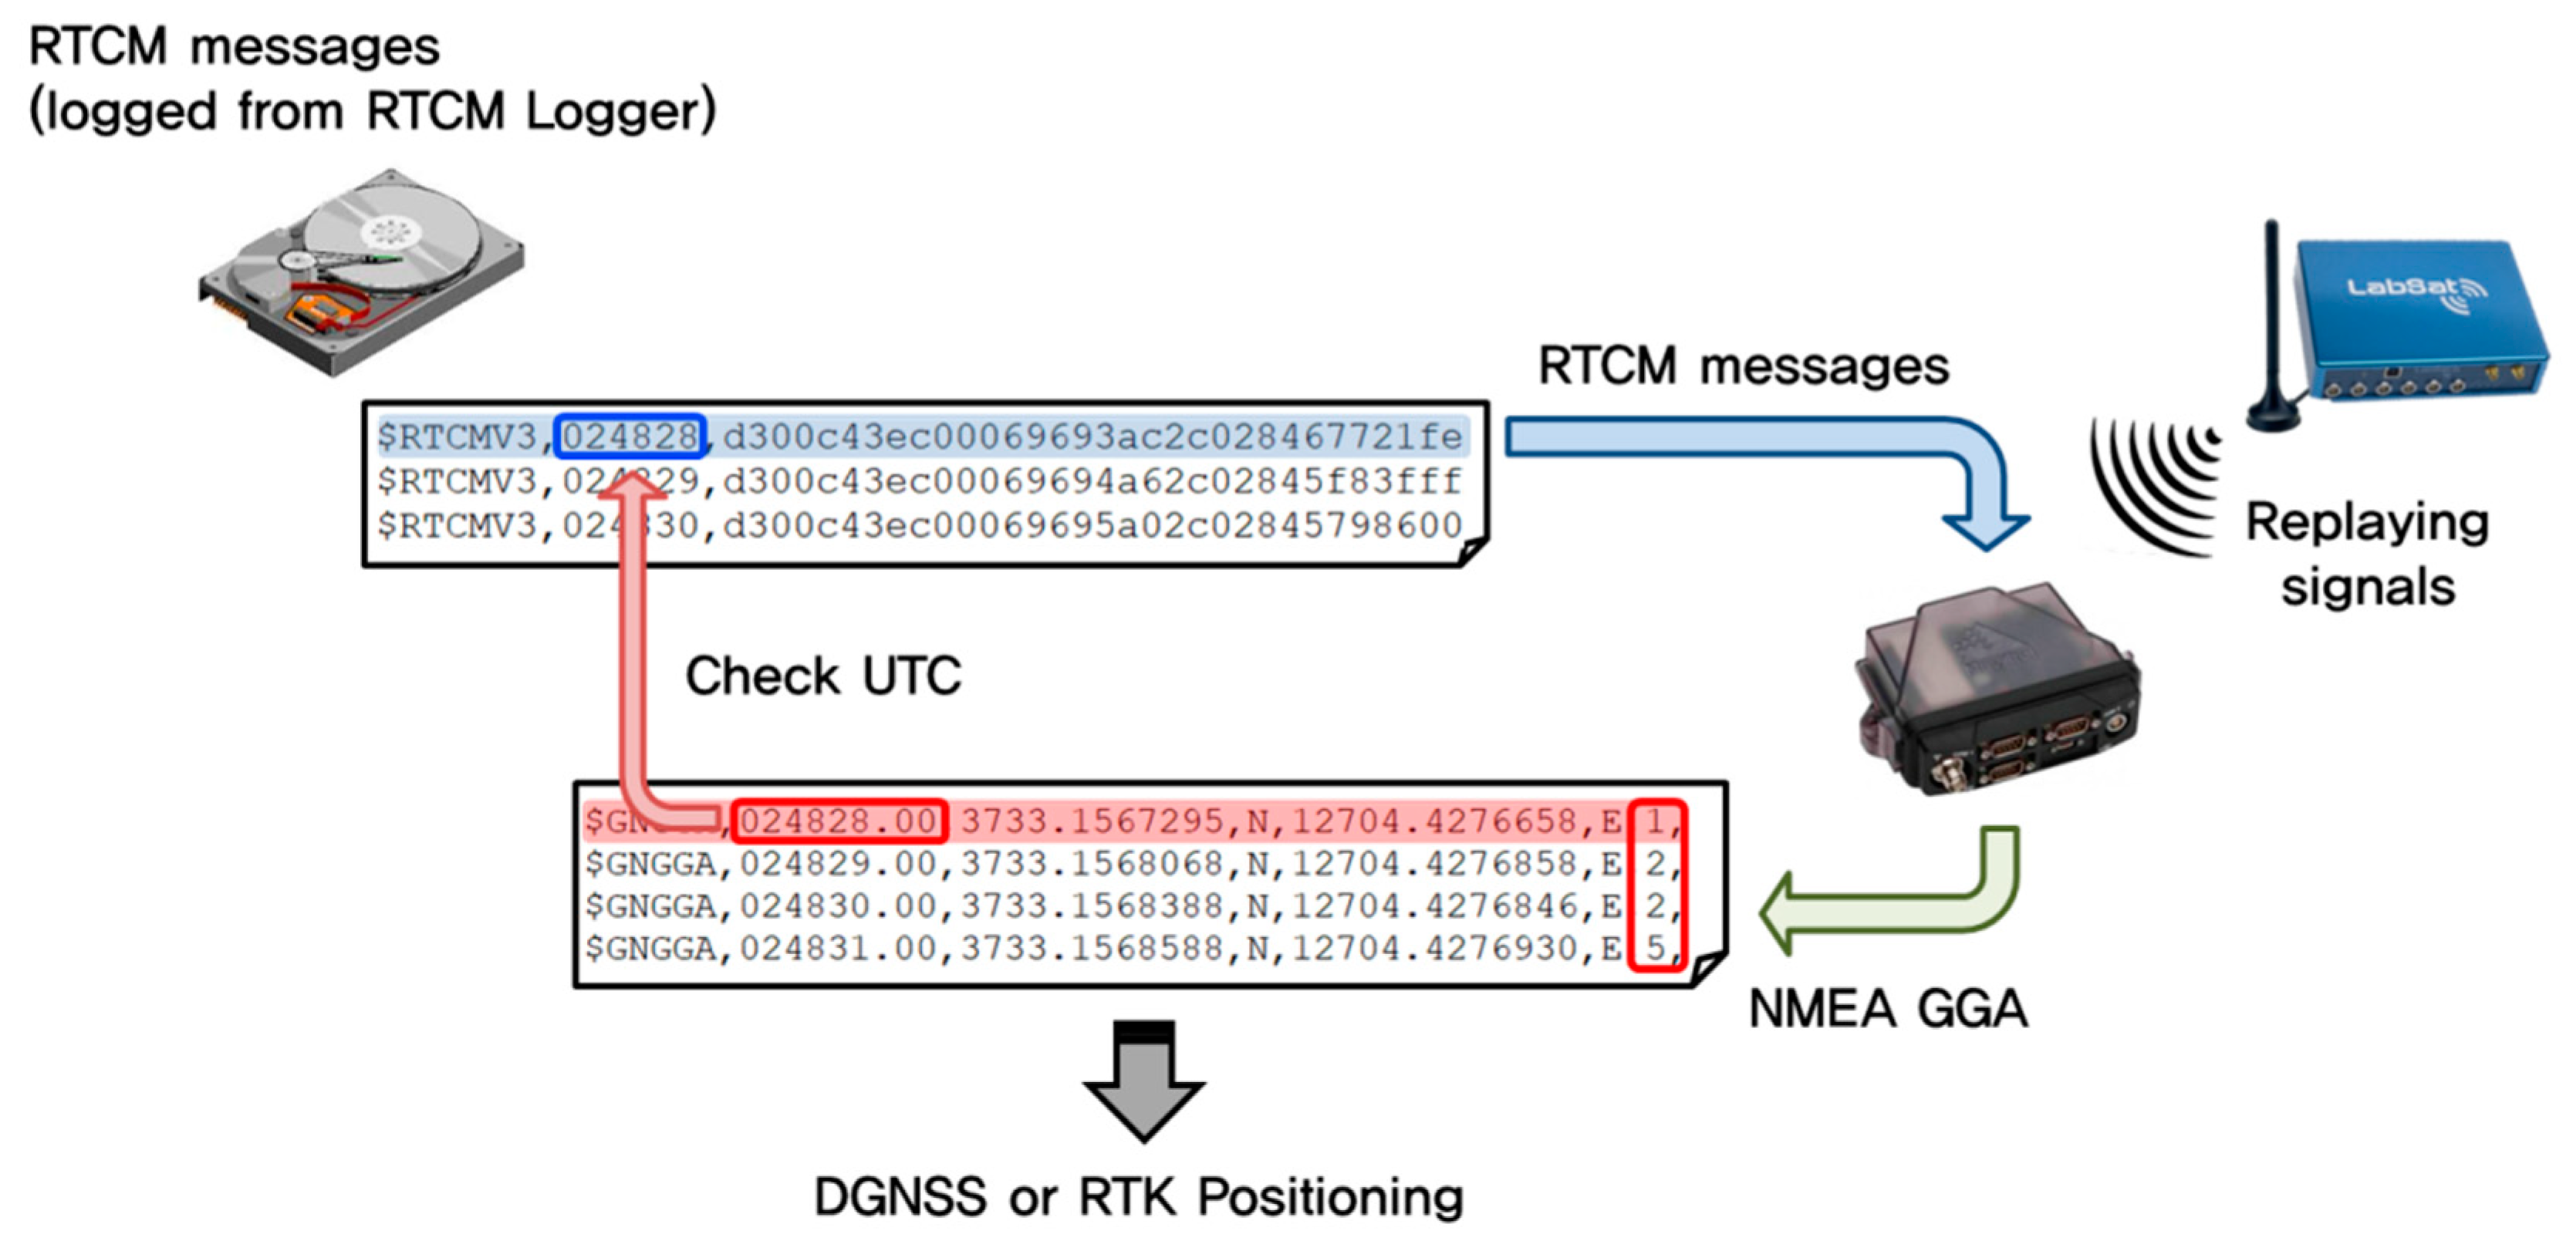
2.2. Software for Logging and Broadcasting RTCM Messages

Most GNSS receivers support various types of positioning modes, such as precise point positioning (PPP) [22], differential GNSS (DGNSS) [14], satellite-based augmentation system (SBAS) based on wide-area DGPS (WADGPS) [23], real-time kinematic (RTK) [16], and network RTK [24,25,26] in addition to the stand-alone mode. Among these positioning modes, the stand-alone and SBAS modes do not require an additional communication channel for receiving correction data. Therefore, these modes are easy and simple to configure in UAVs, and recorded GNSS signals are easily provided using LabSat 3. For other modes, correction data generated from ground reference station facilities must be fed to the GNSS receivers through additional communication channels. Even though a pair of two high-end signal recorders enables the reproduction of the working process of an RTK base-rover system [27], GNSS RF signals should be logged at one as a rover and the other as a base station, and they should be synchronized to replay the RTK process. In particular, since various services that provide GNSS correction messages via the internet without any physical base station have recently become common, applications using the pair of two devices are inevitably becoming very limited. Therefore, it is not only complicated to configure a real-time system, but also impossible to perform the test using a single device. To solve this problem practically, we propose a method that enables a rover GNSS receiver to operate in DGNSS, RTK, or network RTK modes using the RF signal replayed at only one device. We developed a software that logs the correction data of the augmentation system during the recording of real-time GNSS RF signals. The software can also re-broadcast the logged corrections to the GNSS receivers when replaying the recorded signals. Using the software, it is possible to evaluate and compare the performances of various positioning modes for multiple GNSS receivers.
The developed software consists of ‘RTCM Logger’ and ‘Broadcaster’ parts. The RTCM Logger writes RTCM version 2 and 3 messages in a file and the RTCM Broadcaster re-broadcasts the logged RTCM messages to each GNSS receiver. While LabSat 3 is recording GNSS RF signals, the RTCM Logger can receive RTCM messages through the Network Transport of RTCM via Internet Protocol (NTRIP) [28], Transmission Control Protocol/Internet Protocol (TCP/IP) or a serial port. Then, the received RTCM messages are converted and written in a format starting with a header ($RTCMV2 or $RTCMV3) to facilitate the distinguishing of the augmentation mode. Subsequently, the RTCM messages are written in the binary format with its coordinated universal time (UTC) [29], as shown in Figure 1.
During signal replay, the RTCM Broadcaster can obtain the UTC time of the replayed signal through the National Marine Electronics Association (NMEA) [30] GGA sentence from the GNSS rover receiver. The RTCM Broadcaster searches for the UTC time from the logged file, and then feeds the timely corresponding message(s) to the receivers, as shown in Figure 2. The correction age of the NEMA GGA sentence represents the duration since the correction was fed to the receiver, which is typically 1 s for normal DGPS and RTK conditions. We can ensure that the correction has been delivered to the receiver on time by monitoring the correction age, and this methodology also allows us to simulate a long-latency case due to a bad connection to the correction server.

2.3. Performance Evaluation Method of Various GNSS Receivers

Figure 3 illustrates the flow of the methodology for evaluating and analyzing the performance of GNSS receivers for a moving vehicle. First, the received live GNSS signals are recorded while a vehicle with LabSat 3 is moving along a specific trajectory. At the same time, RTCM messages for DGPS or RTK are also written by the RTCM Logger. Then, the recorded signals are re-radiated to GNSS receivers, and the RTCM message(s) corresponding to the UTC time for the replayed signal is/are fed to the receivers by the RTCM Broadcaster. Through these procedures, the trajectory of the drone flight for each positioning mode (e.g., stand-alone, DGPS, RTK, SBAS) of the receivers can be obtained. We processed receiver independent exchange format (RINEX) [31] files (one for the trajectory of the vehicle, and another from reference stations located near the rover) using GNSS post-processing software Trimble Business Center (TBC) [32] to obtain 5 mm accurate true trajectories of the moving vehicle. Finally, we evaluated the performance of the receivers by comparing the calculated trajectory from multiple receivers with the true trajectory obtained using TBC.

3. Verification of the Performance Evaluation System

3.1. Static Test Configuration

To verify the suitability of our developed system, we conducted static tests using LabSat 3, and the RTCM message logging/broadcasting software. First, we performed range-domain and position-domain analyses to examine whether the use of LabSat 3 degraded the performance. For this analysis, we collected GNSS satellite signals received by a GNSS antenna (NovAtel’s GPS-703-GGG Triple-Frequency Pinwheel GNSS Antenna) installed on the roof of the Chung-moo building at Sejong University in South Korea, as shown in Figure 4. The signals were processed using NovAtel FlexPak6 (high-end receiver), u-blox M8P (low-cost receiver), and LabSat 3, which are connected to a signal splitter. After recording the live signals on LabSat 3, the recorded signals were re-radiated to both FlexPak6 and M8P receivers. We obtained the RINEX file for each receiver, for use in the range domain analysis. Position results were also obtained from both receivers, as described in Section 2, and then performance analysis in the position-domain was performed.

3.2. Measurement-Domain Test

To compare the real time measurements with those from the recorded RF signals, we analyzed double difference (DD) measurements using code and phase measurements. Even in a static test, code ( P ) and phase ( Φ ) measurements obtained from both signals are mathematically different to each other due to their own receiver clock bias ( B ) and cycle ambiguity ( N ) terms, as described in Equations (1) and (2) [22].
P r , i s = ρ r s + B r b s + T r s + I r , i s + M P r , i s + ε P r , i s
Φ r , i s = ρ r s + B r b s + T r s I r , i s + M Φ r , i s + N r , i s λ i s + ε Φ r , i s
The subscript r denotes the source of signals (real time (RT) or LabSat 3 (LS)), and the subscripts s and i denote the s-th satellite and type of carrier frequency, respectively. In addition, ρ ,   B ,   b ,   T ,   I ,   M ,   N ,   λ ,   and   ε denote the geometric range from satellite to ground receiver, receiver clock bias, satellite clock bias, tropospheric delay, ionospheric delay, multipath error, integer ambiguity, carrier wavelength, and measurement noise, respectively.
As direct one-by-one comparisons of the measurements cannot be performed in a statistical manner (Figure 5) due to different B and N , we calculated DD measurements for the s-th and t-th satellites between RT and LS. DD ( Δ ) between measurements of RT and LS can be expressed as follows.
Δ P i = Δ ρ + Δ B Δ b + Δ T + Δ I i + Δ M Δ P i + Δ ε Δ P i
Δ Φ i = Δ ρ + Δ B Δ b + Δ T + Δ I i + Δ M Δ Φ i + Δ N i λ i + Δ ε Δ Φ i
In the above equations, the geometric range ( ρ ), multipath error (M), and ionospheric (I) and tropospheric (T) delay are also canceled out because both signals are from a zero-baseline configuration. Receiver ( B ) and satellite ( b ) clock biases are also removed by the differences between satellites and receivers, respectively. If the code measurements from RT and LS are exactly the same, only noise ( Δ ε Δ P i ) should remain in DD of the code measurements ( Δ P i ) . In the same manner, the phase DD ( would not contain all the terms other than the ambiguity ( Δ N i λ i ) and noise ( Δ ε Δ Φ i ) . Assuming that any cycle slip of both measurements does not occur in Equation (4), DD of integer ambiguity ( Δ N i ) can be estimated and removed by the mean integer value of Δ Φ i λ i from Equation (4). Figure 6a,b show the DD residual errors of carrier phase measurements obtained from real-time and LabSat 3 signals for all the visible satellites, respectively. The maximum and root mean square (RMS) values of DD residuals of both receivers are less than 0.02 m, as shown in Table 1.

3.3. Position-Domain Test

We also examined whether performance degradation occurred due to the use of LabSat 3 and our developed software through position domain analysis. We conducted real-time and semi-real-time static tests using the live and recorded signals. As shown in Figure 7, 3 receivers and LabSat 3 were connected to the same antenna to receive the same live satellite signals. RTCM v2 and v3 messages generated by Trimble NetR9 were respectively fed to M8P for RTK positioning and EVK-6 for DGPS positioning. These messages were also logged by our developed RTCM logger. After the real-time static test, we performed the semi-real-time static test by re-radiating the recorded signals to both receivers. In addition, for DGPS and RTK positioning, RTCM v2 and v3 messages at the time corresponding to the UTC time in the NMEA GGA sentence obtained for each receiver were fed to each receiver, as shown in Figure 8. Finally, we obtained the NMEA files (GGA) from each receiver.
Figure 9 and Figure 10 show the differences between east-north-up (ENU) errors of the real-time and semi-real time tests in DGPS and RTK modes. In case of the DGPS mode, there were discrepancies due to noise differences between real-time and recorded RF signals, but biases were not observed. Furthermore, the position fix type in the NMEA GGA sentence turned to 2 (DGPS mode) at the exact same time that the real-time process turned to the DGPS mode, and the fix type stayed at 2 for the remainder of the test. For the RTK case, although the discrepancies increased to about 0.6 m during the initial convergence period of RTK (float mode, fix type = 5), the RMS value of the discrepancies was only 0.001 m during the RTK fixed mode (fix type = 4). Except for the initial convergence period, the RTK fix type (Fixed or Float) was the same overall. These results imply that the use of recorded signals and our developed software does not lead to position performance degradation.

4. Flight Test Performance Evaluation

4.1. Drone Flight Test Configurations

For the dynamic test, we selected a drone capable of mounting the LabSat 3 antenna and configured a flight scenario for the GNSS signal acquisition. We used DJI’s Phantom 3 Professional. Table 2 shows the specifications of Phantom 3.
We divided the drone’s total flight time of 10 min into 3 min of remaining stationary on the ground and 7 min of dynamic maneuvering. The drone flight scenario is as follows. First, the drone was allowed to remain stationary on the ground for 3 min after switching it on. Then the drone was flown along a square trajectory, as shown in Figure 11, after taking off. There are four flight path segments, and each segment includes 1 min of hovering at its waypoint and 30 s of maneuvering to another waypoint.
We carried out the drone flight test on the rooftop of Gwanggaeto building in Sejong University on November 6, 2018, as shown in Figure 12. GNSS signals collected by the drone were recorded in LabSat 3, and RTCM messages generated by Trimble NetR9 (baseline length <1 km) were logged at the same time, as shown in Figure 13. The developed RTCM logger stored the real-time streams of RTCM v 2.3 message to feed the receivers Type (MT) 1 for differential corrections and MT 3 for reference station parameters. It also logged RTCM v3.1 messages of MT 1004 and 1012 with 1005 to re-broadcast L1 and L2 GPS and GLONASS RTK observables in order to replay GPS/GLONASS RTK.
After recording the real time signals through the drone flight test, we performed a total of three re-radiation tests to evaluate the performance of the stand-alone, DGPS, and RTK modes. The recorded signals and RTCM messages were processed by three types of GNSS receivers: Novatel flexpak6, SwiftNav’s Piksi Multi, u-blox M8P, and u-blox EVK-6 (Figure 14). Flexpak6 and Piksi Multi receivers among the them support Beidou and Galileo as well as GPS and GLONASS, however DGPS and RTK of GPS and GLONASS have been analyzed because the correction messages for only GPS and GLONASS have been stored. Even though Phantom 3 does not provide enough payload and space to carry three receivers, the performances of all the receivers with various positioning modes could be evaluated with only one flight test.

4.2. Stand-Alone Mode

In the first test (stand-alone mode), only the recorded signals were input to three receivers, and the performance was analyzed using NMEA files obtained from each receiver. Figure 15 and Figure 16 show the estimated trajectories of the drone and ENU errors in the stand-alone mode, respectively. Table 3 shows RMS and maximum values of errors for each direction. Our proposed system allows intuitive interpretation and easy comparison of the performance of the three different receivers with a single flight test.

4.3. DGPS Mode

Because only u-blox EVK-6 has the DGPS functionality among the three types of receivers, the recorded signals and RTCM v2 messages were input to u-blox EVK-6 for the second test (DGPS mode). The performance was analyzed using the NMEA file obtained from this receiver, referenced to the TBC true trajectory. Figure 17 and Figure 18 show the estimated trajectories of the drone and ENU errors in the DGPS mode, respectively. Table 4 shows that the RMS and maximum values of errors are about 1–2 m and 3–5 m for each direction.

4.4. RTK Mode

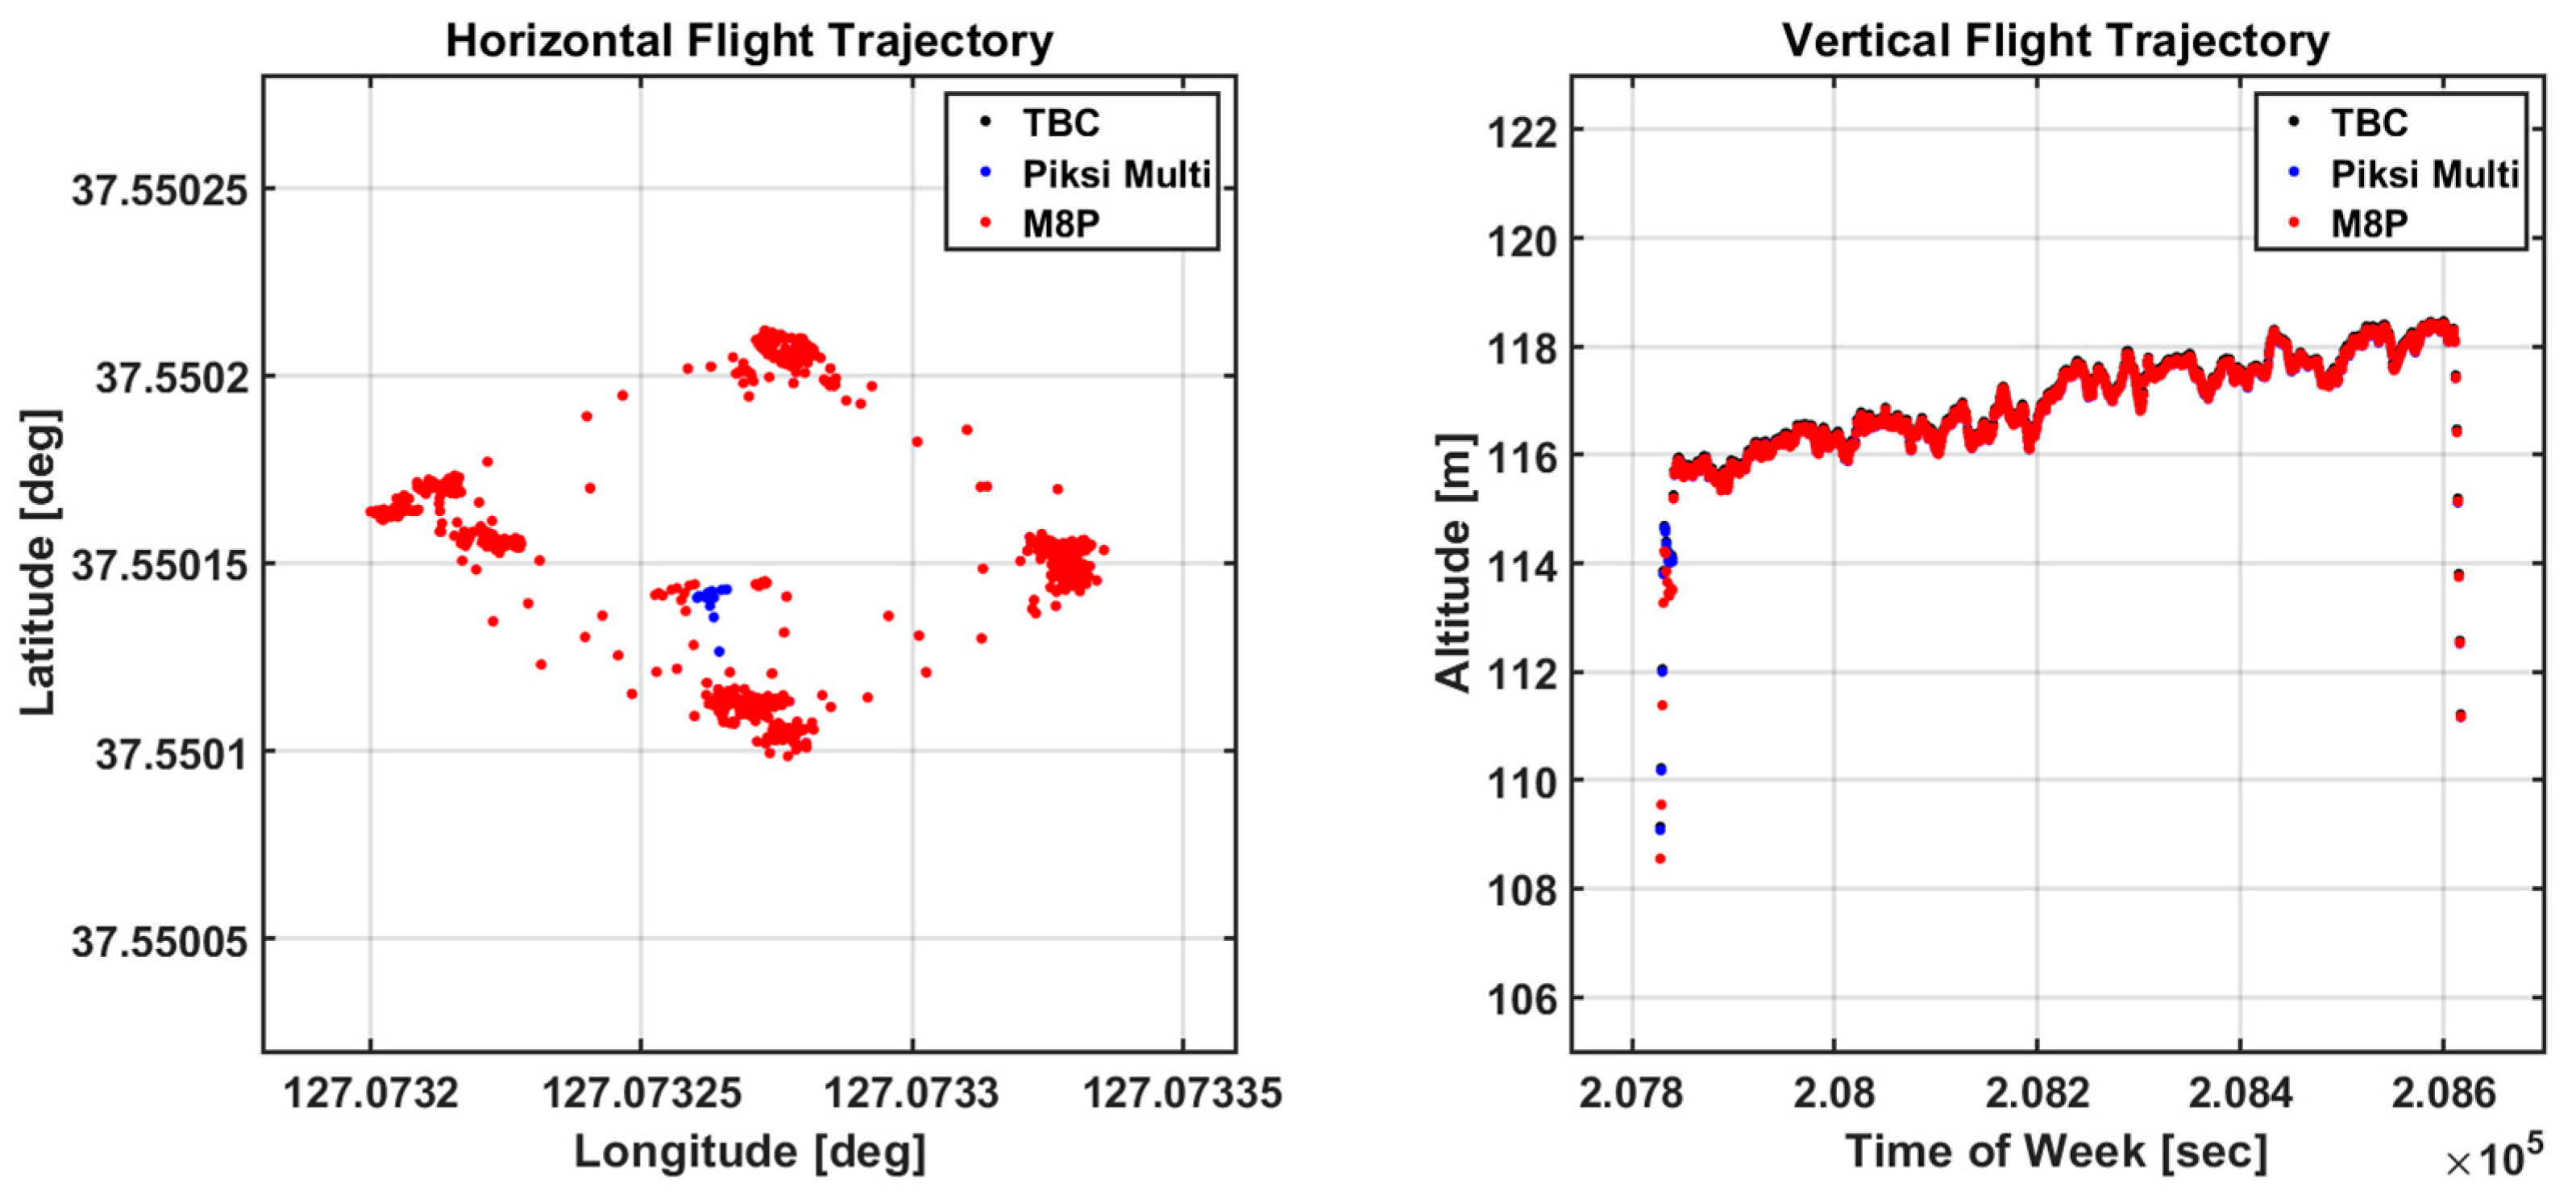
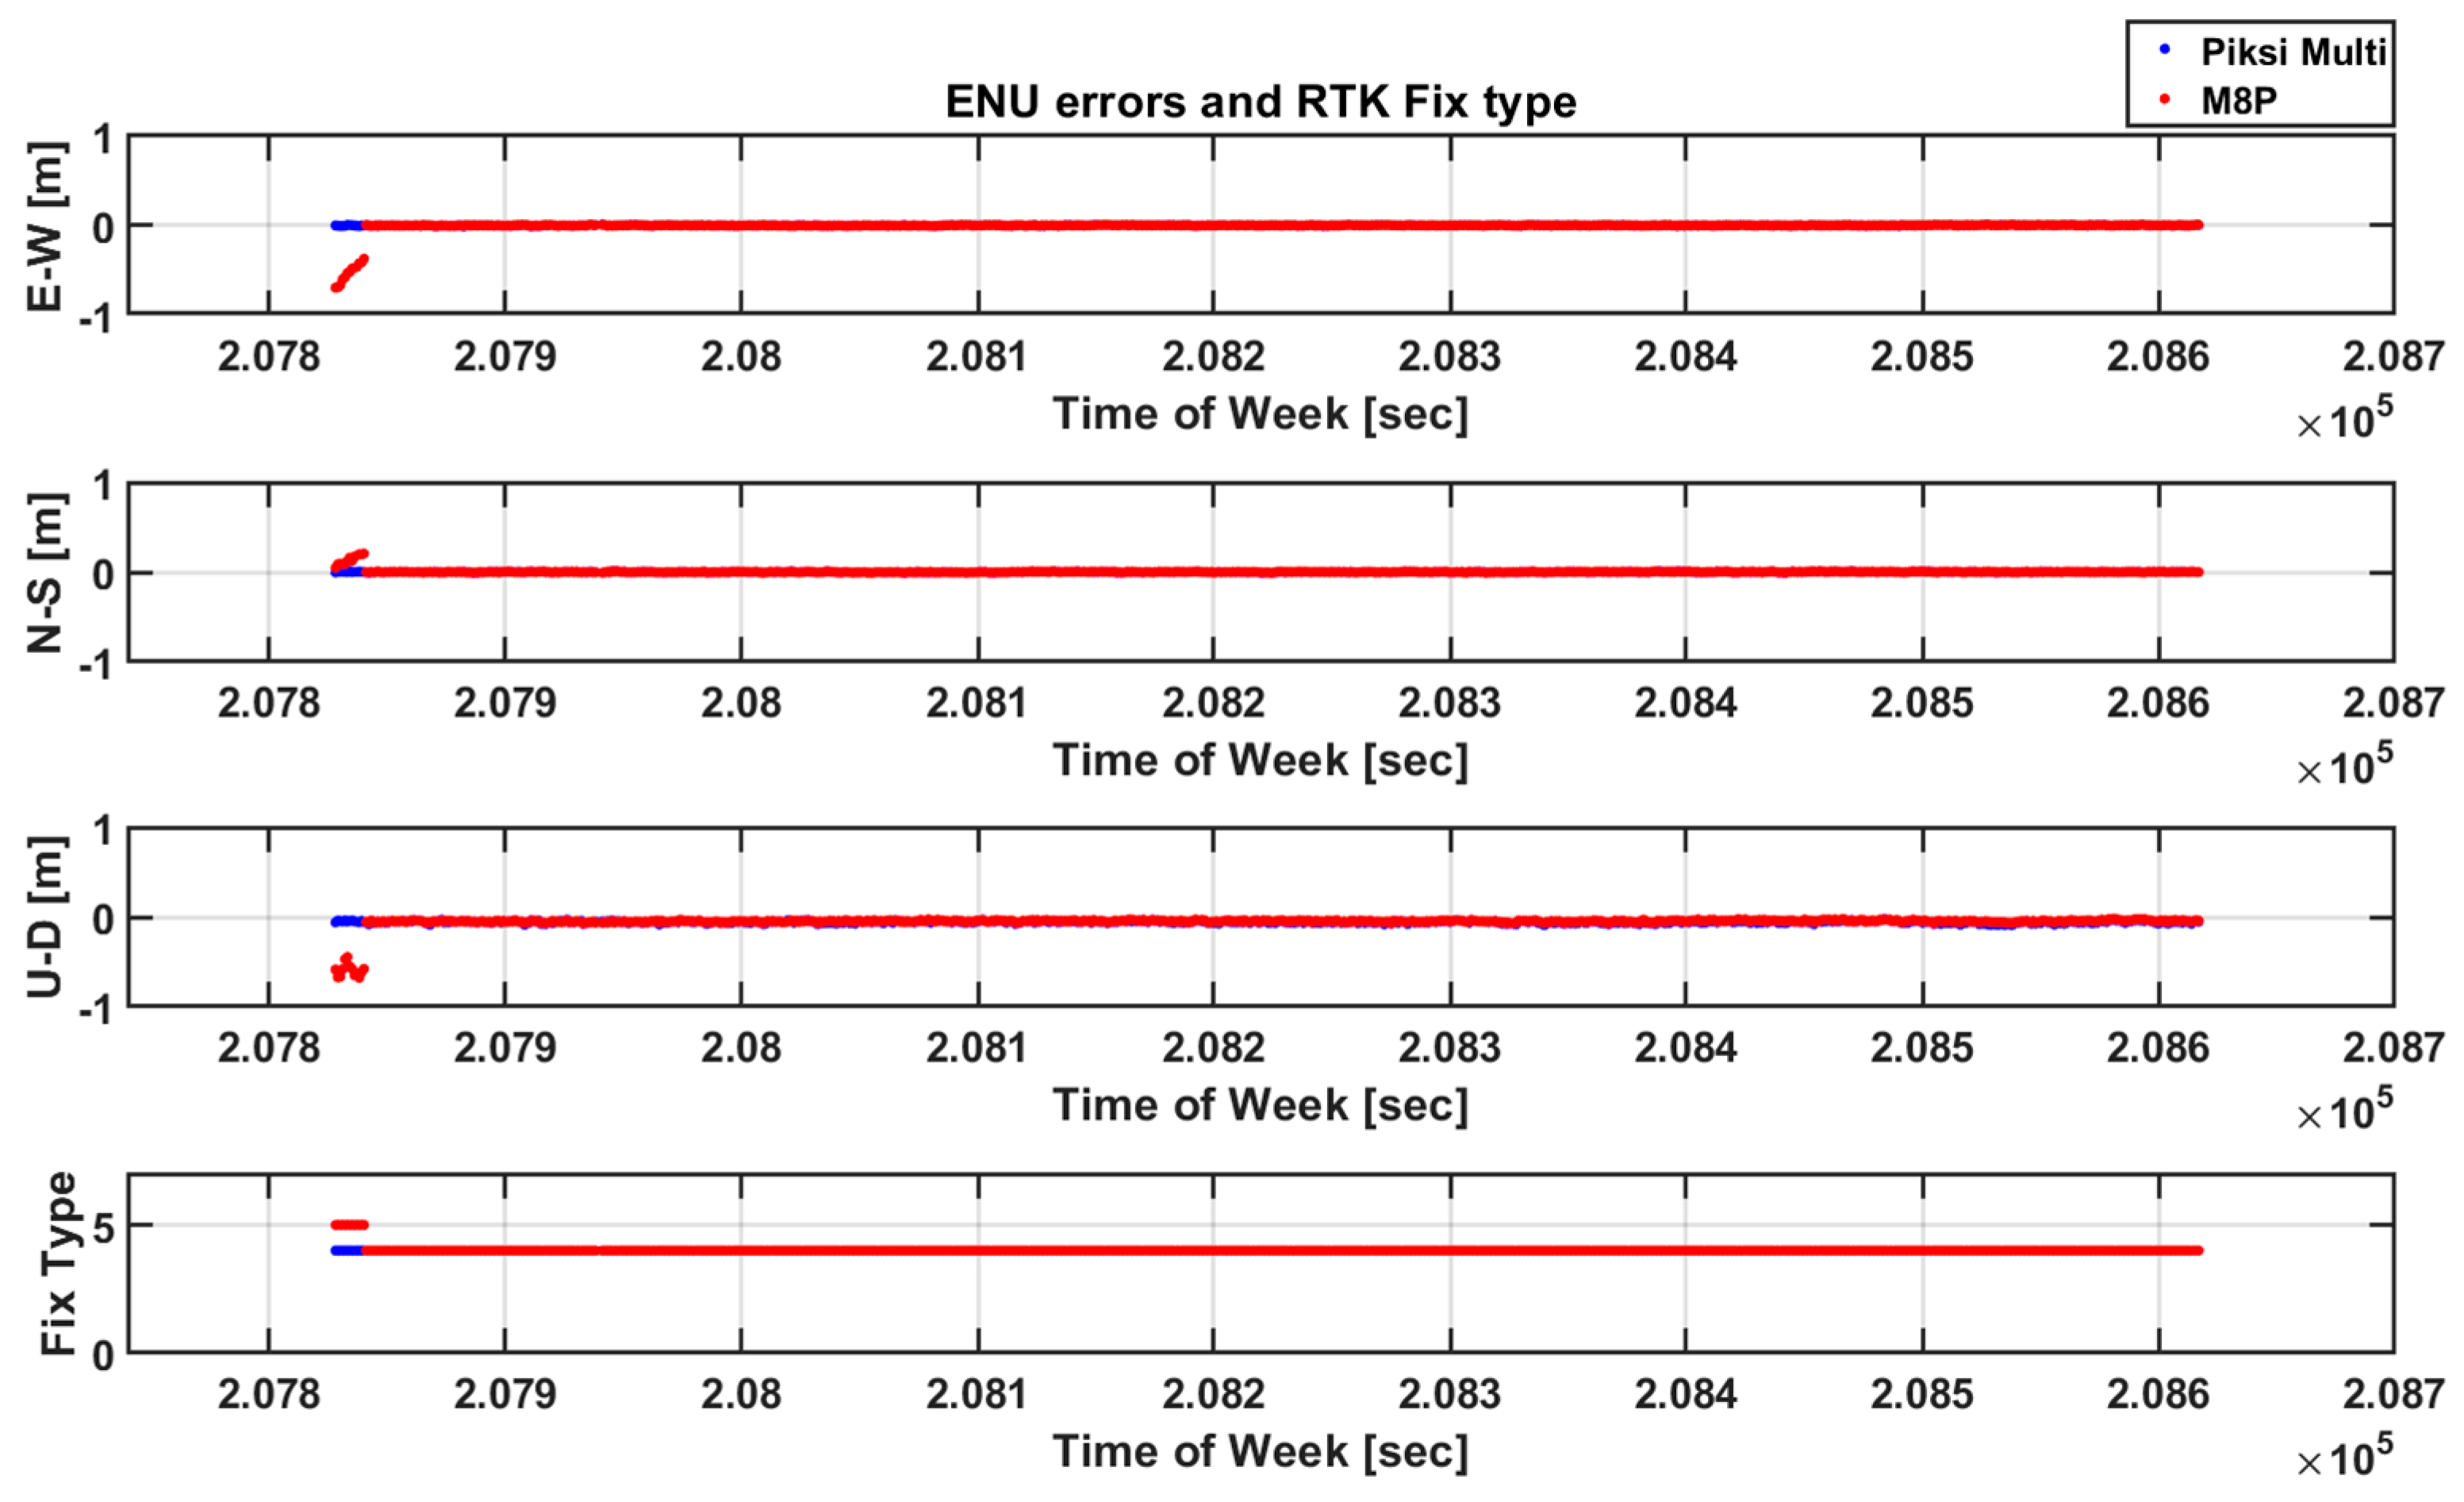
4.4.1. Scenario I: RTK Performance of Different Receivers

In the third test (RTK mode), the recorded signals and RTCM v3 messages were input to u-blox M8P and SwiftNav Piksi Multi, and the performance was analyzed using NMEA files obtained from both receivers. Figure 19 and Figure 20 show the estimated trajectories of the drone and ENU errors with the RTK fix type in the RTK mode, respectively. Table 5 shows RMS and maximum values of errors for each direction as well as Time-to-first-fix (TTFF) and RTK fix rate. According to these results, the positioning performance of the two receivers in the RTK mode are similar at the 1 cm level, and Piksi Multi using dual frequency signals is superior to M8P in TTFF and RTK fix rate.

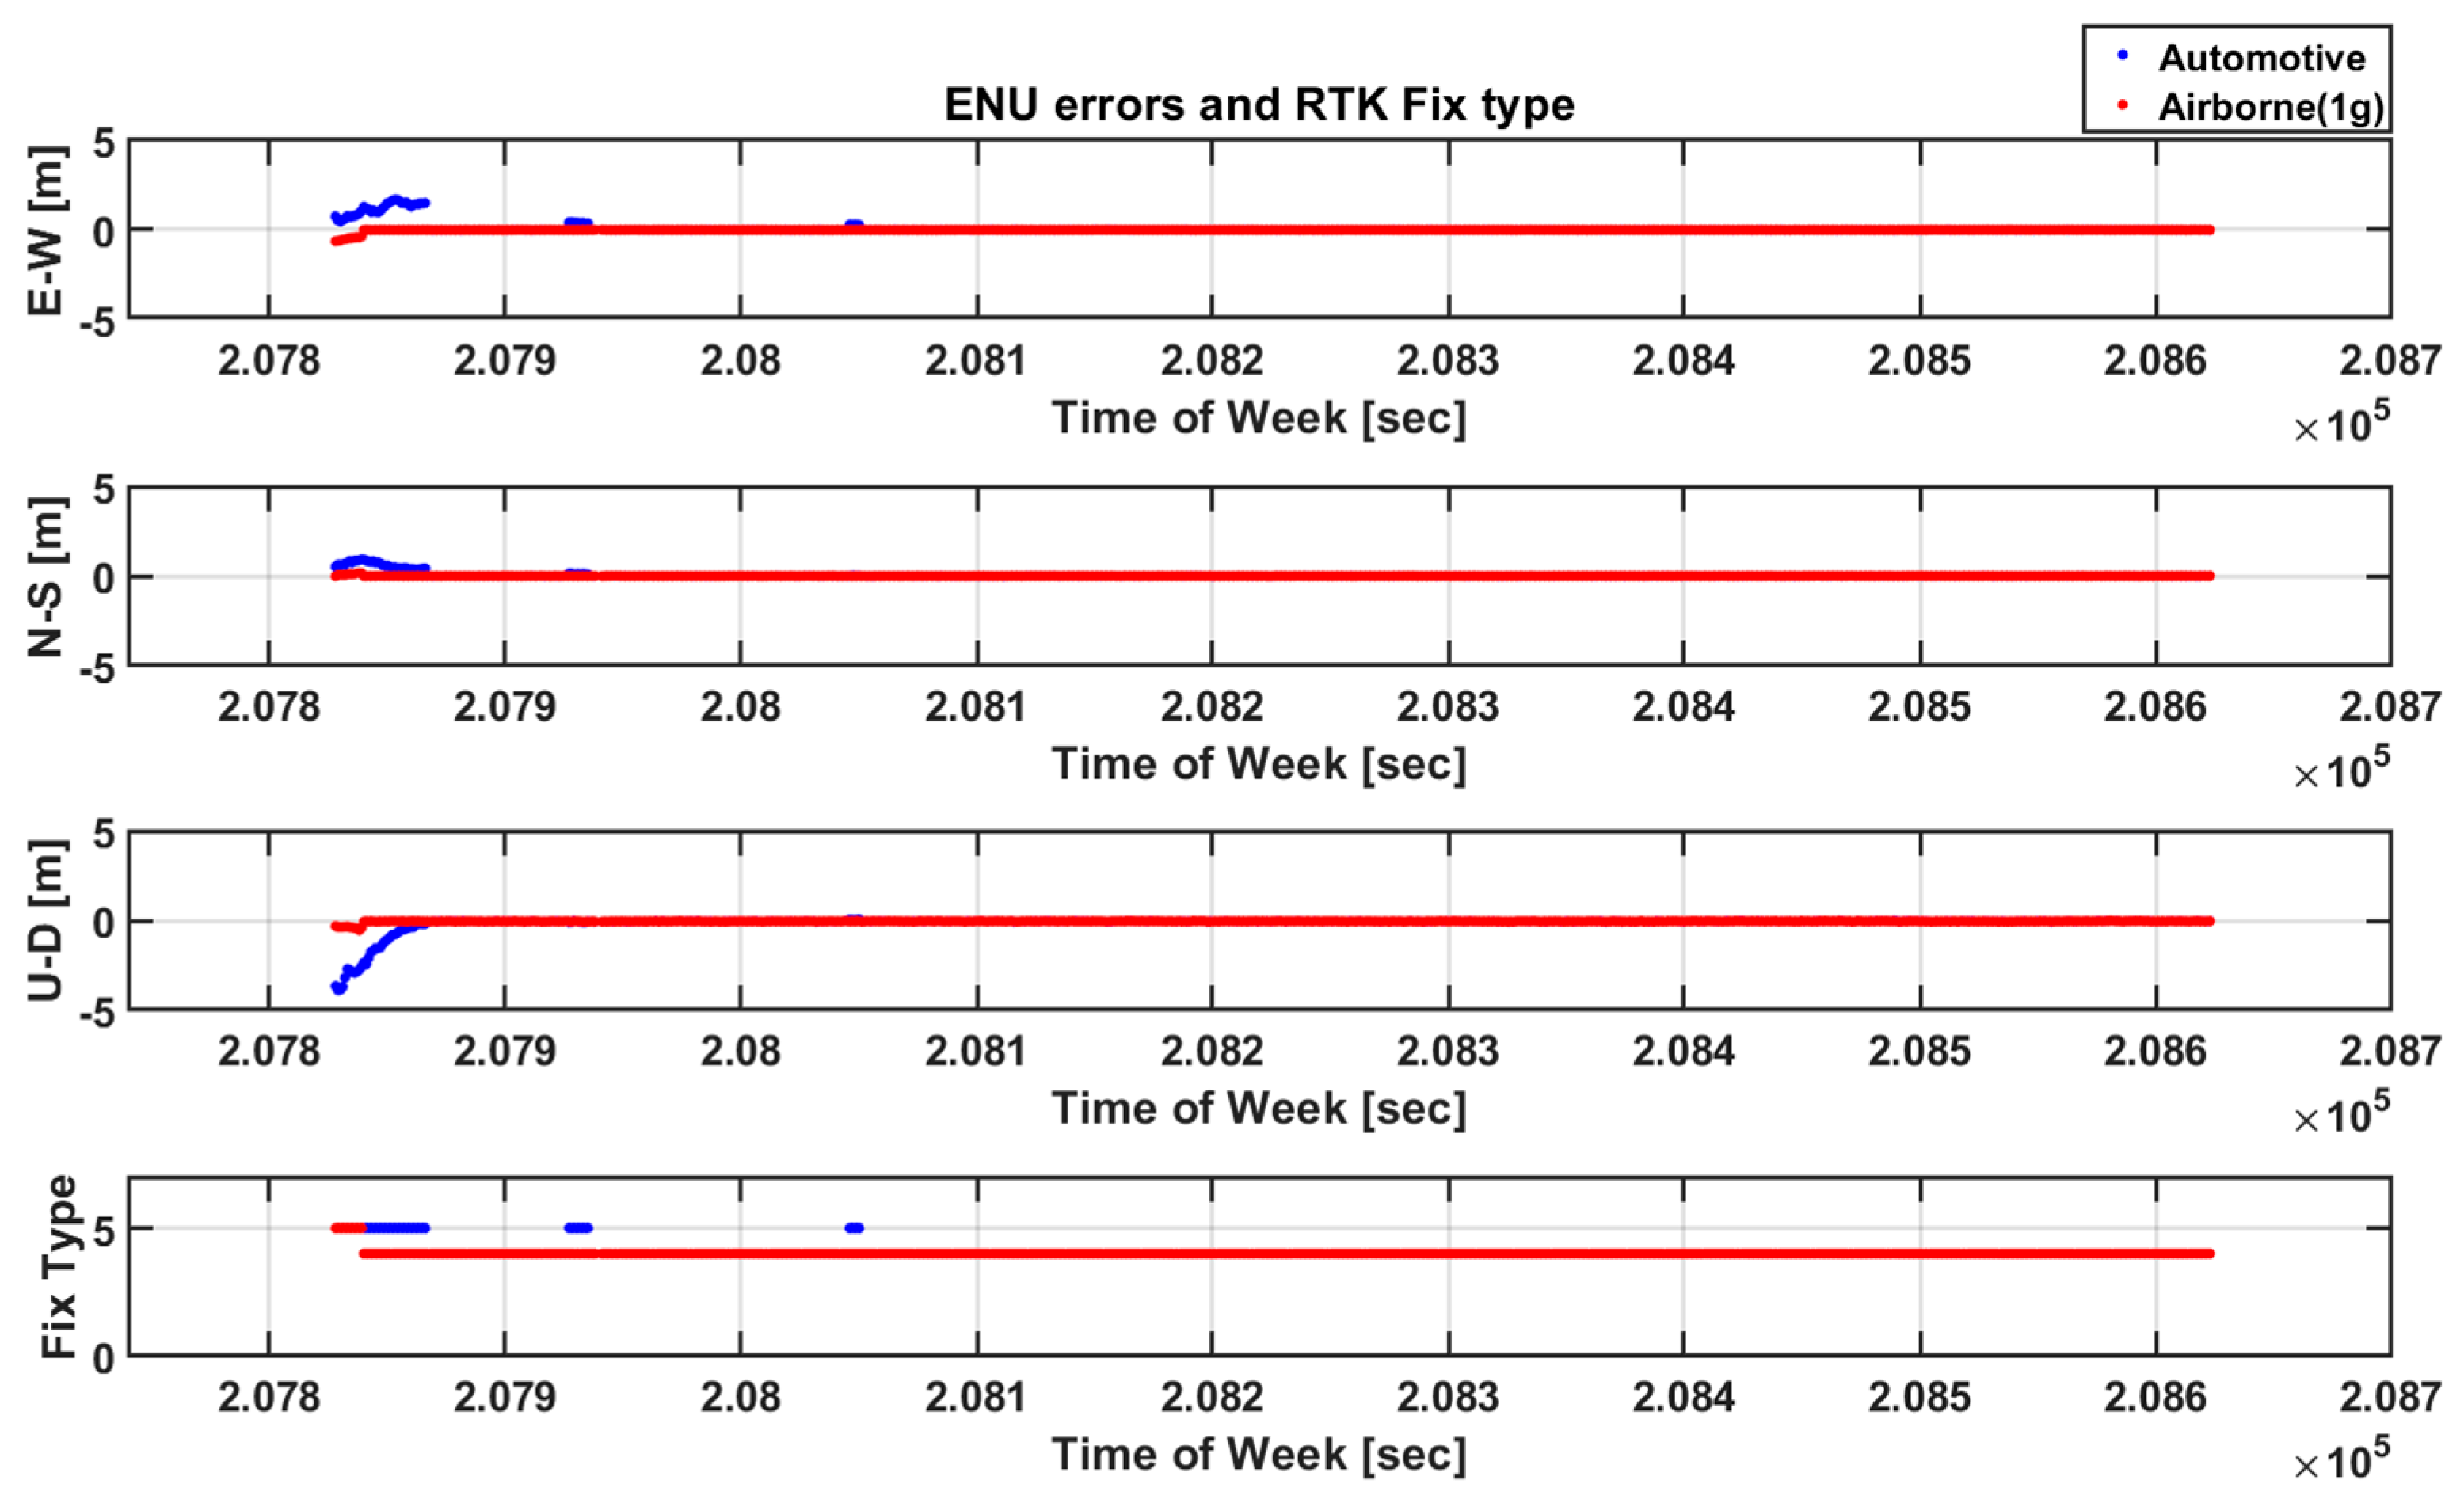
4.4.2. Scenario II: RTK Performance of Different Position Modes

The u-blox M8P receiver used for the previous RTK scenario supports different dynamic platform modes, such as portable, automotive, and airborne modes, and it adjusts the navigation filtering engine adaptively to the expected application environment. To investigate the effect of the different position modes on the RTK accuracy, we compared the positioning results of the automotive and airborne modes using the recorded signal and logged RTCM message, although the data were acquired from an airborne system.
Even though both positioning modes calculated RTK positions using the same GNSS signals and correction messages obtained from the flight test, the wrong dynamic model of automotive mode cannot provide position results as accurately as the right model of airborne mode as shown in Figure 21 and Figure 22 and Table 6. Since the automotive mode assumes the vehicle dynamics to be plane-like, it could not have solved the RTK fix solutions with the errors of several meters until the drone flew up to the altitude of 116 m, while the airborne mode acquired its RTK fix positions in the middle of the ascending phase.
The results of this scenario show that the valid dynamic model enables the solution to follow the true trajectory, which implies this method is helpful for evaluating if the platform or model has been designed appropriately for each kinematic system.

4.4.3. Scenario III: RTK Performance of Different Constellations with Tropospheric Effects

This methodology can easily compare the RTK performance of GPS-only with that of GPS/GLONASS using the RF signal with the correction dataset acquired from the drone flight test. Figure 23 and Table 7 show that multi-constellation of GPS and GLONASS contributes to reducing the initialization time and improving the accuracy of the RTK fixed solutions. The Novatel flexpak6 receiver can also be configured to apply the tropospheric correction to the RTK positioning. Since the altitude difference between the reference station and the UAV’s maneuver was only 3 m, the positioning results difference is not noticeable while the tropospheric correction obviously shortened the initialization time for the ambiguity fix. However, the proposed method makes it easy to see how the receiver’s RTK performance of the dynamic vehicle varies according to each configuration.

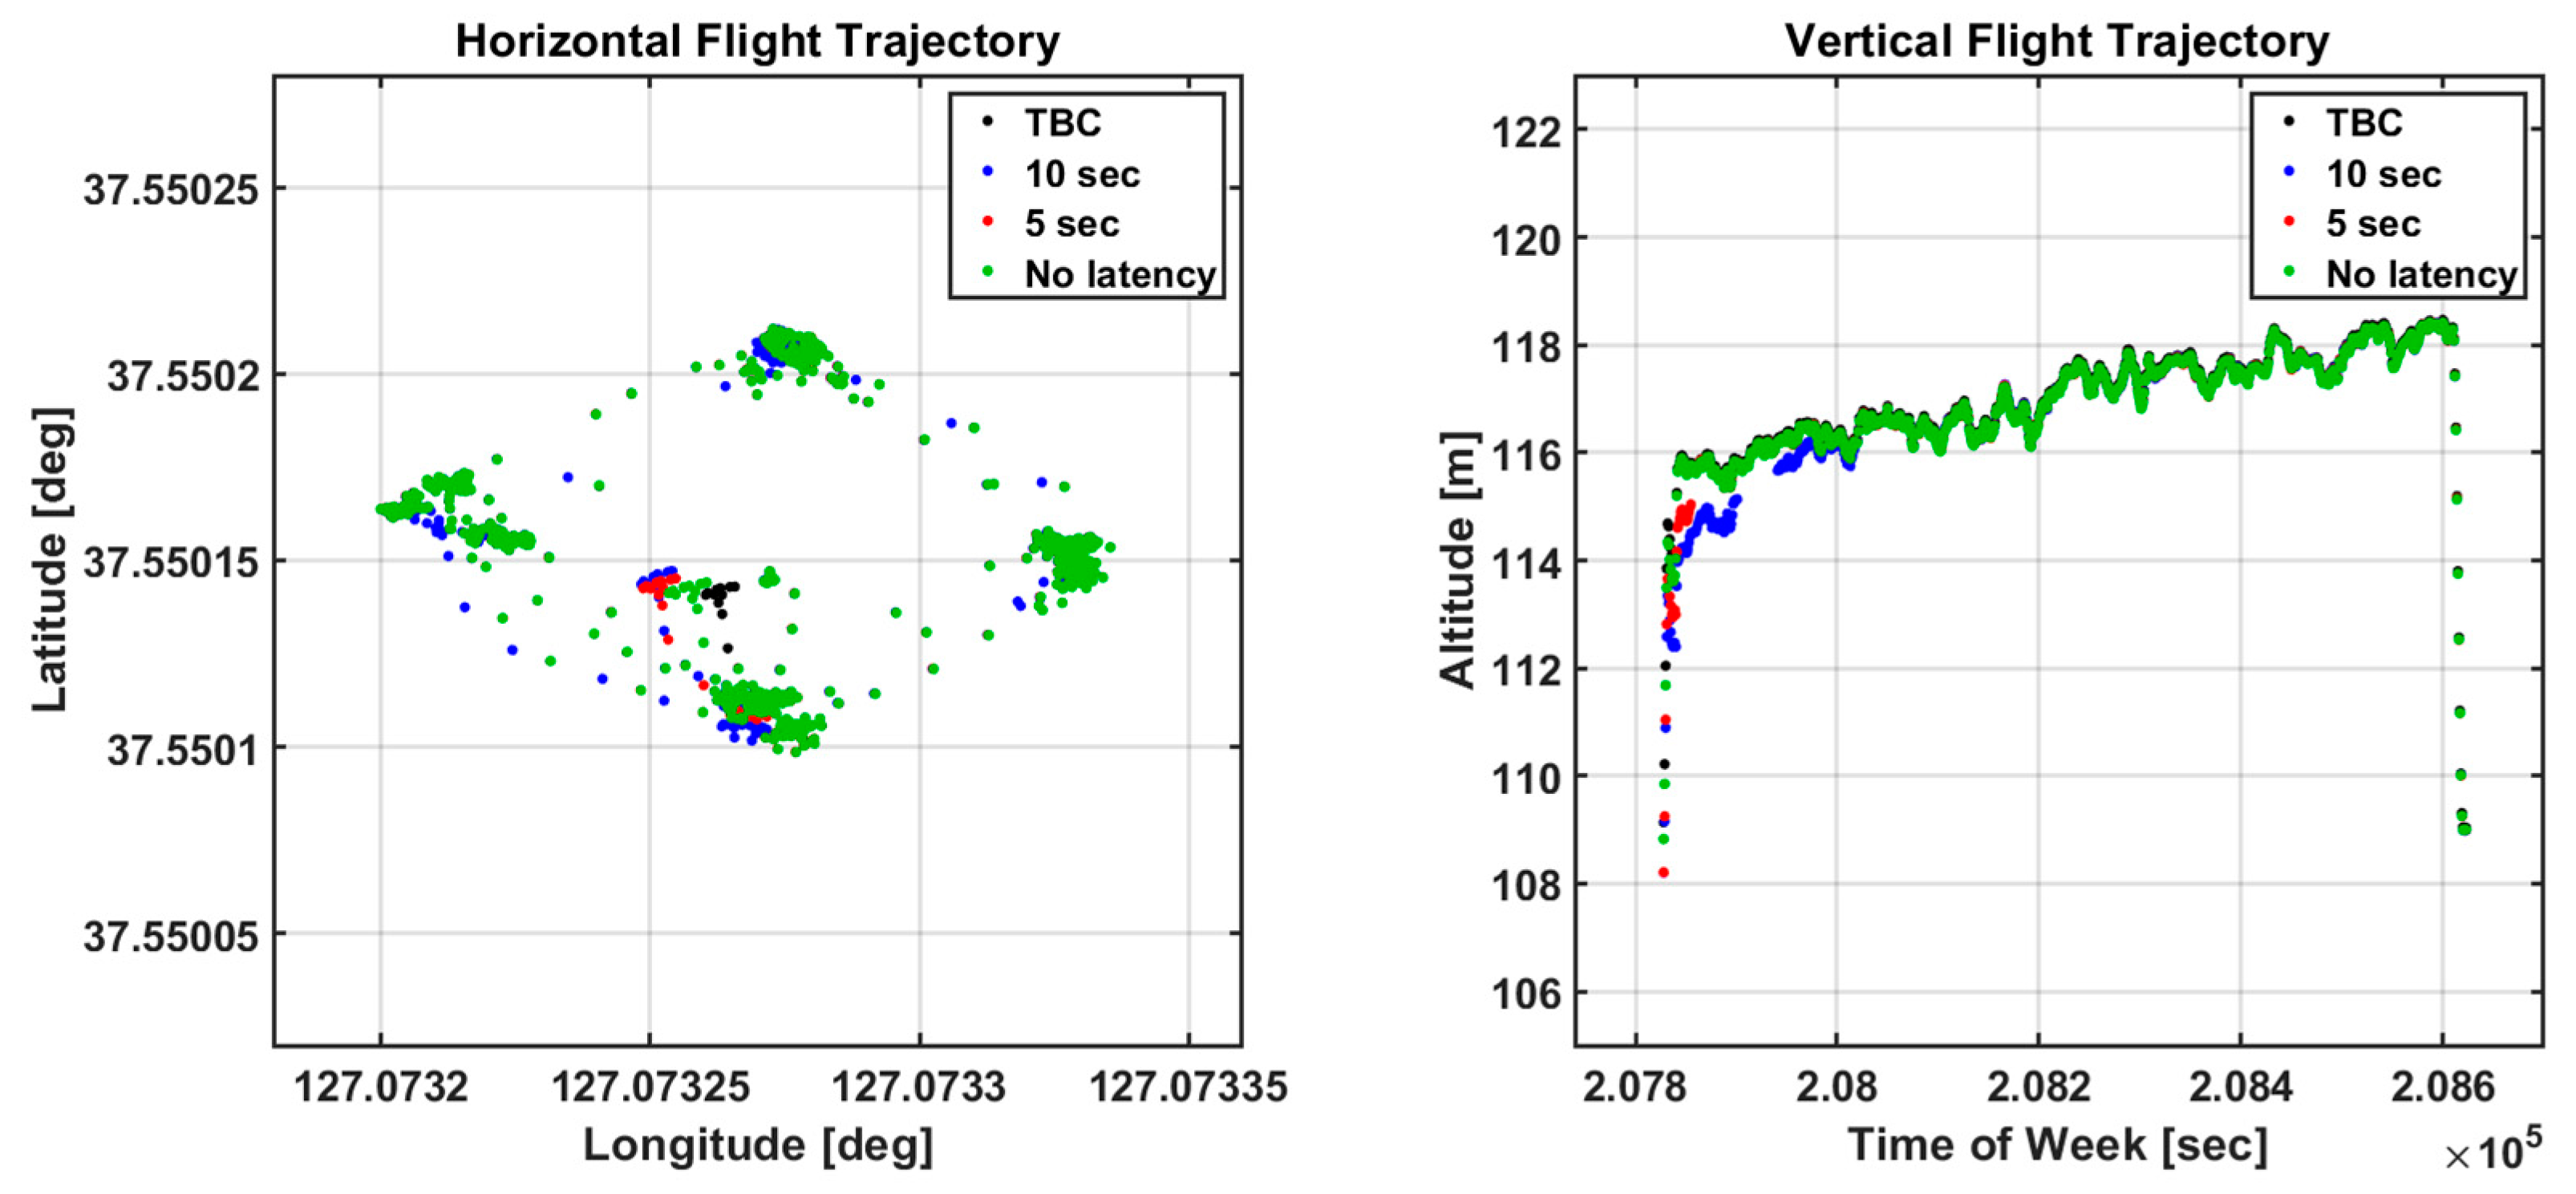
4.4.4. Scenario IV: Performance of RTK Fed with Old Correction Message

We also simulated a correction latency case by intentionally allowing the RTCM Broadcaster to feed old RTCM messages into the receiver. Five and ten second latencies were assigned for this simulation and the results were compared with the normal RTK results, whose correction ages were typically 1 or 2 s old. Even though the ages of correction in the NMEA sentences were printed out as 6 and 11 s as we designed, the errors were less than 3 mm in RMS for each direction once the position had been turned to RTK fixed mode as shown in Figure 24, Figure 25 and Figure 26 and Table 8. The accuracy degradation of the RTK fixed positions due to the latency under an open-sky were negligible, however, the general performance during the ambiguity resolution process was affected by the latency. The maximum error of the RTK float solution fed by 10 s old correction message was larger by 3 cm than that without latency, and it took 75 s for the receiver with old messages to find the solution while the general receiver needed only 14 s. Other ambiguity fixing performance, for examples TTFF and overall ambiguity fixing rate, were also degraded due to the latency.

5. Conclusions

With more applications of GNSS and more users relying on position, the evaluation of positioning performance is becoming increasingly more important. When evaluating the navigation performance of various GNSS receivers, it is very important to provide the same signal environment to all the receivers. However, it is difficult to perform the performance evaluation by mounting all receivers at once because of the limitation of payload capacity of vehicles such as UAVs. Therefore, the performance of GNSS receivers in dynamic modes has been assessed by comparing positioning results obtained from each receiver loaded on vehicles flying along similar trajectories independently at different times. However, such assessments do not ensure validness of evaluation for all receivers. To ensure evaluation validity of the dynamic test, exhaustively numerous field-tests are essential in real-world conditions, which impose a huge pressure on budgets and time.
In this study, we proposed a methodology to guarantee the validity of the dynamic performance evaluation of GNSS receivers with only one flight test. We used RACELOGIC’s LabSat 3 Wideband with the ability to record and replay the GNSS signals to provide the same signal environment to multiple GNSS receivers. Furthermore, we developed a software that can store RTCM messages and re-broadcast them to GNSS receivers using Python. In order to verify the suitability of the system, we performed preliminary static tests and investigated whether performance degradation occurred due to the use of LabSat 3 or the RTCM Logger and Broadcaster. The results of range and position domain tests showed that performance degradation does not occur. After system verification, we performed a drone flight test using DJI’s Phantom 3 Professional. During the dynamic test, GNSS live signals were recorded in LabSat 3, and RTCM messages were also stored simultaneously by our software. Then, we performed three re-radiation tests by applying the recorded signals and RTCM messages to three different GNSS receivers (SwiftNav Piksi Multi, u-blox M8P, and u-blox EVK-6). In this manner, we obtained trajectory estimates of the drone in different positioning modes (stand-alone, DGPS, SBAS, and RTK) of all the GNSS receivers. Based on a total of six trajectories, we compared and analyzed the performance of the GNSS receivers in various positioning modes.
The most significant advantage of our system is that performance analyses of unlimited GNSS receivers and modes are possible with only one flight test. It enables positioning performance evaluation of multiple receivers that cannot be loaded on a small vehicle. Moreover, it can save the cost and time of multiple flight testing as only one dynamic test is required for evaluation. We expect our suggested system to be useful as an accurate and convenient tool for evaluating the dynamic navigation performance in the near future.

Author Contributions

All the authors have contributed to the presented work. C.L. designed the evaluation system and implemented the RTCM Logger/Broadcaster software. H.Y. carried out static/drone flight tests and data analysis. A.C. and C.-S.Y. provided valuable comments and critical feedback regarding the algorithm and applications. B.P. suggested the original concept of the system and supervised its development and the direction of the research. All authors participated in formulating the idea and in discussing the proposed approach and results.

Funding

This research was supported by the MSIT (Ministry of Science and ICT) of Korea under the ITRC (Information Technology Research Center) support program (IITP-2019-2018-0-01423) supervised by the IITP (Institute for Information and Communications Technology Promotion). This research was also supported by the Unmanned Vehicles Advanced Core Technology Research and Development Program through the National Research Foundation of Korea (NRF), Unmanned Vehicle Advanced Research Center (UVARC) funded by the Ministry of Science and ICT, the Republic of Korea (2017M1B3A2A01049995).

Conflicts of Interest

The authors declare no conflict of interest.

References

  1. Hofmann-Wellenhof, H.; Lichtenegger, H.; Wasle, E. GNSS—Global Navigation Satellite Systems; Springer: Vienna, Austria, 2008; pp. 55–85. [Google Scholar]
  2. Misra, P.; Enge, P. Global Positioning System: Signals, Measurements, and Performance, 2nd ed.; Ganga-Jamuna Press: Lincoln, MA, USA, 2006; pp. 147–185. [Google Scholar]
  3. Kaplan, E.D. Understanding GPS: Principles and Applications; Artech House: Boston, MA, USA, 1996; pp. 301–375. [Google Scholar]
  4. UNAVCO. UNAVCO Campaign GPS/GNSS Handbook; UNAVCO: Boulder, CO, USA, 2018; pp. 1–20. [Google Scholar]
  5. Kim, M.; Seo, J.; Lee, J. A Comprehensive Method for GNSS Data Quality Determination to Improve Ionospheric Data Analysis. Sensors 2014, 14, 14971–14993. [Google Scholar] [CrossRef] [PubMed]
  6. Seo, J.; Walter, T.; Chiou, T.-Y.; Blanch, J.; Enge, P. Evaluation of Deep Signal Fading Effects Due to Ionospheric Scintillation on GPS Aviation Receivers. In Proceedings of the Institute of Navigation GNSS, Savannah, GA, USA, 16–19 September 2008. [Google Scholar]
  7. Vinande, E.; Weinstein, B.; Chu, T.; Akos, D. GNSS receiver evaluation record-and-playback test methods. GPS World 2010, 21, 28–34. [Google Scholar]
  8. Cristodaro, C.; Ruotsalainen, L.; Dovis, F. Benefits and Limitations of the Record and Replay Approach for GNSS Receiver Performance Assessment in Harsh Scenarios. Sensors 2018, 18, 2189. [Google Scholar] [CrossRef] [PubMed] [Green Version]
  9. Hadas, T.; Kazmierski, K.; Sośnica, K. Performance of Galileo-only dual-frequency absolute positioning using the fully serviceable Galileo constellation. GPS Solut. 2019, 23, 108. [Google Scholar] [CrossRef] [Green Version]
  10. Kazmierski, K. Performance of Absolute Real-Time Multi-GNSS Kinematic Positioning. Artif. Satell. 2018, 53, 75–88. [Google Scholar] [CrossRef] [Green Version]
  11. RACELOGIC. LabSat 3 Wideband. Available online: https://www.labsat.co.uk/index.php/en/products/labsat-3-wideband (accessed on 10 December 2019).
  12. RTCM Special Committee No. 104. RTCM Standard 10403.1. Radio Technical Commission for Maritime Services; RTCM Special Committee: Arlington, VA, USA, 2011; pp. 378–383. [Google Scholar]
  13. RTCM Special Committee No. 104. RTCM Standard 10402.3. Radio Technical Commission for Maritime Services; RTCM Special Committee: Arlington, VA, USA, 2010. [Google Scholar]
  14. Parkinson, B.W.; Enge, P. Differential GPS. In Global Positioning System: Theory and Applications; Parkinson, B.W., Spilker, J.J., Axelrad, P., Enge, P., Eds.; AIAA: Washington, DC, USA, 1996; pp. 3–50. [Google Scholar]
  15. Park, B.; Kim, J.; Kee, C.; Cleveland, A.; Parsons, M.; Wolfe, D.; Kalafus, R. RRC Unnecessary for DGPS Messages. IEEE Trans. Aerosp. Electron. Syst. 2006, 42, 1149–1160. [Google Scholar] [CrossRef]
  16. Park, B. A Study on Reducing Temporal and Spatial Decorrelation Effect in GNSS Augmentation System: Consideration of the Correction Message Standardization. Ph.D. Thesis, Seoul National University, Seoul, Korea, 2008. [Google Scholar]
  17. Lo Presti, L.; Falletti, E.; Nicola, M.; Troglia Gamba, M. Software Defined Radio Technology for GNSS Receivers. In Proceedings of the IEEE Metrology for Aerospace (MetroAeroSpace), Benevento, Italy, 29–30 May 2014; pp. 314–319. [Google Scholar]
  18. Dimc, F.; Bažec, M.; Borio, D.; Gioia, C.; Baldini, G.; Basso, M. An Experimental Evaluation of Low-Cost GNSS Jamming Sensors. J. Inst. Navig. 2017, 64, 93–109. [Google Scholar] [CrossRef]
  19. Borio, D.; Gioia, C. A Sum-of-Squares Approach to GNSS Spoofing Detection. IEEE Trans. Aerosp. Electron. Syst. 2016, 52, 1756–1768. [Google Scholar] [CrossRef]
  20. Borio, D.; Gioia, C.; Baldini, G.; Giuliani, R. A Real-time SDR Sanitizer for GNSS Interference Mitigation in Road Transportation. In Proceedings of the 24th International Electrotechnical and Computer Science Conference ERK 2015, Bernardin, Portoroz, Slovenia, 21–23 September 2015. [Google Scholar]
  21. Hünerbein, K.; Lange, W.R. Testing Acquisition of GPS/GNSS Location and Velocity to Improve Safety in Autonomous Driving. In Proceedings of the European Test and Telemetry Conference, Nürnberg, Germany, 26–28 June 2018. [Google Scholar]
  22. Kouba, J.; Héroux, P. Precise Point Positioning Using IGS Orbit and Clock Products. GPS Solut. 2011, 5, 12–28. [Google Scholar] [CrossRef]
  23. Kee, C.; Parkinson, B.W.; Axelrad, P. Wide Area Differential GPS. In Proceedings of the 3rd International Technical Meeting of the Satellite Division of the Institute of Navigation, Colorado Spring, CO, USA, 19–21 September 1990; pp. 587–598. [Google Scholar]
  24. Park, B.; Kee, C. The Compact Network RTK Method: An Effective Solution to Reduce GNSS Temporal and Spatial Decorrelation Error. J. Navig. 2010, 63, 343–362. [Google Scholar] [CrossRef]
  25. Kim, J.; Song, J.; No, H.; Han, D.; Kim, D.; Park, B.; Kee, C. Accuracy Improvement of DGPS for Low-Cost Single-Frequency Receiver Using Modified Flächen Korrektur Parameter Correction. ISPRS Int. J. Geo Inf. 2017, 6, 222. [Google Scholar] [CrossRef] [Green Version]
  26. Song, J.; Park, B.; Kee, C. Comparative Analysis of Height-Related Multiple Correction Interpolation Methods with Constraints for Network RTK in Mountainous Areas. J. Navig. 2016, 69, 991–1010. [Google Scholar] [CrossRef] [Green Version]
  27. NTRIP—Networked Transport of RTCM via Internet Protocol. Available online: https://igs.bkg.bund.de/ntrip/about (accessed on 13 October 2019).
  28. Spirent. GNSS Record and Playback: Four Test Needs that Demand Richer Real World Testing, Spirent eBook. Available online: https://www.spirent.com/assets/eb/eb_four-test-needs-that-demand-richer-real-world-testing?submited=Y (accessed on 13 October 2019).
  29. European Space Agency. Atomic Time. Available online: https://gssc.esa.int/navipedia/index.php/Atomic_Time (accessed on 13 October 2019).
  30. NMEA Data. Available online: https://www.gpsinformation.org/dale/nmea.htm (accessed on 24 May 2019).
  31. RINEX. The Receiver Independent Exchange Format. Available online: ftp://igs.org/pub/data/format/rinex301.pdf (accessed on 13 October 2019).
  32. Trimble Geospatial. Trimble Business Center. Available online: https://geospatial.trimble.com/products-and-solutions/trimble-business-center (accessed on 13 October 2019).
Figure 1. Scheme of logging Radio Technical Commission for Maritime Services (RTCM) messages (RTCM Logger).
Electronics 08 01518 g001
Figure 2. Scheme of re-broadcasting RTCM messages (RTCM Broadcaster).
Electronics 08 01518 g002
Figure 3. Scheme of feeding RTCM messages (RTCM Broadcaster).
Electronics 08 01518 g003
Figure 4. Test configuration for verifying performance degradation due to the use of LabSat 3.
Electronics 08 01518 g004
Figure 5. Direct comparison of GPS L1 pseudorange measurements from real time (RT) and LabSat 3 (LS).
Electronics 08 01518 g005
Figure 6. Double difference (DD) residuals of carrier phase measurements; (a) NovAtel, (b) u-blox.
Electronics 08 01518 g006
Figure 7. Real-time static test configuration for verifying performance degradation due to the use of our developed software.
Electronics 08 01518 g007
Figure 8. Semi-real-time static test configuration for verifying performance degradation due to the use of our developed software.
Electronics 08 01518 g008
Figure 9. (a) Discrepancies in ENU errors between both signals in the DGPS mode; (b) NMEA GGA fix type in the DGPS mode.
Electronics 08 01518 g009
Figure 10. (a) Discrepancies in ENU errors between both signals in the RTK mode; (b) NMEA GGA fix type in the RTK mode.
Electronics 08 01518 g010
Figure 11. Drone flight scenario.
Electronics 08 01518 g011
Figure 12. Drone flight test location.
Electronics 08 01518 g012
Figure 13. Drone flight test configurations (real-time).
Electronics 08 01518 g013
Figure 14. Drone flight test configurations (re-radiation).
Electronics 08 01518 g014
Figure 15. Horizontal and vertical flight trajectories of the drone in the stand-alone mode.
Electronics 08 01518 g015
Figure 16. ENU errors in the stand-alone mode.
Electronics 08 01518 g016
Figure 17. Horizontal and vertical flight trajectories of the drone in the DGPS mode.
Electronics 08 01518 g017
Figure 18. ENU errors in DGPS mode.
Electronics 08 01518 g018
Figure 19. Horizontal and vertical flight trajectories of the drone in the RTK mode.
Electronics 08 01518 g019
Figure 20. ENU errors and RTK fix type in RTK mode.
Electronics 08 01518 g020
Figure 21. Horizontal and vertical flight trajectories of the drone in the automotive and airborne modes.
Electronics 08 01518 g021
Figure 22. ENU errors and RTK fix type in the automotive and airborne modes.
Electronics 08 01518 g022
Figure 23. ENU errors and RTK fix type of the multi GNSS and Tropospheric correction test.
Electronics 08 01518 g023
Figure 24. Horizontal and vertical flight trajectories of the drone in the case of RTCM messages with a delay of 5 and 10 s.
Electronics 08 01518 g024
Figure 25. ENU errors and RTK fix type in the case of RTCM messages with a delay of 5 and 10 s.
Electronics 08 01518 g025
Figure 26. Time latency versus RMS values of horizontal and vertical errors in RTK mode.
Electronics 08 01518 g026
Table 1. Root mean square (RMS) and maximum of double difference residuals of carrier phase measurements.
GNSS ReceiverRMSMax.
NovAtel FlexPak60.0011 m0.0089 m
u-blox M8P0.0014 m0.0157 m
Table 2. Specifications of DJI’s Phantom 3 Professional.
Diagonal Size350 mm
Weight1.28 kg
Max Ascent Speed5 m/s
Max Descent Speed3 m/s
Max Speed57.6 km/h
Max Flight TimeApprox. 23 min
Max Tilt Angle35°
Max Transmission Distance3.5–5 km
Table 3. RMS and maximum of ENU errors in the stand-alone mode.
SwiftNav
Piksi Multi
u-blox
EVK-6
u-blox
M8P
RMSEast0.8947 m1.0870 m0.8400 m
North0.7828 m1.0204 m0.7163 m
Up4.3090 m1.6958 m2.4837 m
Max.East2.5083 m4.4078 m1.1333 m
North2.6784 m5.7743 m1.6973 m
Up9.0660 m5.3500 m3.3260 m
Table 4. RMS and maximum of ENU errors in the DGPS mode.
u-blox
EVK-6
RMSEast0.8139 m
North0.8039 m
Up0.9259 m
Max.East4.8190 m
North5.2008 m
Up3.7500 m
Table 5. RMS and maximum of ENU errors, and TTFF and RTK fix rates in the RTK mode.
SwiftNav
Piksi Multi
u-blox
M8P
RMSEast0.0046 m0.0047 m
North0.0042 m0.0034 m
Up0.0566 m0.0479 m
Max.East0.0140 m0.0122 m
North0.0140 m0.0112 m
Up0.0900 m0.0730 m
RTK Fix Rate >99.99%98.35%
TTFF 10 s14 s
Table 6. RMS and maximum of ENU errors, and TTFF and RTK fix rates in the automotive and airborne modes.
AutomotiveAirborne
RMSEast0.0052 m0.0047 m
North0.0042 m0.0035 m
Up0.0458 m0.0473 m
Max.East0.0153 m0.0130 m
North0.0132 m0.0110 m
Up0.0780 m0.0730 m
RTK Fix Rate 93.32%98.49%
TTFF 40 s13 s
Table 7. RMS and maximum of ENU errors, and TTFF and RTK fix rates of the multi GNSS and Tropospheric correction test.
GPS Only (Tropo. on)GPS Only (Tropo. off)GPS+GLO (Tropo. on)GPS+GLO (Tropo. off)
RMSEast0.0053 m0.0056 m0.0065 m0.0065 m
North0.0040 m0.0040 m0.0038 m0.0037 m
Up0.0599 m0.0611 m0.0594 m0.0581 m
Max.East0.0191 m0.0135 m0.0189 m0.0139 m
North0.0116 m0.0123 m0.0110 m0.0129 m
Up0.0970 m0.0890 m0.1110 m0.0850 m
RTK Fix Rate 98.61%96.40%99.54%97.80%
TTFF 13 s32 s5 s20 s
Table 8. RMS and maximum of ENU errors, and TTFF and RTK fix rates in the case of RTCM messages with a delay of 5 and 10 s.
No Latency5 s10 s
RMSEast0.0049 m0.0049 m0.0073 m
North0.0035 m0.0065 m0.0100 m
Up0.0468 m0.0467 m0.0484 m
Max.East0.0130 m0.0154 m0.0217 m
North0.0110 m0.0223 m0.0302 m
Up0.0730 m0.0840 m0.1090 m
RTK Fix Rate 98.49%96.47%80.98%
TTFF 13 s29 s75 s

