1. Introduction
The system frequency in a power system is indicative of the balance between the generation and consumption of active power and must be maintained within the normal range at all times. In a conventional power grid, synchronous generators that have a spinning reserve increase their mechanical power by relying on the deviation of the frequency [
1]. However, in a power grid with high wind power penetration, the output power of a wind turbine generator (WTG) is critical for the maintenance of the system frequency. Hence, a WTG should contribute the system frequency stabilization because active power from the maximum power point tracking (MPPT) control results in large fluctuations in the system frequency [
2]. Some countries specify requirements for the reduction of the ramping rates of the output power of a WTG to overcome fluctuations in the system frequency [
3,
4].
Several control schemes for smoothing the output power of a WTG by controlling the pitch angle have been reported [
5,
6,
7,
8,
9,
10]. However, these methods substantially decrease the captured power from the incoming wind power, and control schemes that entail releasing the kinetic energy stored in the rotating masses of WTG blade and gearbox have been proposed [
11,
12,
13]. Therefore, a WTG can temporarily absorb or release electric energy to the rotating masses and contribute to the system frequency stabilization. However, in a power system with a high wind power penetration, an output with an excessive ramp rate of the WTG might adversely affect the system frequency stabilization.
Accordingly, control schemes for coordinated WTGs and energy storage have also been proposed [
14,
15,
16]. Chunghun et al. [
14] proposed a coordinated control of a WTG and ESS to reduce the output power fluctuation of a WTG. The WTG operated based on the wind speed variation and size of the ESS capacity when de-loaded and they successfully improved the grid reliability, especially in the case of a large wind speed variation. Ziping et al. [
15] proposed maximizing the inertial response of a WTG to arrest the system frequency nadir when the large disturbances occurred in a power system. They used a small-scale battery ESS to reduce the second frequency dip that can occur while recovering the reduced rotor speed through the inertial response of the WTG. Akie et al. [
16] proposed the coordination control of the WTG and ESS using load estimation via a disturbance observer in an isolated grid. In their study, frequency stabilization was supported through mitigating the fluctuation of a WTG using a pitch angle control and an active power control of the ESS that was applied to the low-frequency and high-frequency domains, respectively. These conventional papers propose coordinated controls of a WTG and ESS, and they have responded to issues such as power smoothing, primary frequency control based on large disturbance, and frequency stabilization. However, they do not deal with concerns about the high wind power penetration level.
This study proposes a coordinated control scheme for a WTG and ESS in a microgrid with a high wind power penetration to improve the frequency stabilization. This was achieved through the continuous calculation of the releasable and absorbable energy of a WTG and ESS, along with the determined weight factors related to the energy ratios. Thus, the weight factors improved the ability for supporting frequency stabilization of a WTG and ESS by increasing the stored energy utilization. Contrary to Chunghun et al. [
14] and Akie et al. [
16], in this study, an ESS had a high utilization to maintain the system reliability in an isolated microgrid with a high wind power penetration. The performance of the scheme was investigated using MATLAB R2018b Simulink Electrical.
The rest of the paper is structured as follows. In
Section 2, in addition to the typical variable speed WTG model, the high-fidelity battery model is briefly described. In
Section 3, the proposed coordinated control of the WTG and ESS is explained, including the aim of the proposed scheme, the control strategy for frequency stabilization, and its advantages. In
Section 4, we describe three cases that were conducted to demonstrate the superior operation for system frequency regulation of the coordinated control of WTG and ESS under varying wind speed conditions and set values of the initial state of charge (SOC). In
Section 5, in-depth conclusions are provided.
2. The WTG and Battery Models
The WTG and battery models system supports the frequency stabilization in isolated microgrids by controlling the active powers based on the system frequency variation. A WTG is a permanent magnet synchronous generator (PMSG) and it can control the active power related to its rotor speed. In this paper, the high-fidelity battery model was adjusted to verify the correct performance of the proposed scheme.
2.1. WTG Model
The PMSG configuration is presented in
Figure 1a. The mechanical output power of the turbine,
Pm, is given by:
where
ρ,
R,
vW,
CP,
λ, and
β are the air density, blade length, wind speed, power coefficient, tip-speed ratio of the rotor blade tip speed to wind speed, and blade pitch angle, respectively. According to Siegfried [
17],
cP used in this paper can be represented by:
where
and the coefficients
c1 to
c6 are
c1 = 0.5176,
c2 = 116,
c3 = 0.4,
c4 = 5,
c5 = 21, and
c6 = 0.0068. In this study, λ
opt and
CP,max were set to 8.1 and 0.48, respectively.
The maximum power point tracking (MPPT) output,
PMPPT, is represented as:
where
ωr is the rotor speed and
kg is a constant that is set to 0.512 in this paper. The rotor-side converter (RSC) in the PMSG controls the active and reactive power injected into a grid., and the grid-side converter (GSC) controls the DC-link and terminal voltages.
Figure 1b shows the mechanical power curves at different wind speeds as indicated by the thin solid lines. The maximum power limit was set to 1.1 p.u. and the operating range of the rotor speed of the PMSG was between 0.6 p.u. to 1.2 p.u. [
17], which is represented in
Figure 1b by the red dashed lines.
A controllable WTG (of type III and type IV) can aid in frequency stabilization by using the kinetic energy stored in its rotor. The WTG is connected to the power system through power electronic devices, which means the frequency from the generator side is decoupled from the system frequency, unlike a synchronous generator, which is directly connected to the power system. Hence, for it to regulate the system frequency, the reference power based on the system frequency must be adjusted.
Figure 1c illustrates the frequency stabilization control scheme, which is based on the frequency deviation. In
Figure 1c, the total active power reference,
Pref, consists of the active power reference for the MPPT control,
PMPPT, and additional power reference based on the droop loop, Δ
P, which can be expressed as:
where
fsys,
fnom, and 1/
R are the system frequency, nominal frequency, and loop gain for droop, respectively. When the system frequency is larger than the nominal frequency, WTG reduces the output power through the droop loop. Thus, the system frequency automatically reduces and the rotor speed of a WTG increases. When the rotor speed reaches the maximum, WTG reduces the output power by increasing the pitch angle, consequentially rejecting the wind energy.
2.2. Battery Model
Battery models integrated in the wind farm are commonly used for simplified models that only have fixed parameters regardless of the SOC variation. However, in this paper, a high-fidelity battery model with parameters of a battery equivalent circuit based on the SOC was used to accurately examine the performance change of the battery due to the proposed coordinated control.
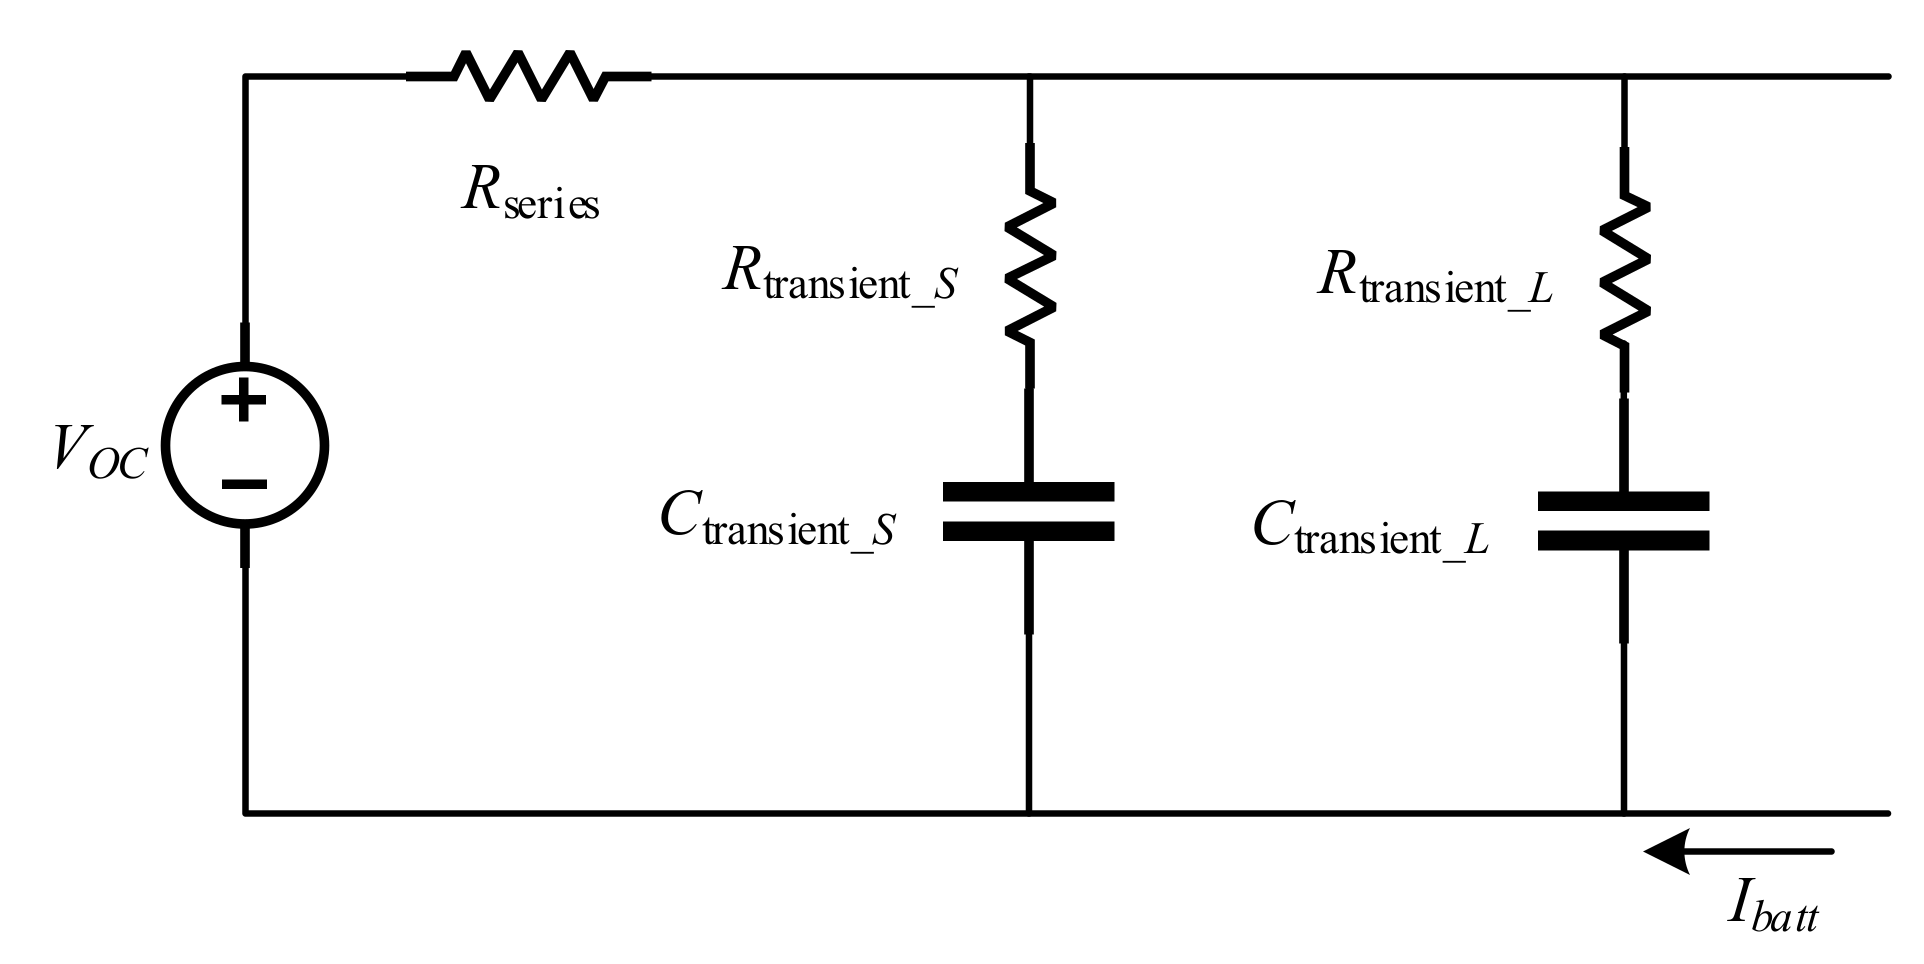
Figure 2 shows the equivalent circuit models that can be used to represent the electrical property of Li-ion batteries and
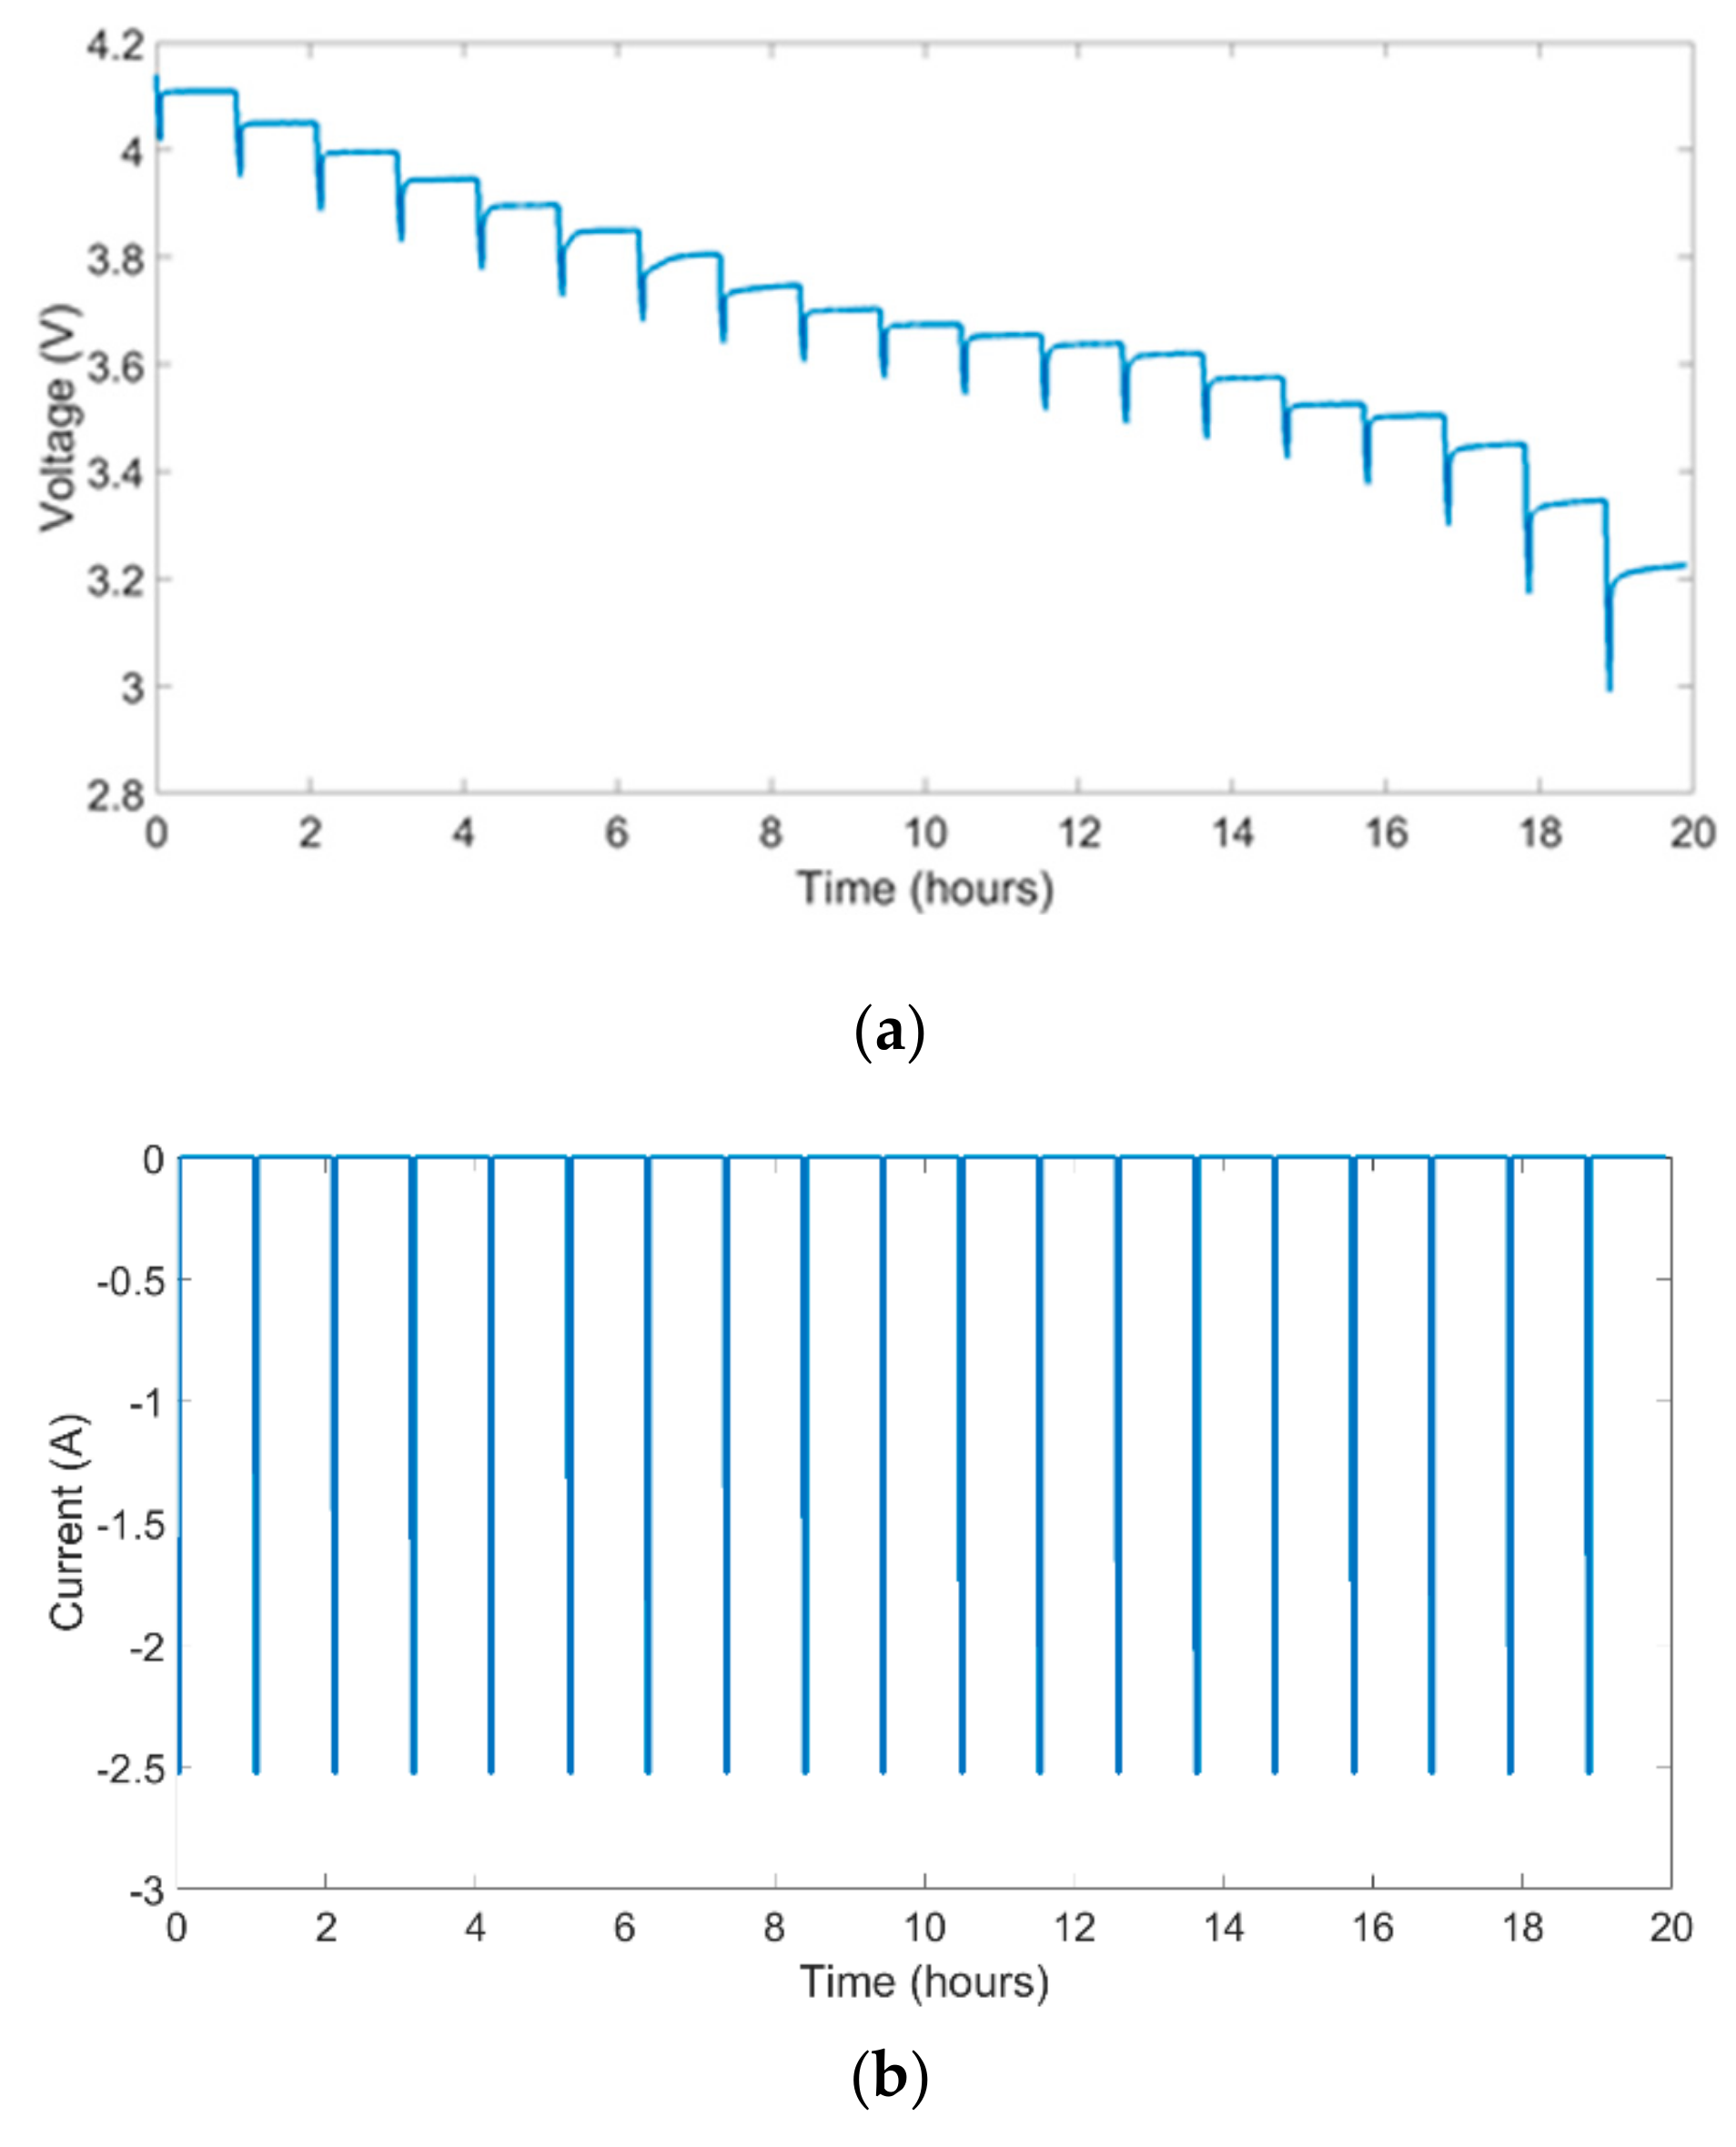
Figure 3 shows the experimental data of an open circuit voltage and line current. These data were extracted from a lithium-ion battery when the battery was discharged by inversely pulsating in 5% increments of SOC.
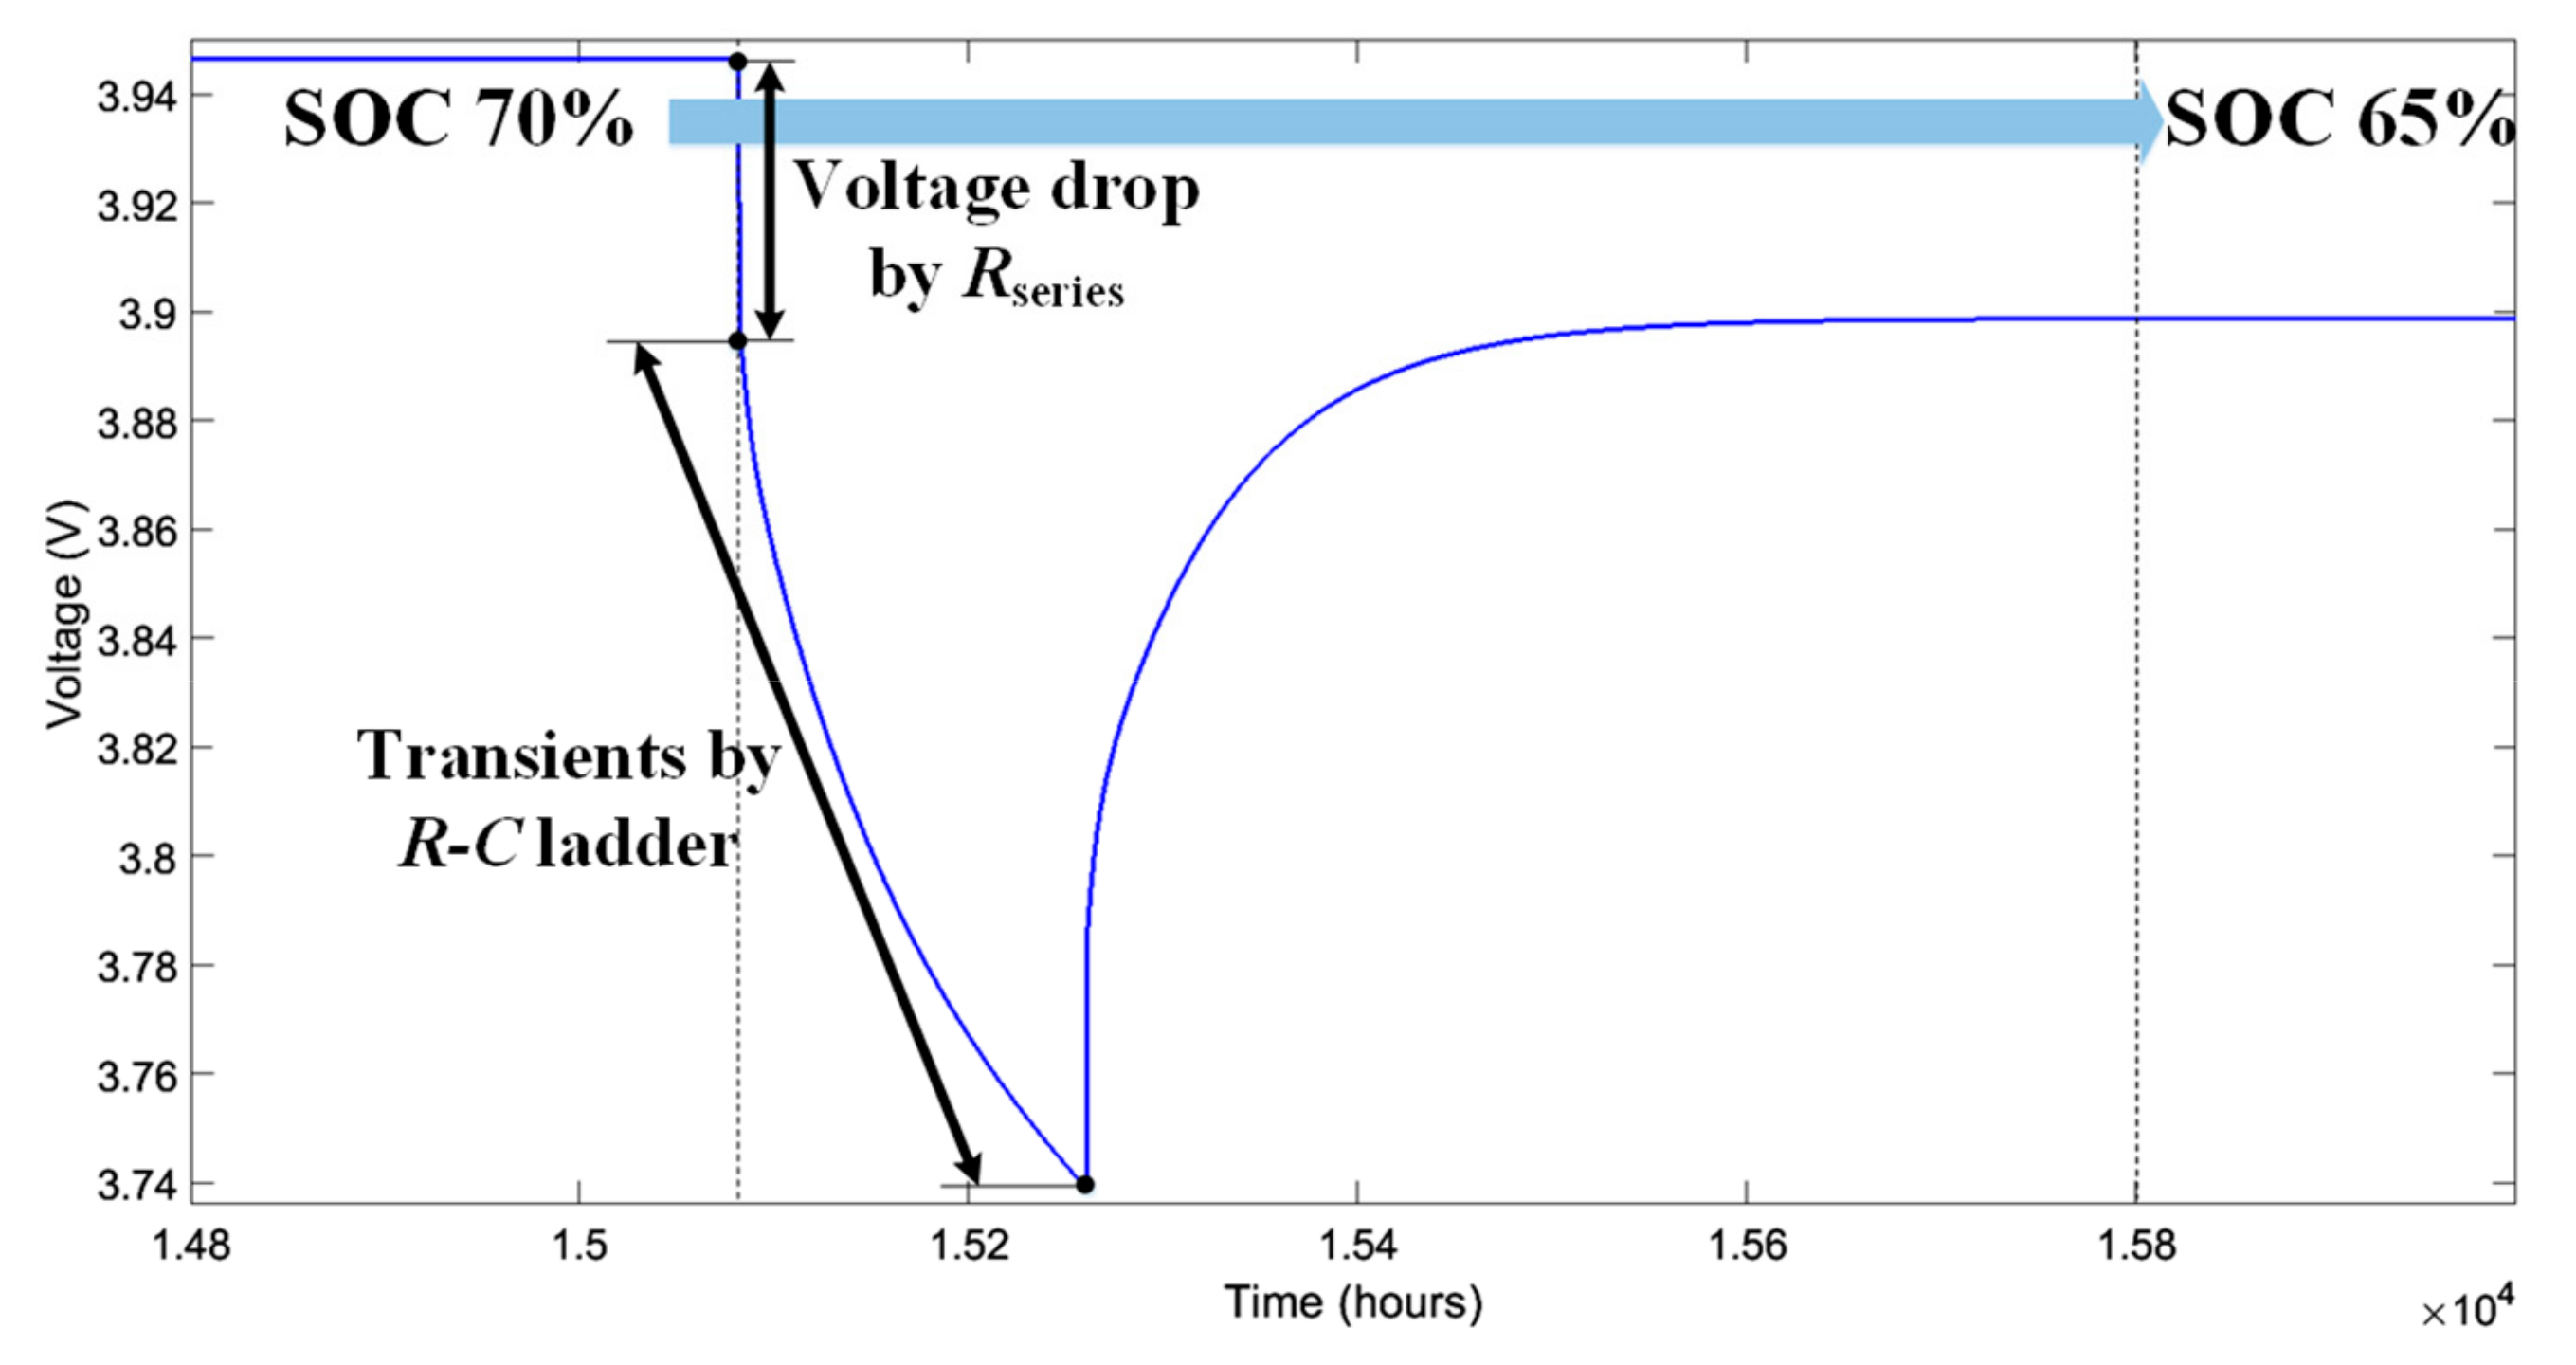
The pulse type tests cause the circuit dynamics of battery, which can provide necessary data about the performance of the battery cell at different points of the SOC.
Figure 4 shows one pulse of the discharge test. To estimate
Rseries, the voltage drops and rated current were used, which can be represented as:
where
Vdrop and
Irated are the voltage drop and rated current, respectively. Using the experimental data, in this paper, the R-C ladder parameters were estimated using MATLAB Curve Fitting. The resistance and capacitance of the two ladders was estimated using the equation for curve fitting determined by:
where
a,
b,
c, and
d are denoted as
Rtransient_S,
τtransient_S,
Rtransient_L, and
τtransient_L, respectively. The
Ctransient_S and
Ctransient_L were calculated using:
3. Coordinated Frequency Stabilization between the WTG and Energy Storage
The aim of the proposed coordinated frequency stabilization scheme was to reduce the system frequency deviation in an isolated microgrid with a high wind power penetration. This was achieved by calculating the releasable and absorbable energy of a WTG and ESS and determining the related weighting factors from the coordinated control. The weighting factors were calculated using the releasable and absorbable energy of the WTG and ESS to the power system.
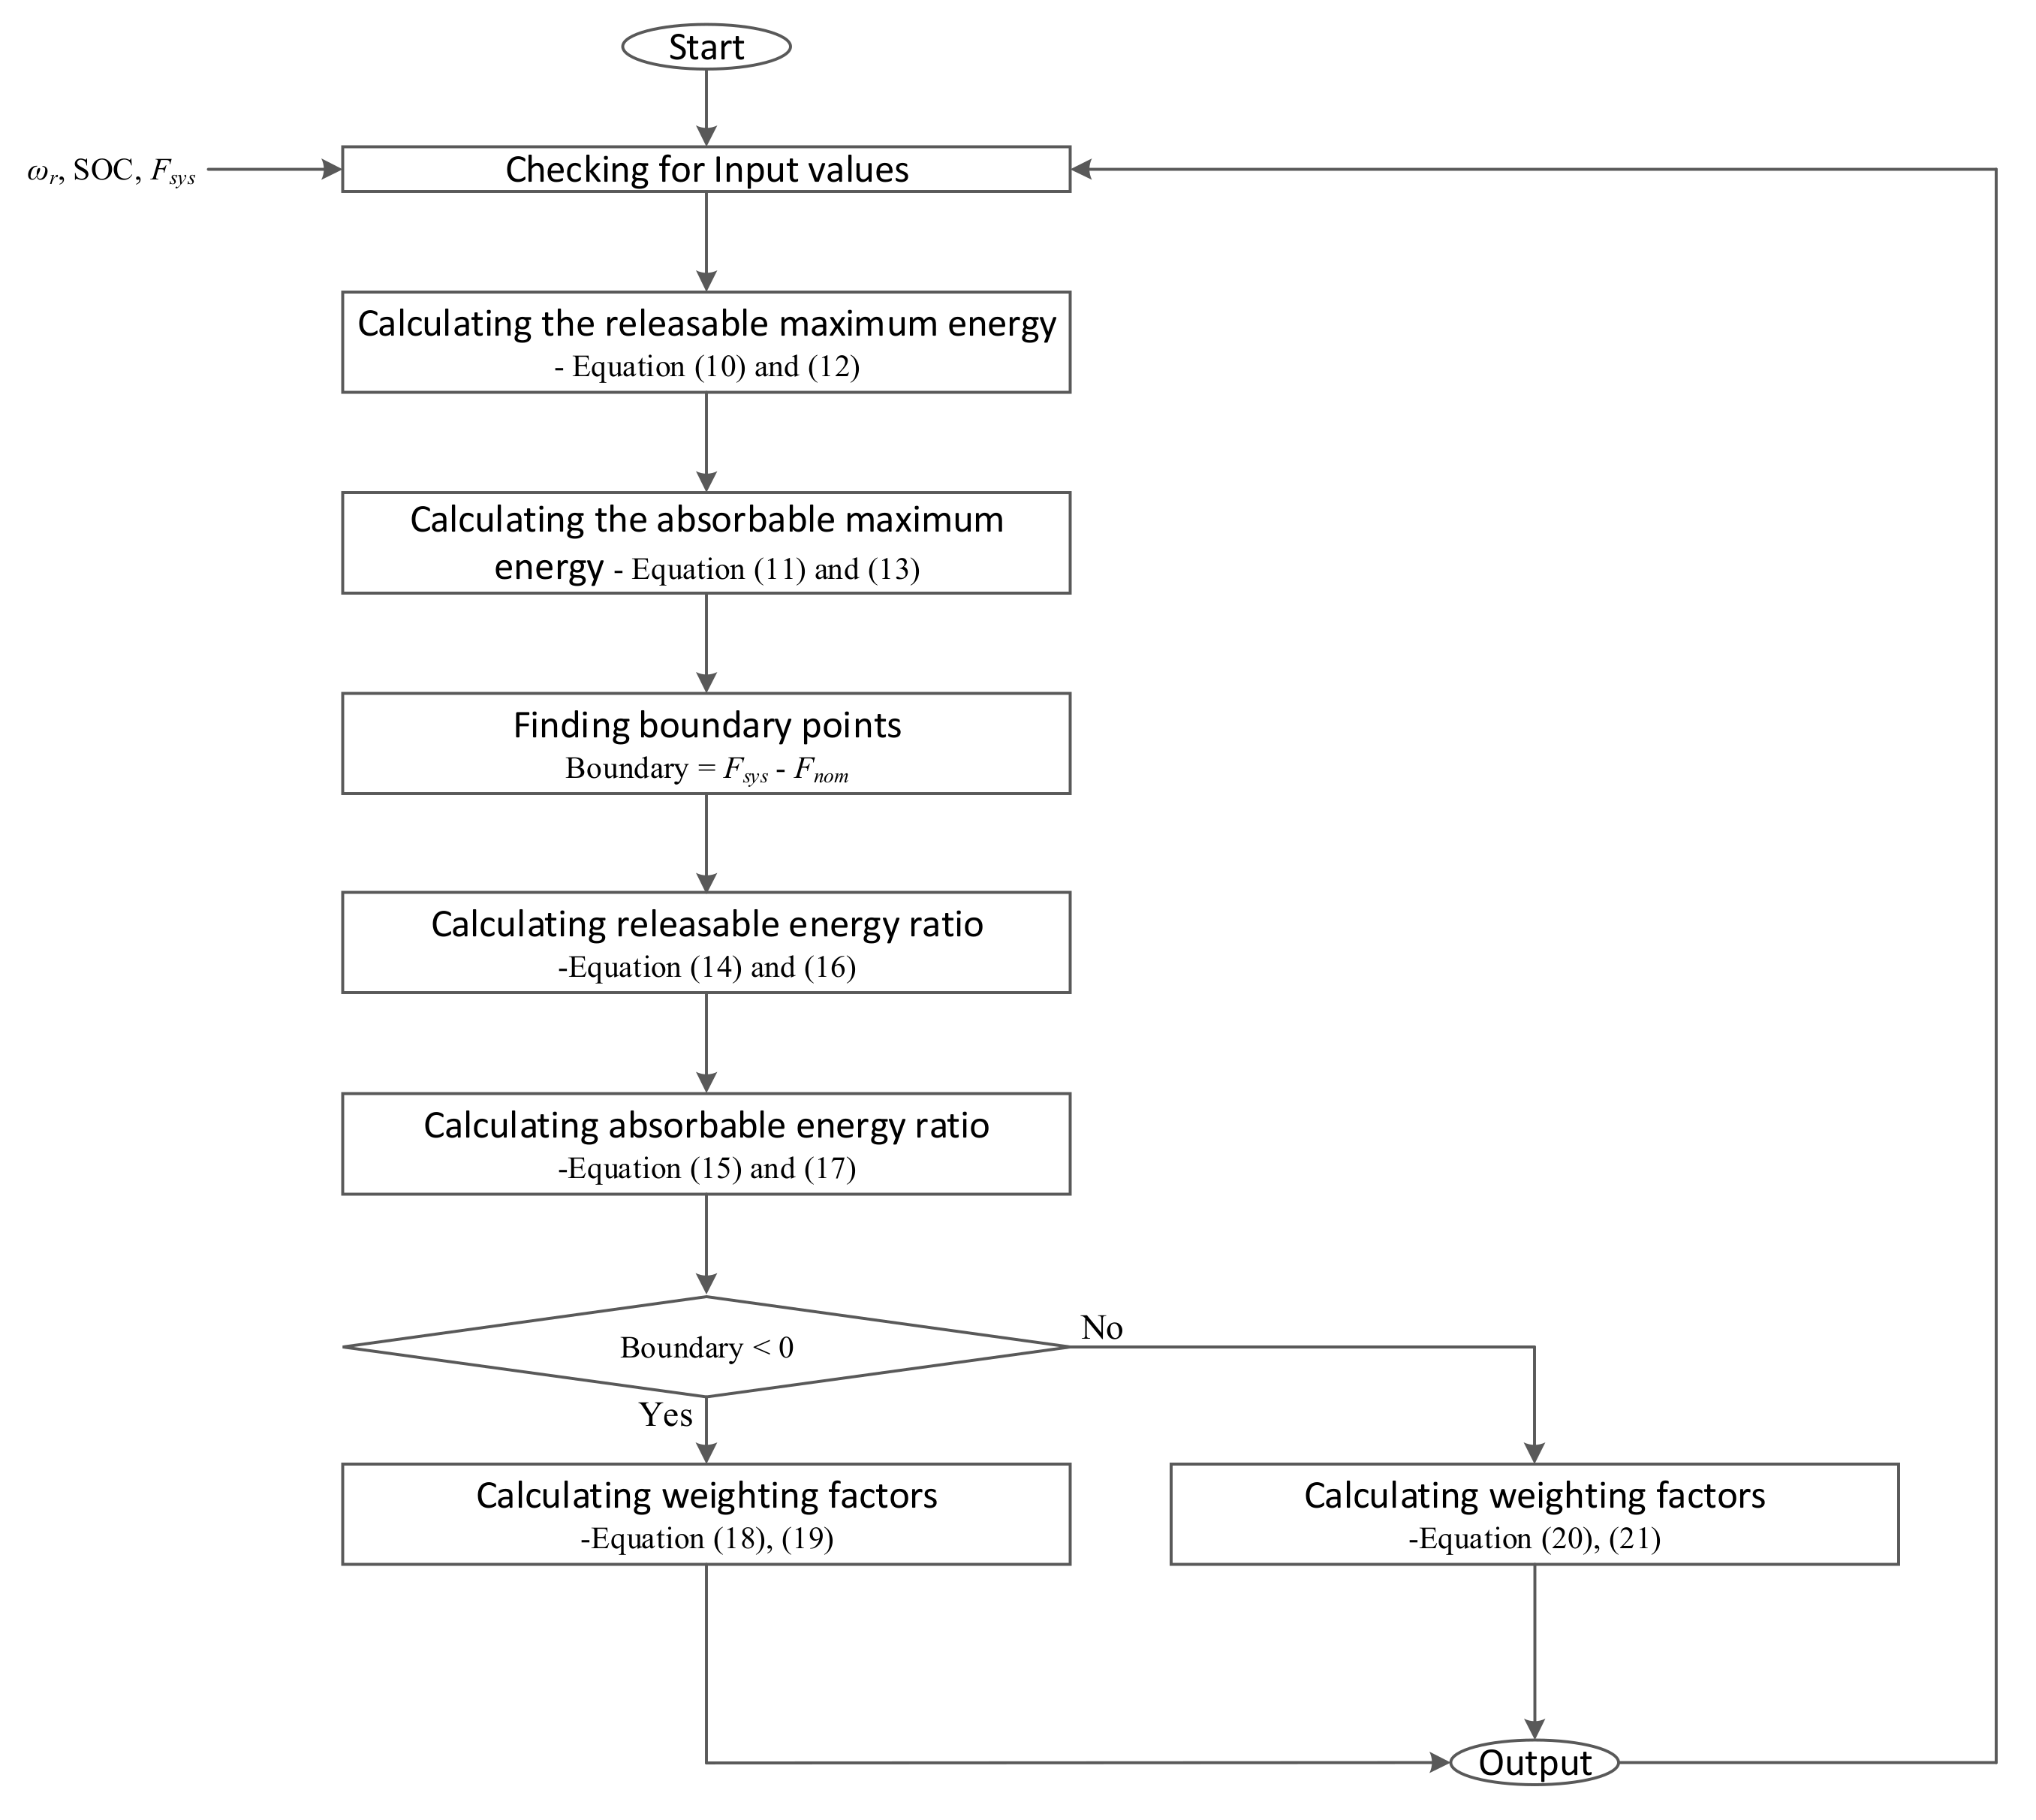
Figure 5 shows the flowchart for the coordinated frequency stabilization between the WTG and ESS. The algorithm presents the host controller for the coordination between the WTG and ESS that regulates the system frequency to the nominal frequency and increases the system reliability.
The resource and system values, such as wr, SOC, and Fsys, were required when implementing the proposed algorithm. It performed the following series of steps:
- 1)
The algorithm calculated the releasable and absorbable maximum energy of the WTG and ESS. The releasable and absorbable maximum energy of the WTG were represented as
where
J,
wmax, and
wmin are the inertia constant, maximum rotor speed, and minimum rotor speed of a WTG, respectively. The releasable and absorbable maximum energy of an ESS were represented using:
where
C,
SOCmax, and
SOCmin are the capacity, maximum SOC, and minimum SOC of a battery, respectively.
- 2)
To adjust the determined energy ratios for the WTG and ESS, the algorithm calculated the frequency deviation, Δf = fsys – fnom.
- 3)
The releasable and absorbable energy ratios of the WTG and ESS were calculated to increase the utilized energy and improve the frequency stabilization. The releasable and absorbable energy ratio of the WTG were represented as:
The releasable and absorbable energy ratio of ESS were represented as:
- 4)
The energy ratio consisted of two values from Step 1 to Step 3, i.e., the ratio for the releasable energy and the ratio for the absorbable energy. The weighting factors of the WTG and ESS were calculated for two cases, i.e., one without a power system and the other with excessive electricity, which could be confirmed through the system frequency in Step 2.
The weighting factors of the releasable energy were represented as:
The weighting factors of absorbable energy were represented as:
where
p and
q are the coefficients related to the penetration levels of WTG and ESS, respectively. The penetration levels of the WTG and ESS needed to be considered when determining the proper weight of the control for the frequency stabilization of the power system.
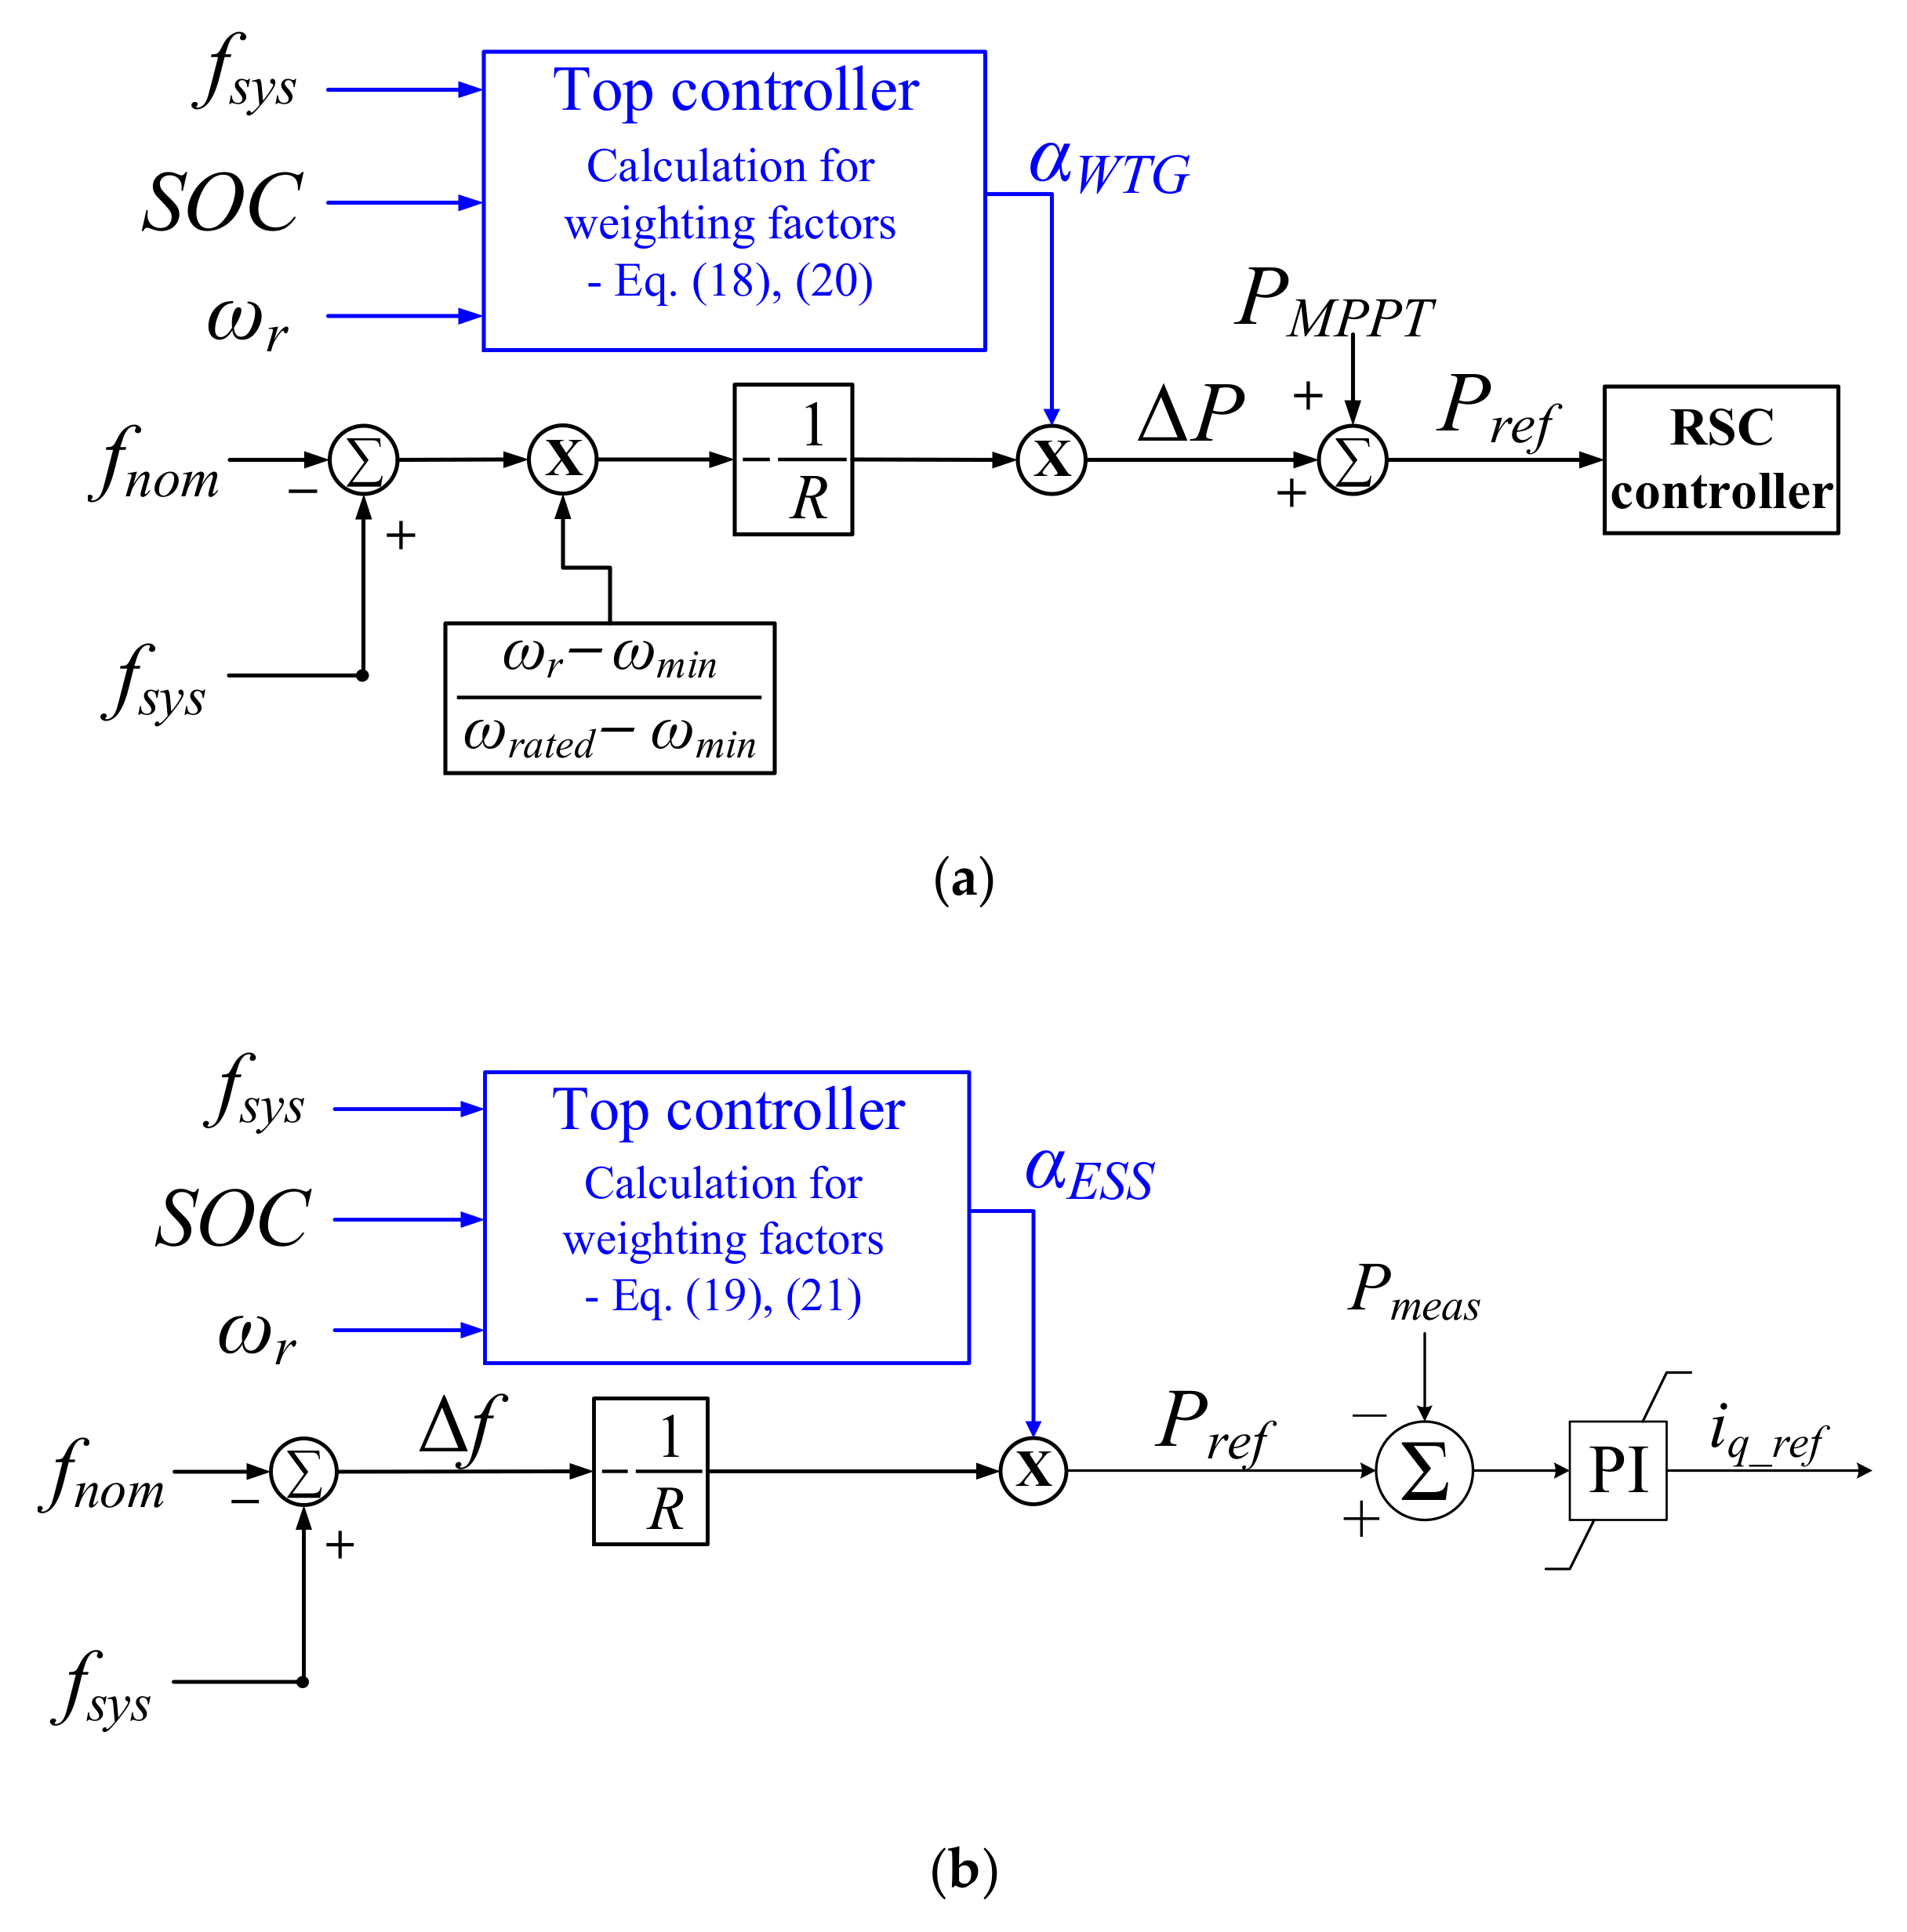
The weighting factors calculated using the coordinated control were multiplied and converted to the conventional frequency stabilization scheme as shown in
Figure 6.
Figure 6a shows the operational characteristics of a WTG; to support the frequency stabilization, the additional reference power, Δ
P, was calculated and added to the reference of the MPPT control. When the frequency fluctuated, Δ
P was calculated using the multiplication of the inverse of the system frequency and weighting factor according to the releasable and absorbable energy. The reference active power of ESS was calculated using the droop loop multiplied by a weighting factor. Thus, the WTG and ESS could contribute to the frequency stabilization and also adequately utilize the stored energy by sharing their releasable and absorbable energies.
4. Case Studies
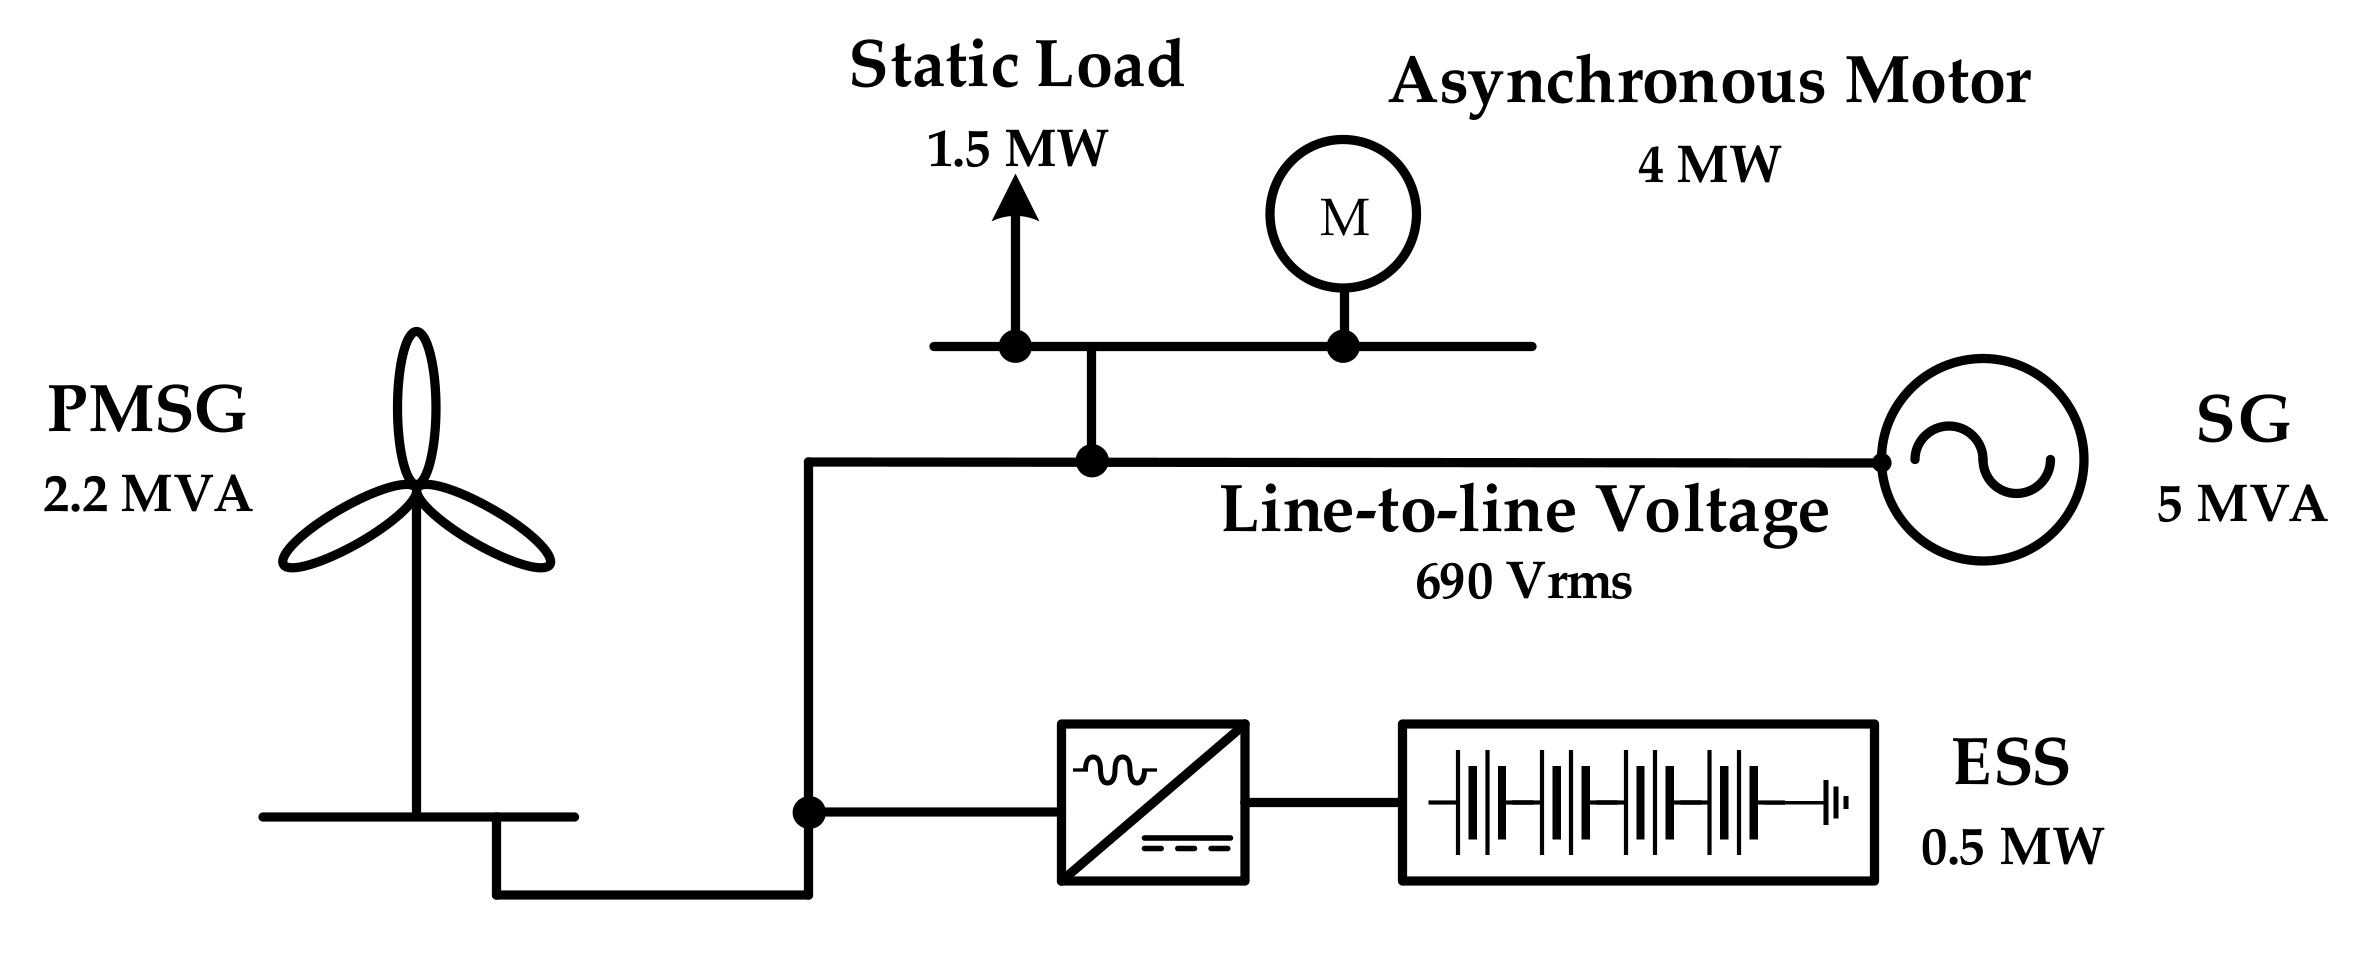
The isolated microgrid was modeled to investigate the performance of the coordinated frequency stabilization scheme. It was simulated using MATLAB Simulink Electrical simulator. The model system consisted of the static load, asynchronous motor, ESS, diesel generator, and PMSG, and they were connected in parallel, as shown in
Figure 7. Furthermore, the initial values of the microgrid are shown in
Table 1. In the
Appendix, the parameters that affected the dynamics of the model system are explained, namely the parameters of the asynchronous motor and diesel generator. In this study, the system frequency was computed using zero crossing detection [
18]. The WTG and ESS had a droop loop to allow them to aid in the stabilization of the system frequency (see
Figure 1c). In this model, the wind power penetration level, which is defined as the capacity of wind power divided by the peak load, was calculated to be 40.0%.
The performance of the frequency stabilization control of a WTG is affected by the system frequency, which depends on the balance between supply power and demand power. Thus, we investigated the performance of the frequency stabilization schemes under various wind speeds. In addition, the proposed scheme had a positive performance, even in cases where the wind speed was kept very low. Furthermore, in the case of load variations, the performance of the proposed scheme was verified.
The performance of the coordinated control scheme was compared to a case where the WTG and ESS participated in frequency stabilization. In addition, it was also compared to a case where the WTG did not support the frequency stabilization but ESS supported it. In the conventional case, the droop gains of the WTG and ESS were set to −200 and −20, respectively. Furthermore, the coefficients p and q in the coordinated control were set to 1.5 and 3, respectively.
Table 2 shows the organization of the case studies to performance of the frequency stabilization control. Cases 1–3 analyze the performance of the proposed scheme according to the retention status of the releasable and absorbable energy of the WTGs and ESS. The main cause of the system frequency fluctuations in this case was the wind speed variation. Case 4 analyzes the performance of the proposed scheme due to rapid load changes. The following subsections describe the comparative analysis results for the frequency stabilization for the four cases.
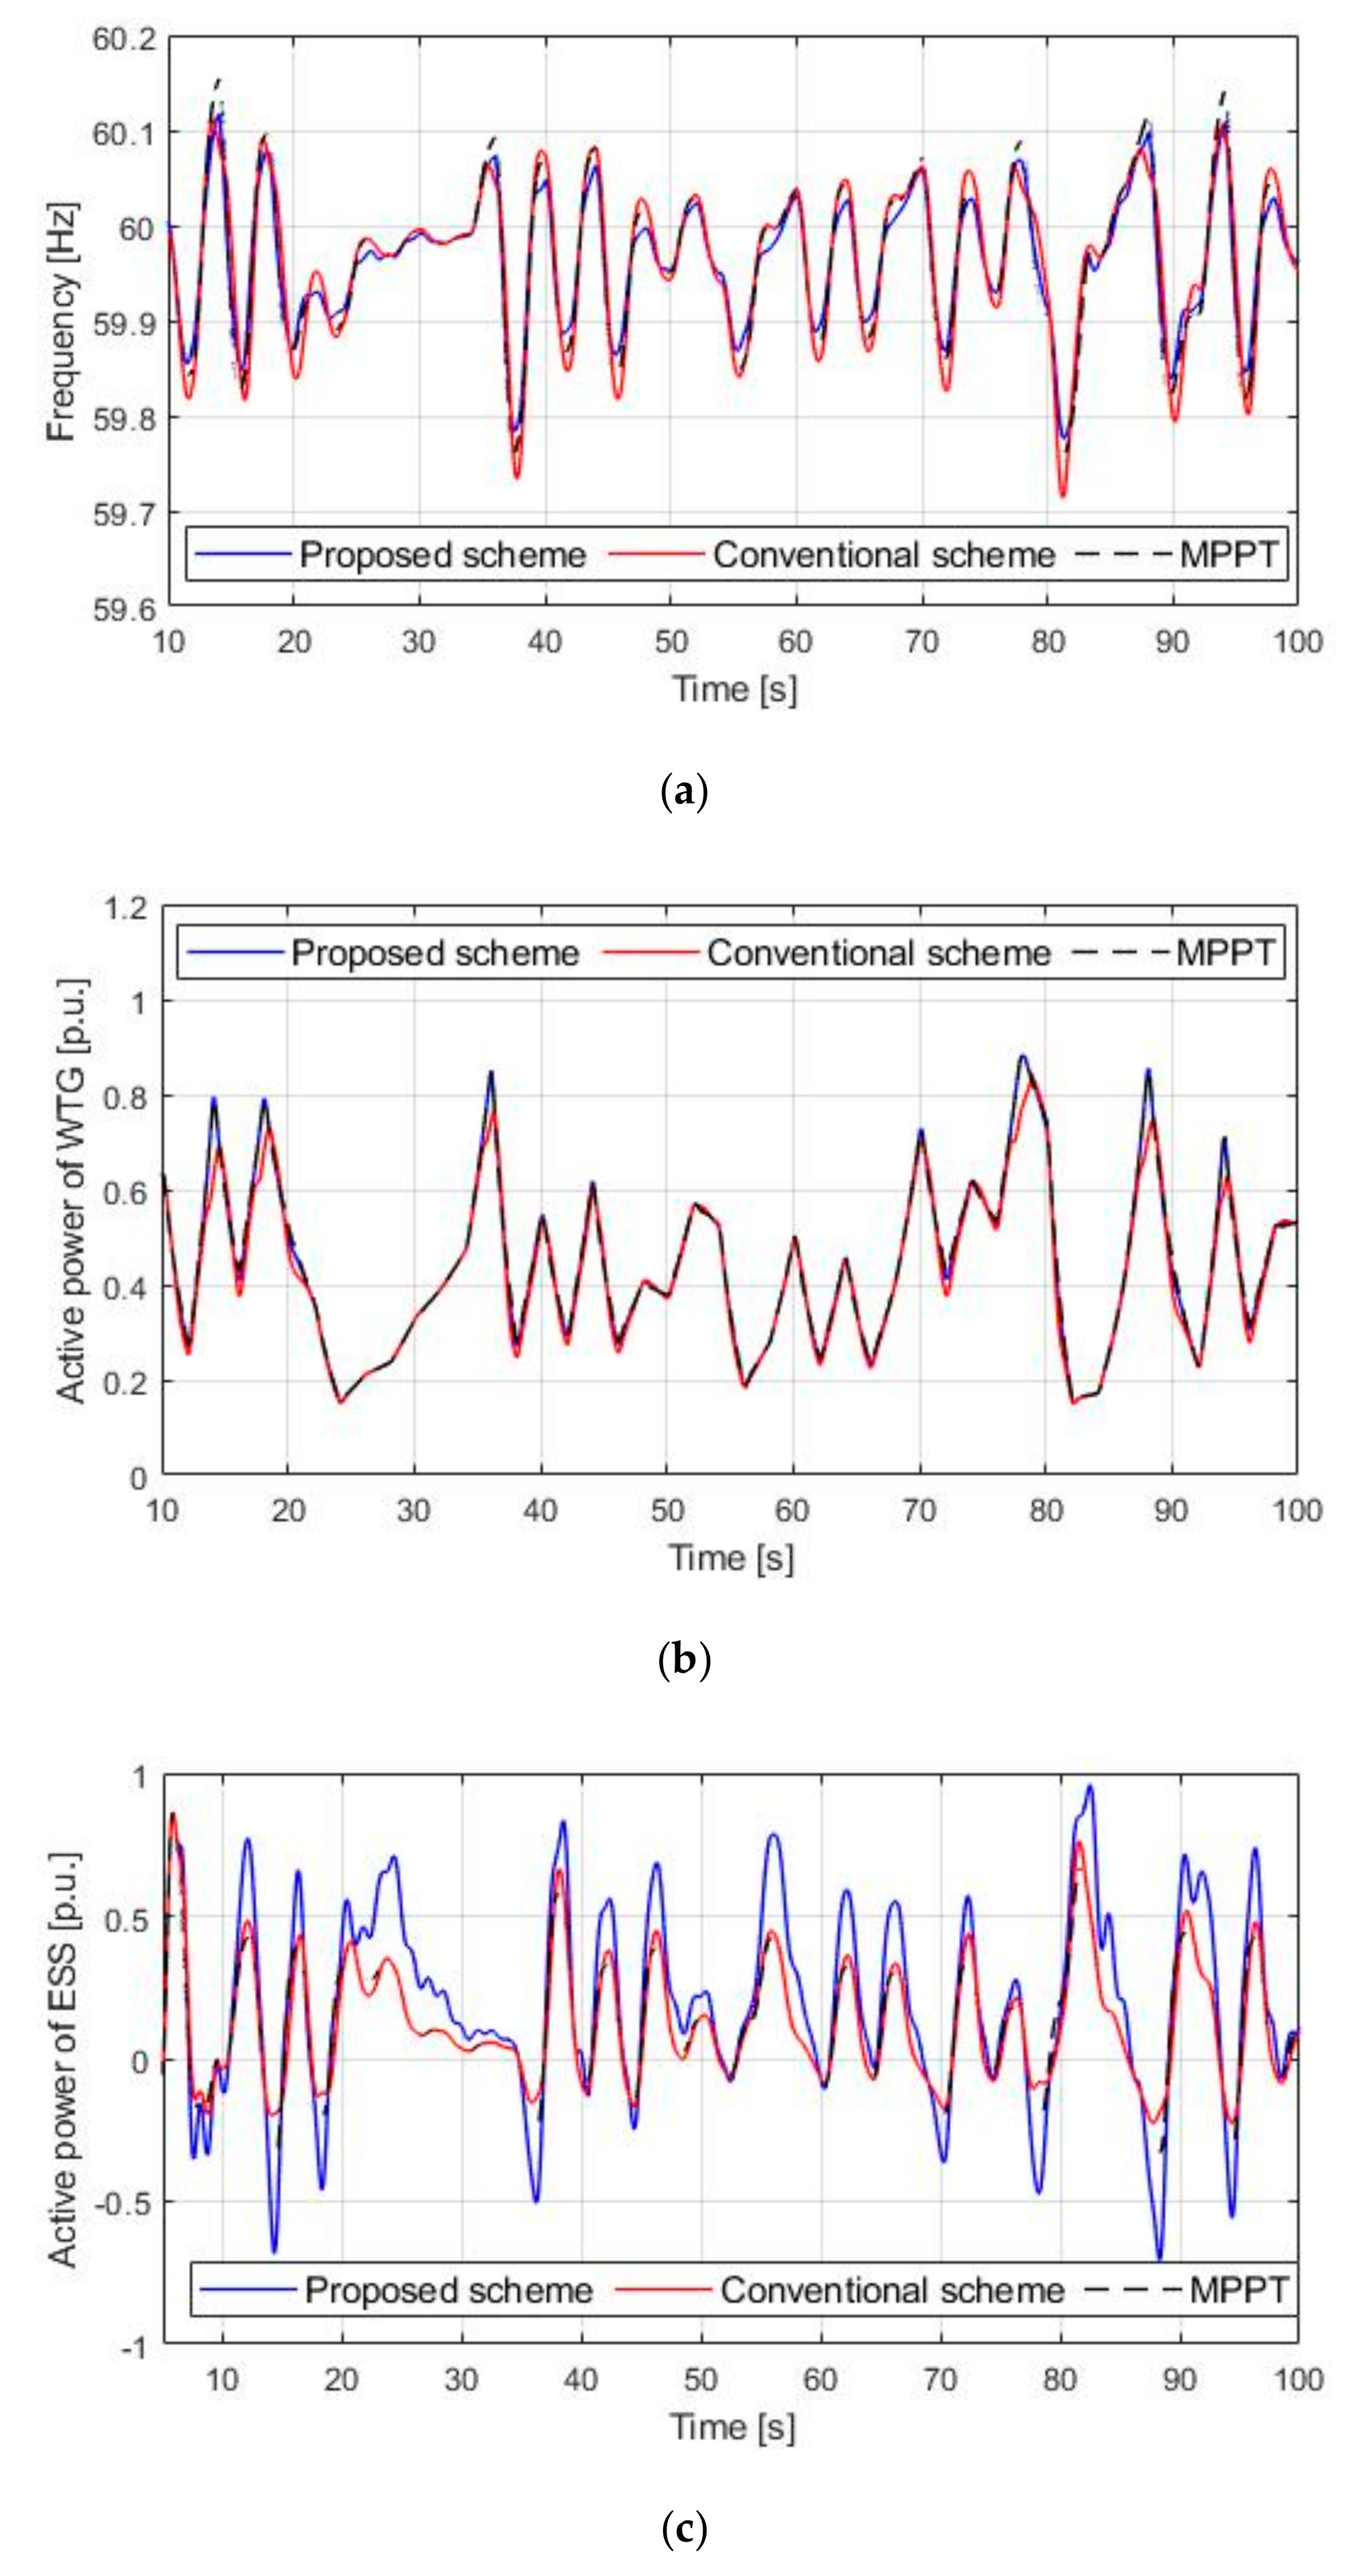
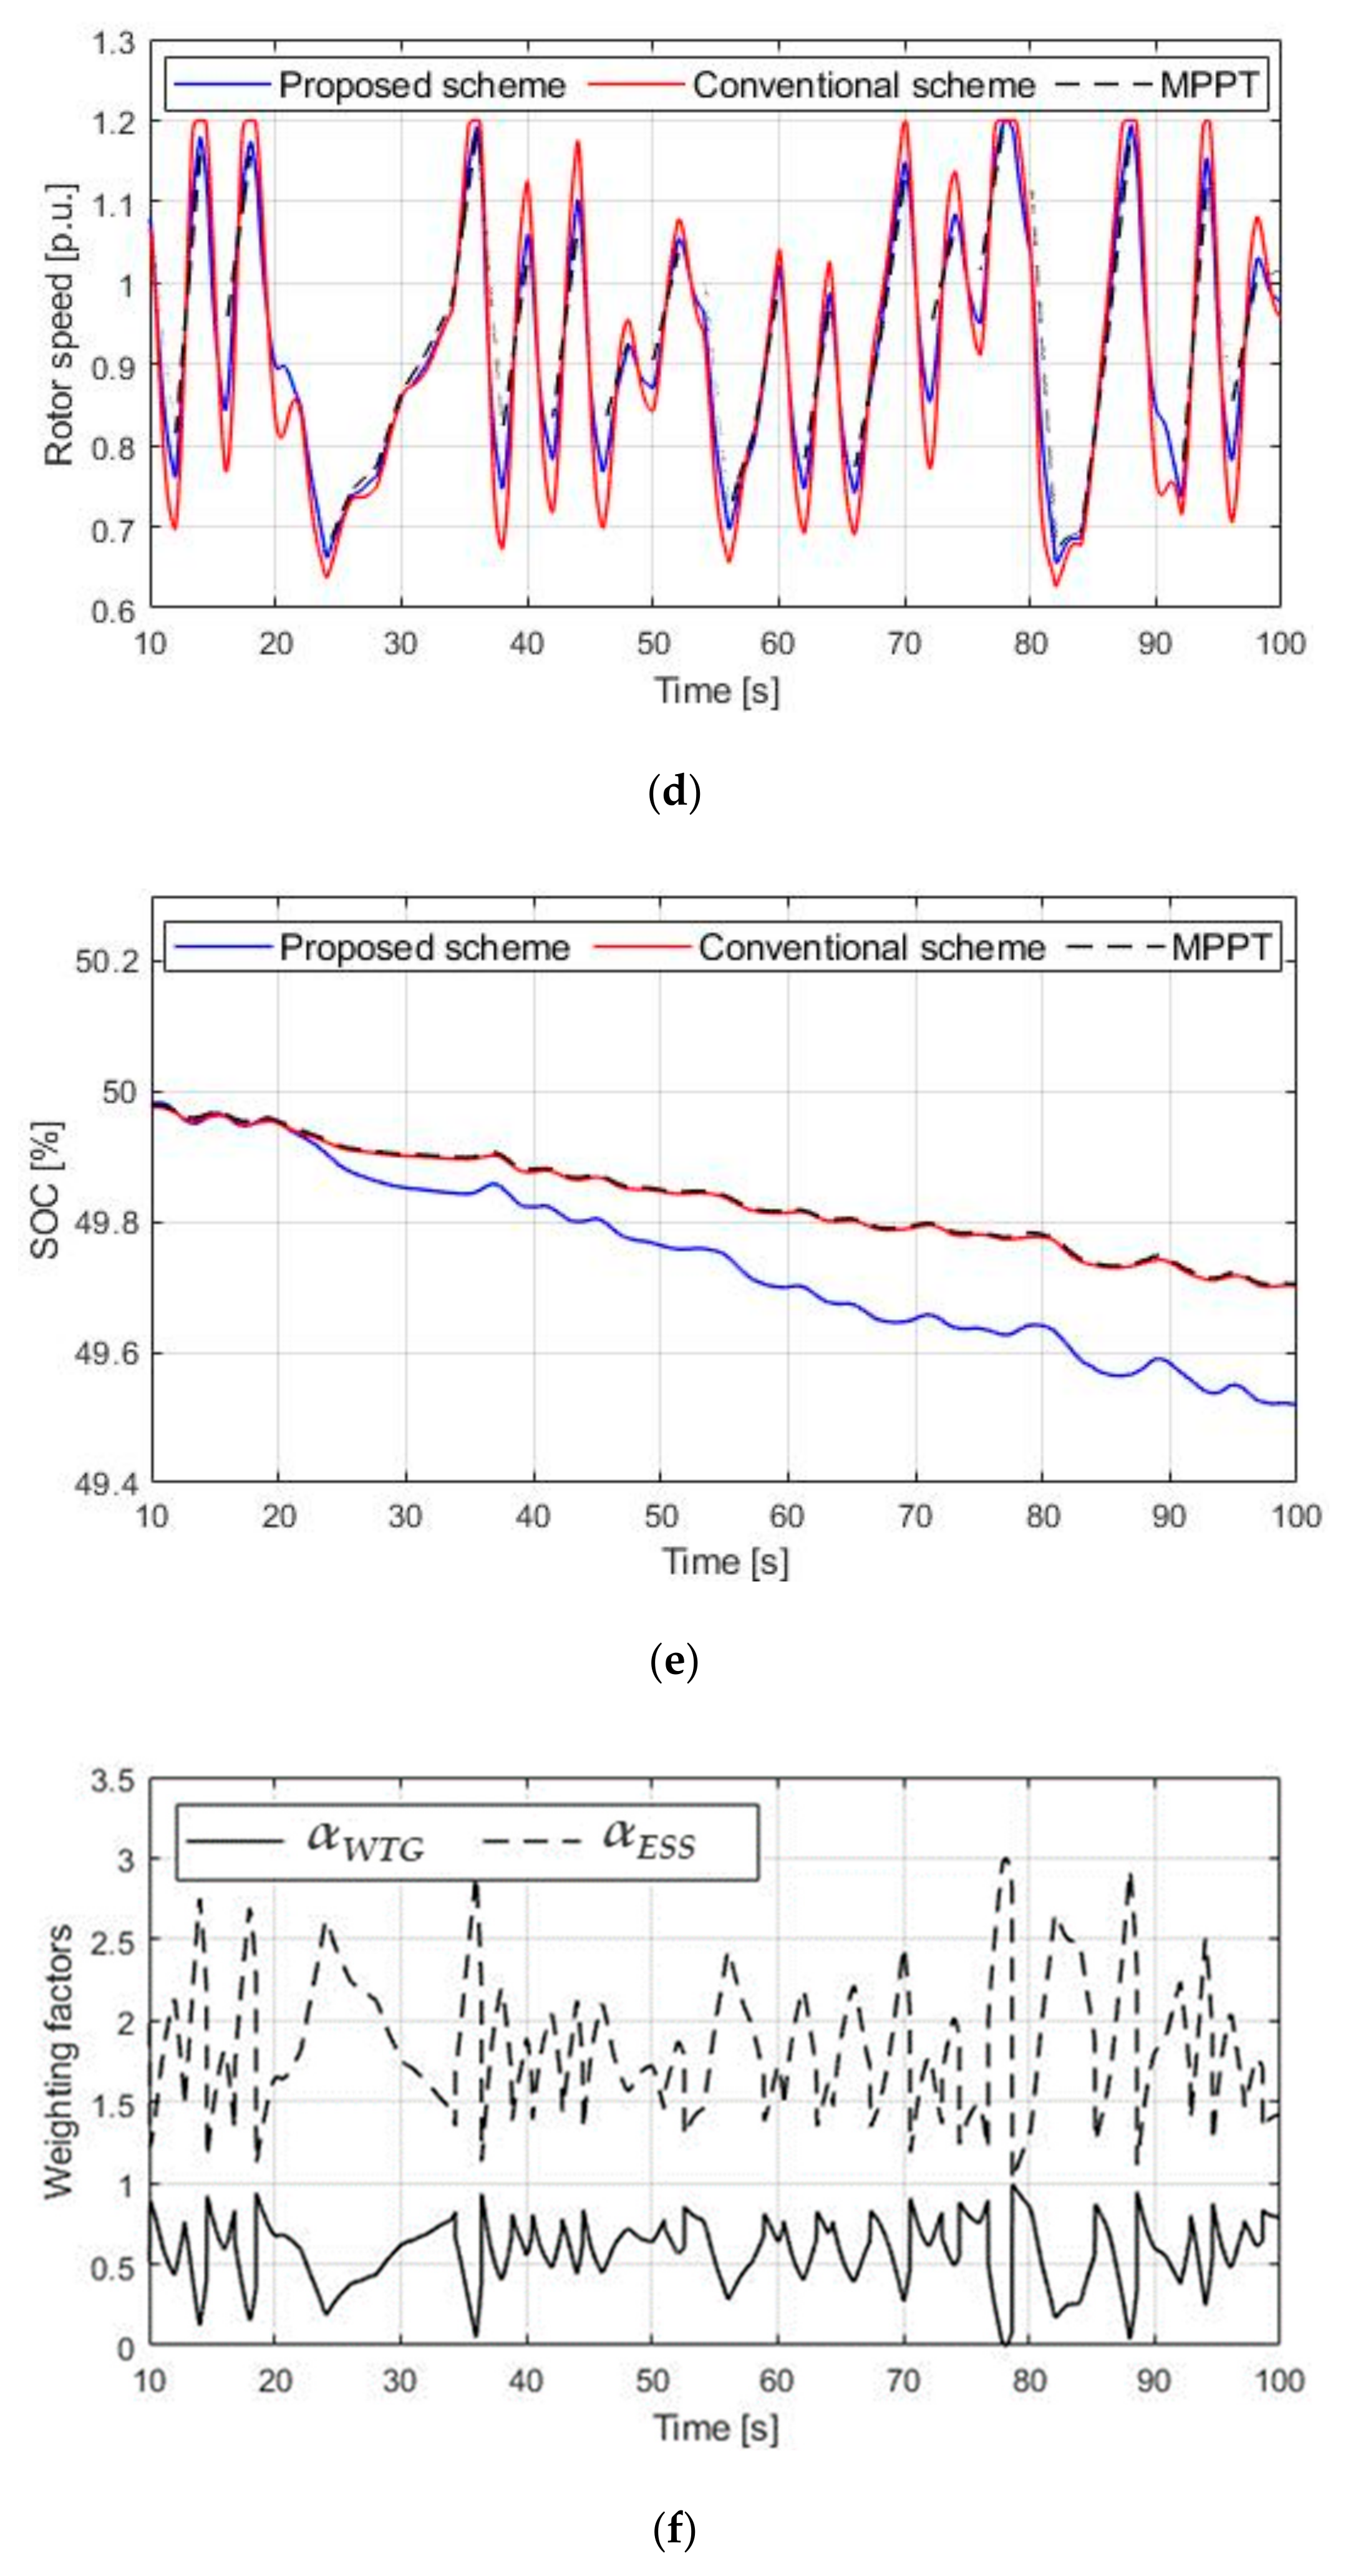
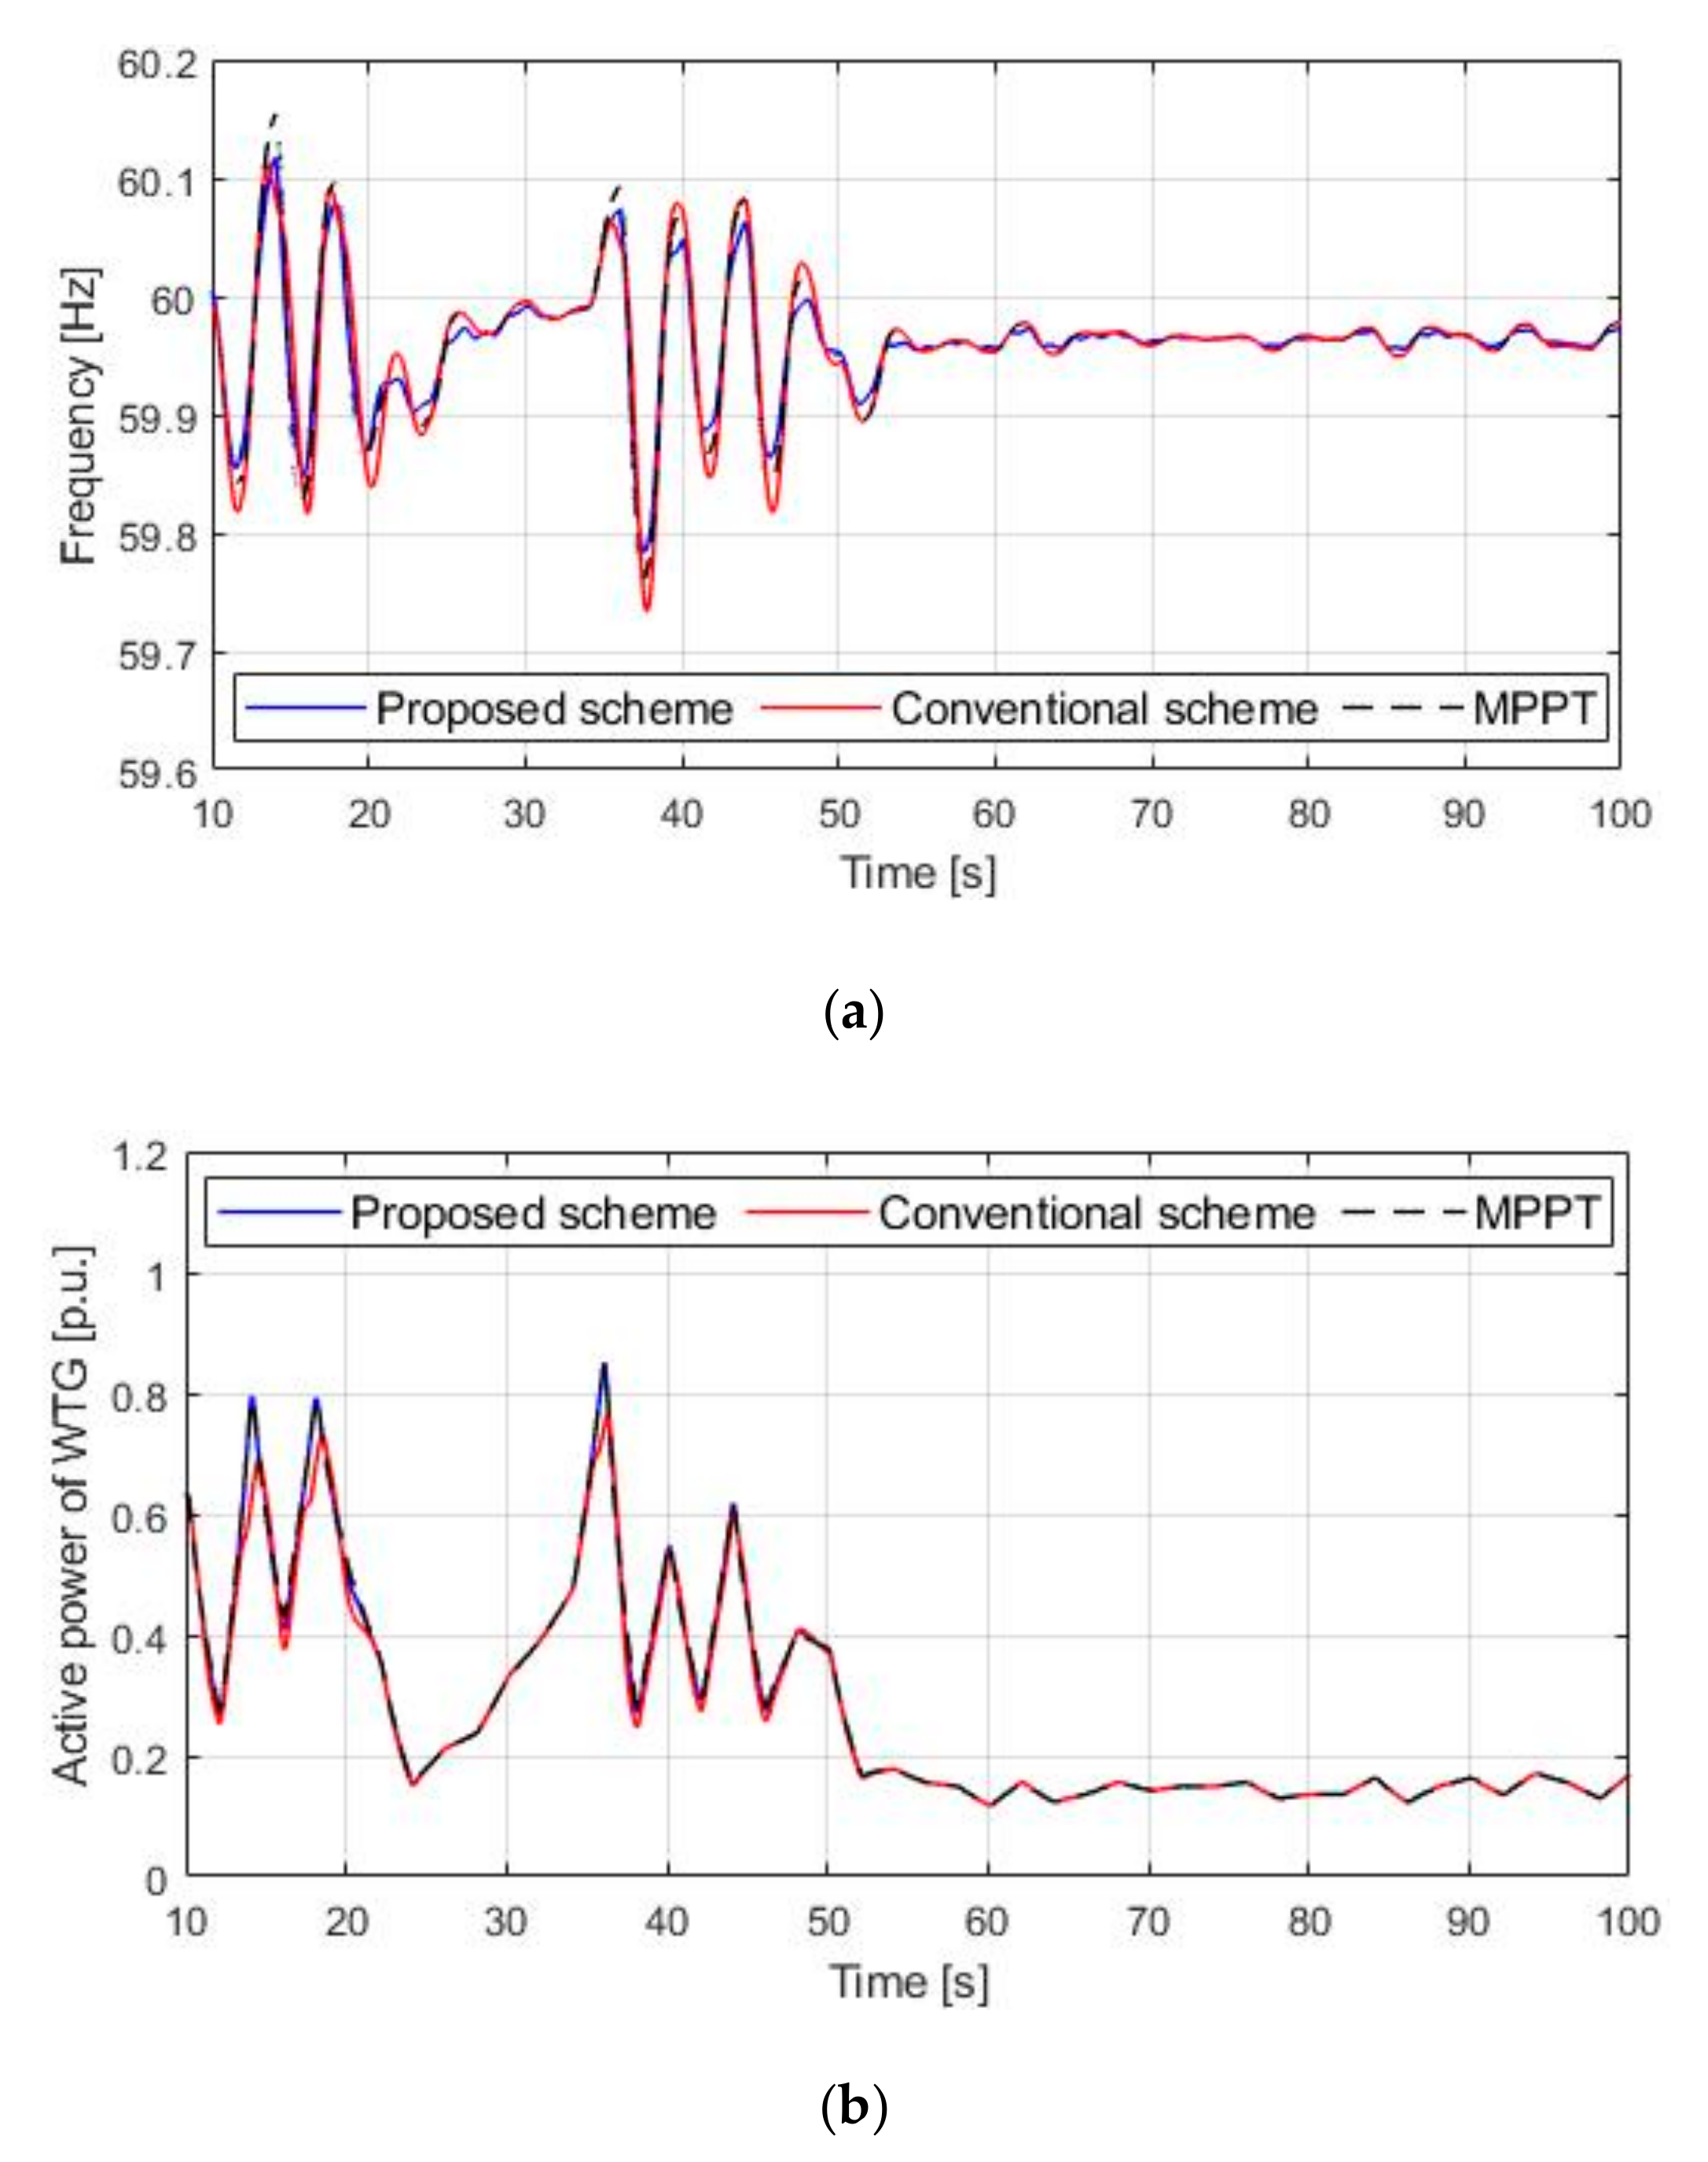
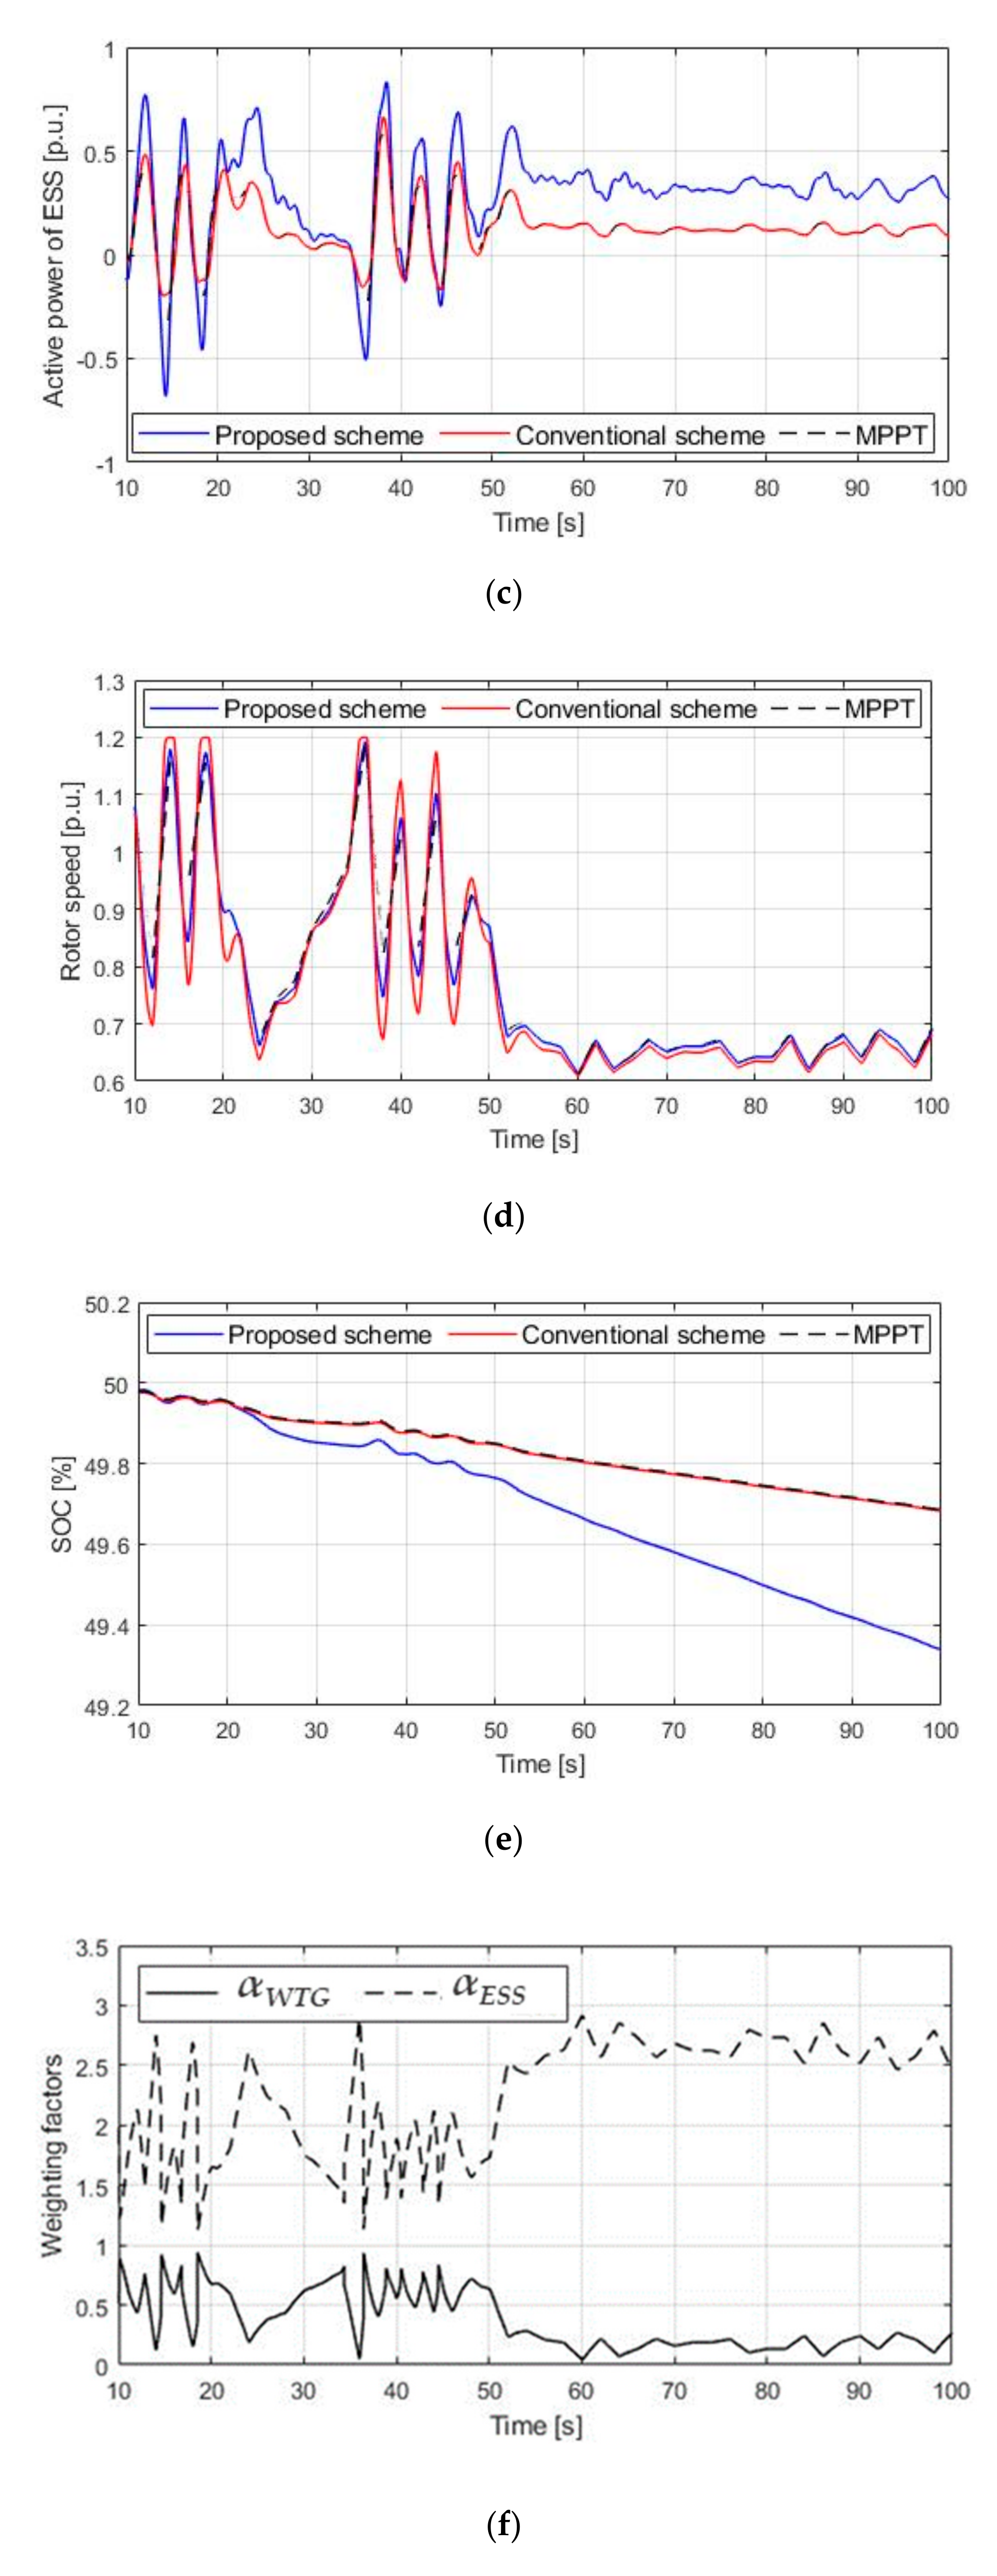
4.1. Case 1: Variable Wind Speed, 50% of Initial SOC, and Constant Loads
In this case, the initial SOC of the ESS was set at 50% and both the WTG and ESS supported the system frequency stabilization.
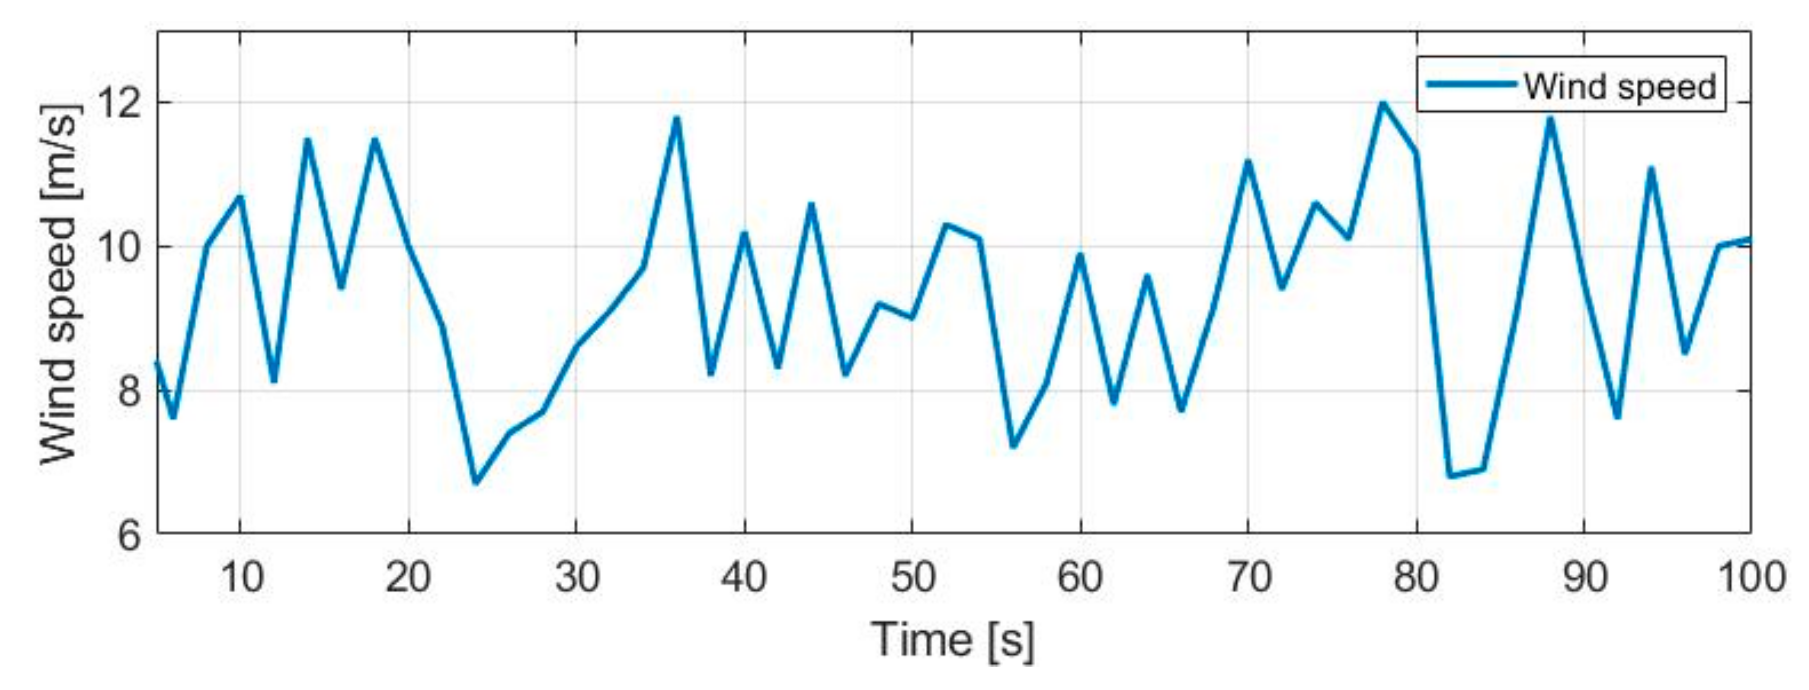
Figure 8 shows the wind speed variation profile, and based on the fluctuation of the output power of a WTG from wind speed variation, the system frequency fluctuated.
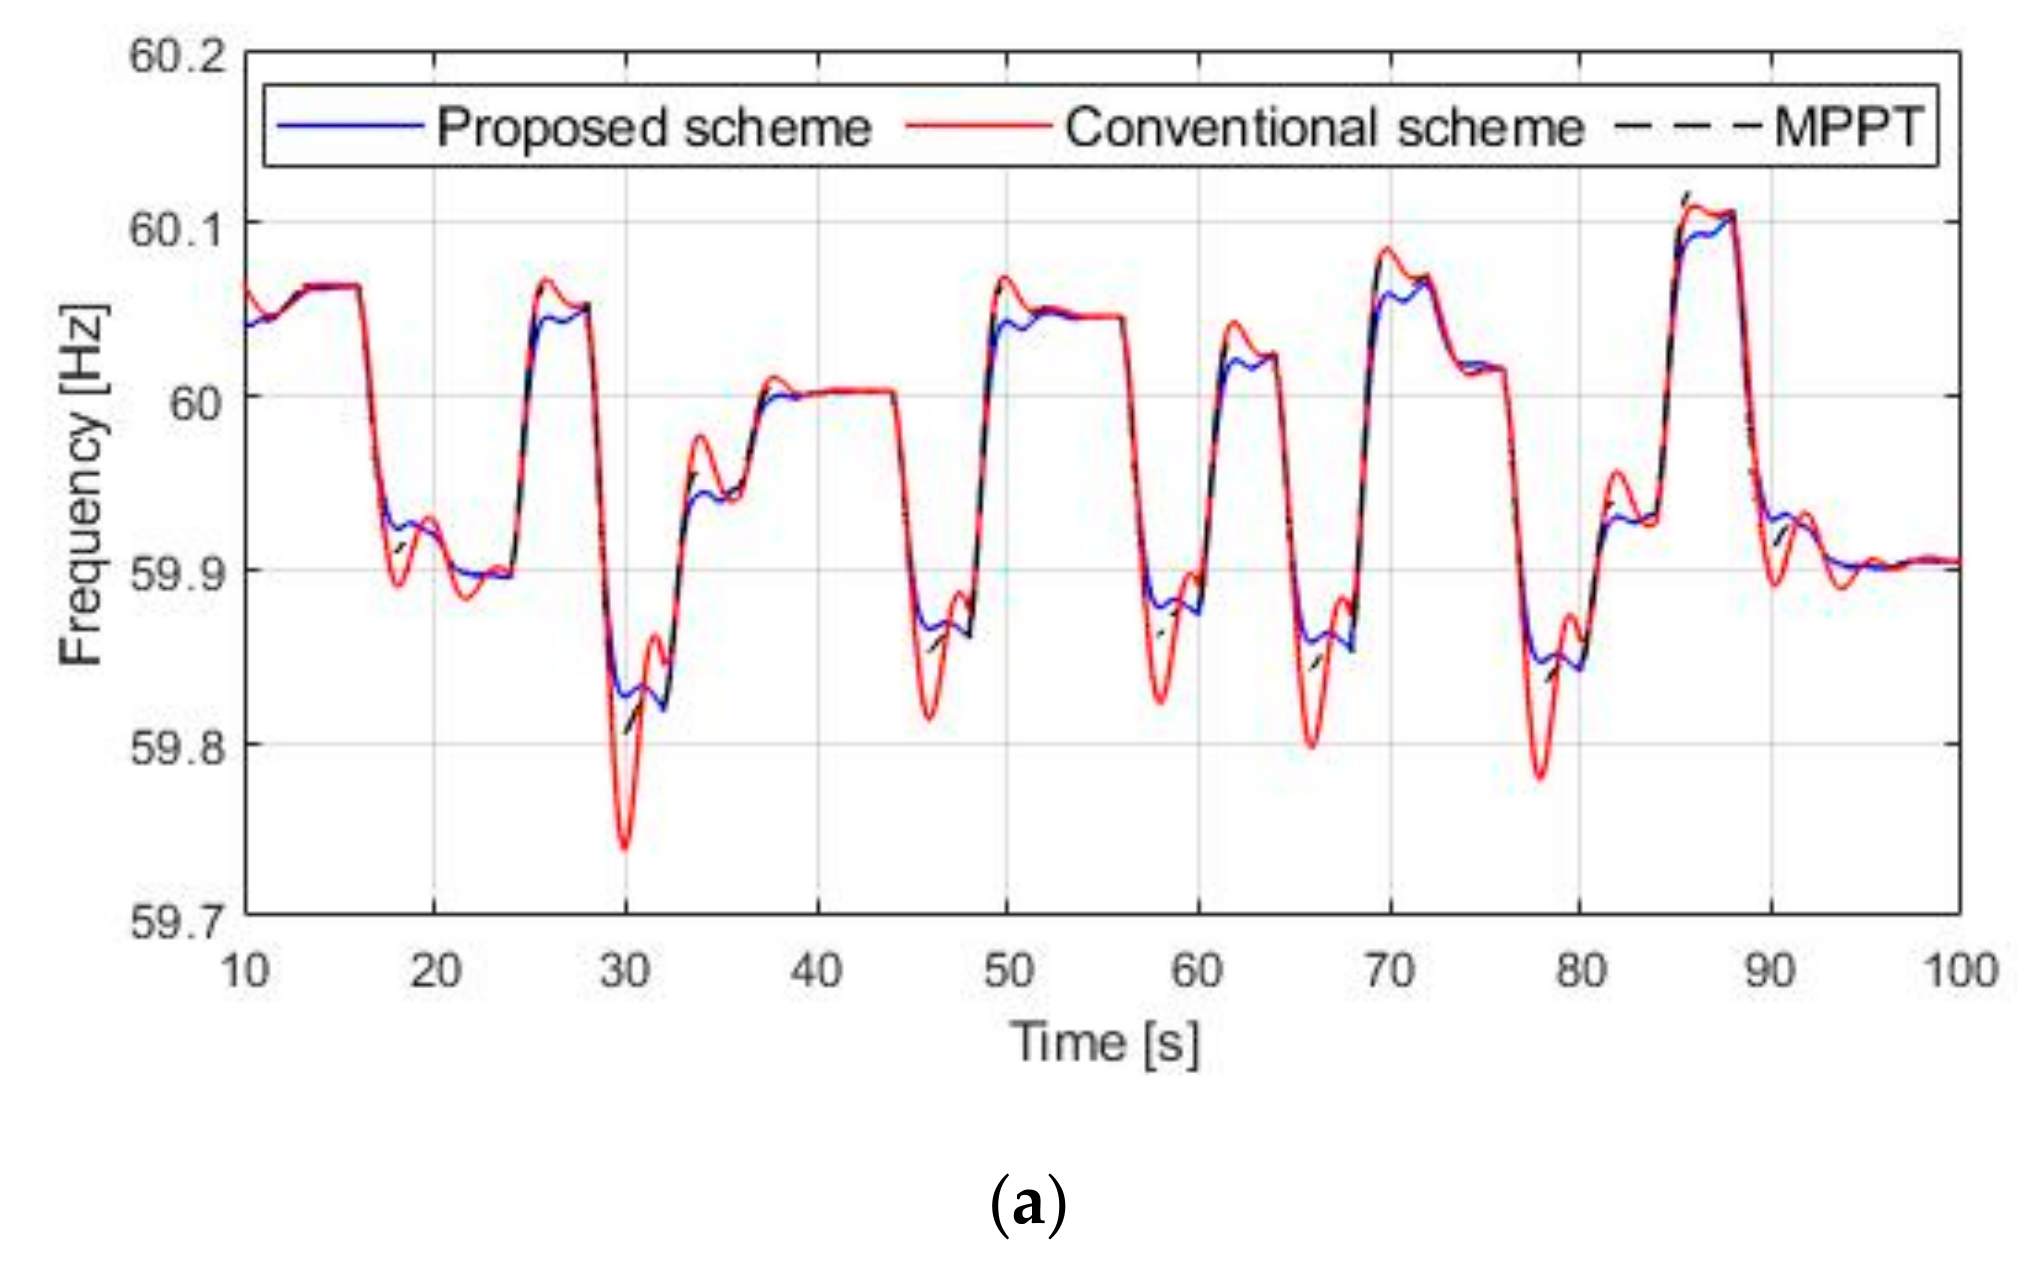
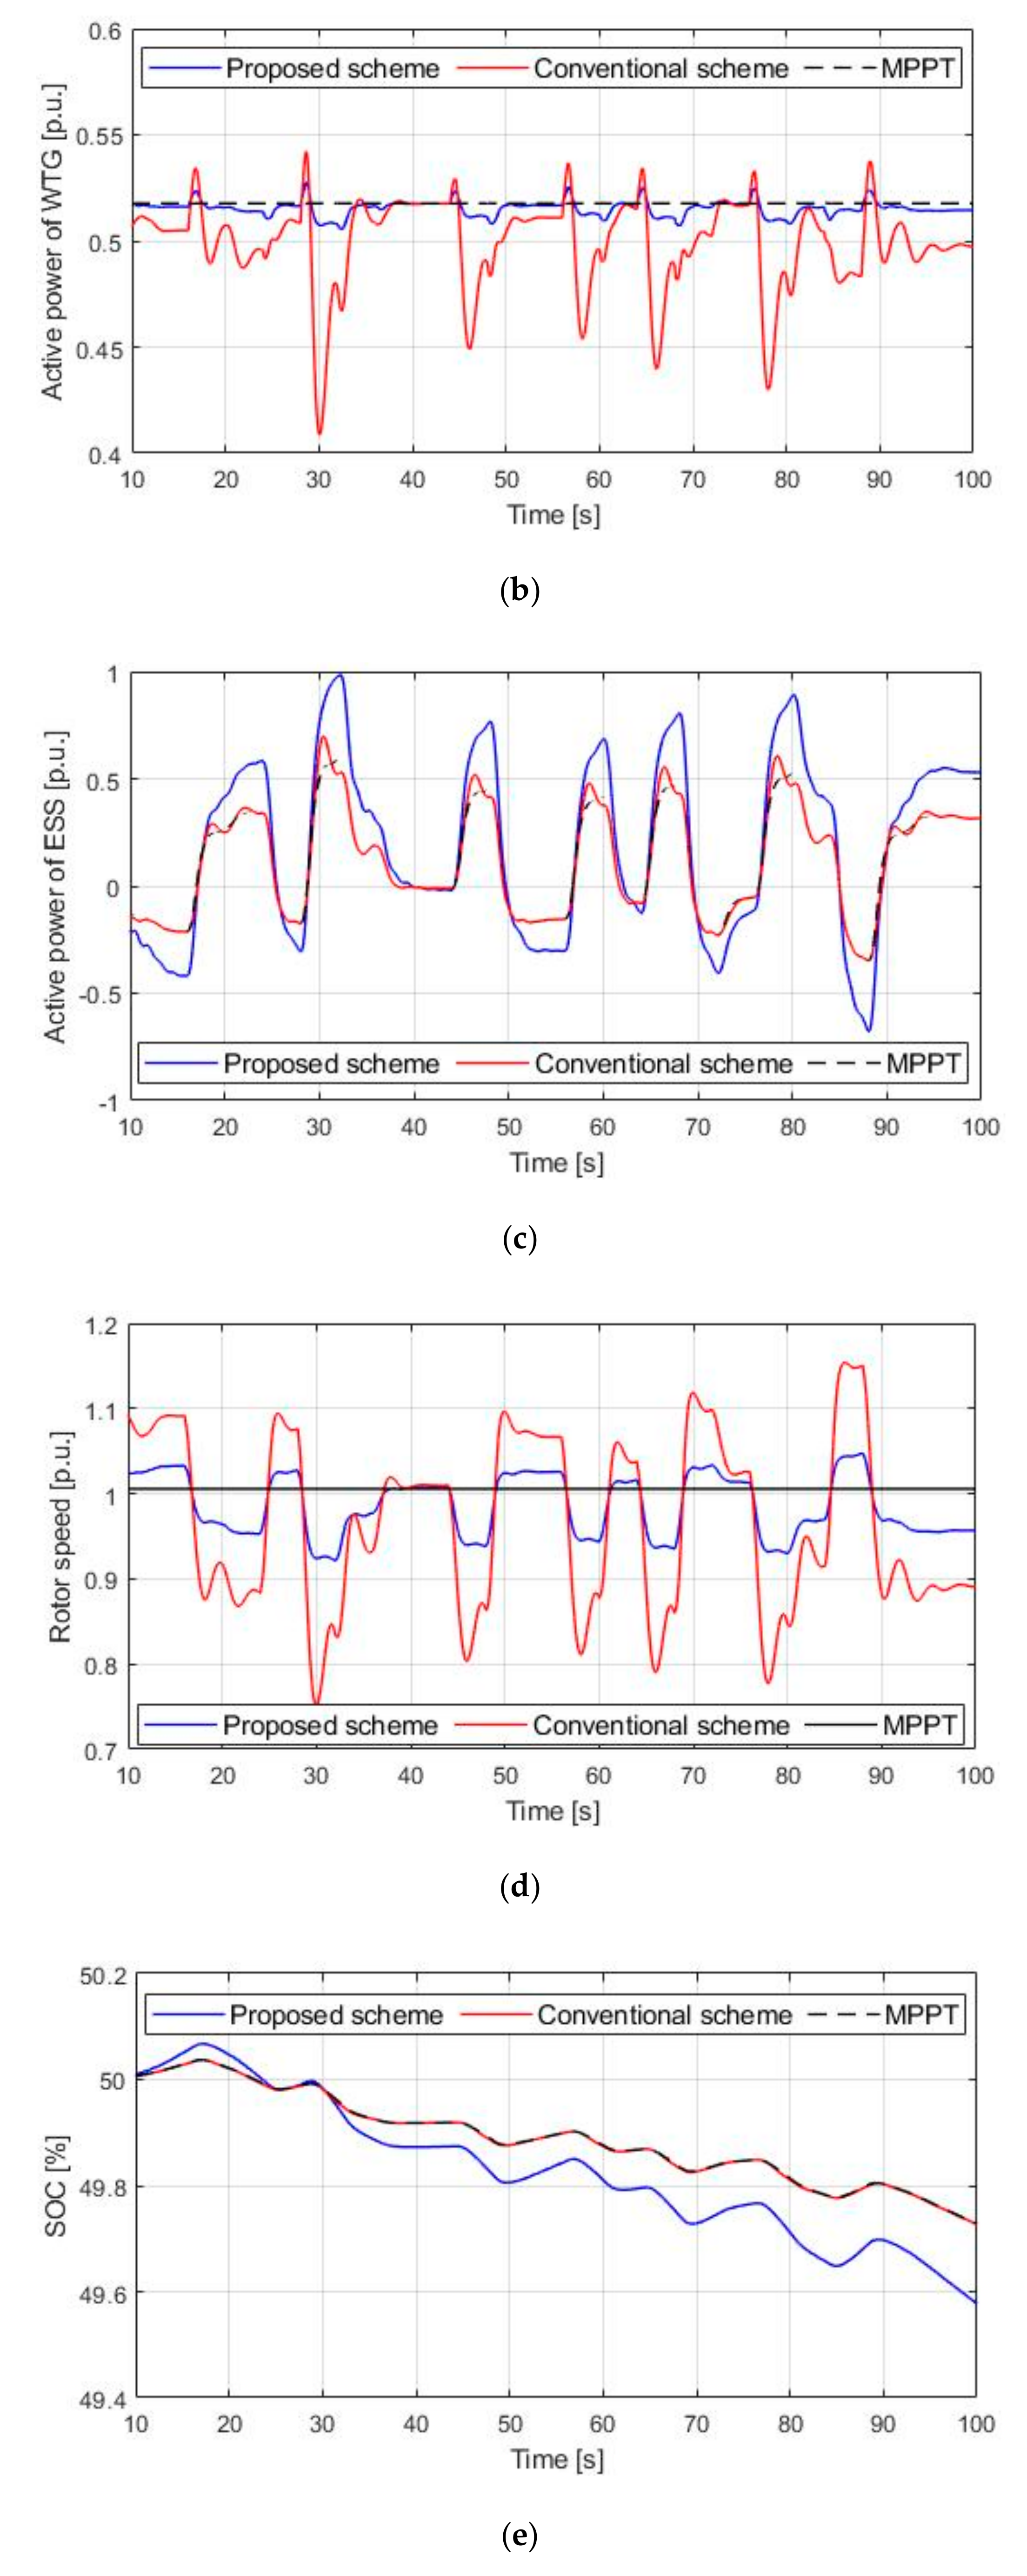
Figure 9 shows the simulation results, including the effects of the wind speed variation. The frequency deviation for the proposed scheme was less than that of the conventional scheme. The peak-to-peak of the system frequency for the MPPT, conventional scheme, and proposed scheme were 0.3930 Hz, 0.3966 Hz, and 0.3404 Hz, respectively. This was because the coordinated control arbitrated the releasable and absorbable energy of WTG and ESS; thus, in the results for the proposed scheme, the active power of the ESS was released more in line with the conventional scheme (see
Figure 9c). The active power of the WTG rapidly reduced as the wind speed significantly decreased between 80.0 s and 82.0 s. The system frequency decreased to 59.71 Hz for the conventional scheme, and the decrease was less than that of the proposed scheme by 0.063 Hz. This was because the output power of a WTG in the conventional scheme was abruptly reduced and the output of an ESS could not easily and rapidly compensate for the decrease whereas the stored kinetic energy of the WTG was significantly released. However, the proposed scheme determined the weighting factors by considering their releasable and absorbable energy. The sudden decrease in wind power output due to wind speed decrease resulted in a decrease in releasable energy. Thus,
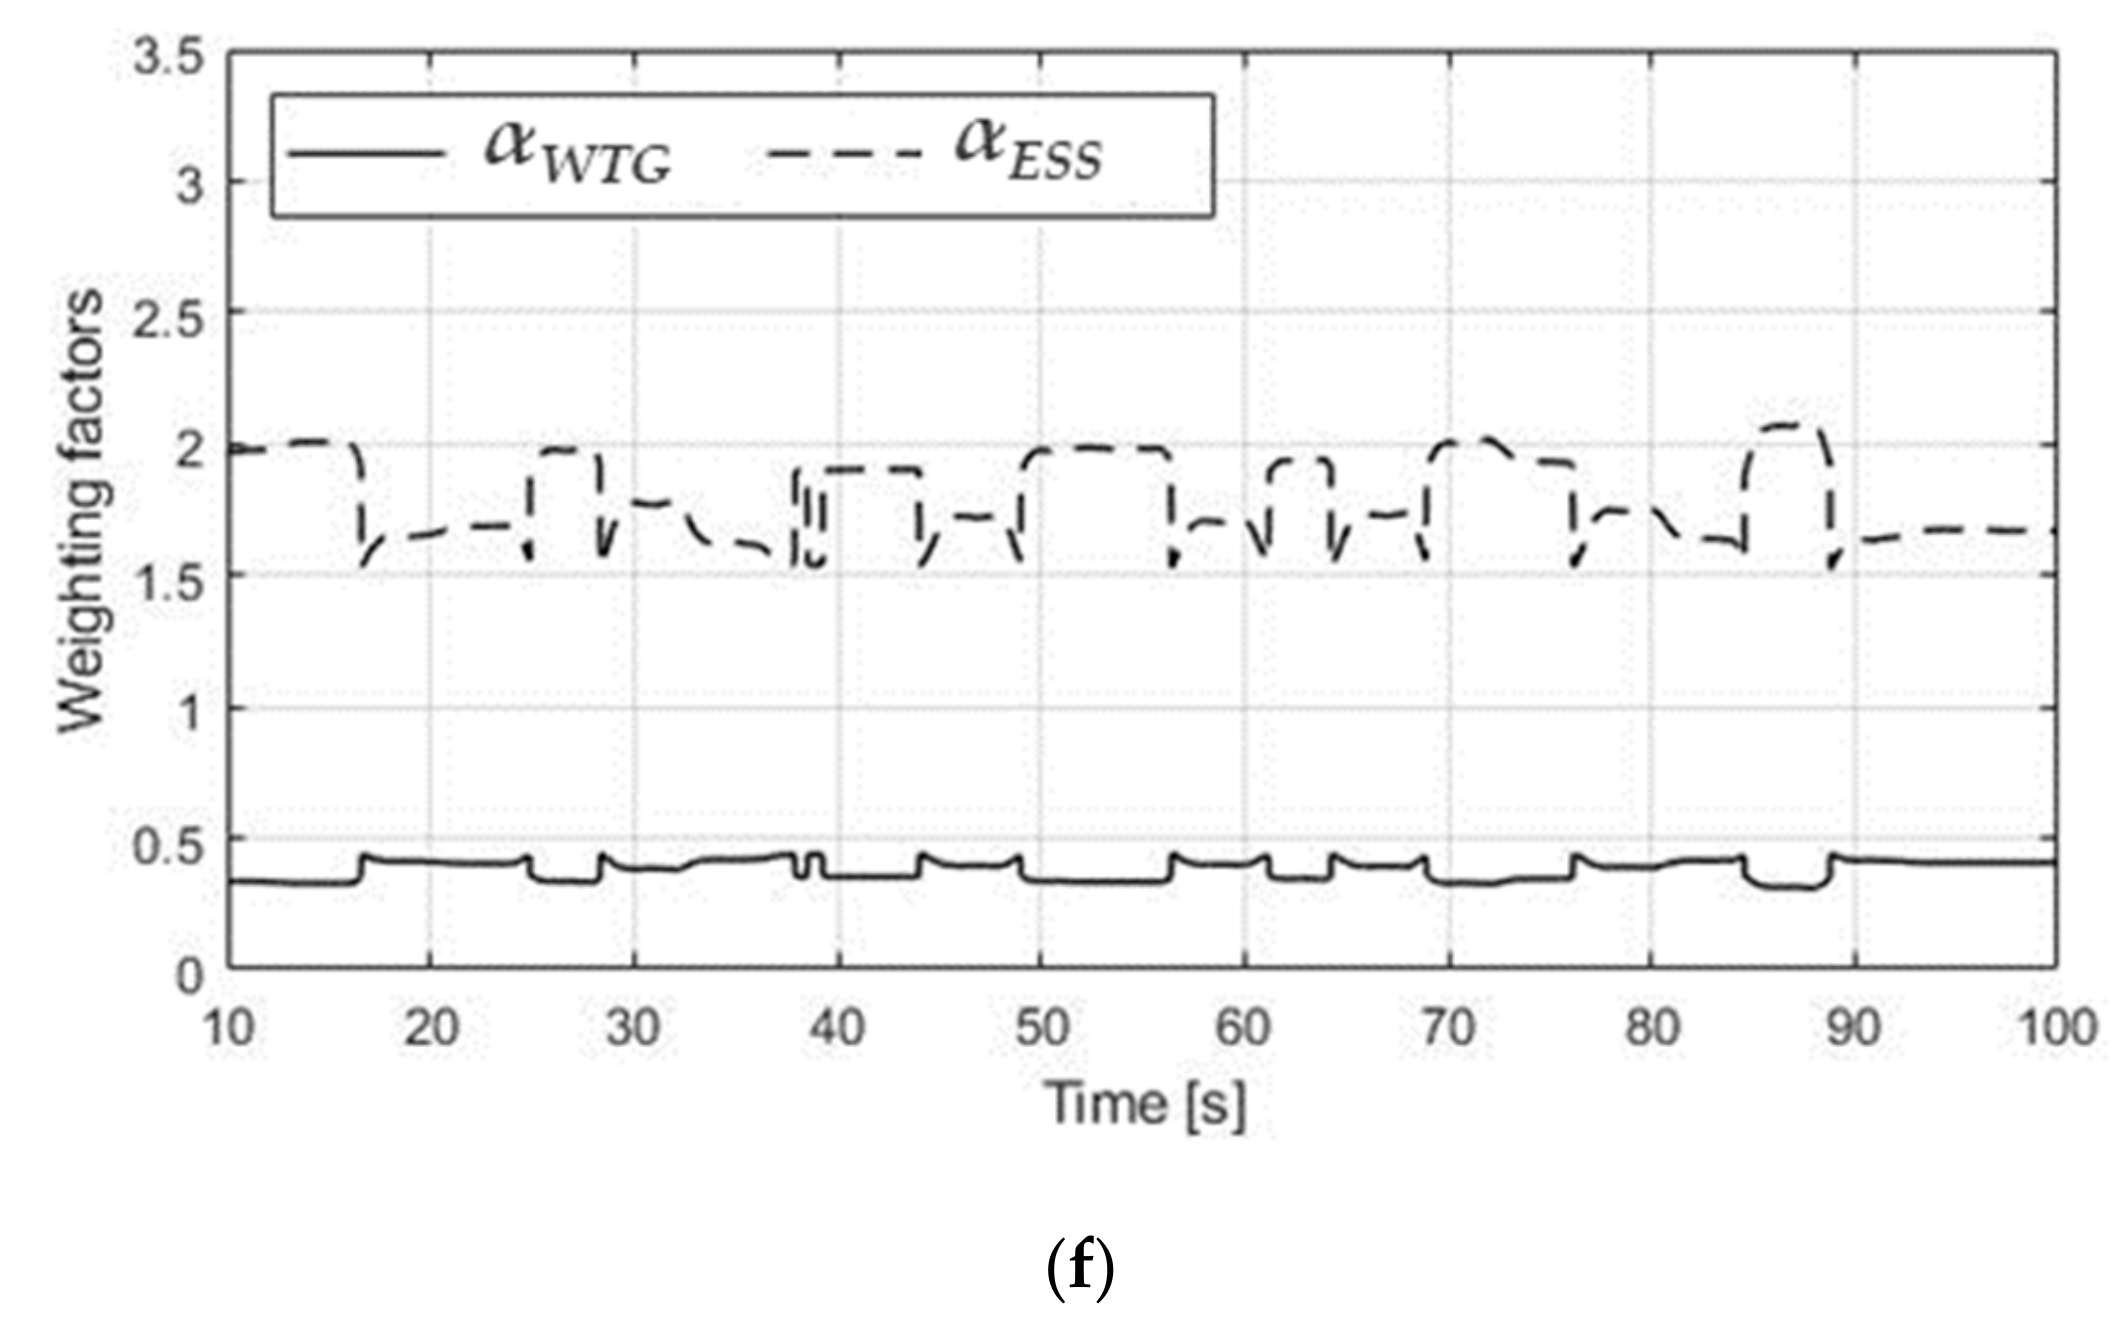
αWTG decreased, whereas
αESS increased; accordingly, ESS could compensate for the reduced output power of the WTG by releasing its electrical energy.
The reduced amount of SOC for the conventional and proposed schemes were 0.2984% and 0.4802%, respectively (see
Figure 9e). Because the coordinated control increased the additional active power using weighting factors related to SOC, the weighting factors of the WTG and ESS were calculated for the releasable and absorbable energy. In this case, the ESS had enough releasable and absorbable energy, and thus,
αESS was determined such that the ESS had a greater contribution compared to the WTG, as shown in
Figure 8f. Note that the high value of coefficient
p could adversely affect the frequency stabilization when the penetration level of the WTG was high.
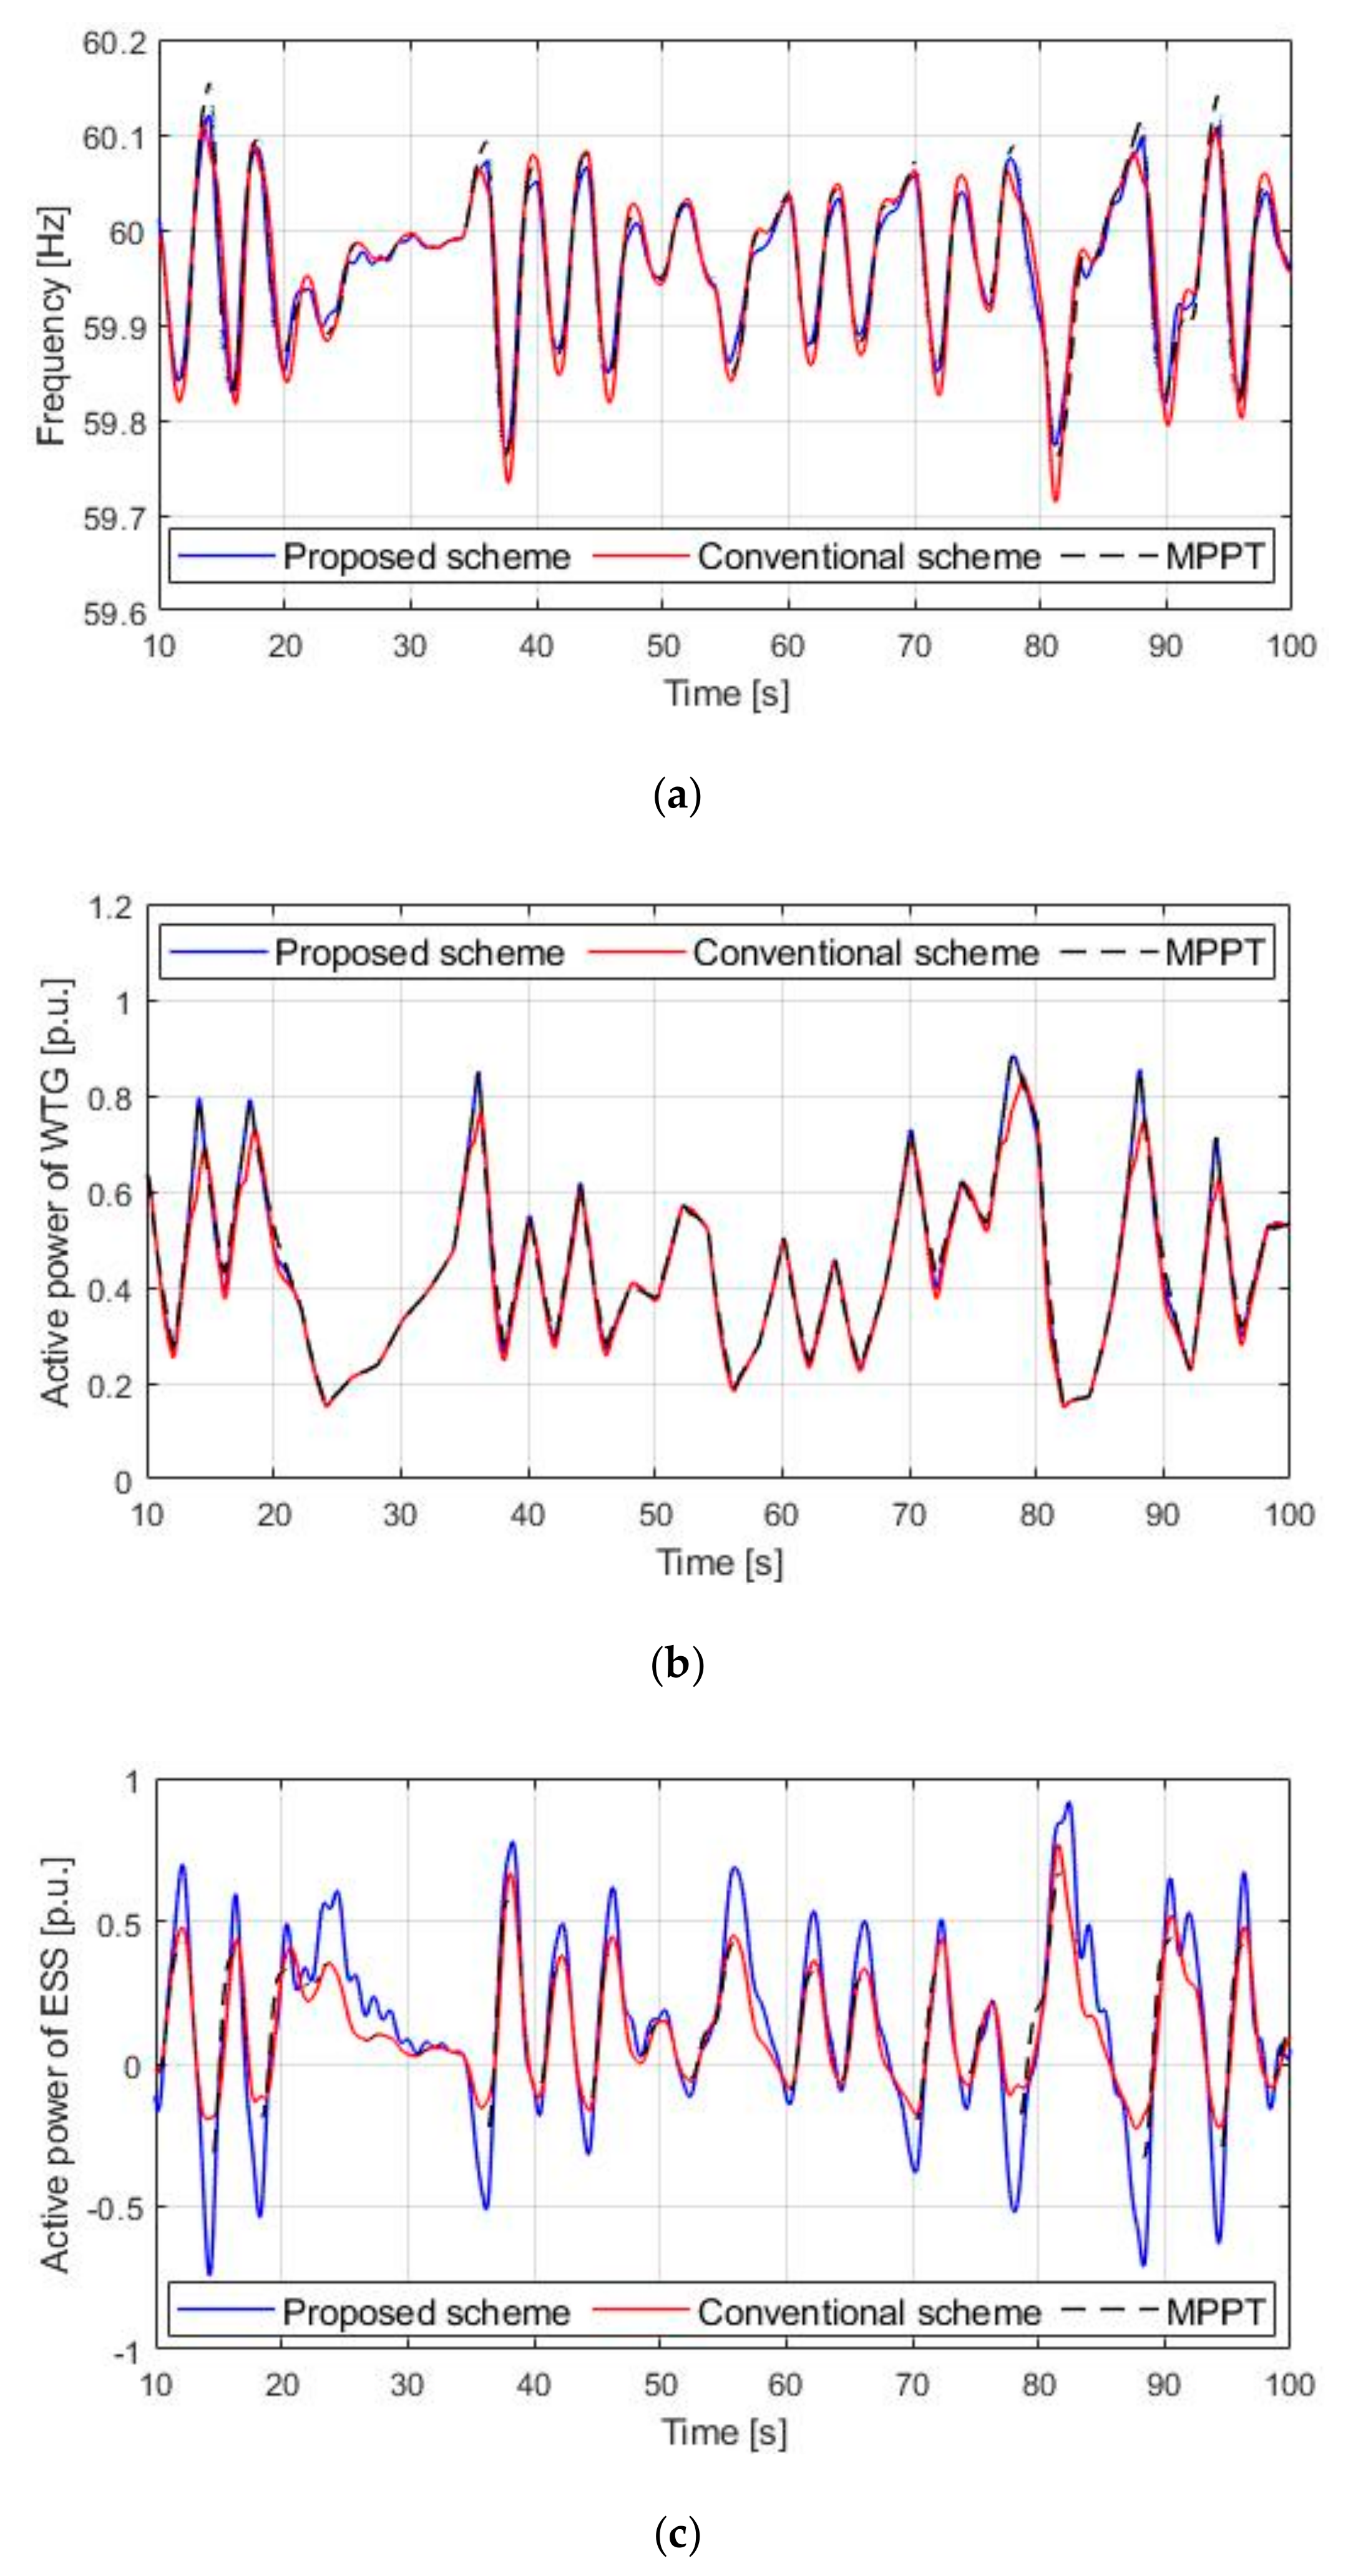
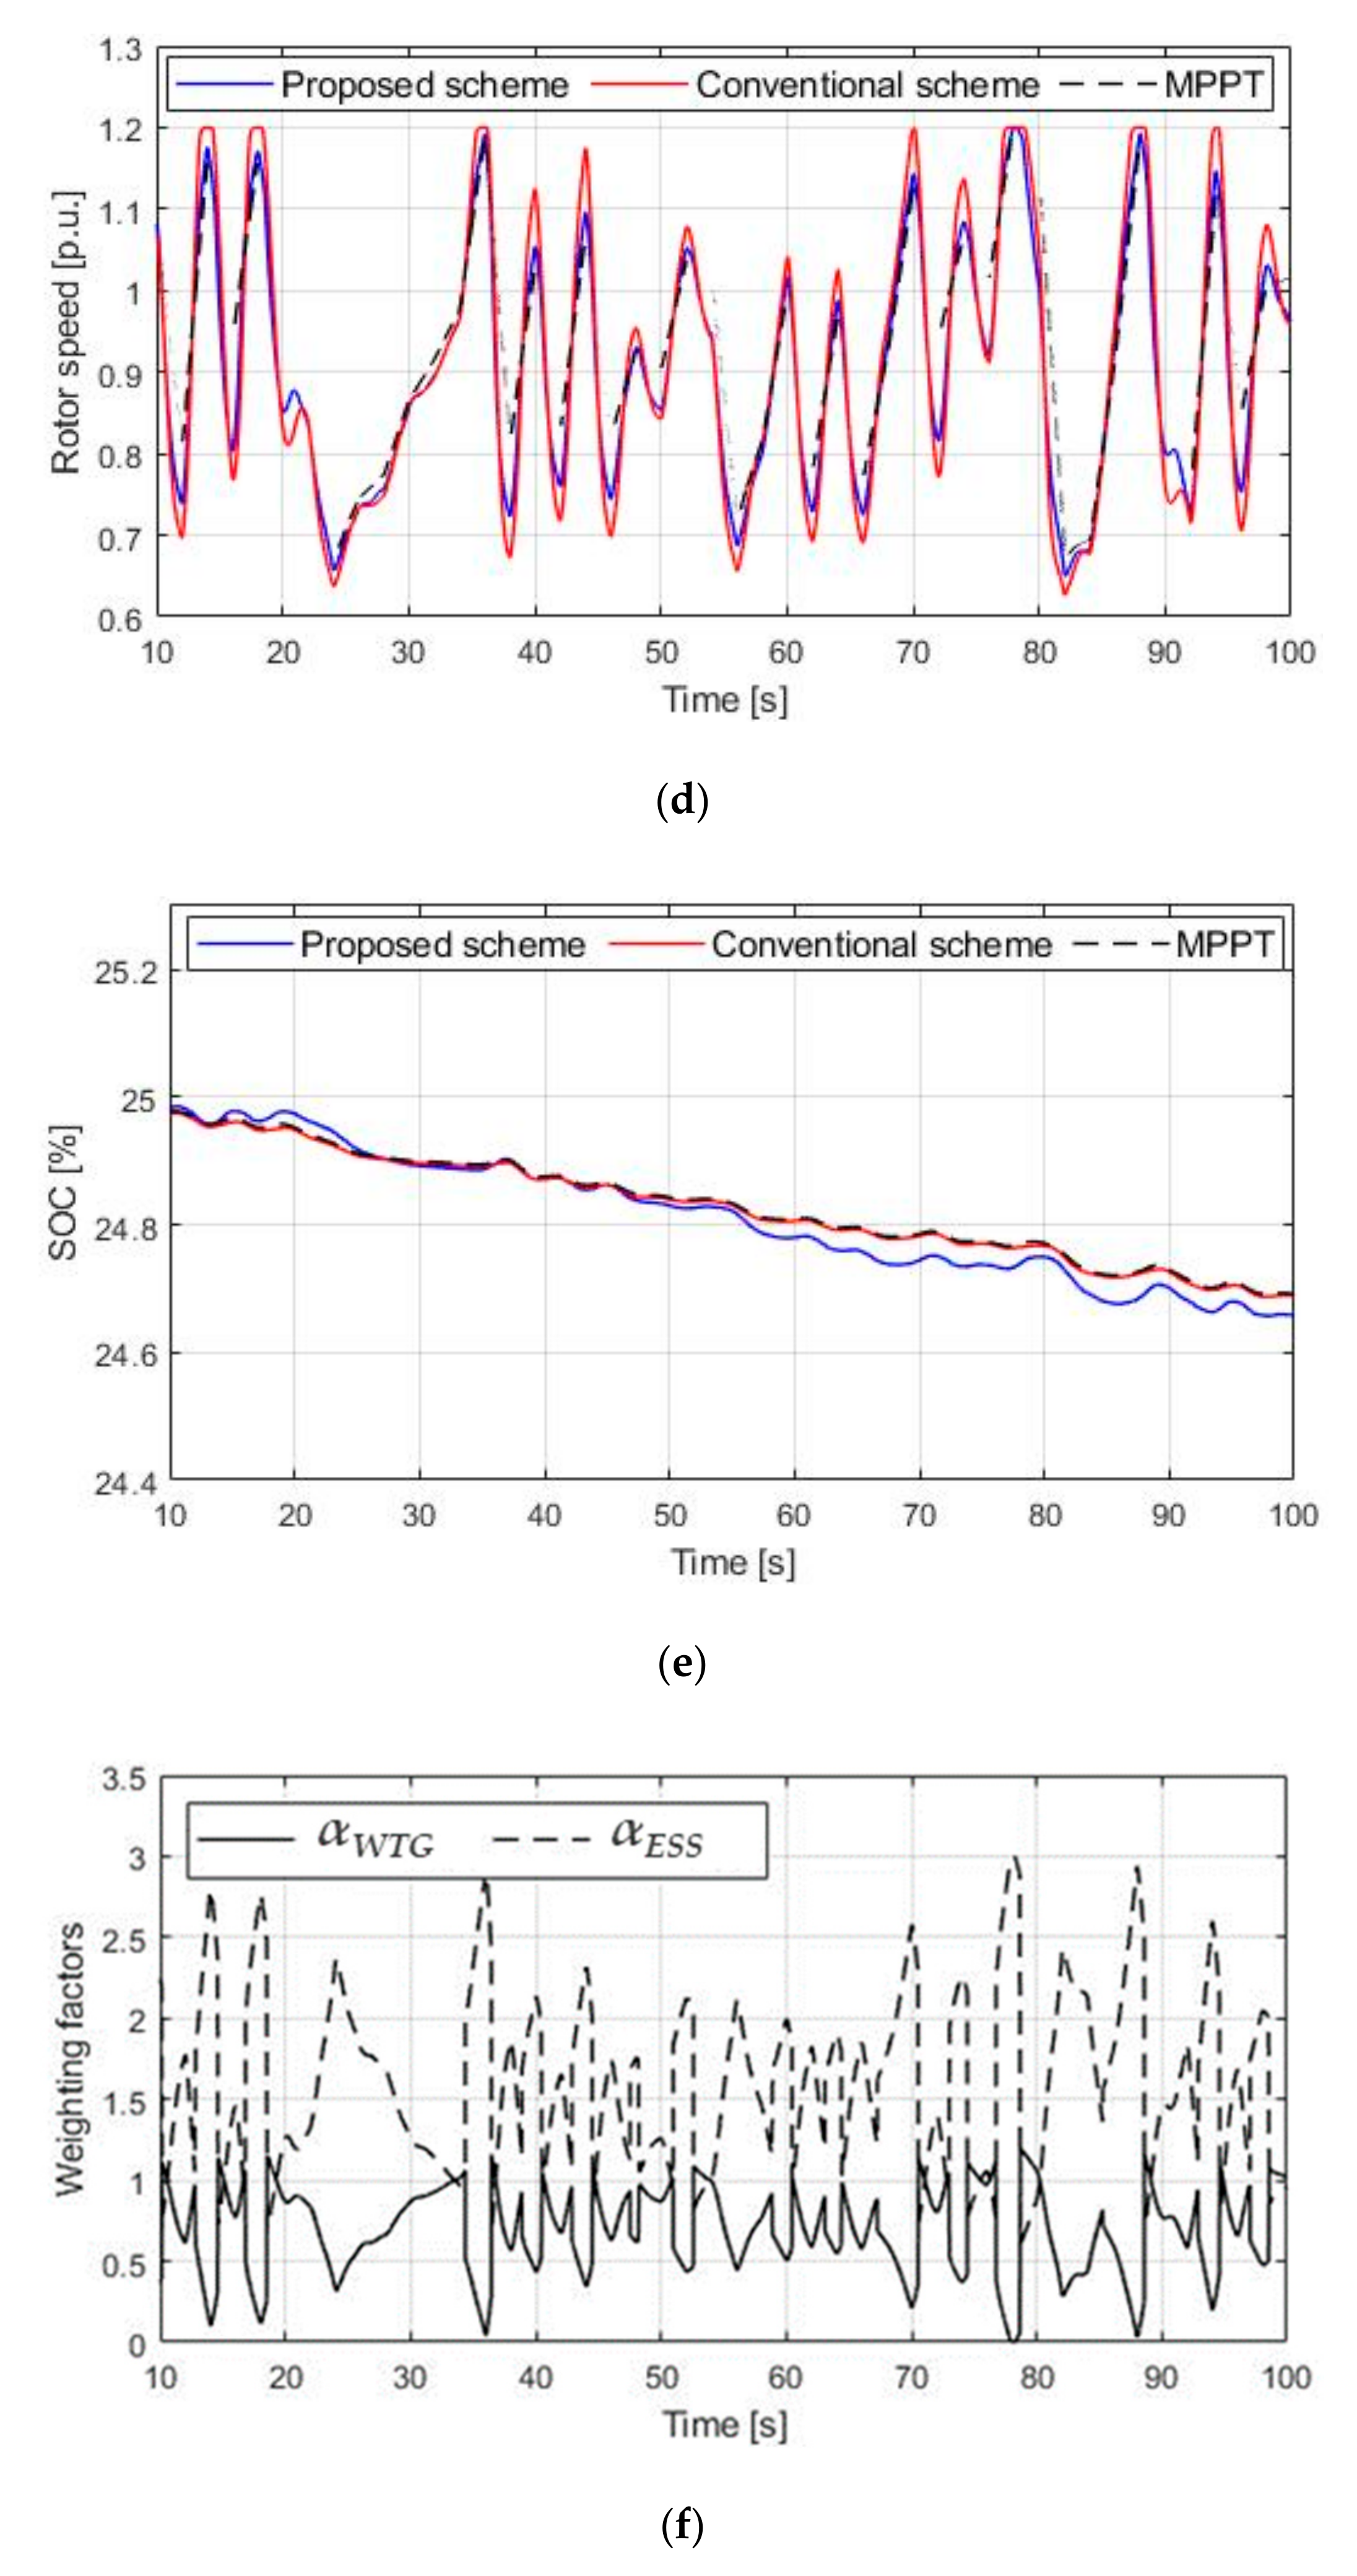
4.2. Case 2: Variable Wind Speed, 25% of Initial SOC, and Constant Loads
The results for case 2 are presented in
Figure 10. In this case, the initial SOC was set at 25% and was less than that of case 1. The peak-to-peak of the system frequency for the proposed scheme was 0.3556 Hz, which was less than in the MPPT by 0.0365 Hz, and less than in the conventional scheme by 0.0405 Hz. When the frequency deviation was smaller than zero, WTG and ESS increased their output powers. However, the results of the peak-to-peak of the system frequency for the proposed scheme was greater than in case 1. This was because the releasable energy of not only the ESS, but also the WTG, was smaller than in case 1. However, in situations where the energy was absorbed, the active power of the ESS was larger than that of case 1 (see
Figure 10c), since the initial SOC was set at a low value. Thus, the reduced amount of SOC for the proposed scheme was 0.3411% (see
Figure 10e), lower than that of the proposed scheme in case 1 by 0.1391%.
Figure 10f shows the weighting factors of the coordinated control, and because of the low SOC,
αWTG was determined for a high value in comparison to the results for case 1 when the frequency deviation was lower than zero. Thus, the WTG released more kinetic energy stored in the rotor; accordingly,
wr slightly decreased (see
Figure 10d). In addition, the determined
αESS was lower in comparison to the results in case 1. Hence, the released energy of the ESS decreased and the absorbed energy increased in comparison to the results in case 1.
4.3. Case 3: Variable Wind Speed and Low Wind Speed, 50% of Initial SOC, Constant Loads
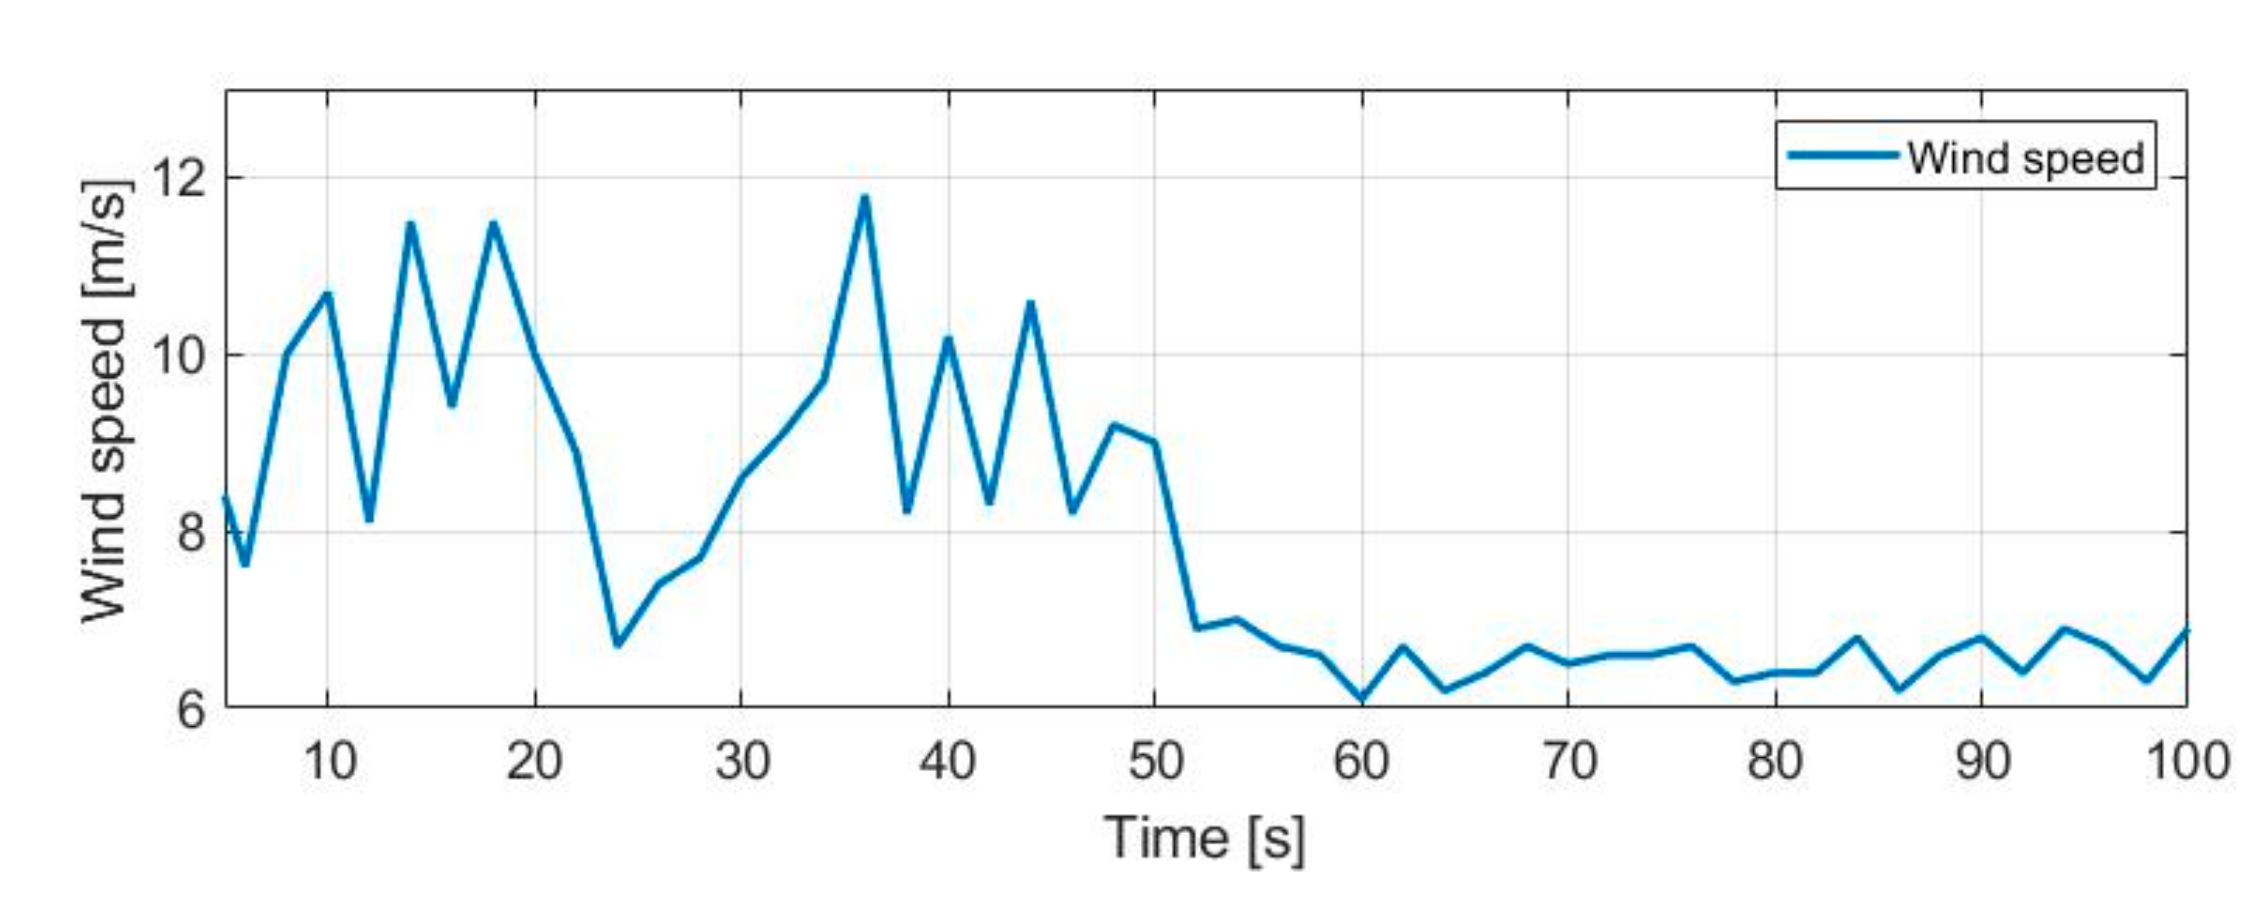
The performance of the coordinated control was also affected as the wind speed remained low, which meant that WTG had low stored kinetic energy to release when the system frequency was lower than the nominal frequency.
Figure 11 shows the wind speed variation profile for case 3, and in this profile, the wind speed was maintained at a low speed after 54 s.
Figure 12 shows the results for case 3. The peak-to-peak of the system frequency before 54 s for the MPPT, conventional scheme, and proposed scheme were 0.3930 Hz, 0.3770 Hz, and 0.3325 Hz, respectively. In addition, the peak-to-peak of the system frequency after 54 s for the MPPT, conventional scheme, and proposed scheme were 0.0282 Hz, 0.0285 Hz, and 0.0184 Hz, respectively. This was because the output power fluctuations of a WTG were reduced with the low wind speed, consequently resulting in temporary fluctuations in the system frequency from 50 s onwards, as shown in
Figure 12a. The amount of SOC for the proposed scheme was reduced by 0.6613%, which was larger than the results of the proposed scheme in case 1 by 0.1811%. In this case, the static load resulted in a deviation of the system frequency deviation after 54 s. However, if a larger disturbance were to occur in a power system, the system frequency would decrease because the WTG had no releasable kinetic energy. The proposed scheme could calculate the weighting factor of the ESS due to the shortage of the releasable energy that could be emitted from the wind turbine, thus preventing the large decrease in frequency in such a situation.
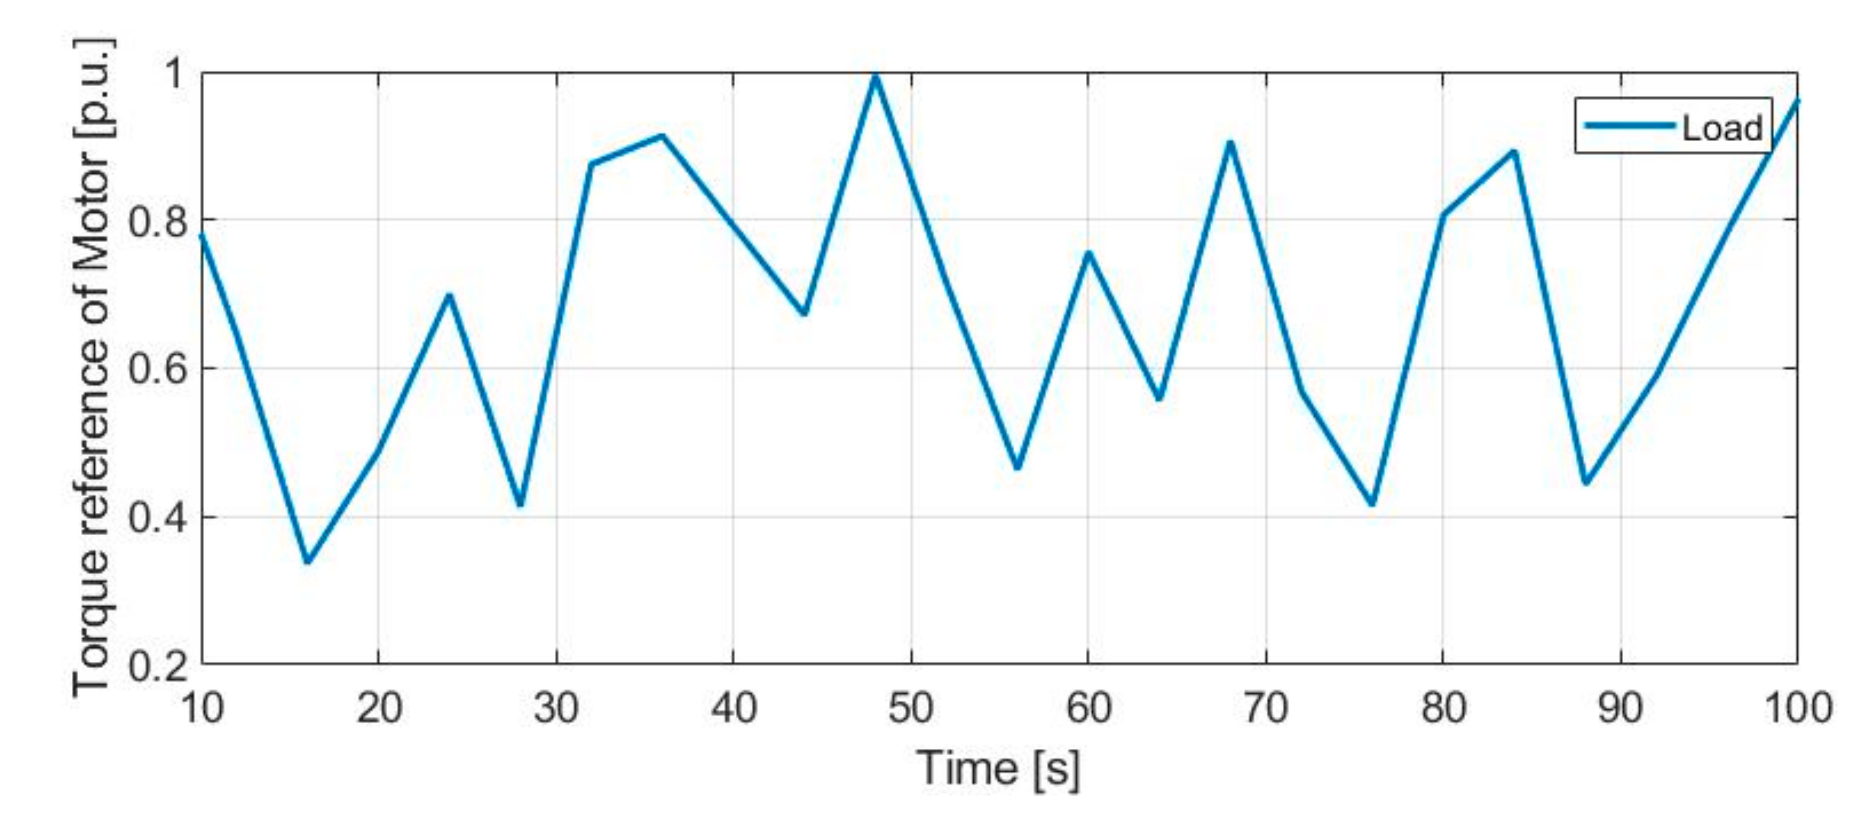
4.4. Case 4: Load Variation, Constant Wind Speed, and 50% of Initial SOC
The system frequency deviation was also based on the load variation.
Figure 13 shows the load variation profile for case 4. The load fluctuated between 2 MW and 5.5 MW, and the peak load occurred at 48 s for 5.5 MW. The load variation resulted in significant system frequency fluctuations. In this case, the coefficients
p and
q in the coordinated control were set at 0.8 and 3.4, respectively.
Figure 14 shows the results for case 4. In this case, the initial SOC was set at 50% and the wind speed was constant at 10 m/s. The peak-to-peak of the system frequency for the proposed scheme was 0.2841 Hz, less than that of the MPPT by 0.030 Hz, and smaller than in the conventional scheme by 0.087 Hz. This resulted in a higher peak-to-peak system frequency for the conventional scheme in comparison to the MPPT because the WTG excessively contributed to the frequency stabilization, as shown in
Figure 14b,d. In particular, the system frequency drastically decreased in the process of recovering the kinetic energy since the WTG significantly increased the output power to compensate for the load variation at 48.0 s. The proposed scheme prevented the excessive contribution of the WTG in the frequency stabilization because the weighting factor was accurately calculated based on the kinetic energy of the wind turbine; this is important since significant increases in wind turbine output due to frequency drops can have a negative impact on isolated microgrids with a high wind power penetration.
Figure 14e shows the SOC of the ESS. The reduced amount of SOC for the proposed scheme and conventional scheme were 0.4225% and 0.2731%, respectively. In the proposed scheme, the WTG had a lower contribution to frequency stabilization than in the conventional scheme. Thus, the contribution of the ESS was increased to perform the frequency stabilization, as shown in
Figure 14f. As a result, the frequency stabilization control was performed stably by preventing an excessive contribution toward the frequency stabilization by the WTG.
In all four cases, the results show that the releasable and absorbable energy of a WTG and the ESS was shared well in the proposed scheme and this enabled it to successfully control the frequency stabilization. Hence, the accurate determination of the contribution to the frequency stabilization of a WTG prevented its excessive contribution, and thus, in cases of high wind power penetration levels, the system frequency deviation successfully decreased in the proposed scheme.
5. Conclusions
The coordinated frequency stabilization of a WTG and ESS for increasing utilized energy to improve the frequency stabilization were investigated. The ability of a WTG and ESS to support the frequency stabilization support was dependent on how the stored kinetic energy of the WTG and ESS was used. The proposed scheme consistently calculated the releasable and absorbable energy of the WTG and ESS and determined weighting factors related to the energy ratios. In each frequency support control loop of the WTG and ESS, the determined weighting factors produced an additional active power reference. Therefore, the active power references for supporting frequency stabilization were based on the ability for the utilized energy of WTG and ESS.
The simulation results showed that the proposed coordinated control scheme successfully improved the system frequency and prevented the excessive contribution of a WTG in power systems with a high wind power penetration. Furthermore, the proposed scheme ensured minimized resource losses of the participating frequency support as they had low releasable or absorbable energy capacities.
The advantages of the proposed coordinated scheme are that it can ensure adequate utilized stored energy. Therefore, the proposed scheme may provide potential solutions to ancillary services, especially in isolated microgrids, by increasing the reserve power in an electric power grid.
Author Contributions
M.K., G.Y., and J.B. mainly proposed the coordinated scheme. M.K., G.Y., S.H., J.K. and J.B. performed the simulation tests and analyzed the results. J.P. and J.K. contributed the design for the high-fidelity battery model and revised the original scheme. All authors contributed toward writing the paper.
Funding
This research was funded by Korea Institute of Energy Technology Evaluation and Planning (KETEP) and Ministry of Trade, Industry & Energy (MOTIE), No. 20182410105280.
Acknowledgments
This work was supported by the KETEP and the MOTIE of the Republic of Korea. (no. 20182410105280).
Conflicts of Interest
The authors declare no conflict of interest.
Appendix
The detailed parameters of an asynchronous were used as introduced in Ziping et al. [
15]. The capacity of the asynchronous motor was 4 MW. The stator resistance and inductance of the motor were set to 0.02 p.u. and 0.04 p.u., respectively. The rotor resistance and inductance of the motor were set to 0.02 p.u. and 0.04 p.u., respectively. The mutual inductance and inertia constant were set to 1.36 p.u. and 0.1 p.u., respectively.
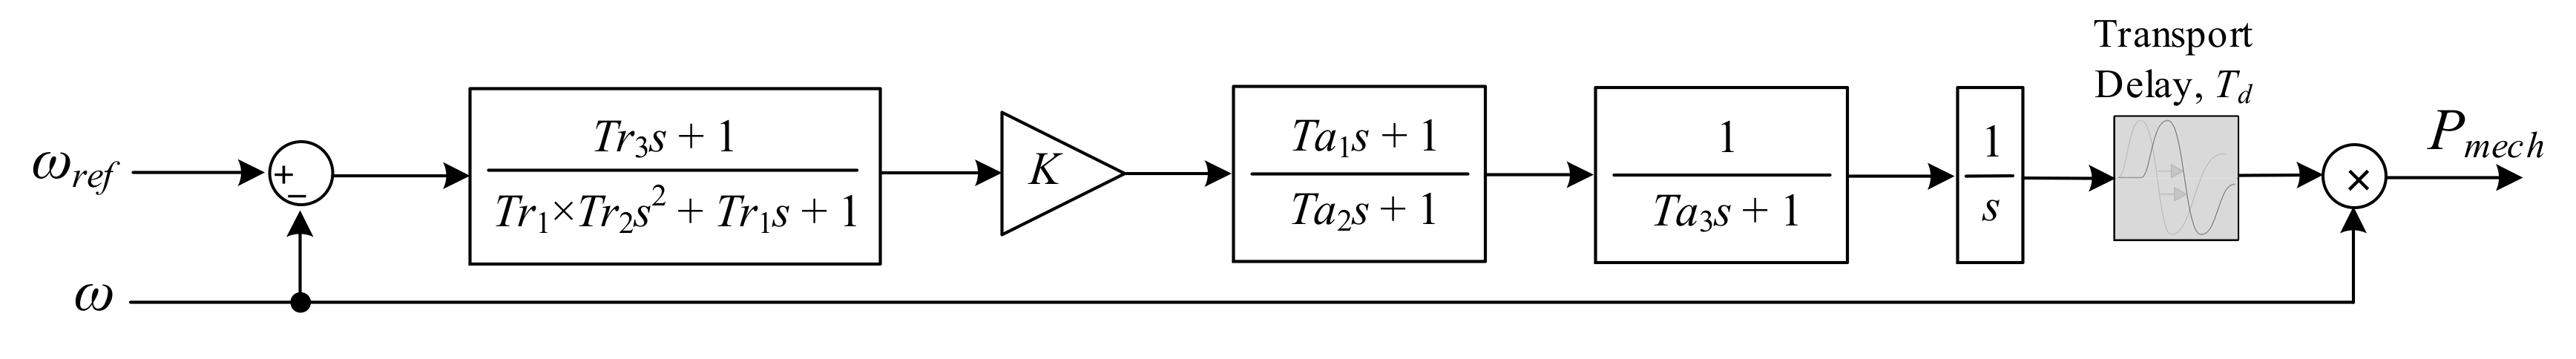
Figure A1 shows the typical governor and diesel engine block diagram. In this Figure,
Tr1,
Tr2,
Tr3,
K,
Ta1,
Ta2,
Ta3, and
Td were set to 0.01, 0.02, 0.2, 40, 0.25, 0.009, 0.0384, and 0.024, respectively. The inertia time constant of a diesel generator was set to 5 s.
Figure A1.
A governor and diesel engine block diagram.
Figure A1.
A governor and diesel engine block diagram.
References
- Machowski, J.; Bialek, J.W.; Bumby, J.R. Frequency Stability and Control; John Wiley & Sons: Hoboken, NJ, USA, 2008. [Google Scholar]
- Eto, J.H. Use of Frequency Response Metrics to Assess the Planning and Operating Requirements for Reliable Integration of Variable Renewable Generation; Lawrence Berkeley National Laboratory: Berkeley, CA, USA, 2011. [Google Scholar]
- Fagan, E.; Grimes, S.; McArdle, J.; Smith, P.; Stronge, M. Grid Code Provisions for Wind Generators in Ireland. In Proceedings of the IEEE PES General Meeting, San Francisco, CA, USA, 12–16 June 2005; pp. 1241–1247. [Google Scholar]
- EirGrid. Controllable Wind Farm Power Station Grid Code Provisions; Grid Code Version 3.1; EirGrid: Dublin, Ireland, 2008. [Google Scholar]
- Muljadi, E.; Butterfield, C.P. Pitch-Controlled variable speed wind turbine generation. IEEE Trans. Ind. Appl. 2001, 37, 240–246. [Google Scholar] [CrossRef]
- Senjyu, T.; Sakamoto, R.; Urasaki, N.; Funabashi, T.; Fujita, H.; Sekine, H. Output power leveling of wind turbine generator for all operating regions by pitch angle control. IEEE Trans. Energy Convers. 2006, 21, 467–475. [Google Scholar] [CrossRef]
- Haixin, W.; Junyou, Y.; Zhe, C.; Weichun, G.; Shiyan, H.; Yiming, M.; Yunlu, L.; Guanfeng, Z.; Lijian, Y. Gain scheduled torque compensation of PMSG-based wind turbine for frequency regulation in an isolated grid. Energies 2018, 11, 1623–1642. [Google Scholar]
- Lin, J.; Sun, Y.Z.; Song, Y.H.; Gao, W.Z.; Sørensen, P. Wind power fluctuation smoothing controller based on risk assessment of grid frequency deviation in an isolated system. IEEE Trans. Sustain. Energy 2013, 4, 379–392. [Google Scholar] [CrossRef]
- Margaris, I.D.; Papathanassiou, S.A.; Hatziargyriou, N.D.; Hansen, A.D.; Sørensen, P. Frequency control in autonomous power systems with high wind power penetration. IEEE Trans. Sustain. Energy 2012, 3, 189–199. [Google Scholar] [CrossRef]
- Tingting, C.; Sutong, L.; Gangui, Y.; Hongbo, L. Analysis of doubly fed induction generators participating in continuous frequency regulation with different wind speeds considering regulation power constraints. Energies 2019, 12, 635–655. [Google Scholar]
- Morren, J.; Pierik, J.; de Haan, S.W.H. Intertial response of variable speed wind turbines. Elect. Power Syst. Res. 2006, 76, 980–987. [Google Scholar] [CrossRef]
- Ullah, N.R.; Thiringer, T.; Karlsson, D. Temporary primary frequency control support by variable speed wind turbine—Potential and applications. IEEE Trans. Power Syst. 2008, 23, 601–612. [Google Scholar] [CrossRef]
- Kim, Y.; Kang, M.; Muljadi, E.; Park, J.-W.; Kang, Y.C. Power smoothing of a variable-speed wind turbine generator in association with the rotor-speed-dependent gain. IEEE. Trans. Sustain. Energy 2017, 8, 990–999. [Google Scholar] [CrossRef]
- Chunghun, K.; Muljadi, E.; Chungchoo, C. Coordinated control of wind turbine and energy storage system for reducing wind power fluctuation. Energies 2018, 11, 52–70. [Google Scholar]
- Ziping, W.; Wenzhong, G.; Huaguang, Z.; Shijie, Y.; Xiao, W. Coordinated control strategy of battery energy storage system and PMSG-WTG to enhance system frequency regulation capability. IEEE Trans. Sustain. Energy 2017, 8, 1330–1343. [Google Scholar]
- Akie, U.; Tomonobu, S.; Atsushi, Y.; Toshihisa, F. Frequency Control by Coordination Control of WTG and Battery Using Load Estimation. In Proceedings of the 2009 International Conference on Power Electronics and Drive Systems, Taipei, Taiwan, 2–5 November 2010. [Google Scholar]
- Siegfried, H. Grid Integration of Wind Energy Conversion System; John Wiley & Sons: Hoboken, NJ, USA, 1998. [Google Scholar]
- Vainio, O.; Ovaska, S.J. Digital filtering for robust 50/60 Hz zero-crossing detectors. IEEE Trans. Instrum. Meas. 1996, 45, 426–430. [Google Scholar] [CrossRef]
Figure 1.
The PMSG model. (a) Typical configuration of a PMSG; Vr, Ir: voltage and current in the rotor circuit; Vt, It: voltage and current at the terminal; Vr,ref, Vt,ref: reference RSC and GSC voltage; VDC: DC-link voltage; Vg, Ig: voltage and current at the point of common coupling (PCC); ωr: rotor speed; β: pitch angle. (b) Operational characteristics of a PMSG. (c) Operational characteristics of a frequency stabilization scheme.
Figure 2.
General equivalent circuit model (two R-C branches).
Figure 2.
General equivalent circuit model (two R-C branches).
Figure 3.
Pulse discharge in 5% increments of the SOC. (a) Experimental data of open circuit voltage. (b) Experimental data of discharged current.
Figure 3.
Pulse discharge in 5% increments of the SOC. (a) Experimental data of open circuit voltage. (b) Experimental data of discharged current.
Figure 4.
One pulse from the discharge test.
Figure 4.
One pulse from the discharge test.
Figure 5.
Flowchart for the coordinated frequency stabilization between a WTG and ESS.
Figure 5.
Flowchart for the coordinated frequency stabilization between a WTG and ESS.
Figure 6.
Operational characteristics of the proposed coordination control scheme. (a) Active power control of a WTG. (b) Active power control of an ESS.
Figure 6.
Operational characteristics of the proposed coordination control scheme. (a) Active power control of a WTG. (b) Active power control of an ESS.
Figure 7.
A single-line-diagram of the isolated microgrid model.
Figure 7.
A single-line-diagram of the isolated microgrid model.
Figure 8.
Wind speed (m/s) (variation profile for case 1 and case 2.
Figure 8.
Wind speed (m/s) (variation profile for case 1 and case 2.
Figure 9.
Simulation results for case 1: (a) system frequencies, (b) active powers of the WTG, (c) active powers of the ESS, (d) rotor speeds of the WTG, (e) SOCs of the ESS, and (f) weighting factors of the coordinated control.
Figure 9.
Simulation results for case 1: (a) system frequencies, (b) active powers of the WTG, (c) active powers of the ESS, (d) rotor speeds of the WTG, (e) SOCs of the ESS, and (f) weighting factors of the coordinated control.
Figure 10.
Simulation results for case 2: (a) system frequencies, (b) active powers of the WTG, (c) active powers of the ESS, (d) rotor speeds of the WTG, (e) SOCs of the ESS, and (f) weighting factors of the coordinated control.
Figure 10.
Simulation results for case 2: (a) system frequencies, (b) active powers of the WTG, (c) active powers of the ESS, (d) rotor speeds of the WTG, (e) SOCs of the ESS, and (f) weighting factors of the coordinated control.
Figure 11.
Wind speed (m/s) variation profile for Case 3.
Figure 11.
Wind speed (m/s) variation profile for Case 3.
Figure 12.
Simulation results for case 3: (a) system frequencies, (b) active powers of the WTG, (c) active powers of the ESS, (d) rotor speeds of the WTG, (e) SOCs of the ESS, and (f) weighting factors of the coordinated control.
Figure 12.
Simulation results for case 3: (a) system frequencies, (b) active powers of the WTG, (c) active powers of the ESS, (d) rotor speeds of the WTG, (e) SOCs of the ESS, and (f) weighting factors of the coordinated control.
Figure 13.
Load variation (p.u.) profile for Case 4.
Figure 13.
Load variation (p.u.) profile for Case 4.
Figure 14.
Simulation results for case 4: (a) system frequencies, (b) active powers of the WTG, (c) active powers of the ESS, (d) rotor speeds of the WTG, (e) SOCs of the ESS, and (f) weighting factors of the coordinated control.
Figure 14.
Simulation results for case 4: (a) system frequencies, (b) active powers of the WTG, (c) active powers of the ESS, (d) rotor speeds of the WTG, (e) SOCs of the ESS, and (f) weighting factors of the coordinated control.
Table 1.
Initial values of the microgrid consistence.
Table 1.
Initial values of the microgrid consistence.
| BESS | Value | WTG | Value |
|---|
| Capacity of a single cell | 10 Ah | Rated generator power | 2.2 MVA |
| Number of cells in series | 500 EA | Rated turbine power | 2.0 MW |
| Number of stacks in parallel | 80 EA | Rated rotor speed | 1.2 p.u. |
| Rated active power | 0.5 MW | Minimum rotor speed | 0.6 p.u. |
| Diesel | Value | Rated wind speed | 12.0 m∙s−1 |
| Rated generator power | 5 MVA | Cut-in speed | 4.5 m∙s−1 |
| Line-to-line voltage | 690 Vrms | Generator inertia | 35000 kg∙m2 |
Table 2.
Organization of the case studies.
Table 2.
Organization of the case studies.
| Cases | Wind Speeds | Initial SOCs | Loads |
|---|
| Case 1 | Variable | 50% | Constant |
| Case 2 | Variable | 25% | Constant |
| Case 3 | Variable and low | 50% | Constant |
| Case 4 | Constant | 50% | Variable |
© 2019 by the authors. Licensee MDPI, Basel, Switzerland. This article is an open access article distributed under the terms and conditions of the Creative Commons Attribution (CC BY) license (http://creativecommons.org/licenses/by/4.0/).


