Downlink Power Allocation Strategy for Next-Generation Underwater Acoustic Communications Networks


Abstract
:1. Introduction
1.1. Differences in System Methodologies in the Literature
1.2. Main Contributions
- The DL PA strategy is employed using an orthogonal frequency-division multiple access (OFDMA) technique for UAC networks.
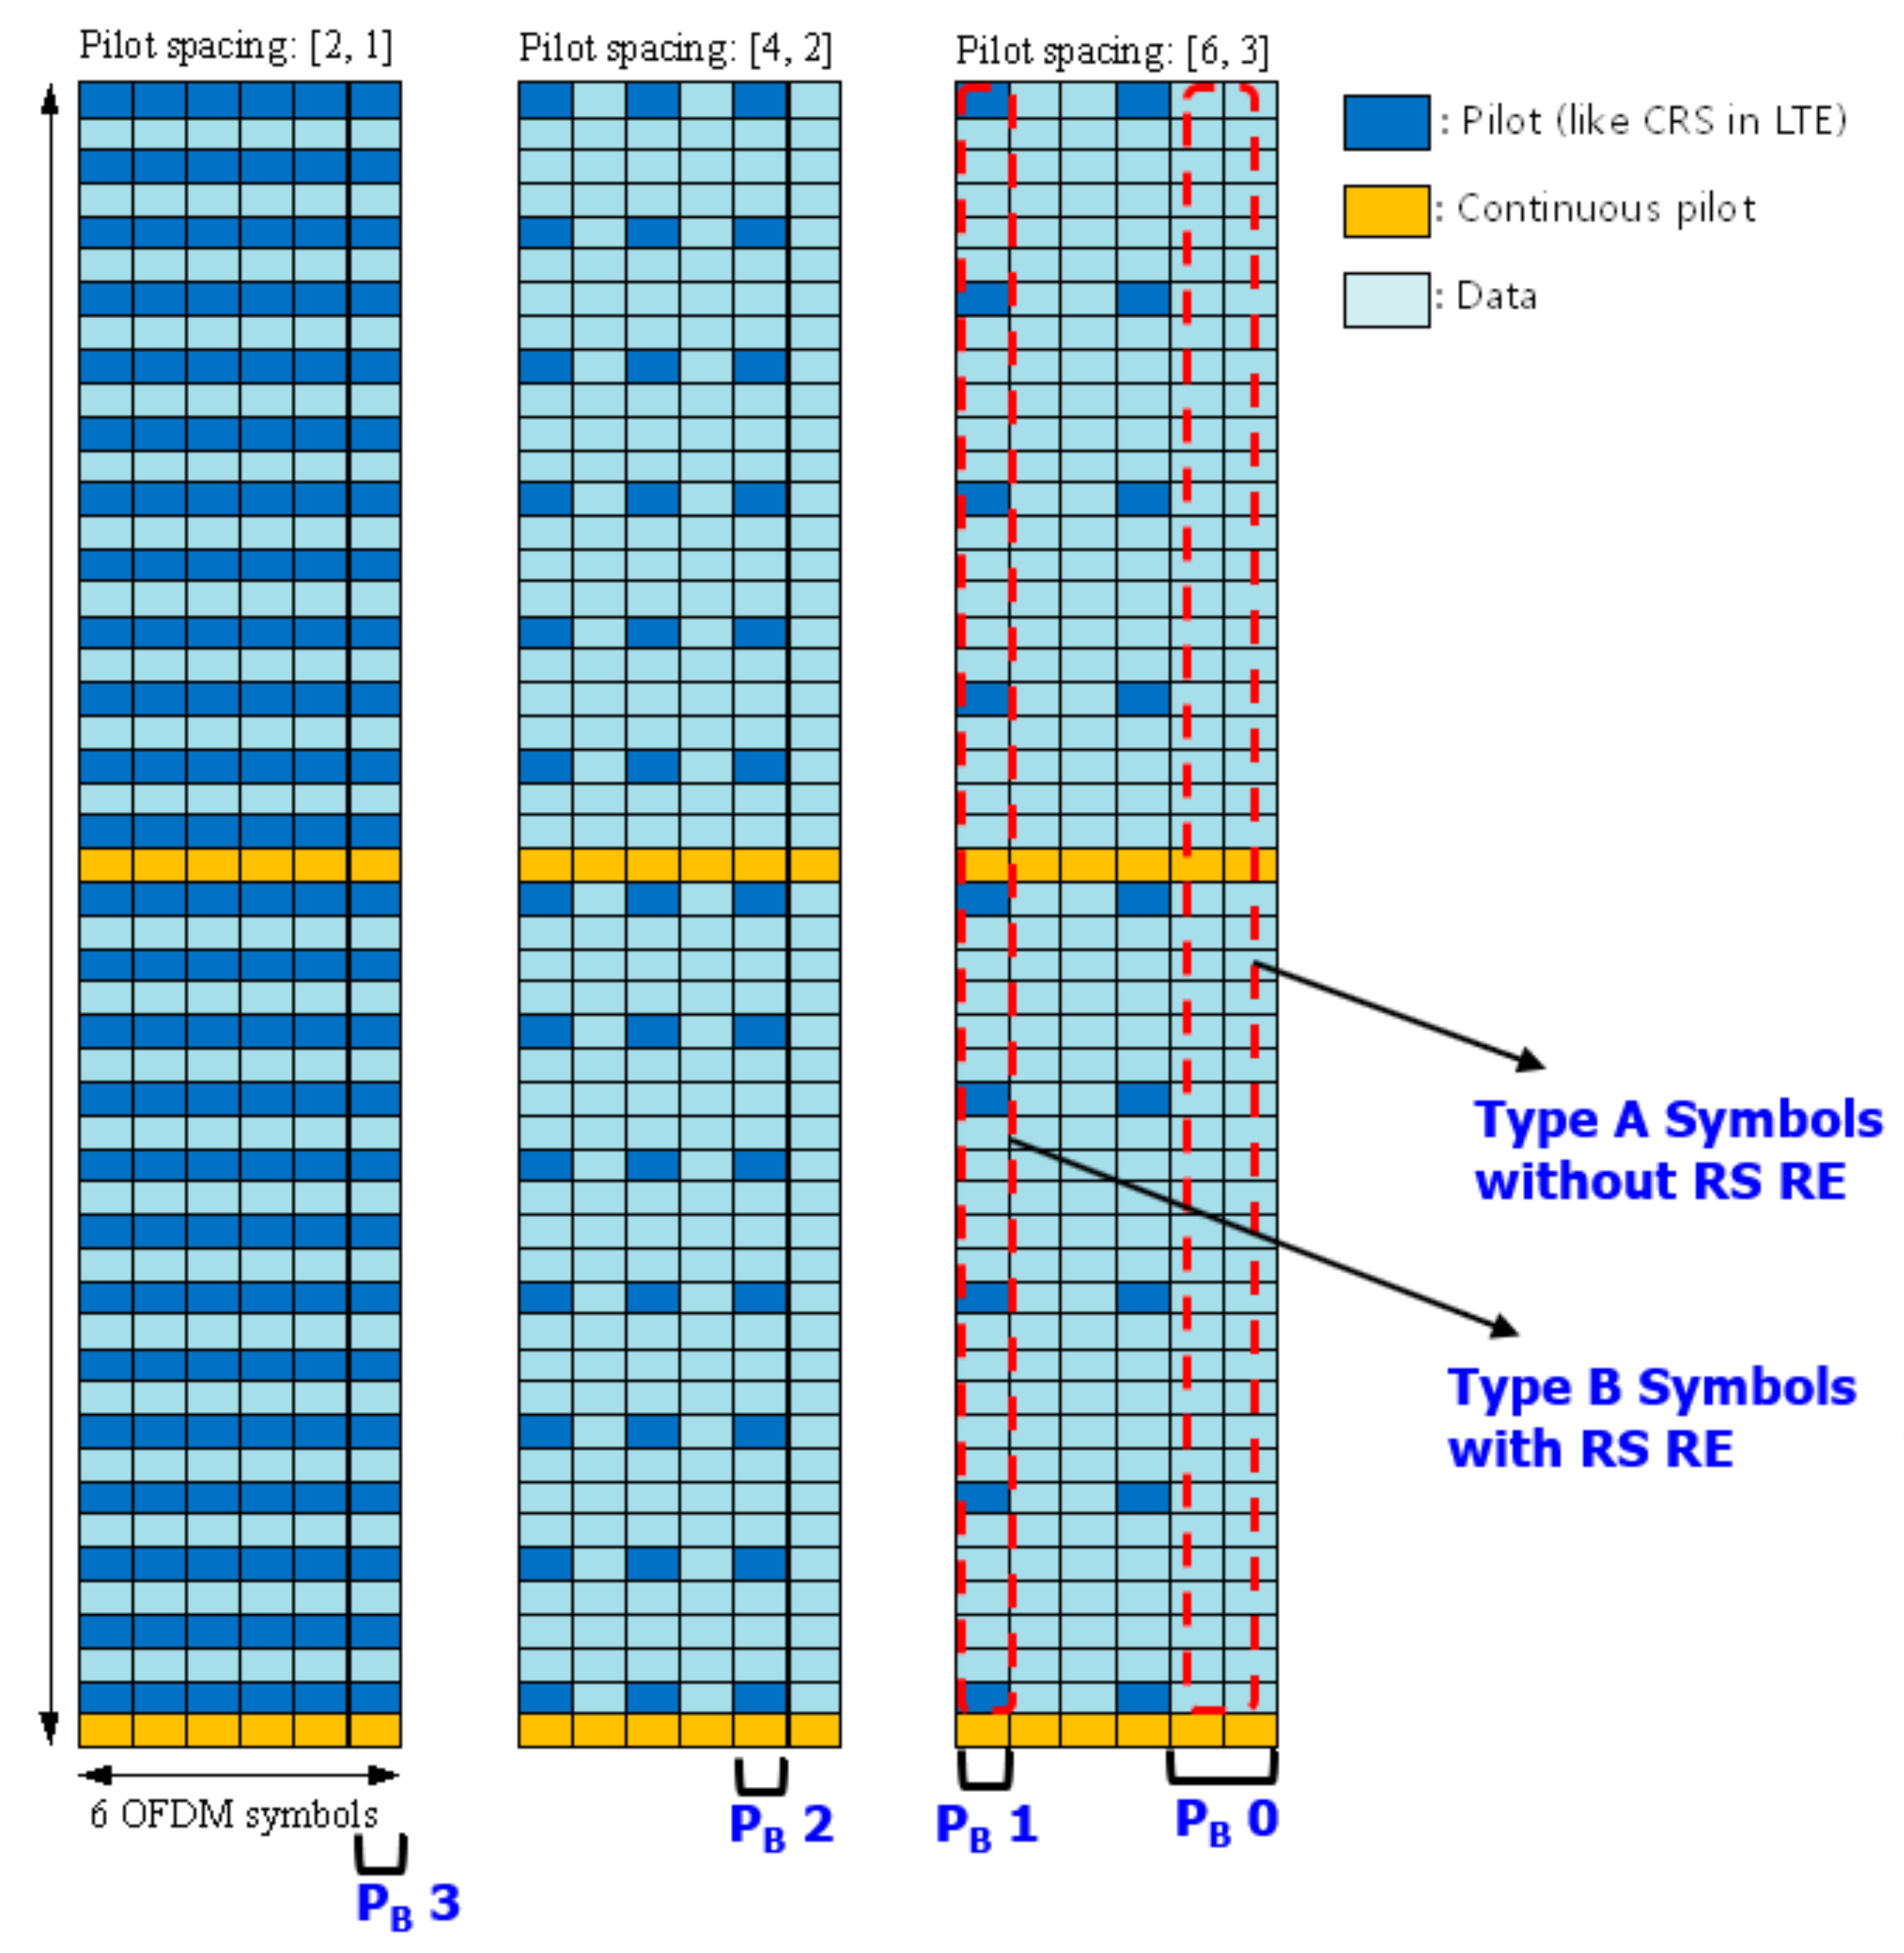
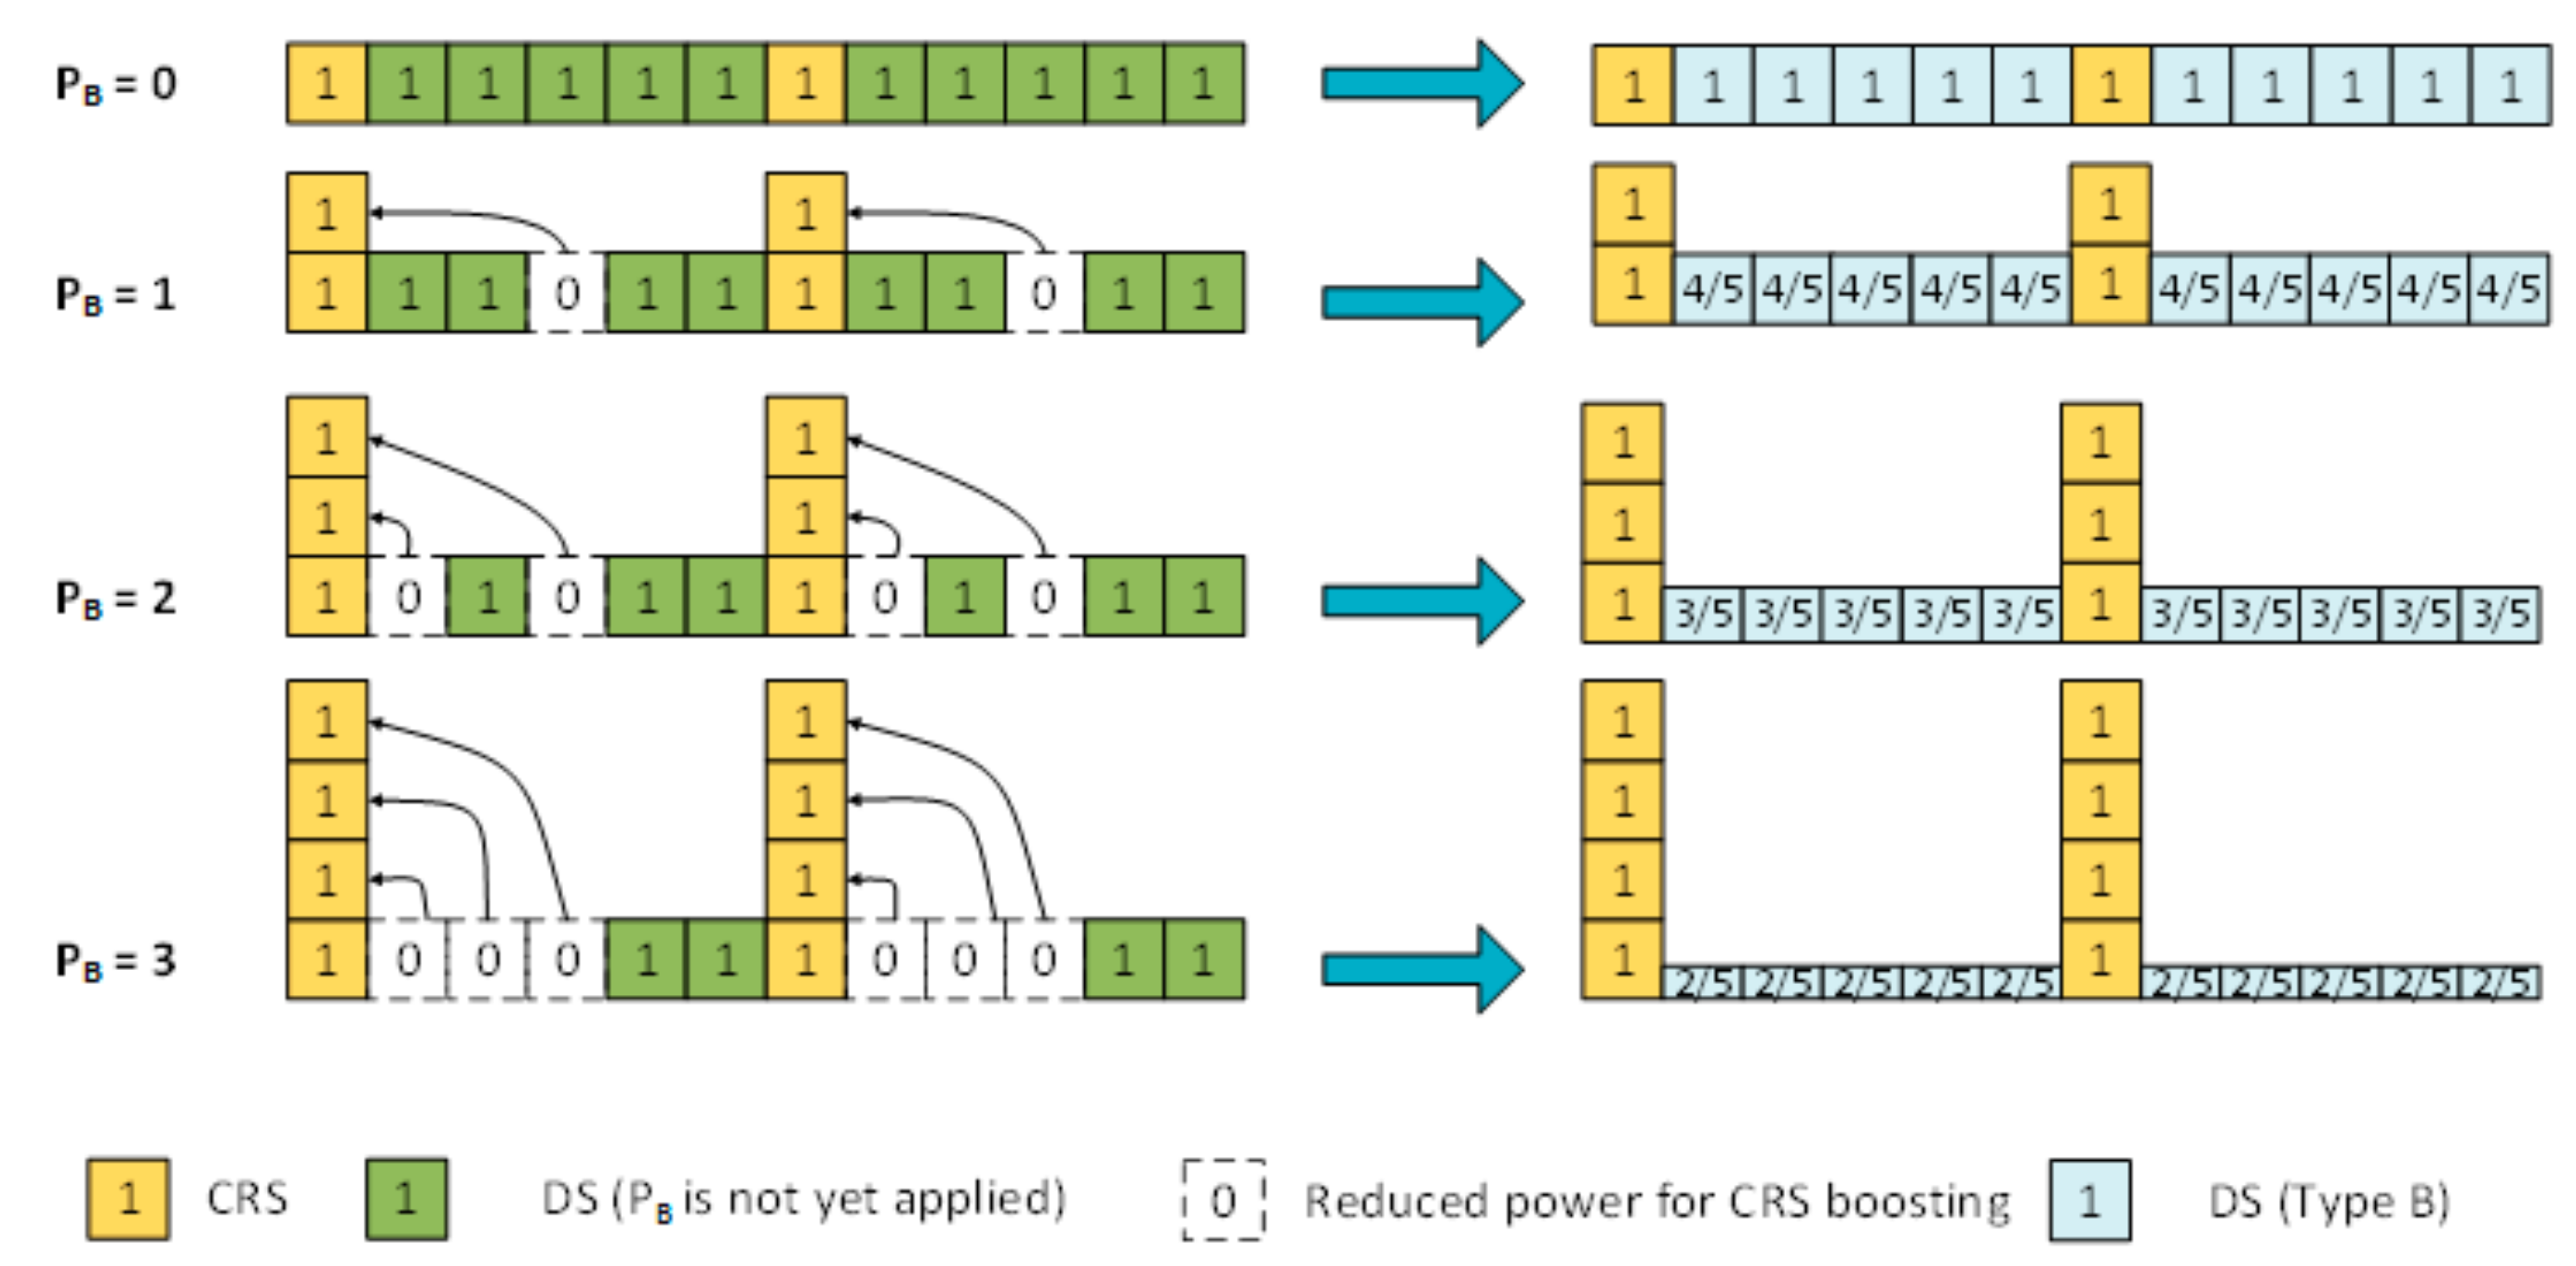
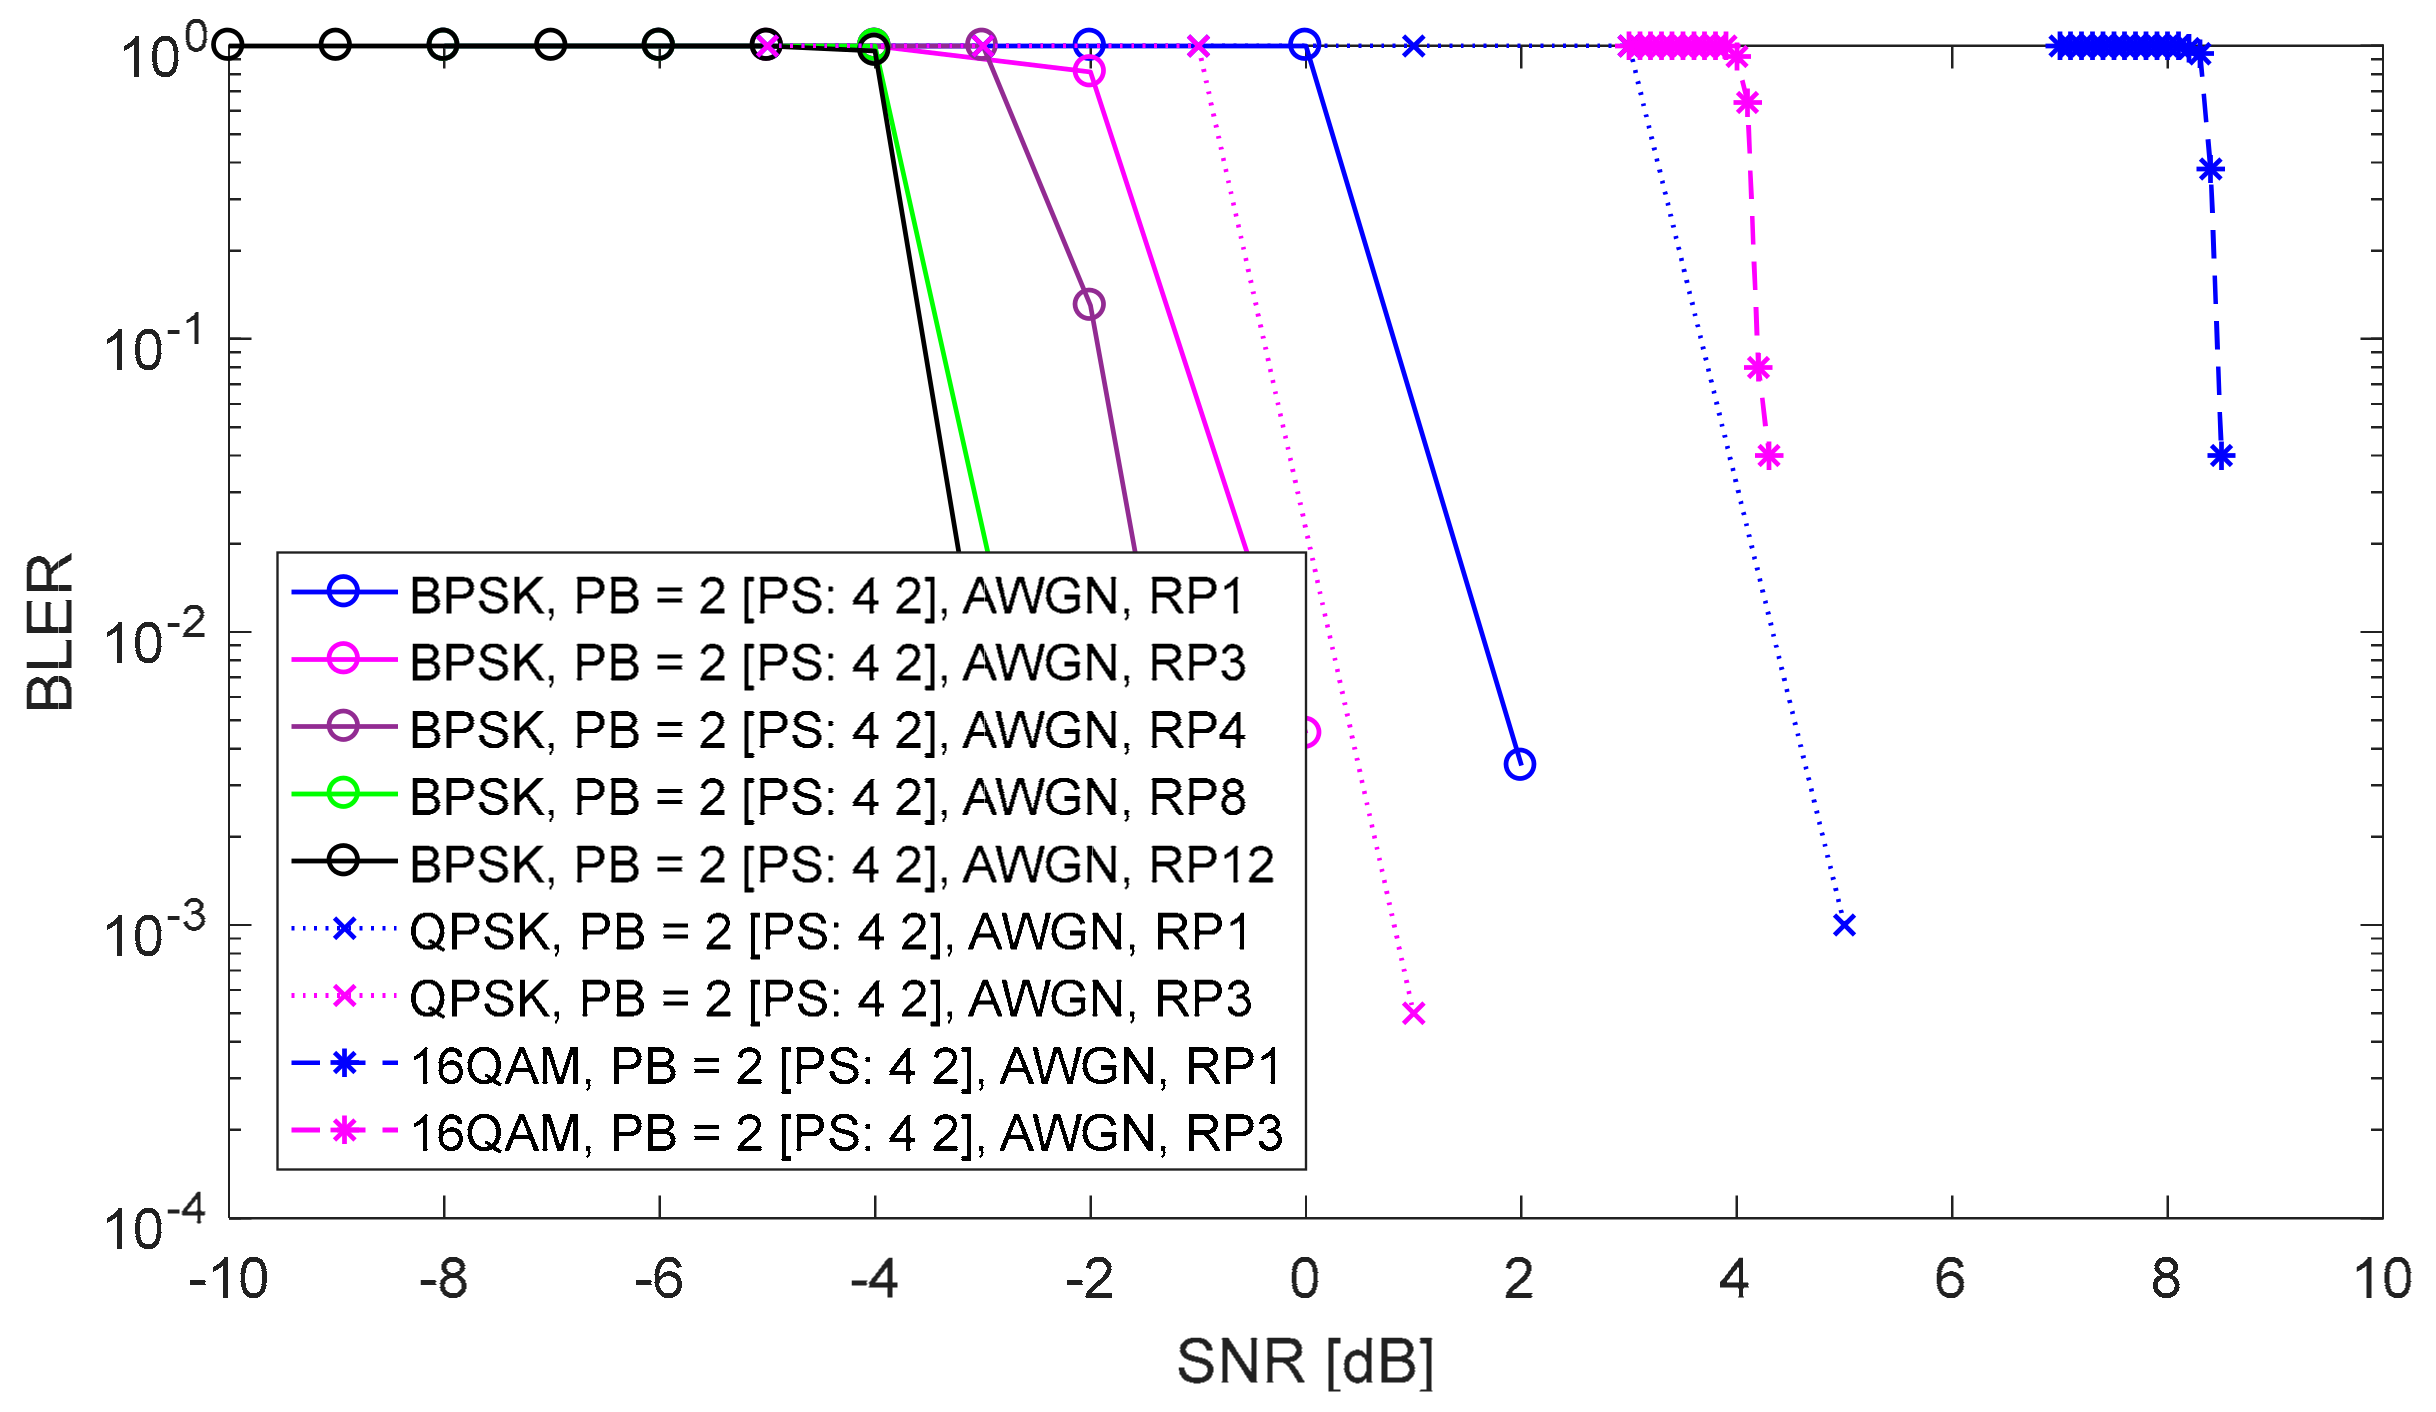
- The power offset approach is presented using three kinds of pilot spacing and by applying the power boosting (PB) concept on OFDM symbols for a UAC network.
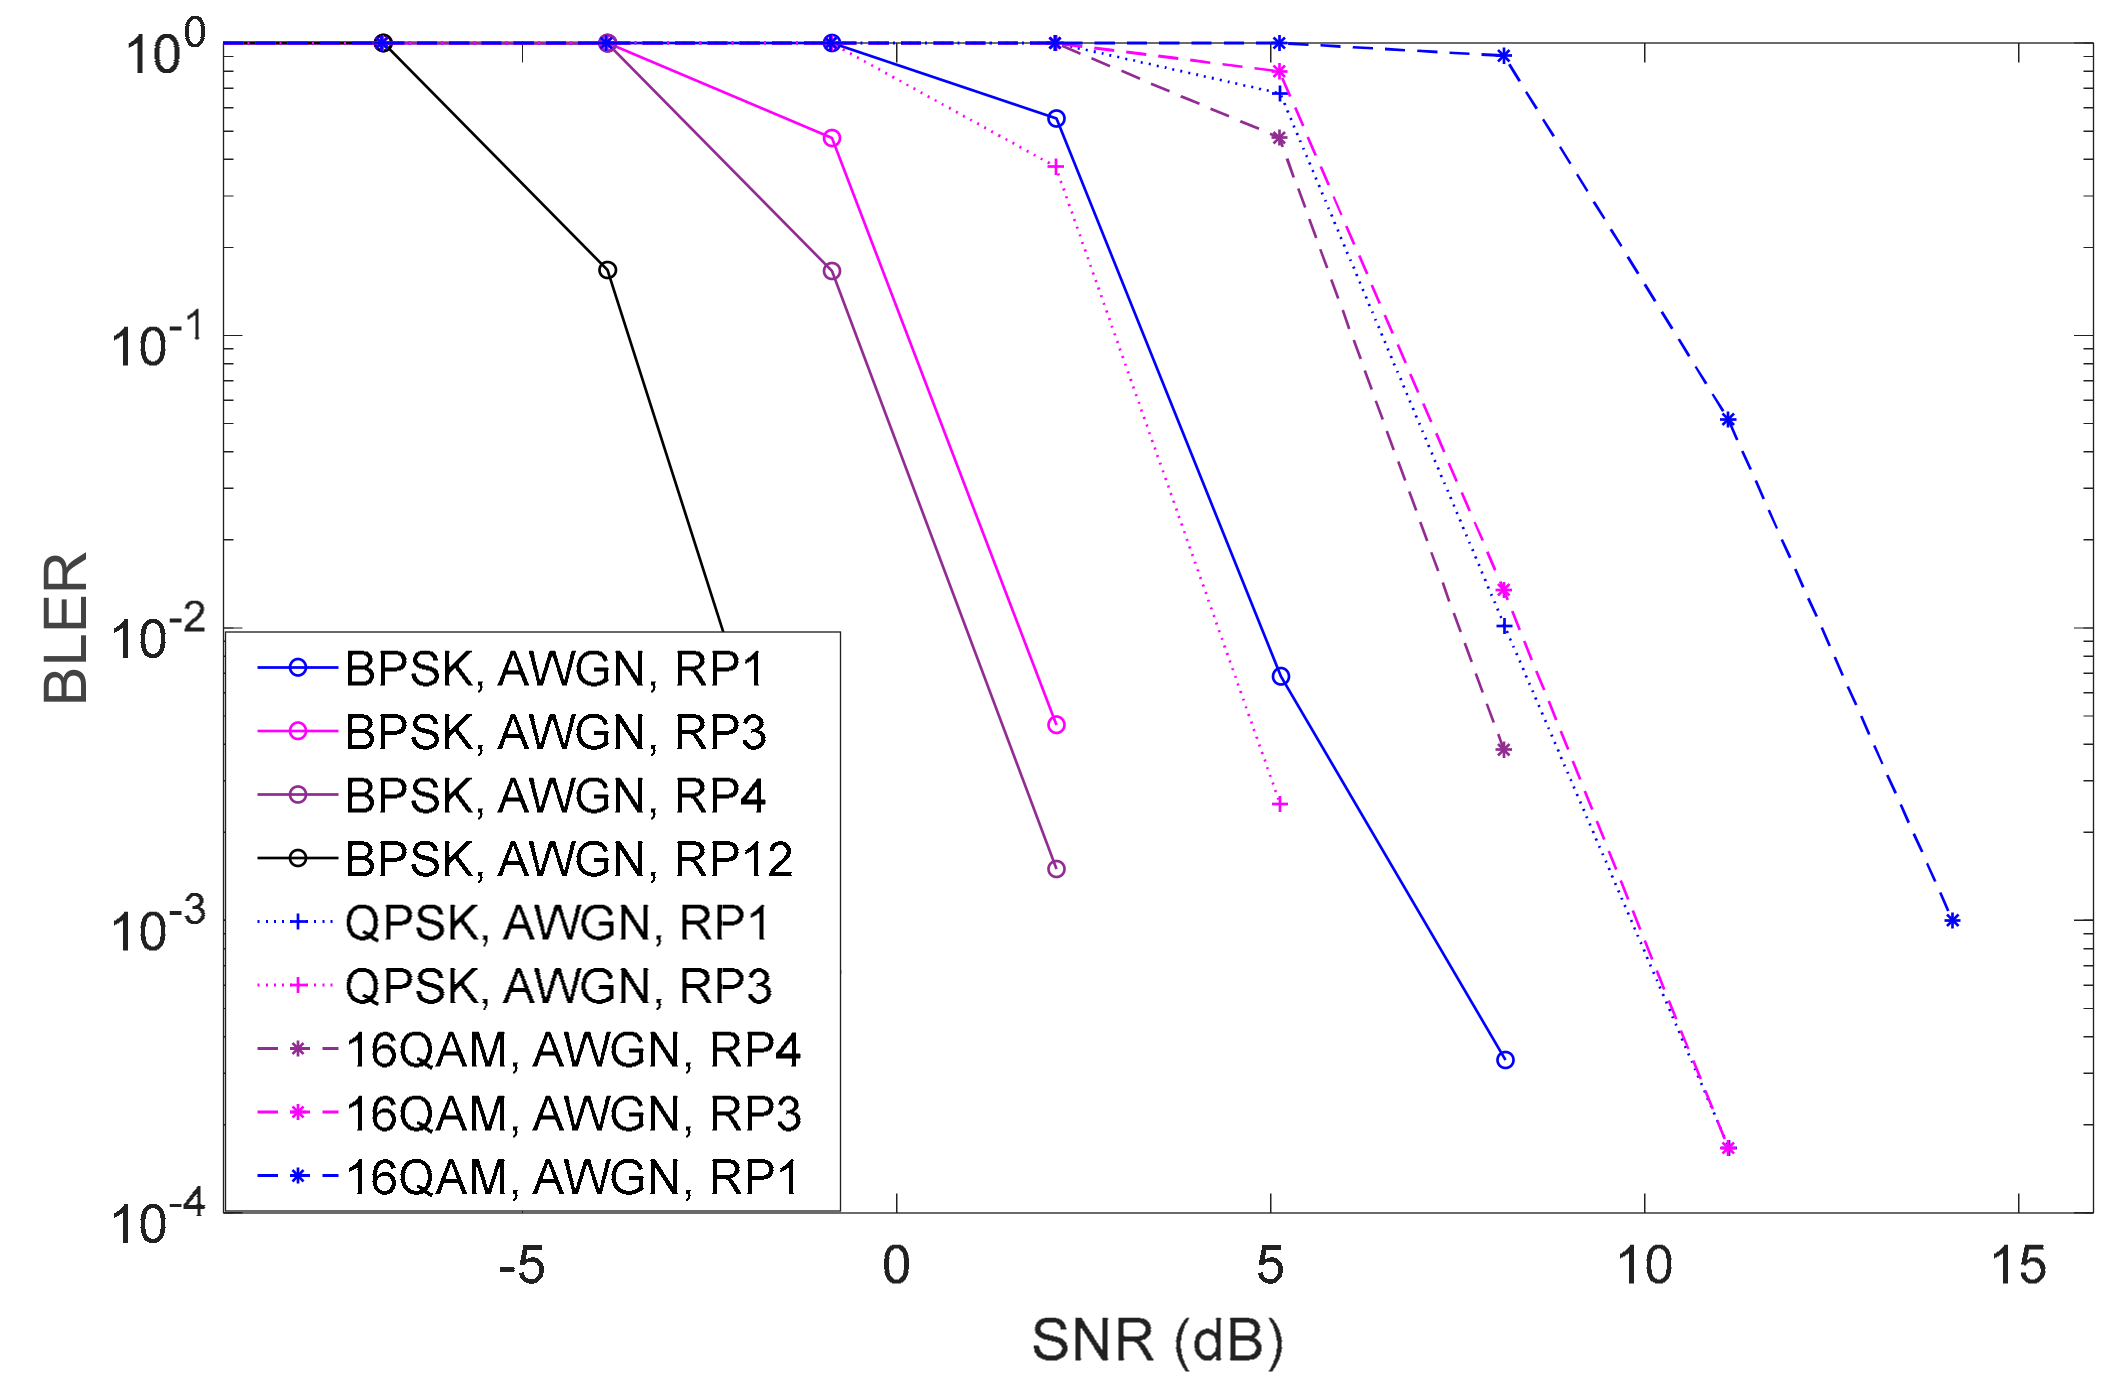
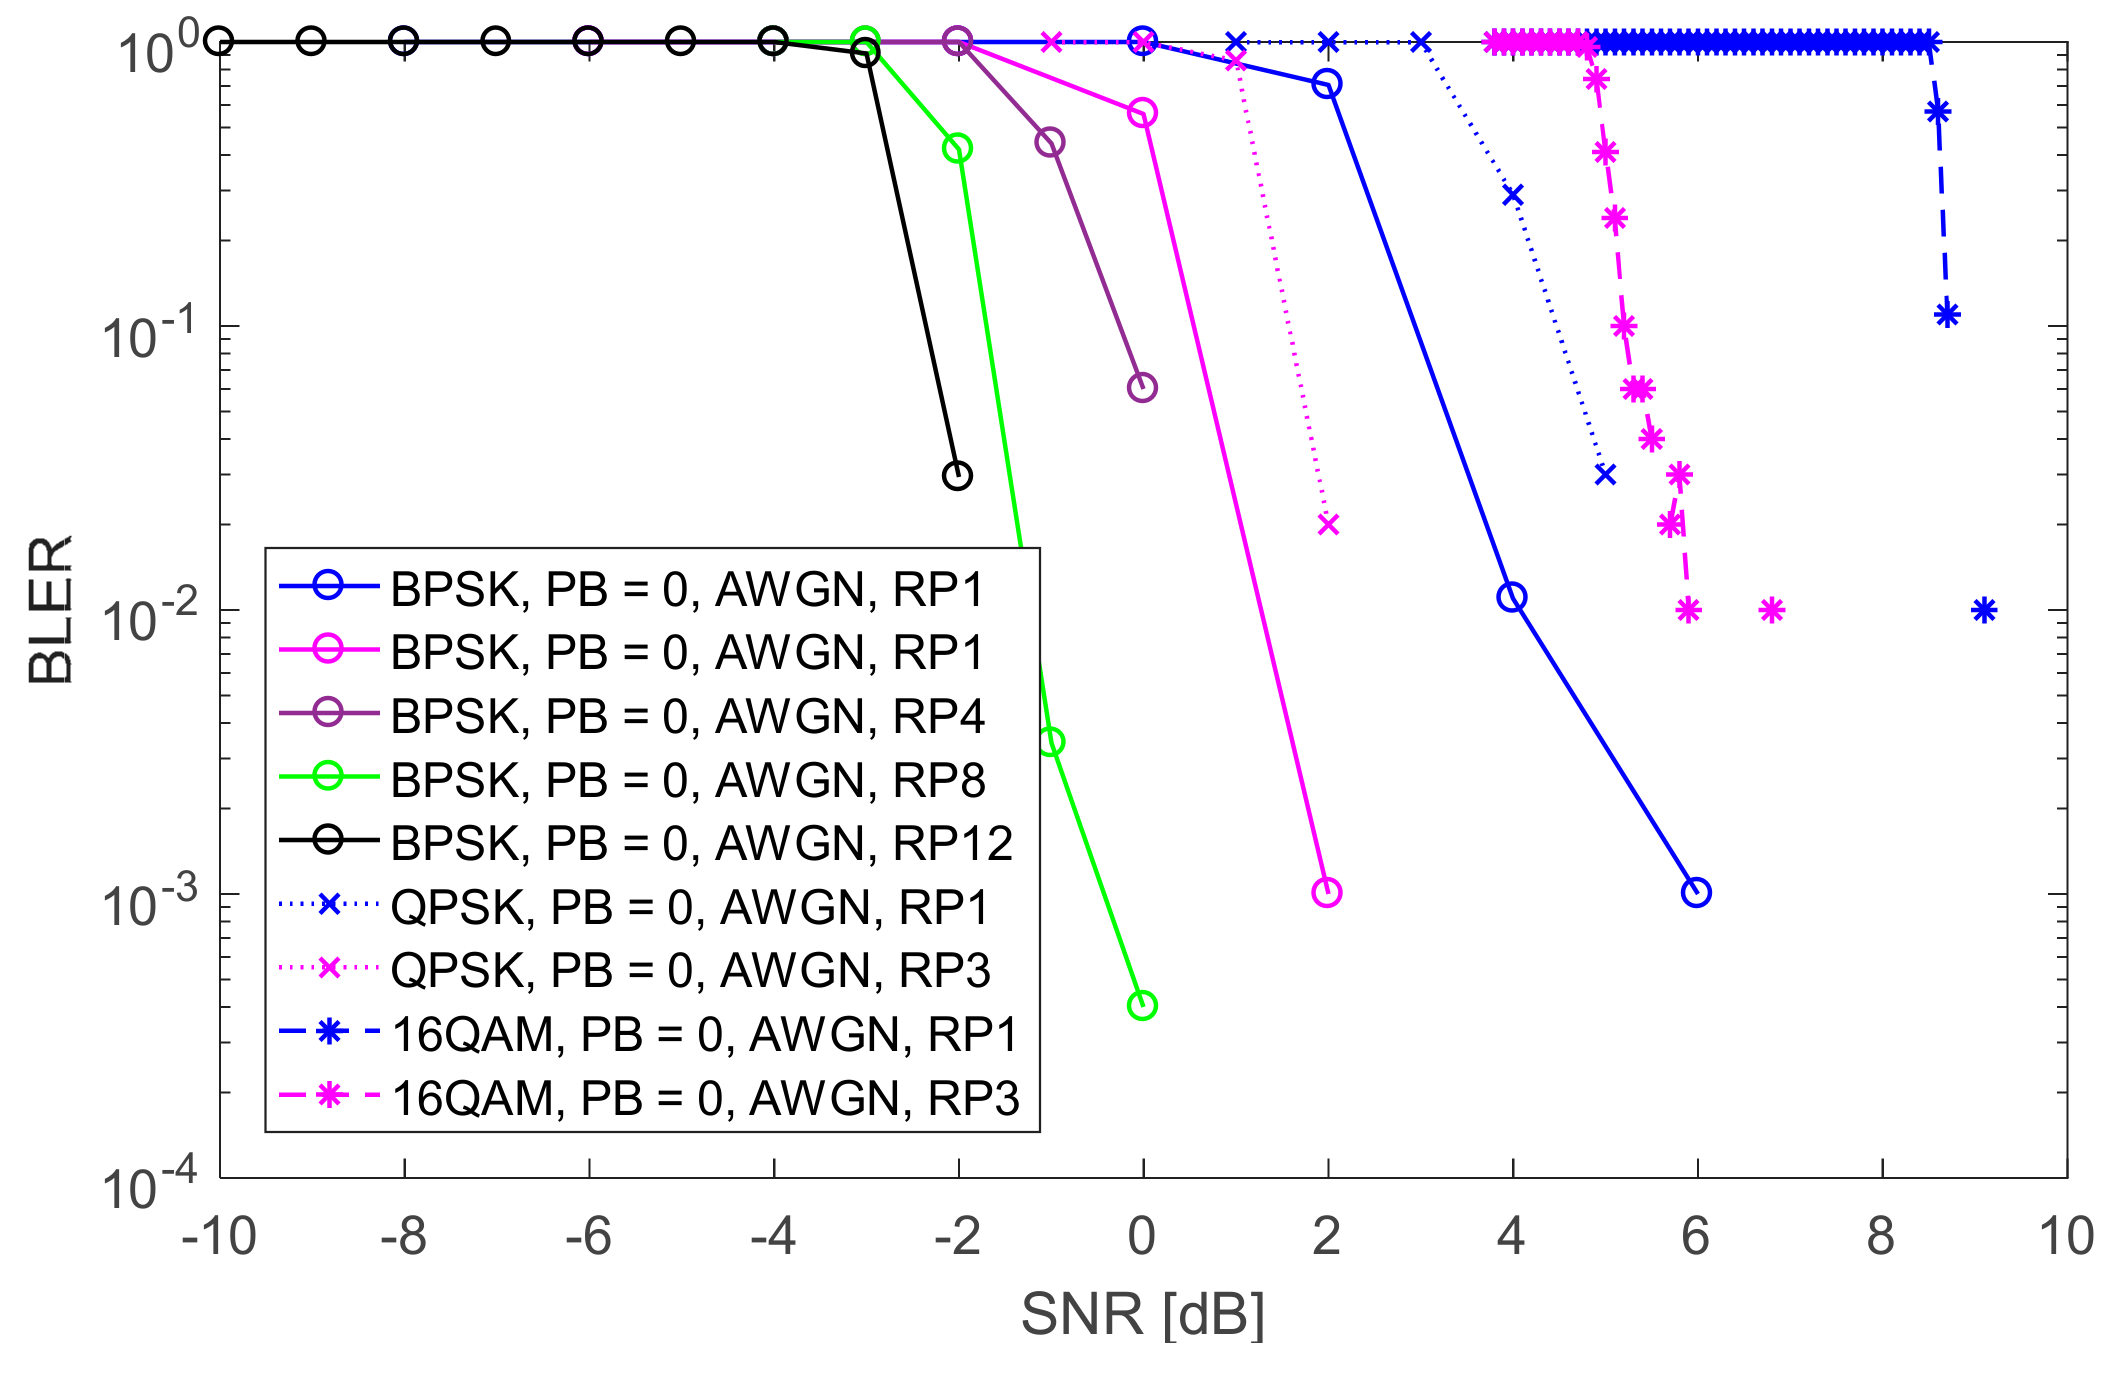
- BLER results are drawn from the LLS, and we analyze the SNR for PA and non-PA strategies.
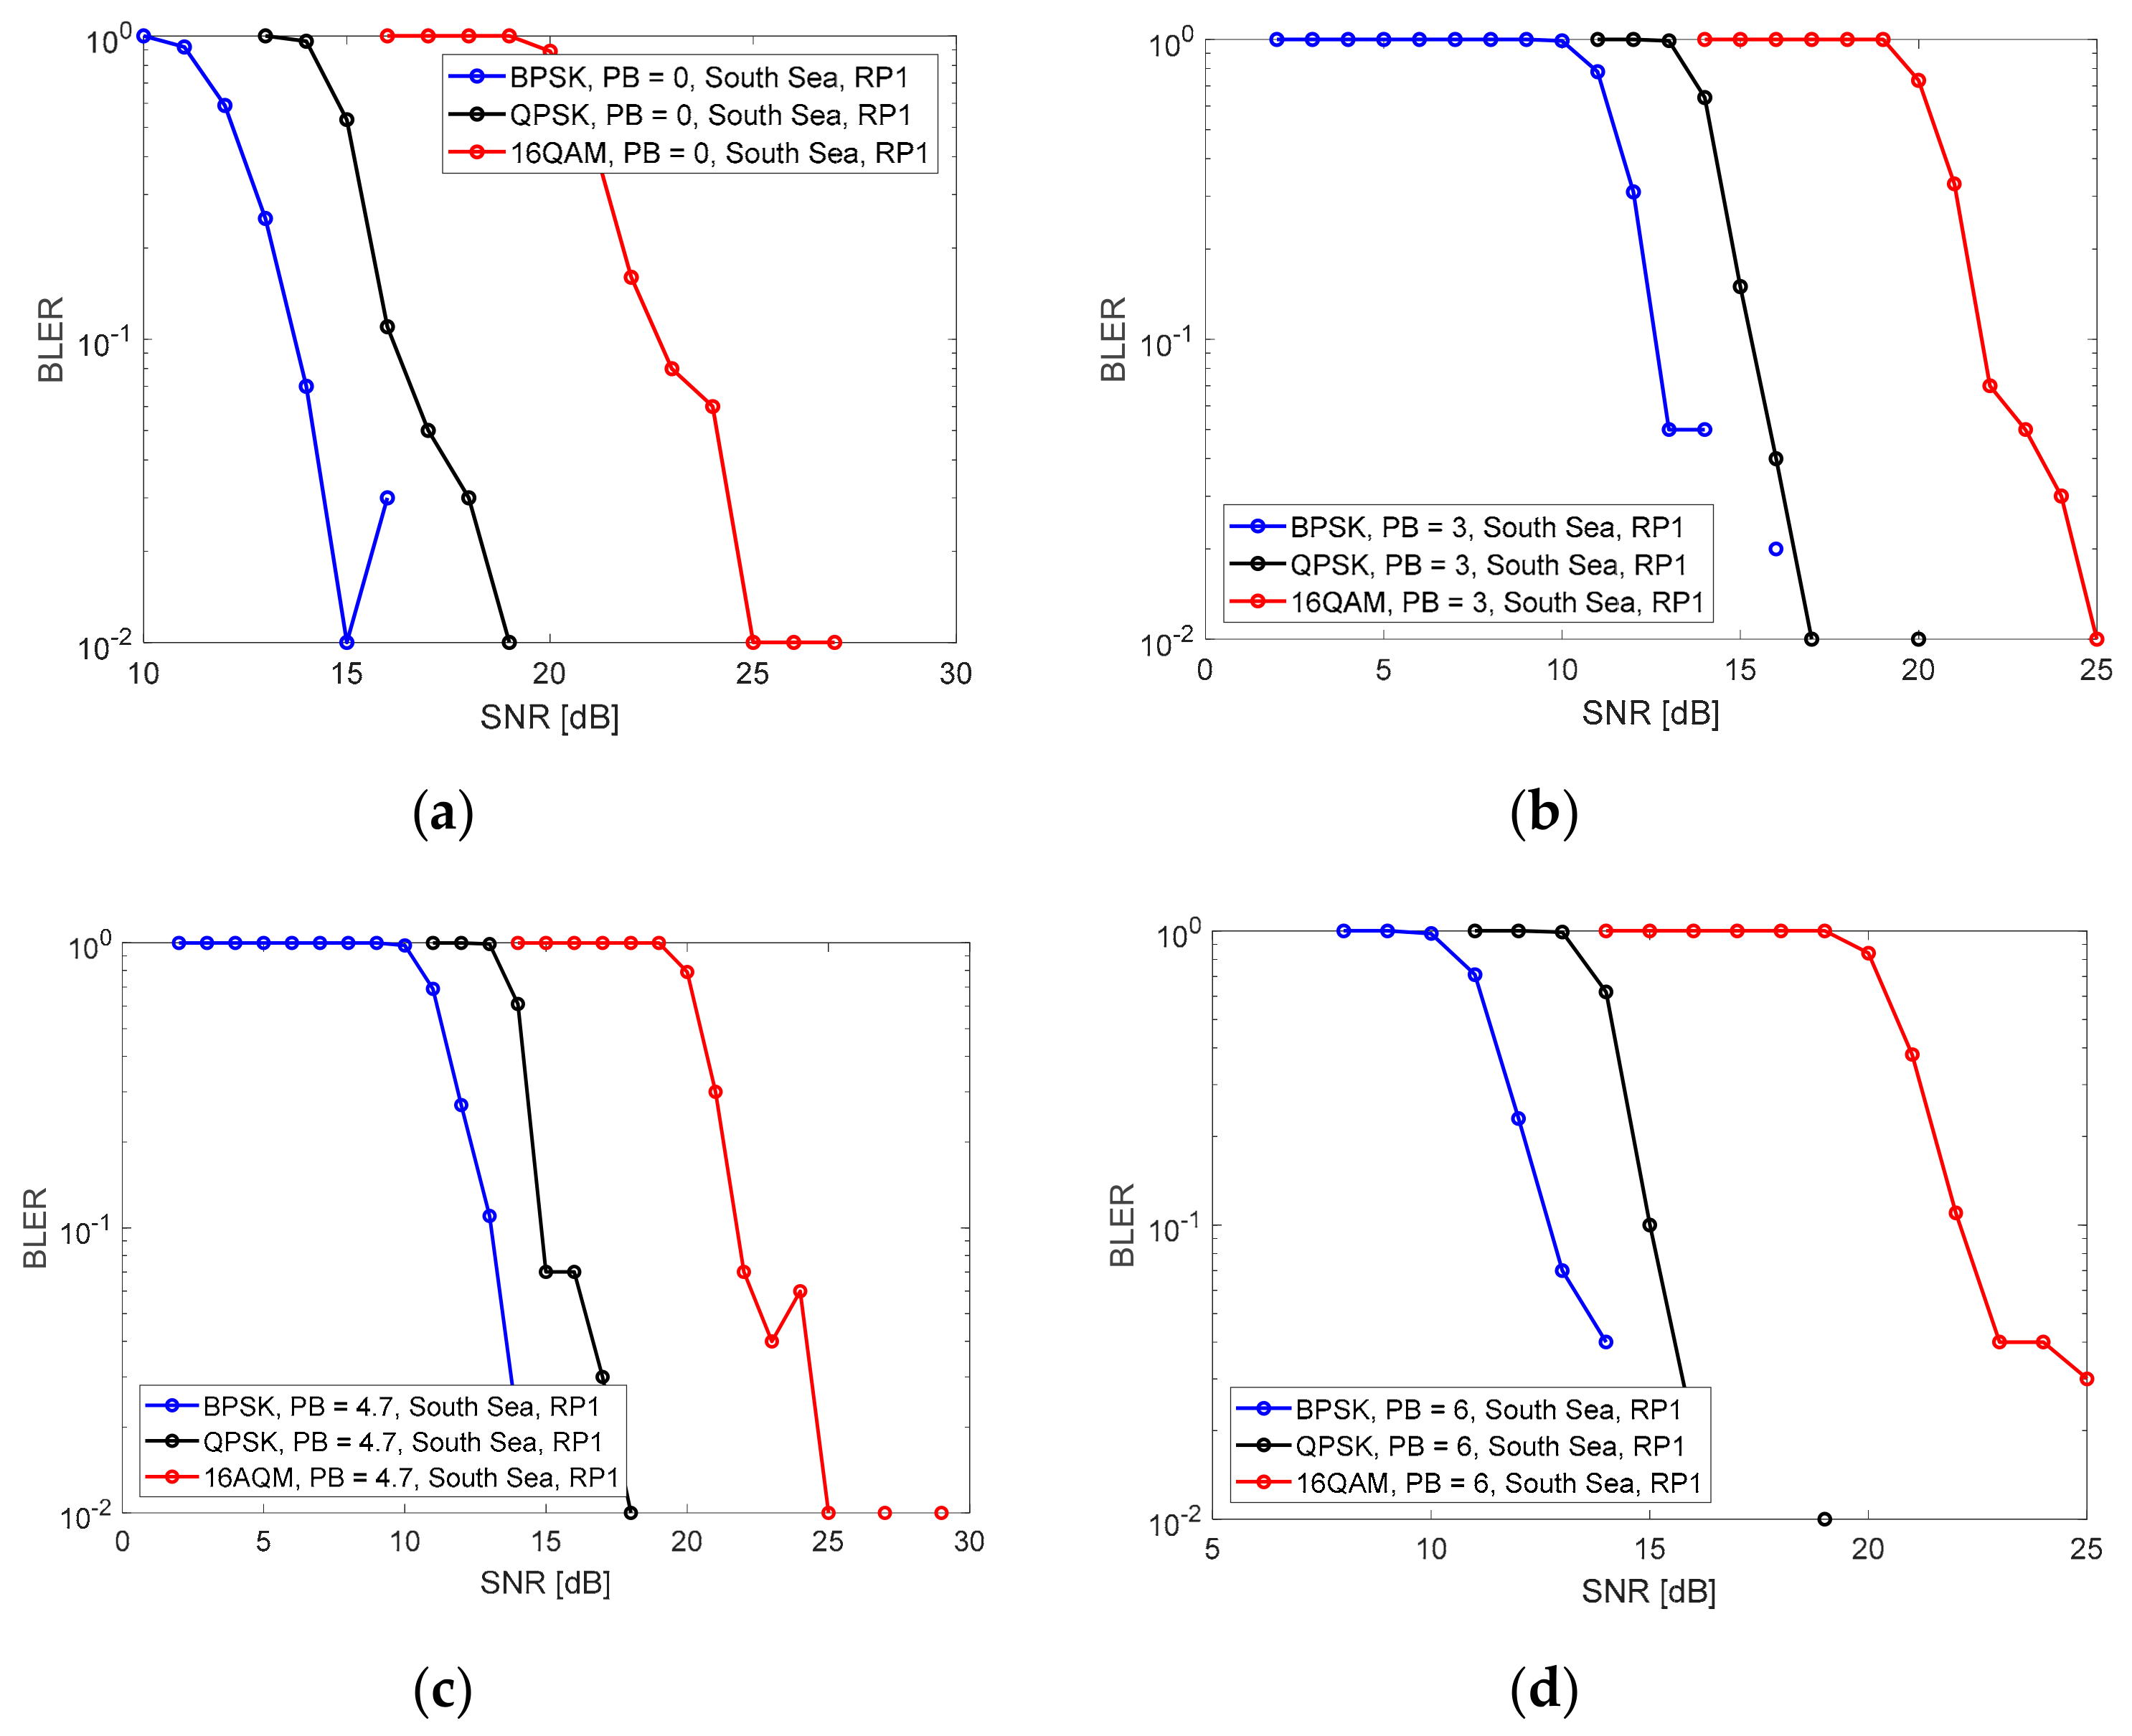
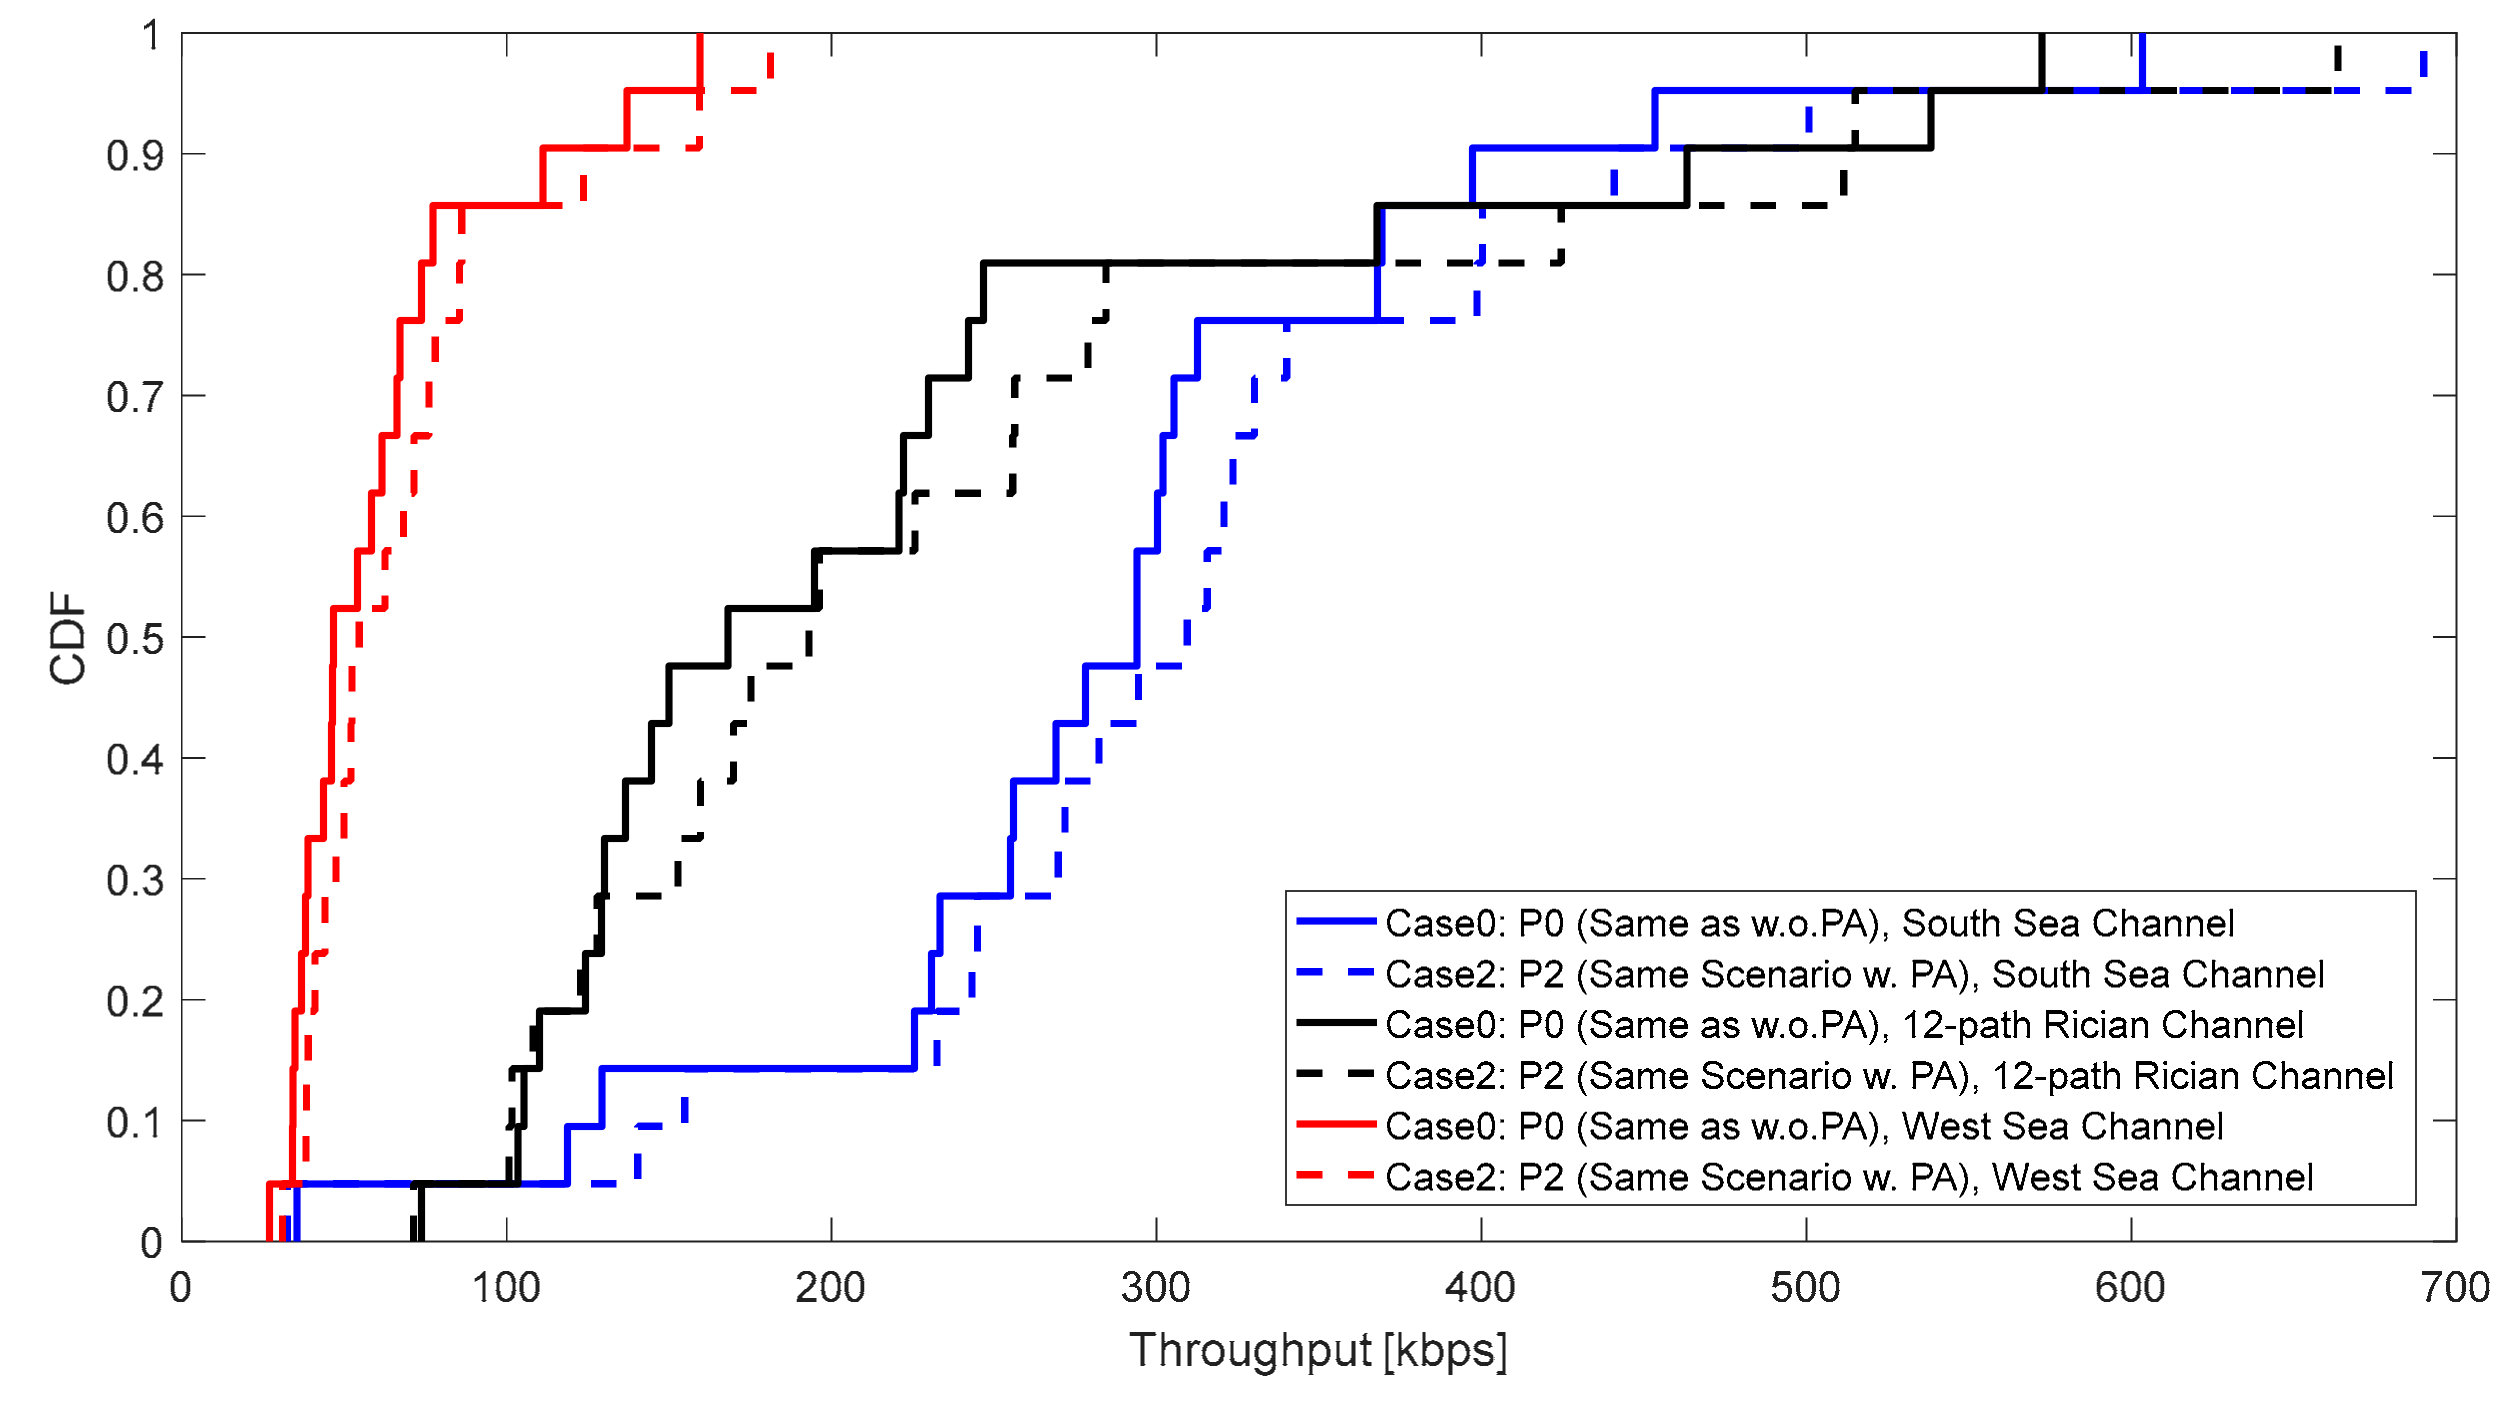
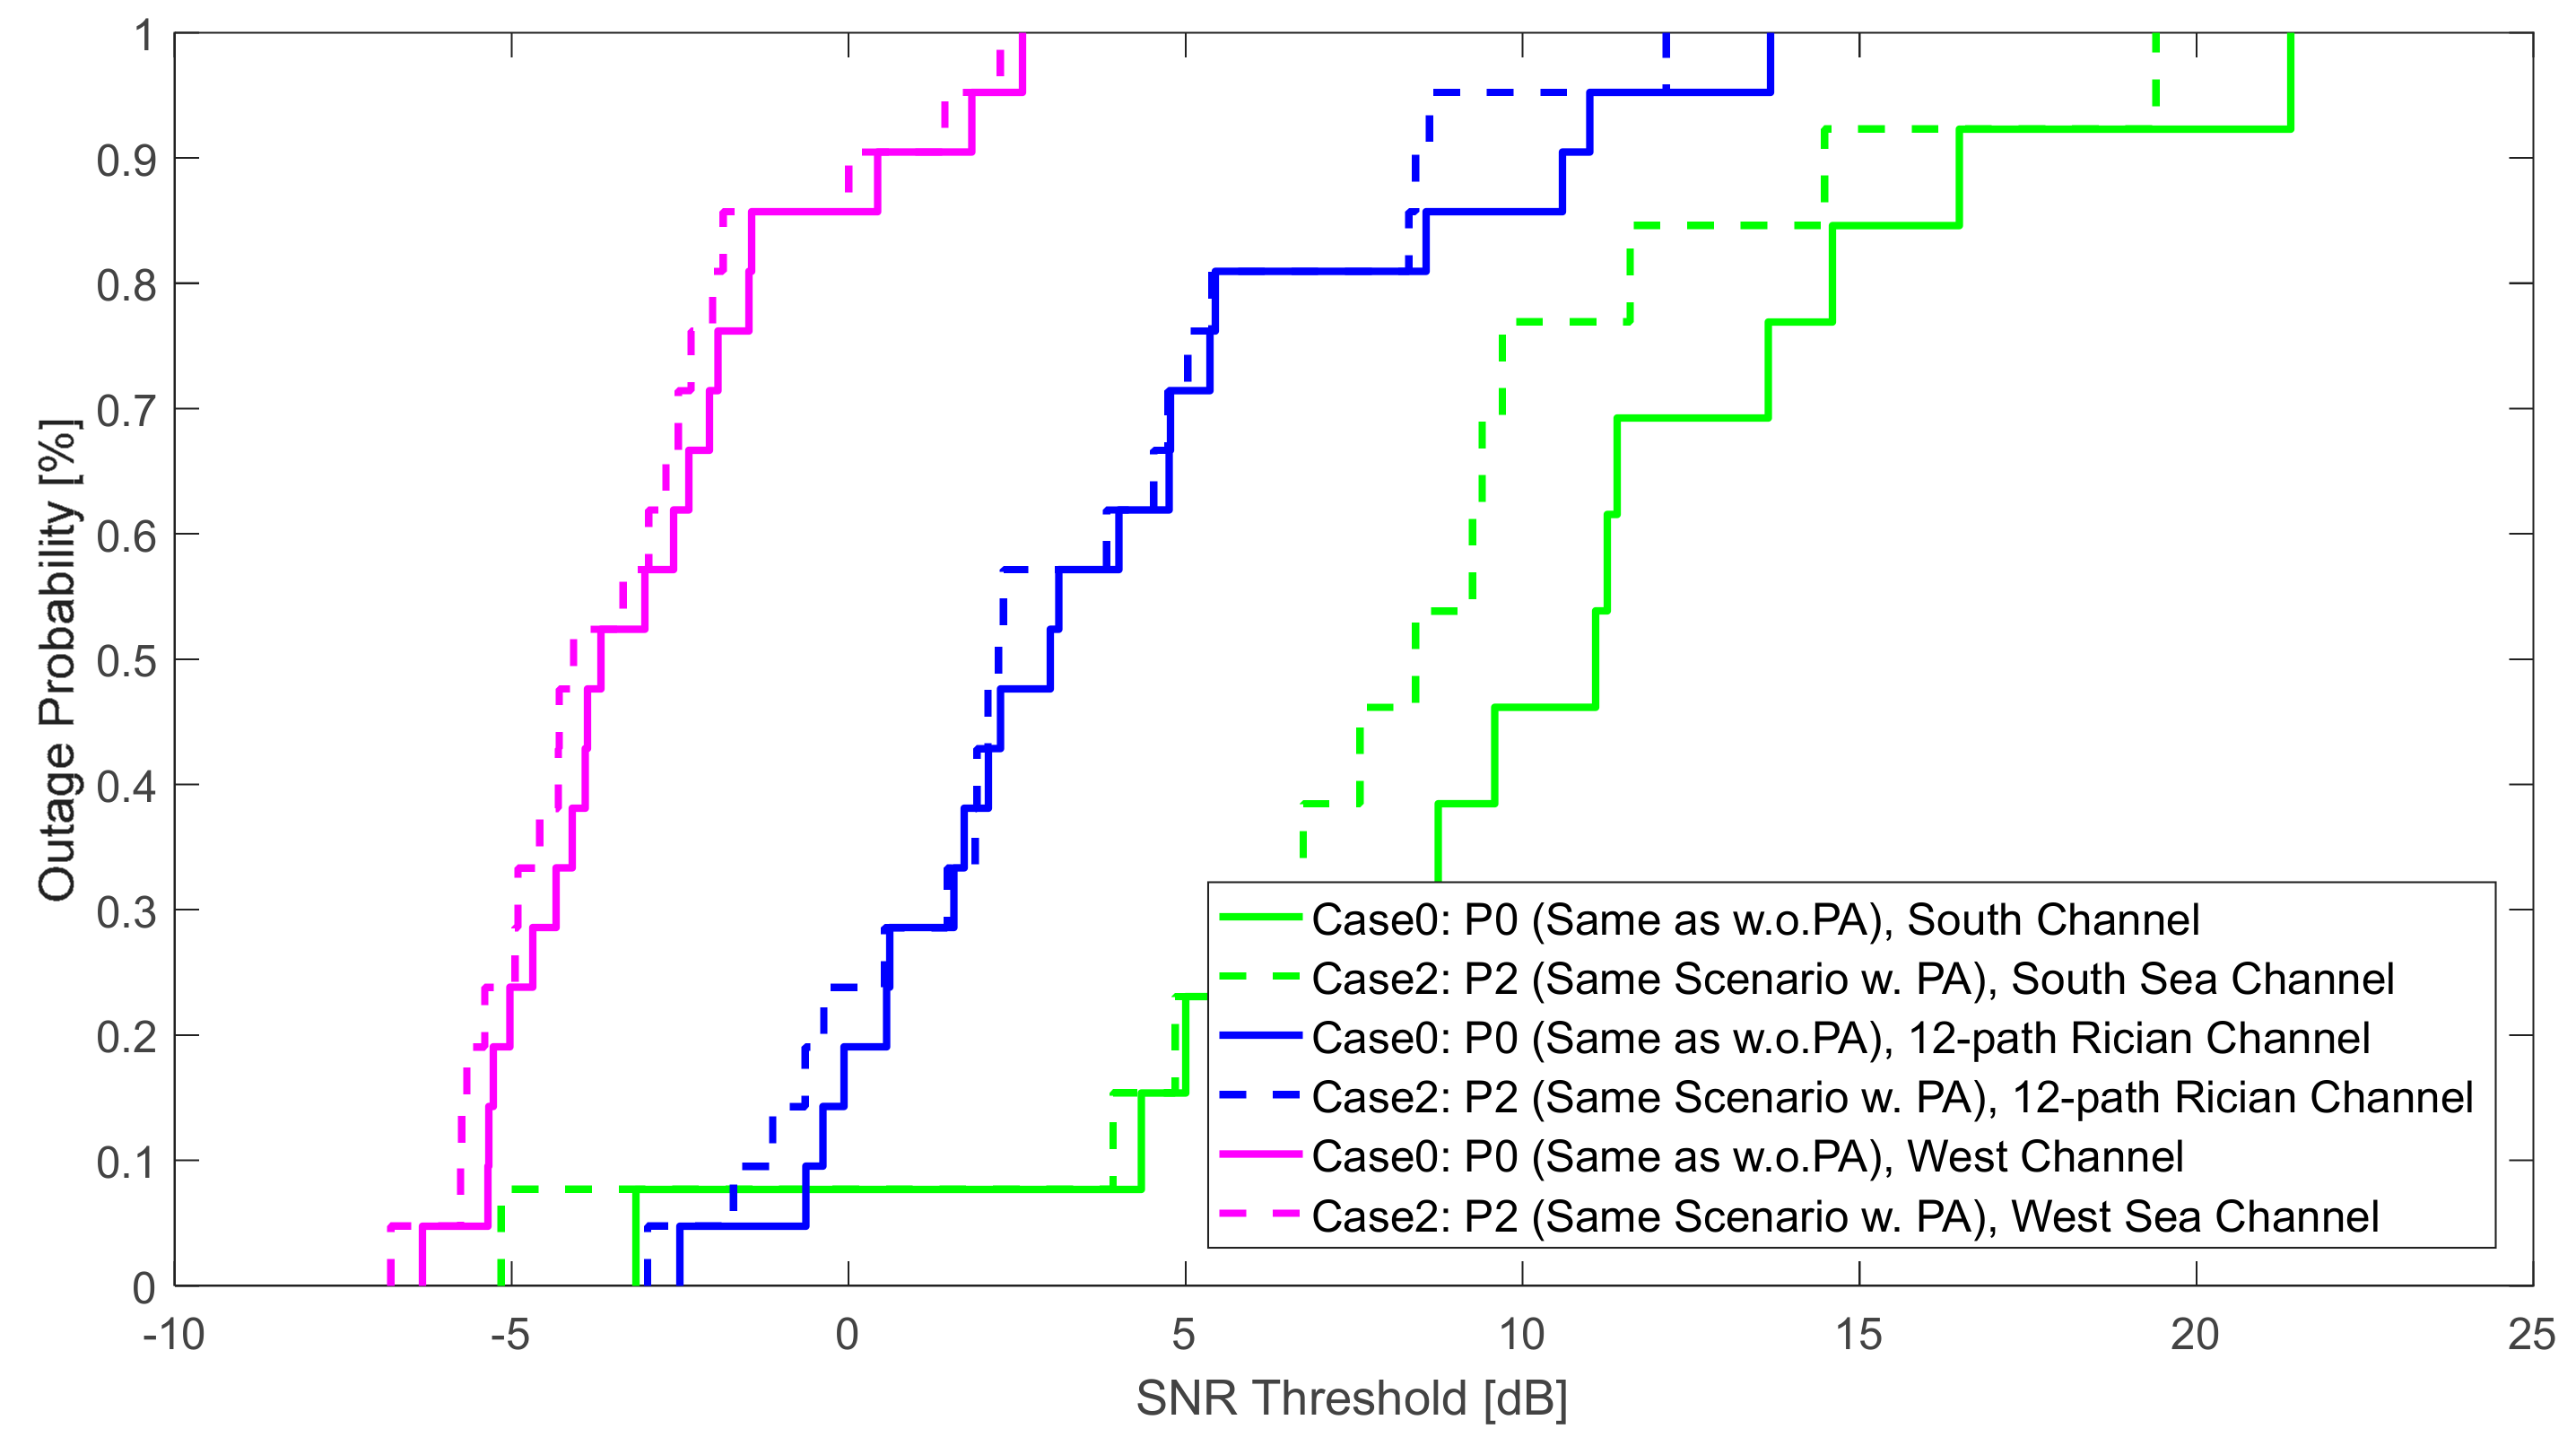
- The best PB case is adopted for the SLS, and we compare throughput and outage performance for PA and non-PA strategies.
2. System Model for UAC Networks
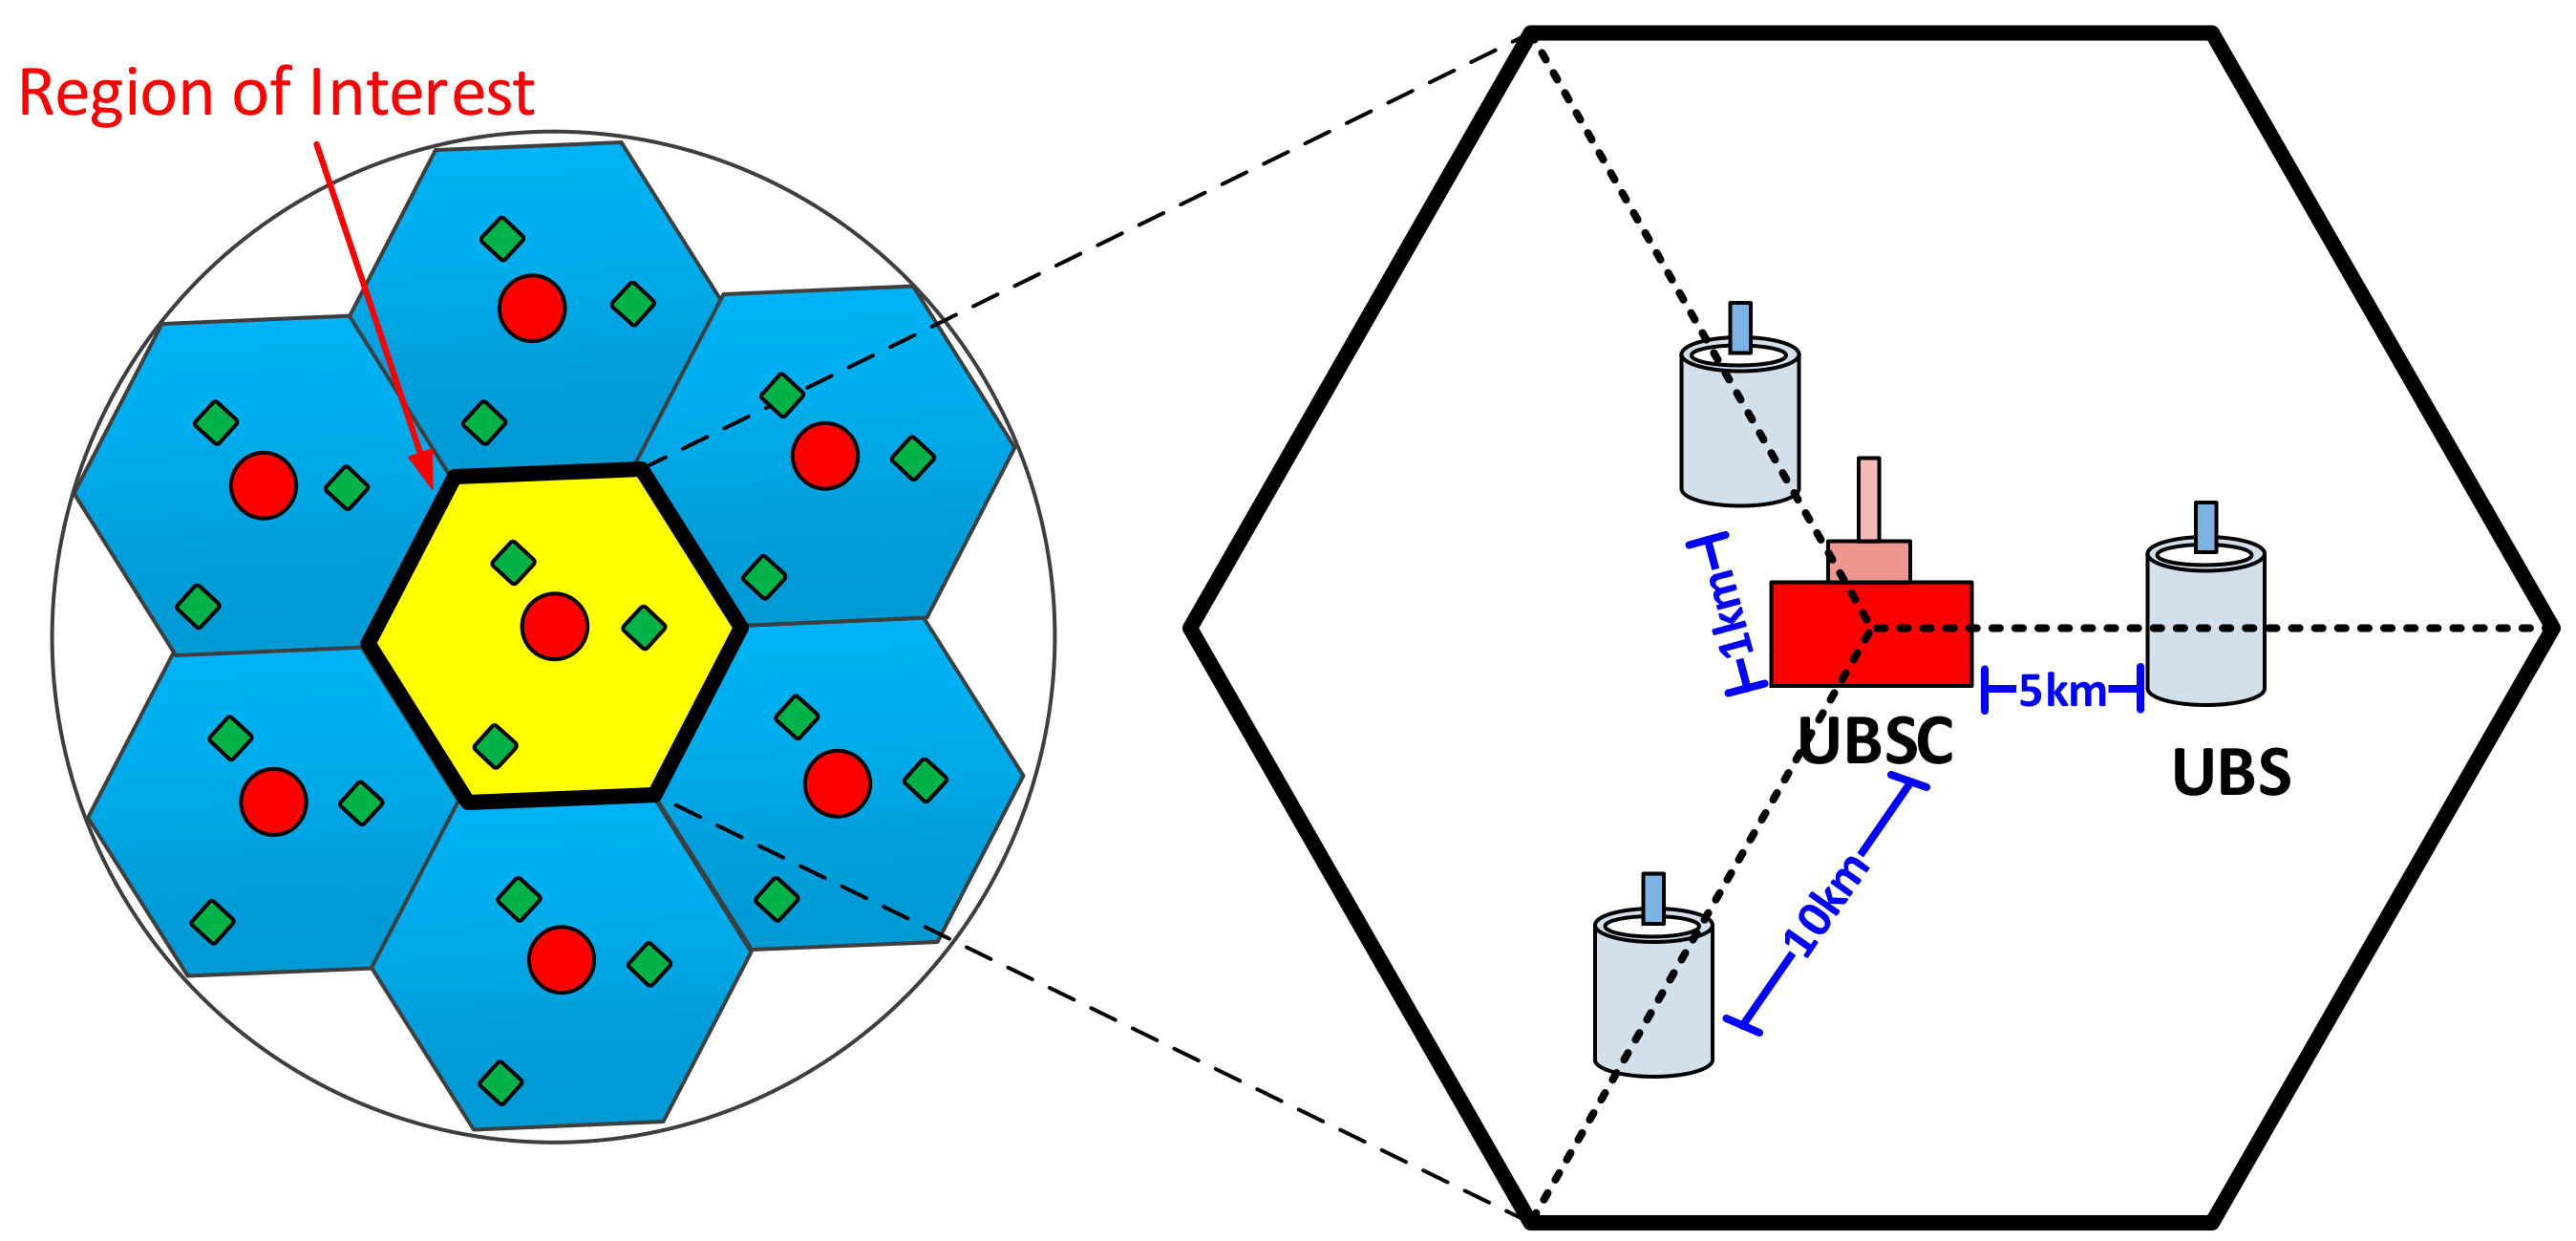
2.1. Network Layout
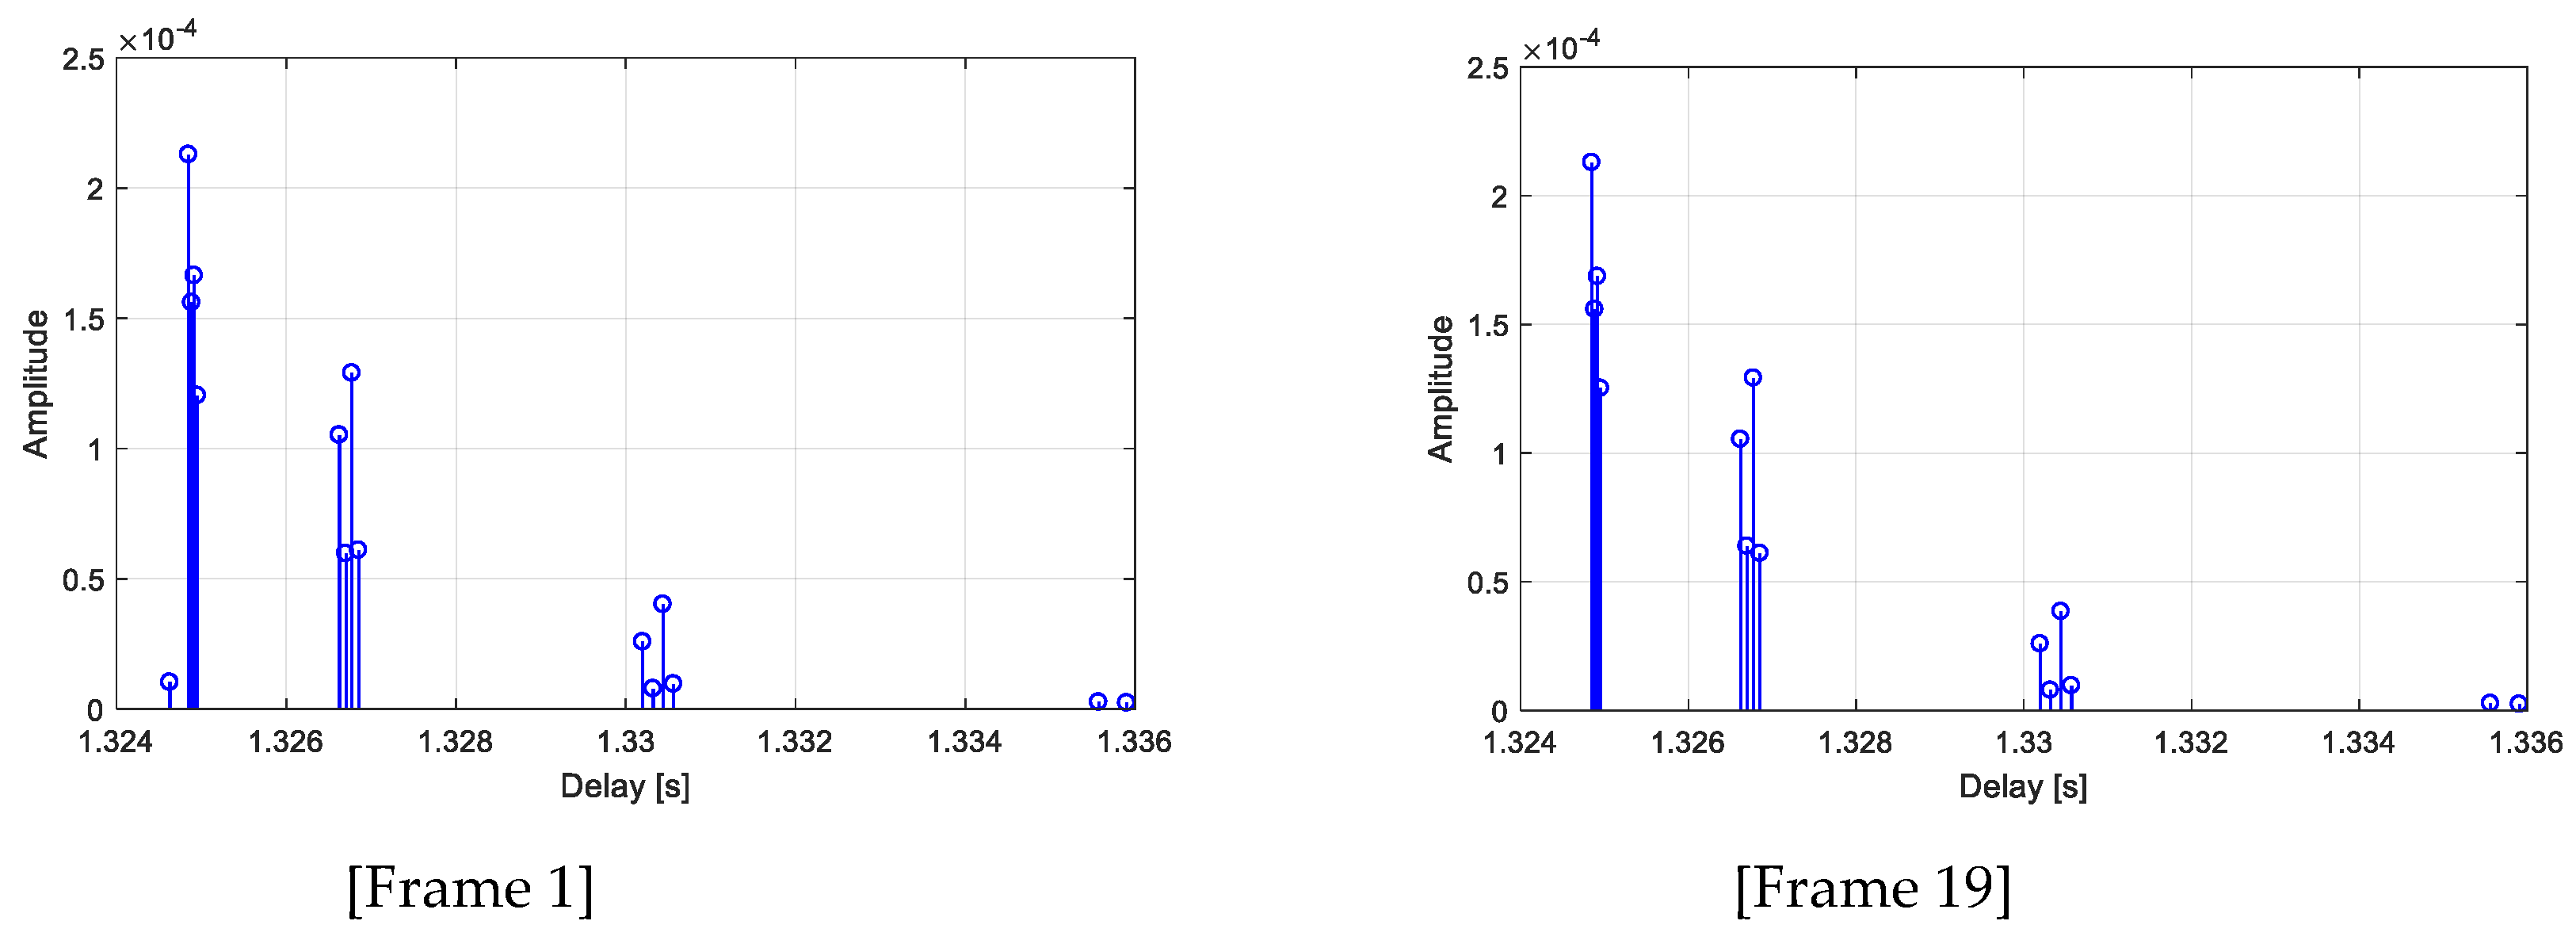
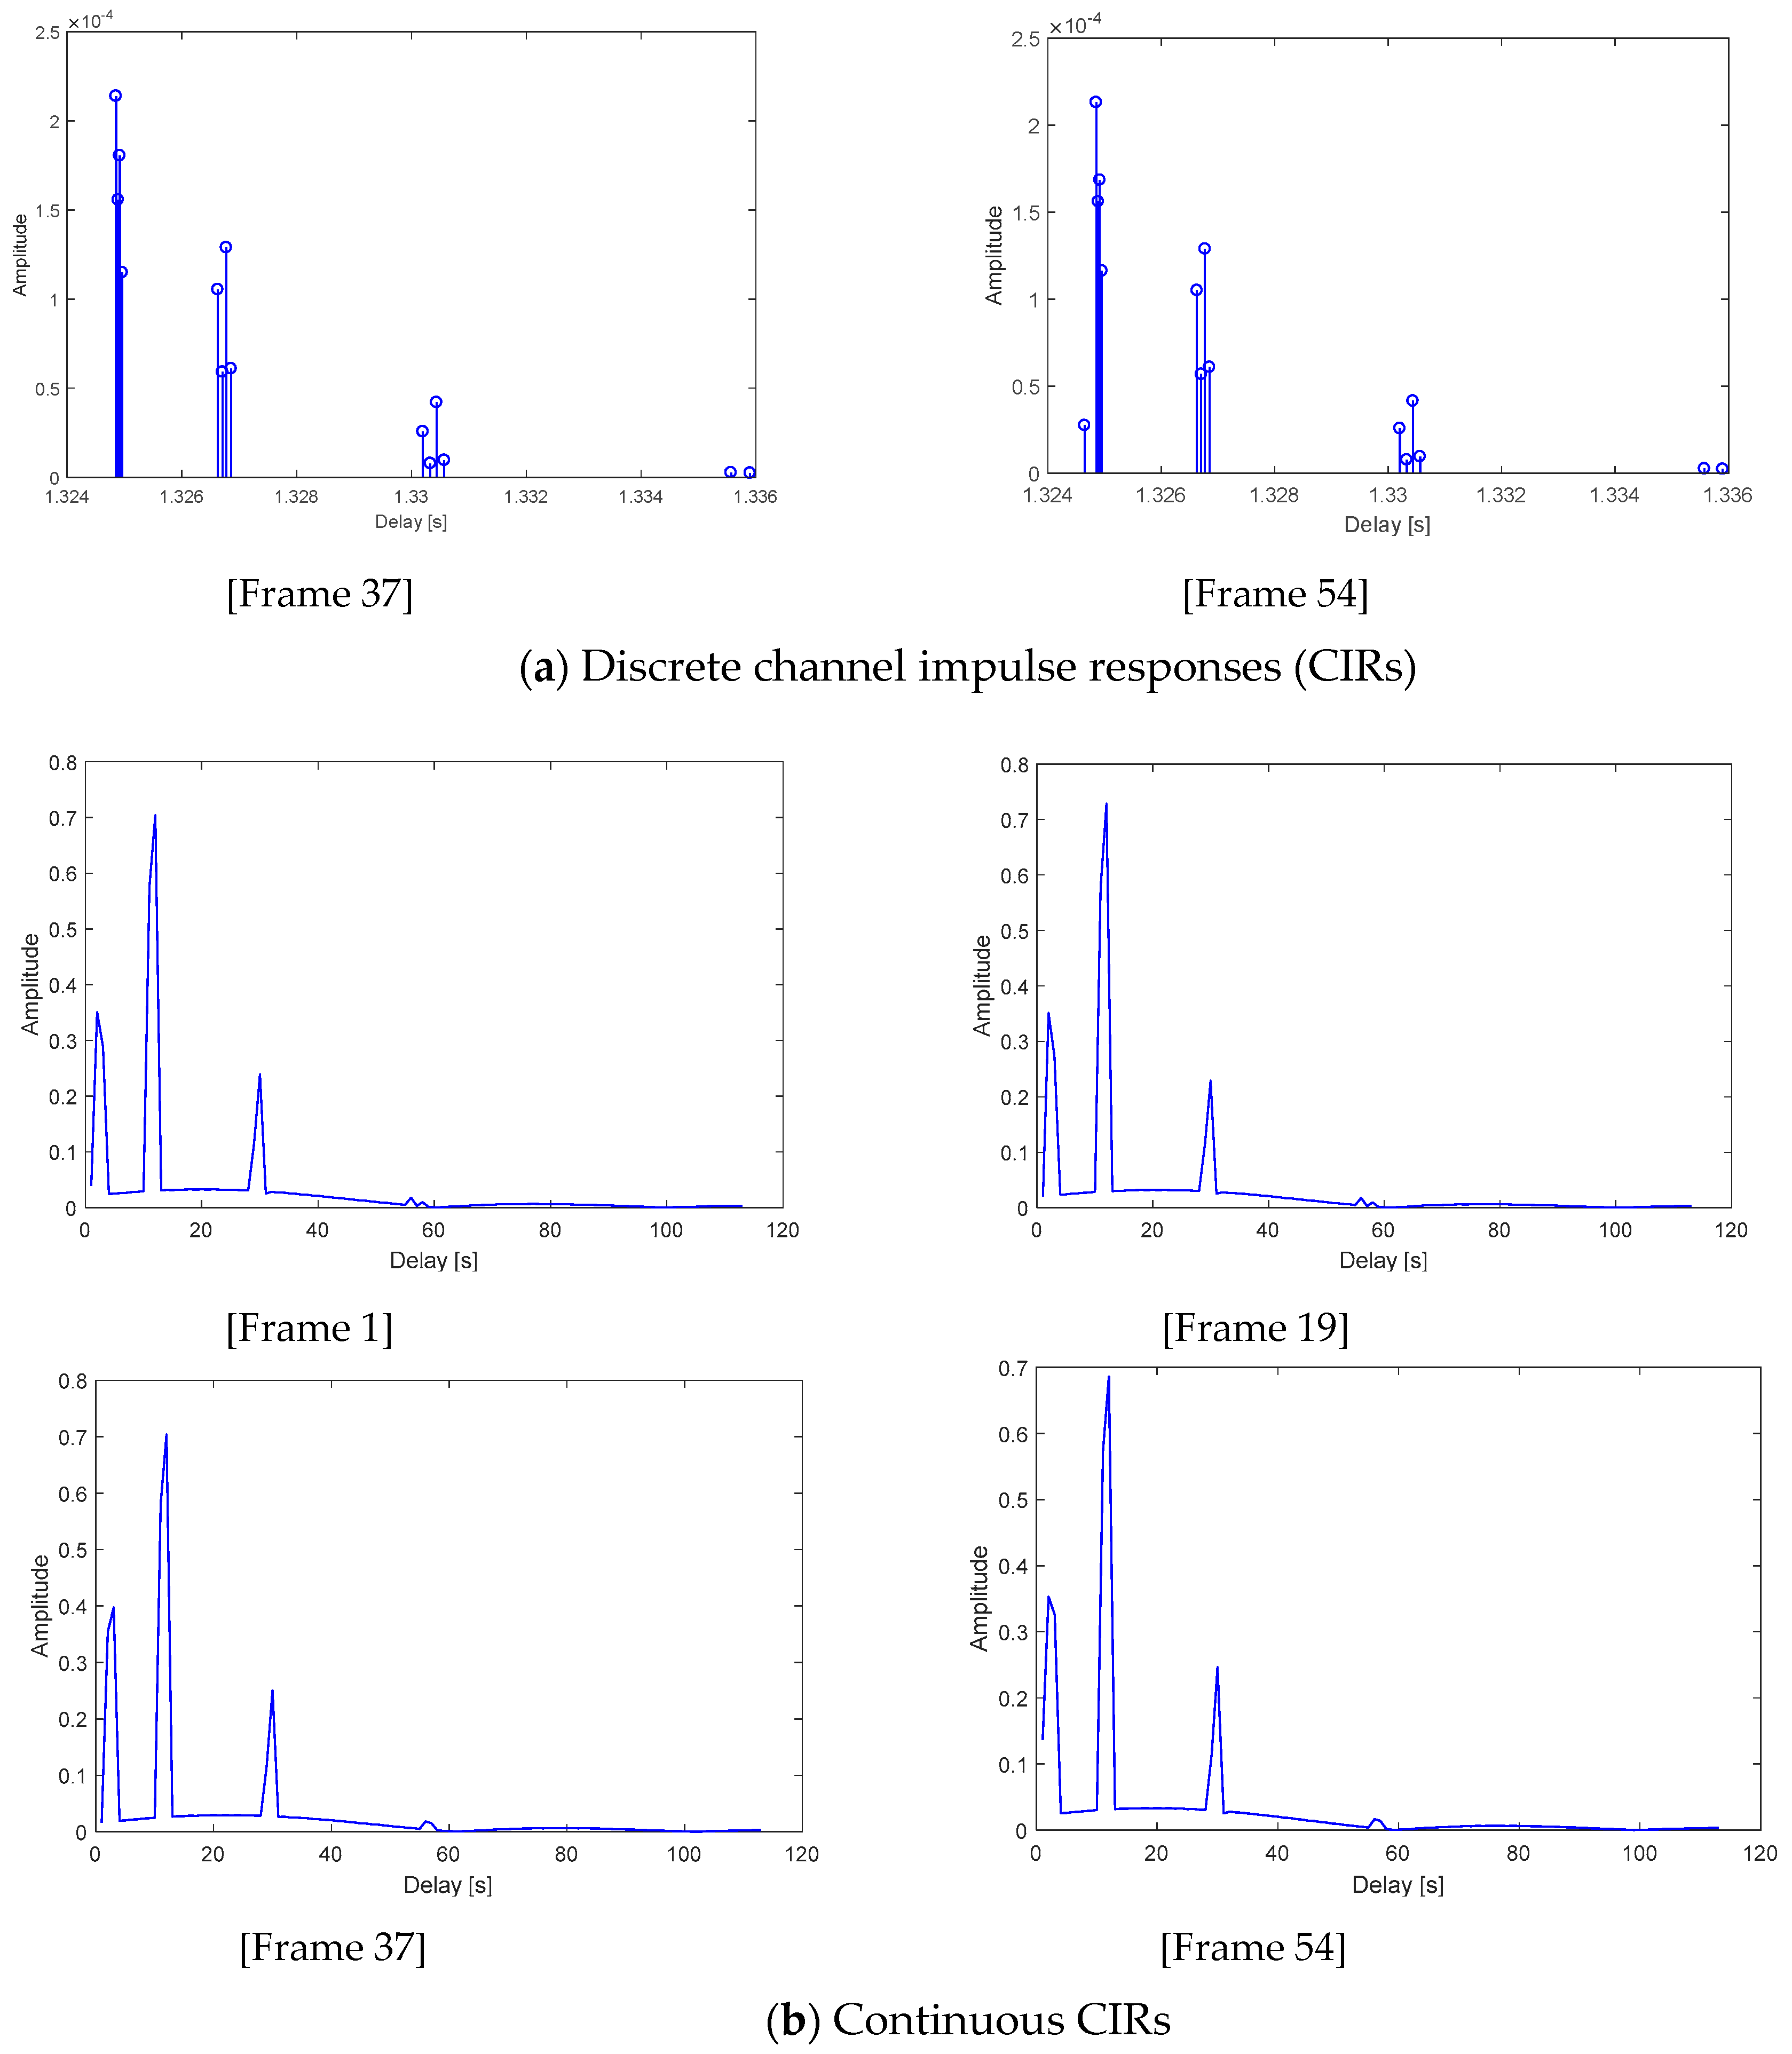
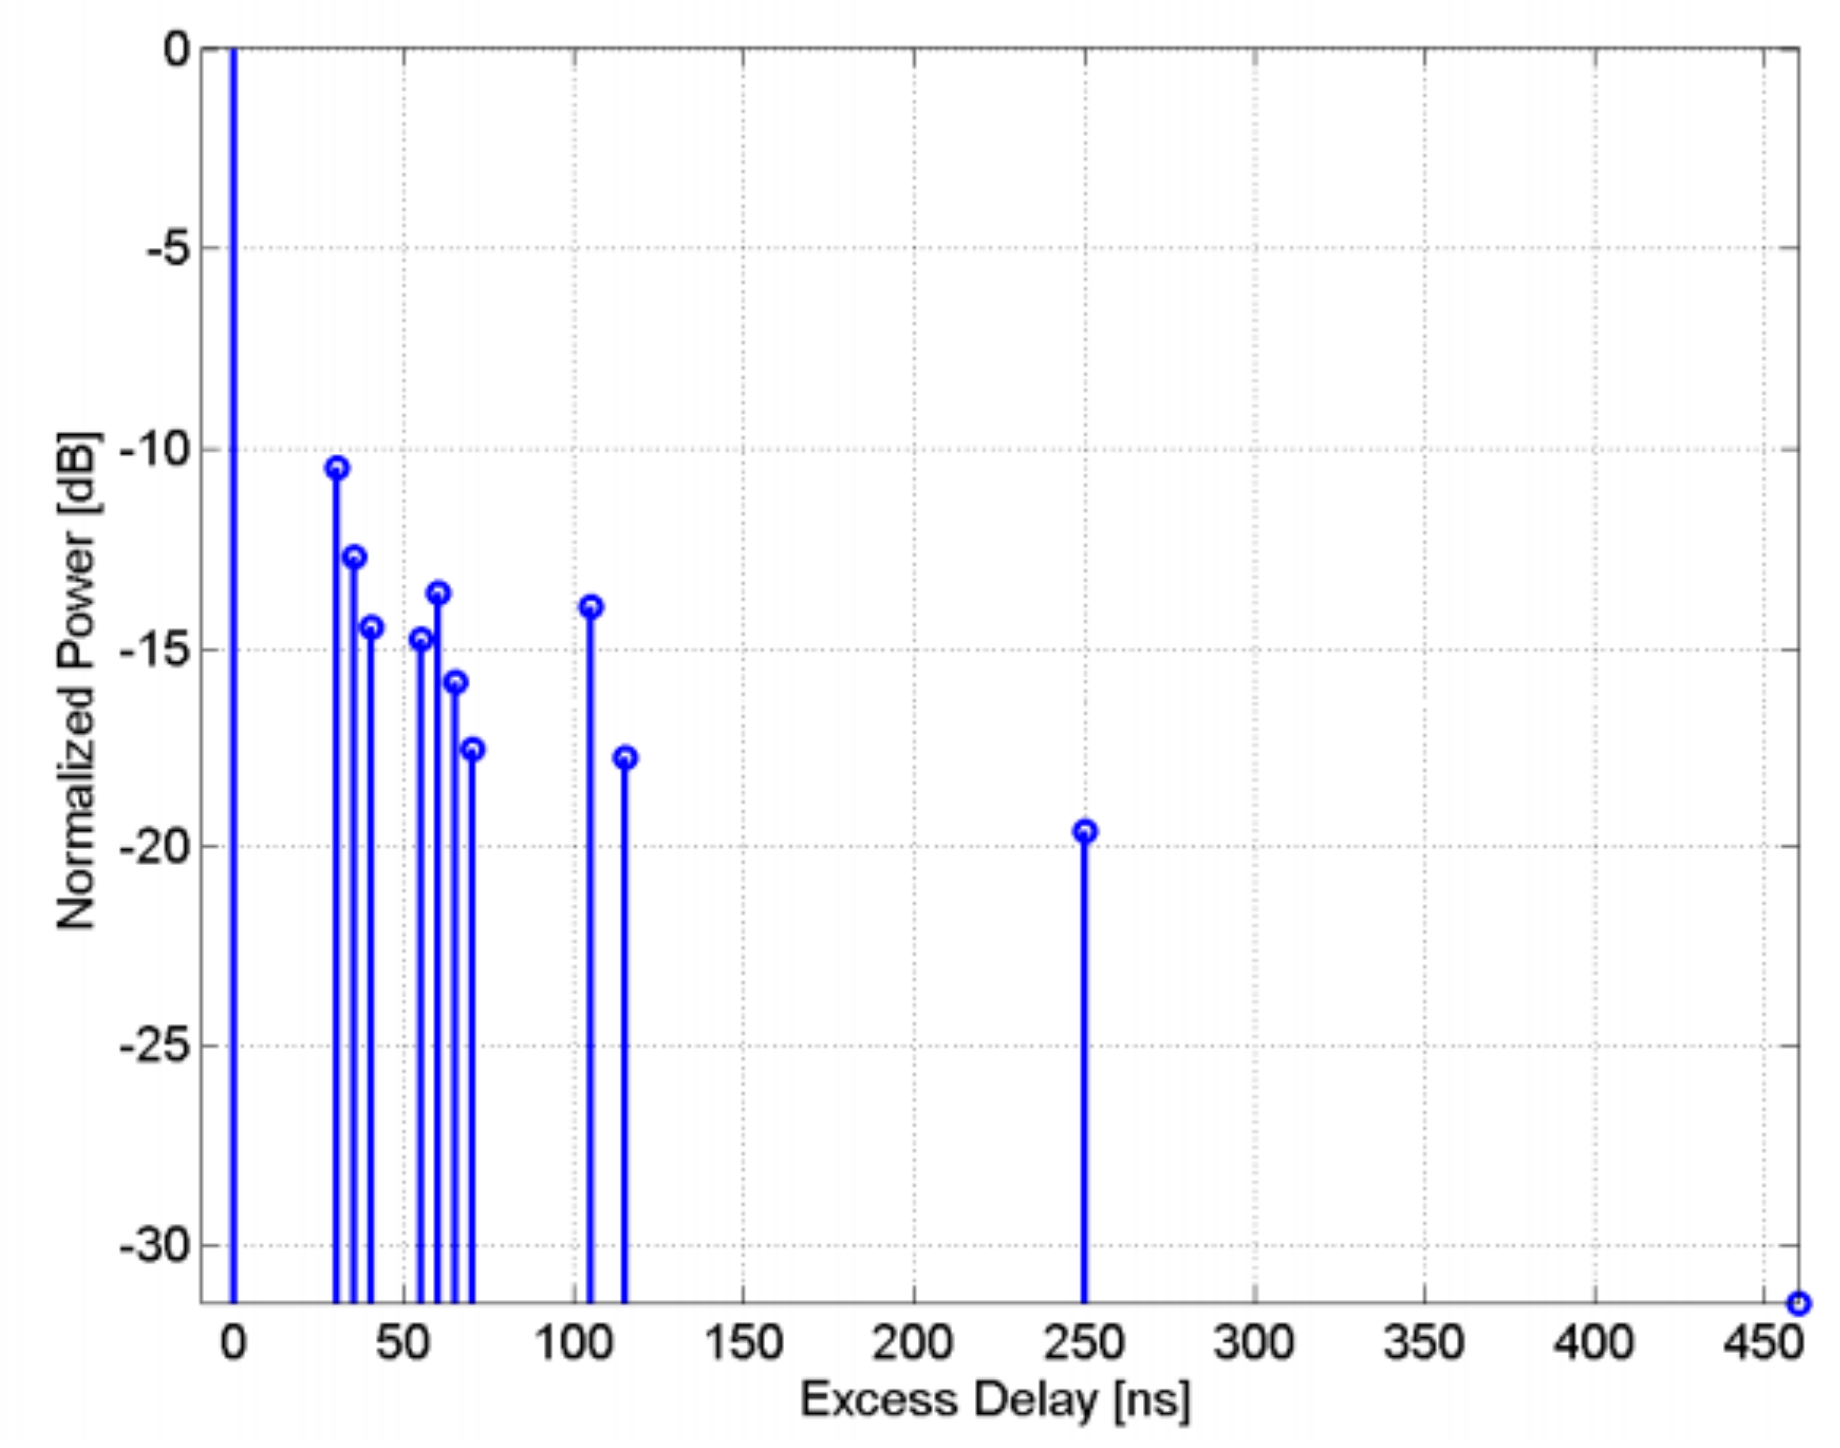
2.2. Channel Model
3. Proposed Downlink Power Allocation Strategy for UAC Networks
3.1. Power Offset Using Three Types of Pilot Spacing
3.2. Reference Signal Power Boosting Gain
4. Performance Evaluation of the Proposed Downlink Power Allocation Strategy
4.1. Analysis of PA and Non-PA Using LLS Results
4.2. Analysis of PA and Non-PA Using SLS Results
5. Conclusions
Author Contributions
Funding
Conflicts of Interest
References
- Qu, F.; Wang, Z.; Yang, L. A journey toward modeling and resolving doppler in underwater acoustic communications. IEEE Commun. Mag. 2016, 54, 49–55. [Google Scholar] [CrossRef]
- Stojanovic, M.; Beaujean, P. Acoustic Communication. In Springer Handbook of Acoustic; Dhanak, M.R., Xiros, N.I., Eds.; Springer: New York, NY, USA, 2016; pp. 359–383. [Google Scholar]
- Melodia, T.; Kulhandjian, H.; Demirors, E. Advances in underwater acoustic networking. In Mobile Ad-hoc Networking: Cutting Edge Directions, 2nd ed.; Basagni, S., Conti, M., Giordano, S., Stojmenovic, I., Eds.; John Wiley & Sons: Hoboken, NJ, USA, 2013; pp. 504–854. [Google Scholar]
- Stoganovic, M.; Preisig, J. Underwater acoustic communication channels: Propagation models and statistical characterization. IEEE Commun. Mag. 2009, 47, 84–89. [Google Scholar] [CrossRef]
- Berger, C.R.; Zhou, S.; Willett, P. Sparse channel estimation for multicarrier underwater acoustic communication: From subspace methods to compressed sensing. IEEE Trans. Signal Process. 2010, 58, 1708–1721. [Google Scholar] [CrossRef]
- Kim, S.; Cheon, H.; Park, S. A hexagon tessellation approach for the transmission energy efficiency in underwater wireless sensor networks. J. Inf. Process. Syst. 2010, 6, 53–66. [Google Scholar] [CrossRef]
- Stojanovic, M. On the design of underwater acoustic cellular systems. In Proceedings of the OCEANS, Aberdeen, UK, 18–21 June 2007; pp. 1–6. [Google Scholar]
- Sirinivasan, B. Capacity of Underwater Acoustic OFDM Cellular Networks. Masters’ Thesis, University of California, Santa Barbara, CA, USA, November 2008. [Google Scholar]
- Ahmad, I.; Kaleem, Z.; Chang, K.H. Block Error Rate and UE Throughput Performance Evaluation Using LLS and SLS in 3GPP LTE Downlink; Korean Institute of Communication and Information Sciences: Yongpyong Resort, Korea, February 2013; pp. 512–516. [Google Scholar]
- Mehlfuhrer, C.; Ikuno, J.C.; Shwarz, S.; Wrulich, M.; Rupp, M. The vienna LTE simulators-enabling reproducibility in wireless communications research. EURASIP J. Adv. Signal Process. 2011, 2011, 29. [Google Scholar] [CrossRef]
- Mehlfuherer, C.; Wrulich, M.; Ikuno, J.C.; Rupp, M. Simulating the long-term evolution physical layer. In Proceedings of the European Signal Processing Conference, Glasco, UK, 24–28 August 2009; pp. 1471–1478. [Google Scholar]
- Chen, W.; Ahmad, I.; Chang, K.H. Co-channel interference management using eICIC/FeICIC with coordinated scheduling for the coexistence of PS-LTE and LTE-R networks. EURASIP J. Wirel. Commun. 2017, 2017, 34. [Google Scholar] [CrossRef]
- Santos, R.B.; Freitas, W.C.; Cavalcani, F.R. Link-to-system level interface solutions in multistate channels for 3gpp lte wireless system. In Proceedings of the Simposio Brasileiro de Telecommunication, Sao Pedro, Brazil, 17–20 December 2007; pp. 1–6. [Google Scholar]
- Rappaport, T.S. Wireless Communications: Principles and Practice, 2nd ed.; Prentice Hall PTR: Upper Saddle River, NJ, USA, 1996; p. 736. [Google Scholar]
- Ahmad, I.; Chang, K.H. Effective SNR mapping and link adaptation strategy for next-generation underwater acoustic communications networks: A cross-layer approach. IEEE Access 2019, 7, 44150–44164. [Google Scholar] [CrossRef]
- Ahmad, I.; Kaleem, Z.; Chang, K.H. Uplink power control for interference mitigation based on users priority in two-tier femtocell network. In Proceedings of the IEEE International Conference on ICT Convergence, Jeju, Korea, 14–16 October 2013; pp. 474–475. [Google Scholar]
- Ahmad, I.; Chen, W.; Chang, K.H. Co-channel interference analysis using cooperative communication schemes for the coexistence of PS-LTE and LTE-R networks. In Proceedings of the IEEE Communication and Electronics Special Session on LTE Technologies and Services, Ha Long, Vietnam, 27–29 July 2016; pp. 181–182. [Google Scholar]
- Ahmad, I.; Chen, W.; Chang, K.H. LTE-railway user priority-based cooperative resource allocations schemes for coexisting public safety and railway networks. IEEE Access 2017, 5, 7958–8000. [Google Scholar] [CrossRef]
- Kaleem, Z.; Khaliq, M.Z.; Khan, A.; Duong, T.Q. PS-CARA: Context-aware resource allocation scheme for mobile public safety networks. J. Sens. 2018, 18, 1473. [Google Scholar] [CrossRef] [PubMed]
- Ahmad, I.; Chang, K.H. Analysis on MIMO transmit diversity and multiplexing techniques for ship ad-hoc networks under a maritime channel model in coastline areas. In Proceedings of the IEEE International Conference on ICT Convergence, Jeju, Korea, 18–20 October 2017; pp. 18–20. [Google Scholar]
- Ahmad, I.; Chang, K.H. Analysis on MIMO transmit diversity techniques for ship ad-hoc network under a maritime channel model in coastline areas. J. Korean Inst. Commun. Inf. Sci. 2017, 42, 383–385. [Google Scholar] [CrossRef]
- Ahmad, I.; Kaleem, Z.; Chang, K.H. QoS priority based femtocell user power control for interference mitigation in 3GPP LTE-A HetNet. J. Korean Inst. Commun. Inf. Sci. 2014, 39, 61–74. [Google Scholar] [CrossRef]
- Ahmad, I.; Nguyen, L.D.; Ha, D.B. Quality-of-Service Aware Game Theory-Based Uplink Power Control for 5G Heterogeneous Networks. Mob. Netw. Appl. 2019, 24, 556–563. [Google Scholar] [CrossRef]
- Ahmad, I.; Chang, K.H. Design of system-level simulator architecture for underwater acoustic communications and networking. In Proceedings of the ICTC, Jeju, Korea, 19–21 October 2016; pp. 384–386. [Google Scholar]
- Mughal, U.A.; Ahmad, I.; Chang, K.H. Virtual cells operation for 5G V2X communications. In Proceedings of the Conference of Korean Institute of Communications and Information Sciences (KICS), Jeju, Korea, 7–10 January 2019; pp. 1–2. [Google Scholar]
- Mughal, U.A.; Ahmad, I.; Chang, K.H. Cellular V2X Communications in Unlicensed Spectrum: Compatible Coexistence with VANET in 5G Systems. In Proceedings of the JCCI, Jeju, Korea, 27–31 May 2019; pp. 1–2. [Google Scholar]
- Ahmad, I.; Chang, K.H. Mission critical user priority-based random access scheme for collision resolution in coexisting PS-LTE and LTE-M networks. IEEE Access 2019, 7, 115505–115517. [Google Scholar] [CrossRef]
- Stojanovic, M. Design and capacity analysis of cellular-type underwater acoustic networks. IEEE J. Ocean. Eng. 2008, 33, 171–181. [Google Scholar] [CrossRef]
- Radosevic, A.; Duman, T.M.; Proakis, J.G.; Stojanovic, M. Channel prediction for adaptive Modulation in underwater acoustic communications. In Proceedings of the IEEE OCEANS, Santander, Spain, 6–9 June 2011; pp. 1–5. [Google Scholar]
- Stojanovic, M. On the relationship between capacity and distance in an underwater acoustic communication channel. In Proceedings of the International Conference on UnderWater Networks and Systems, Los Angeles, CA, USA, 2 September 2006; pp. 41–47. [Google Scholar]
- Brekhovskikh, L.M.; Lysanov, Y.P. Fundamental of Ocean Acoustics, 3rd ed.; Springer: New York, NY, USA, 1982. [Google Scholar]
- Cheon, J.; Cho, H. Power allocation scheme for non-orthogonal multiple access in underwater acoustic communications. Sensors 2017, 17, 2465. [Google Scholar] [CrossRef] [PubMed]
- Jing, L.; He, C.; Ding, Z. Z Energy management and power allocation for underwater acoustic sensor network. IEEE Sens. J. 2017, 17, 6451–6462. [Google Scholar] [CrossRef]
- Stojanovic, M.; Zorzi, M. On joint frequency and power allocation in a cross-layer protocol for underwater acoustic networks. IEEE J. Ocean. Eng. 2010, 35, 936–947. [Google Scholar]
- IST-4-027756 WINNER II D1.1.2 V1.0 WINNER II Channel Models. Available online: http://www.ero.dk/6799B797-53CC-417E-B6FA-059A8E6AF350?frames=no& (accessed on 24 October 2019).
- 3GPP TS 36.211 V8.9.0, Physical Channels and Modulation. 2010. Available online: https://www.etsi.org/deliver/etsi_ts/136200_136299/136211/08.09.00_60/ts_136211v080900p.pdf (accessed on 24 October 2019).
- 3GPP TS 36.212 V8.8.0, Multiplexing and Channel Coding. 2010. Available online: https://www.etsi.org/deliver/etsi_ts/136200_136299/136212/08.08.00_60/ts_136212v080800p.pdf (accessed on 24 October 2019).
- 3GPP TS 36.213 V8.8.0, Physical Layer Procedures. 2009. Available online: https://www.etsi.org/deliver/etsi_ts/136200_136299/136213/08.08.00_60/ts_136213v080800p.pdf (accessed on 24 October 2019).


| CQI | Modulations with Repetition Patterns | Code Rate | SNR (dB) |
|---|---|---|---|
| 1 | BPSK, RP12 | 1/2 | −3.6 |
| 2 | BPSK, RP4 | 1/2 | −0.6 |
| 3 | BPSK, RP3 | 1/2 | 0.1 |
| 4 | QPSK, RP3 | 1/2 | 2.9 |
| 5 | BPSK, RP1 | 1/2 | 3.4 |
| 6 | 16QAM, RP4 | 1/2 | 6.1 |
| 7 | QPSK, RP1 | 1/2 | 6.9 |
| 8 | 16QAM, RP3 | 1/2 | 7.2 |
| 9 | 16QAM, RP1 | 1/2 | 10.4 |
| Parameters | Values |
|---|---|
| Carrier Frequency | 5.5 kHz |
| Bandwidth | 5 kHz |
| No. of UBSCs | 1-tier, 7 Sites |
| Inter-site Distance | 4 km |
| No. of UBSs | 21 |
| Distances of UBSs from the UBSC | 10 km, 5 km, 1 km (long, medium, short distances) |
| Antenna Pattern | Omni-directional |
| Transmission Power | 46.989 dBm |
| Channel Model | Ambient Noise Pathloss Fading Channel Model |
| Transmission Modes | SISO (Single Input Single Output) |
| Effective SINR (Signal to Interference and Noise Ratio) | EESM (Exponential Effective SINR Mapping) |
| Scheduling | Proportional Fair |
| MCS (Modulation and Coding Scheme) | CR (Code Rate) | PB (Power Boosting): 0 dB | PB: 3 dB | PB: 4.7 dB | PB: 6 dB |
|---|---|---|---|---|---|
| BPSK, RP1 | 1/2 | 13.72 | 12.62 | 13.06 | 12.7 |
| QPSK, RP1 | 1/2 | 16.15 | 15.31 | 14.83 | 15 |
| 16QAM, RP1 | 1/2 | 22.72 | 21.8 | 21.75 | 22.09 |
| Average SNR at BLER 10−1 | 1/2 | 17.53 | 16.57 | 16.54 | 16.59 |
| CQI | MCS | CR | Case 0 [PB: 0 dB SNR dB] | Case 2 [PB: 3 dB SNR dB] |
|---|---|---|---|---|
| 1 | BPSK, RP12 | 1/2 | −2.4 | −3.6 |
| 2 | BPSK, RP8 | 1/2 | −1.8 | −3.4 |
| 3 | BPSK, RP4 | 1/2 | −0.2 | −1.99 |
| 4 | BPSK, RP3 | 1/2 | 0.75 | −1.2 |
| 5 | QPSK, RP3 | 1/2 | 1.7 | −0.4 |
| 6 | BPSK, RP1 | 1/2 | 2.95 | 0.9 |
| 7 | QPSK, RP1 | 1/2 | 4.5 | 3.8 |
| 8 | 16QAM, RP3 | 1/2 | 5.6 | 4.2 |
| 9 | 16QAM, RP1 | 1/2 | 8.9 | 8.2 |
| Fading Channel Models | Case 0 [P0 (kbps)] | Case 2 [P2 (kbps)] |
|---|---|---|
| South Sea | 293.9 | 309.4 |
| twelve-path Rician | 168 | 193 |
| West Sea | 46.7 | 54.6 |
| South Sea Channel (At 5 dB SNR Threshold) | 12-path Rician Channel (At 0 dB SNR Threshold) | West Sea Channel (At −5 dB SNR Threshold) | |||
|---|---|---|---|---|---|
| P0 | P2 | P0 | P2 | P0 | P2 |
| 24% | 16% | 24% | 21% | 33% | 24% |
© 2019 by the authors. Licensee MDPI, Basel, Switzerland. This article is an open access article distributed under the terms and conditions of the Creative Commons Attribution (CC BY) license (http://creativecommons.org/licenses/by/4.0/).
Share and Cite
Ahmad, I.; Chang, K. Downlink Power Allocation Strategy for Next-Generation Underwater Acoustic Communications Networks. Electronics 2019, 8, 1297. https://doi.org/10.3390/electronics8111297
Ahmad I, Chang K. Downlink Power Allocation Strategy for Next-Generation Underwater Acoustic Communications Networks. Electronics. 2019; 8(11):1297. https://doi.org/10.3390/electronics8111297
Chicago/Turabian StyleAhmad, Ishtiaq, and KyungHi Chang. 2019. "Downlink Power Allocation Strategy for Next-Generation Underwater Acoustic Communications Networks" Electronics 8, no. 11: 1297. https://doi.org/10.3390/electronics8111297
APA StyleAhmad, I., & Chang, K. (2019). Downlink Power Allocation Strategy for Next-Generation Underwater Acoustic Communications Networks. Electronics, 8(11), 1297. https://doi.org/10.3390/electronics8111297