Impact of Aging on Three-Dimensional Facial Verification


Abstract
1. Introduction
2. Materials and Methods
2.1. Face Template Construction
2.2. 3D Face Forward Aging Model (3D F-FAM)
3. Performance Evaluation Protocol
4. 3D Face Verification Process
5. Results
5.1. Database Collection
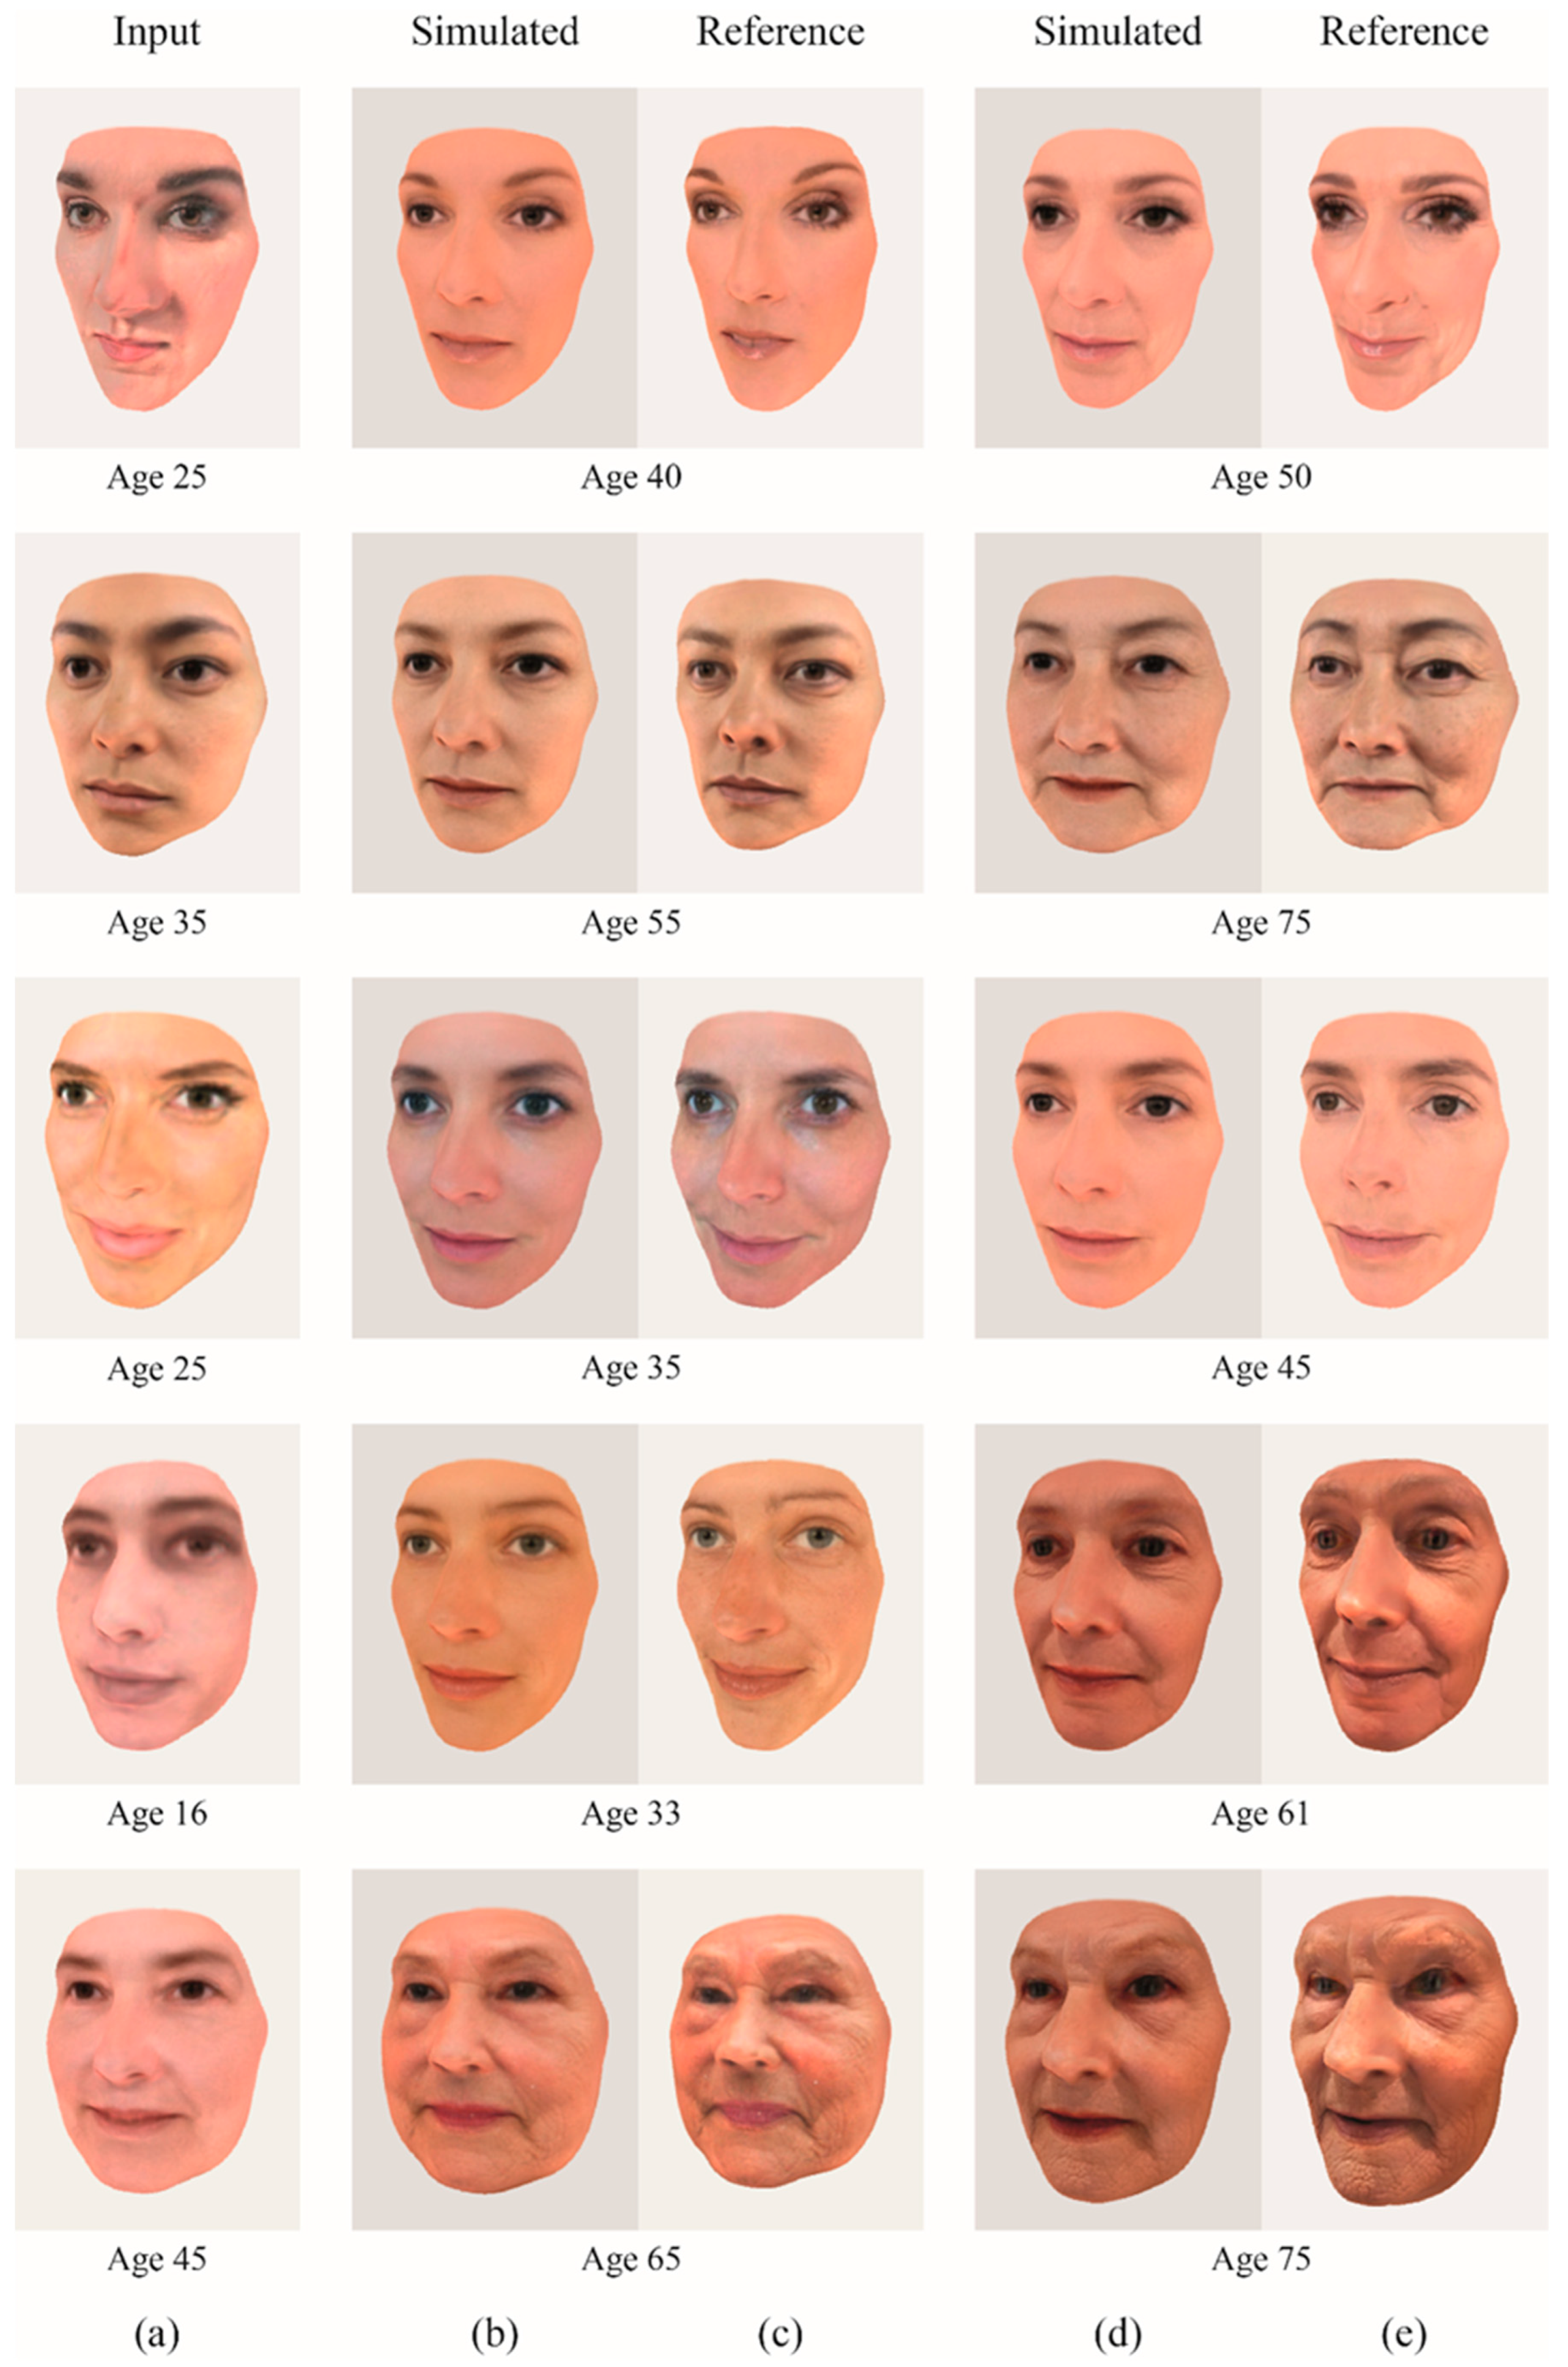
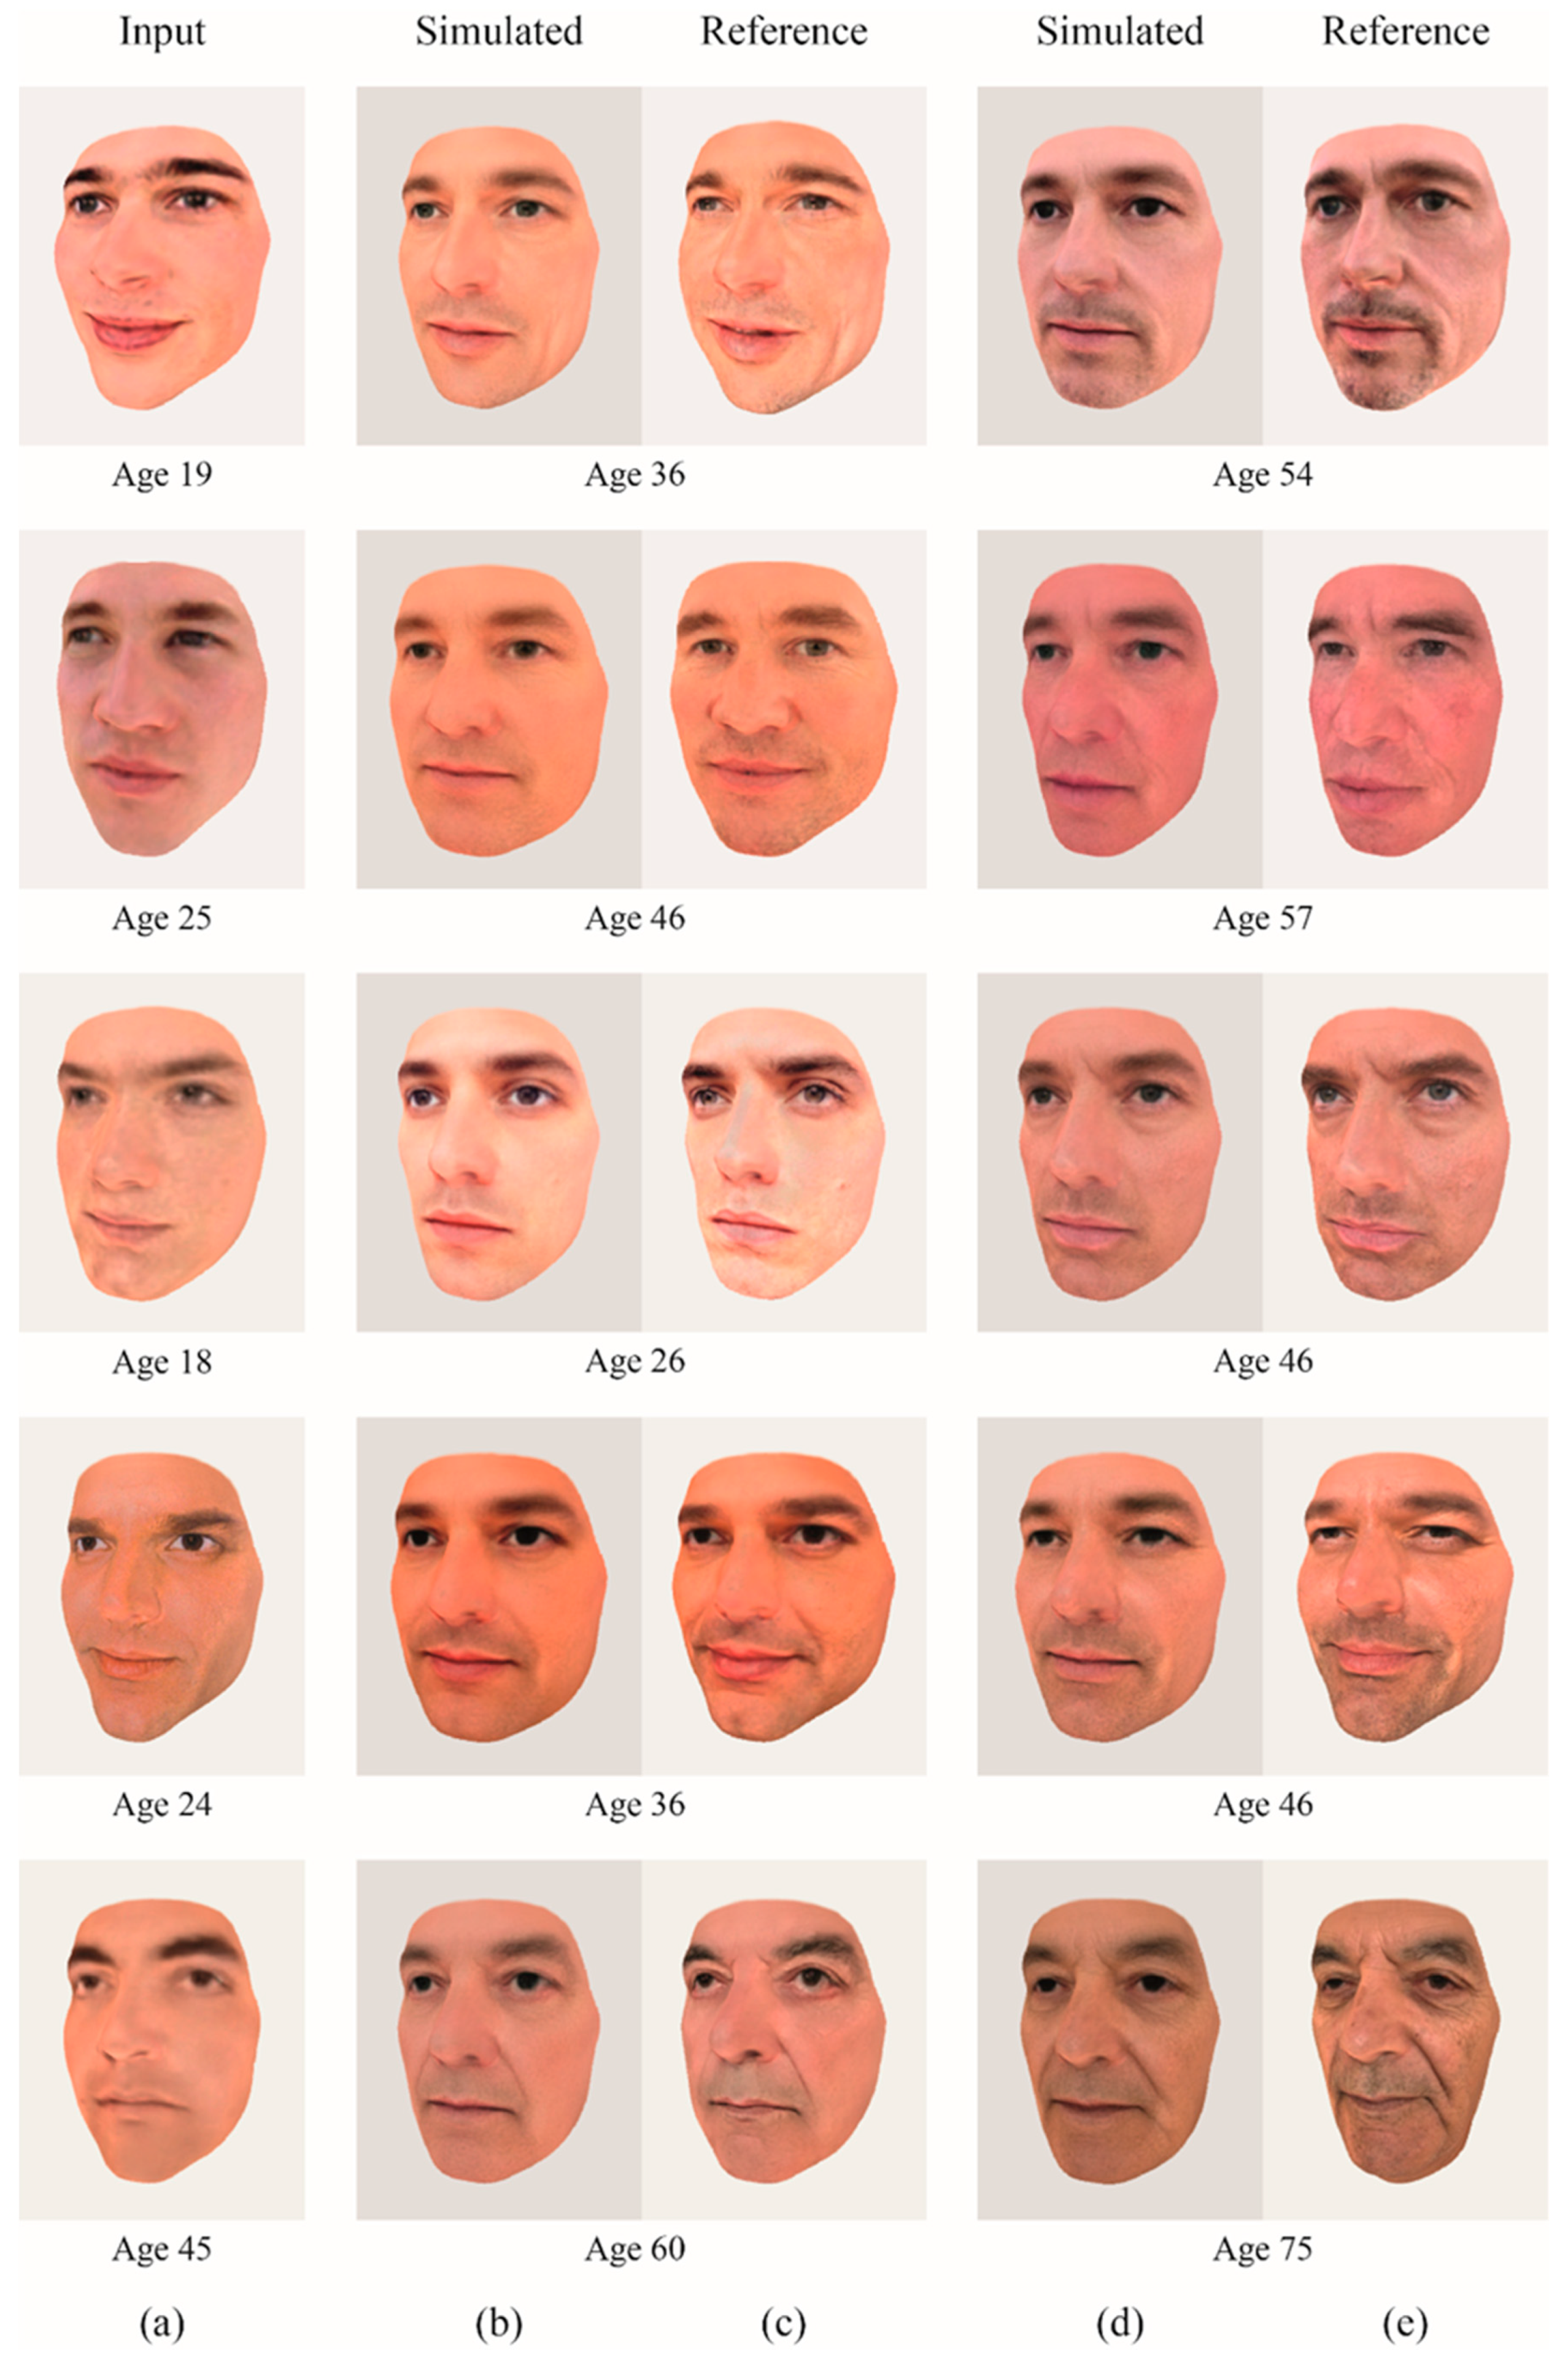
5.2. Face Renderings Using the Proposed 3D Model
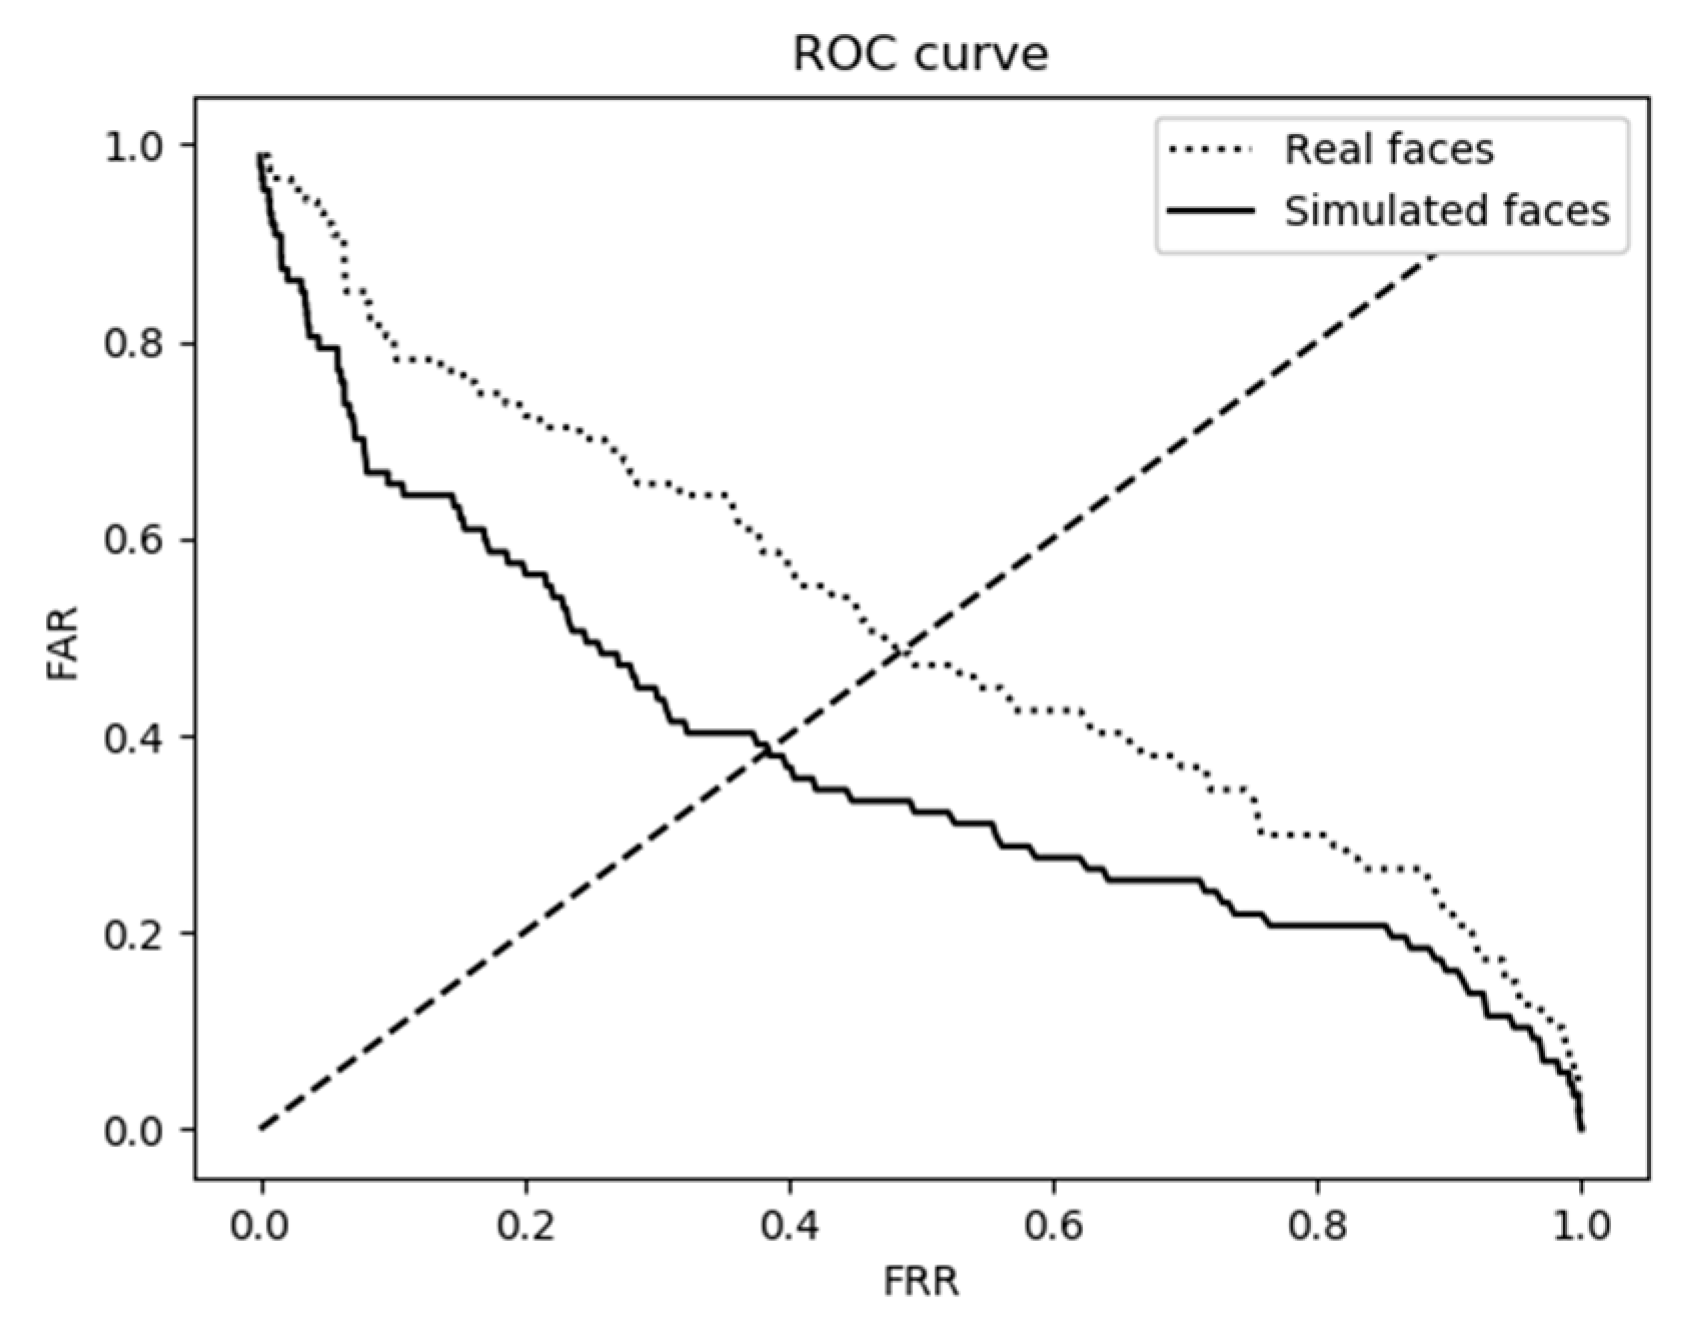
5.3. Performance Evaluation Results
5.4. Objective Comparison of 3D Facial Verification
6. Discussion and Conclusions
Author Contributions
Funding
Conflicts of Interest
References
- Fitzgerald, R.; Graivier, M.H.; Kane, M.; Lorenc, Z.P.; Vleggaar, D.; Werschler, W.P.; Kenkel, J.M. Update on Facial Aging. Aesthetic Surg. J. 2010, 30, 11S–24S. [Google Scholar] [CrossRef] [PubMed]
- Castelo-Branco, C.; Duran, M.; Gonzalez-Merlo, J. Skin collagen changes related to age and hormone replacement therapy. Maturitas 1992, 15, 113–119. [Google Scholar] [CrossRef]
- Burt, D.M.; Perrett, D.I. Perception of Age in Adult Caucasian Male Faces: Computer Graphic Manipulation of Shape and Colour Information. Proc. R. Soc. B Biol. Sci. 1995, 259, 137–143. [Google Scholar]
- Rowland, D.A.; Perrett, D.I. Manipulating Facial Appearance through Shape and Color. IEEE Comput. Graph. Appl. 1995, 15, 70–76. [Google Scholar] [CrossRef]
- Pitanguy, I.; Leta, F.; Pamplona, D.; Weber, H.I. Defining and measuring aging parameters. Appl. Math. Comput. 1996, 78, 217–227. [Google Scholar] [CrossRef]
- Leta, F.R.; Conci, A.; Pamplona, D.; Pitanguy, I. Manipulating Facial Appearance Through Age Parameters. Proc. Ninth Brazilian Symp. Comput. Graph. Image Process. 1996, 167–172. [Google Scholar]
- Pitanguy, I.; Pamplona, D.; Weber, H.I.; Leta, F.; Salgado, F.; Radwanski, H.N. Numerical modeling of facial aging. Plast. Reconstr. Surg. 1998, 102, 200–204. [Google Scholar] [CrossRef]
- Tiddeman, B.P.; Burt, D.M.; Perrett, D.I. Prototyping and transforming facial texture for perception research. IEEE Comput. Graph. Appl. 2001, 21, 42–50. [Google Scholar] [CrossRef]
- Tiddeman, B.P.; Stirrat, M.R.; Perrett, D.I. Towards realism in facial image transformation: Results of a wavelet MRF method. Comput. Graph. Forum 2005, 24, 449–456. [Google Scholar] [CrossRef]
- Lanitis, A.; Taylor, C.J.; Cootes, T.F. Toward automatic simulation of aging effects on face images. IEEE Trans. Pattern Anal. Mach. Intell. 2002, 24, 442–455. [Google Scholar] [CrossRef]
- Scandrett, C.M.; Solomon, C.J.; Gibson, S.J. A person-specific, rigorous aging model of the human face. Pattern Recognit. Lett. 2006, 27, 1776–1787. [Google Scholar] [CrossRef]
- Ramanathan, N.; Chellappa, R. Modeling age progression in young faces. In Proceedings of the 2006 IEEE Computer Society Conference on Computer Vision and Pattern Recognition, New York, NY, USA, 17–22 June 2006; Volume 1, pp. 387–394. [Google Scholar]
- Ramanathan, N.; Chellappa, R.; Biswas, S. Age progression in Human Faces: A Survey. J. Vis. Lang. Comput. 2009, 15, 3349–3361. [Google Scholar]
- Wu, Y.; Thalmann, N.M.; Thalmann, D. A dynamic wrinkle model in facial animation and skin ageing. J. Vis. Comput. Animat. 1995, 6, 195–205. [Google Scholar] [CrossRef]
- O’Toole, A.J.; Price, T.; Vetter, T.; Bartlett, J.C.; Blanz, V. 3D shape and 2D surface textures of human faces: The role of ‘averages’ in attractiveness and age. Image Vis. Comput. 1999, 18, 9–19. [Google Scholar] [CrossRef]
- O’toole, A.J.; Vetter, T.; Volz, H.; Salter, E.M. Three-dimensional caricatures of human heads: Distinctiveness and the perception of facial age. Perception 1997, 26, 719–732. [Google Scholar] [CrossRef] [PubMed]
- Suo, J.; Min, F.; Zhu, S. A Multi-Resolution Dynamic Model for Face Aging Simulation. In Proceedings of the 2007 IEEE Conference on Computer Vision and Pattern Recognitio, Minneapolis, MN, USA, 18–23 June 2007; pp. 1–8. [Google Scholar]
- Kemelmacher-Shlizerman, I.; Suwajanakorn, S.; Seitz, S.M. Illumination-aware age progression. In Proceedings of the 2014 IEEE Conference on Computer Vision and Pattern Recognition 2014, Columbus, OH, USA, 23–28 June 2014; pp. 3334–3341. [Google Scholar]
- Shu, X.; Tang, J.; Lai, H.; Liu, L.; Yan, S. Personalized Age Progression with Aging Dictionary. In Proceedings of the 2015 IEEE International Conference on Computer Vision, Santiago, Chile, 7–13 December 2015; pp. 3970–3978. [Google Scholar]
- Tsai, M.; Liao, Y.; Lin, I. Human face aging with guided prediction and detail synthesis. Multimed. Tools Appl. 2014, 72, 801–824. [Google Scholar] [CrossRef]
- Sagonas, C.; Panagakis, Y.; Arunkumar, S.; Ratha, N.; Zafeiriou, S. Back to the future: A fully automatic method for robust age progression. In Proceedings of the 23rd International Conference on Pattern Recognition (ICPR), Cancun, Mexico, 4–8 December 2016; pp. 4226–4231. [Google Scholar]
- Yang, H.; Huang, D.; Wang, Y.; Wang, H.; Tang, Y. Face Aging Effect Simulation Using Hidden Factor Analysis Joint Sparse Representation. IEEE Trans. Image Process. 2016, 25, 2493–2507. [Google Scholar] [CrossRef]
- Antipov, G.; Dugelay, J. Face aging with conditional generative adversarial networks. In Proceedings of the 2017 IEEE International Conference on Image Processing (ICIP), Beijing, China, 17–20 September 2017; pp. 2089–2093. [Google Scholar]
- Zhang, Z.; Song, Y.; Qi, H. Age Progression/Regression by Conditional Adversarial Autoencoder. In Proceedings of the IEEE Conference on Computer Vision and Pattern Recognition, Honolulu, HI, USA, 21–26 July 2017. [Google Scholar]
- Li, Y. (Li Yuancheng); Li, Y. (Yan Li). Face aging effect simulation model based on multilayer representation and shearlet transform. J. Electron. Imaging 2017, 26, 053011. [Google Scholar] [CrossRef]
- Shen, C.T.; Huang, F.; Lu, W.H.; Shih, S.W.; Liao, H.Y.M. 3D age progression prediction in children’s faces with a small exemplar-image set. J. Inf. Sci. Eng. 2014, 30, 1131–1148. [Google Scholar]
- Park, U.; Tong, Y.; Jain, A.K. Age-Invariant Face Recognition. IEEE Trans. Pattern Anal. Mach. Intell. 2010, 32, 947–954. [Google Scholar] [CrossRef]
- Maronidis, A.; Lanitis, A. Facial age simulation using age-specific 3D models and recursive PCA. In Proceedings of the International Conference on Computer Vision Theory and Applications (VISAPP 2013), Barcelona, Spain, 21–24 February 2013; Volume 1. [Google Scholar]
- Blanz, V.; Vetter, T. A Morphable Model For The Synthesis Of 3D Faces. Siggraph 1999, 99, 187–194. [Google Scholar]
- Park, U.; Tong, Y.; Jain, A.K. Face recognition with temporal invariance: A 3D aging model. In Proceedings of the 2008 8th IEEE International Conference on Automatic Face & Gesture Recognition, Amsterdam, The Netherlands, 17–19 September 2008; pp. 1–7. [Google Scholar]
- Scherbaum, K.; Sunkel, M.; Seidel, H.P.; Blanz, V. Prediction of individual non-linear aging trajectories of faces. Comput. Graph. Forum 2007, 26, 285–294. [Google Scholar] [CrossRef]
- Suo, J.; Zhu, S.; Shan, S.; Chen, X. A Compositional and Dynamic Model for Face Aging. IEEE Trans. Pattern Anal. Mach. Intell. 2010, 32, 385–401. [Google Scholar] [PubMed]
- Sagonas, C.; Panagakis, Y.; Leidinger, A.; Zafeiriou, S. Robust Joint and Individual Variance Explained. In Proceedings of the IEEE Conference on Computer Vision and Pattern Recognition, Honolulu, HI, USA, 21–26 July 2017; pp. 5739–5748. [Google Scholar]
- Hall, J.; Allanson, J.; Gripp, K.; Slavotinek, A. Handbook of Physical Measurements; Oxford University Press: Oxford, UK, 2006. [Google Scholar]
- Wang, Z.; Bovik, A.C.; Sheikh, H.R.; Simoncelli, E.P. Image quality assessment: From error visibility to structural similarity. IEEE Trans. Image Process. 2004, 13, 600–612. [Google Scholar] [CrossRef] [PubMed]
- Lavoue, G.; Corsini, M. A comparison of perceptually-based metrics for objective evaluation of geometry processing. IEEE Trans. Multimed. 2010, 12, 636–649. [Google Scholar] [CrossRef]
- Urbanová, P. Performance of distance-based matching algorithms in 3D facial identification. Egypt. J. Forensic Sci. 2016, 6, 135–151. [Google Scholar] [CrossRef]
- Farazdaghi, E. Facial Ageing and Rejuvenation Modeling Including Lifestyle Behaviours, Using Biometrics-Based Approaches; Université Paris-Est: Paris, France, 2017. [Google Scholar]
- Farazdaghi, E.; Nait-Ali, A. Backward face ageing model (B-FAM) for digital face image rejuvenation. IET Biom. 2017, 6, 478–486. [Google Scholar] [CrossRef]
- Guo, J.; Vidal, V.; Cheng, I.; Basu, A.; Baskurt, A.; Lavoue, G. Subjective and Objective Visual Quality Assessment of Textured 3D Meshes. ACM Trans. Appl. Percept. 2016, 14, 1–20. [Google Scholar] [CrossRef]


| Author | Dimension | Approach | Texture | Shape | Database | Year |
|---|---|---|---|---|---|---|
| Burt et al. [3] | 2D | Prototype-based | Yes | Yes | 147 Caucasian males aged between 20 and 62 | 1995 |
| Rowland et al. [4] | 2D | Prototype-based | Yes | Yes | Collection 1: 40 males aged between 25 and 29 Collection 2: 20 males aged between 50 and 54 | 1995 |
| Wu et al. [14] | 2D | Wrinkle model | Yes | No | No learning database | 1995 |
| Pitanguy et al. [5,6,7] | 2D | Numerical-based analysis | No | Yes | 50 females aged between 25 and 65 | 1996 & 1998 |
| O’Tool et al. [15,16] | 3D | PCA-based | Yes | Yes | 50 male and 50 female with the mean age of 26.9 years | 1999 |
| Tiddeman et al. [8,9] | 2D | Wavelet, prototype-based | Yes | Yes | No learning database | 2001 & 2005 |
| Lanitis et al. [10] | 2D | Statistical appearance-based | Yes | Yes | 500 face images of 60 subjects | 2002 |
| Scandrett et al. [11] | 2D | PCA-based | Yes | Yes | 329 males and 329 females from FG-NET{ TA \1 “FG-NET: Face and gesture recognition network” \s “FG-NET” \c 1 } | 2006 |
| Ramanathan et al. [12,13] | 2D | Anthropometrical growth | No | Yes | 233 images of 109 individuals | 2006 & 2008 |
| Scherbaum et al. [31] | 3D | Nonlinear SVR{ TA \1 “SVR: Support Vector Machine Regression” \s “SVR” \c 1 } function | Yes | Yes | 3D scans of 125 males and 113 females | 2007 |
| Suo et al. [32] | 2D | And-Or graph, Markov chain | Yes | Yes | 50,000 photos of Asian adults aged between 20 and 80 | 2010 |
| Park et al. [27] | 3D | Weighted average | Yes | Yes | FG-Net and 132 scans of 4 subjects | 2010 |
| Tsai et al. [20] | 2D | Guided prediction | Yes | Yes | FG-NET | 2013 |
| Shen et al. [26] | 3D | Metric learning | Yes | Yes | No learning database | 2014 |
| Kemelmacher et al. [18] | 2D | IAAP{ TA \1 “IAAP: Illumination-Aware Age Progression” \s “IAAP” \c 1 } | Yes | Yes | 40K photos aged between 0 and 80 | 2014 |
| Shu et al. [19] | 2D | Dictionary learning | Yes | Yes | 800 pairs for females and 800 pairs of males aged between 0 and 80 | 2015 |
| Sagonas et al. [21] | 2D | Robust Age Progression | Yes | Yes | 160,000 images aged between 1 and 70 | 2016 |
| Yang et al. [22] | 2D | Recurrent Neural Networks | Yes | Yes | FG-NET and IRIP{ TA \1 “IRIP: Intelligent Recognition and Image Processing” \s “IRIP” \c 1 } | 2016 |
| Zhang et al. [24] | 2D | Deep learning-based (Conditional Adversarial Auto encoder – CAAE{ TA \1 “CAAE: Conditional Adversarial Auto encoder” \s “CAAE” \c 1 }) | Yes | No | 10,670 images aged between 0 and 80 | 2017 |
| Sagonas et al. [33] | 2D | Deep learning-based (RJIVE{ TA \1 “RJIVE: Robust Joint and Individual Variance Explained” \s “ RJIVE| \c 1 }) | Yes | Yes | MORPH and CACD{ TA \1 “CACD: Cross-Age Celebrity Dataset” \s “CACD” \c 1 } | 2017 |
| Antipov et al. [23] | 2D | Deep learning-based (Age-cGAN{ TA \1 “cGAN: conditional Generative Adversarial Network” \s “cGAN” \c 1}) | Yes | No | 110K images of IMDB{ TA \1 “IMDB: Internet Movie Data Base” \s “IMDB” \c 1 }-Wiki{ TA \1 “Wiki: World Internet Knowledge Index” \s “Wiki” \c 1 } cleaned dataset | 2017 |
| Ethnicity | No. of Subjects in Total | No. of Subjects in Each Group | Gender | Age Range |
|---|---|---|---|---|
| Caucasian | 900 | 180 | 90 Female 90 Male | 26–75 years old |
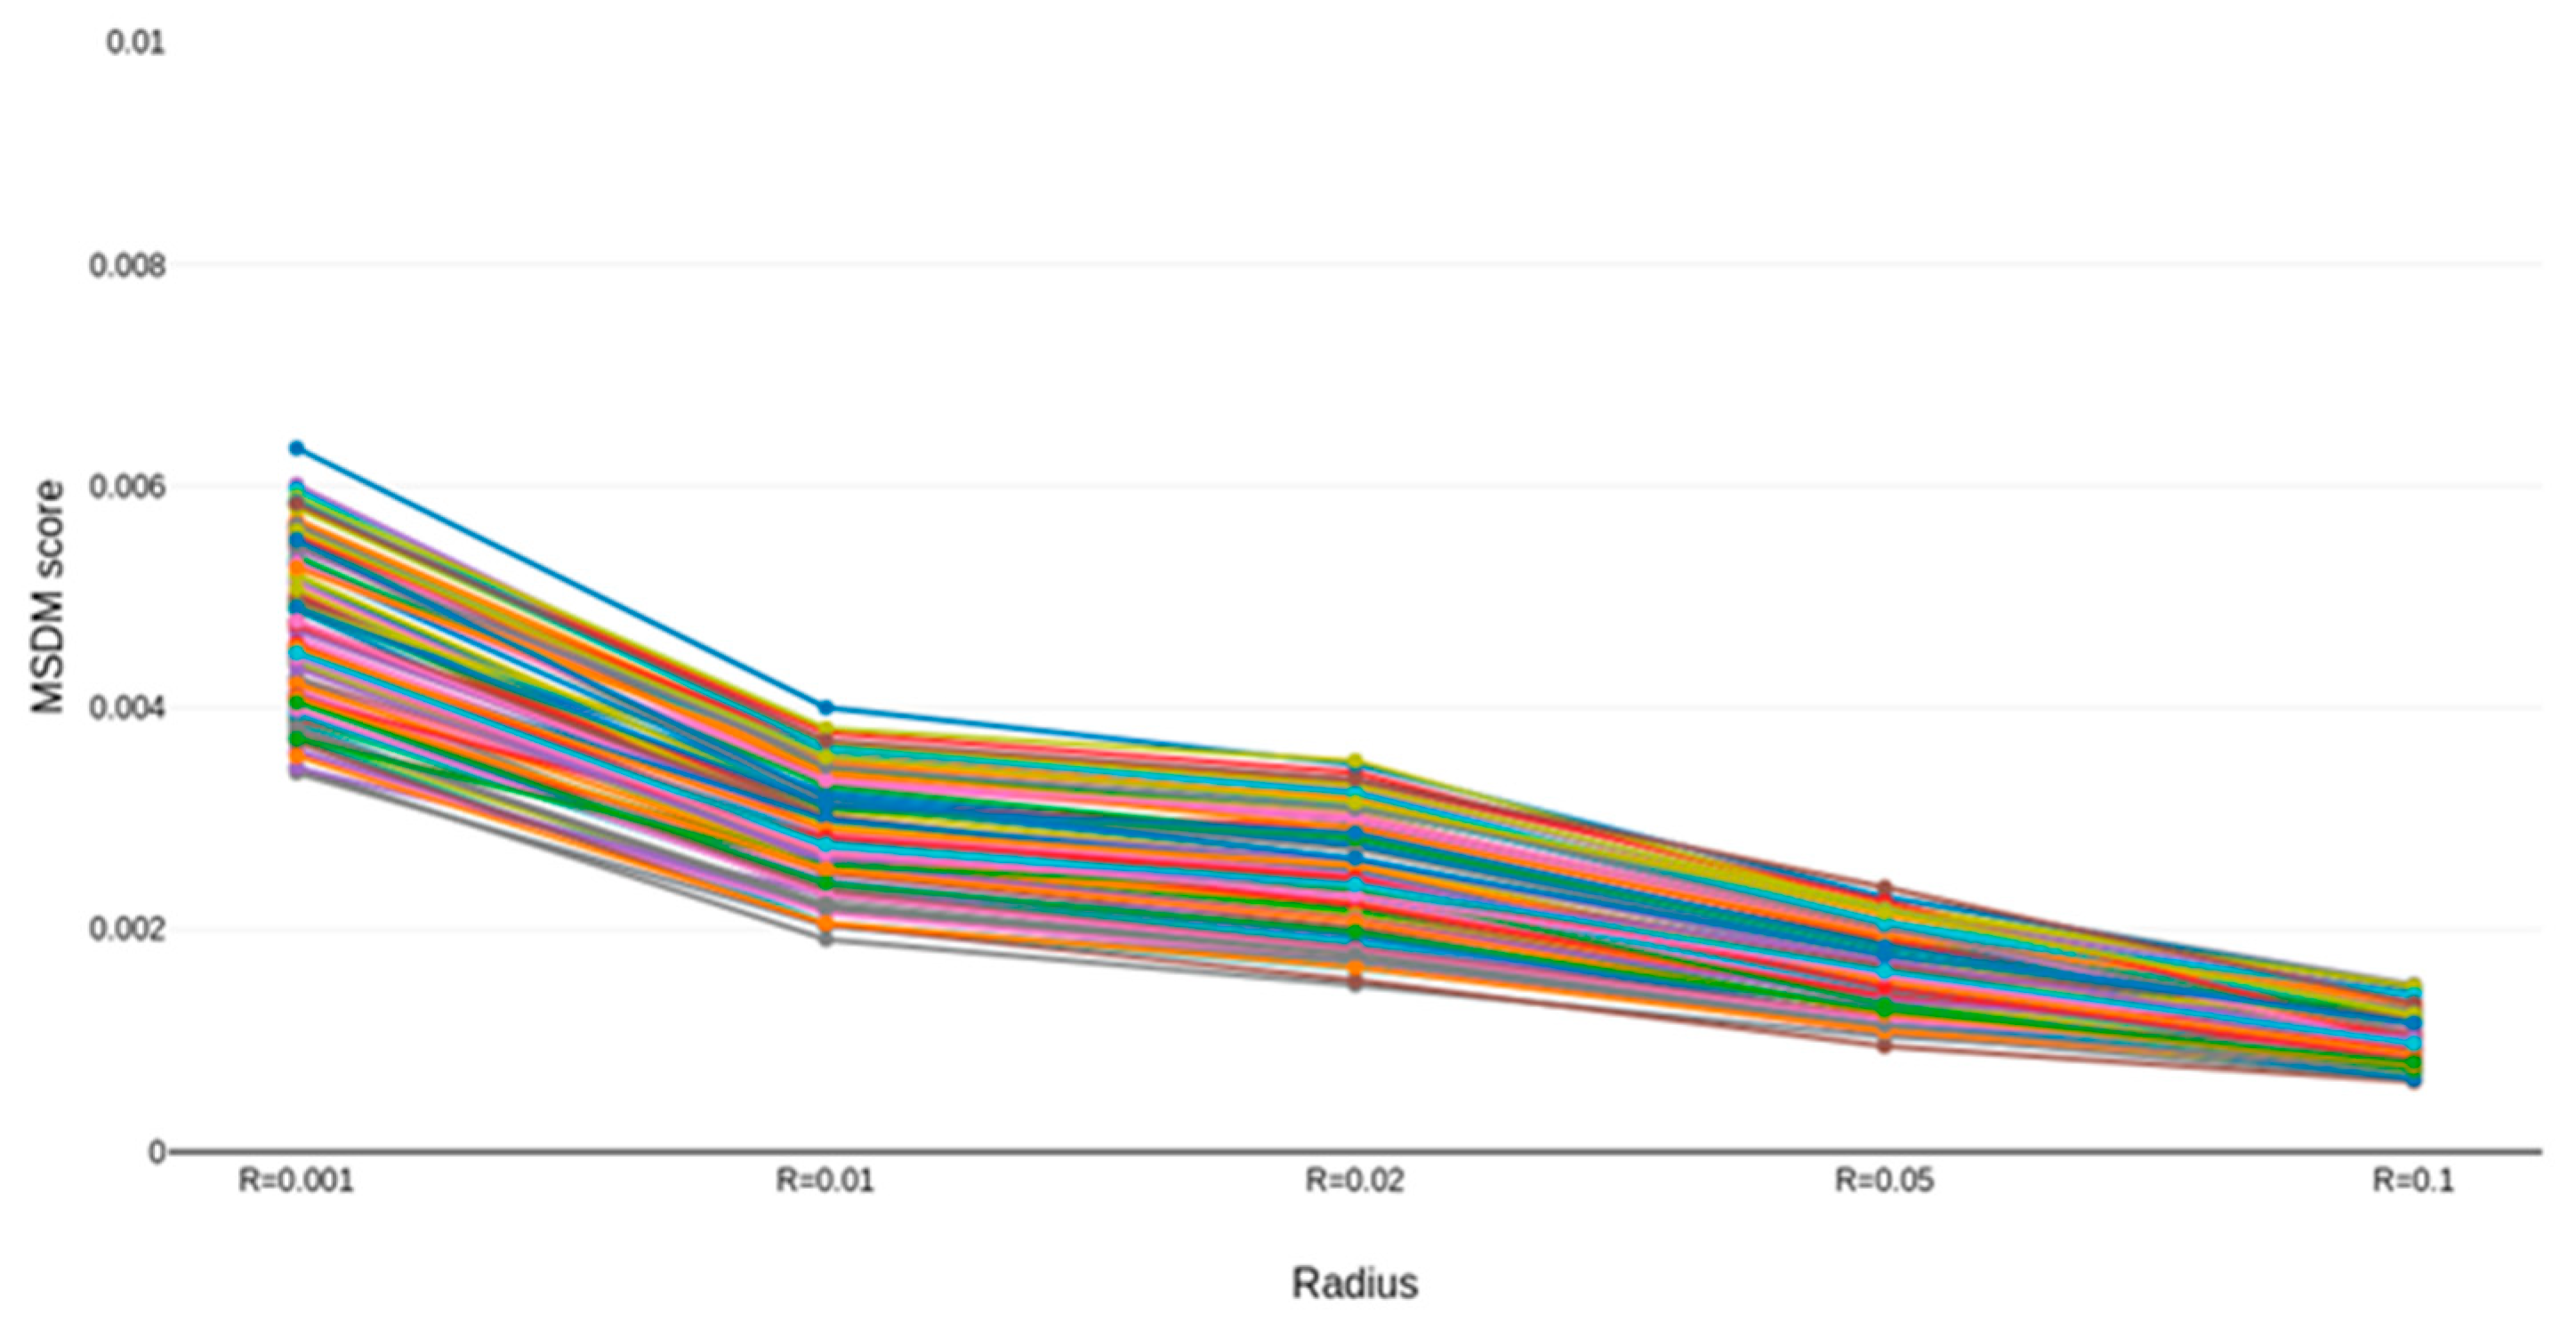
| Females & Males | Radius | ||||
|---|---|---|---|---|---|
| R = 0.001 | R = 0.01 | R = 0.02 | R = 0.05 | R = 0.1 | |
| MSDM | 0.006 | 0.004 | 0.003 | 0.002 | 0.001 |
| Gender | GPM | < 5 years | 5 < < 10 | 10 < < 20 | > 20 years |
|---|---|---|---|---|---|
| Female | SSIM MSDM FLM | 0.1737 0.2463 0.2305 | 0.1830 0.2622 0.2628 | 0.2117 0.2703 0.2712 | 0.2414 0.3064 0.2937 |
| Male | SSIM MSDM FLM | 0.2136 0.2739 0.1865 | 0.2690 0.2831 0.21516 | 0.2881 0.2936 0.2386 | 0.3034 0.3133 0.2639 |
| Method | Representation | Sensitivity | 3D F-FAM | Other Models |
|---|---|---|---|---|
| RMSE distance [11] | 2D | Texture | 67% | 55% |
| Mahalanobis distance [26] | 3D | Shape | 72% | 58% |
| Objective performance [39] | 2D | Texture | 68% | 78% |
| SSIM [35,40] | 3D | Texture | 70% | 78% |
| MSDM [36,39] | 3D | Shape | 72% | 64% |
| GPM | 3D | Texture & shape | 74% | - |
© 2019 by the authors. Licensee MDPI, Basel, Switzerland. This article is an open access article distributed under the terms and conditions of the Creative Commons Attribution (CC BY) license (http://creativecommons.org/licenses/by/4.0/).
Share and Cite
Heravi, F.M.Z.; Farazdaghi, E.; Fournier, R.; Nait-ali, A. Impact of Aging on Three-Dimensional Facial Verification. Electronics 2019, 8, 1170. https://doi.org/10.3390/electronics8101170
Heravi FMZ, Farazdaghi E, Fournier R, Nait-ali A. Impact of Aging on Three-Dimensional Facial Verification. Electronics. 2019; 8(10):1170. https://doi.org/10.3390/electronics8101170
Chicago/Turabian StyleHeravi, Farnaz Majid Zadeh, Elham Farazdaghi, Régis Fournier, and Amine Nait-ali. 2019. "Impact of Aging on Three-Dimensional Facial Verification" Electronics 8, no. 10: 1170. https://doi.org/10.3390/electronics8101170
APA StyleHeravi, F. M. Z., Farazdaghi, E., Fournier, R., & Nait-ali, A. (2019). Impact of Aging on Three-Dimensional Facial Verification. Electronics, 8(10), 1170. https://doi.org/10.3390/electronics8101170