1. Introduction
Radiomics and radiogenomics are two terms that are increasingly used in the language of those working in the field of diagnostic imaging: radiologists, nuclear physicians and medical physicists. To understand the meaning of the term radiomics, the start must be from a fundamental premise, even if not so obvious: radiological images are much more than simple anatomical figures. The new diagnostic technologies, in fact, produce in addition to the classic images by now familiar even to many not employed to the works, an enormous wealth of numerical data that simple visual observation, the so-called qualitative analysis, fails to elaborate [
1]. If these images are analyzed in detail by powerful computers through complex mathematical algorithms, it is possible to obtain objective quantitative data, capable of providing information on the underlying pathophysiological phenomena, inaccessible to simple visual analysis [
2]. Hence, the use of modern machine and deep learning methodologies for high-tech quantitative analysis, relating to medical images [
1,
2]. The modern techniques of radiomics are combined with new therapies for the treatment of oncological pathologies mainly directed towards the so-called targeted therapies such as the immunotherapy. The immune system plays an important role in recognizing and eliminating cancer cells. In cancer patients, cancer cells escape this control. The immunotherapy treatment wants to instruct or reactivate the cells of the immune system to recognize cancer cells as neoplastic cells and to eliminate them [
3].
Specifically, one of the most studied mechanisms that today allows immunotherapy to reactivate the immune system to recognize and destroy tumor neoplastic cells is based on the inhibition of the programmed death-ligand protein 1 (PD-L1). From recent retrospective and multicenter studies in immuno-oncology, it would seem that the upregulation of PD-L1 plays a key role in tumor angiogenesis and in the proliferation of neoplastic cells [
4,
5,
6]. An accurate analysis of different tumor histologies has shown that a high tumor expression of PD-L1 was associated with increased tumor aggressiveness [
4,
5,
6]. Many PD-L1 inhibitors are in the development as immuno-oncology therapies and are showing good results in clinical trials.
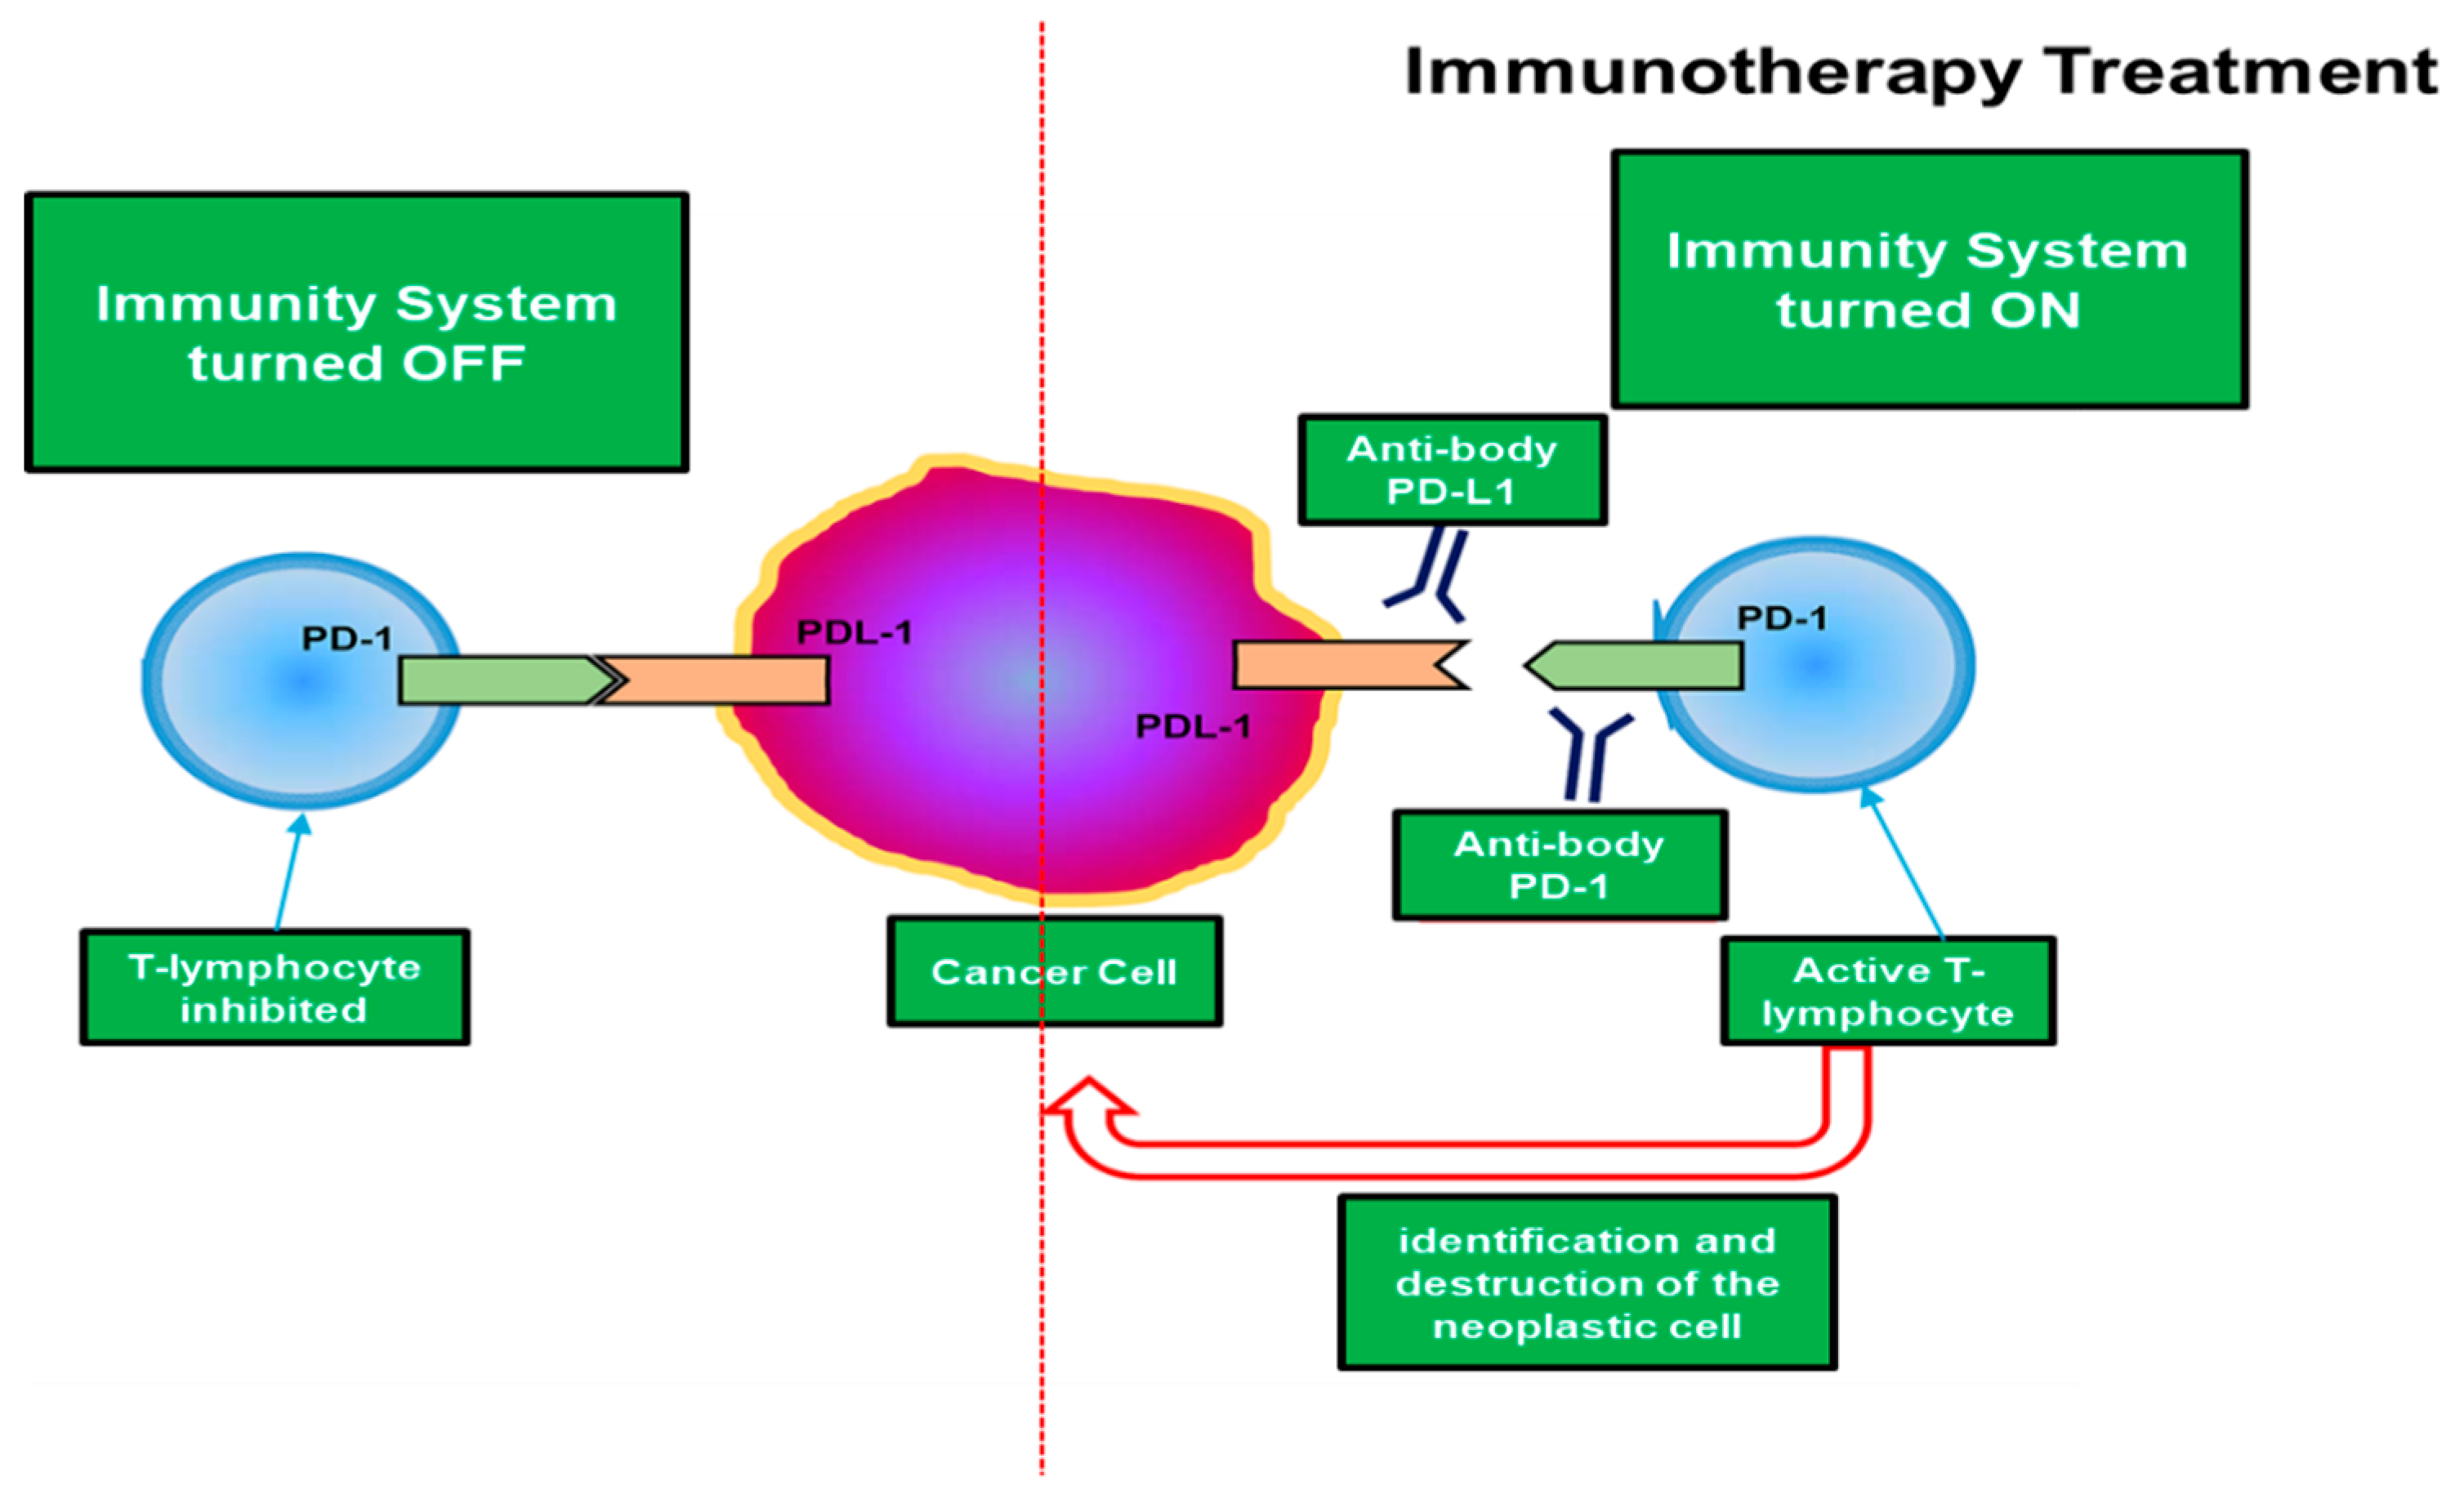
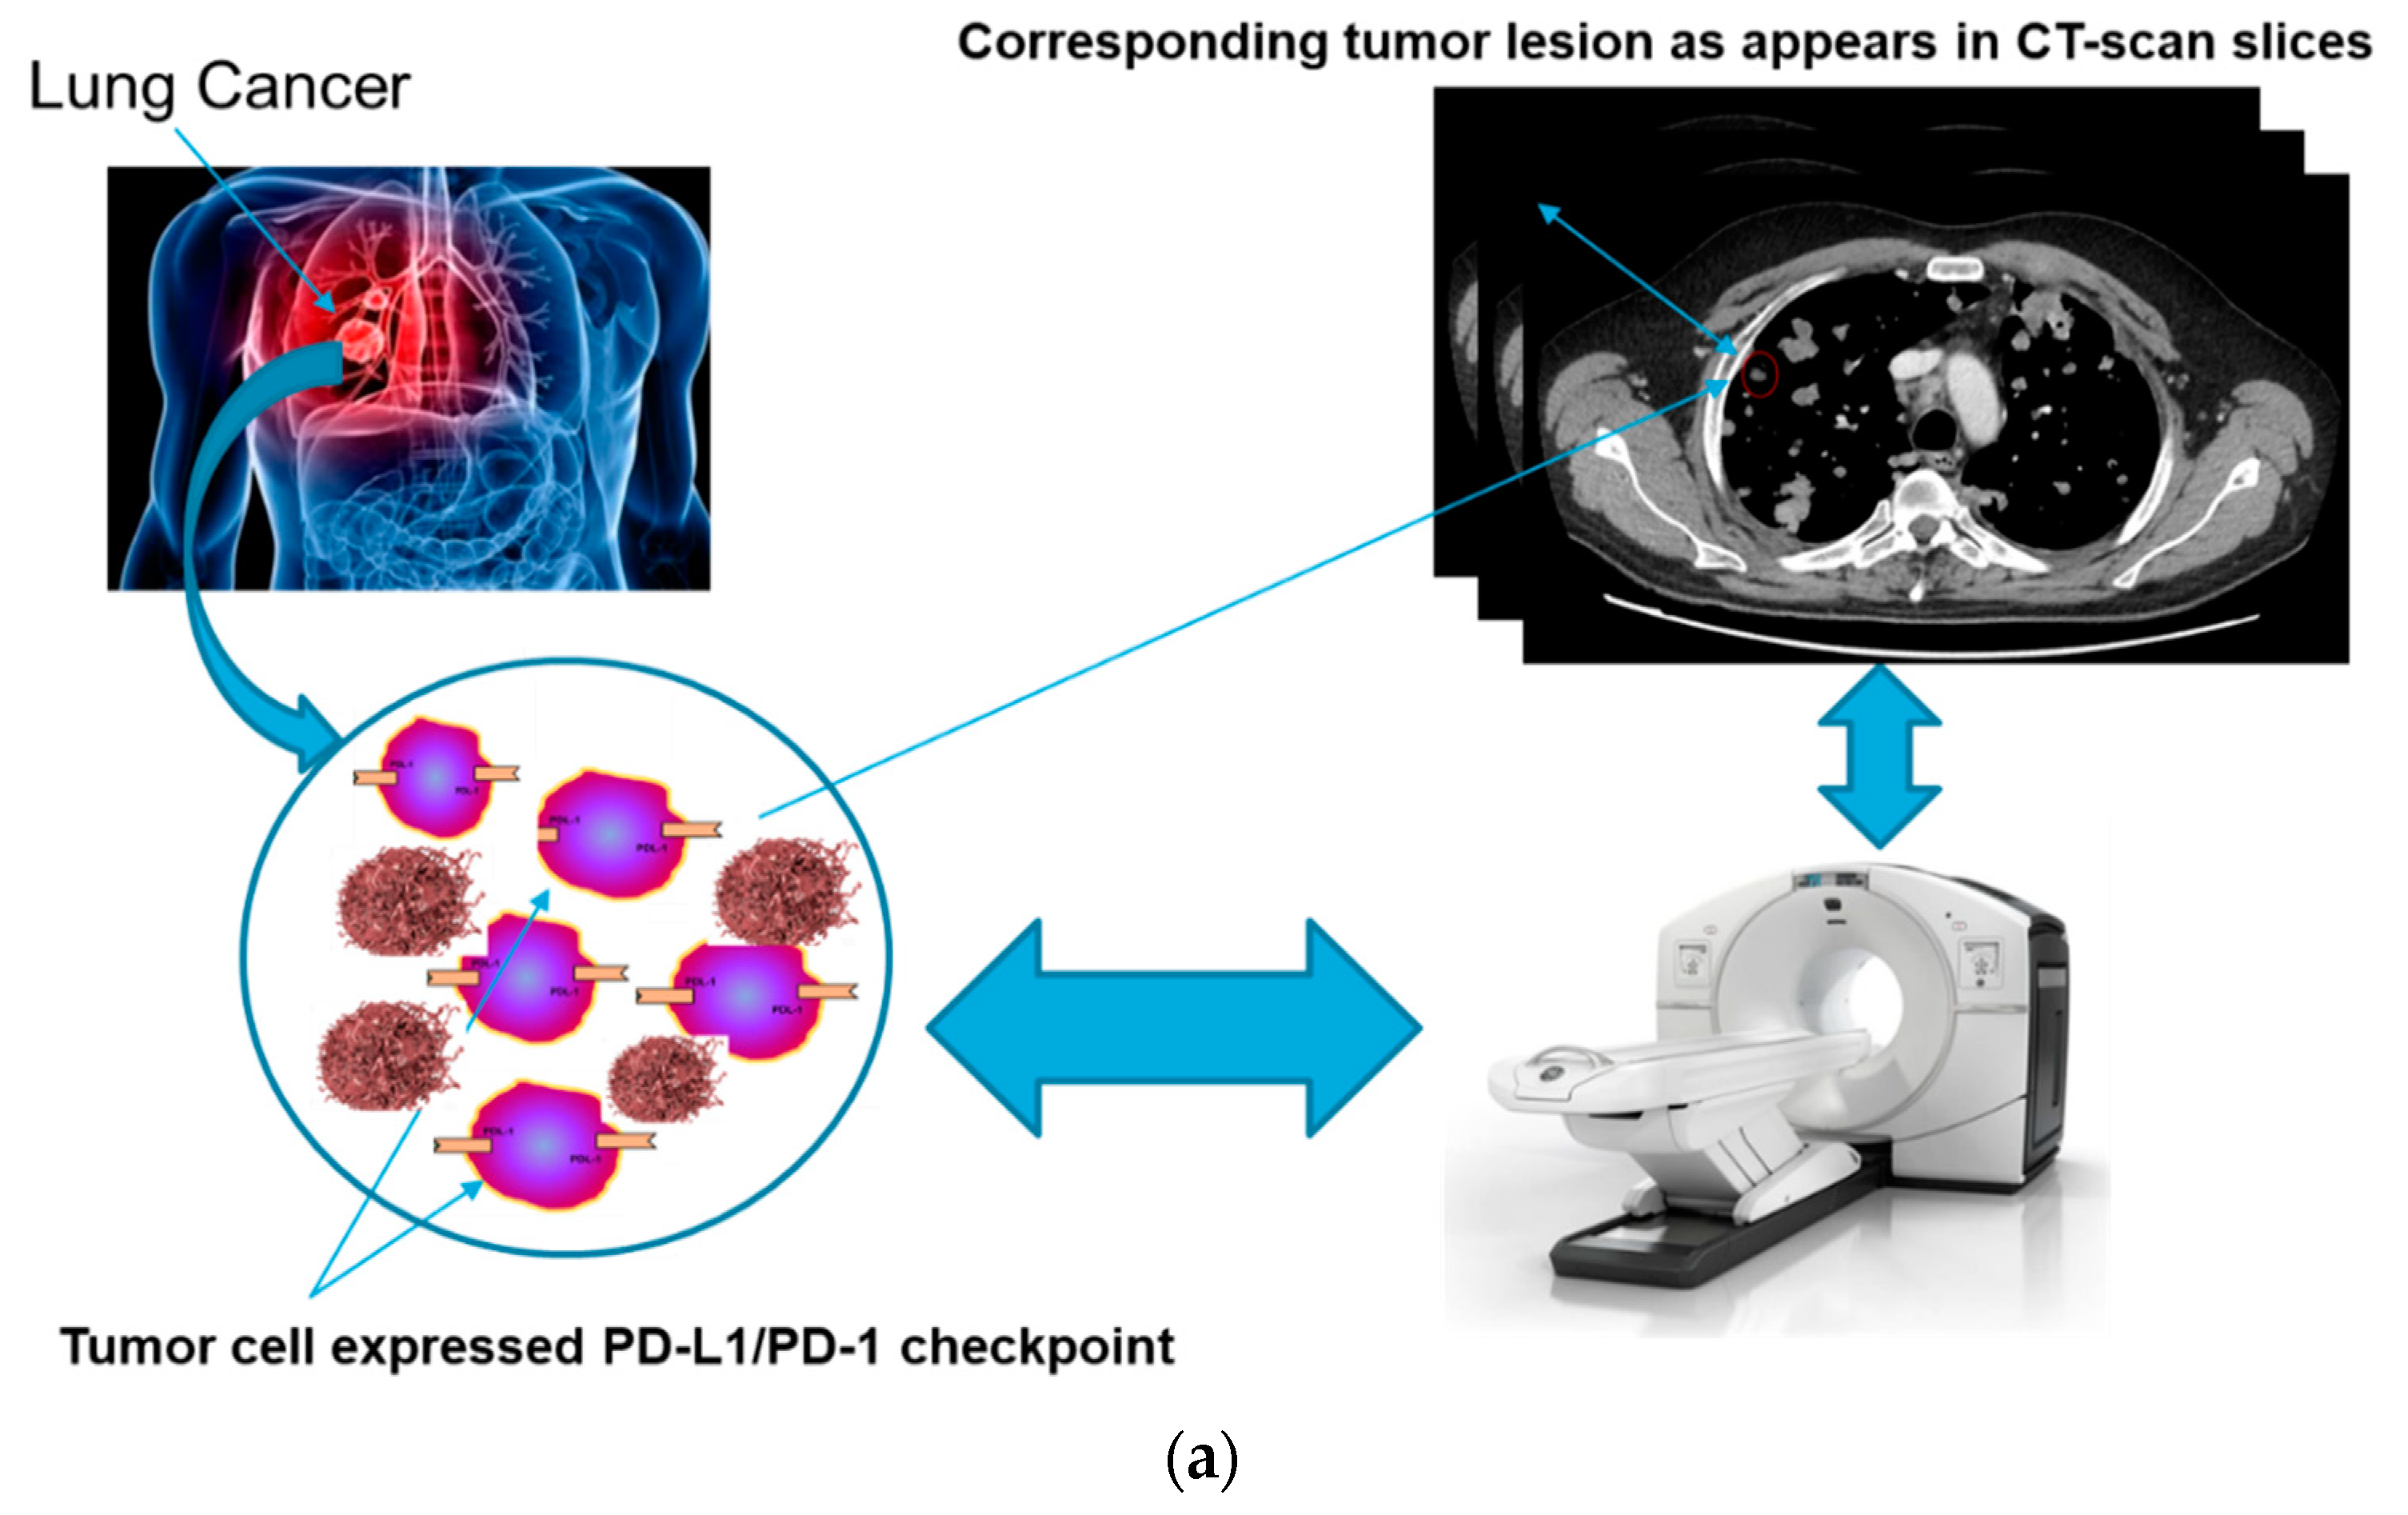
Figure 1 illustrates the mechanism by which tumor cells inhibit the common defenses of the organism by the PD-1/PD-L1 checkpoint:
As it is evident from
Figure 1, the tumor cells that contain in their surface the PD-L1 inhibitor, use this mechanism to deactivate the immune system of the host organism and therefore proliferate without particular difficulties, hence a greater aggressiveness of the tumor. Therefore, many studies are underway that aim to prepare immunotherapy drugs that inhibit the PD-1/PD-L1 checkpoint and that destroy these inhibitory pathways by restoring the antitumor activity of T cells [
7] as schematized in
Figure 1. This is the target of immunotherapy. Obviously, there are several pathways that immuno-oncology research attempts to identify in order to prepare drugs that are effective in the fight against immunotherapy. However, this paper focuses on the immunotherapeutic method aimed at inhibiting the PD-1/PD-L1 checkpoint, which is considered one of the most promising ones. Therefore, a field of very high interest is the selection of patients who may or may not benefit from immunotherapy as well as the identification of predictive response factors. Currently, it would seem that the elevated expression of the PD-L1 marker in tumor cells seems to be related to a better efficacy of immunity drugs or at least some of them [
8]. However, this correlation is not always true and depends on the type of neoplasm and its primary site and unfortunately, also by other factors that to date are not completely known to physicians. Specifically, several clinical studies show that there is a fair correlation between the efficacies of immunotherapy treatment for certain types of tumors (bladder, lung, skin, etc.) and an expression of the PD-L1 inhibitor greater than 50% [
7,
8]. However, the problem of assessing in advance the efficacy of immunotherapy from the sole quantification of PD-L1 expression in the surface of tumor cells requires an invasive biopsy in the primitive site of the tumor.
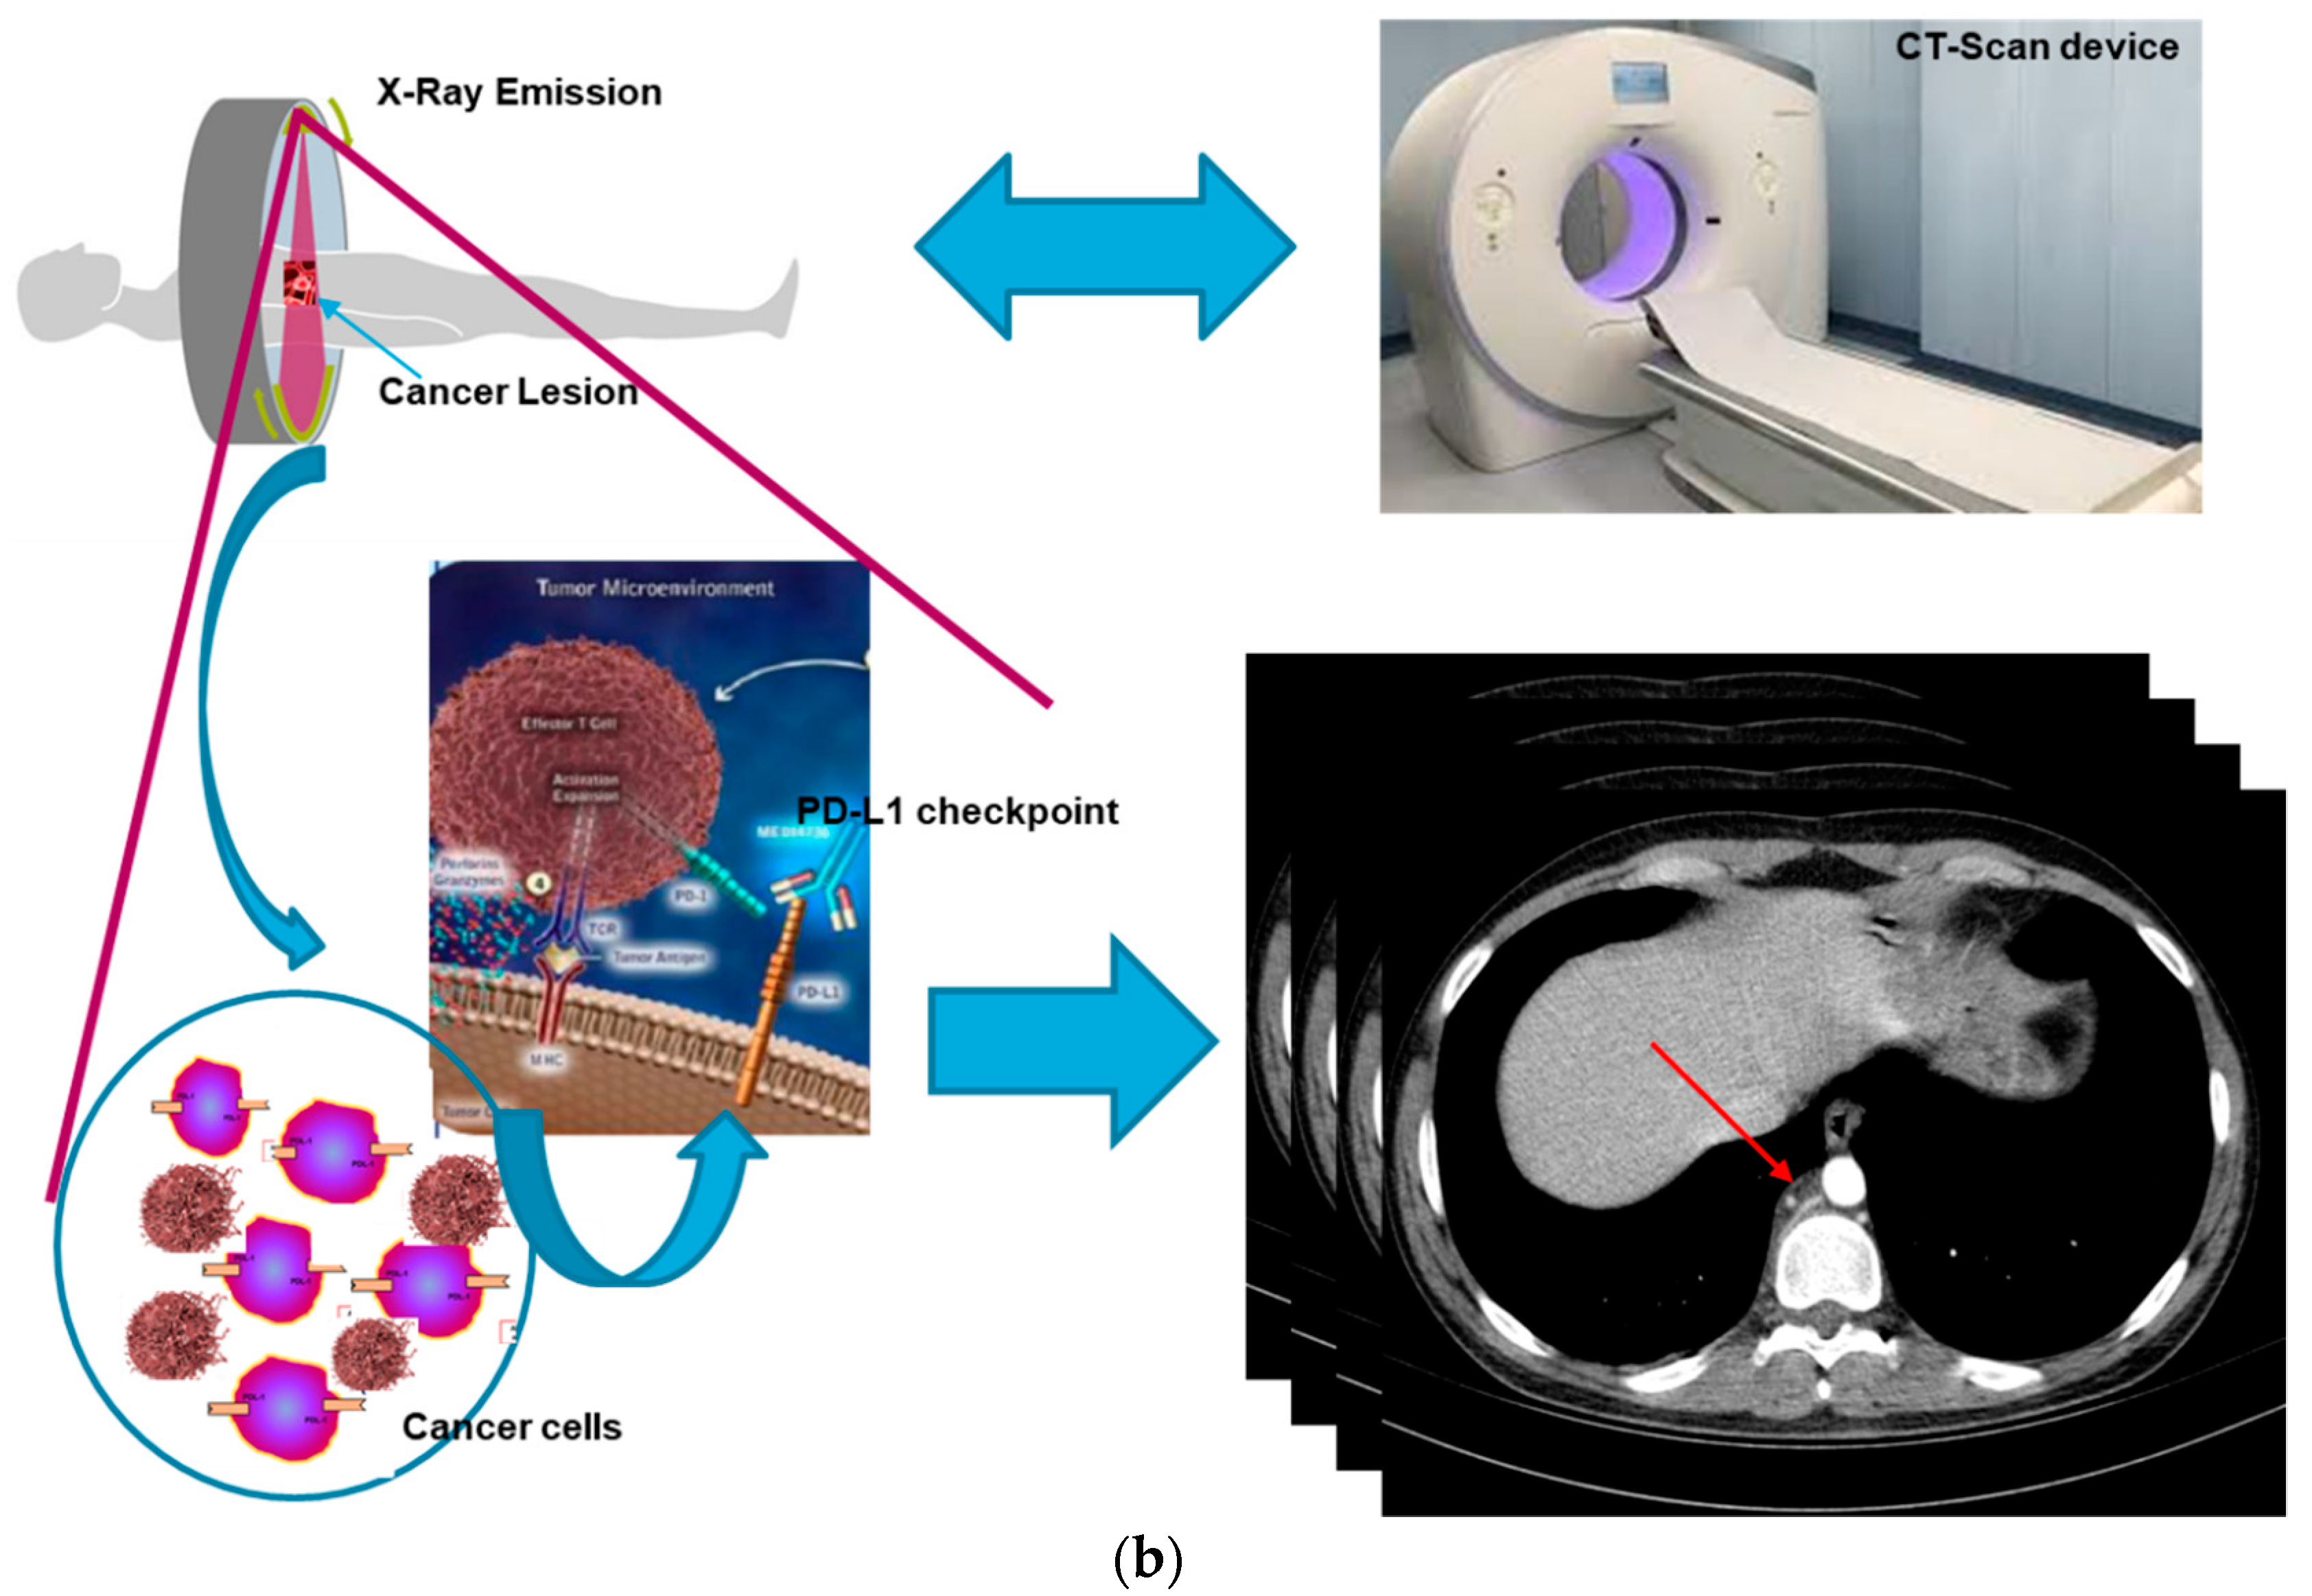
For these reasons, the authors in this paper have analyzed the possibility of estimating the responsiveness of cancer patients to immunotherapeutic treatment based only on an advanced analysis of the patient’s medical images (CT-scans, MRI, PET, etc.) and without information regarding the expression of the PD-L1 inhibitor. In fact, it was hypothesized that there is a correlation between the level of expression of the PD-L1 inhibitor (in the surface of the tumor cell) and the morphological time-dynamic of the corresponding neoplastic lesion as captured by diagnostic imaging.
Figure 2 shows this correlation hypothesized by the authors:
Many researchers have investigated the correlation between diagnostic imaging and predictive estimation of the response to a specific oncological therapeutic treatment [
7,
8,
9]. To confirm the above hypothesis, this study carried out various scientific programs that examine the correlation between medical images and the early diagnosis of neoplasms and predictive estimation of the response to a given therapeutic treatment (see Patent section). A preliminary work covered the analysis of the correlation between some features obtainable from dermoscopic images and the risk of oncological progression of some skin lesions for melanoma early diagnosis [
9,
10,
11,
12]. Through the use of ad-hoc hand-crafted image features appropriately designed together with modern classifiers based on recent deep learning techniques, several pipelines have been proposed that allow excellent accuracy (accuracy: 98% with sensitivity and specificity of 98%) to perform an efficient preventive screening and follow-up of skin cancer [
9,
10,
11,
12,
13]. The authors are also studying the use of some sensors called silicon photomultiplier (SiPM) for the study of some physio-pathological abnormalities of subjects suffering from cancer as well as some pharmacological therapies applicable to certain aggressive forms of cancer, such as lung cancer [
14,
15,
16,
17,
18]. For further details, the authors are studying the correlation between some physiological patterns (based on the study of ECG/PPG signals of the oncological subject) and the aggressiveness / diagnosis of the related tumor before and during the medical treatment. For the determination of these patterns, the authors are using specific sensors based on SiPM technologies [
15,
16,
17,
18]. At the same time, the correlation between the aforementioned patterns and the response to some chemotherapeutic treatments applicable to patients suffering from certain types of lung cancer were evaluated [
14]. Further studies show that it is possible to correlate some medical image features and the neoplastic progression of the monitored lesion. In this area, an interesting approach has been shown in [
19] in which the authors propose an efficient radiomics pipeline named MAPS as it is based on the analysis of the morphology, asymmetry, physiology, and size of the diagnostic imaging. Specifically, this pipeline is able to perform efficient prostate cancer detection using multi-parametric MRI based image features (accuracy: 87% with sensitivity of approximately 84% and specificity of approximately 88%). The authors proposed a tumor candidate identification algorithm that identifies the regions of concern and constructs a comprehensive radiomics feature model to detect the much-suspected cancer regions. Further on the subject of prostate cancer in [
20], a novel approach for automatic prostate tumor detection using a radiomics-driven conditional random field (RD-CRF) is proposed. The proposed method analyses the inter-voxel spatial and radiomics feature relationships to ensure that the identified tumor candidates exhibit specific tissue characteristics of cancer. The authors have evaluated the performance of their proposed pipeline by using MP-MRI image data. The results seem very promising (accuracy: 91.93% with sensitivity of approximately 72% and specificity of approximately 92%). As mentioned, the analysis of medical images/data can also be correlated with the predictive estimate of the patient’s response to therapeutic treatment, among which the immunotherapeutic one is of interest.
In this field, an interesting preliminary work has been proposed by Shi et al. in [
21]. This paper considers a model of tumor growth and treatment with anti-angiogenesis therapy and immunotherapy. The authors proposed a mathematical model consisting of such ordinary differential equations (ODEs) to simulate the interactions between normal cells, cancer cells, immune cells and the anti-angiogenic agent in the tumor growth process. An interesting outcome of that approach is that only anti-angiogenesis therapy could not completely eliminate the tumor cells while immunotherapy can eradicate tumor cells. The results also show that the model combined with tumor anti-angiogenesis therapy can achieve a better therapeutic effect. One of the most aggressive cancer is, of course, the brain tumor. Moreover, the studies show that the aforementioned correlations can be extended—under appropriate hypotheses—to different types of tumors and primitive sites.
For instance, in [
22] the authors identified an innovative (as it seems no similar approach has been proposed in literature) MRI imaging signature for prediction of the overall survival (OS) in patients with glioblastoma cancer. A fully-automatic radiomics model (based on the random forest classifier) is described in [
22], including automatic tumor segmentation, automatic features extraction and selection. The proposed signature-detection pipeline succeeds to stratify patients into prognostically high-risk and low-risk groups (C-index of approximately 0.726 with 95% confidence intervals). In the same field, Lv et al. investigated the prognostic performance of radiomics features on NasoPharyngeal Carcinoma (NPC) patients imaged with baseline FDG PET/CT-scans [
23]. An ad-hoc Kaplan-Meier analysis was used to estimate progression-free survival (PFS) as well as an advanced regression model with forward stepwise was used for the features selection The authors proposed 24 radiomics features and 8 clinical features to be significantly associated with PFS in univariate analysis. Overall, radiomics features can provide complementary prognostic information for NPC subjects imaged with FDG PET/CT-scans which significantly improves the medical assessment of such patients. It is possible to estimate the response of the therapy from imaging data (radiomics) beforehand for immunotherapy, but also for other oncological therapies. In [
24], the authors analyzed the possibility of planning a therapy minimizing side effects and optimizing the efficacy of the treatment. The authors in [
24] presented an application of radiomics to non-small cell lung cancer, dealing with the novel task of predicting the possibility of carrying out an adaptive therapy. The authors achieved promising performance, identifying a radiomics signature for predicting a positive outcome of the cancer treatment (tumor reduction) (AUC of approximately 80.2%). An interesting comparison paper about recent radiomics pipelines is reported in [
25]. In this paper, the authors proposed a realistic perspective on various emerging clinical applications based on radiomics in order to provide an efficient predicting outcome model for cervix cancer exploiting different machine learning based methodologies. Alahmari et al. proposed a very promising radiomics pipeline for extracting and analyzing low-dose computed tomography image quantitative features in order to develop ad-hoc decision support tools that can improve lung cancer screening [
26]. The approach proposed by authors in [
26] relies upon to the so-called delta radiomics (i.e., changes in features over time) which showed high performance in predicting the treatment response in lung cancer screening. The authors showed that combining delta radiomics features with conventional radiomics features can significantly improve the overall performance of the screening/treatment response estimation model for lung cancer management (AUC of approximately 83%; sensitivity: 58%; specificity: 87%; accuracy: 82%). About the prediction of the immunotherapy treatment response, an interesting approach has been proposed in [
27]. In this work, the authors proposed the integration of data-mining methods in the case-based reasoning (CBR) approach to improve the performance of the retrieval phase and then to predict the response to immunotherapy treatment for patients who have plantar and common warts disease. Radiomics is also used to address another problem in the field of oncology, namely the grading of some forms of cancer. In [
28], Sun et al. proposed a complete comparative study to compare the prediction performance of frequently utilized radiomics feature selection (from MRI images) and classification methods in glioma grading. The results reported in [
28] confirmed that the proposed pipeline achieved the best performance in the differentiation of glioblastoma and low-grade glioma in both cross validation datasets (balanced accuracy: 0.944, AUC: 0.986). This comparative investigation indicated that both feature selection methods and recent machine learning classifiers can significantly improve the overall performance in glioma grading. An interesting field of research similar to radiomics is linked to the use of integro-differential mathematical models to model the tumor and therefore to characterize in advance the possible response to a treatment. An example of this research topic is reported in [
29] in which the authors analyzed systems biology for designing a tumor-immune interaction model and translated it into a set of mathematical differential equations. They proposed, as model variables, the number of tumor cells, bacteria cells, immune cells and so forth. The obtained results seem very promising as reported in [
29]. In the wake of the topic discussed in this paper, it is worth mentioning that the pipeline proposed in [
30] analyzed the expression of programmed cell death ligand-1 (PD-L1) to be used as a biomarker that indicates to physicians whether a patient should or should not receive immunotherapy. They confirmed, as previously stated, that this approach is unreliable i.e., PD-L1 level expression testing alone is insufficient for immunotherapy patient selection in most malignancies.
In [
31], the authors studied radiomics non-invasive biomarker(s) to predict immunotherapy outcomes in patients with metastatic non-small cell lung cancer (NSCLC.) The authors discovered that radiomic data retrieved from a primary tumor are suitable to predict overall survival (OS) in patients with metastatic NSCLC. By means of an unsupervised-features selection-based pipeline with a multivariate Cox regression algorithm, the authors were able to identify the main features which predict better oncological outcomes in NSCLS patients. Similar interesting results have been obtained in [
32] in which the authors developed and validated a radiomics-based biomarker of tumor-infiltrating CD8 cells in patients treated with PD-1/PD-L1 immunotherapy ([AUC] = 0.67; 95% CI: 0.57–0.77; p = 0.0019). Therefore, as confirmed by the aforementioned studies, correlating the early diagnosis of a tumor and estimating the response of the oncological patient to immunotherapy treatment with the analysis of medical images is a very promising area of research that the authors have decided to investigate in this scientific contribution. Specifically, in this work, the authors propose an image processing pipeline based on the adoption of such radiomics approaches to be used as a biomarker to predict, in advance and without any invasive biopsy, the possible response to mono-agent PD-1/PD-L1 immunotherapy treatment. Specifically, this study examined and validated the proposed approach to the case of patients affected by metastatic bladder cancer with different staging.
2. Materials and Methods
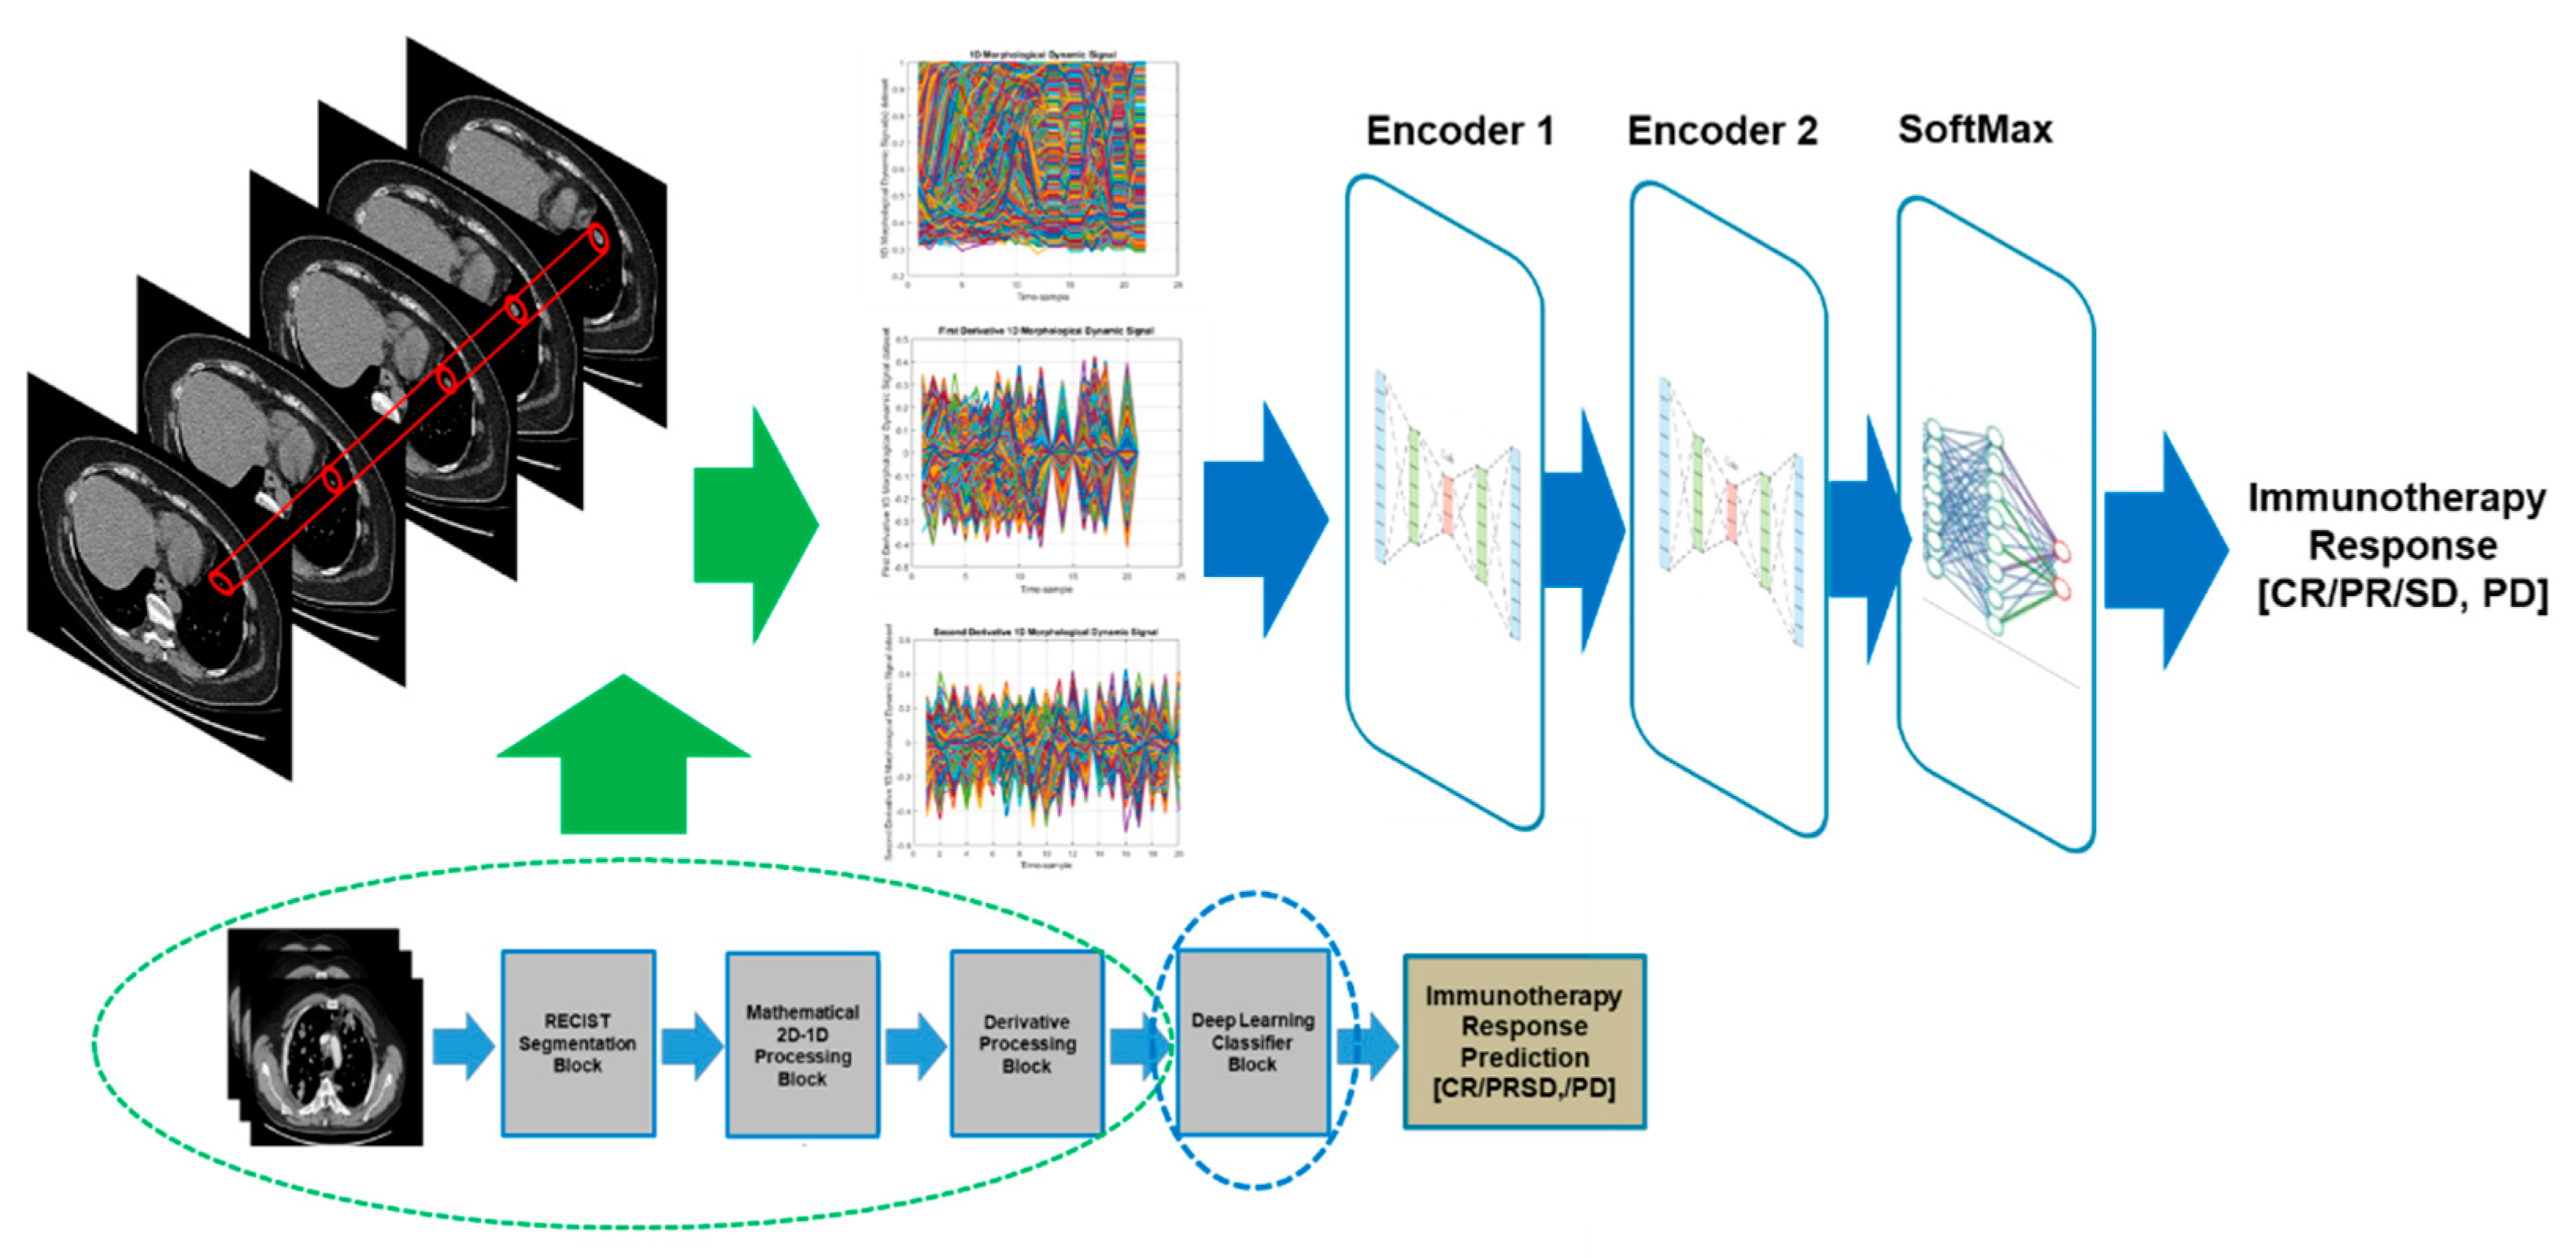
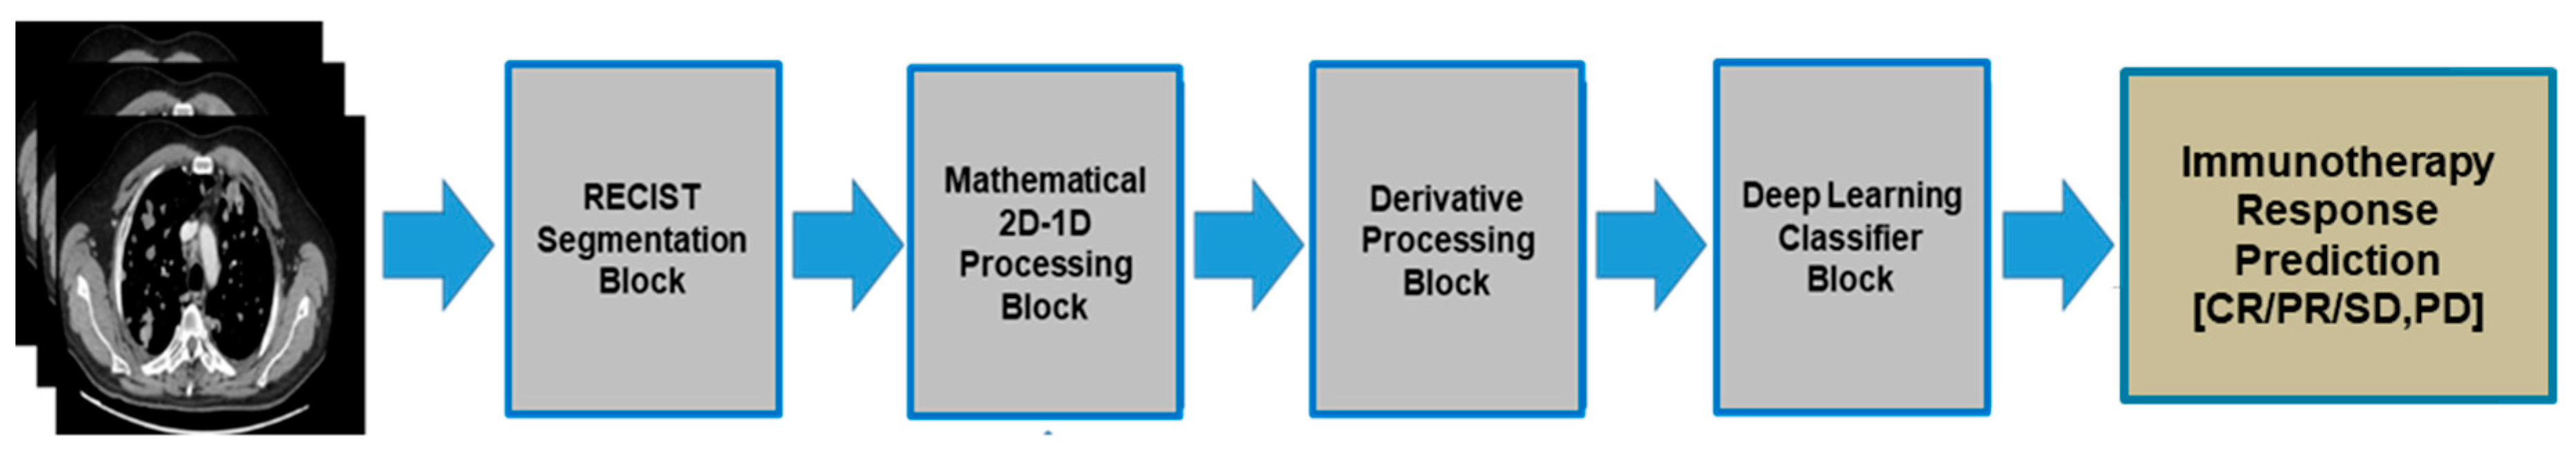
Figure 3 reported the overall scheme of the proposed pipeline. Each of the designed blocks are described in the following sub-sections.
2.1. RECIST Segmentation Block
One of the most feared and dangerous features of malignant tumors is their ability to metastasize to other parts of the body. The process of the formation and spreading of metastases is one of the peculiar characteristics of being malignant. Metastases can be spread through the blood and/or lymphatic route and obviously follow the anatomy of the interconnection of organs in the human body. In the specific case, bladder cancer is one of the most insidious cancers that exist [
33]. The most common type of bladder cancer is the so-called transitional cell carcinoma which accounts for approximately 95 percent of cases. Other types of bladder cancer are adenocarcinoma and primitive squamous carcinoma, which are much less frequent. The bladder tumor appears more frequently on the lateral walls of the organ and has a papillary appearance (i.e., as small outgrowth) in 75% of cases, or a flat or nodular shape. Bladder cancer can spread either by the blood reaching, in order, the liver, lungs and bones or via the lymphatic system by infiltrating the lymph nodes in the pelvic area. Once the presence of a malignant bladder tumor is confirmed, definitive staging requires the use of imaging (usually CT-scan and PET) to characterize the level of spread of the disease in the body [
33]. For this reason, especially in the advanced stages, the lesions detectable by the diagnostic imaging test are multiple and therefore, the radiologist/oncologist is required to select a significant subset which then allows to monitor their evolution over time. To this end, the Response Evaluation Criteria in Solid Tumors (RECIST) guideline and its updated version RECIST 1.1 come to our aid. With the term RECIST, a practical methodology is referred to evaluate the outcome of the cancer treatment in solid tumors by using deterministic criteria to assess changes in the tumor burden (lesions) [
34]. The RECIST guideline has been recently updated in version 1.1 [
35]. Basically, the RECIST main criteria for medical imaging processing in oncology (as of interest in this discussion) are the following:
Only patients with a measurable disease at baseline should be included in protocols;
A measurable disease can be defined as a disease in which there is the presence of at least one measurable lesion;
Measurable lesion: a lesion that can be accurately measured with longest diameter (in one dimension) ≥20 mm (≥10 mm for spiral CT-scan);
Non-measurable lesions: all other lesions with longest diameter <20 mm (10 mm for spiral CT-scan);
All baseline evaluations should be performed as closely as possible to the beginning of treatment and never more than 4 weeks before the beginning of treatment.
The same method of assessment should be used for monitoring each identified lesion at baseline;
CT-scan and MRI methodologies should be performed with cuts of 10 mm or less in slice thickness contiguously. A spiral CT-scan should be performed using a 5 mm contiguous reconstruction algorithm;
All measurable lesions up to a maximum of 2 lesions per organ and 5 lesions in total, representative of all involved organs should be identified as target lesions and recorded at baseline;
Target lesions should be selected on the basis of their size (lesions with the longest diameter) and their suitability to perform repeatable measures;
A sum of the longest diameter (LD) for all target lesions is calculated and reported as the baseline sum LD. The baseline sum LD is used as a reference to evaluate the follow-up and treatment response of the analyzed cancer.
About target lesions, the RECIST guideline suggested the procedure for assessing the tumor as well as the treatment response as follows:
Complete response (CR): Disappearance of all target lesions;
Partial response (PR): At least a 30% decrease in the sum of the LD of target lesions;
Stable disease (SD): Neither sufficient shrinkage to qualify for PR nor sufficient increase to qualify for PD, taking as a reference the smallest sum LD since the treatment started;
Progressive disease (PD): At least a 20% increase in the sum of the LD of target lesions, taking as the reference the smallest sum LD recorded since the treatment started.
Therefore, in light of the RECIST criteria, the oncologist manually identifies the TARGET lesions and these serve to monitor the oncological disease over time and therefore, in this case, the effectiveness of the immunotherapy treatment. In terms of interest in this work, only one TARGET lesion was identified, the most significant according to the RECIST criteria adopted above to monitor the disease during immunotherapy treatment.
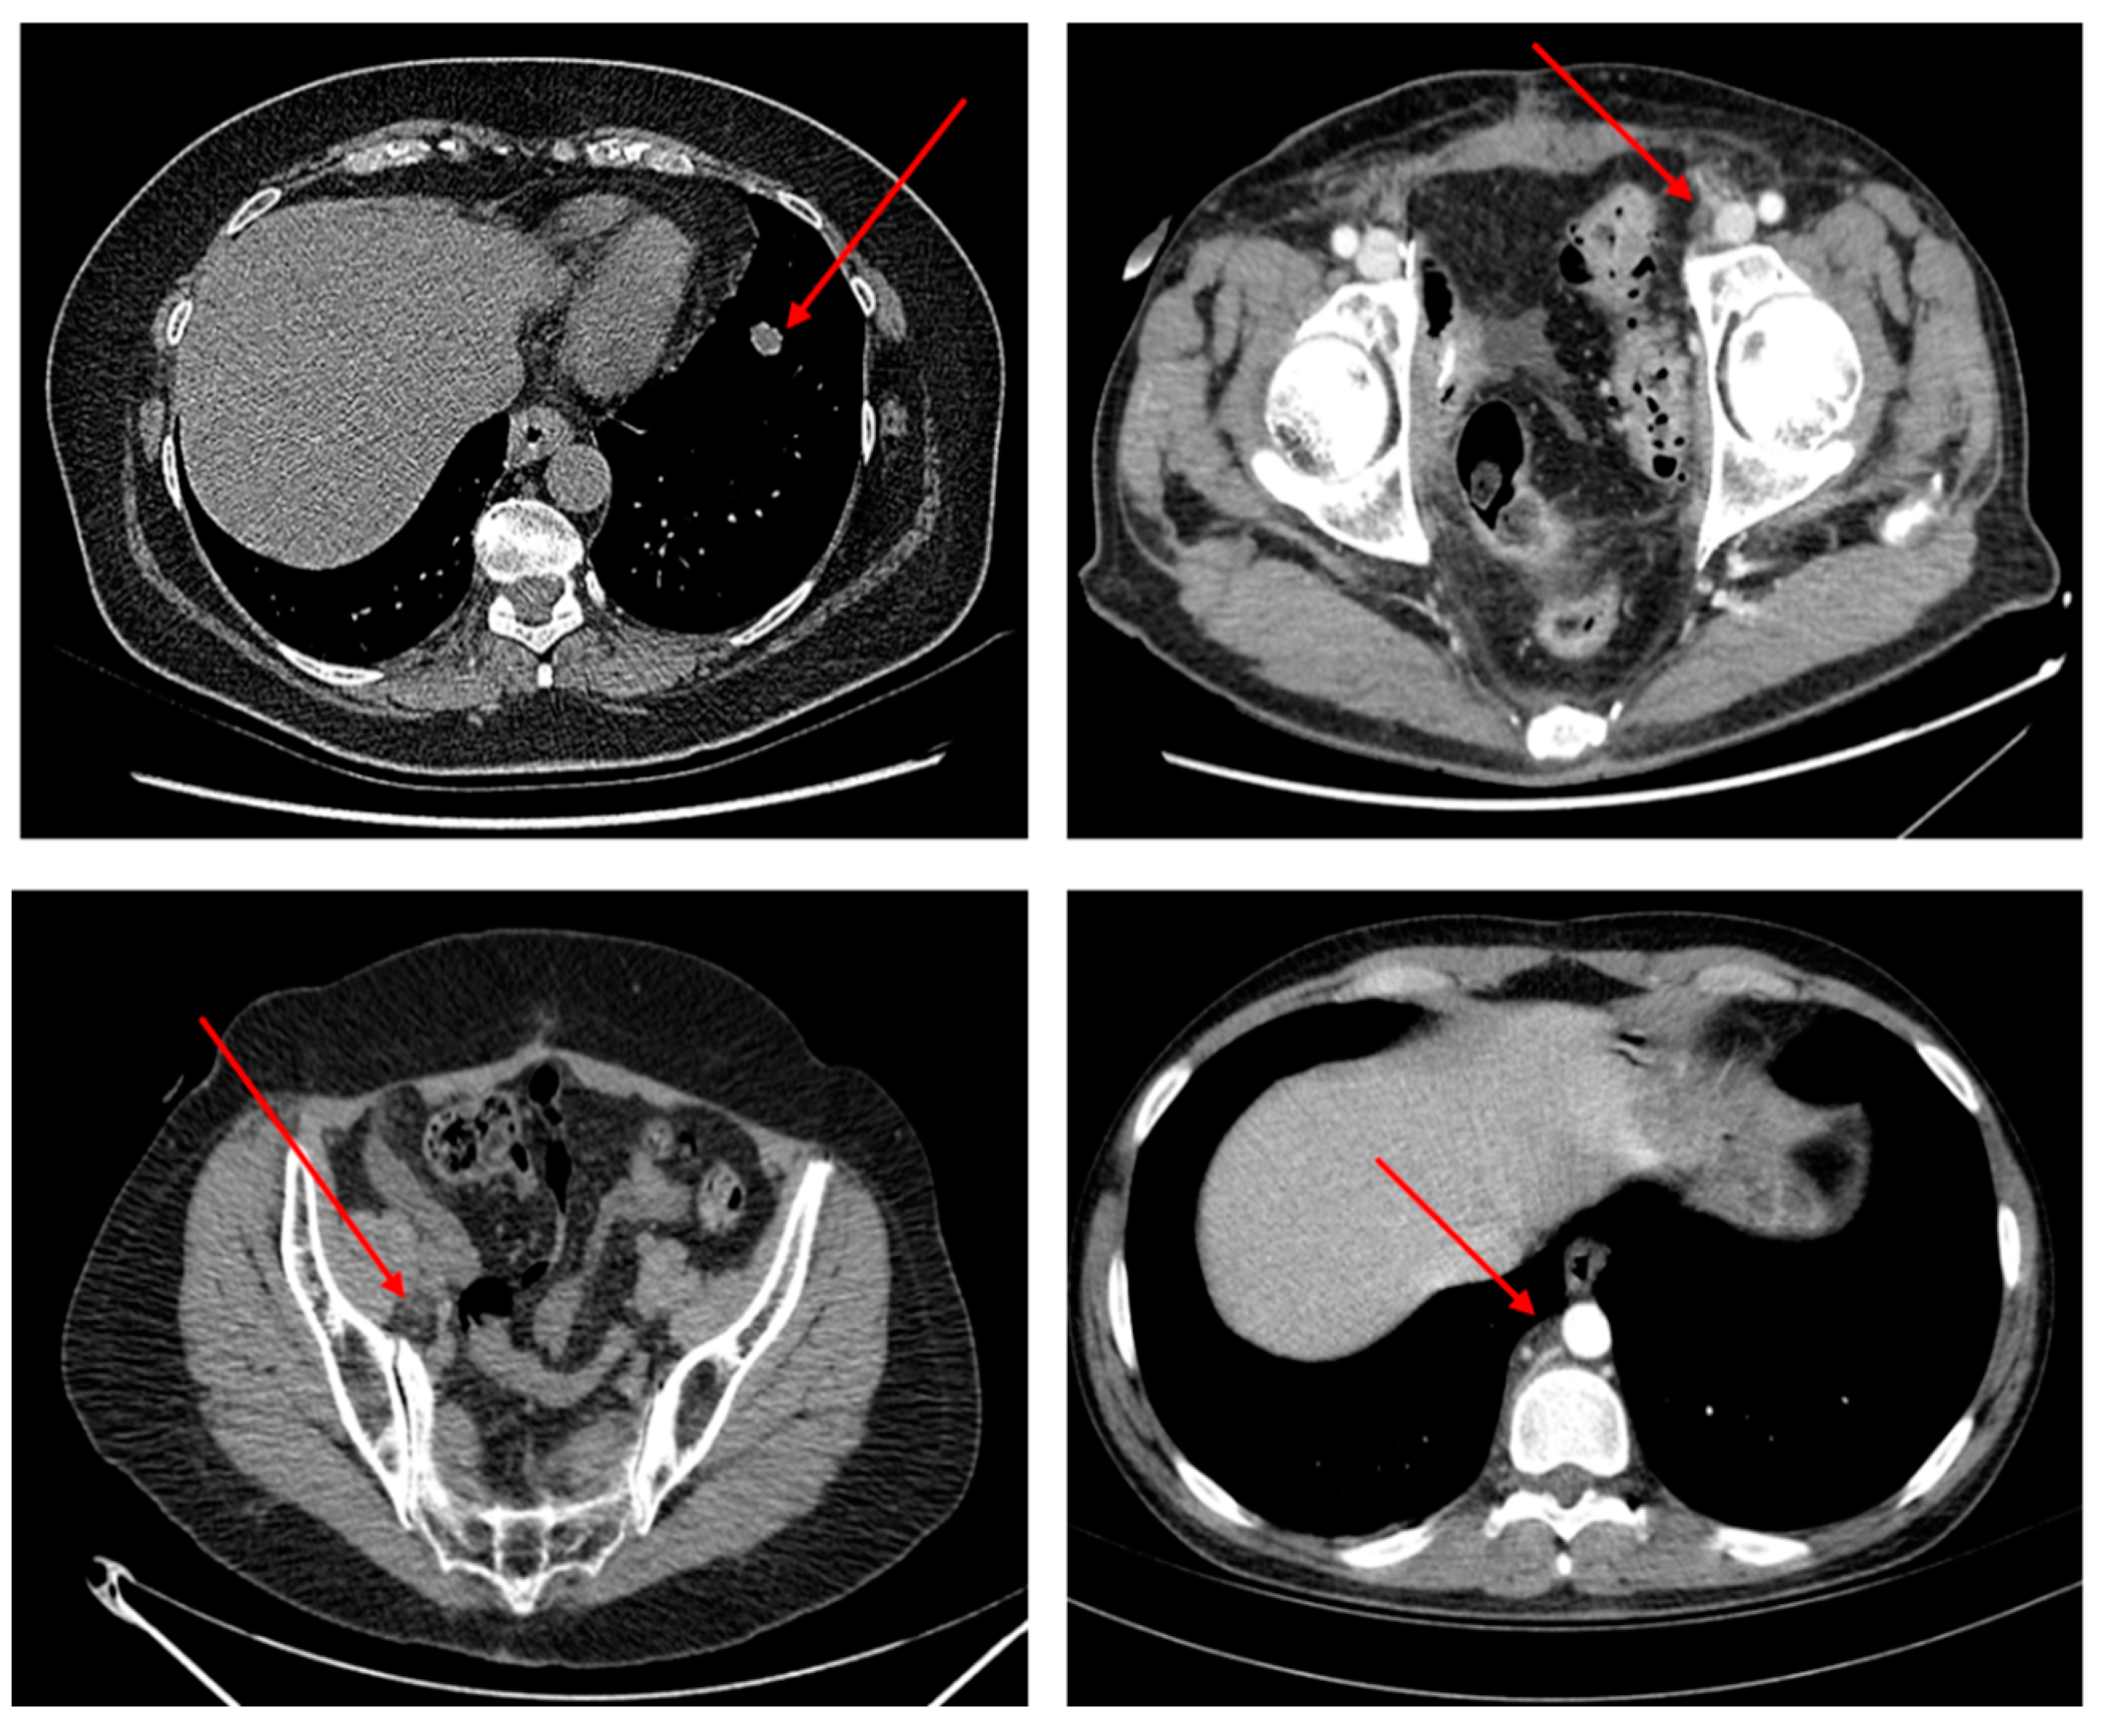
Figure 4 shows some examples of TARGET lesions manually identified by oncologists who have been used by bladder cancer patients and inserted into the dataset used to train and validate the proposed pipeline.
Figure 4 shows some TARGET lesions (metastasis of the primitive bladder tumor in the thoracic and pelvic-abdominal area) selected by the oncologist according to the RECIST criteria mentioned above and which is therefore used for clinical evaluations of the anti-PD-L1 immunotherapy treatment.
As previously stated, the hypothesis put forward by the authors is that the hyper/hypo expression of the PD-1/PD-L1 checkpoint in tumor cells influences the morphological dynamics of the lesion in diagnostic imaging. In our case, the CT-scan method that in bladder cancer is suggested by the guidelines for staging the overt disease [
33]. For these reasons, at this stage once the oncologist identifies the TARGET lesion, this is segmented by a semi-automatic procedure in all the slices in which it is evident.
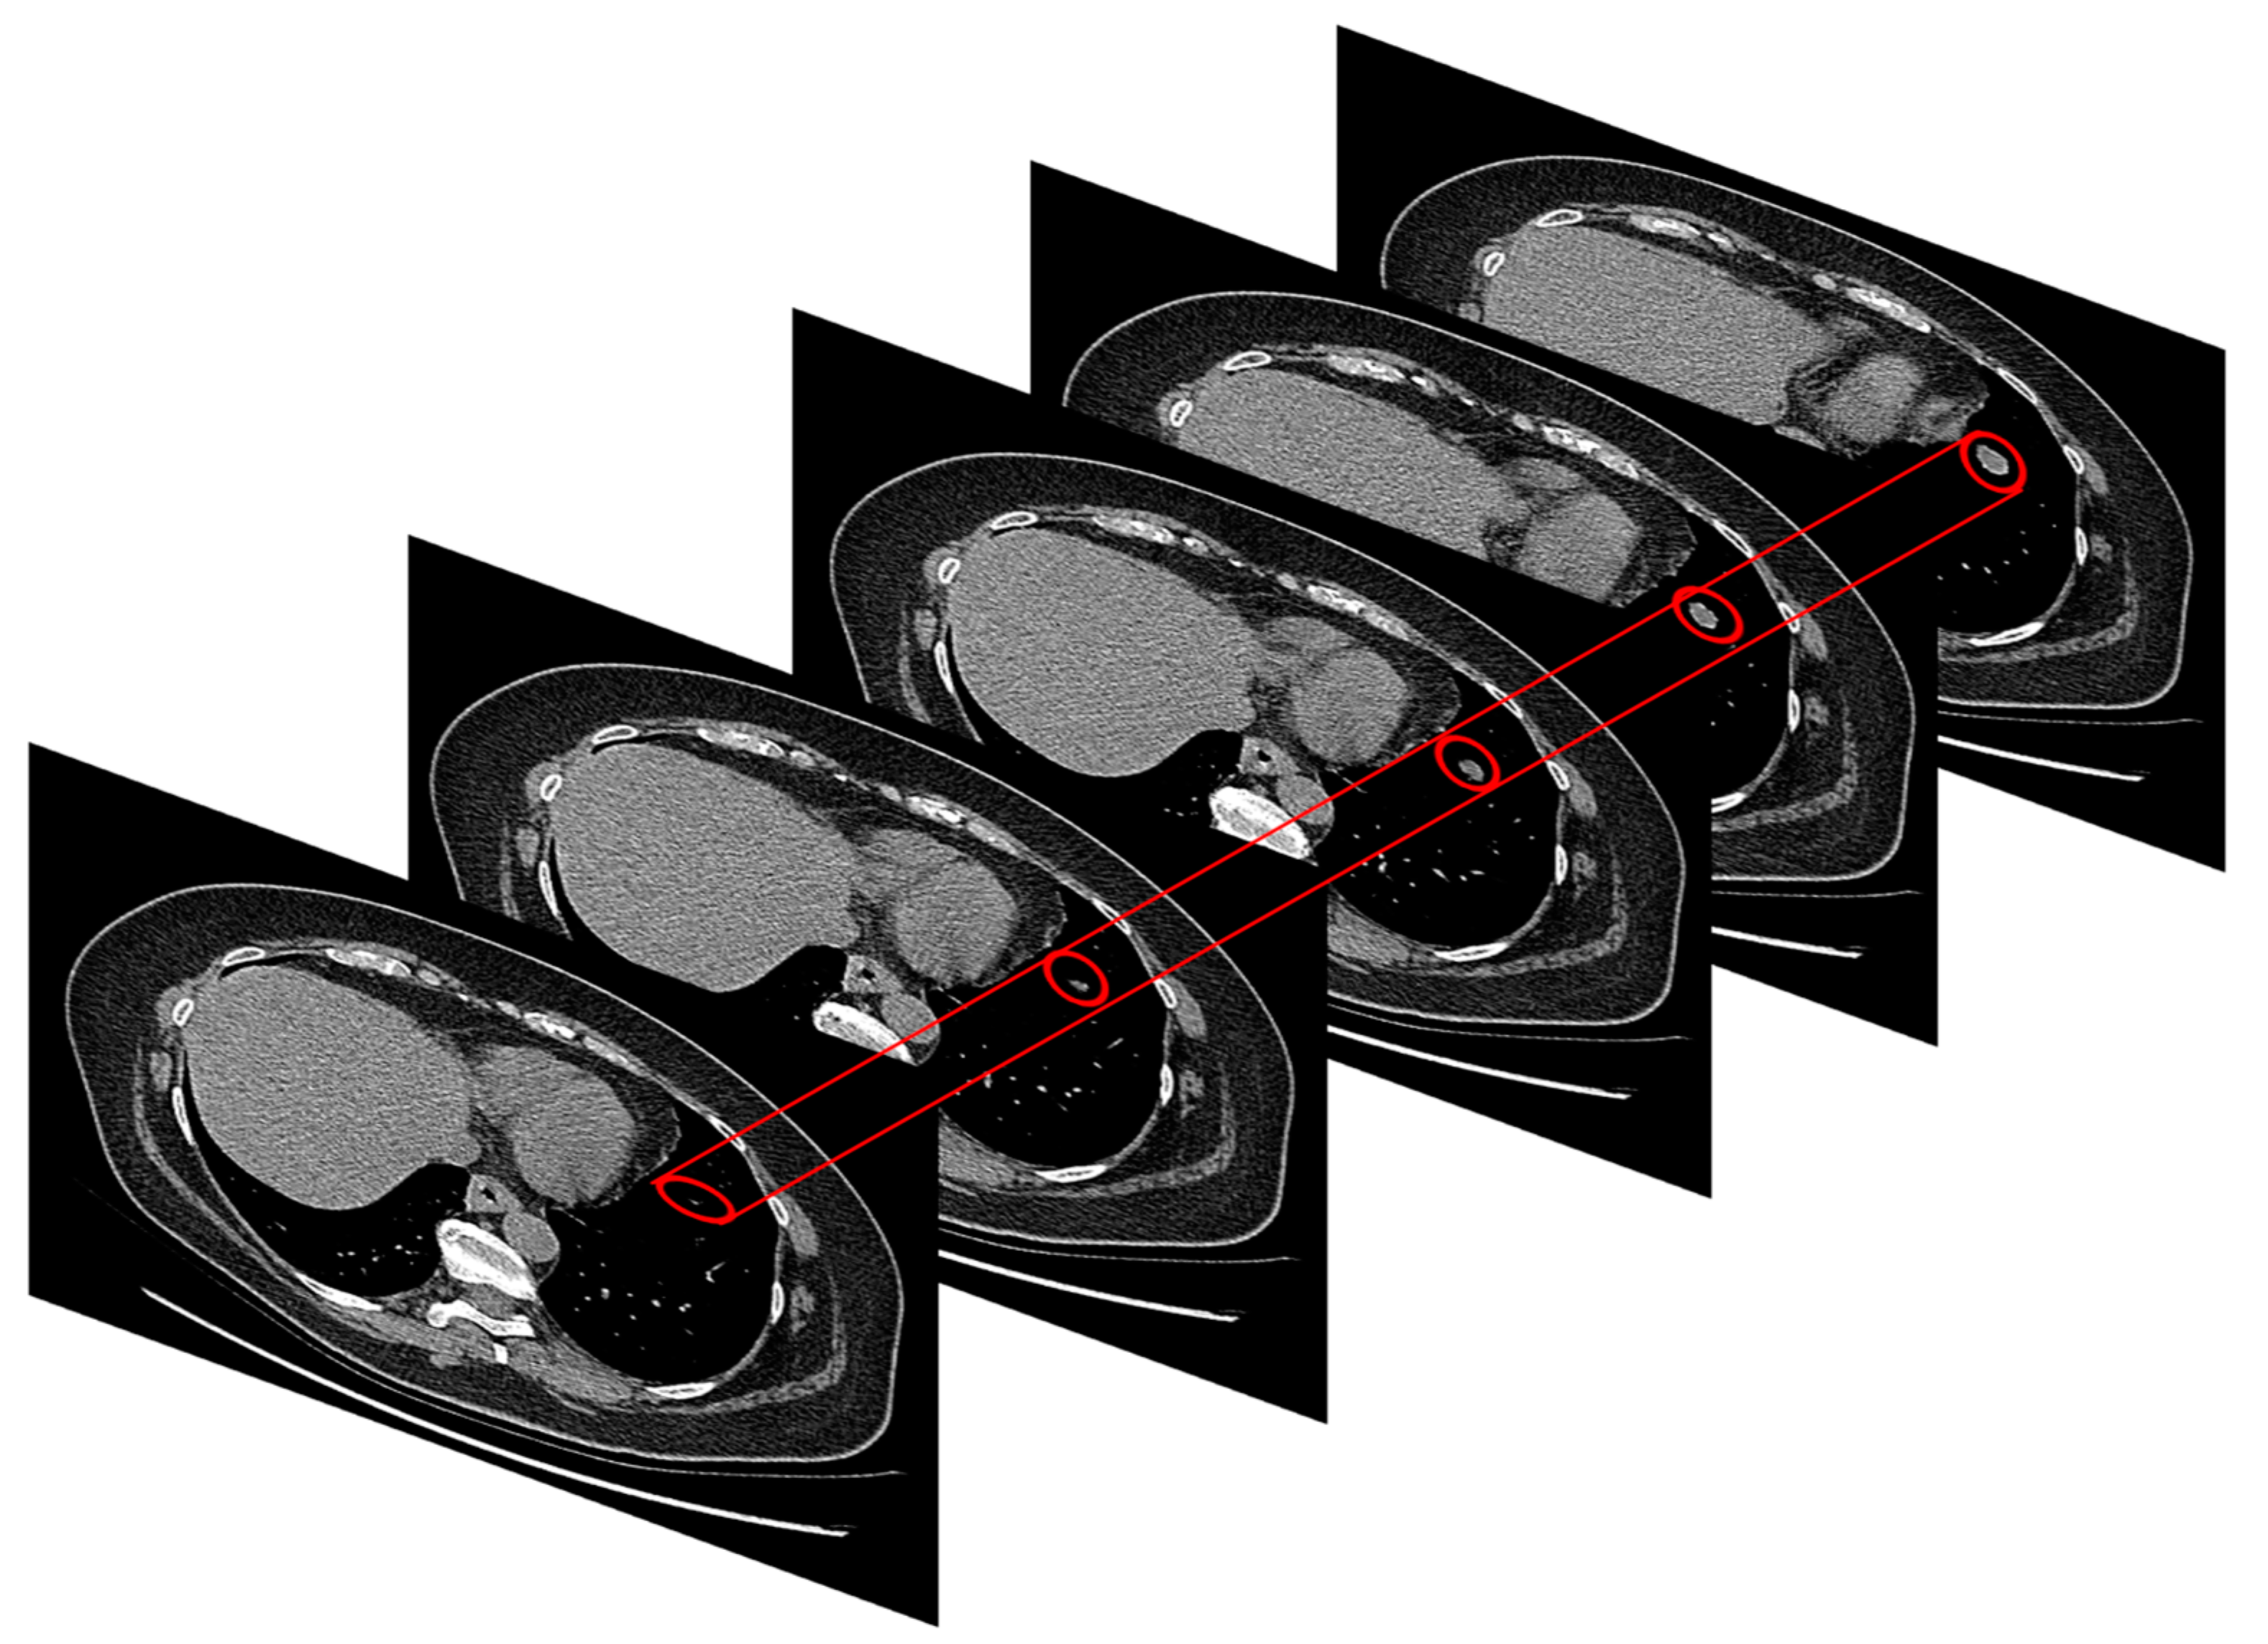
Figure 5 shows this phase performed in this block.
As shown in
Figure 5, in the present block of the proposed pipeline, the authors after having identified the TARGET lesion to be monitored, perform a manual segmentation of the lesion starting from the first slice in which it is visible and up to the last one in which it disappears. In this way, a region of interest (ROI) of size 40 × 40 containing the only lesion to be processed were able to be extracted. Basically, both the first slice in which the lesion appears and the lesion itself (which therefore becomes the so-called target lesion according to RECIST criterion) is manually identified by the oncologist. Moreover, it is considered the last slice in which this lesion is evident. Then, using an ad-hoc developed software, the ROI surrounding the identified target lesion according to the chosen dimensions are selected. This ROI is maintained for each of the slices, up to the last identified as above. Therefore, the procedure is semi-automatic. Formally, this procedure can be modelled as follows:
where it has been indicated with
Ij(
x’,
y’) the individual CT-scan slice which basically is a gray-level image (total number of slices equal to N) and with
the corresponding gray-level ROI-image 40 × 40 extracted through the manual segmentation procedure
Obviously, depending on each TARGET lesion and how extensive this is, the number of CT-scan slices to be processed varies for each patient, having regard also to the staging of the tumor. As is illustrated in the following block, this study proceeded to standardize this aspect, as is better described in the next section. Therefore, in conclusion, the output of this block is the series of gray-level images
40 × 40 characterizing the morpho-dynamic evolution of the identified TARGET lesion. Let
define the common dimension of the selected
image.
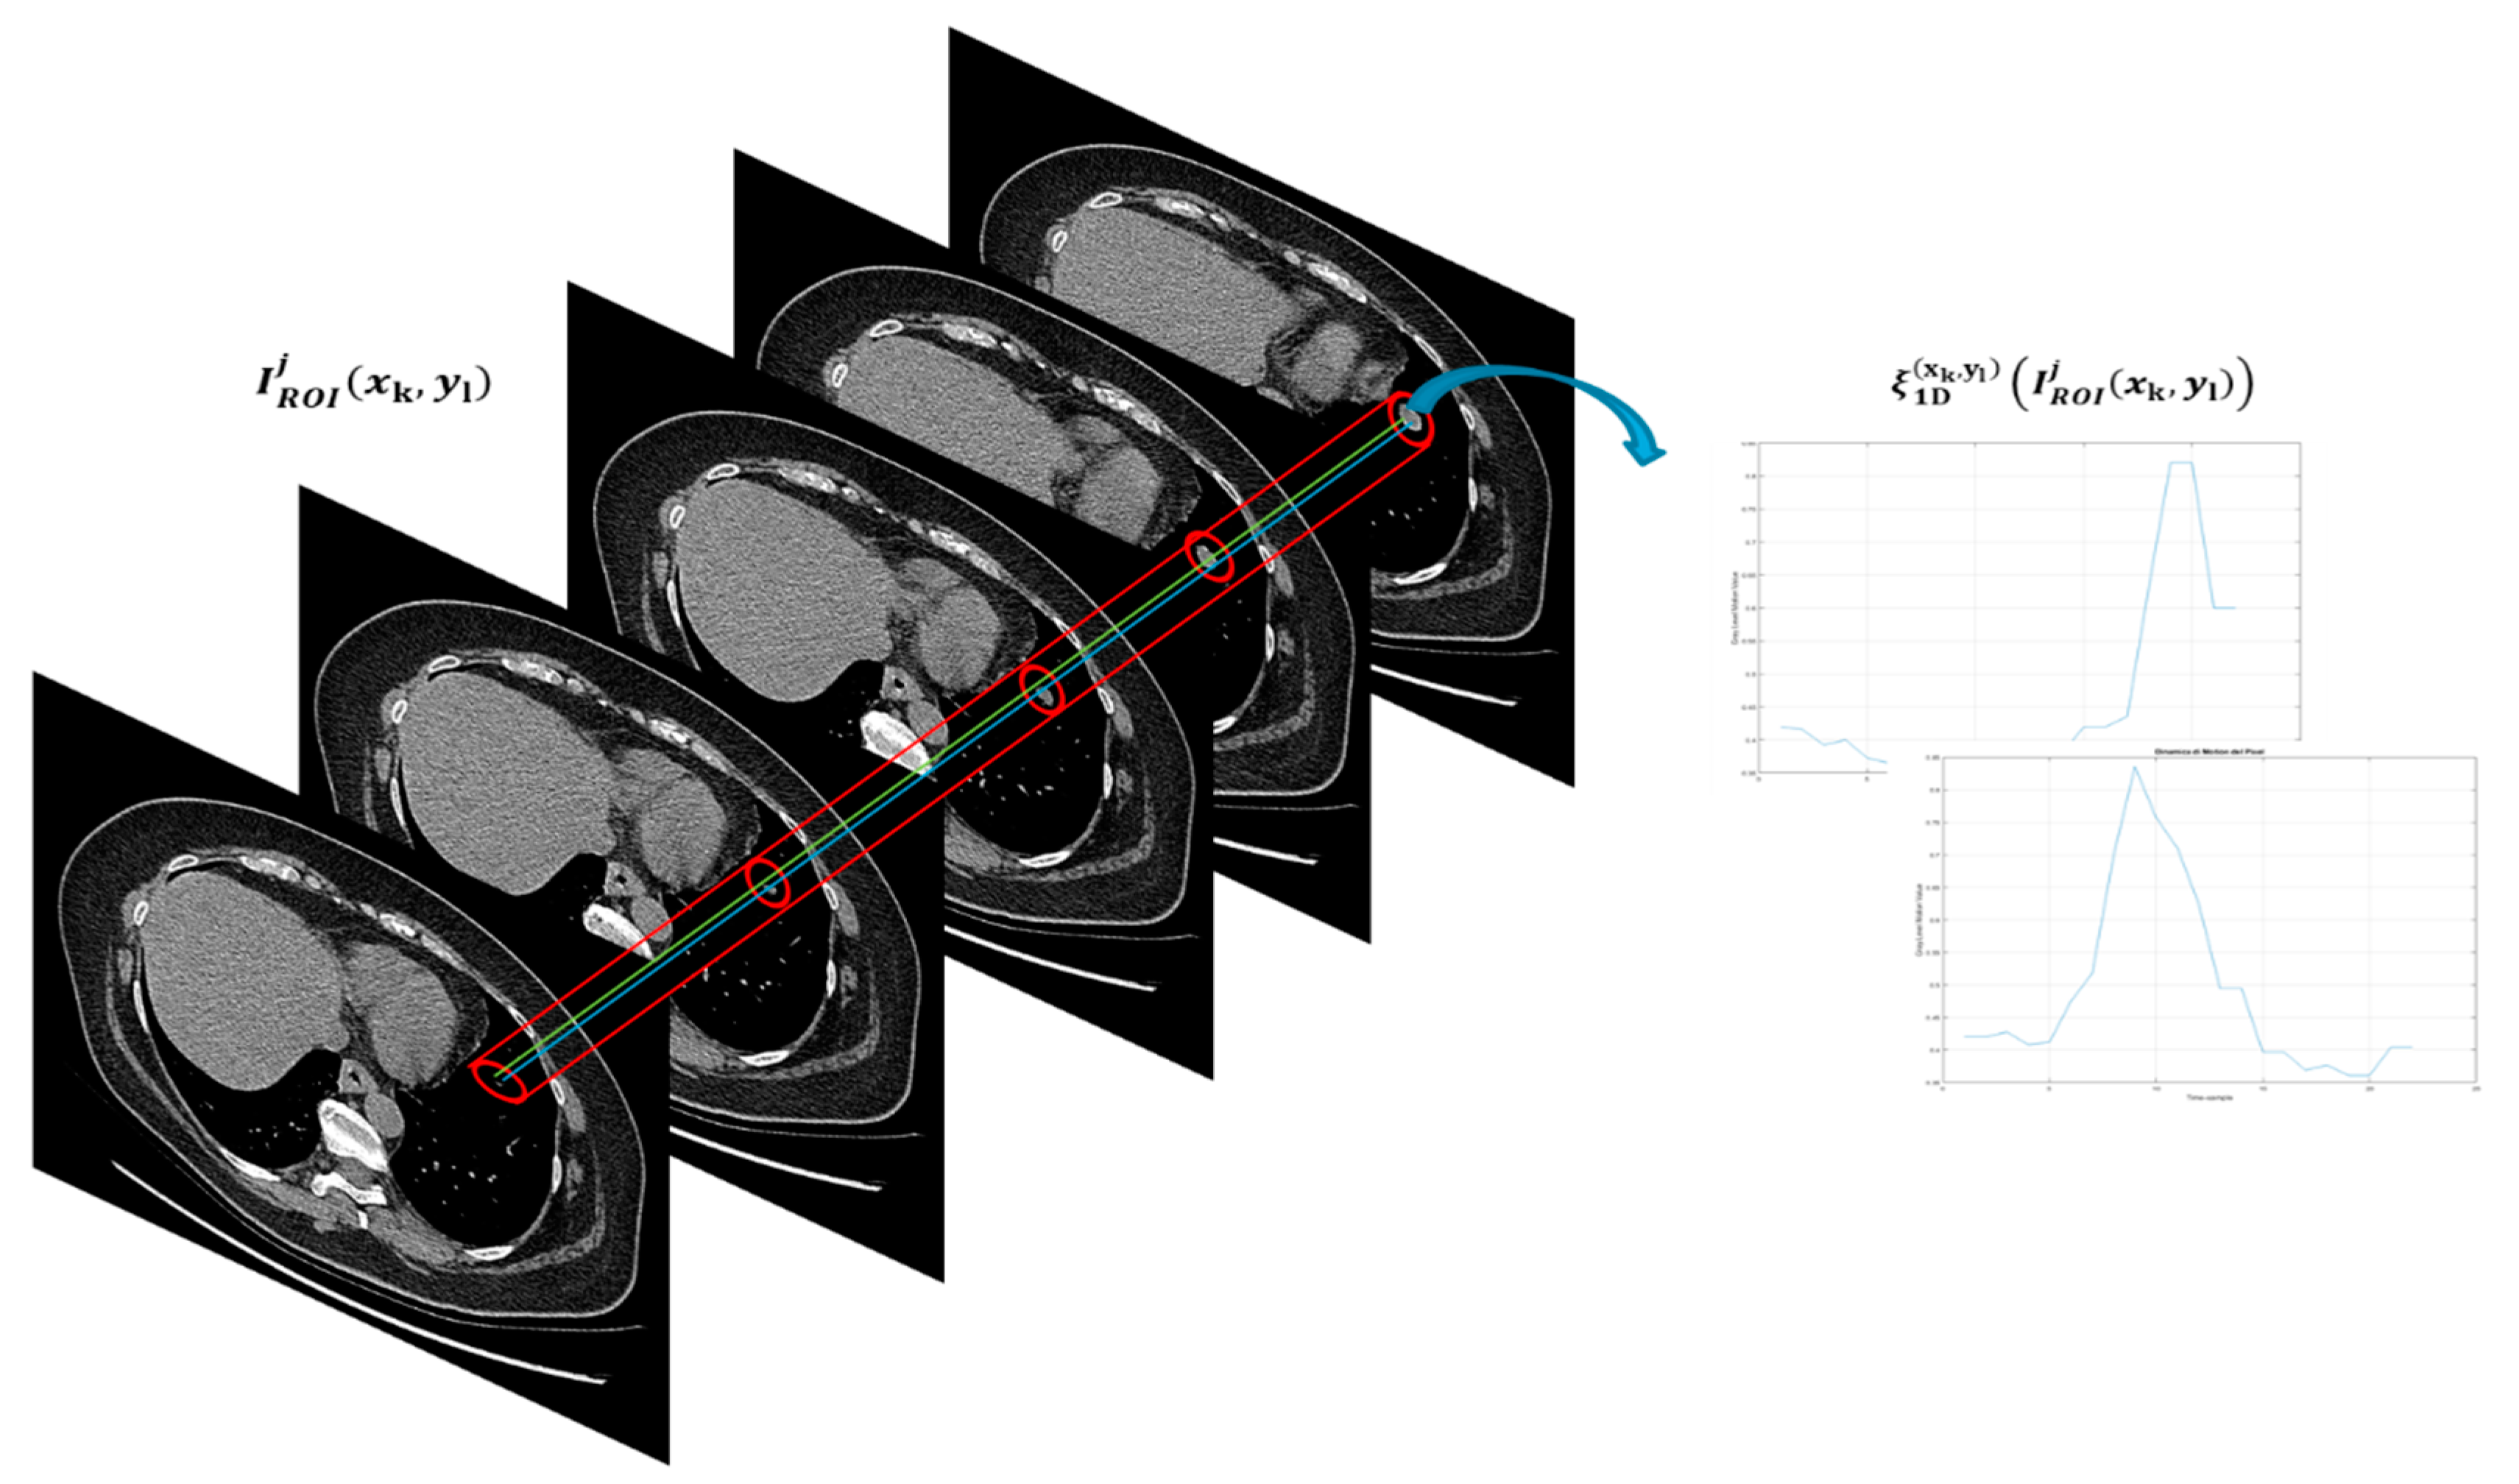
2.2. Mathematical 2D-1D Processing Block
The target of this block is to pre-process the set of images
characteristic of the morphological dynamics of the TARGET lesion identified according to the RECIST criterion. Specifically, the
images are analyzed, pixel by pixel, as the intensity of the latter varies in the individual slices. In this way, a 2D to 1D conversion of the dataset of segmented images are performed as the initial dataset of
images are replaced with a corresponding dataset of 1D signals useful for describing the dynamic intensity variation of each pixel of the slice image. Formally, this study proceeds analytically as stated above:
In Equation (2), this study has indicated with the 1D signal obtained from the dynamic analysis of the pixel intensities of the image for each of the p slices considered in the morphological dynamics of the TARGET lesion. As anticipated in the previous block, the number of slices involved in the morphological dynamic of the TARGET lesion varies from patient to patient, therefore, the length of each 1D signal obtained from the pixel intensity analysis varies accordingly. To standardize this aspect, after several heuristic tests, a good trade-off value was identified, which allows the dataset of 1D signals obtained to be homogeneous. In further detail, the value of p = 22 was identified as the optimal length of the 1D vector.
Identifying the exact number of slices in which a cancerous lesion (identifiable according to the RECIST criterion) is evident is non-trivial. Basically, it depends on numerous factors related to the CT-scan device acquisition mechanism (whether linear, single-slice or spiral multi-slices), the size of the lesion, the location of the lesion, etc. Without presuming to be able to generalize for any type of tumors, the authors noticed that in the case under examination (patients with metastatic bladder cancer), the average number of slices in which an identifiable lesion according to RECIST criterion was analyzable varied between 10 and 25. Therefore, the proposed pipeline was tested by selecting different options for choosing the length of the 1D vector that can be reconstructed from slices in the range between 10–25. This study found that in the range 23–25, there was no significant improvement in the performance of the entire algorithm while in the range 10–21, there was a proportional degradation of the performance system discriminative (with respect to the range 22–25) in predicting the immunotherapeutic outcome of patients in the analyzed training set. Therefore, opting for the choice of greater performance and lower computational load, p = 22 was chosen. These are, as mentioned, heuristic tests that the authors intend to refine better in a subsequent study to try and find a generic methodology applicable to any tumoral form. Moreover, as the first tests of the proposed pipeline, the authors agreed with the oncologists’ decision to identify only one TARGET lesion for each patient. From a medical-oncological point of view, the identification of a TARGET lesion is sufficient to characterize the response to the mono-agent anti-PD-L1 immunotherapy treatment in the analyzed patients. On average, since CT-scan images of multi-slice spiral devices and the examined patients with metastatic bladder cancer were the focus in this study, the range of variation of the size of the target lesions that were analyzed can be considered in the range 10.5–50 mm. Therefore, the size of the adopted window 40x40 pixels was sufficient to characterize the lesion without any of them exceed the selected analysis area. Therefore, considering only one target lesion per patient, a ROI of 40 × 40 may seems in the first instance, oversized. However, it should be considered primarily, that by oversizing the ROI, the authors also included within it information related to healthy tissue (organ or lymphatic) which is therefore adequately considered by the discriminating deep neural network. In addition to this, it should also be said that in clinical practice, it may be advisable to analyze more neighboring target lesions. The authors, for this purpose, are working on the final version of the proposed method that analyzes more neighboring target lesions both in the organ and, where possible and present, in the lymphatic area (draining lymph node station) because it is thought to improve the discriminative performance of the proposed method. Therefore, for this reason, this study deliberately chose to opt for a 40 × 40 ROI in view of the extensions and generalizations of the method proposed here.
If the length of the individual signals 1D is lower or higher than p = 22, a resize operation was performed in the signal, thus obtained by means of a bi-cubic algorithm [
36]. Basically, the following operation was performed:
in which were denoted with
the bi-cubic re-map function [
33]. All the processed signals were normalized in the range
.
Figure 6 shows the task performed by this block:
In
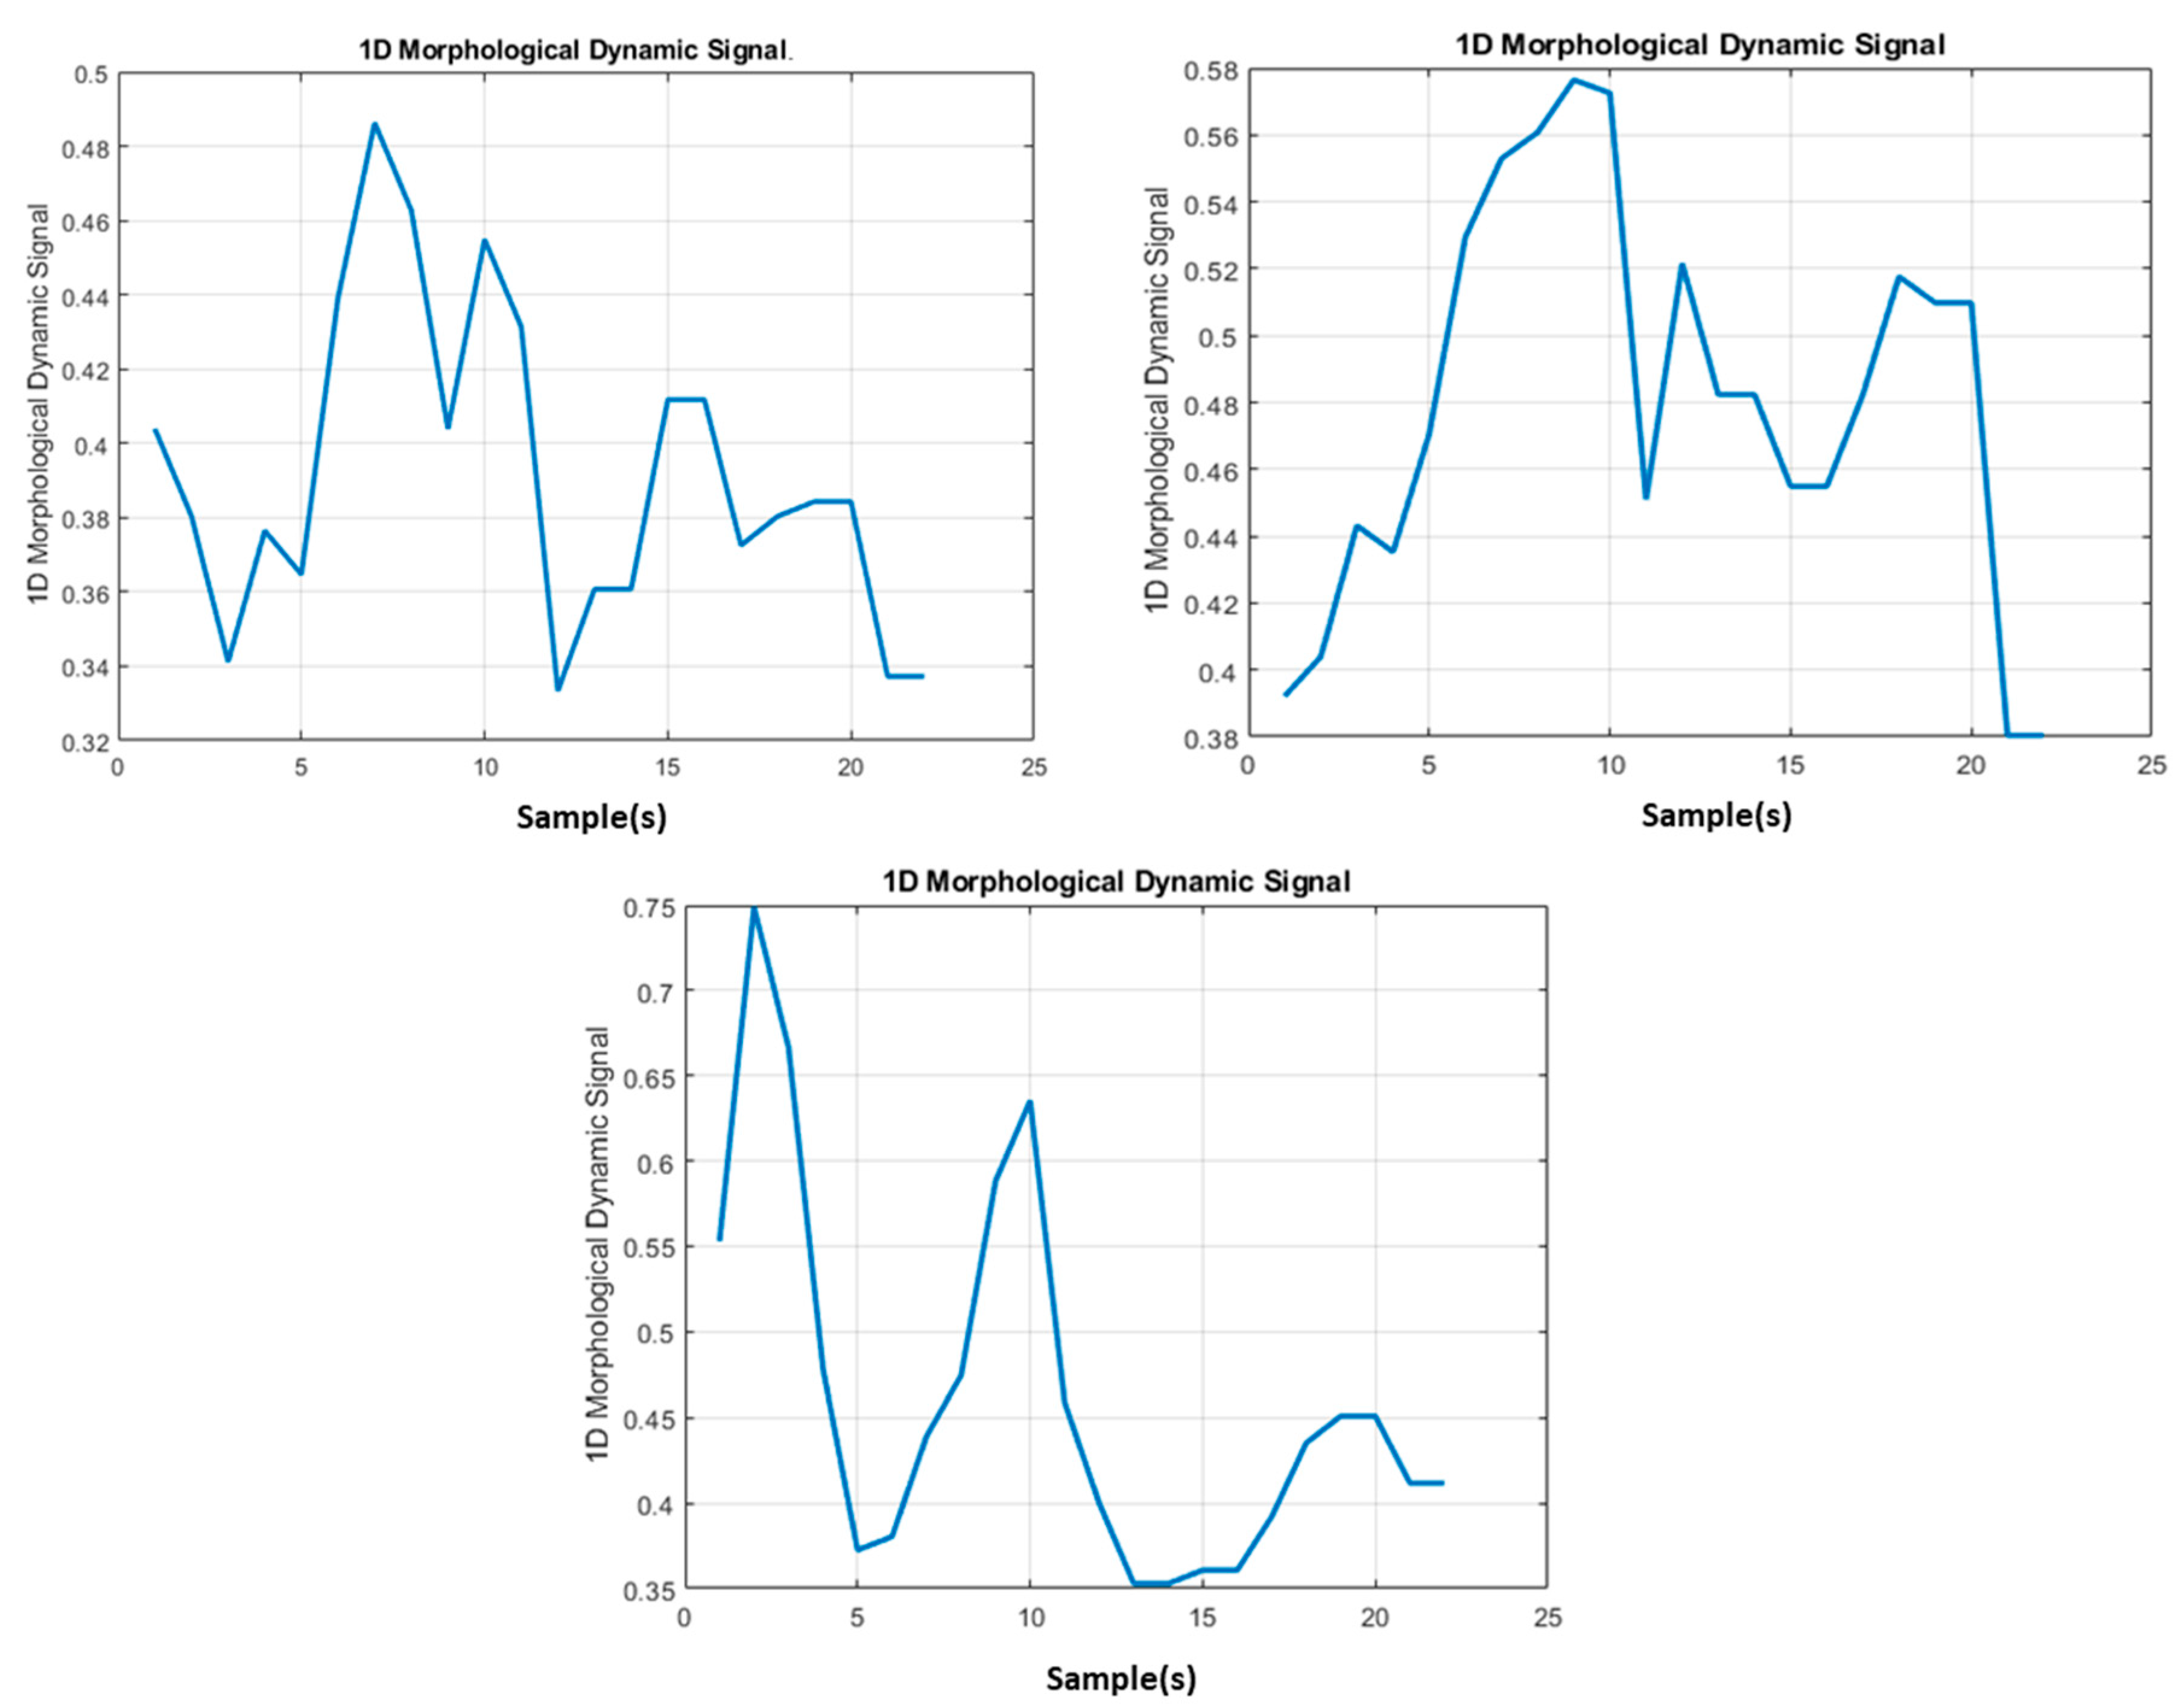
Figure 7, some instances of 1D signal
obtaining from
images containing the morphological dynamic information of the TARGET lesion are reported:
In
Figure 7, some instances of the 1D signal obtained by mathematical processing as per Equations (2) and (3) are reported. The output of this block is the
signal(s) dataset which was fed into the derivative processing block.
2.3. Derivative Processing Block
As mentioned, the underlying hypothesis made by the authors is related to the influence that the hyper / hypo expression of the PD-L1 inhibitor by tumor cells is related to the morphological dynamic of the lesion found in the slices of the diagnostic examination performed with the CT-scan methodology. Therefore, in order to correctly characterize the dynamics, in addition to the generated 1D signal dataset
(see previous section), it is considered useful to characterize the speed with which the pixel intensity (deducible from the first derivative) varies and the acceleration is physiologically impressed by the variation of the TARGET lesion morphology in each slices (deducible from the second derivative). Therefore, in addition to the
signal dataset in the present block, the following two further datasets were computed, which therefore completed the characterization of the morphological dynamic of the TARGET lesion:
The authors in a future work intend to analyze the correlation between the different derivative kernels to be applied to the operations of Equations (4) and (5) and the overall discriminative capability of the proposed pipeline. Furthermore, for the new two datasets as per Equations (4) and (5), a bi-cubic resizing [
33] to 1D 1 × 22 vector length was performed. All generated datasets [
,
] were fed into the next section, in which the authors designed an ad-hoc deep learning classifier.
2.4. Deep Learning Classifier Block
The aim of this block is to perform a classification of the dataset of input signals trying to discriminate the patients who show characteristics to make them suitable for immunotherapy for bladder cancer (therefore, the authors expect a complete CR, partial response to the PR treatment or stable disease, SD) from those that do not have characteristics that make them eligible for treatment (for which there are expect a disease progression, PD despite the immunotherapy treatment). For this purpose, a Stacked Autoeconder architecture was used with a SoftMax layer [
11]. The proposed deep learning framework is reported in
Figure 8:
The Autoencoder methodology is introduced formally. Suppose there is only a set of training data as follows:
An Autoencoder tries to learn a function:
More specifically, Autoencoder tries to learn an approximation to the identity function i.e., an internal representation of the input vector
y. In our proposed pipeline, the target of the used Autoencoder is to learn the input pre-processed 1D signal datasets [
,
] by means of a latent representation mapped over the hidden neurons. An interesting evaluation to be done for the above described Autoencoder is related to the number of hidden layers and/or units (neurons) this study keeps small. From the related theory, it seems that when the number of hidden units is adequate, it is possible to discover interesting mathematical structures to be used to characterize the learned data. Some of those features can be obtained by imposing such constraints on the mathematical learning process of the Autoencoder. Specifically, if a sparsity constraint is imposed on the hidden units, then the Autoencoder still discovers interesting structures in the data, even if the number of hidden units is large. In fact, in our proposed pipeline, the authors decided to impose these constraints in order to evaluate the possible new correlations in the input data related to the expression of the PD-L1 inhibitor. Formally, this study is interested in addressing the following problem (an Autoeconder with
n neurons and one hidden layer is assumed):
where
is assigned to the activation of the hidden j-unit when the network is given a specific input
y, while
represents the average activation of the hidden unit j (averaged over the training set with length m). The authors are interested to enforce the constraint:
where
is a sparsity index, typically a small value close to zero. In our case, a sparsity index fixed to 0.045 was defined. In other words, the average activation of each hidden neuron
j should be close to the selected sparsity radius i.e., 0.045 in the proposed pipeline. To achieve the above constraint, a kind of extra penalty term was used that penalizes all the activation j-unit
deviating significantly from
. Formally, the following further constraint was imposed:
where it is supposed that the hidden layer has nth number of neurons. With above constraint penalty, this study basically applied the well-known concept of the Kullback-Leibler (KL) divergence approach [
8] as the above constraint equation which can be re-written as follows:
Where the above KL divergence function may be defined as the divergence between a Bernoulli random variable with mean
and a Bernoulli random variable with mean
KL-divergence can be considered as a common function for measuring the statistical difference between the two distributions. The above penalty constraint has the property that
0 (if
and otherwise, it increases monotonically as
diverges from
A classical mathematical analysis of the above KL function shows that it reaches its minimum of 0 when
=
having the desired effect of causing
to be close to
Therefore, the overall corrected sparse latent representation of the input vector x can be obtained during the Autoencoder backpropagation learning process with the target to minimize the following extended cost function:
where J(W,b) is simple classical adopted cost function [
8], while μ is a kind of penalty rate controlling sparsity process described above. It is clear from the above equation that the term
depends on the weights’ matrix W and bias b also, because it is the average activation of hidden unit j, which is clearly correlated to the values of W and b. In this way, the Autoencoder is able to be induced to search for the inter-correlation of the input dataset and then improve the classification task. Moreover, the L2-regularization approach was introduced in order to reduce the overfitting issue [
8].
A two layer of so configured Autoencoder was designed i.e., a Stacked Autoencoder framework in which each of the used Autoencoder shows one hidden layer of 50 neurons and a sparsity penalty index = 0.045. At the end, a SoftMax layer was configured to classify the latent representation of the input dataset performed by the designed Stacked Autoencoder. In detail, the SoftMax layer classifies the data processed by the Stacked Autoencoder framework in two classes respectively: The first containing all the patients from the analysis of the TARGET lesion according to the proposed algorithm that can present a positive response to immunotherapeutic treatment (complete response, CR, partial response, PR or stable disease, SD); in the second class are those inserted who, again based on the analysis performed of the TARGET lesion, are not eligible for an immunotherapy treatment for bladder cancer as there would be a progression of disease, PD.
3. Testing and Validation of the Proposed Pipeline: Results
In order to validate the discriminatory performance of the proposed pipeline, the authors used a dataset of selected patients suffering from metastatic bladder cancer already treated on the front line with a chemotherapy treatment that unfortunately did not produce total regression of the disease. The experiments were carried out on 43 healthy subjects of both sexes (39 men and 4 women), aged between 40 and 79 years. The volunteers gave informed consent to the procedures approved by the internal Ethical Committee Catania (local Institutional Review Board) designated inside the Medical Oncology Department of the Emergency Hospital “Cannizzaro” located in Catania (Italy) and in which the patients were treated, monitored and followed both in the screening and the follow-up phase.
Table 1 shows the statistical characteristics of the dataset used to train and validate the proposed algorithm.
For each patient, a series of routine hematochemical data in addition to imaging were collected both before starting treatment and during the same in order to monitor the TARGET lesion identified according to the RECIST criterion. Basically, in the work herein, the authors used baseline CT-scan images acquired before the immunotherapeutic treatment, as a baseline on which to apply the proposed pipeline. Then, at half treatment and at the end of it, new CT-scan acquisition images were performed to evaluate the response of the immunotherapeutic drug analyzing the size of the target lesion identified according to the RECIST criterion. The selected TARGET lesions are both hematic (on organ) and lymphatic (lymph node). The dataset was subdivided partly for the training phase (65%—28 patients containing both cases belonging to the first class and cases belonging to the second) and the remaining 35% (15 patients) was used for testing and validation of the proposed method. The imaging for all patients was performed using a CT-scans multi-slice method.
Table 2 and
Table 3 show the statistical features of both the training and validation/testing dataset:
Therefore, considering the two classes of discriminators, the training dataset contains 60% of patients belonging to the first class (that is, who detect a positive response to the immunotherapy treatment) and 67.85% of the patients belonging to the second class instead, i.e., those who unfortunately show disease progression despite immunotherapy treatment. As for the validation and testing dataset, this is therefore composed of the remaining 40% of patients belonging to the first discriminating class and 32.15% of patients instead belonging to the second class. Furthermore, in relation to the other statistical aspects of the sample, from a comparison between
Table 1,
Table 2 and
Table 3, it is possible to ascertain that the same is well distributed both in relation to the training phase and in relation to the pipeline validation and testing session.
For each patient, the target lesion identified by the oncologists was monitored throughout the immunotherapy treatment. Specifically, the assessments referred to in the RECIST 1.1 criterion were performed with reference to the longest diameter (LD) of the monitored TARGET lesion. Therefore, at the end of the treatment, patients were considered responsive (totally or partially) if they fell respectively into the CR categories (complete response: completely regressed lesion), PR (partial response: At least a 30% decrease in the sum of the LD of target lesions) or SD (stable disease: when there has been neither progression of the disease nor significant regression). When, at the end of the treatment an increase in the LD value of the TARGET lesion was observed, the patient was classified as not responsive to immunotherapy treatment (PD: disease progression).
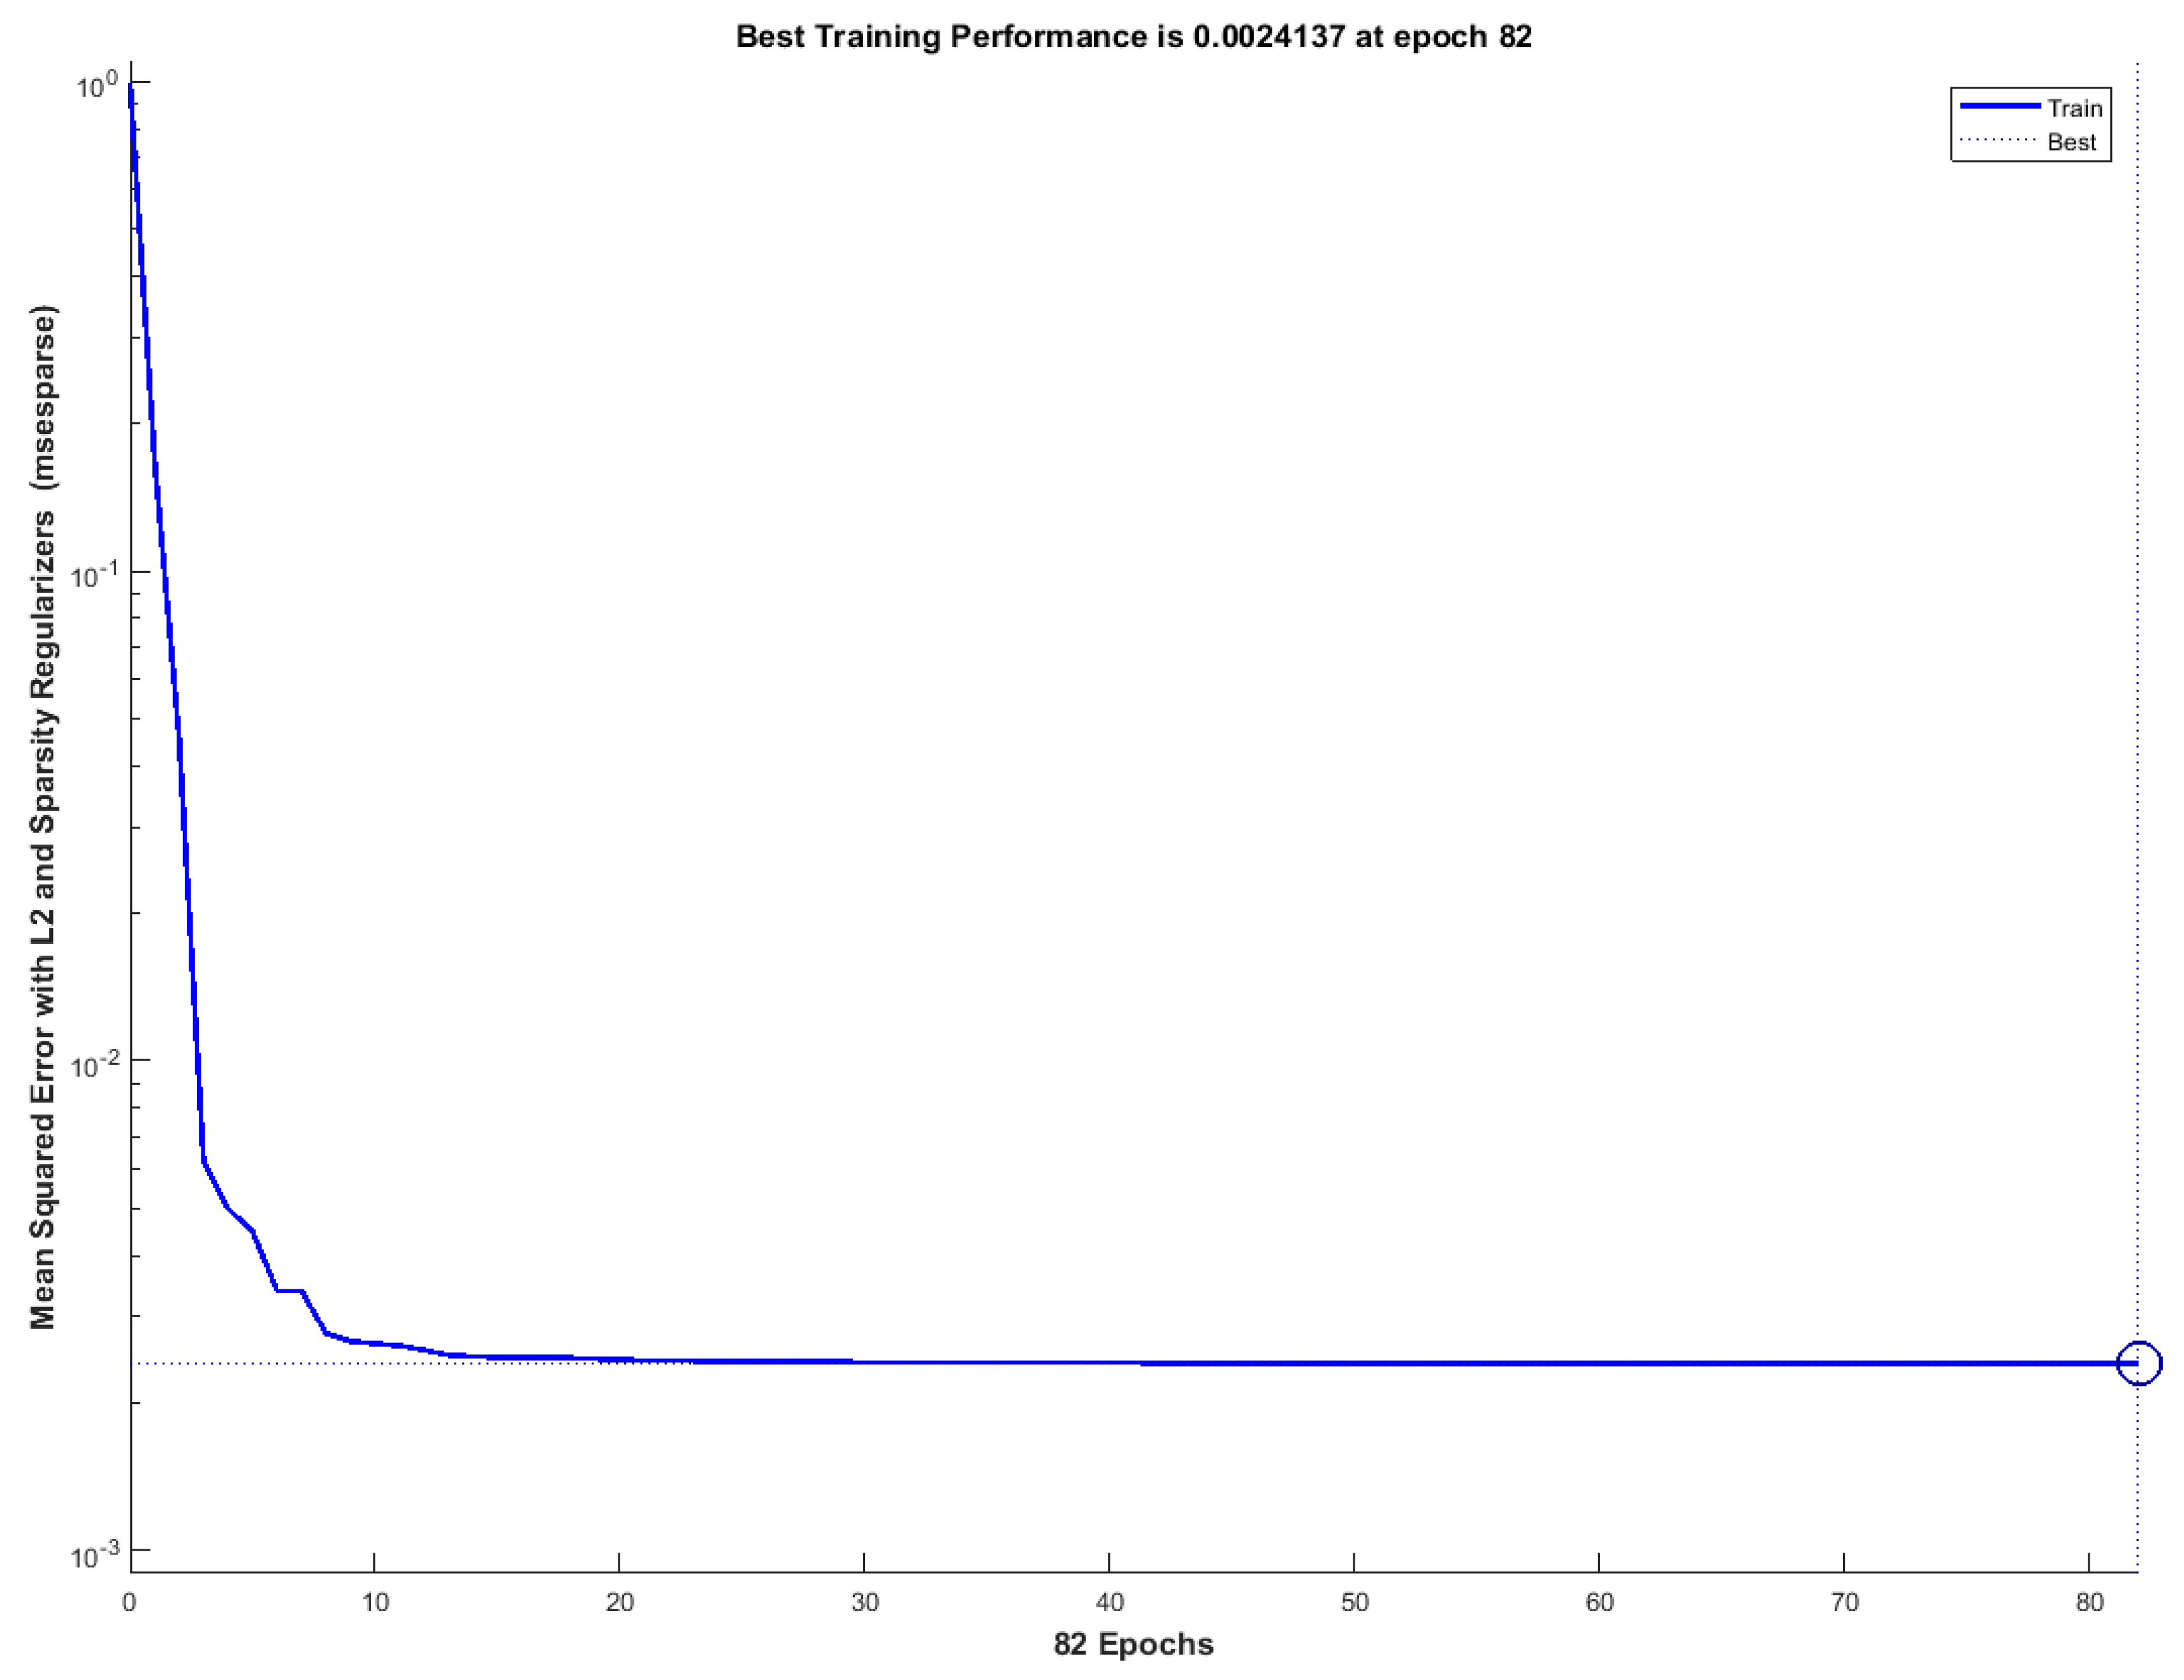
Figure 9 shows an instance of the decreasing learning error dynamic of the designed Autoencoder. In
Table 4, the performance evaluation of the proposed approach was reported. In order to highlight the advantages obtainable from the application of the proposed pipeline as a non-invasive, predictive method of a response to immunotherapy treatment, this study reports in
Table 5 the overall response rate (ORR) of a dataset of patients suffering from bladder cancer and treated in first line with chemotherapy, which were then treated with immunotherapy.
The above performance indexes have been computed as follow:
where we have denoted with:
TP: True positive prediction;
TN: True negative prediction;
FP: False positive prediction;
FN: False negative prediction;
The overall forecasted ORR with respect the true response rate retrieved from the analyzed dataset is reported in
Table 6.
The results reported in
Table 4 show that the proposed method is promising and deserves further investigation to make it more reliable as a decision-support tool for the oncologist who treats cases of advanced stage tumors where there is an applicable immunotherapeutic treatment. The specificity/sensitivity ratio also offers significant positive insights as the algorithm in this case has been able not only to discriminate with a good percentage of patients eligible for those not eligible, but also manages to predict with discreet effectiveness those patients who could have a minimum benefit from immunotherapy (sensitivity).
The patients of the dataset used to test the proposed pipeline were treated in two clinical trials, with Atezolizumab and Durvalumab drugs which, as reported in
Table 5, show an ORR average in the range of 14.5–17.8%. From
Table 6, it is also possible to understand that in the analyzed dataset, the actual ORR obtained (16.28%) is aligned with the scientific studies presented in the literature [
37] if stable disease (SD) patients are excluded from the computation of a positive outcome class as a scientific benchmark reported in the literature [
37]. Therefore, with a pipeline able to discriminate with an accuracy of approximately 86%, this study, on average, was able to identify early and non-invasively most of the patients who will benefit from the immunotherapy treatment. With sensitivity/specificity indexes of more than 80%, those who are eligible for immunotherapy treatment can be adequately discriminated by those who are not. It is reiterated that this result can be obtained simply by analyzing the basal CT scans imaging acquired just before the start of the treatment, without any need for biopsies or similar procedures. Obviously, these are preliminary results that need to be validated by a multicenter randomized study that includes a larger and a statistically significant patient dataset. It would also be advisable to understand if it is possible to generalize and extend the obtained results to other tumor histologies.
Moreover, using this algorithmic approach, it is possible to structure a further correlation between the immunotherapeutic response and the hyper/hypo expression of the PD-1/PD-L1 checkpoint that goes beyond the simple quantification of the level of expression with respect to the static threshold of 50%. However, this does not always provide a deterministic criterion for assessing eligibility for immunotherapeutic treatment. This latent correlation is certainly included in the latent mapping constructed by the Autoeconder in the information signal datasets related to the morphological dynamics of the analyzed TARGET lesion. Therefore, a more accurate analysis and structuring of the deep learning framework could improve the understanding of this correlation. Obviously, these are preliminary results and a dataset of 43 patients is certainly not sufficient to confirm the robustness of the proposed pipeline with mathematical certainty, although it is certainly a good starting point.
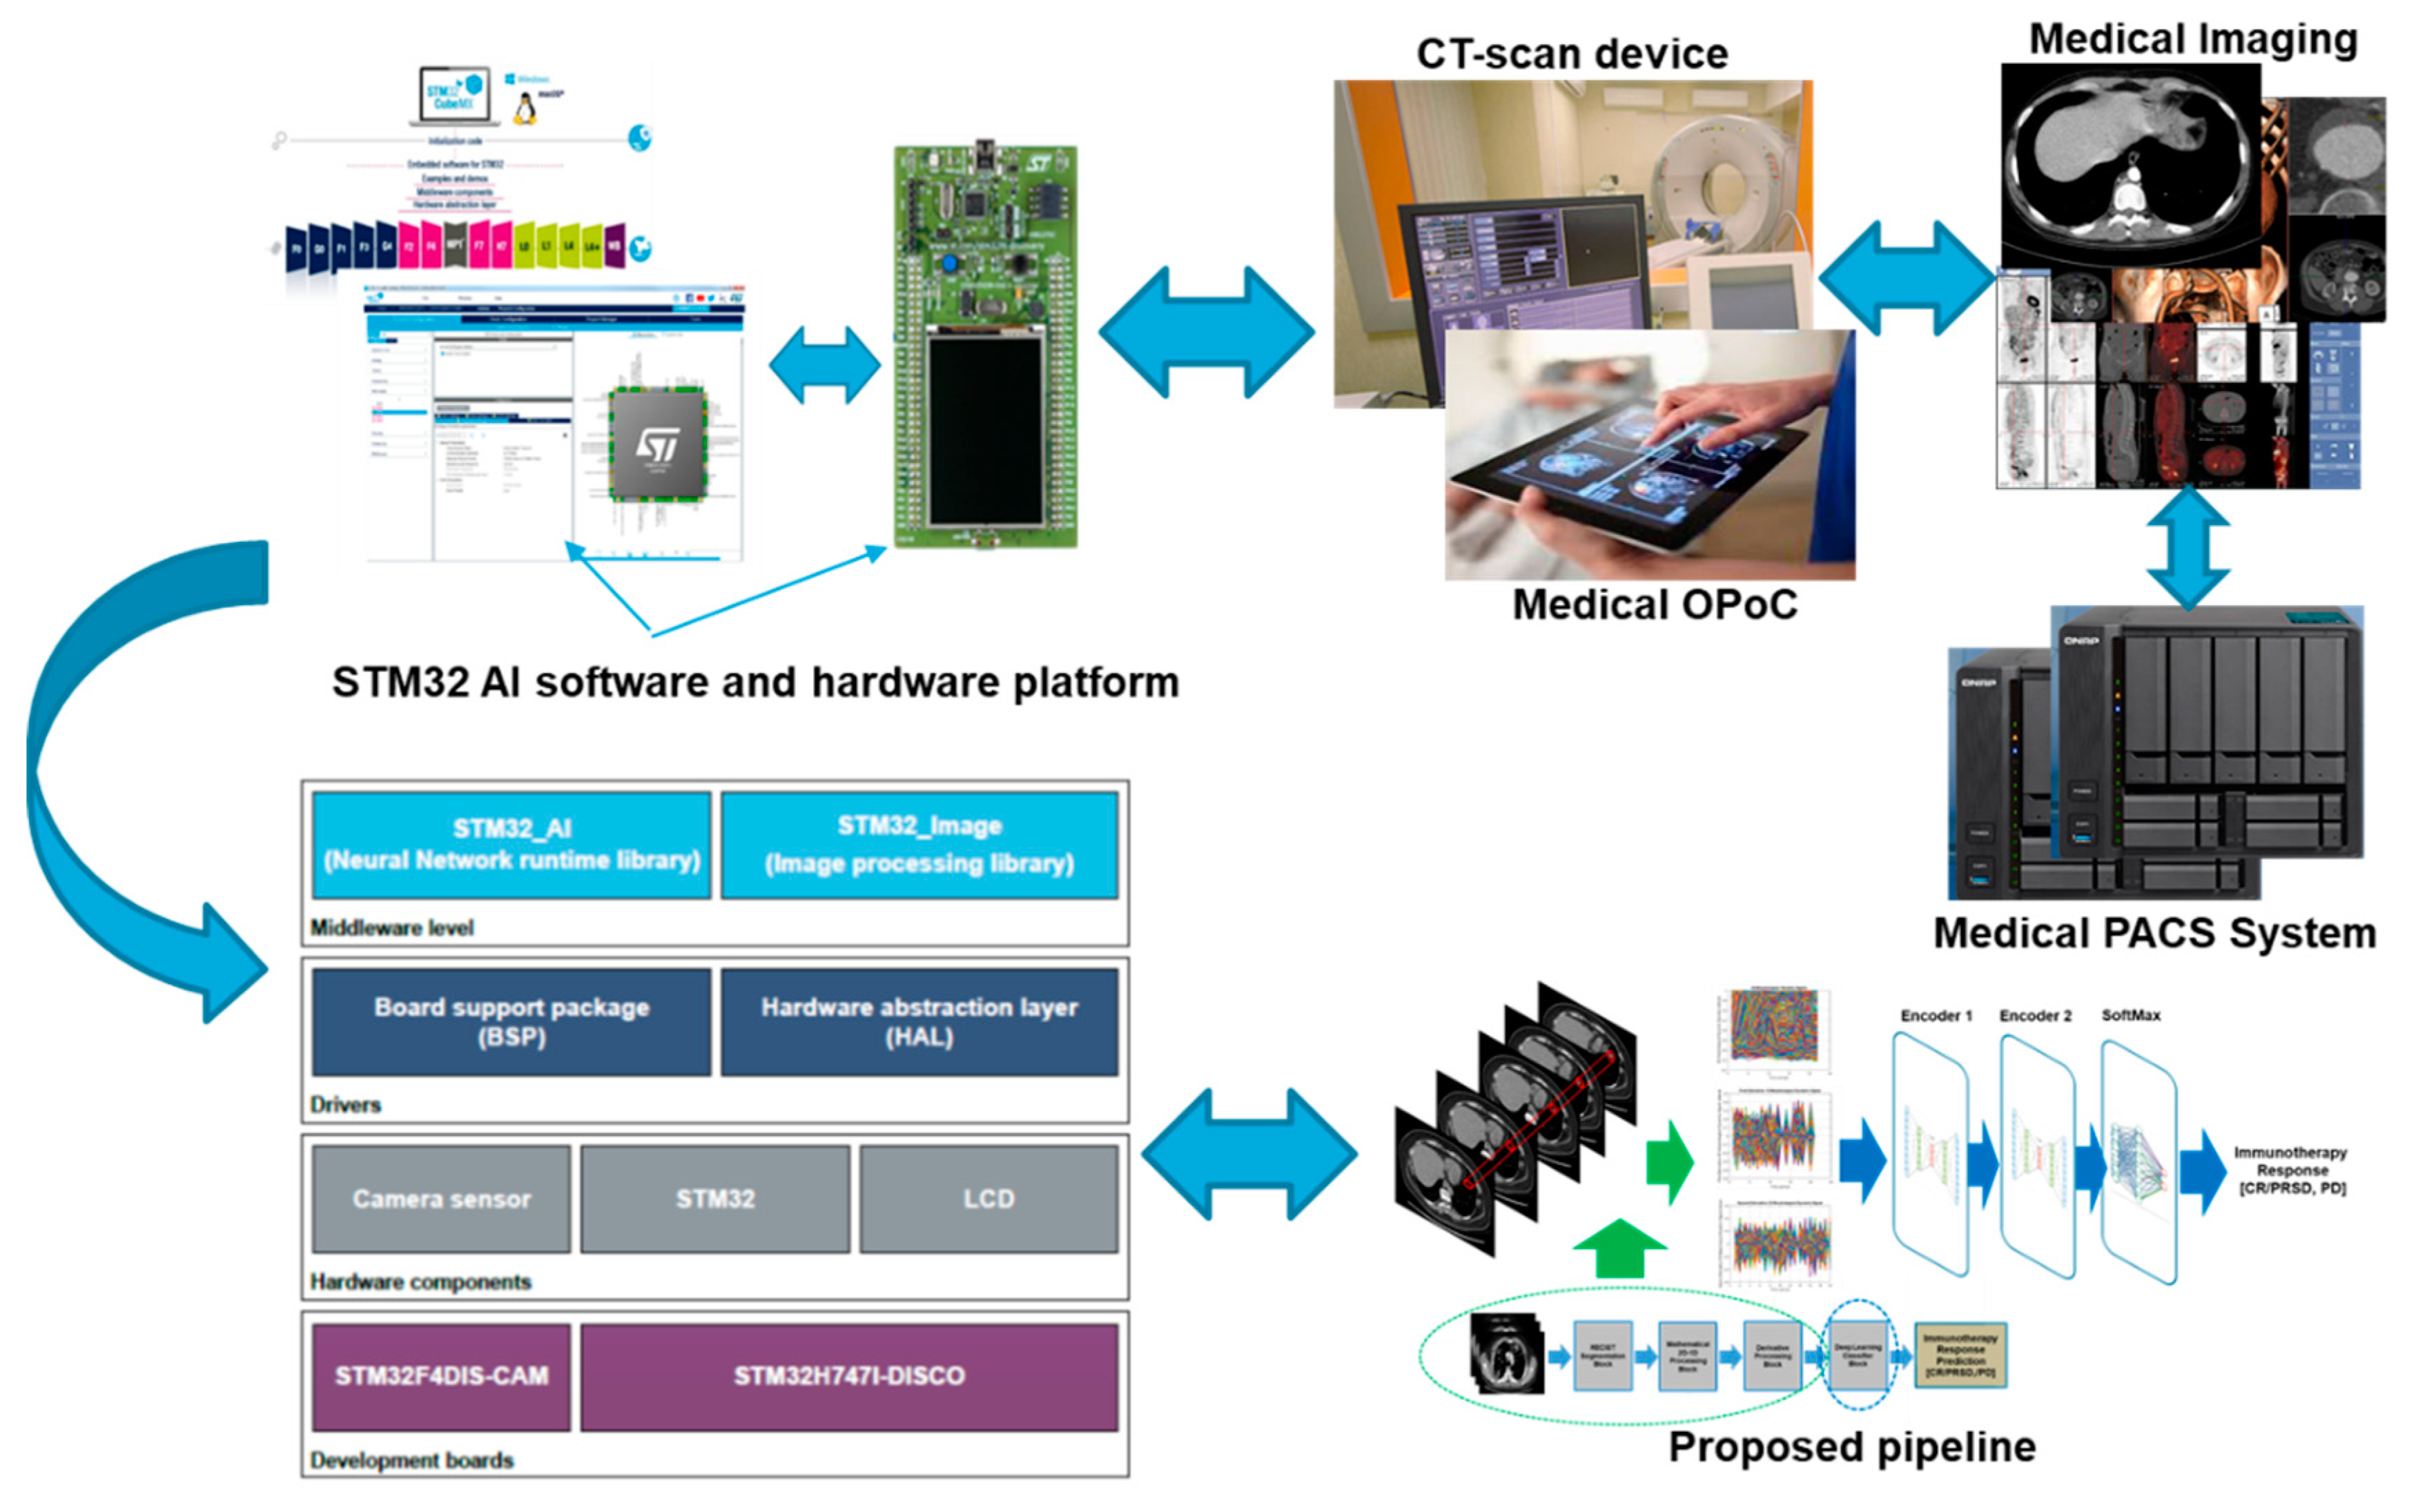
Currently, the proposed method is being ported to the embedded platform based on STM32 microcontrollers equipped with a software platform that allows the development of applications based on deep learning [
38]. The use of an embedded platform such as the one based on STM32 cores (which in fact include such ARM Cortex Ax) allows the creation of a hardware add-on for current imaging devices (such as CT-scan devices). Moreover, considering that the STM32 platform proposed is to host as firmware, the algorithm described in this work is in fact a stand-alone embedded system. The goal of the proposal is to implement an oncological point of care (OPoC) that by acquiring the digital imaging scans (CT-scans, MRI, etc.), it is able to provide an estimation of the overall response rate with respect to the possible medical treatments available in a short time. The access to imaging data can take place through the classic Picture Archiving and Communication System (PACS) systems used in all medical-hospital facilities for digital sharing of patients’ medical-diagnostic data. The connection to the PACS server data is obviously strictly protected by appropriate authentication protocols that guarantee the safety of sensitive patient data. The realization of an OPoC is certainly an important step forward in cancer research. In fact, if an OPoC were made available to every oncologist, it would be possible for the physician to obtain an early elaboration of the patient’s medical data. In this way, the oncologist could receive support from the proposed system which, on the basis of the imaging data, is able to evaluate in advance the eligibility of the patient for a given treatment, be it chemotherapy or immunotherapy. As reported in
Figure 10, the STM32 software equipment includes special libraries that allow the development of algorithms based on deep learning as well as a set of libraries useful for the classic image processing operations needed to implement the proposed method. The actual algorithm is stored as firmware within the STM32 core. Moreover, in the hardware abstraction layer (HAL) block, the proposed embedded system is able to provide the necessary drivers to manage external devices such as sensors, diffusers, temperature detectors and other medical devices. This part is currently being developed for the integration of the part of the system related to the use of the SiPM sensor. In fact, as described in the previous paragraphs, there would seem to be a link between the response to medical treatment (including both chemotherapy and immunotherapy) and specific physiological patterns that the authors are studying through the use of a particular sensor called SiPM [
14,
15,
16,
17,
18,
19]. The final idea would be to equip the OPoC device with this sensor in order to correlate the imaging data with the physiological patterns to make the predictive analysis of the response to the oncological medical treatment for evaluation more robust.
Figure 10 shows the embedded hardware/software platform for carrying out the porting of the proposed pipeline [
38].


