1. Introduction
In the last few decades, the global positioning system (GPS) has been widely employed in positioning and navigation because of its high reliability and accuracy, and because of its real-time positioning capability [
1]. In indoor environments, however, this power substantially declines and it may even be impossible to accurately and continuously locate the coordinates of the followed object, largely due to building structures, building materials, and other obstructions [
2].
Recently, with the rapid development of high-intensity, solid-state white LEDs, the idea of using LEDs for both illumination and data transmission has become a promising trend in contemporary applications [
3], particularly the growing demand for positioning techniques in indoor environments where people spend approximately 90% of their time during the day [
4]. Also, LED lighting technology is gradually replacing conventional indoor lighting methods due to its safety, economy, and environmental friendliness [
3,
5]. Additionally, visible light communication (VLC) has recently emerged as one of the most promising candidates for fifth-generation (5G) mobile communications [
1]. Several other types of wireless signals have been applied in indoor positioning fields, such as WiFi, RFID, Bluetooth, and Zigbee, and each of them has unique strengths, although their positioning accuracy remains somewhat limited [
2].
In this paper, we propose a novel kNN-RF model based upon the traditional fingerprint technique. Unlike the existing received signal strengths (RSS)-based algorithms, in this scheme k-nearest neighbors (kNN) is responsible for enlarging the number of inputs for the next random forest (RF) model, which needs enough data to avoid overfitting and to obtain more accurate training results. Not all data generated from kNN are used by the RF model; rather, the data are sent through an evaluation and collection process which ranks the importance of each feature and eliminates the useless ones. This process reduces the computational time and increases the capacity of the RF training operation. Another noteworthy point is that our proposed model incorporates the strong effects of multipath reflection, ambient light, and other noises. Our approach produced a remarkable reduction in the error range from 94.2 cm by the conventional kNN method to 19.3 cm by the kNN-RF method.
The main contributions of this paper are as follows:
- ▪
Most of recent VLC-based research have ignored the impact of reflection (see
Section 2). However, this noise exerts a very bad influence on the positioning accuracy, especially in areas outside the room’s center. In this paper, the effects of multipath reflection are thoroughly explored at the highest reflective rate.
- ▪
We propose a novel machine learning-based indoor positioning solution. This method first uses kNN as a powerful tool to expand the number of features for RF in the next step. Then the position of the mobile object can be located based on the estimation process in the RF algorithm which collects all the features directly from both the LED lights and the kNN output signals.
The remainder of this paper is organized as follows.
Section 2 summarizes and analyzes some related works.
Section 3 introduces the system model with and without multipath reflections, and then presents our proposed algorithm in detail.
Section 4 discusses our simulation results and performance evaluations, then some proposed real applications are presented in
Section 5, and
Section 6 offers our discussion and conclusion.
2. Related Work
To improve accuracy, several VLC-based positioning techniques have been proposed [
6], including the angle of arrival (AOA) [
7], time of arrival (TOA), time difference of arrival (TDOA) [
8,
9], phase difference of arrival (PDOA) [
10,
11], and RSS [
12,
13]. Each of them has distinct limitations: AOA helps considerably to reduce the positioning errors but requires high computational complexity; TOA and TDOA need to ensure compliance with strict requirements for synchronization; PDOA requires a lower computational time than TDOA but needs a local oscillator; and RSS-based positioning accuracy is considered moderately low because of the effect of ambient light, noises, and the tilt angle of the photo-detector (PD) [
10].
In addition to diverse types of signal-based positioning methods, a few positioning algorithms have been developed to optimize the quality of indoor positioning systems (IPS). In Reference [
12], the authors proposed an improved kNN model by applying weights to more accurately determine the Euclidean distances.
Another approach, which compares machine learning and other conventional RSS-based solutions, was presented in Reference [
13]. However, the general focus of these articles ignores multipath reflections, even though they actually exist and have an enormous impact on the system quality. To elucidate these impacts, the authors in Reference [
14] proved that the influence of multipath reflections is much weaker and seems to be almost unaffected in the central region of a given room. In contrast, the reflection in other areas (i.e., the corners and edges) is more powerful than in the case of no reflection. In the given results, the positioning errors in the corner unexpectedly increased and reached roughly 2 m.
In Reference [
15] the authors used the trilateration method to show that the positioning errors increased by 76 times, from 2 cm using line-of-sight (LOS) compared to 152 cm with non-line-of sight (NLOS). In Reference [
16], the authors proposed a new approach to reduce the positioning error by using calibration methods, including selecting the strongest LED signal and decreasing the distance between the LED bulbs. As a result, there was a considerable improvement in the positioning accuracy, and the errors in the whole room were at 0.3 m and 0.25 m as a result of LED selection and changing the LED distance, respectively. However, the corresponding errors outside the central region were still high, at 0.47 m and 0.36 m. Additionally, a change in the number of LEDs and the distance between them may lead to changes in the structure of the room and illumination intensity. These analyses demonstrate that interference exerts a very negative influence on the positioning accuracy of LOS and NLOS, especially in corners and near edge areas. To reduce such detrimental effects, the authors of Reference [
17] presented a new way to improve the positioning accuracy in a room corner, based on tilting the image sensor. They did not consider the multipath reflections and still achieved low accuracy at some points, and found it difficult to determine the optimal tilt angle.
3. System Model and Proposed Positioning Method
In this section, we first investigate the system model used for the proposed solution. This model consists of a directed optical channel and a non-directed optical channel. In each part, we focus on calculating the received optical power, then the total received optical power from both channels are shown. Next, a typical system configuration and our proposed kNN-RF algorithm are introduced in detail.
3.1. System Model
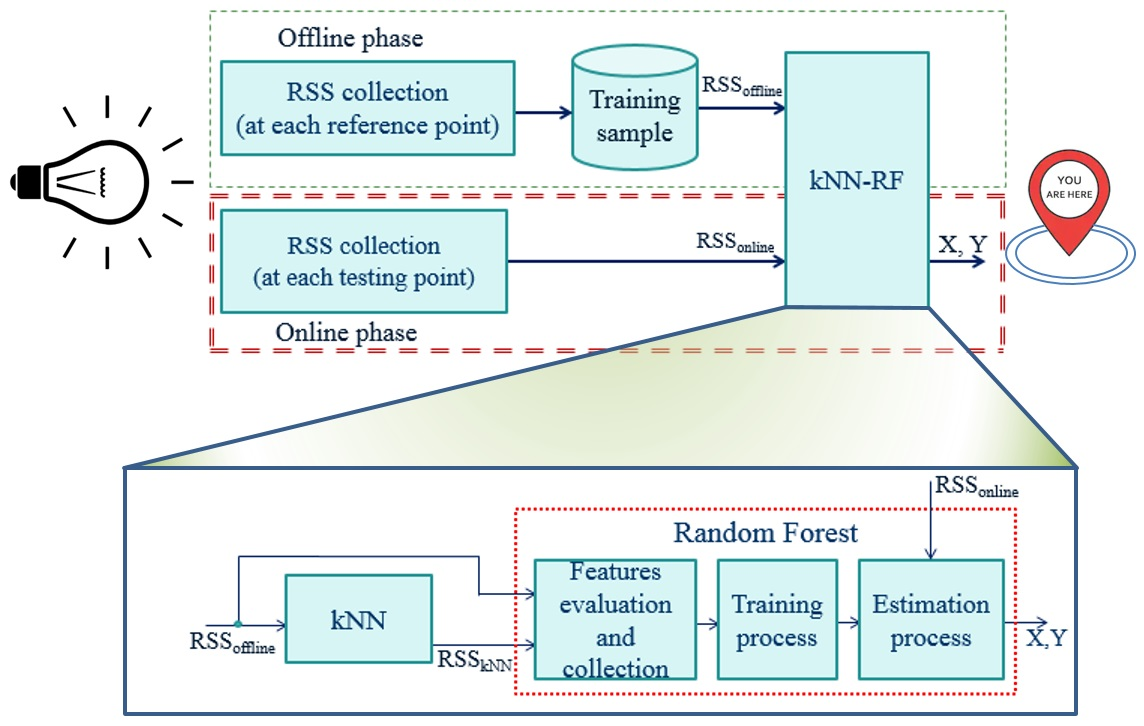
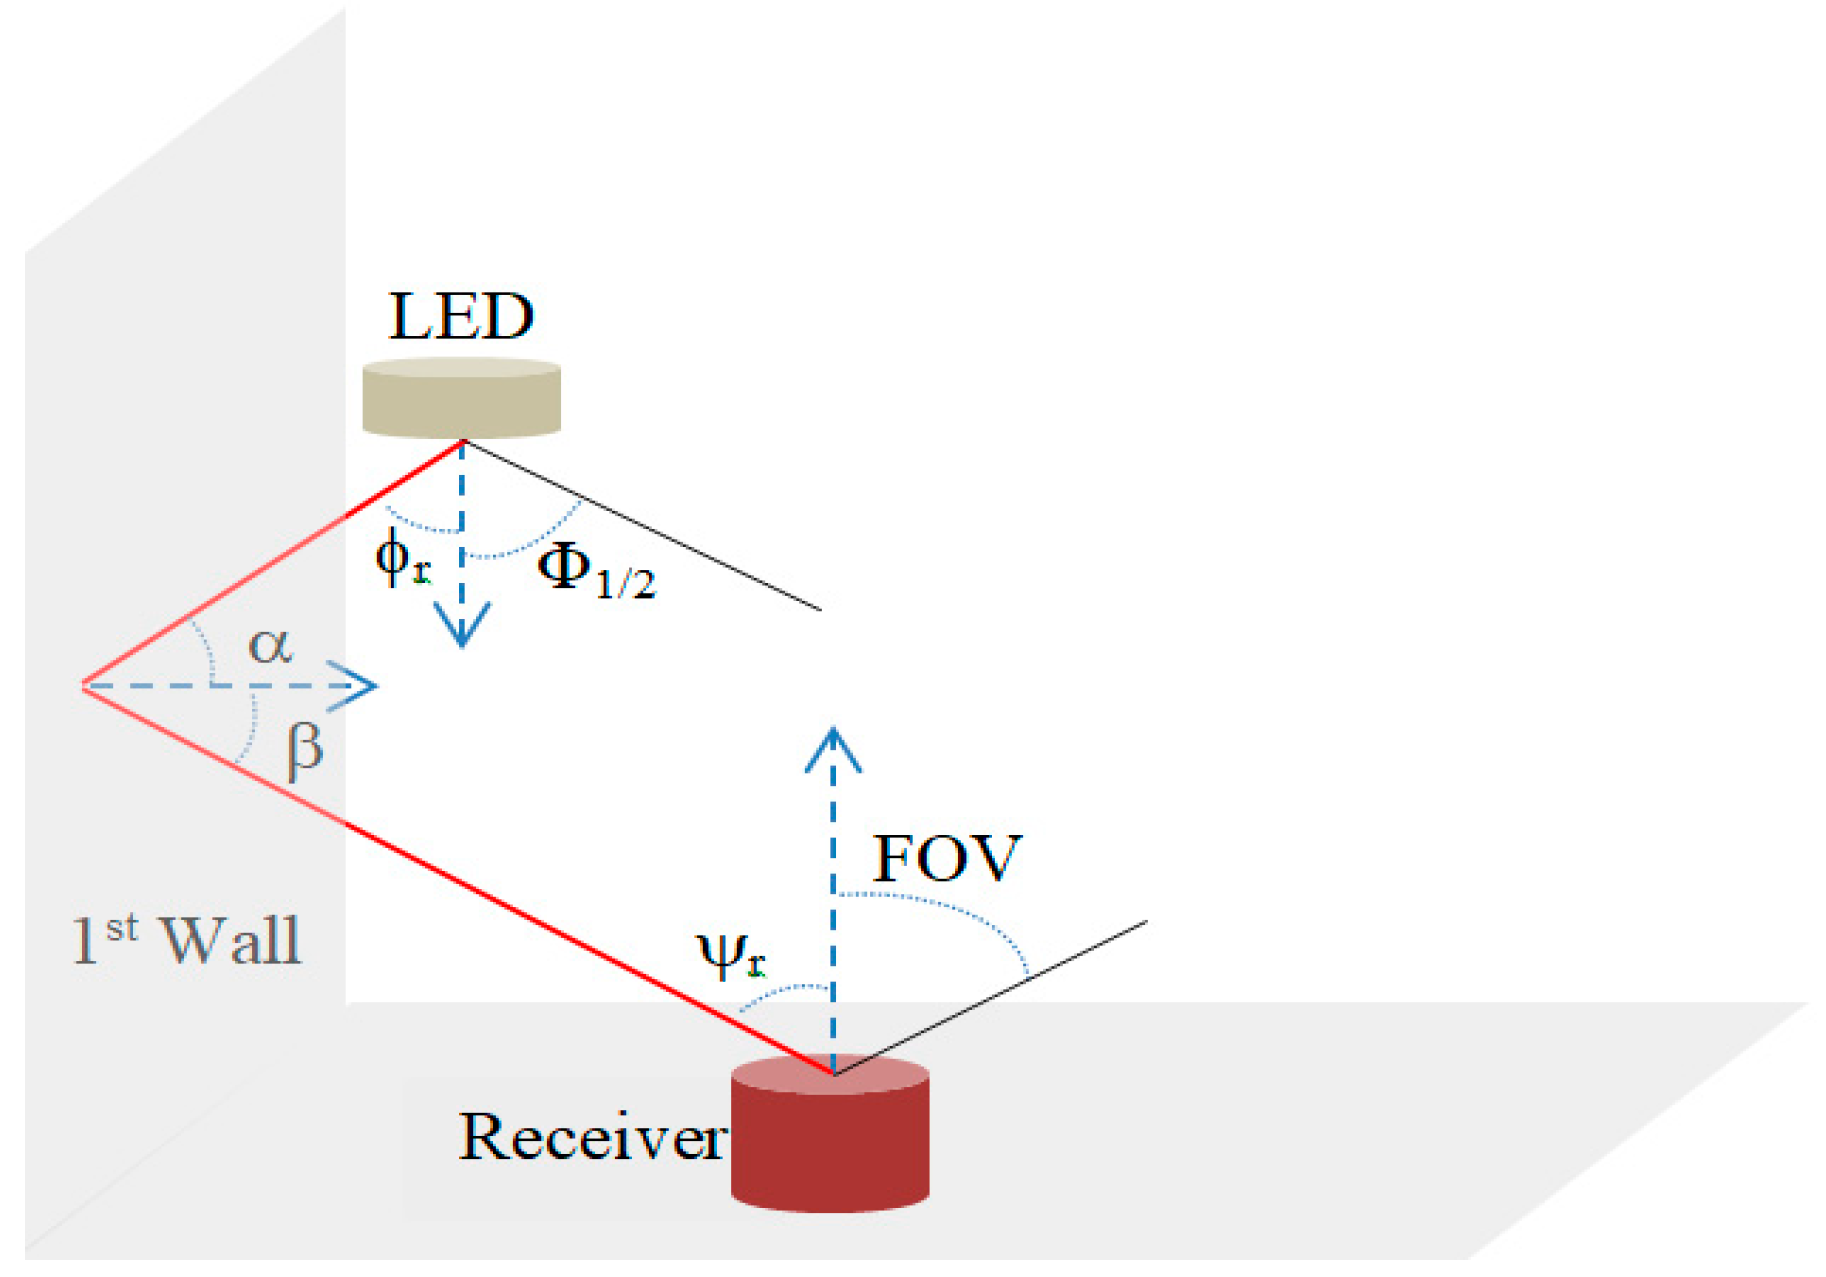
3.1.1. Directed Optical Channel
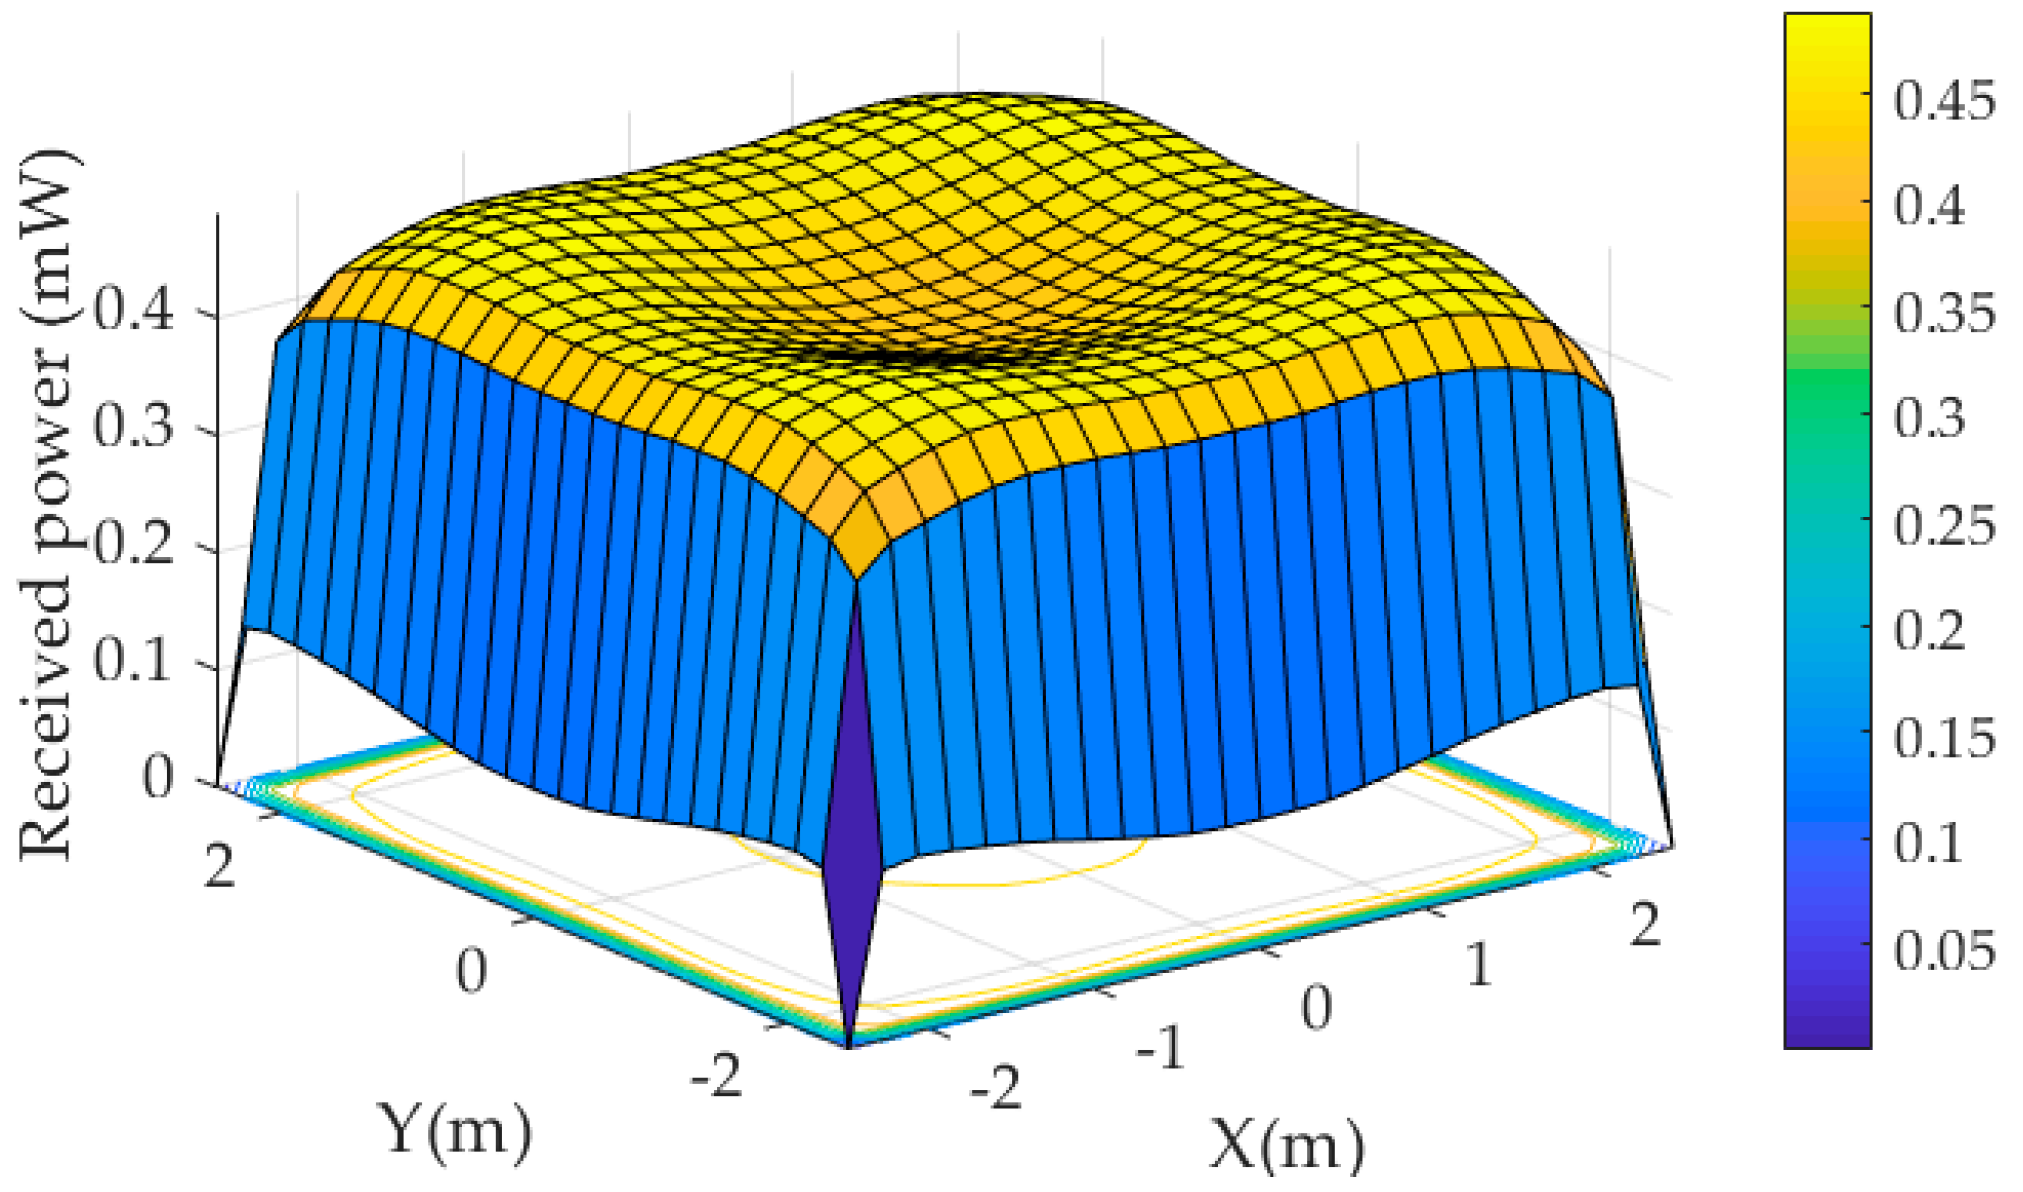
The directed optical channel, or LOS path, is shown in
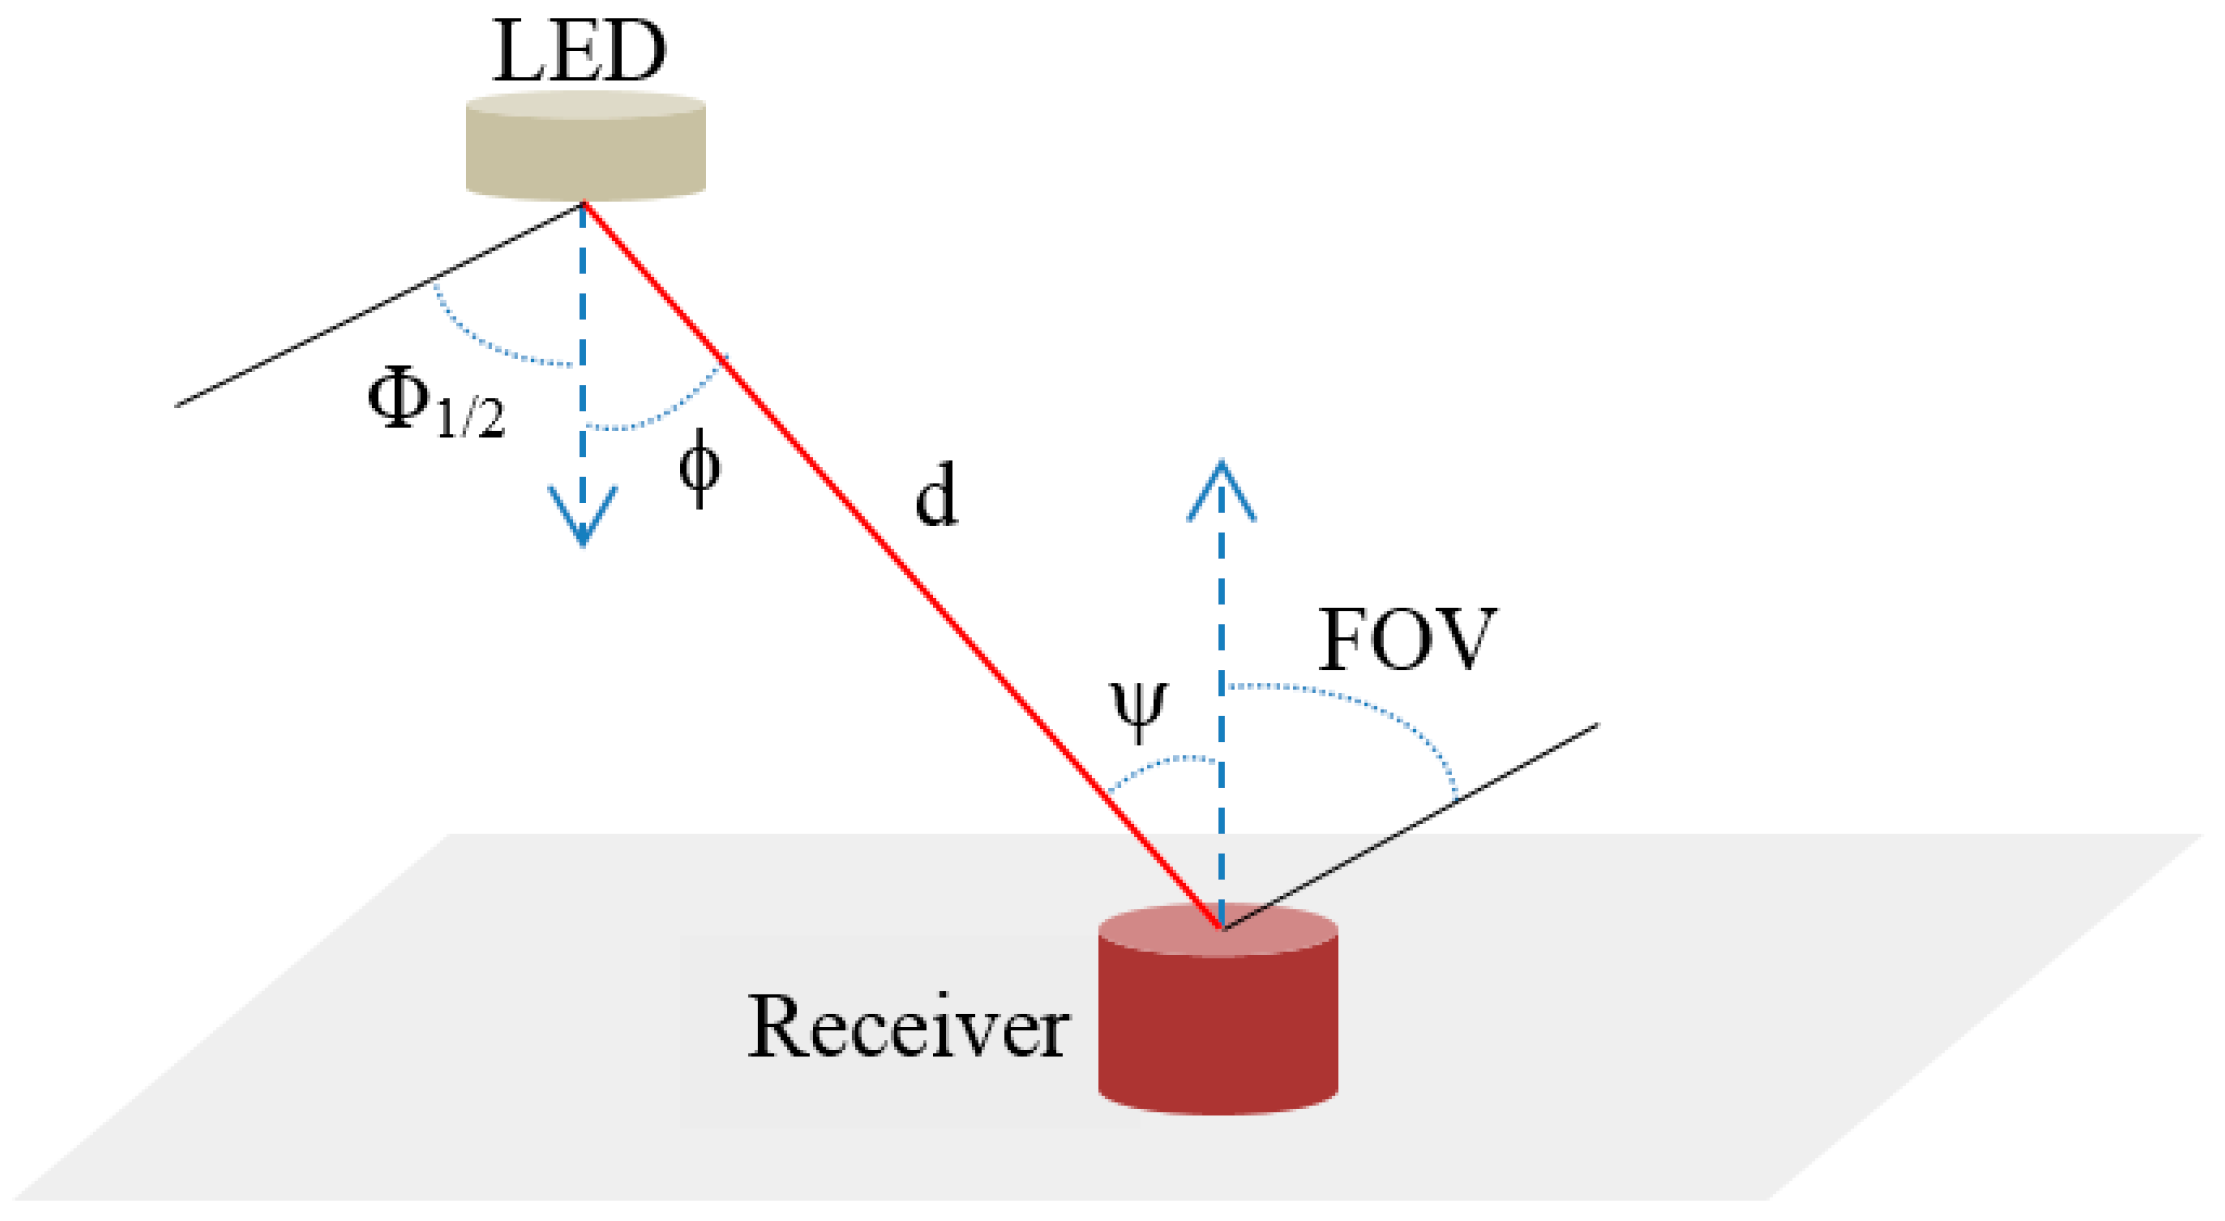
Figure 1. This channel is of vital importance in almost every indoor VLC positioning system because it receives most of the total optical power. As illustrated in
Figure 2, the maximum received power is 0.92 mW and the minimum is 0.34 mW. The power distribution in the central region appears quite uniform, and the illumination intensity in this area is stronger than other areas, especially in the corners.
To compute the LOS power, we assume that the distance and the angle from the transmitter to the receiver are
d and ϕ, respectively. The irradiance angle ϕ and incidence angle Ψ are of equal value because we accept that both the LED and the photosensitive area of the receiver are parallel to the floor (see
Figure 1).
To effectively detect the presence of visible light from the LED, the signal collection area on the optical sensor plays an important role. This area has a great influence over the positioning correctness and can be calculated as [
18]:
where
APD is the active detector area of the PD;
Ts(Ψ) is the gain of the optical filter;
g(Ψ) is the gain of the optical concentrator; and Ψ
c is the receiver field of view (FOV).
The irradiance (W/cm
2) is given by Reference [
18]:
where
Pt is the transmitted power;
d is the transmission distance from the LED to the PD; and
Ro(ϕ) is the Lambertian radiant intensity, written as [
19]:
where
n is the Lambertian order and is determined from [
19]:
The optical power gathered from the LED lamps can be expressed as [
18]:
Finally, the total directed optical power at the receiver is as follows [
5]:
3.1.2. Non-Directed Optical Channel
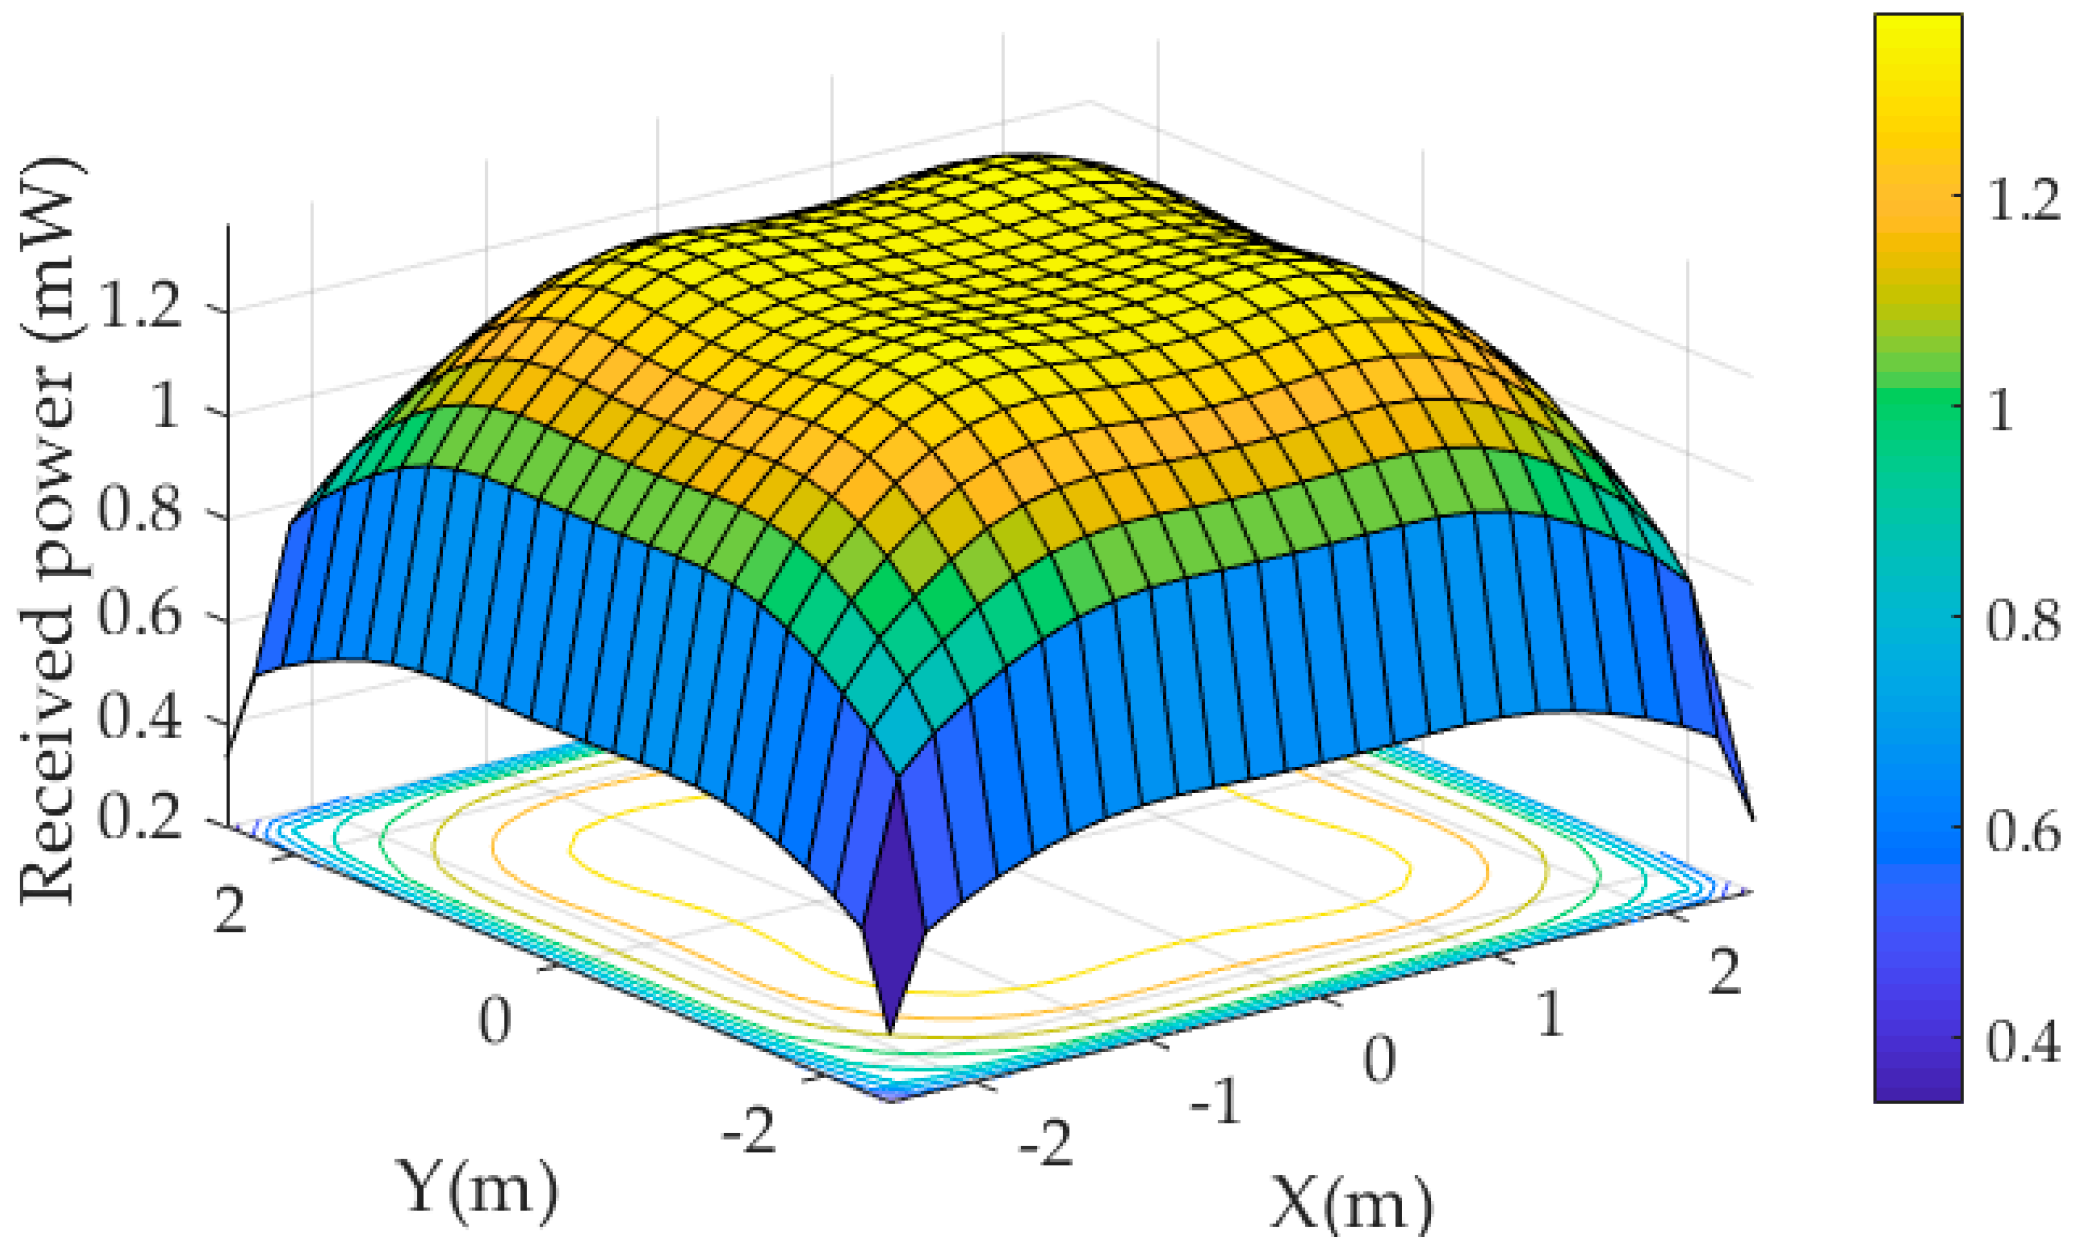
To evaluate the impact of multipath noises on the system performance, we conducted a comprehensive study of the effects of the first reflection from the four walls around the room. In practice, the reflection of visible light always exists in an indoor environment, especially in a narrow space with walls, ceiling, floor, and some pieces of furniture. As can be seen in
Figure 3, the active area of the receiver is facing upwards and is parallel with the floor. Hence, it is impossible to have a sense of the first signal reflected from the floor. In addition, the direction of the LED bulb is facing downwards, and we also set the half-power semi-angle of each bulb at 60° and the distance from the light source to the ceiling at 0.7 m. This meant that the amount of light which the ceiling directly received from the LED bulb was completely restricted. Furthermore, any additional reflections could be neglected because they would have no significant effect compared to the total noise level power [
20]. For these reasons, we chose the first reflection from the walls and the LOS signal as the major channel model in our work.
Figure 4 illustrates that the power distribution in the corner and near the wall was higher than in the central area.
To compute the received power of the first reflection link, we compute the received power at a reflective point on the wall as follows:
where
Is(
d1, ϕ) can be obtained from Equation (2);
d1 is the distance between an LED and a reflective point; and
Aeff_wall is the effective signal collection area on the wall and is given as follows:
where
dAwall is the surface element on the wall and α is the angle of irradiance from an LED to the reflective point.
Based on the cosine law and the inverse square law, the transmitted power from a reflective point is then given:
where
d2, β are the distance and the angle, respectively, from a reflective point and the receiver, and
ρ is the reflectance factor.
Substituting Equations (8) and (9) into (10), we have:
From here, the PD uses
PT_wall as the input signal from the non-direct link, and the final power
that the sensors collect can be calculated as:
where Ψ
r is the incidence angle of the light from the wall.
Finally, we adopt the non-directed optical power as follows [
5]:
3.1.3. Overall Optical Channel
In this paper, the overall channel is considered as the connection between the LOS path and the diffuse reflection path. The purpose of this combination was to further investigate the undesirable effects of reflection on the system performance and to make our simulation results more reliable and practical. Furthermore, as previously discussed in
Section 3.1.1 and
Section 3.1.2, we simply focused on the first reflection path from the four walls around the empty room and thus, the total received optical power from the four LED groups is the sum of the directed and non-directed optical power (see
Figure 5) given by:
3.2. Proposed Positioning Method
3.2.1. System Configuration
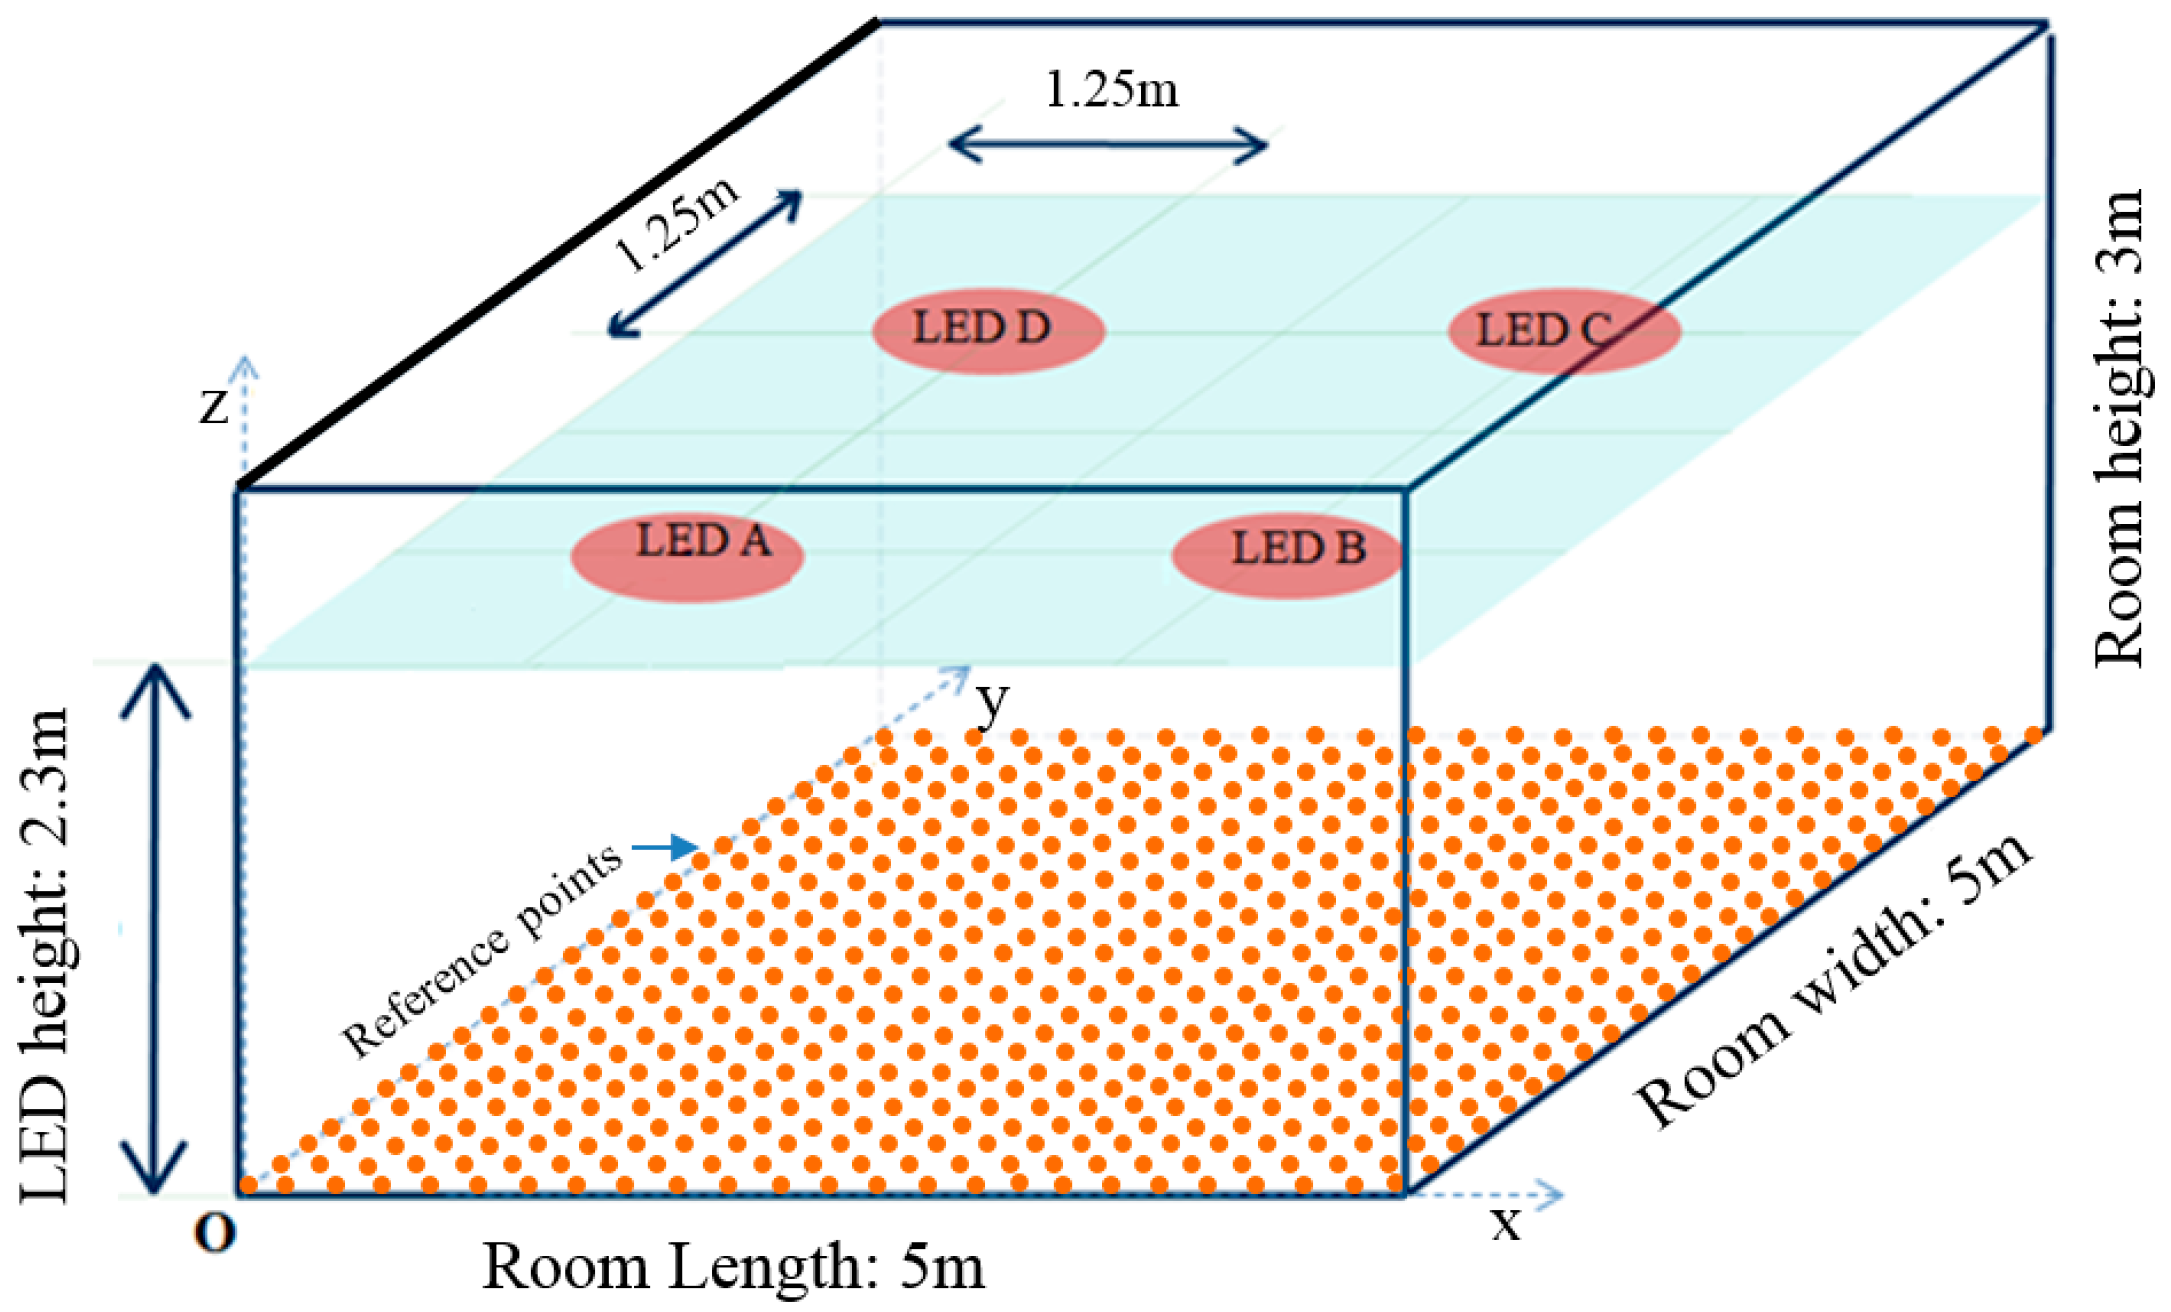
An overview of a typical room model is shown in
Figure 6 [
14], where its length, width, and height are fixed at 5 m, 5 m, and 3 m, respectively. We assume the LED bulbs are installed on an imaginary plane at a height of 2.3 m from the floor. Four LED bulbs are used in this model, and each of them has 10 W of transmitted optical power and a half-power semi-angle of exactly 60°. In our system, the receiver moving around the 25-m
2 floor has a PD active area of 1 cm
2 and is parallel with the floor. Other technical parameters related to the transmitters, receiver, and multipath reflection noise are summarized in detail in
Table 1.
3.2.2. kNN-RF Algorithm
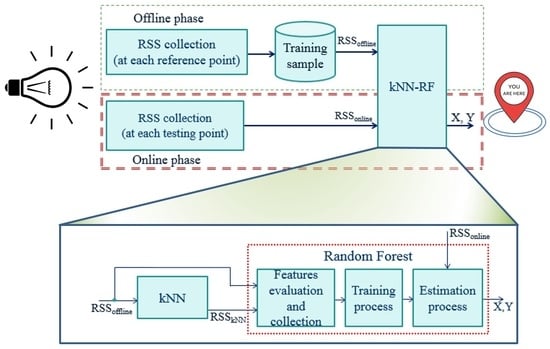
In the following section, we present a novel fingerprint location method known as kNN-RF, a combination of kNN and RF. In particular, the training data are expanded by kNN, and this leads to a significant improvement in the positioning accuracy after the RF training process.
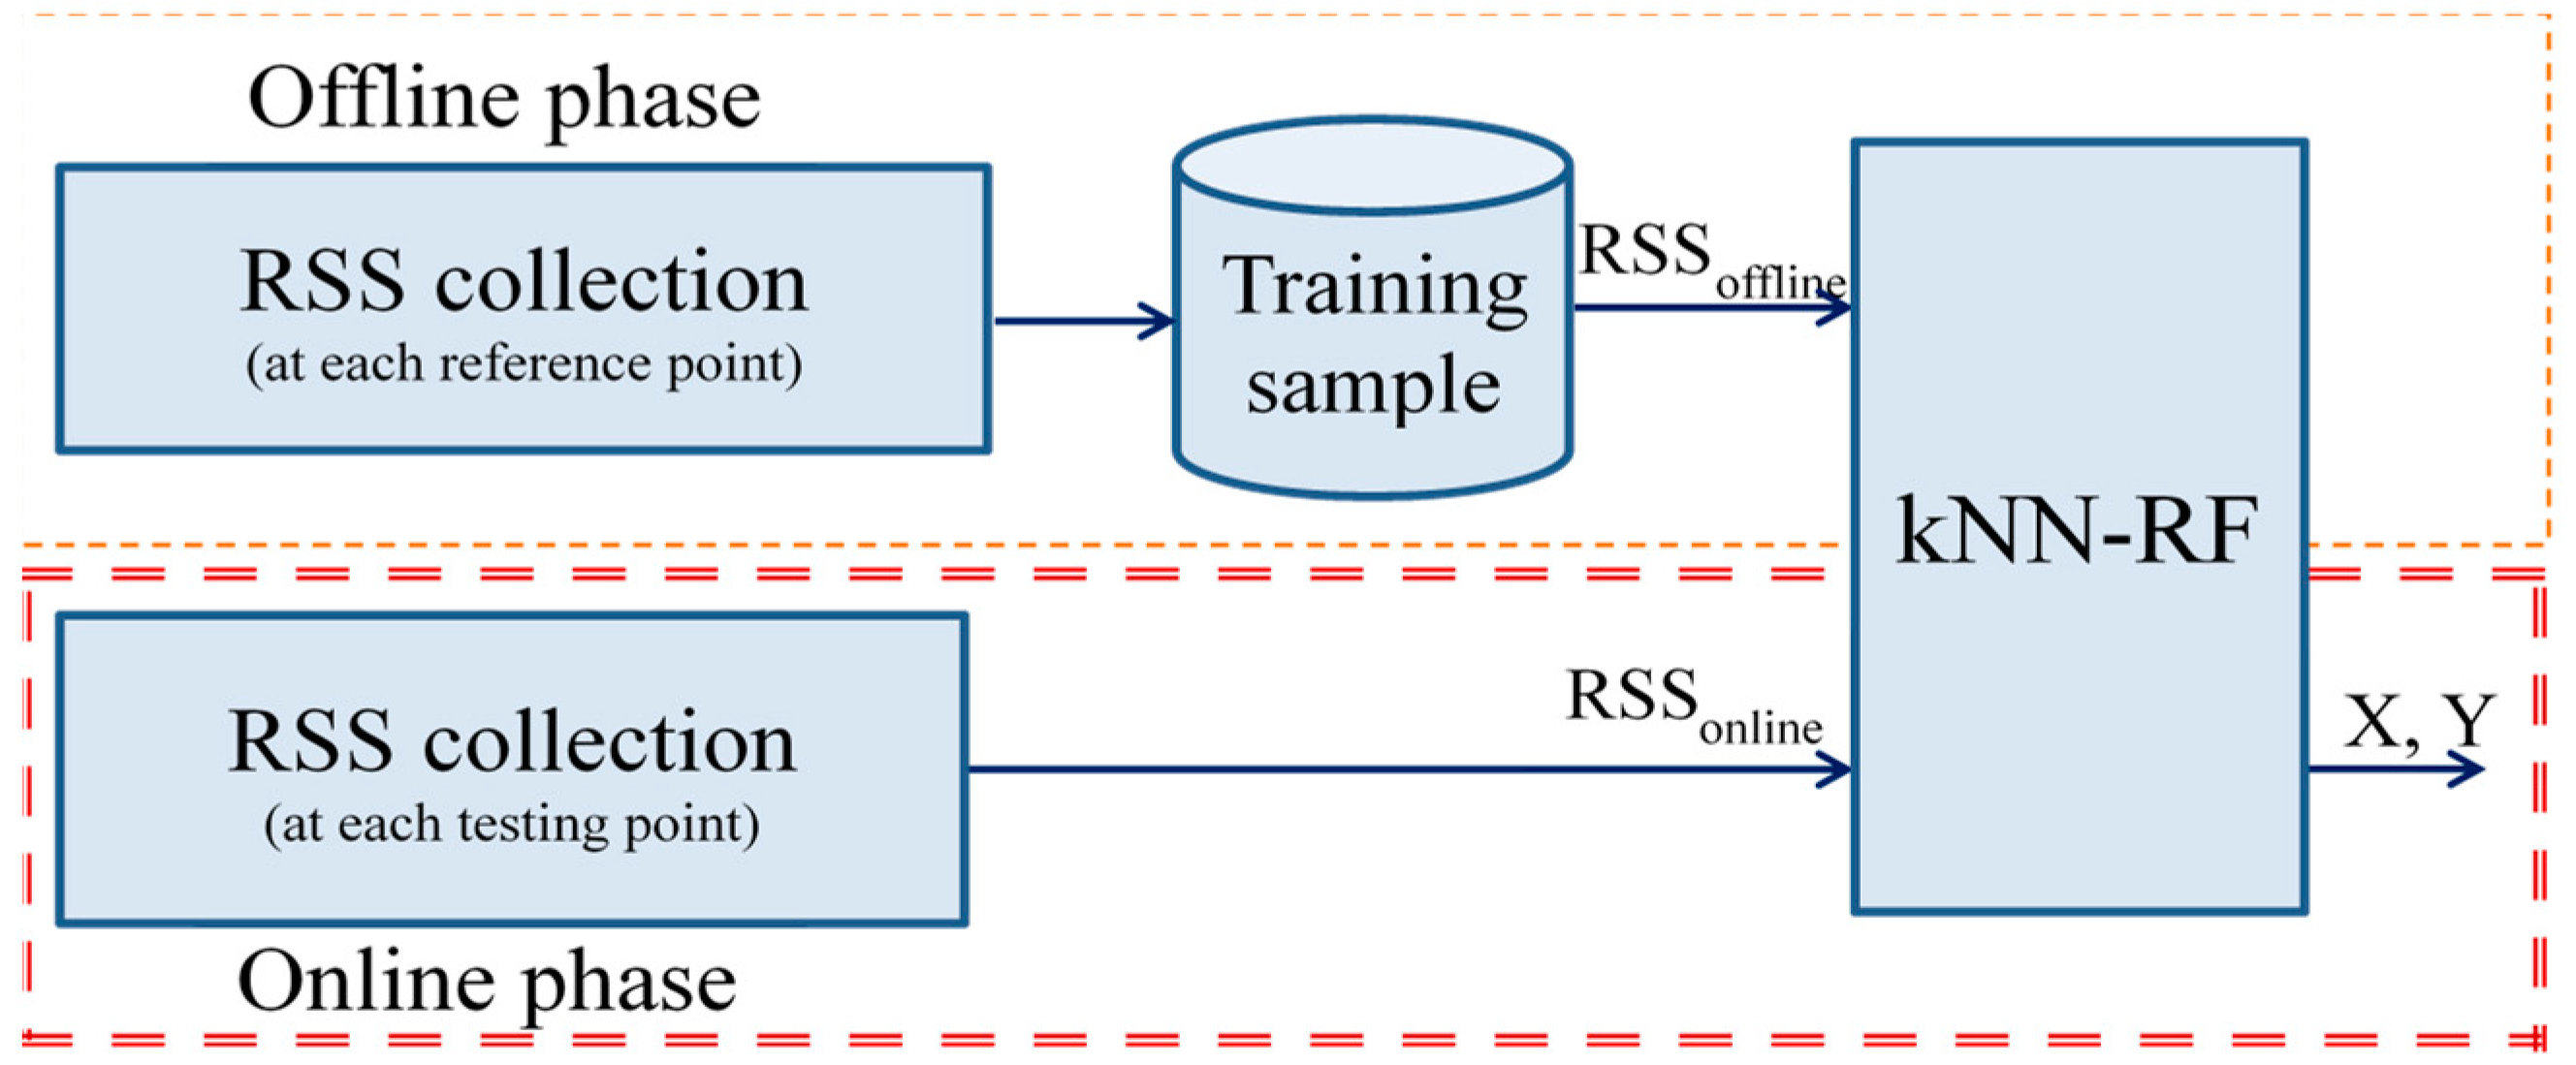
The proposed RSS-based technique can be divided into two main phases— the offline phase and the online phase (
Figure 7).
The offline phase plays a key role since it takes most of the program execution time. This phase consists of three separable basic steps. First, based on the area of the floor (see
Figure 6), we prepared a feasible number of reference points (25 × 25) with the distance between these points of 20.833 cm and the optical receiver on a mobile object then began to collect all the RSS data from the four LED bulbs at each predetermined point. Second, all the sampling data gathered from the previous step were stored in memory.
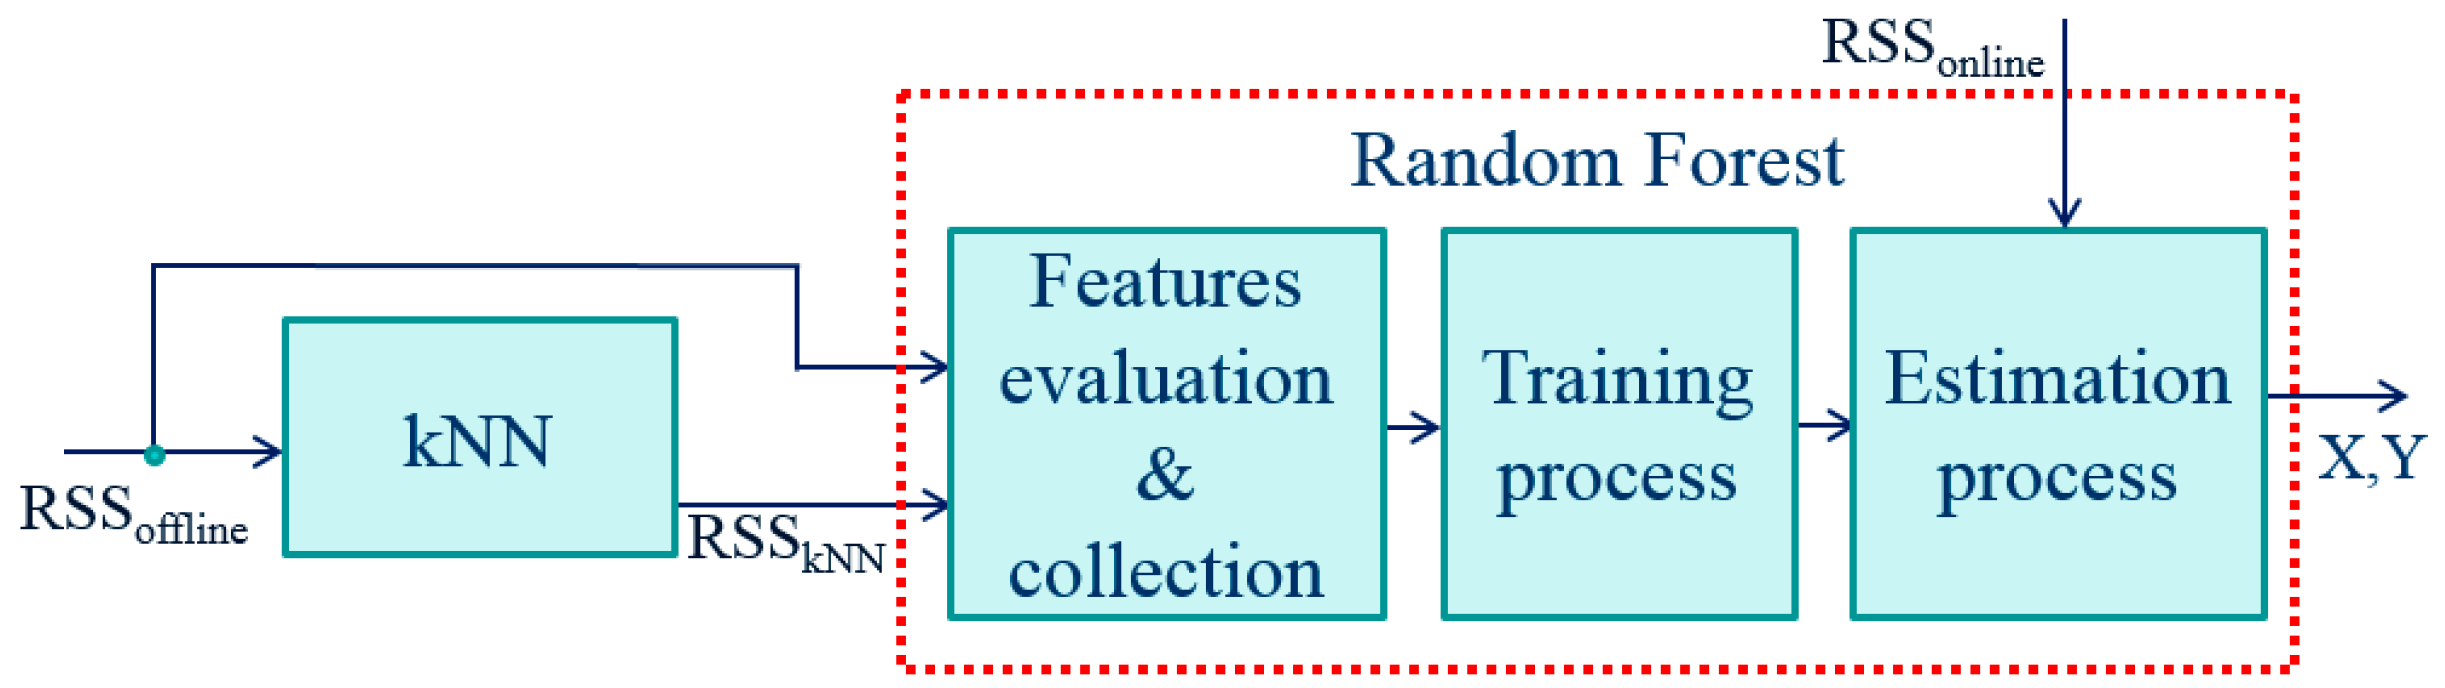
Finally, all these data were sent to the kNN-RF model. This process (
Figure 8) is described in the following details:
- (i)
Feature expanding process using kNN: First using kNN is an important step to increase the number of variables for the RF model, by finding the closest points to each reference point. kNN is a very simple machine learning algorithm and is widely used in the current IPSs. The main objective of this method is to find the Euclidean distances based on all of the reference points collected in the offline phase. For the number of Euclidean distances, it is entirely possible to rely on the value of
k (
k > 1) [
12]. Specifically, the Euclidean distances are computed as follows:
where
i is the number of LED bulbs (i.e.,
i = 4);
RSSon_i are the RSS values collected in the online phase; and
RSSoff_i are the RSS values stored in the offline phase.
After determining the Euclidean distances, the coordinates of each closest point are easily identified. From this location, their RSS values are also inferred. To determine one of the two inputs of the next RF block, the major operation of this step is to identify the nearest RSS of each collected fingerprint based on the Euclidean distance (15). The number of RSS outputs from kNN always depends on how many
k closest points are used. In our proposed system, the number of LED bulbs is fixed at four; hence each
k value corresponds to four RSS values. In summary, RSS data transferred to the next step from the kNN model are illustrated in
Table 2, with
k = 2 and given as:
where
RSSkNN is the total number of RSS values after processing using kNN;
LEDno is the number of LEDs (here,
LEDno = 4);
k is the number of nearest points; and
Foff is the number of fingerprints (here,
Foff = 625).
- (ii)
Feature evaluation and collection process: The RSS signals from both the kNN output and the sampling data stored in the memory are transferred to the first function block in the RF model, namely, feature evaluation and collection. As discussed earlier, the number of features from kNN varies depending upon the number of
k-nearest points, and they obviously exist in direct proportion. In the RF algorithm we can improve the performance of the training process and reduce the computation cost using the feature importance ranking [
21,
22].
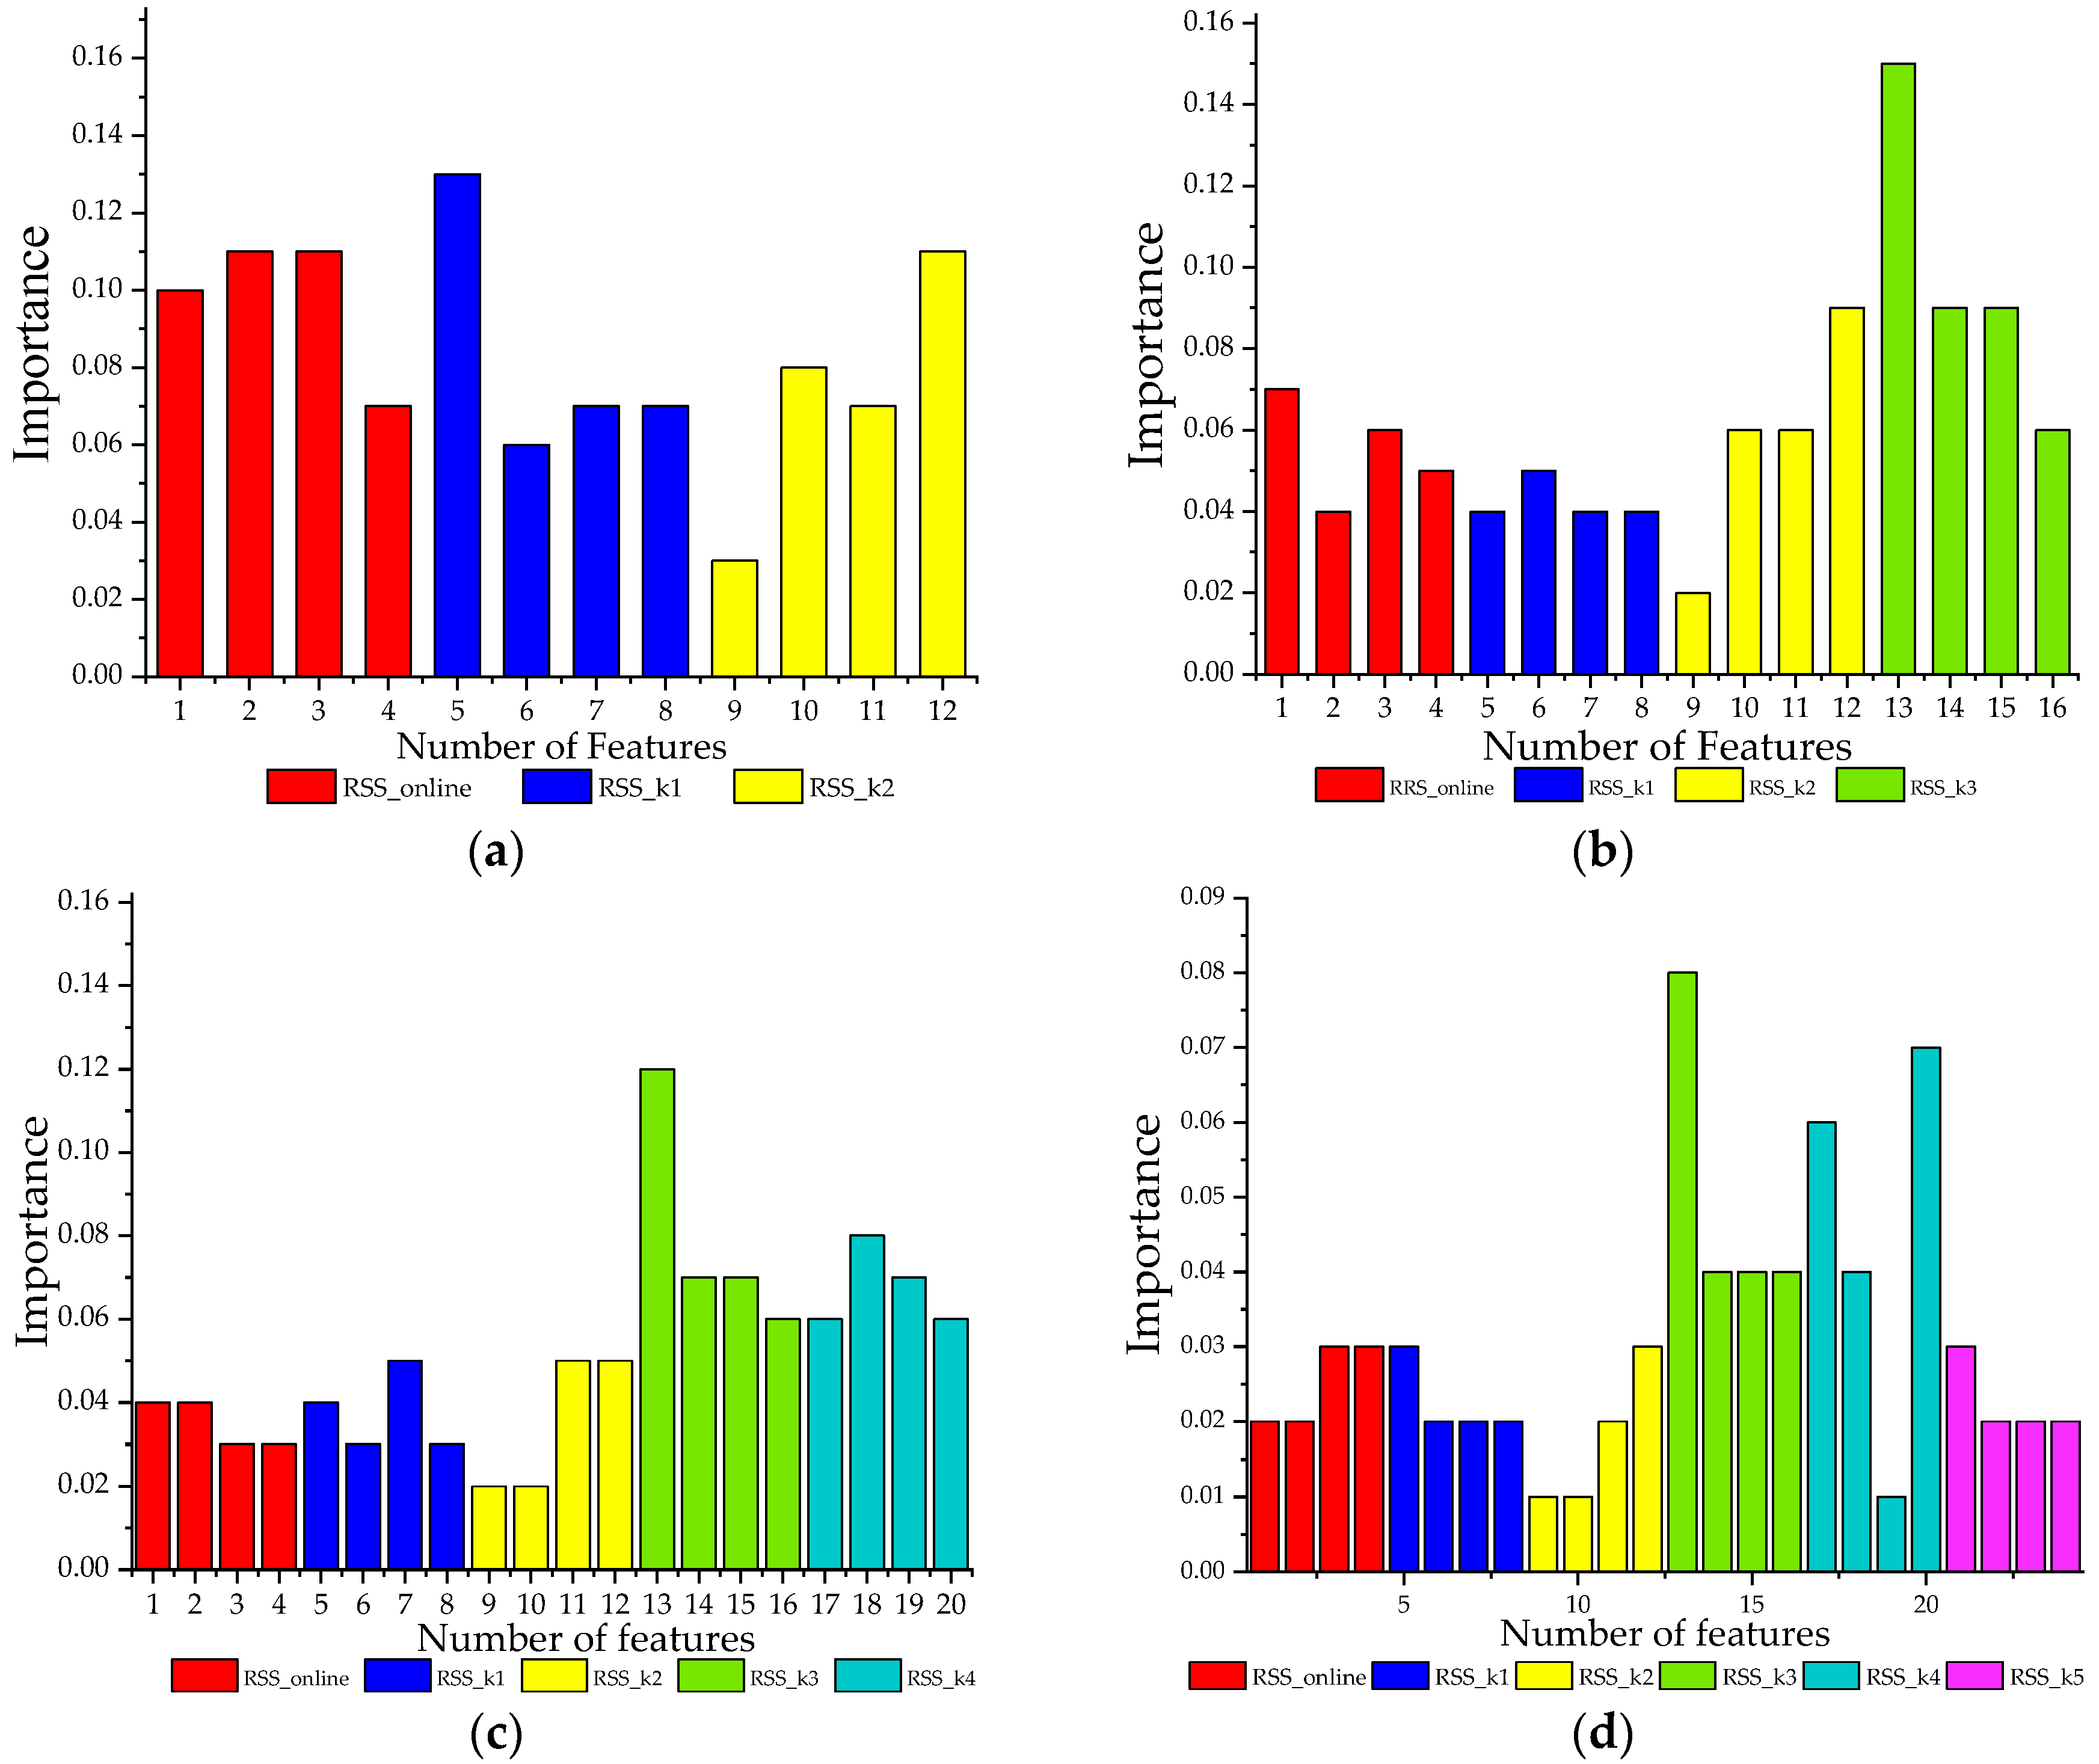
In
Figure 9 the importance level of the variables is illustrated, with
k = 2, 3, 4, and 5. In each case there are always differences among the feature groups (e.g., RSS_online, RSS_
k1, RSS_
k2, RSS_
k3, RSS_
k4, RSS_
k5), and even among elements in a group. The least important value can be neglected to achieve better or at least the same positioning accuracy using much less computing time.
- (iii)
The training process using RF: After evaluating and collecting the notable features, the RF training process is executed. We set the number of trees and features to 40 and 12, respectively. Similar to the previous procedure in kNN, the RF also uses the RSS data as the input signals, but the difference here is the combination of RSS data collected from the reference points and the RSS data that came from the kNN. This connection increases the number of variables, which helps reduce the chances of overfitting. However, a tremendous amount of data can lead to a very long run time.
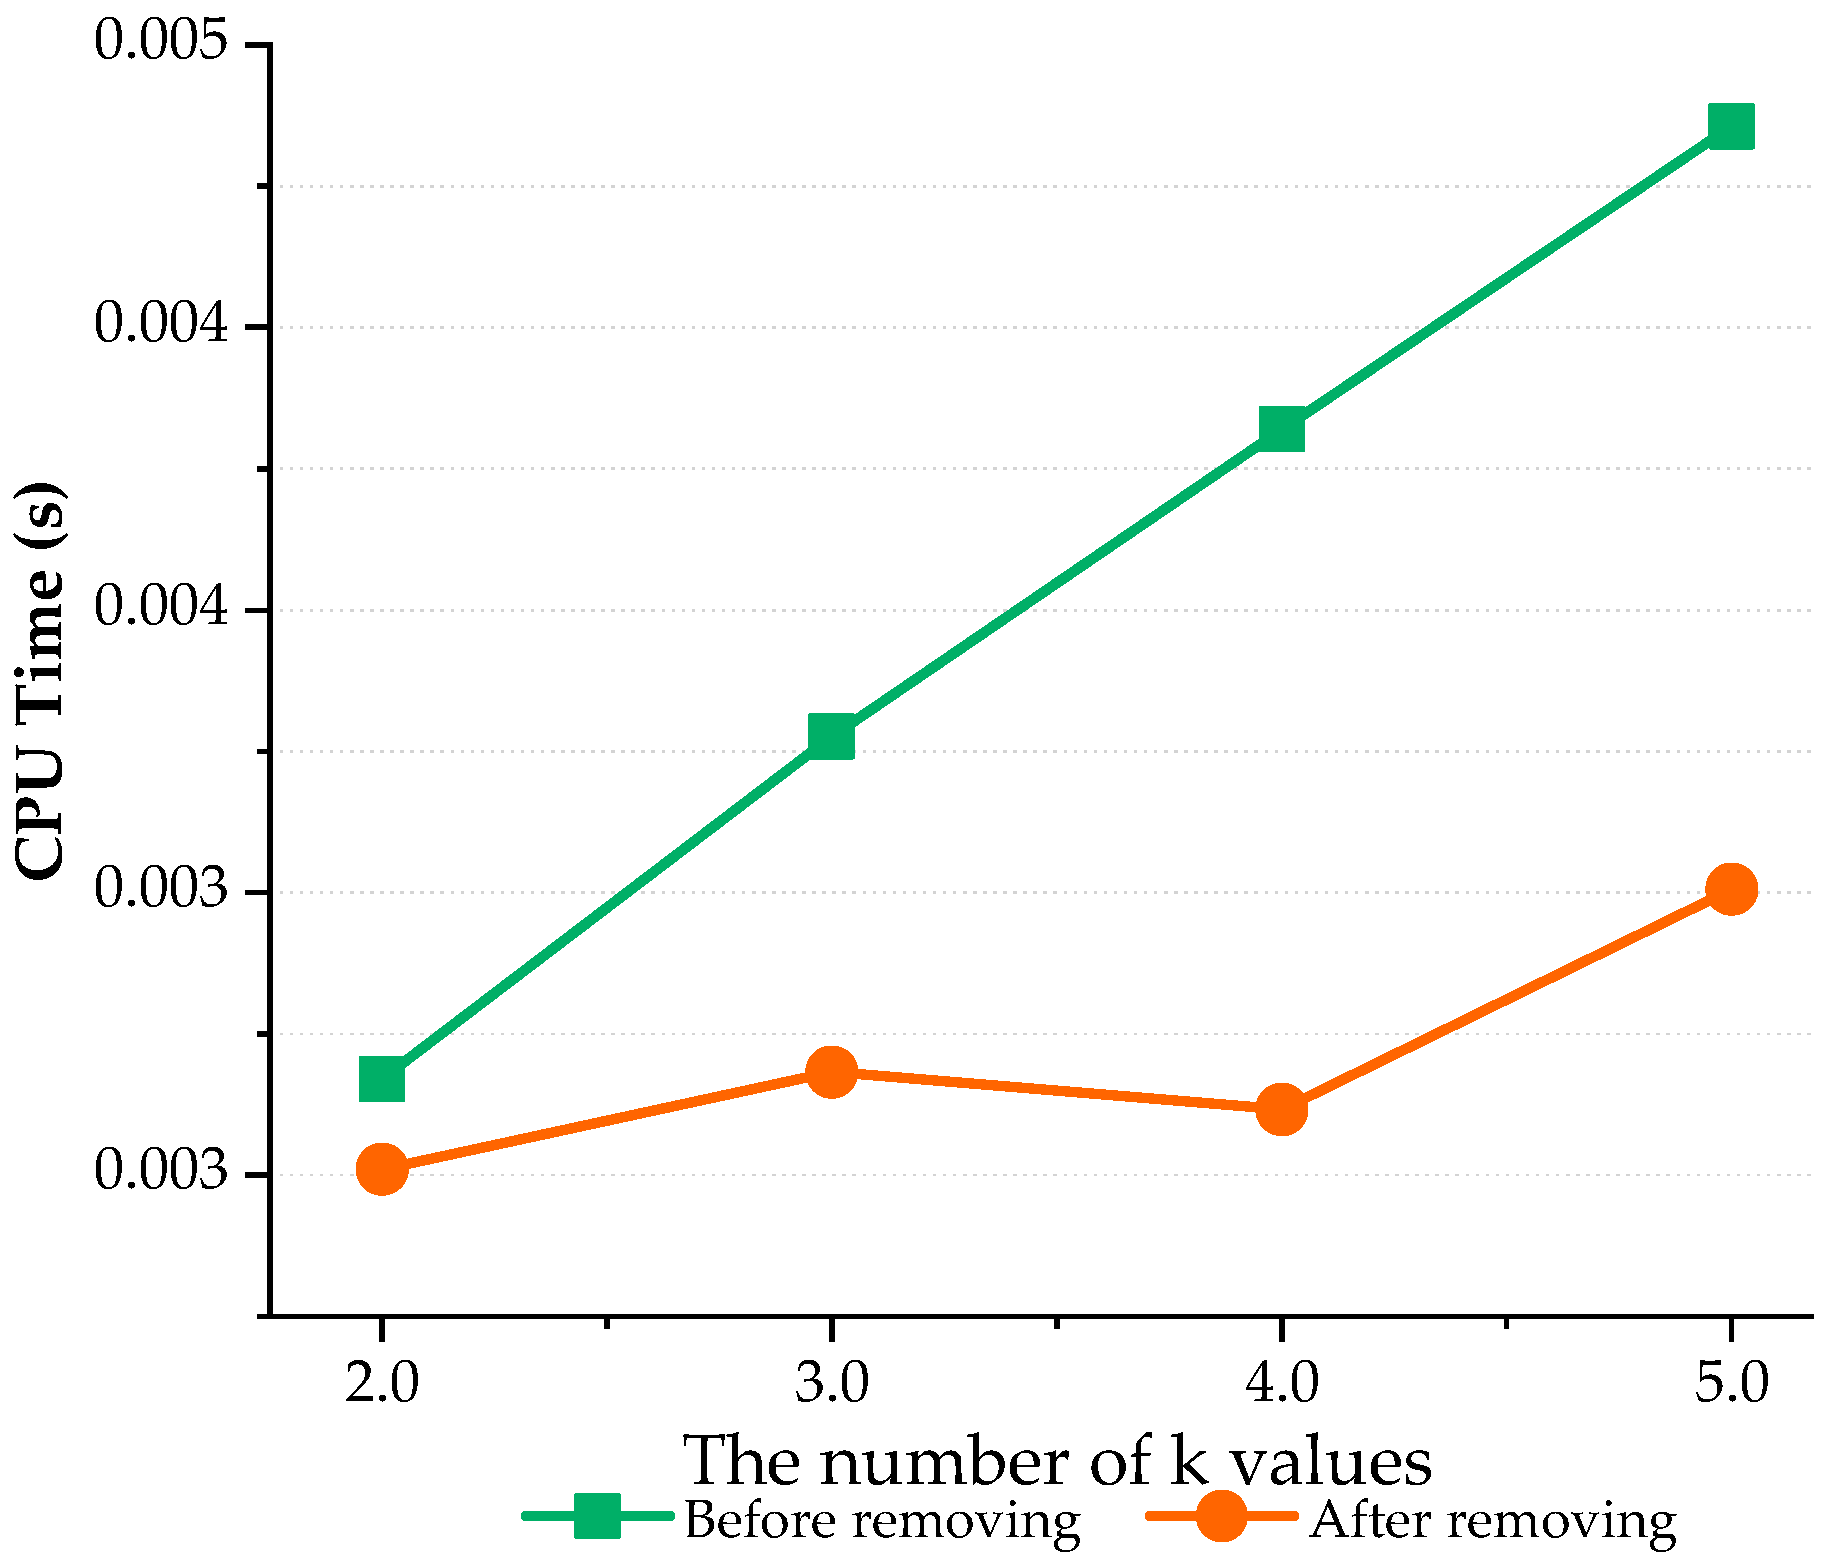
Thus, the analysis results in
Figure 9 can be used to choose, as well as remove, the appropriate features. Then, as shown in
Figure 10, by neglecting some features that have an importance rate ≤4%, the CPU time is achievably enhanced, by 5.99% with
k = 2 and by 18.3% with
k = 3. With
k = 5, half of all the features are skipped and the improvement increases up to 31%, while the mean errors rise only slightly by 7.45%. Therefore, the CPU time gradually decreases as more useless features are neglected.
In the online phase, the current RSS data from all the LED lights are sent directly to the estimation process block in the kNN-RF model (
Figure 8). This block then uses these data and all the trained data in the offline phase to estimate the position of the object being considered. Estimation plays a major role in the online phase and has an effect on the final estimated position.
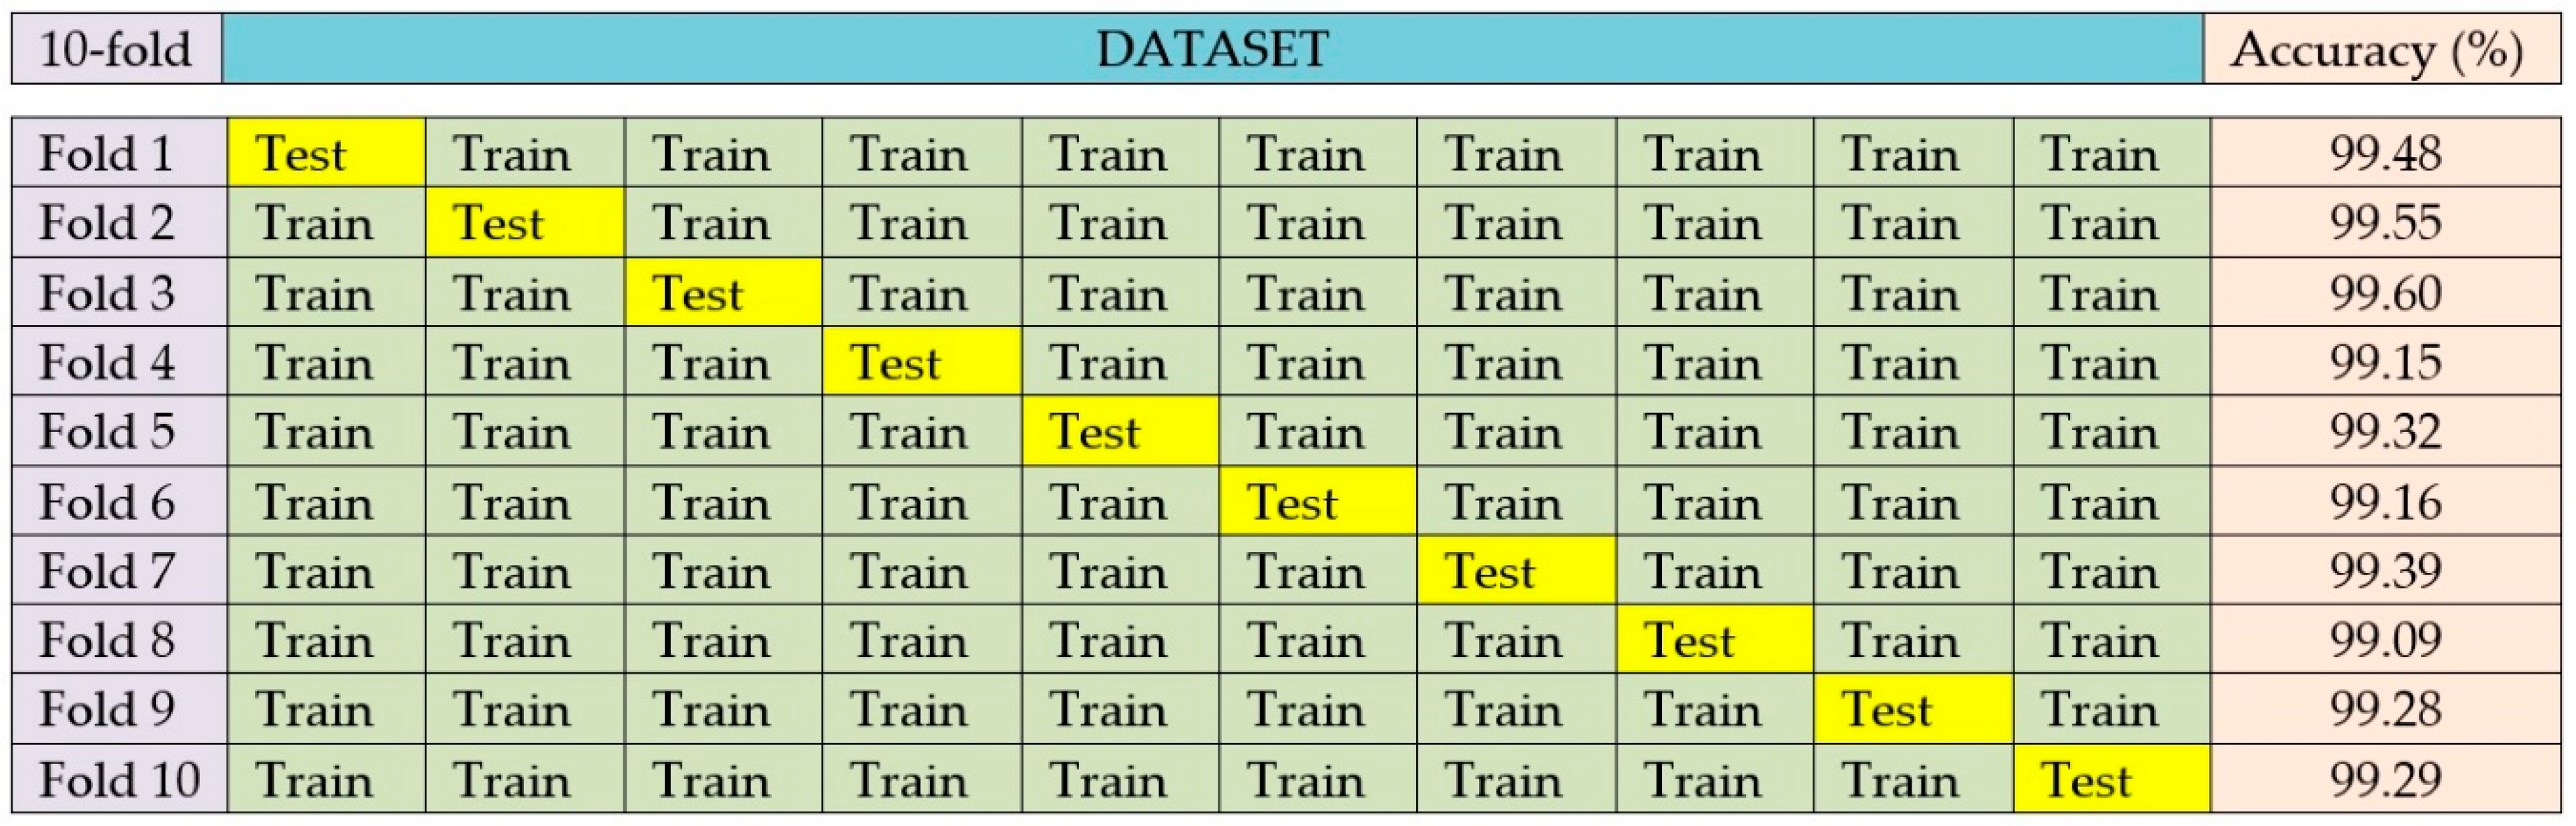
To evaluate the performance of our proposed algorithm, we shuffled the dataset randomly and divided them into 10 subsets. We then performed cross validations in each of them. By using this method, each subset is given the opportunity to be a testing set 1 time and be a training set 9 times. The results shown in
Figure 11 demonstrate that our method is able to predict unseen data with a mean accuracy of 99.33%. More in-depth analyses of the impacts of the number of neighbors in kNN, the number of trees in RF, the receiver angle, and the performance of our method are thoroughly discussed in the next section.
4. Performance Evaluation
4.1. Effects of the Number of Neighbors in kNN
We examined cases with various numbers of
k nearest points, and from
Table 3 it is virtually certain that when
k gradually increased from 2 to 8, the accuracy score showed only a minor fluctuation. However, some error types, such as the mean absolute error (MAE), mean square error (MSE), and root mean square error (RMSE) were slightly worse, corresponding to the increase in
k values. As mentioned in
Section 3.2, finding an ideal
k value is considered an excellent way to satisfy the real-time requirements and enhance the quality of the recommended solution. In our proposed method, the number of features sent to the RF block increased four times, corresponding to each
k value added (see
Section 3.2). Therefore, in this paper,
k is set to 2.
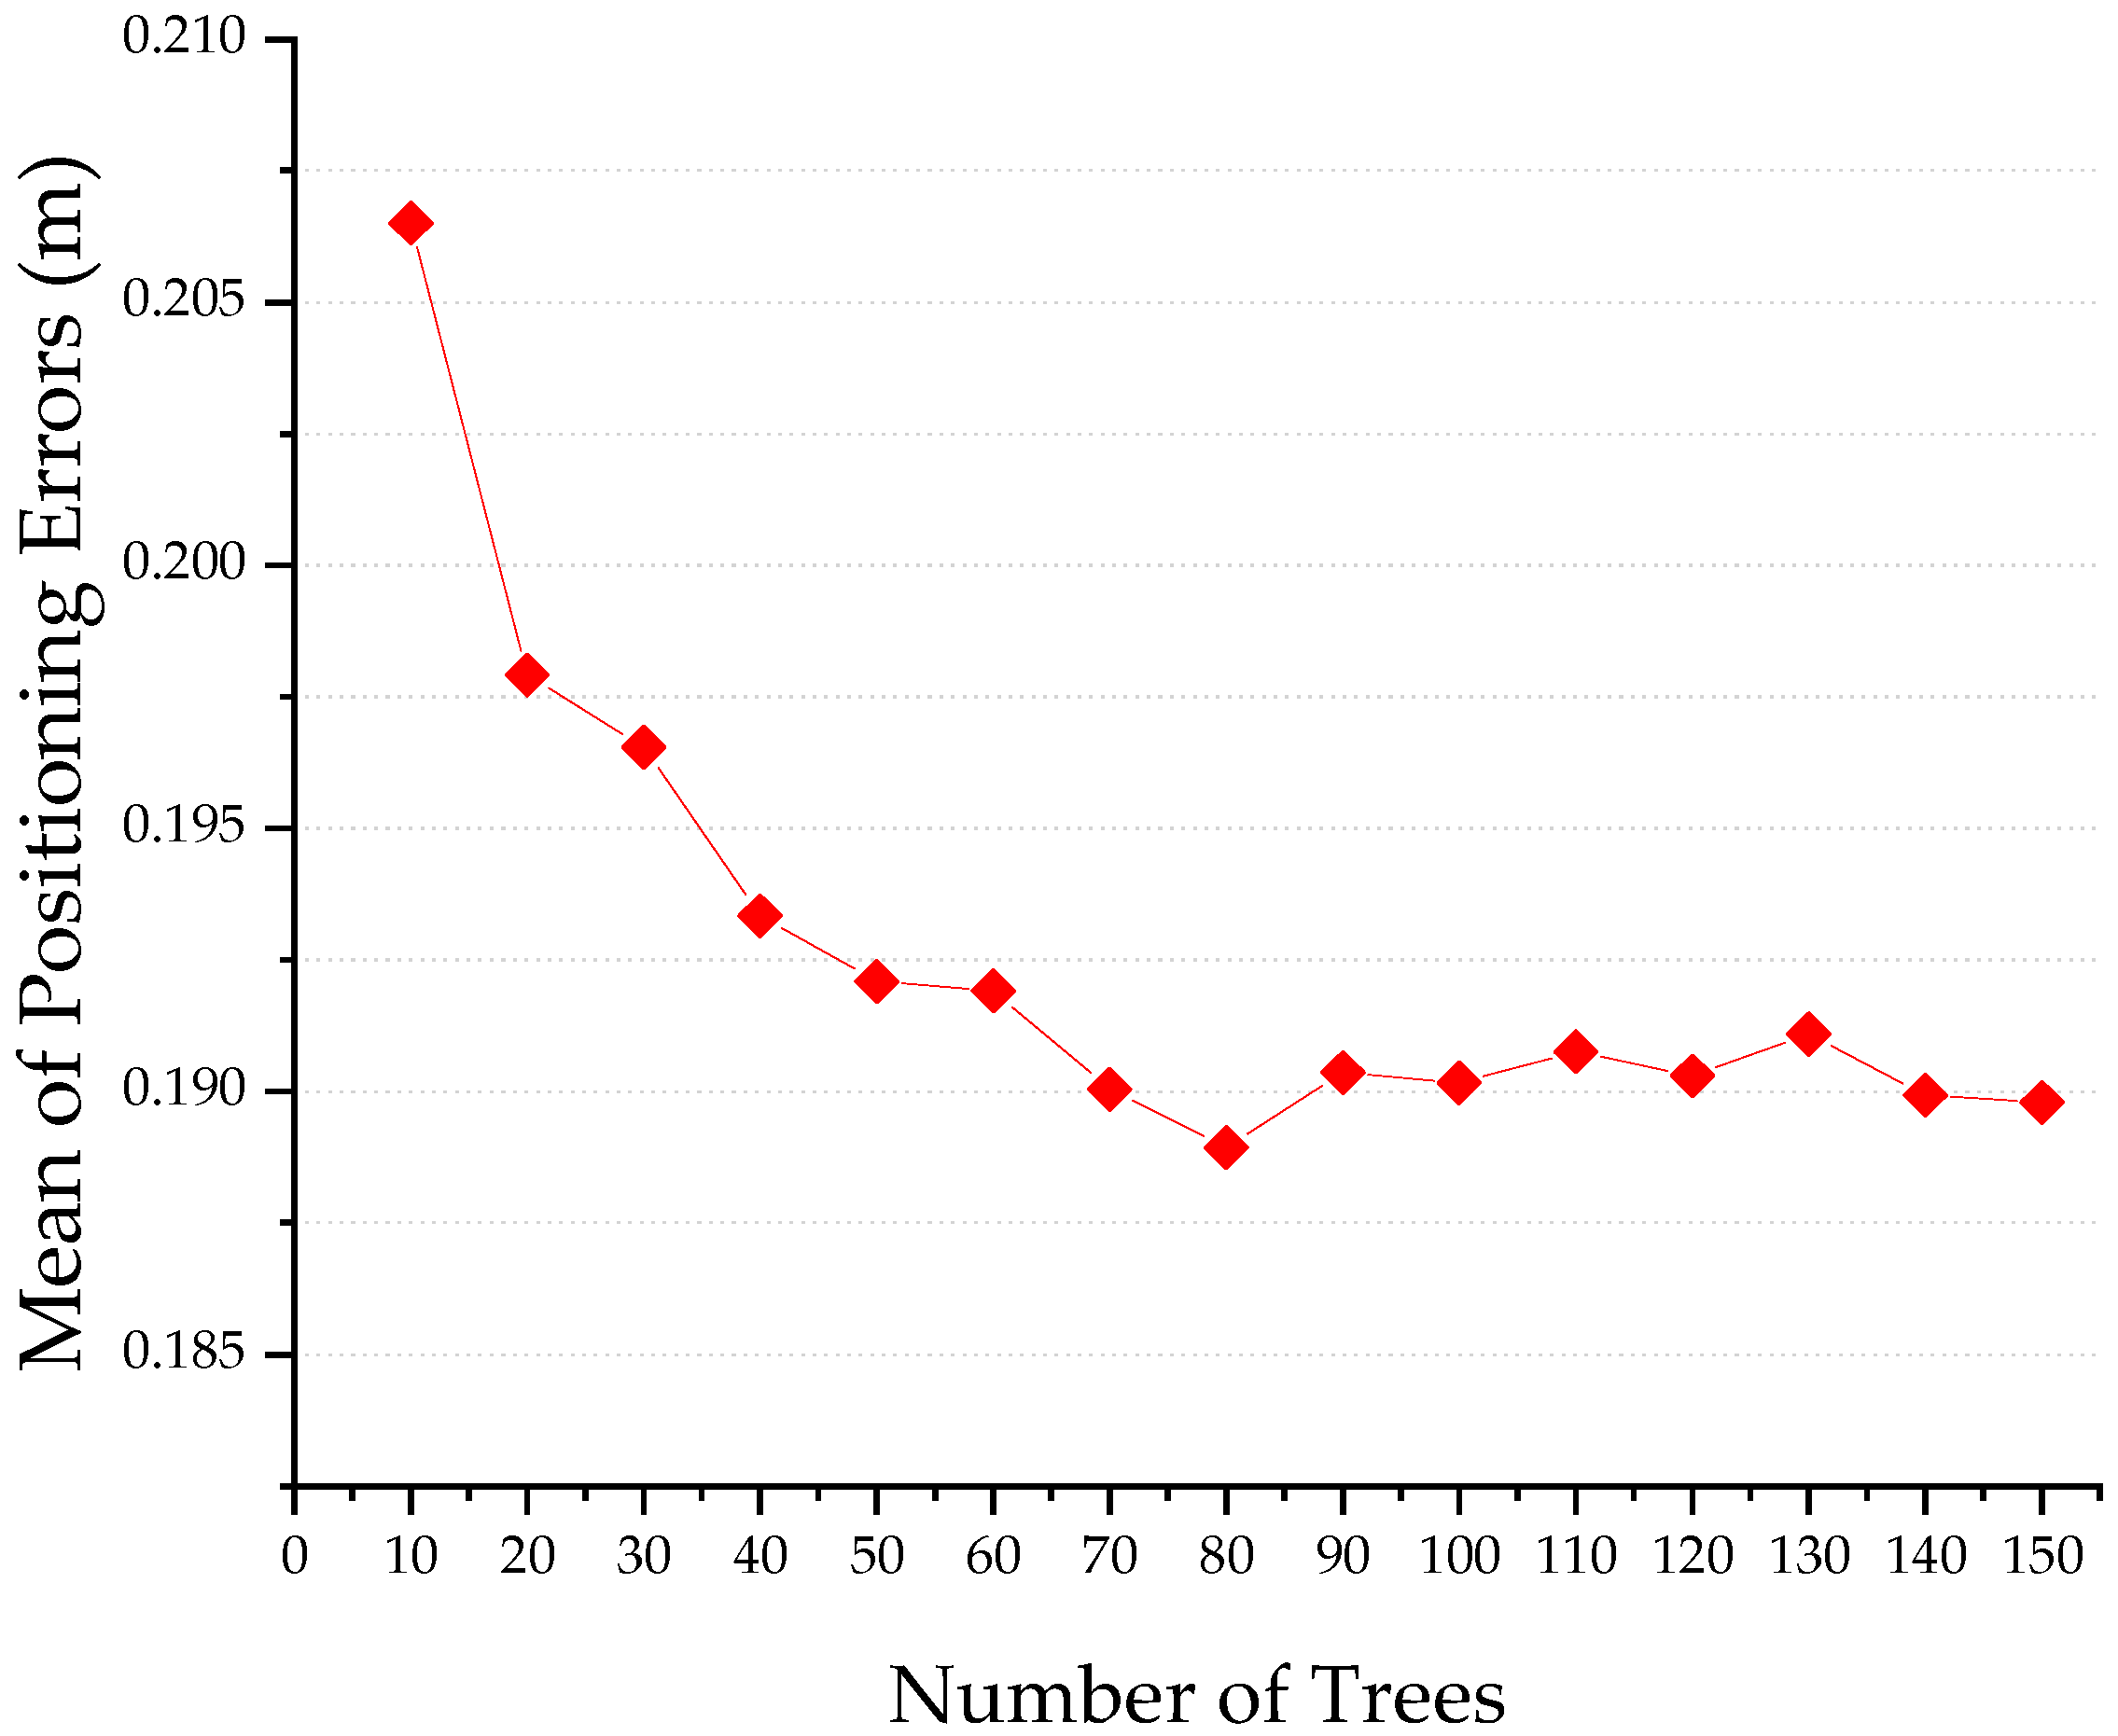
4.2. Effects of the Number of Trees in RF
The number of trees in RF has a significant impact on not only the computational time, but also the positioning error of the system. To achieve reliable results, we randomly selected 125 testing data points (20% overall) and executed 100 consecutive repetitions to evaluate the influence of the number of trees on the system performance.
As depicted in
Figure 12, the more trees that are chosen, the smaller the mean of the positioning errors. When the number of trees is more than 40, the performance continues to slightly improve, but not significantly. With 40 trees, the mean of the positioning errors was 0.193 m, and with 150 trees it was 0.189 m, a difference of only about 2.07%. From 70 trees onwards, the system became more stable, with mean errors in the range of 0.189 m to 0.191 m.
We also found that there were no considerable differences in the mean errors when the number of trees reached 40 and more. However, as discussed in
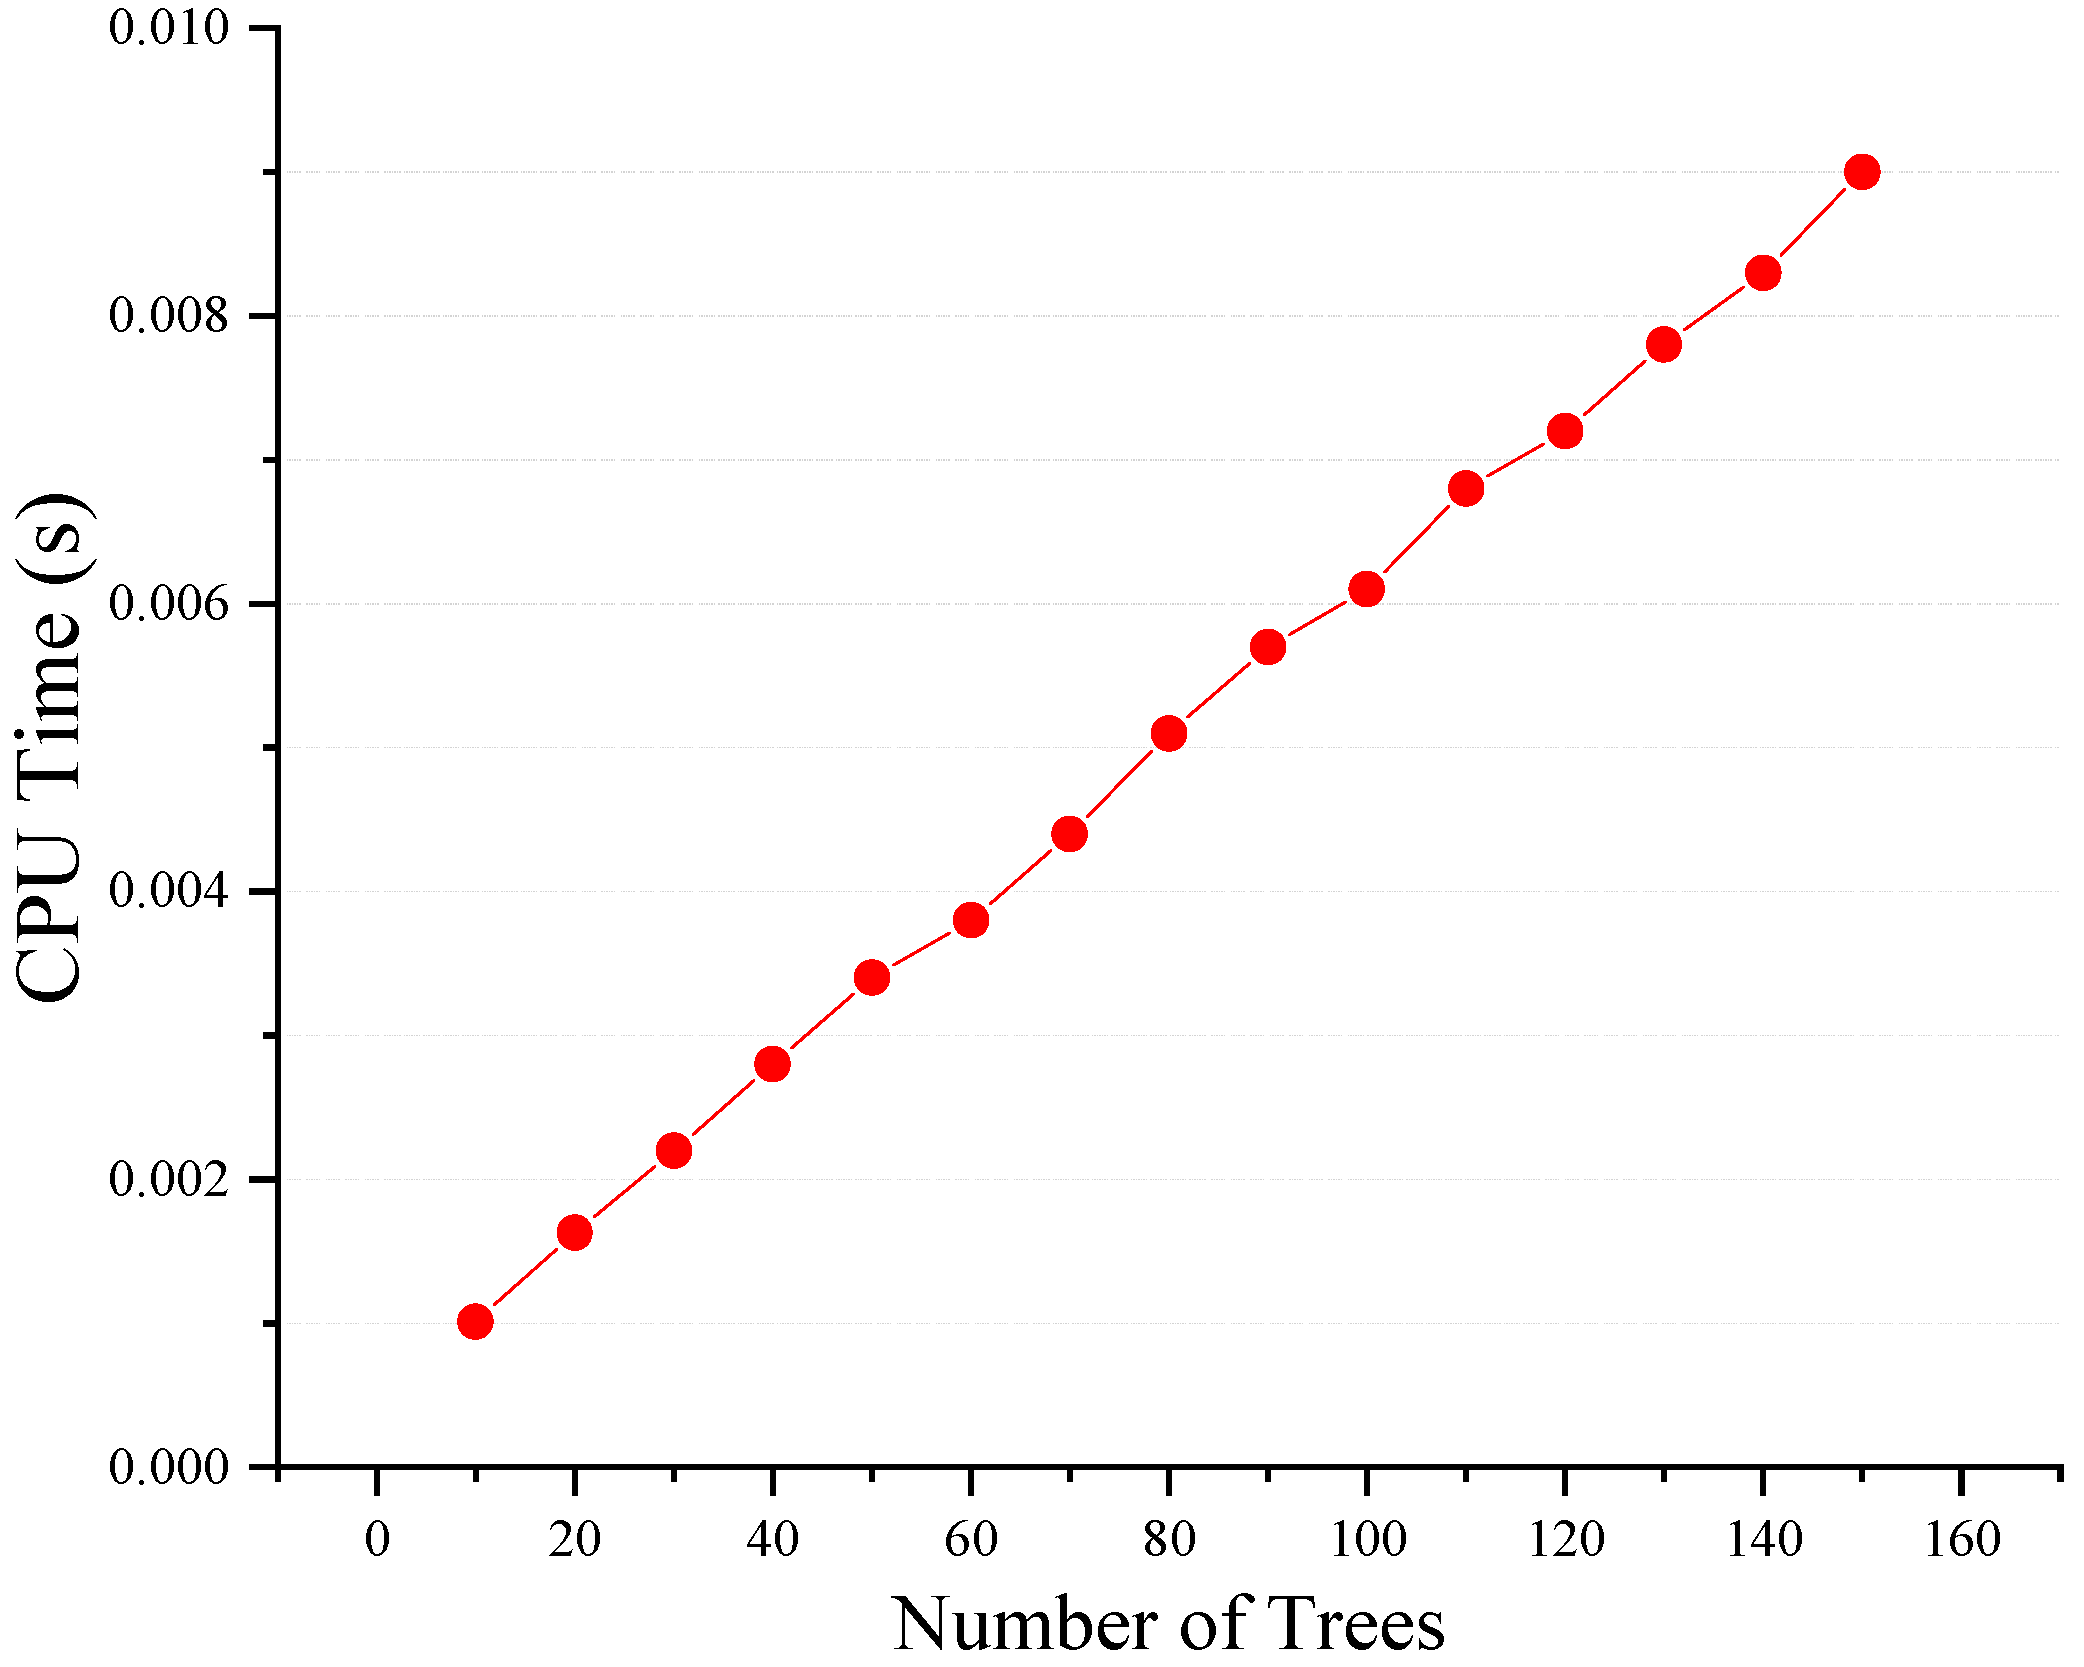
Section 3.2, the tree numbers are directly proportional to the computational effort required (
Figure 13). For instance, if 150 trees are selected instead of 10, the computational time will increase more than 13 times; thus, our system always suffers from a heavy computation burden. Therefore, to ensure the real-time performance and acceptable positioning quality, we recommend limiting the number of potential trees to the range of 40 to 70; even smaller values can be considered when strict execution time is required.
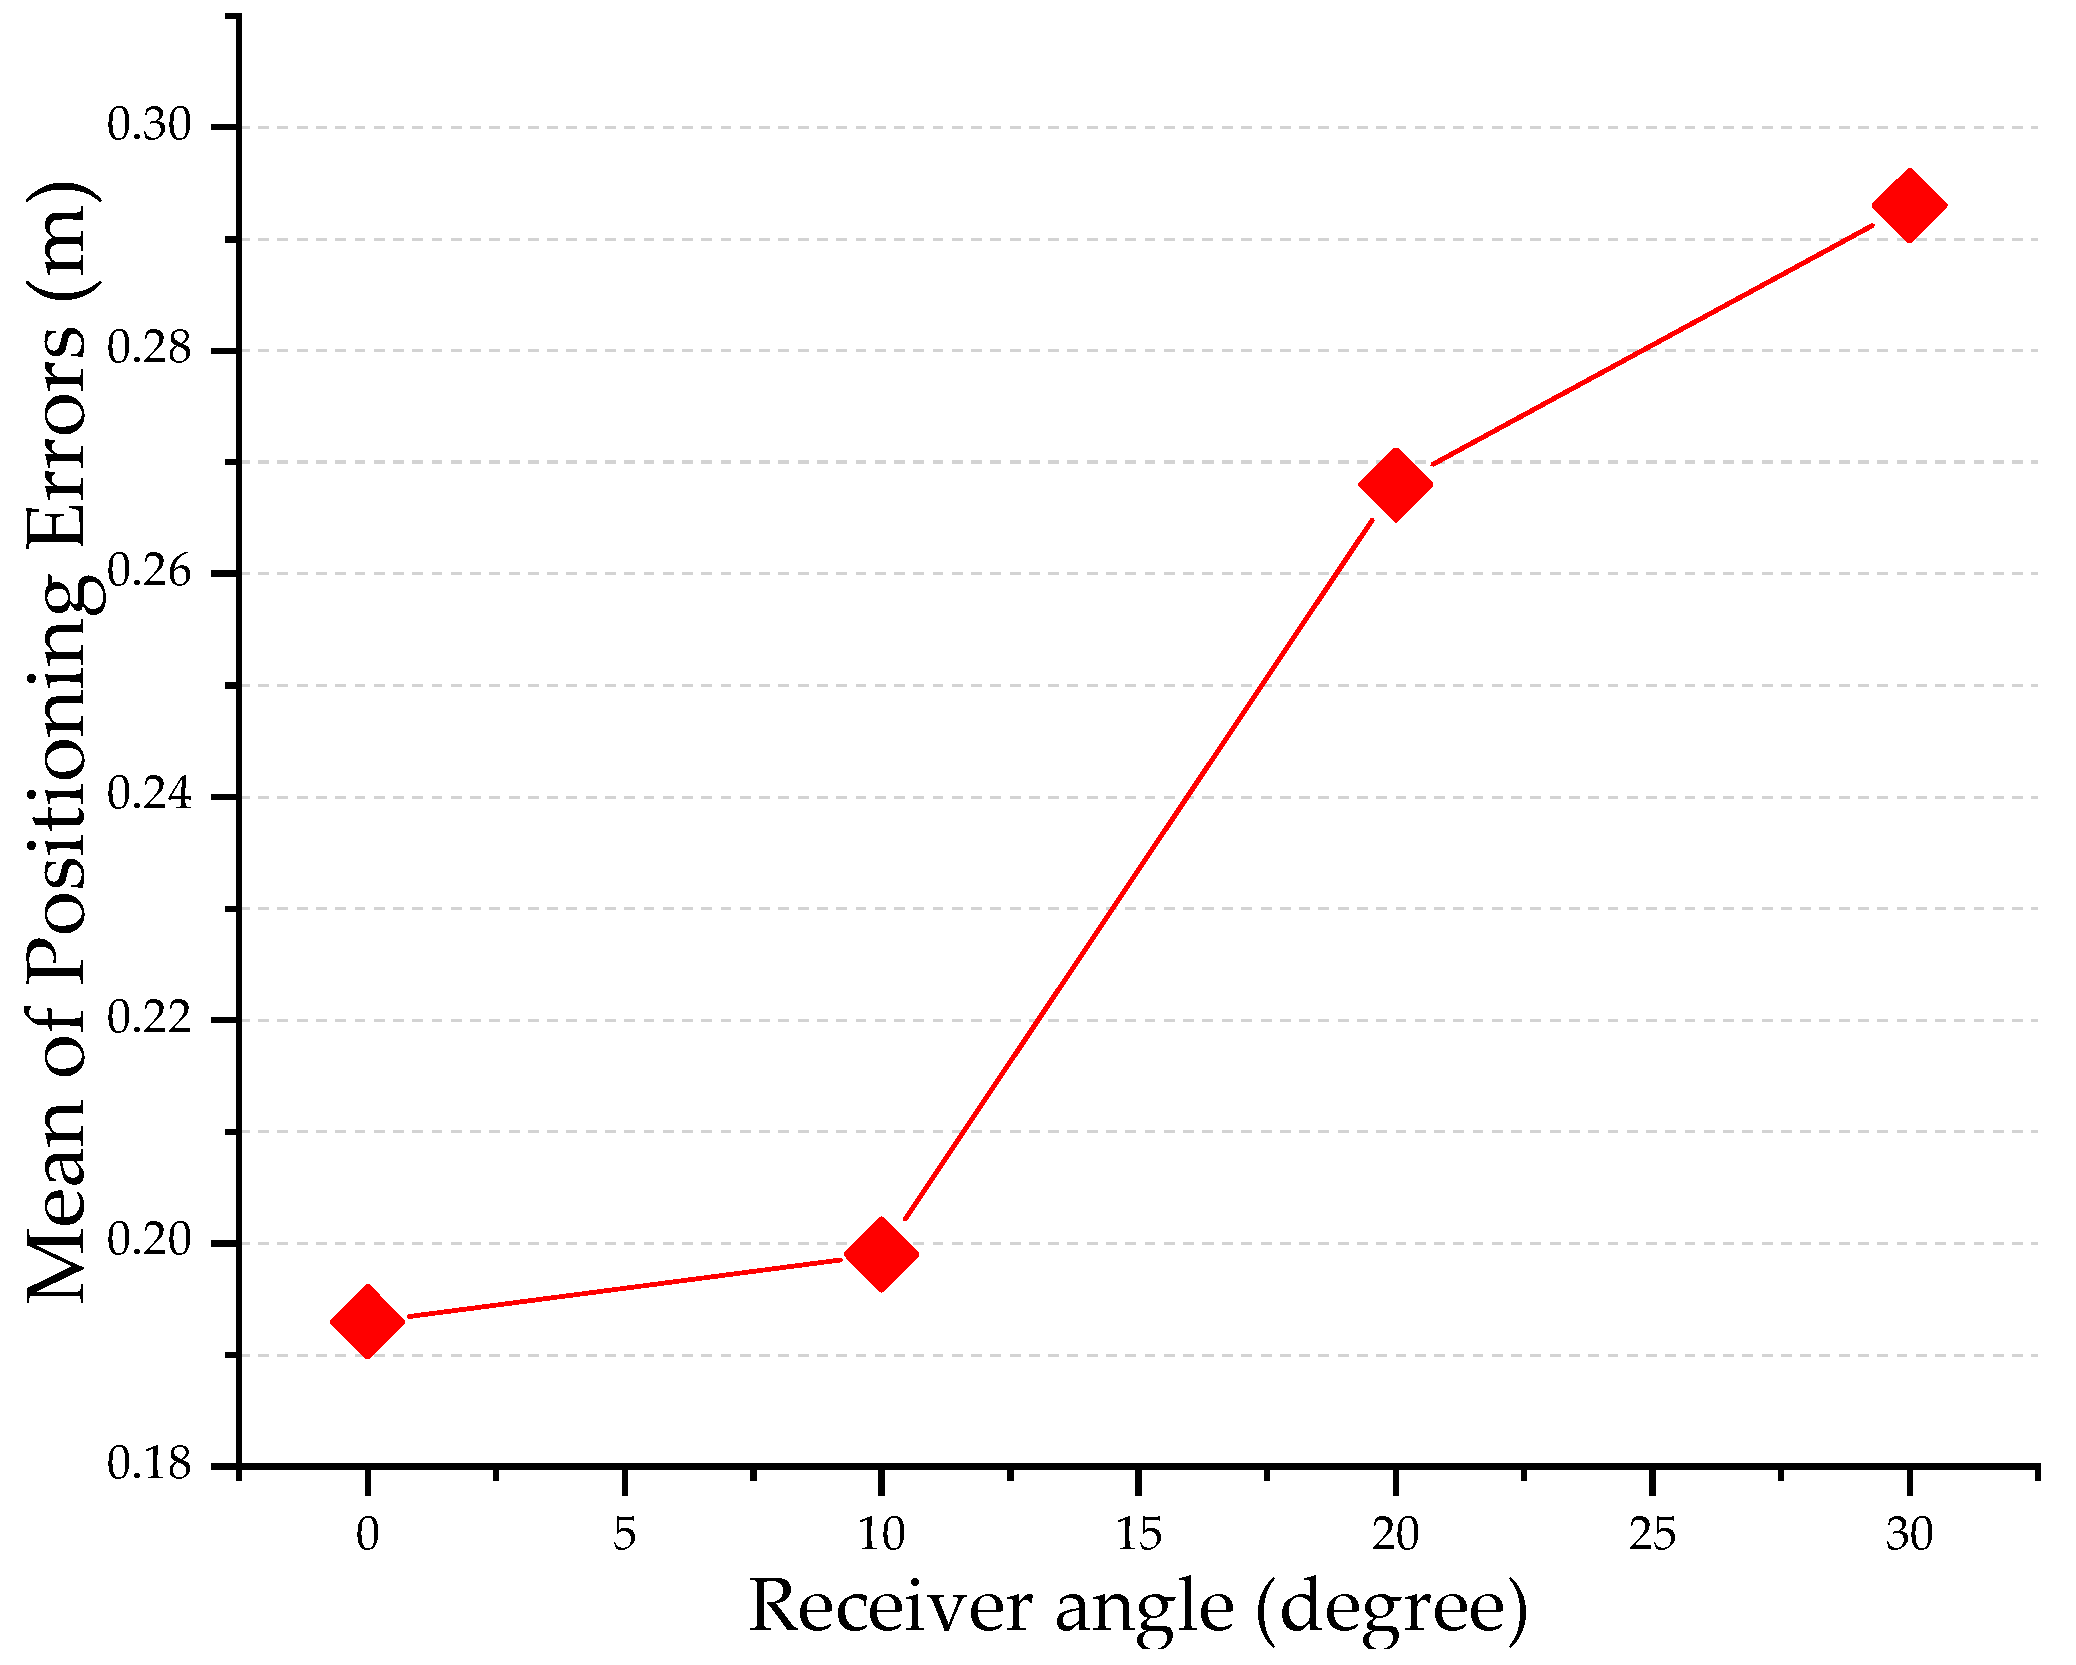
4.3. Effects of the Receiver Angle
In practice, the angle of the receiver may change over time and the degree of change depends on either the robustness of the mobile object equipped with a PD, the flatness of the moving surface, or the posture of the person using the PD sensor. In this section, we evaluated the effects of the receiver angle on the positioning accuracy by testing the mean of positioning errors corresponding to three separate cases: 10°, 20°, and 30°. For simplicity we assumed that the receiver angle is formed by the horizontal plane of the PD and the horizontal plane of the floor. This can be seen in
Figure 14, compared with the case of a fixed rotation angle (0°), the positioning errors in the cases of 10°, 20°, and 30° inclinations increased 3%, 28%, and 34%, respectively. This means that as we gradually increase the tilt angle of the optical receiver, the positioning accuracy changes in a deteriorating direction. However, the positioning error showed a slight increase in the range from a 0° to 10° inclination of only 3%. This range of tilt angle is also one of the most ubiquitous situations in reality. We are, therefore, confident that our proposed solution fully satisfies the actual requirements.
4.4. Performance Evaluation
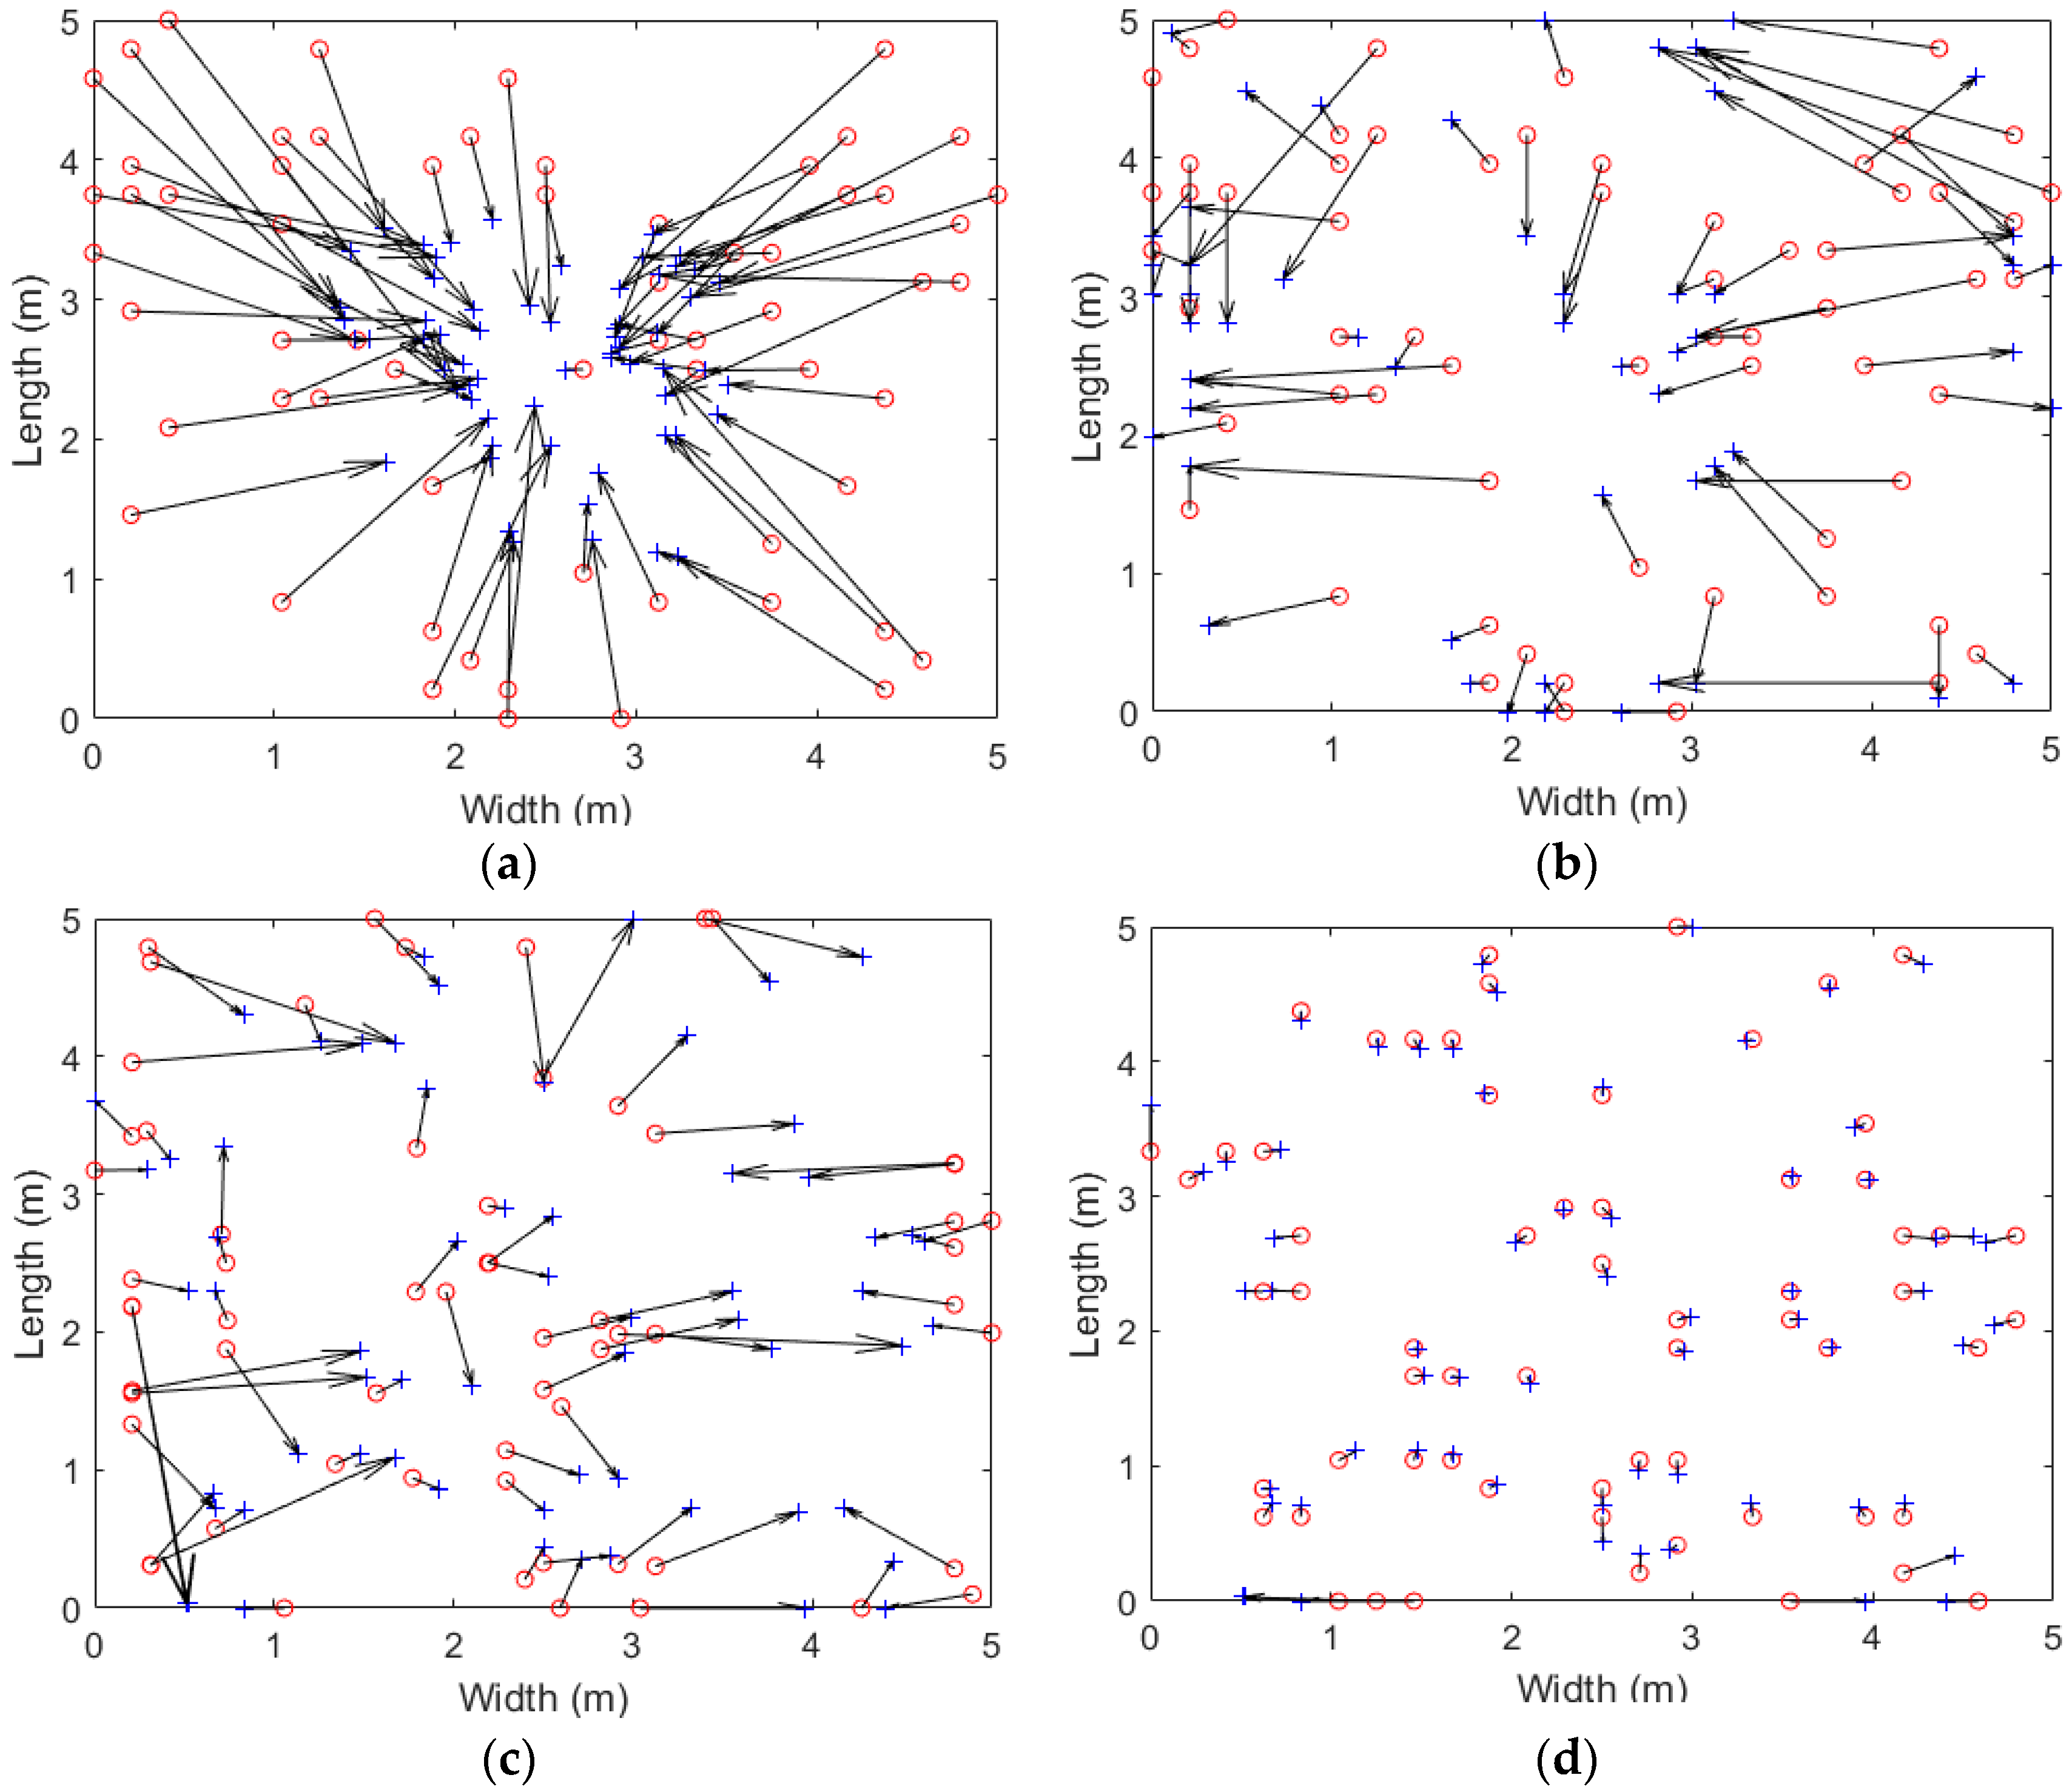
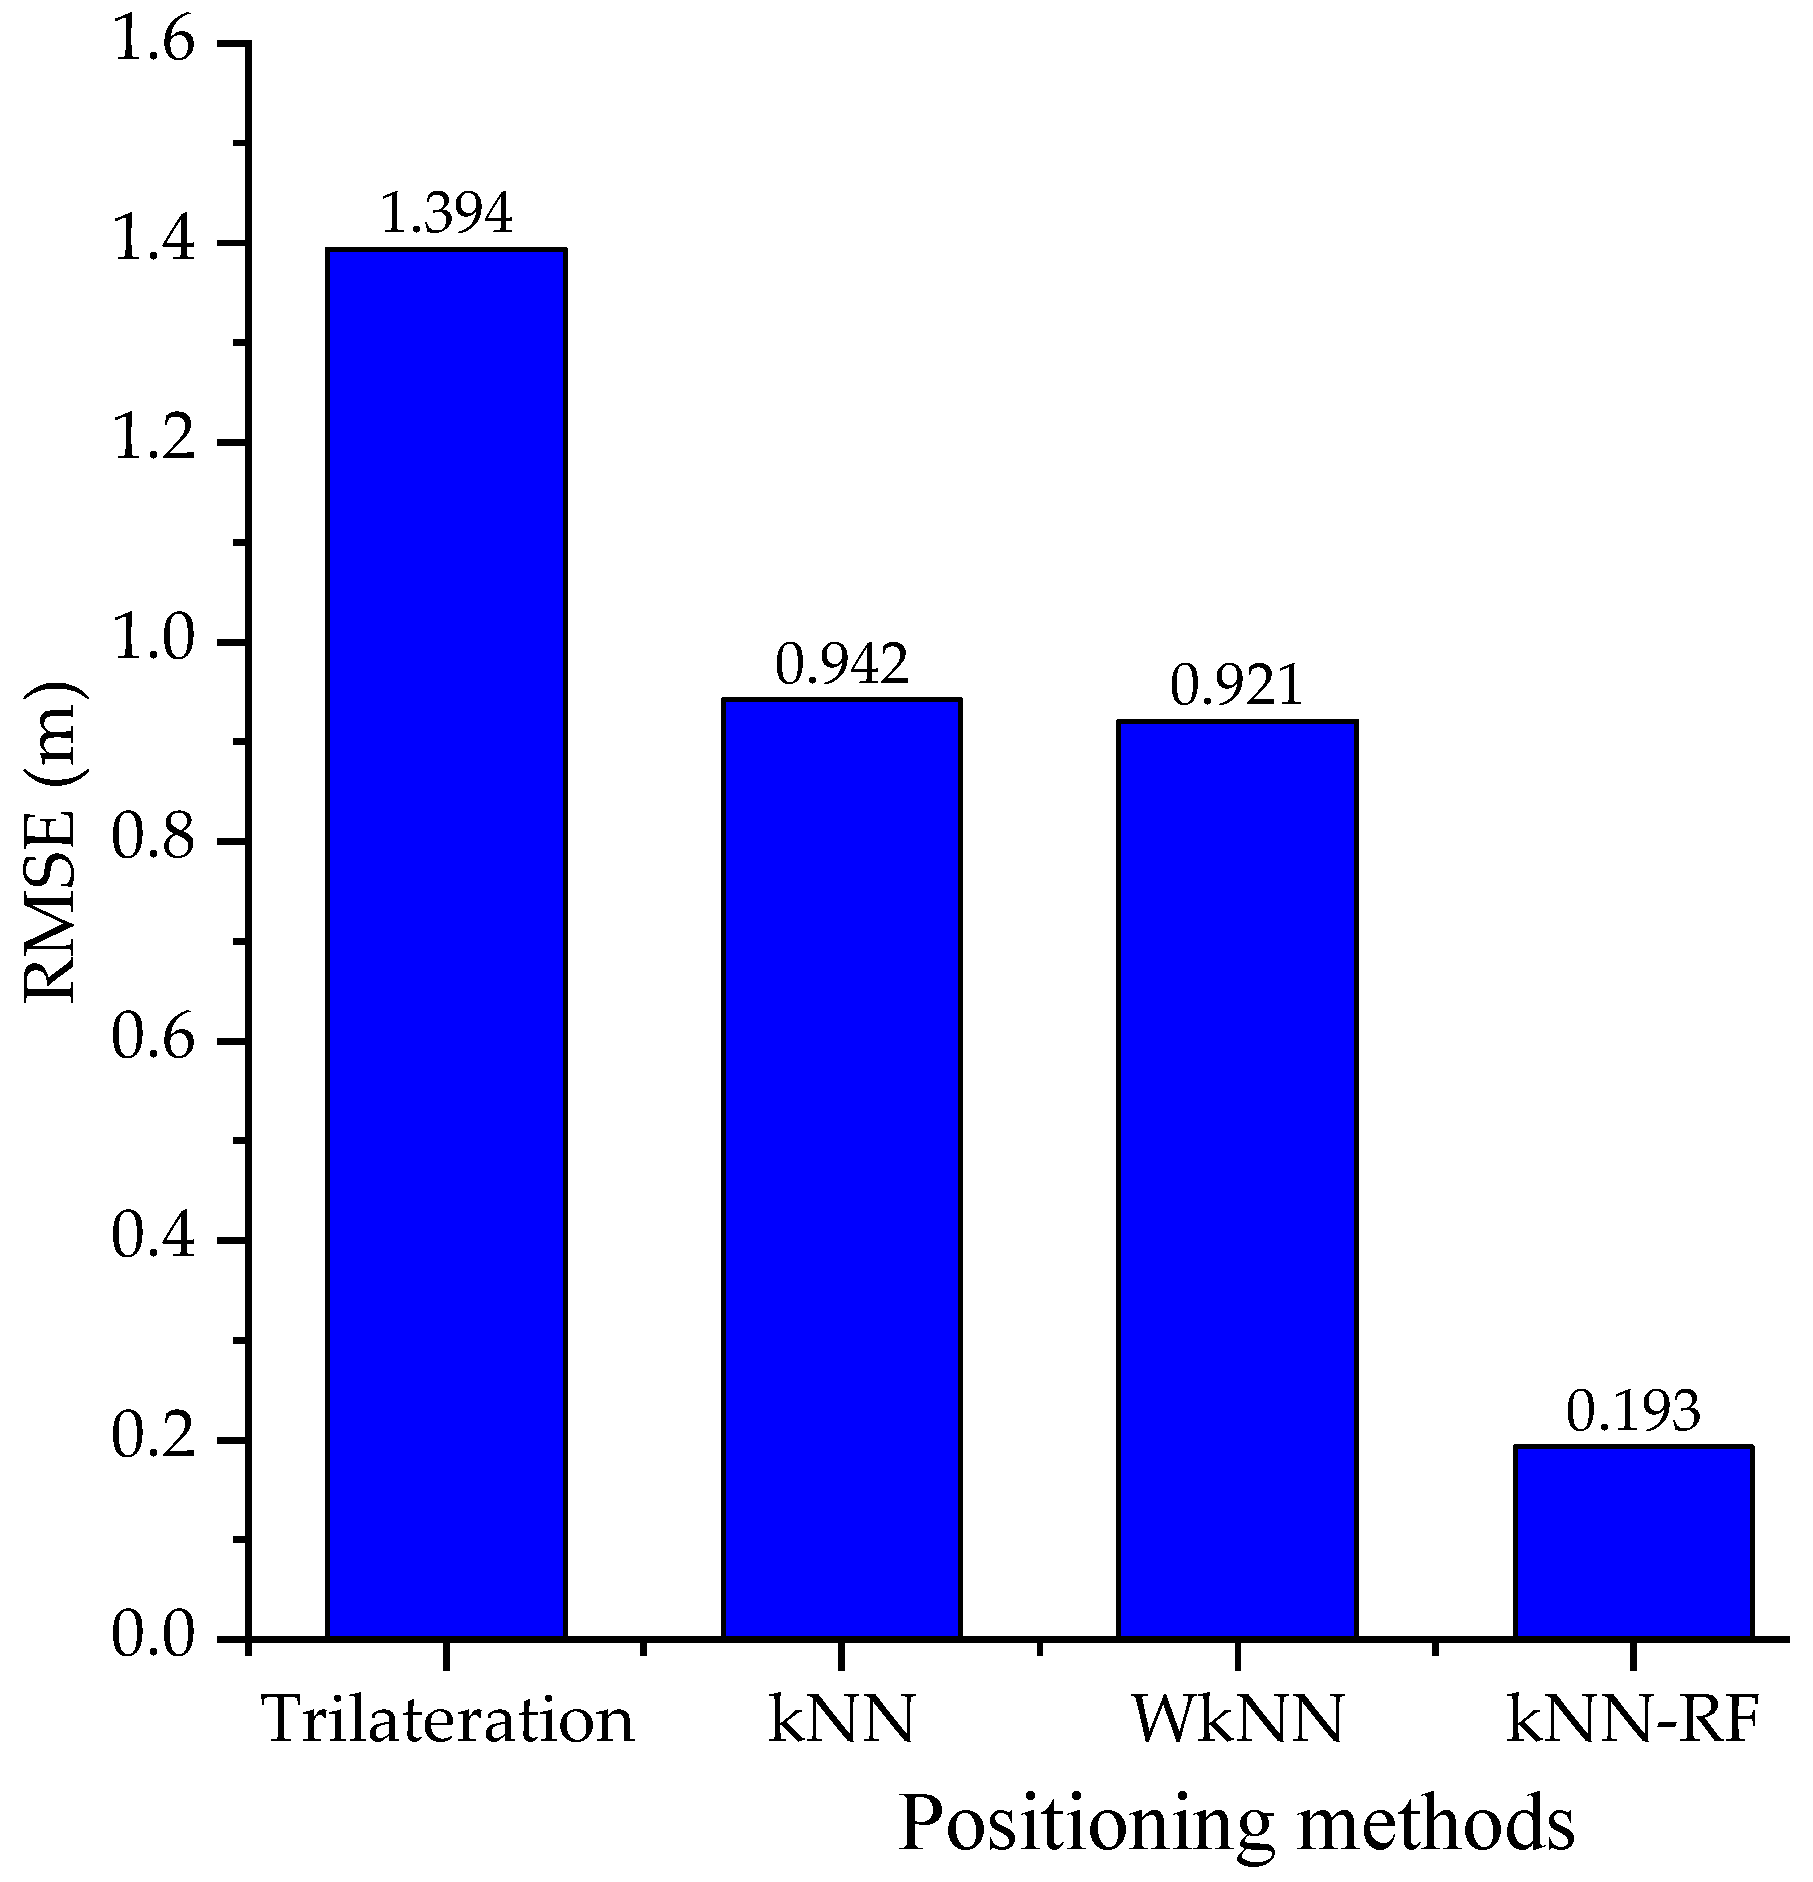
In
Figure 15, the true positions (tails) and the estimated positions (heads) are used to visually illustrate the positioning accuracy of trilateration, kNN, Weighted-kNN (WkNN), and kNN-RF algorithms. It is clear that the combination of kNN and RF produced the most promising performance.
In Reference [
12], the authors demonstrated that a WkNN model in a non-reflective space was approximately 36% to 50% more accurate than the trilateration method with and without ambient light, respectively. In a reflective environment, however, the precision of the positioning system with the WkNN method became much worse, as the mean error rose from 0.031 m to 0.92 m, a 29-fold increase. In contrast to the first three algorithms (i.e., trilateration, kNN, and WkNN), the errors in the kNN-RF method were considerably lower, with an RMSE of 0.193 m (
Figure 16).
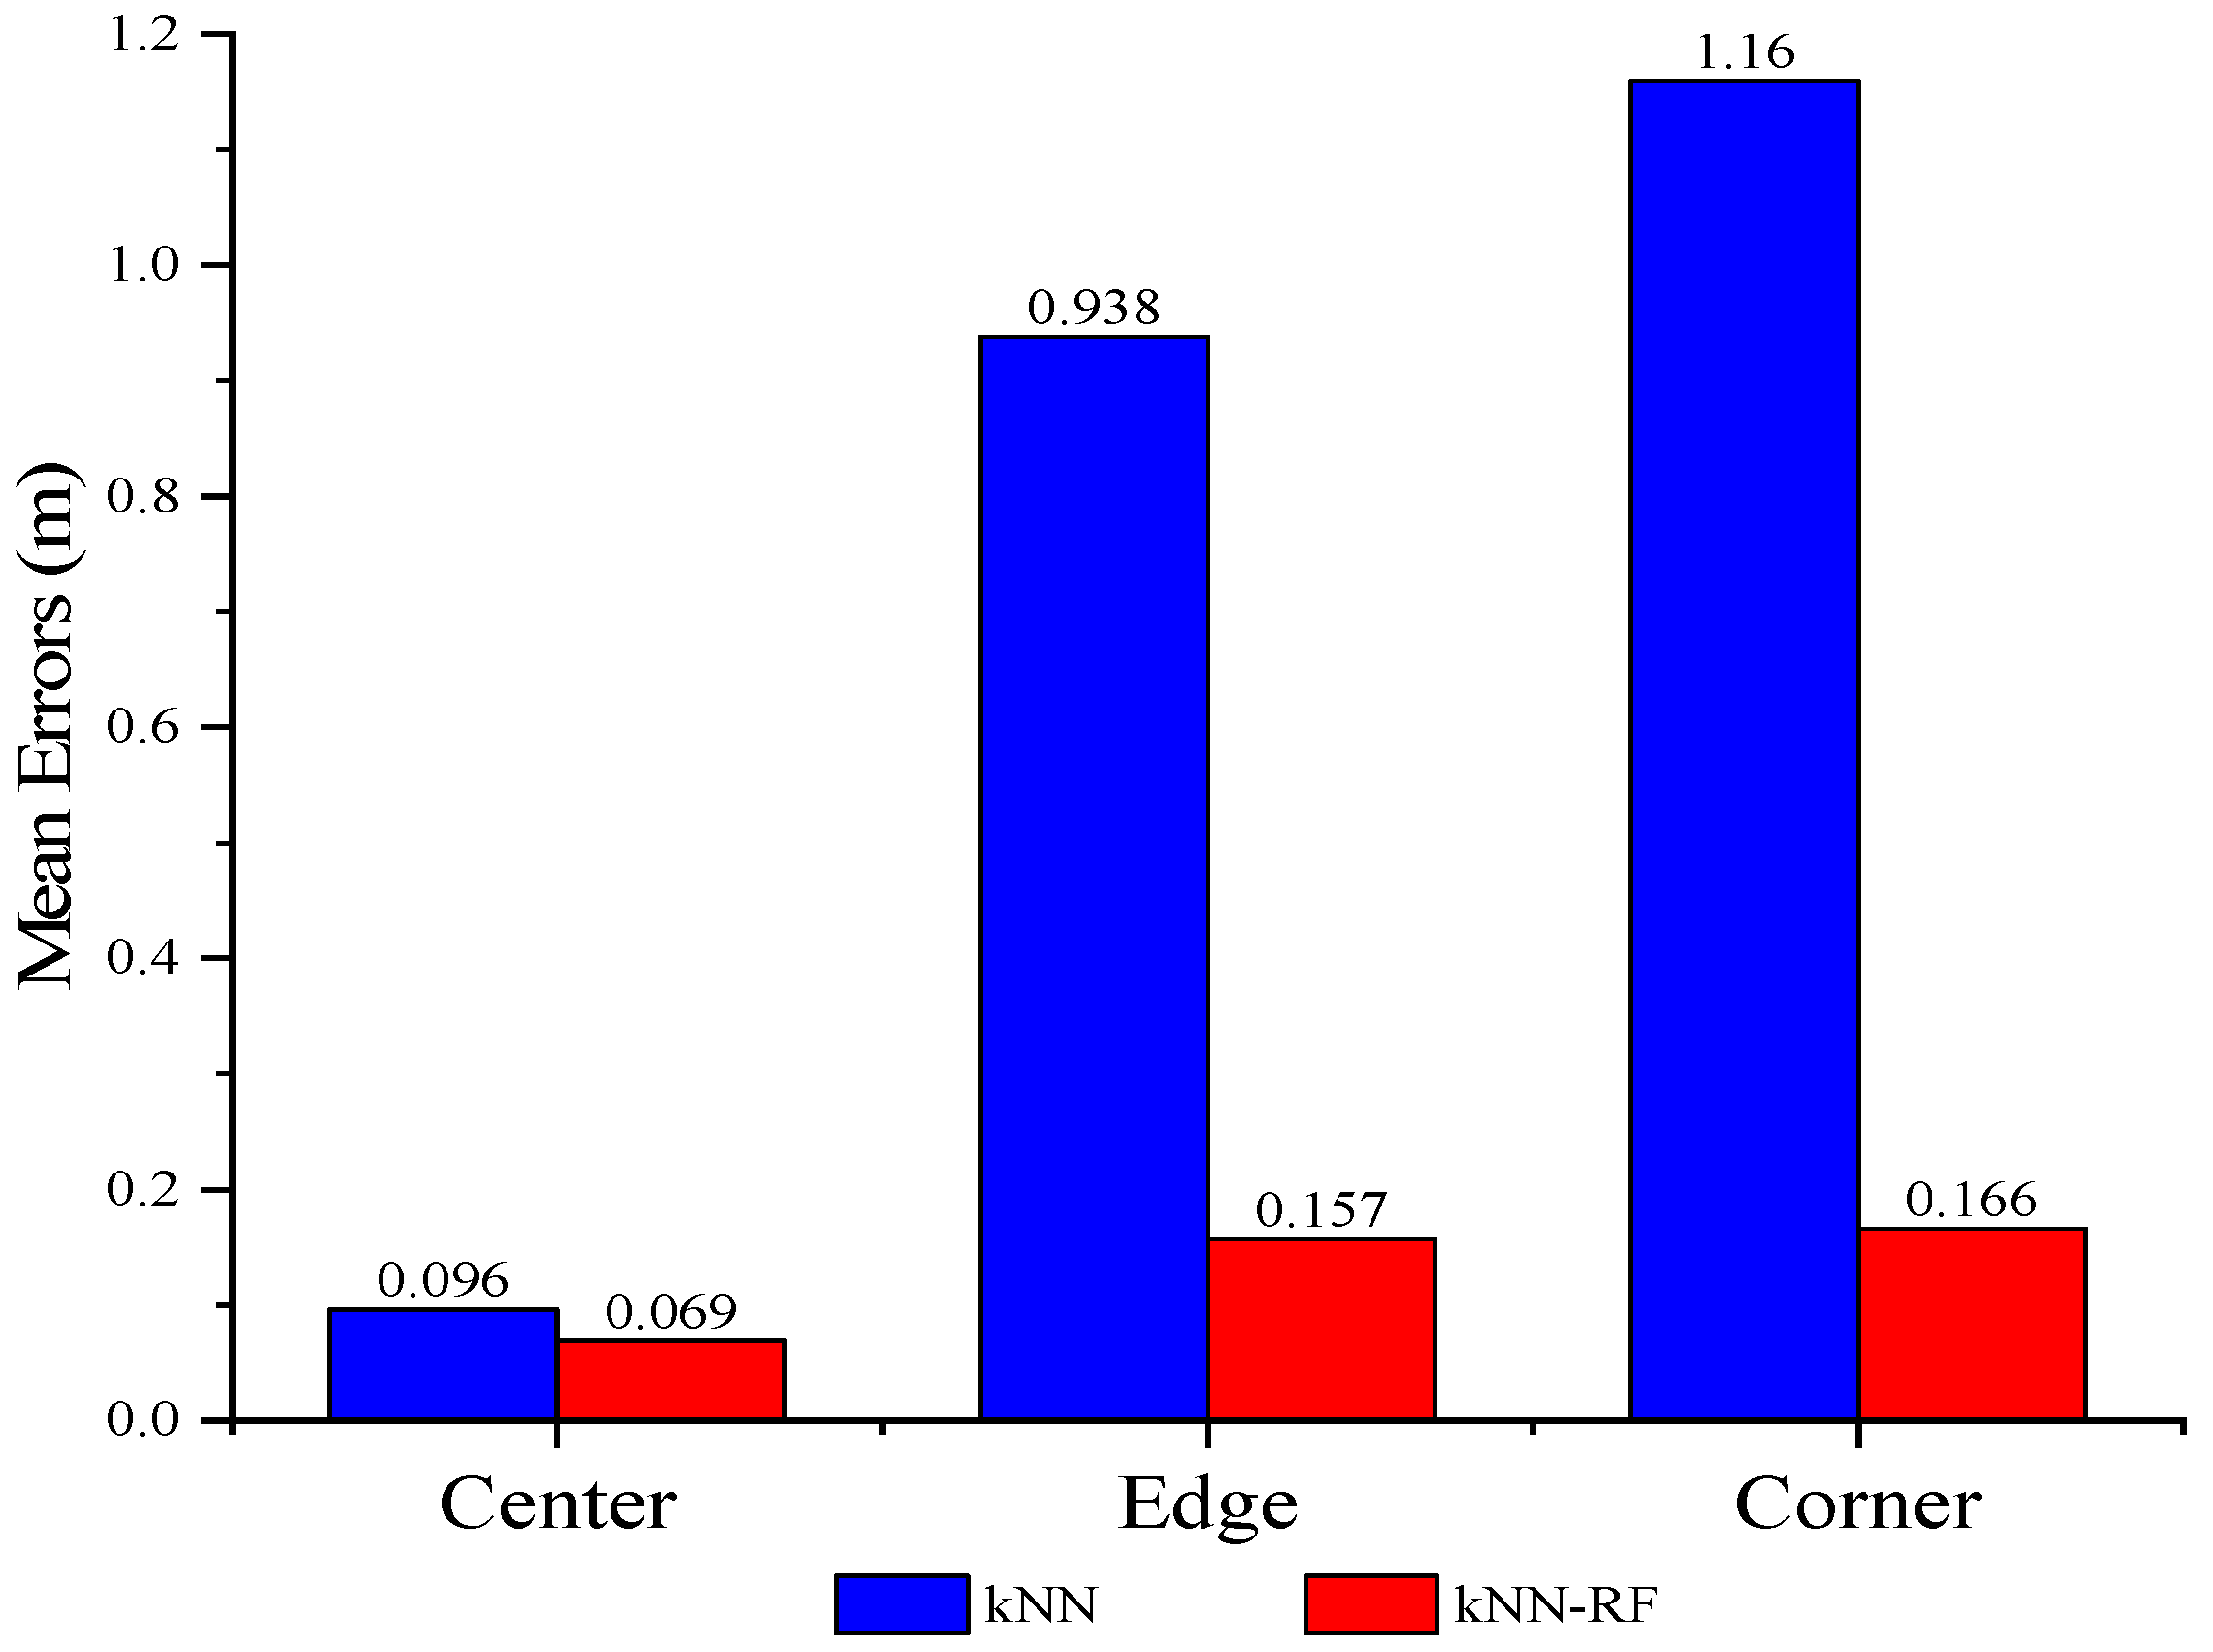
As shown in
Figure 17, the kNN-RF showed positive effects in specific areas of the model. By analyzing the random data with kNN and kNN-RF, we found that the highest error appeared in the corner where the impacts of noise and reflection were greatest. However, after being trained by the kNN-RF algorithm, the error dramatically declined (almost 7-fold) from 1.16 m to 0.166 m. Although the effect of the reflection in the region near the wall was higher than in the central area, and was lower than in the corner area, there was a notable (6-fold) mean error improvement. In contrast, due to the limited impact of the reflection on the central points, that area achieved the best positioning accuracy, 0.069 m, and thus gained only a slight improvement from kNN to kNN-RF.
These results demonstrate that our proposed kNN-RF solution produced a significant improvement in the accuracy of the positioning system, even though the interference intensity became stronger due to reflection and other noises.
5. Applications
The evolution of indoor positioning system using LED light gives us an ideal opportunity to develop useful products that serve our daily lives. In particular, we can build in-house localization applications at a low cost thanks to the availability of LED bulbs. In this paper, we suggest some applications that we are pursuing.
Assistive devices for people with disabilities: The PD will be put on a smart cane or other assistive walking devices to localize the position of the blind users and help them reach their destination quickly and safely. Additionally, a smart wheel chair with a positioning function enables the elderly and the disabled to travel easily. This can help improve their quality of life and maintain their sense of independence.
Indoor mobile robots: In addition to the applications for the disabled, LED-based indoor positioning solution is also particularly useful in the field of mobile robots. We can use a mobile robot as an effective means of transport in a factory or warehouse. The robot is used to pick up, move, and place objects automatically. We can also adopt this kind of robot as a home assistant device which can make our lives easier and more comfortable.
6. Discussion and Conclusions
To improve the positioning accuracy in multipath reflective environments, an innovative indoor VLC positioning model is proposed in this paper, namely kNN-RF. Our simulation results show that this combination of kNN and RF algorithms was five times more precise than other kNN methods. As for conventional kNN methods, the quality of the positioning system is satisfactory if and only if there is no existence of reflection. This noise, however, always persists in the indoor environment. In this paper, we consider not only the highest reflection rate, but also the effect of ambient light, thermal noise, and shot noise. The obtained outcomes show a considerable improvement in the positioning accuracy outside of the room center, which faces the highest multipath reflections. For instance, the positioning errors represent a marked improvement from kNN to kNN-RF in the room corners and near the wall by 7-fold and 6-fold, respectively.
The potential results of the kNN-RF method present a chance of improving the performance of the positioning system despite the negative impact of noises.
To further our research, we plan to conduct a real-time, full-scale experiment to demonstrate the performance of our proposed method. We will also focus on improving the positioning accuracy by strengthening the optimization of signal pre-processing before taking the kNN-RF algorithm into account. After performing some improvements to the algorithm, we will try to apply our proposed algorithm to indoor a mobile robot. For our current study, a VLC-based positioning system is one of the main parts in the field of a multi-robot system, including collision avoidance and multi-robot coordination.


