You are currently viewing a new version of our website. To view the old version click .
Electronics
  • Article
  • Open Access

7 August 2018

Design and Implementation of a Sensor-Cloud Platform for Physical Sensor Management on CoT Environments

,
,
,
and
1
Department of Computer Engineering, Jeju National University, Jeju 63243, Korea
2
KSB Convergence Research Department, Electronics and Telecommunications Research Institute, Daejeon 34129, Korea
*
Author to whom correspondence should be addressed.
This article belongs to the Special Issue Open-Source Electronics Platforms: Development and Applications

Abstract

The development of the Internet of Things (IoT) has increased the ubiquity of the Internet by integrating all objects for interaction via embedded systems, leading to a highly distributed network of devices communicating with human beings as well as other devices. In recent years, cloud computing has attracted a lot of attention from specialists and experts around the world. With the increasing number of distributed sensor nodes in wireless sensor networks, new models for interacting with wireless sensors using the cloud are intended to overcome restricted resources and efficiency. In this paper, we propose a novel sensor-cloud based platform which is able to virtualize physical sensors as virtual sensors in the CoT (Cloud of Things) environment. Virtual sensors, which are the essentials of this sensor-cloud architecture, simplify the process of generating a multiuser environment over resource-constrained physical wireless sensors and can help in implementing applications across different domains. Virtual sensors are dynamically provided in a group which advantages capability of the management the designed platform. An auto-detection approach on the basis of virtual sensors is additionally proposed to identify the accessible physical sensors nodes even if the status of these sensors are offline. In order to assess the usability of the designed platform, a smart-space-based IoT case study was implemented, and a series of experiments were carried out to evaluate the proposed system performance. Furthermore, a comparison analysis was made and the results indicate that the proposed platform outperforms the existing platforms in numerous respects.

1. Introduction

The Internet of Things (IoT) paradigm will be the next wave in the era of computing [1]. The Internet of Things is the fundamental idea of essentially empowering a worldwide connected network of any devices with an on and off switch to the Internet between the real world and a virtual world. The Internet of Things guarantees to enable accomplishing imaginative applications in application areas such as building and home control, smart environment, framing, intelligent transportation, and healthcare services. The embodiment of IoT is to ensure secure connection among heterogeneous physical sensors and actuators with the Internet. Depending upon the Gartner report, the IoT market is predicted to incorporate 20.8 billion IoT devices by 2020 [2]. Huge measures of the data generated by all these devices together should be gathered, processed, stored, and retrieved [3]. Consequently, how to deal with the expanding number of devices has consistently been a vital issue in the area of IoT.
Cloud computing [4] is a much more appropriate technology which provides magnificent elastic computation and data management abilities for IoT. Indeed, it is diffusely acknowledged that cloud computing can be invested in utility services in the immediate future [5]. Cloud computing has been involved and comprised of miscellaneous technologies like smart grids, networking, computational virtualization, and software services [6]. Normally, the IoT consists of a large variety of objects which are limited in storage and computing power. Cloud management techniques are progressively employed to manage IoT components, as IoT systems are growing complex [7]. The goal of cloud computing is to give a better utilization of distributed resources to accomplish better services for the end users. This model is furthermore transforming the way software is made, as an ever increasing number of applications nowadays are intended to be carried out in the cloud. In this manner, there are particular programming models in light of the idea of “XaaS” where X is hardware, software, data, and so forth [8]. Software-as-a-service (SaaS), platform-as-a-service (PaaS), and infraconfiguration-as-a-service (IaaS) are three fundamental categories of cloud computing services.
In consideration of how the cloud is produced, the virtualization of objects is the accompanying normal step in this field. Virtualization [9] is a rising technique that creates virtual representations of physical resources and enables usage of resources as shared resources and on an on-demand basis. Virtual sensors [10] are required for taking care of complex tasks which cannot be handled by physical sensors. They can be utilized to remotely interface two regions of interest with a single function. Researchers have recently focused on sensor virtualization to advance applications in business, health, and academic domains, and they have made several proposals [11] which expand the paradigm of physical sensor networks in which client applications can access virtualized sensors that are capable of being operated from anyone else in software control [12]. For example, mobile crowdsensing could be one of the areas that can benefit from these virtualized sensors through participatory sensing [13]. A crowdsensing platform is presented in Reference [14] where thousands of sensors are required to collect context data from users in the city. Vehicular cloud computing [15] is another typical application, which merges mobile cloud computing and vehicular networking to integrated communication-computing platforms. A distributed and adaptive resource management controller [16] is proposed which aims at allowing resource-limited car smartphones to perform traffic offloading towards the cloud in vehicular access networks.
However, existing studies of physical sensors center around sensor data processing [17], power consumption [18], sensor localization [19,20], and sensor node programming [21,22,23]. There are few studies that concentrate on the management of physical sensors since these sensors are linked to their own application directly. This means that these sensors would reside on the local system, and hence have no other way to be accessed from external servers beyond the local domain. Furthermore, the requirements for sensor management have not been clarified, and thus, users may feel discontent if they cannot use the sensors they need. Moreover, users should be informed of the status of sensor nodes if the sensor is disconnected or faults occur so that they can select other functioning sensors. However, most of these systems have poor capability and infraconfiguration to detect fault nodes in sensor networks.
Our contributions in this paper are as follows: First, we propose a new sensor-cloud-based platform with the main objective of empowering more advanced capability to cope with physical sensors, by means of virtual sensors. With the progression of web front-end technologies, for instance, JavaScript and HTML5, the growing trend of IoT platforms moves in a web-driven direction using Representational State Transfer Application Programming Interfaces (REST APIs) in combination with product-specific services and web-based dashboards to help users to rapidly configure and monitor the connected objects through the platform. This study concentrates on the virtualization of wireless sensor networks (WSNs) to the cloud by utilizing these web technologies, proposing a platform which is intended to achieve a consistent combination with physical sensor networks. This could be applicable by giving software agents running in the cloud, likewise alluded to as virtual sensors that act simply like physical sensors dispersed in the cloud, giving the environmental circumstances from the zone where they are deployed. Along these lines, this is the so-called sensor-data-as-a-service (SDaaS) paradigm [24]. This paradigm lessens the excess data capture as data reusability in WSNs that is straightforward to the cloud users. The end users can directly control and utilize the WSNs through standard functions with an assortment of parameters like sampling frequency, latency, and security. Moreover, multiple users from different regions can share the data captured by WSNs with a specific end goal to reduce the burden of data collection for both the system and the users. The designed platform also provides different interfaces for enrolling physical sensors, for provisioning virtual sensors, for monitoring and controlling virtual sensors, and for creating and supervising end users. Besides, the users do not need to concern the low-level points of specification of sensors, for example, the types of sensors utilized and how to set up the sensors.
The most prominent aspect about this platform, which makes it a stage forward in reinforcing coordination of WSNs with the cloud, is the novel approach to recognize faulty sensors via virtual sensors. Since the status of virtual sensors have a relationship with their corresponding physical counterpart, the virtual sensors will be able to inform of sensor errors if the associated physical sensors are faulty. Lastly, we demonstrate the practicality of our designed platform by implementing a real-life case study in smart space. The Raspberry Pi, which provides the computing power and wireless communication capabilities, has been used to integrate with various low-resource sensors. The IoTivity [25] is utilized for the communication between physical sensors and the cloud, but for communication between the cloud and application client, HTTP is used. The IoTivity is a standard and open source framework to permit adaptability making solutions which can address a wide range of IoT devices from various application environments. In general, the IoTivity conforms to the User Datagram Protocol (UDP)/IP stack, hence the Constrained Application Protocol (CoAP) [26] is chosen as the mandatory protocol. It originally characterizes an HTTP-like transfer protocol which also entirely complies with the representative architecture of state transfer (REST) architecture style.
The rest of this paper is organized as follows: Section 2 gives a concise introduction on cloud infra configurations towards IoT and discusses a portion of the similar related research. Section 3 explains the designed platform for integrating physical sensors in the cloud. Section 4 gives some insight into the implementation of the case study over the designed platform. Also, we describe an overview of the implementation of the smart space case study using various snapshots. Section 5 reports the evaluation results of the proposed platform. Section 6 outlines the significance of the proposed work through a comparative analysis with existing work. Finally, Section 7 summarizes the main conclusions of the paper and discusses some directions for future research.

3. Designed Architecture for Sensor-Cloud Platforms

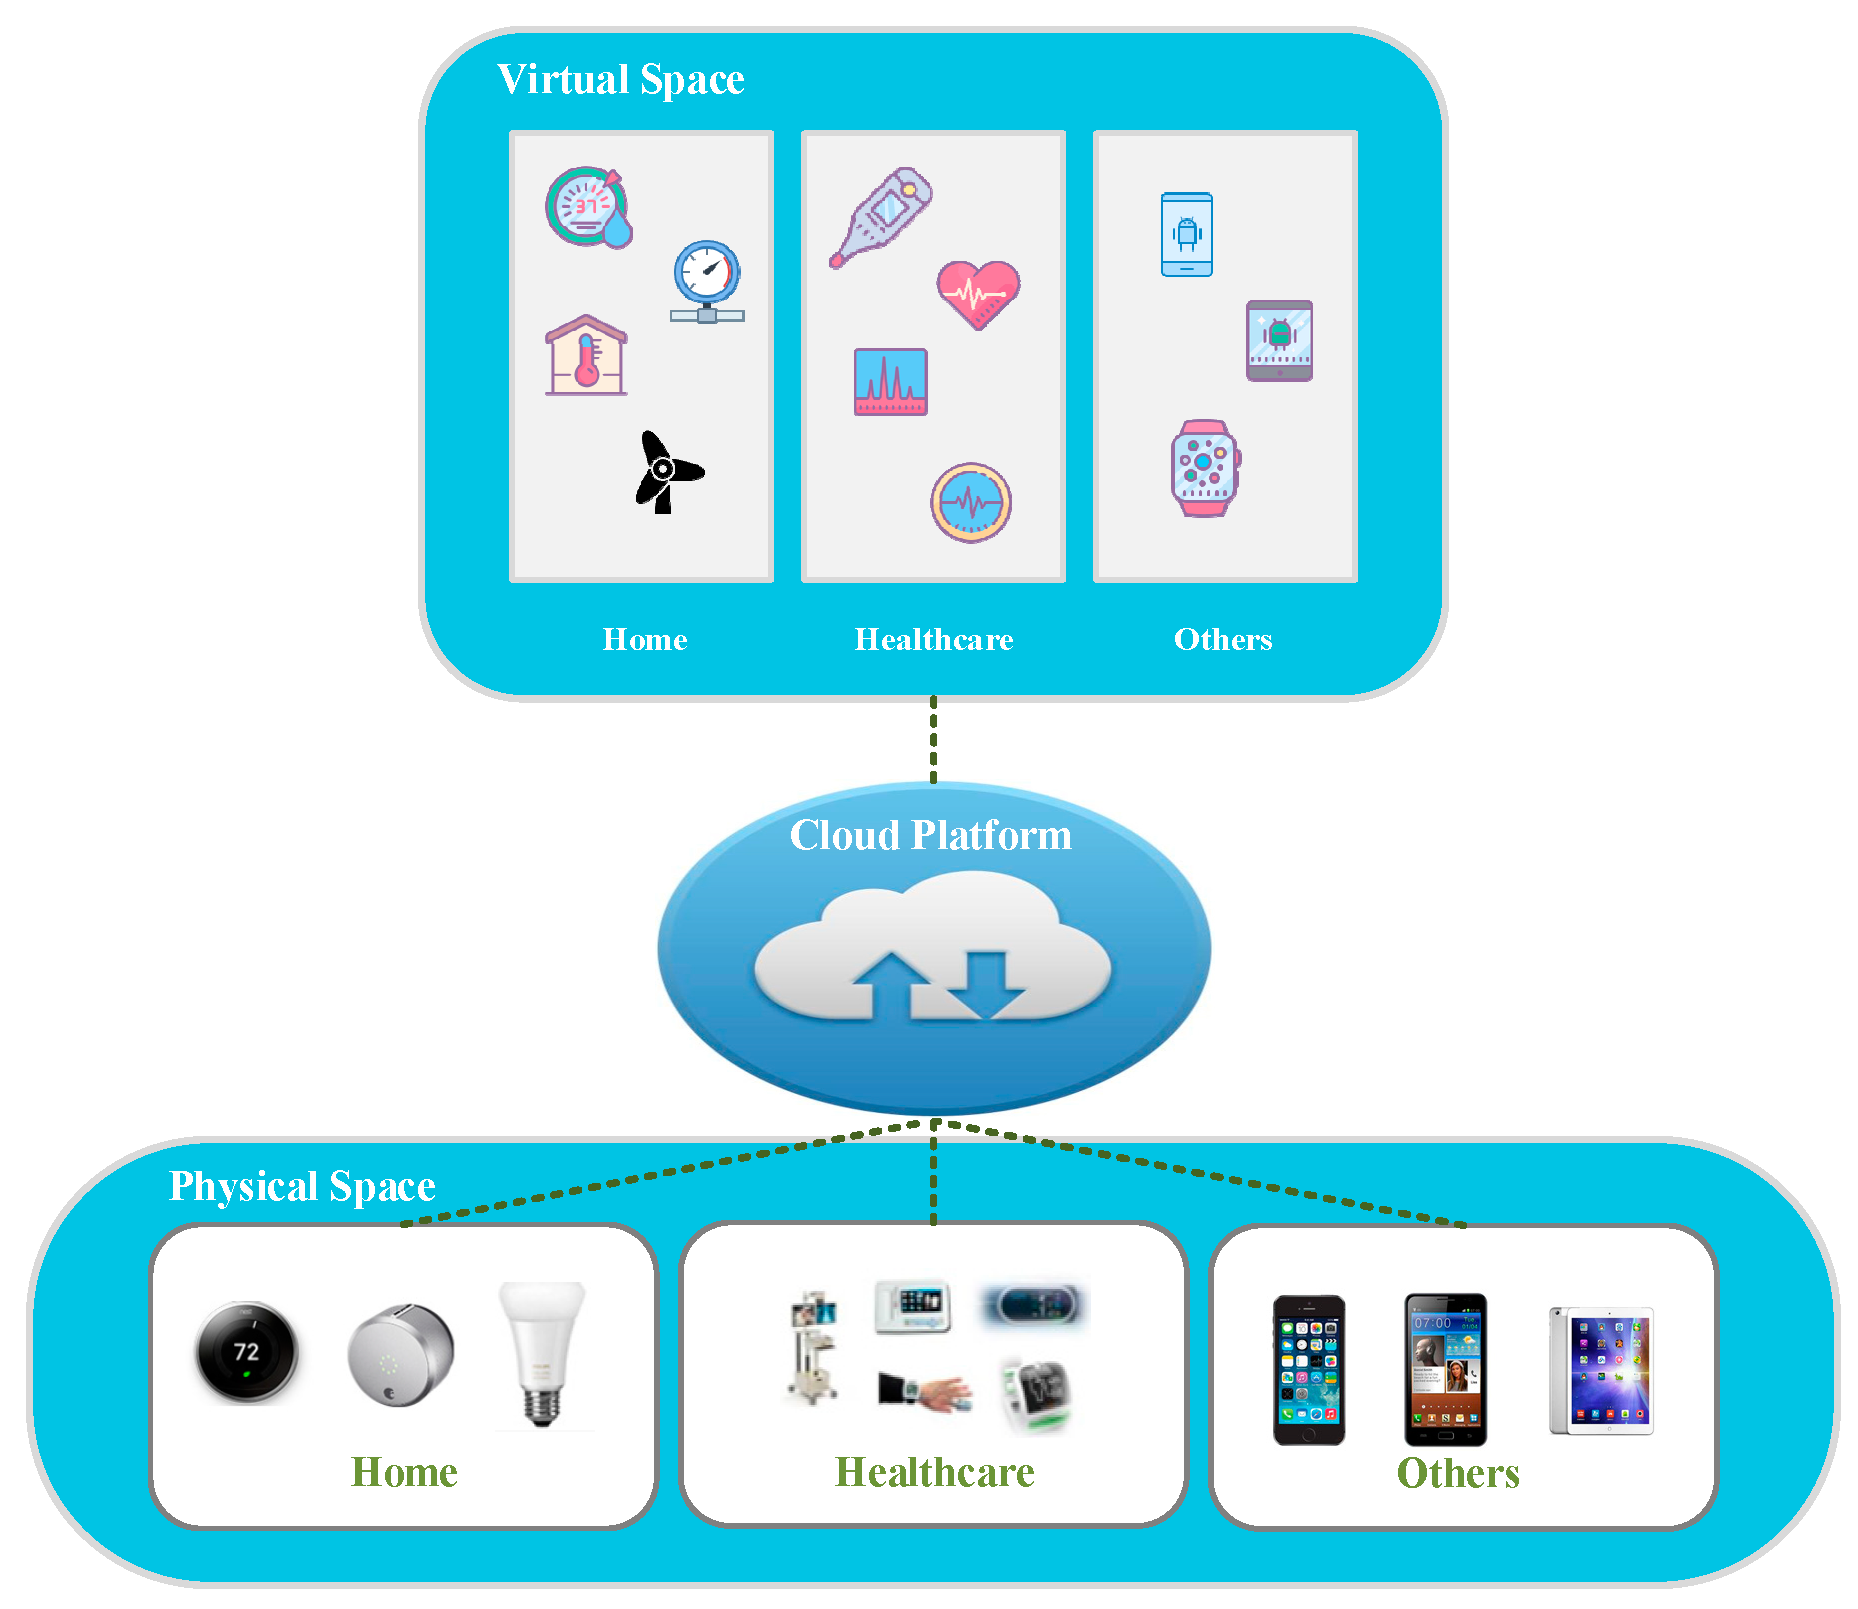
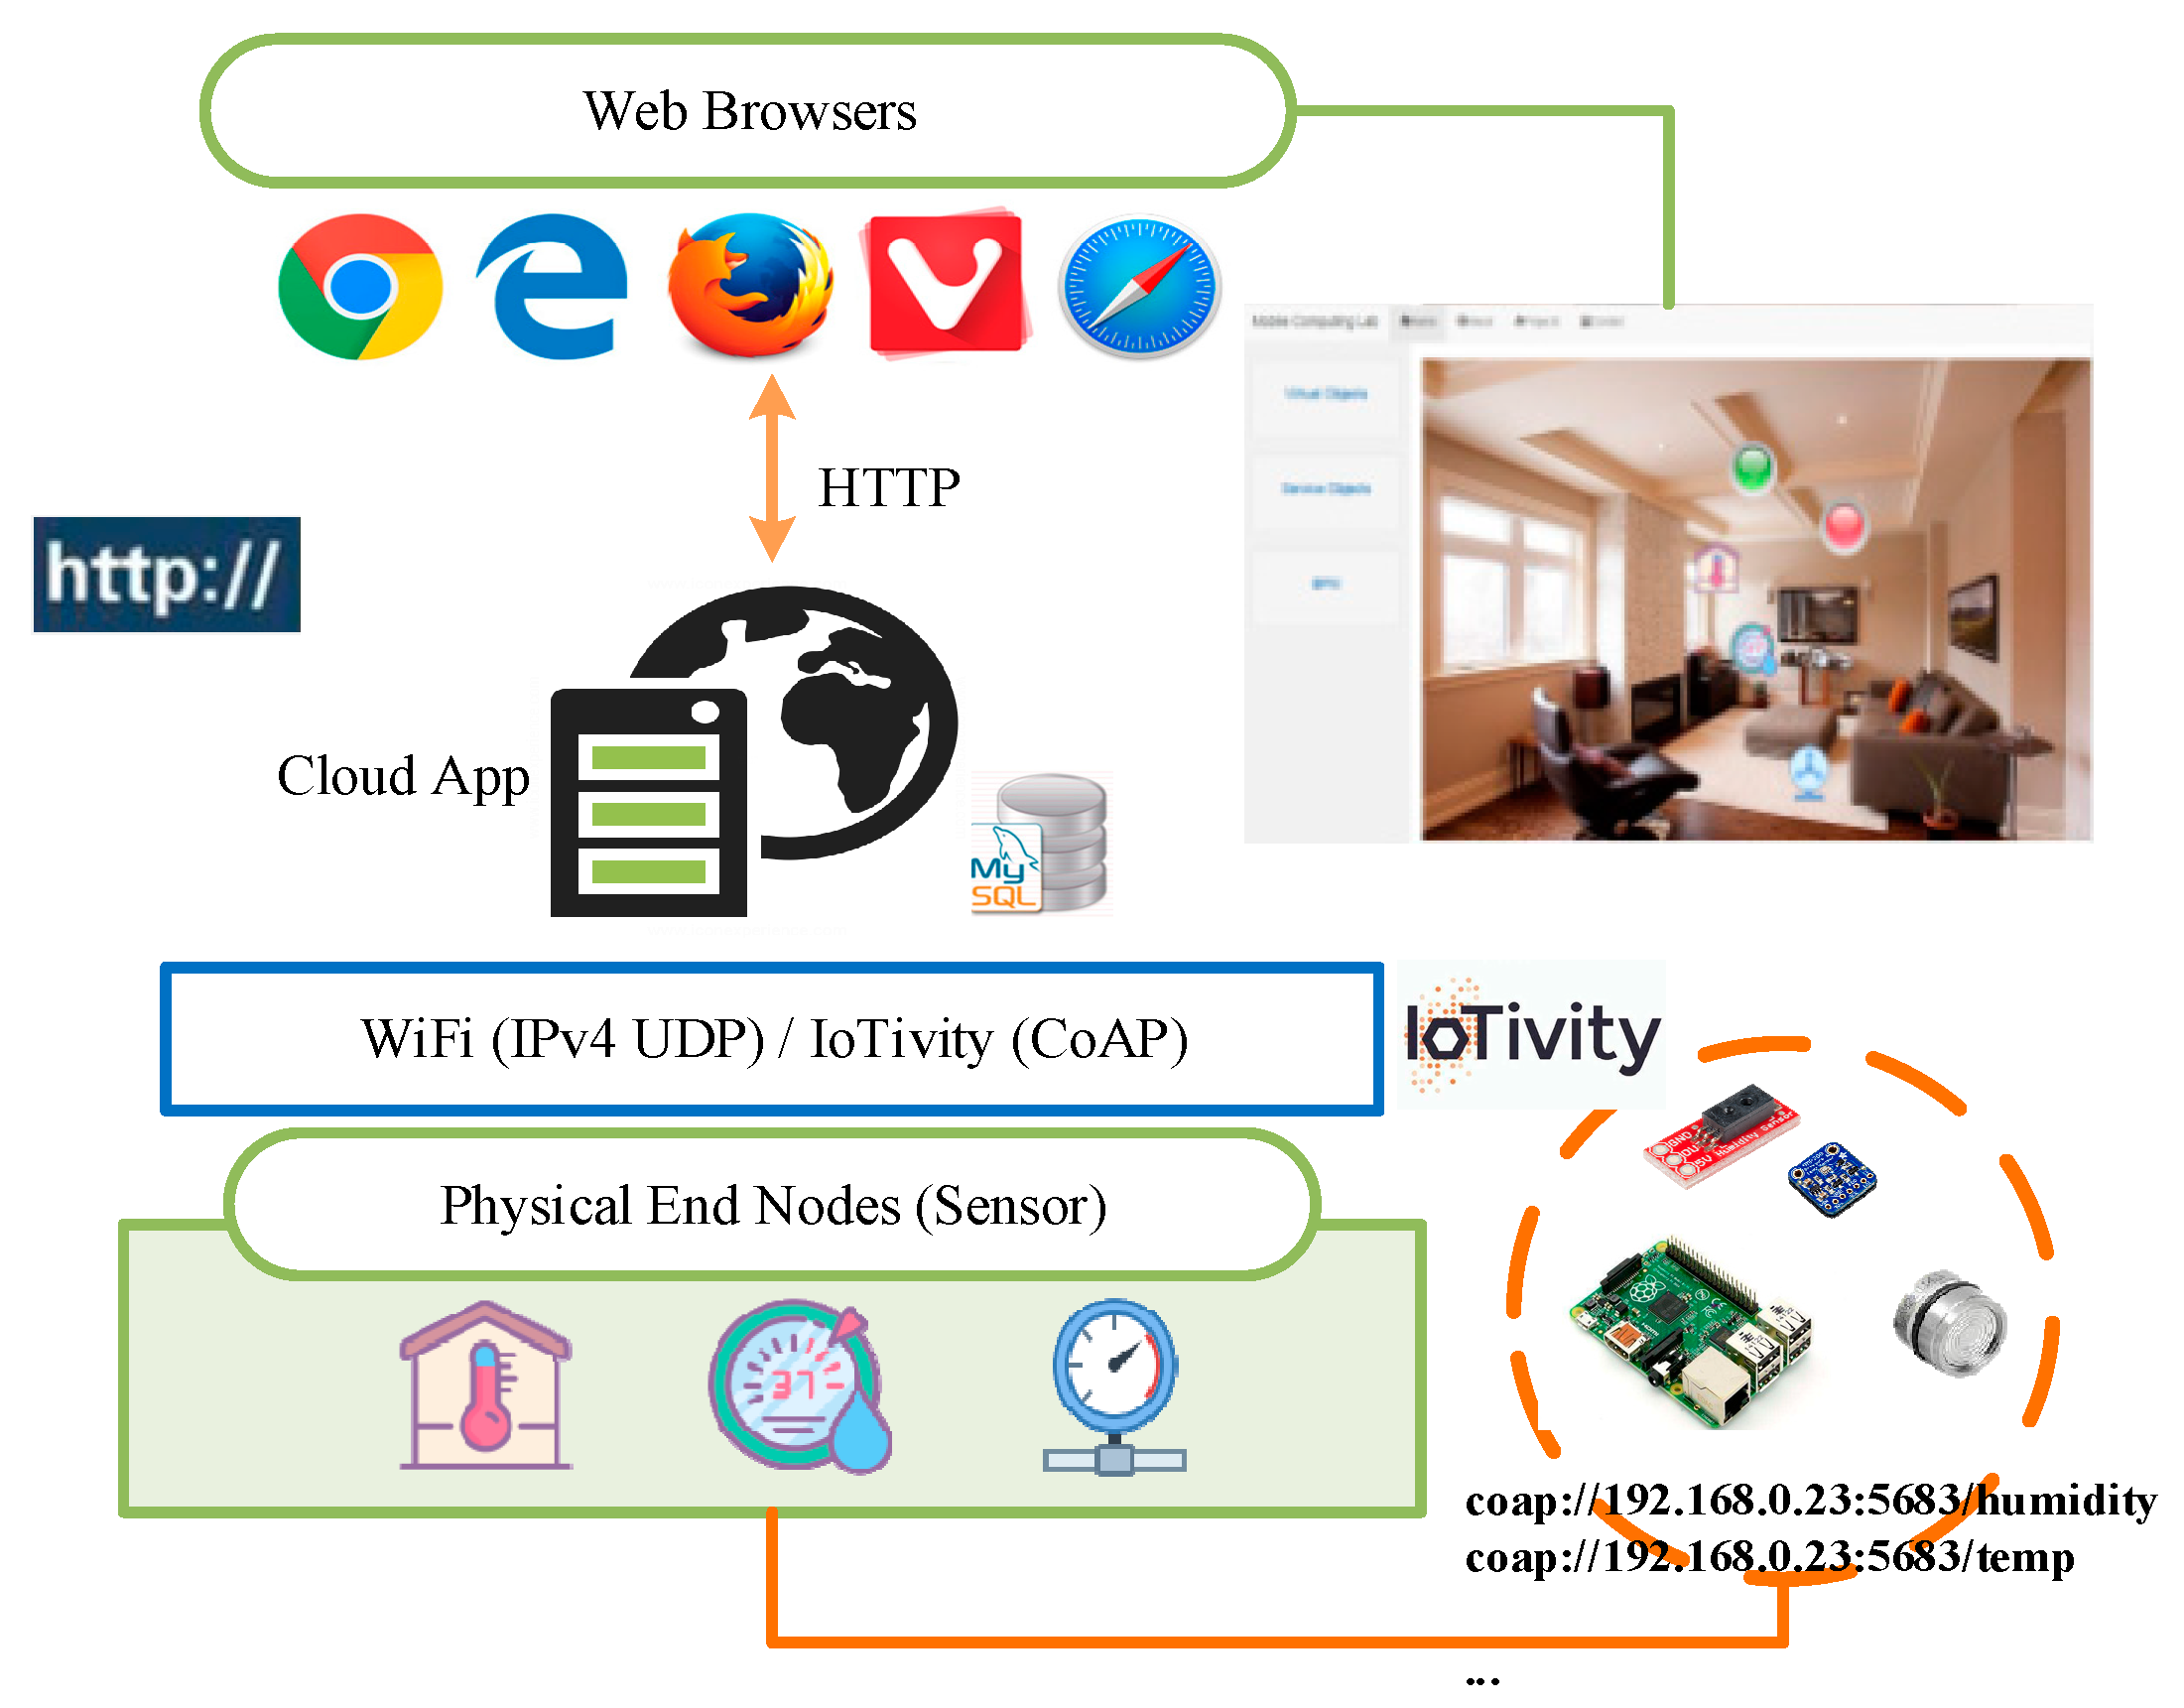
3.1. Basic Architecture of the Cloud-Based Platform

Figure 1 presents the basic architecture of the Cloud-based platform. The IoT nodes consist of various physical sensors capable of communicating with the Internet. The cloud extracts profile data from the sensors, thus representing them as virtual sensors via the web interface. The cloud also provides RESTful APIs to offer functionalities such as discovering physical sensors and reading sensing data from them.
Figure 1. Basic architecture of Cloud-based platform.
The mapping physical sensors to virtual sensors on the Cloud-based platform is described in Figure 2. We describe virtual sensors in order to enable the users to use sensors without any concern about considerations like specifications or location of physical sensors. The virtual sensors are used to encapsulate the basic attributes and behaviors of their corresponding physical counterparts in the physical space. The physical space consists of various IoT devices across different application domains such as smart home, healthcare, etc. These devices have the ability to perform actions according to commands from the virtual space. For each device, a device profile is preserved, which contains the properties (ID, URI, location, etc.) of the device and the basic action offered by the service. The profiles are stored by the cloud platform for further processing, as in other previous platforms. This platform provides various visual interfaces that provide better understanding of virtual sensors and enable the end users to manipulate IoT devices associated with the platform in an intuitive way, thereby reducing the burden under the premise of performing some actions on the physical sensors.
Figure 2. Mapping physical sensors to virtual sensors.

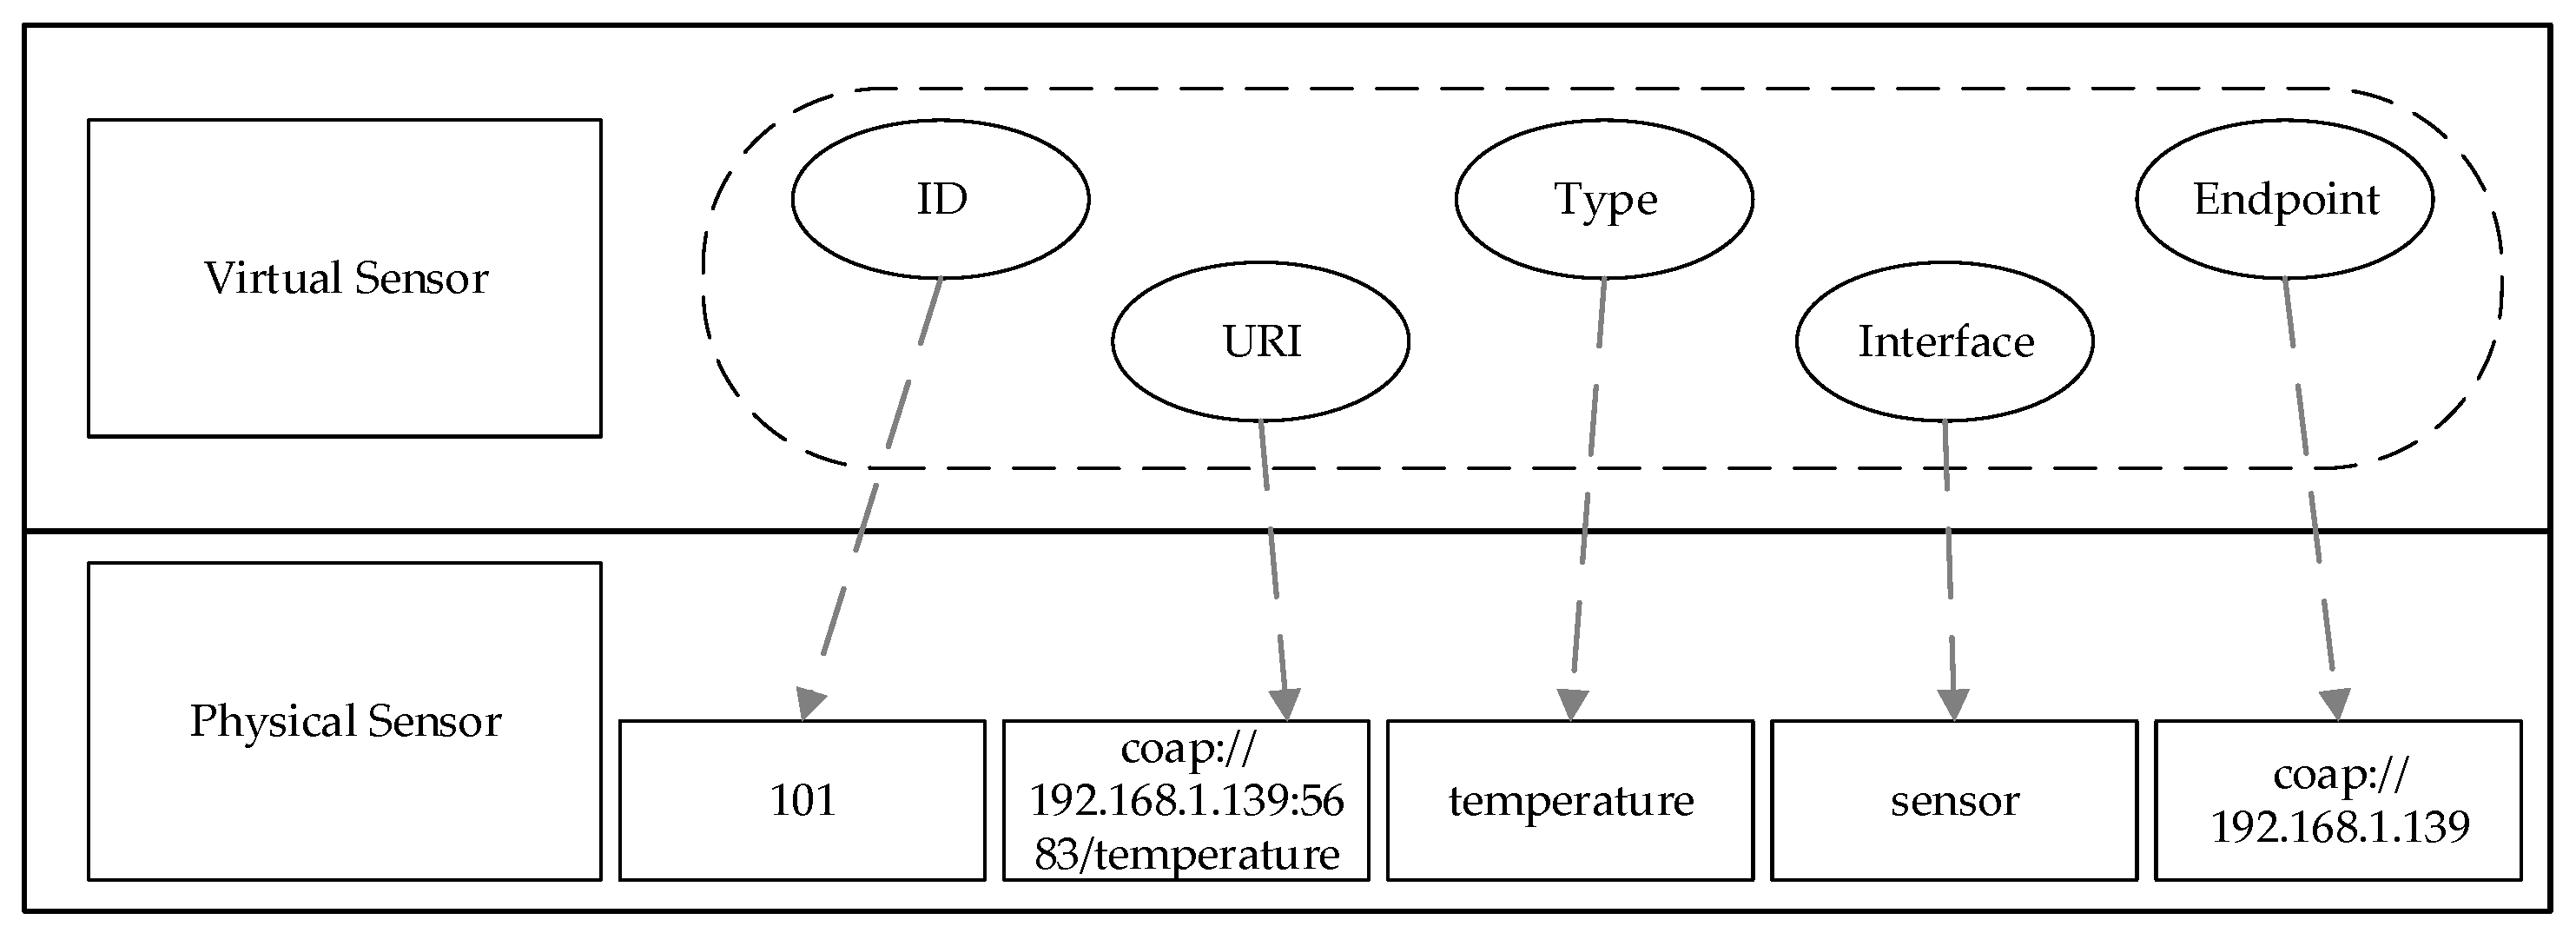
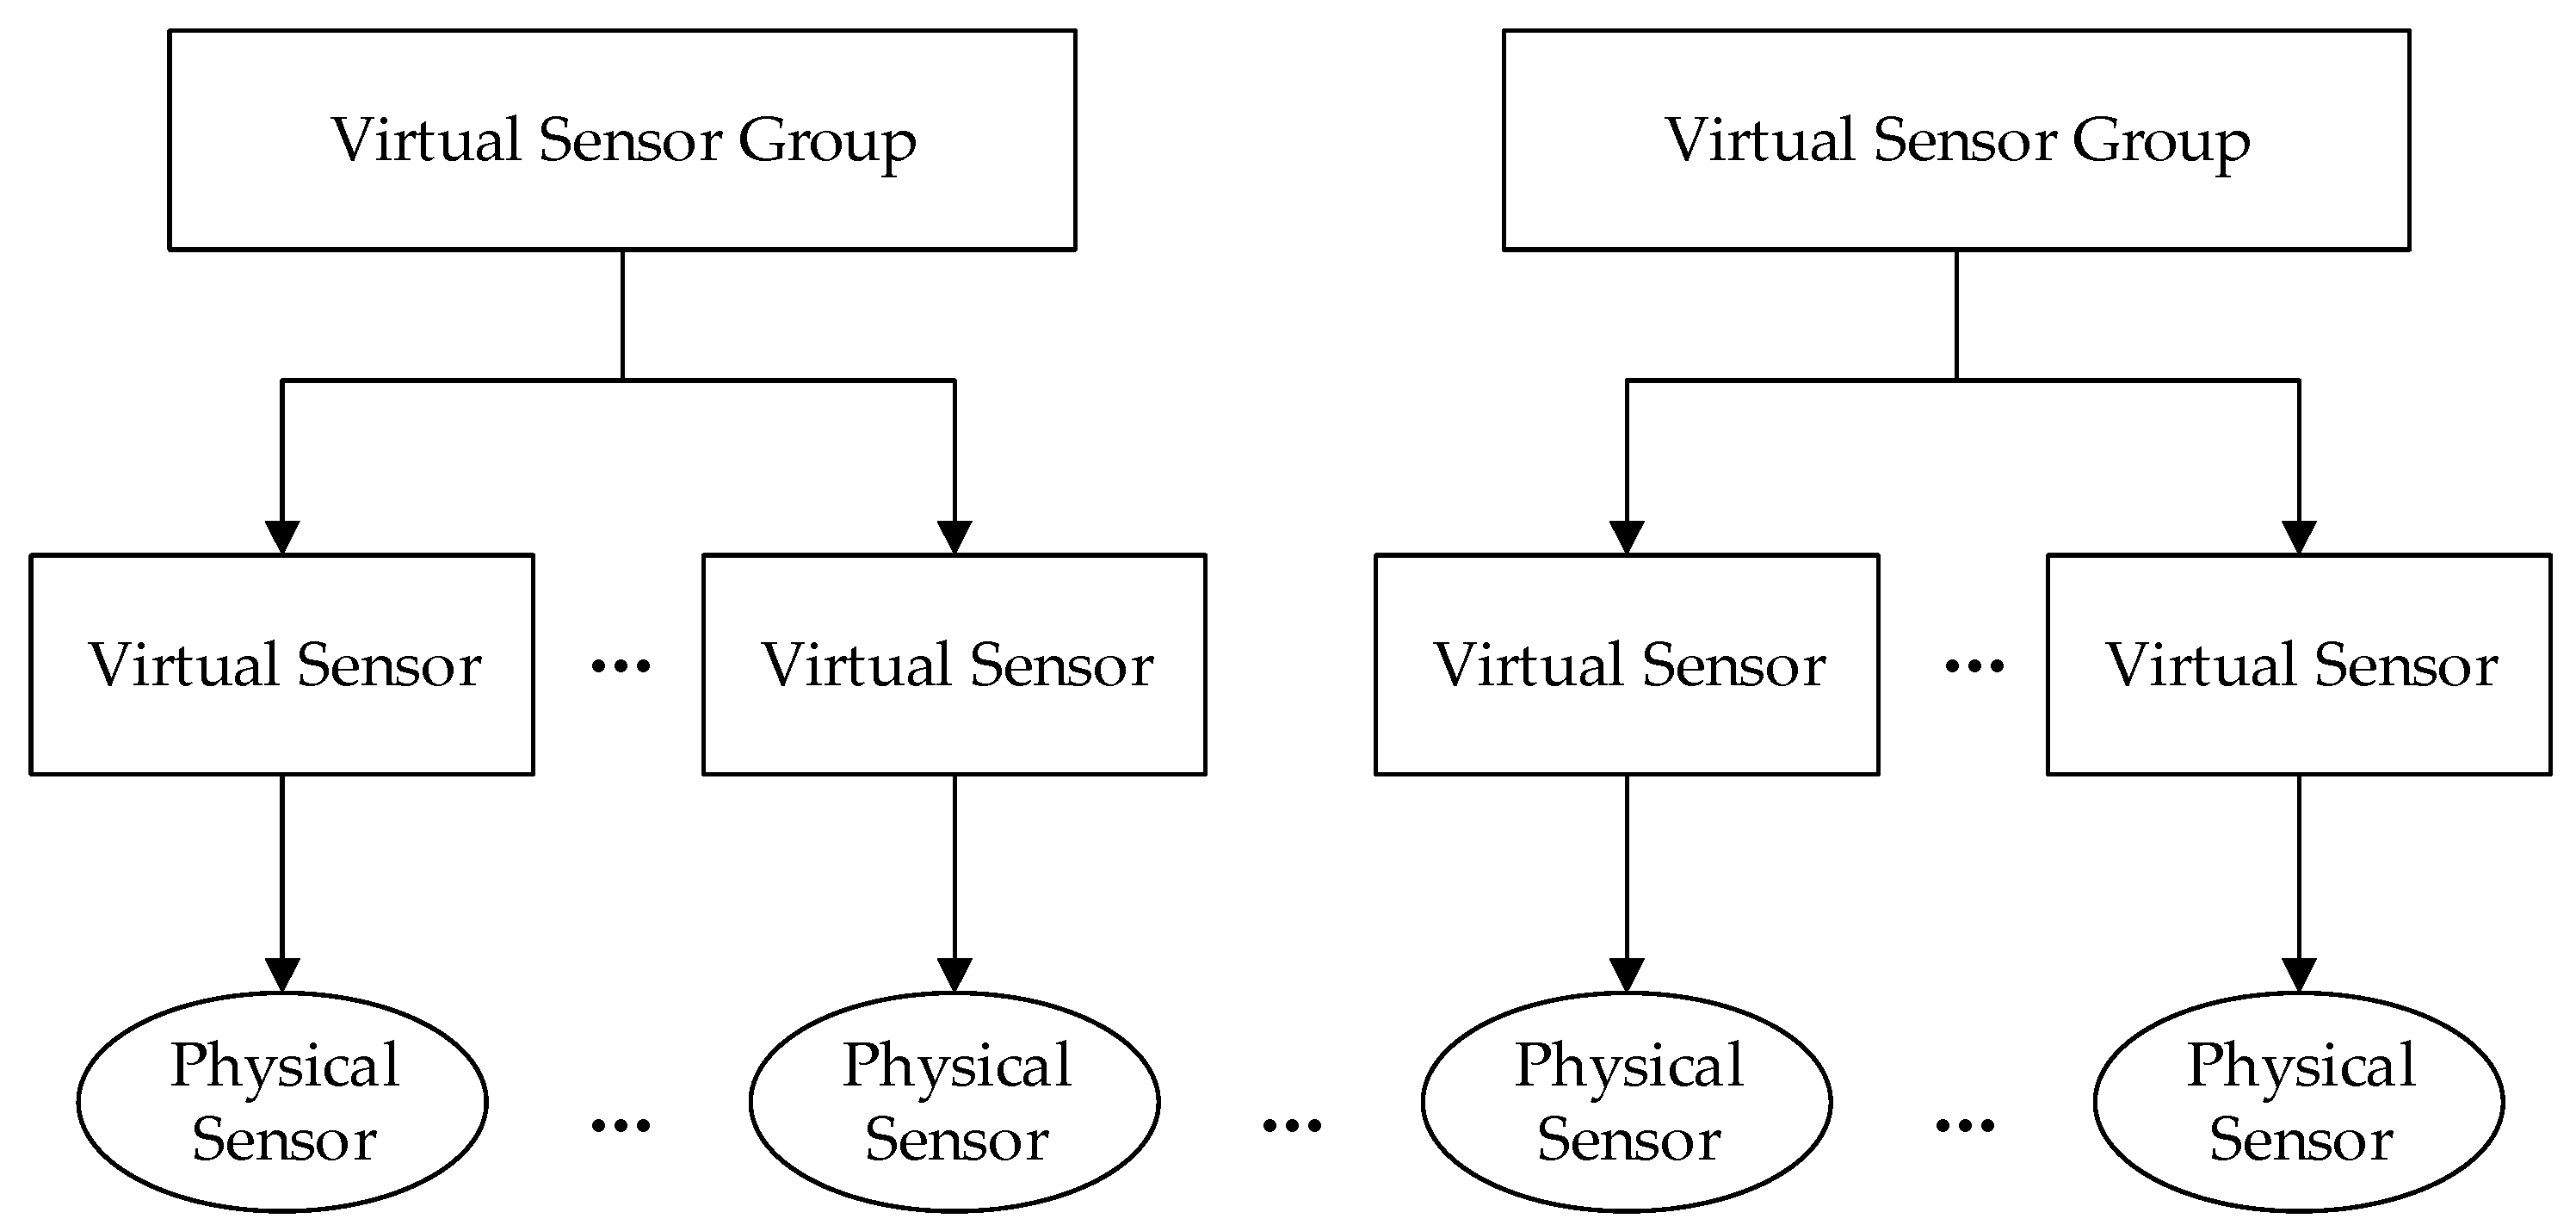
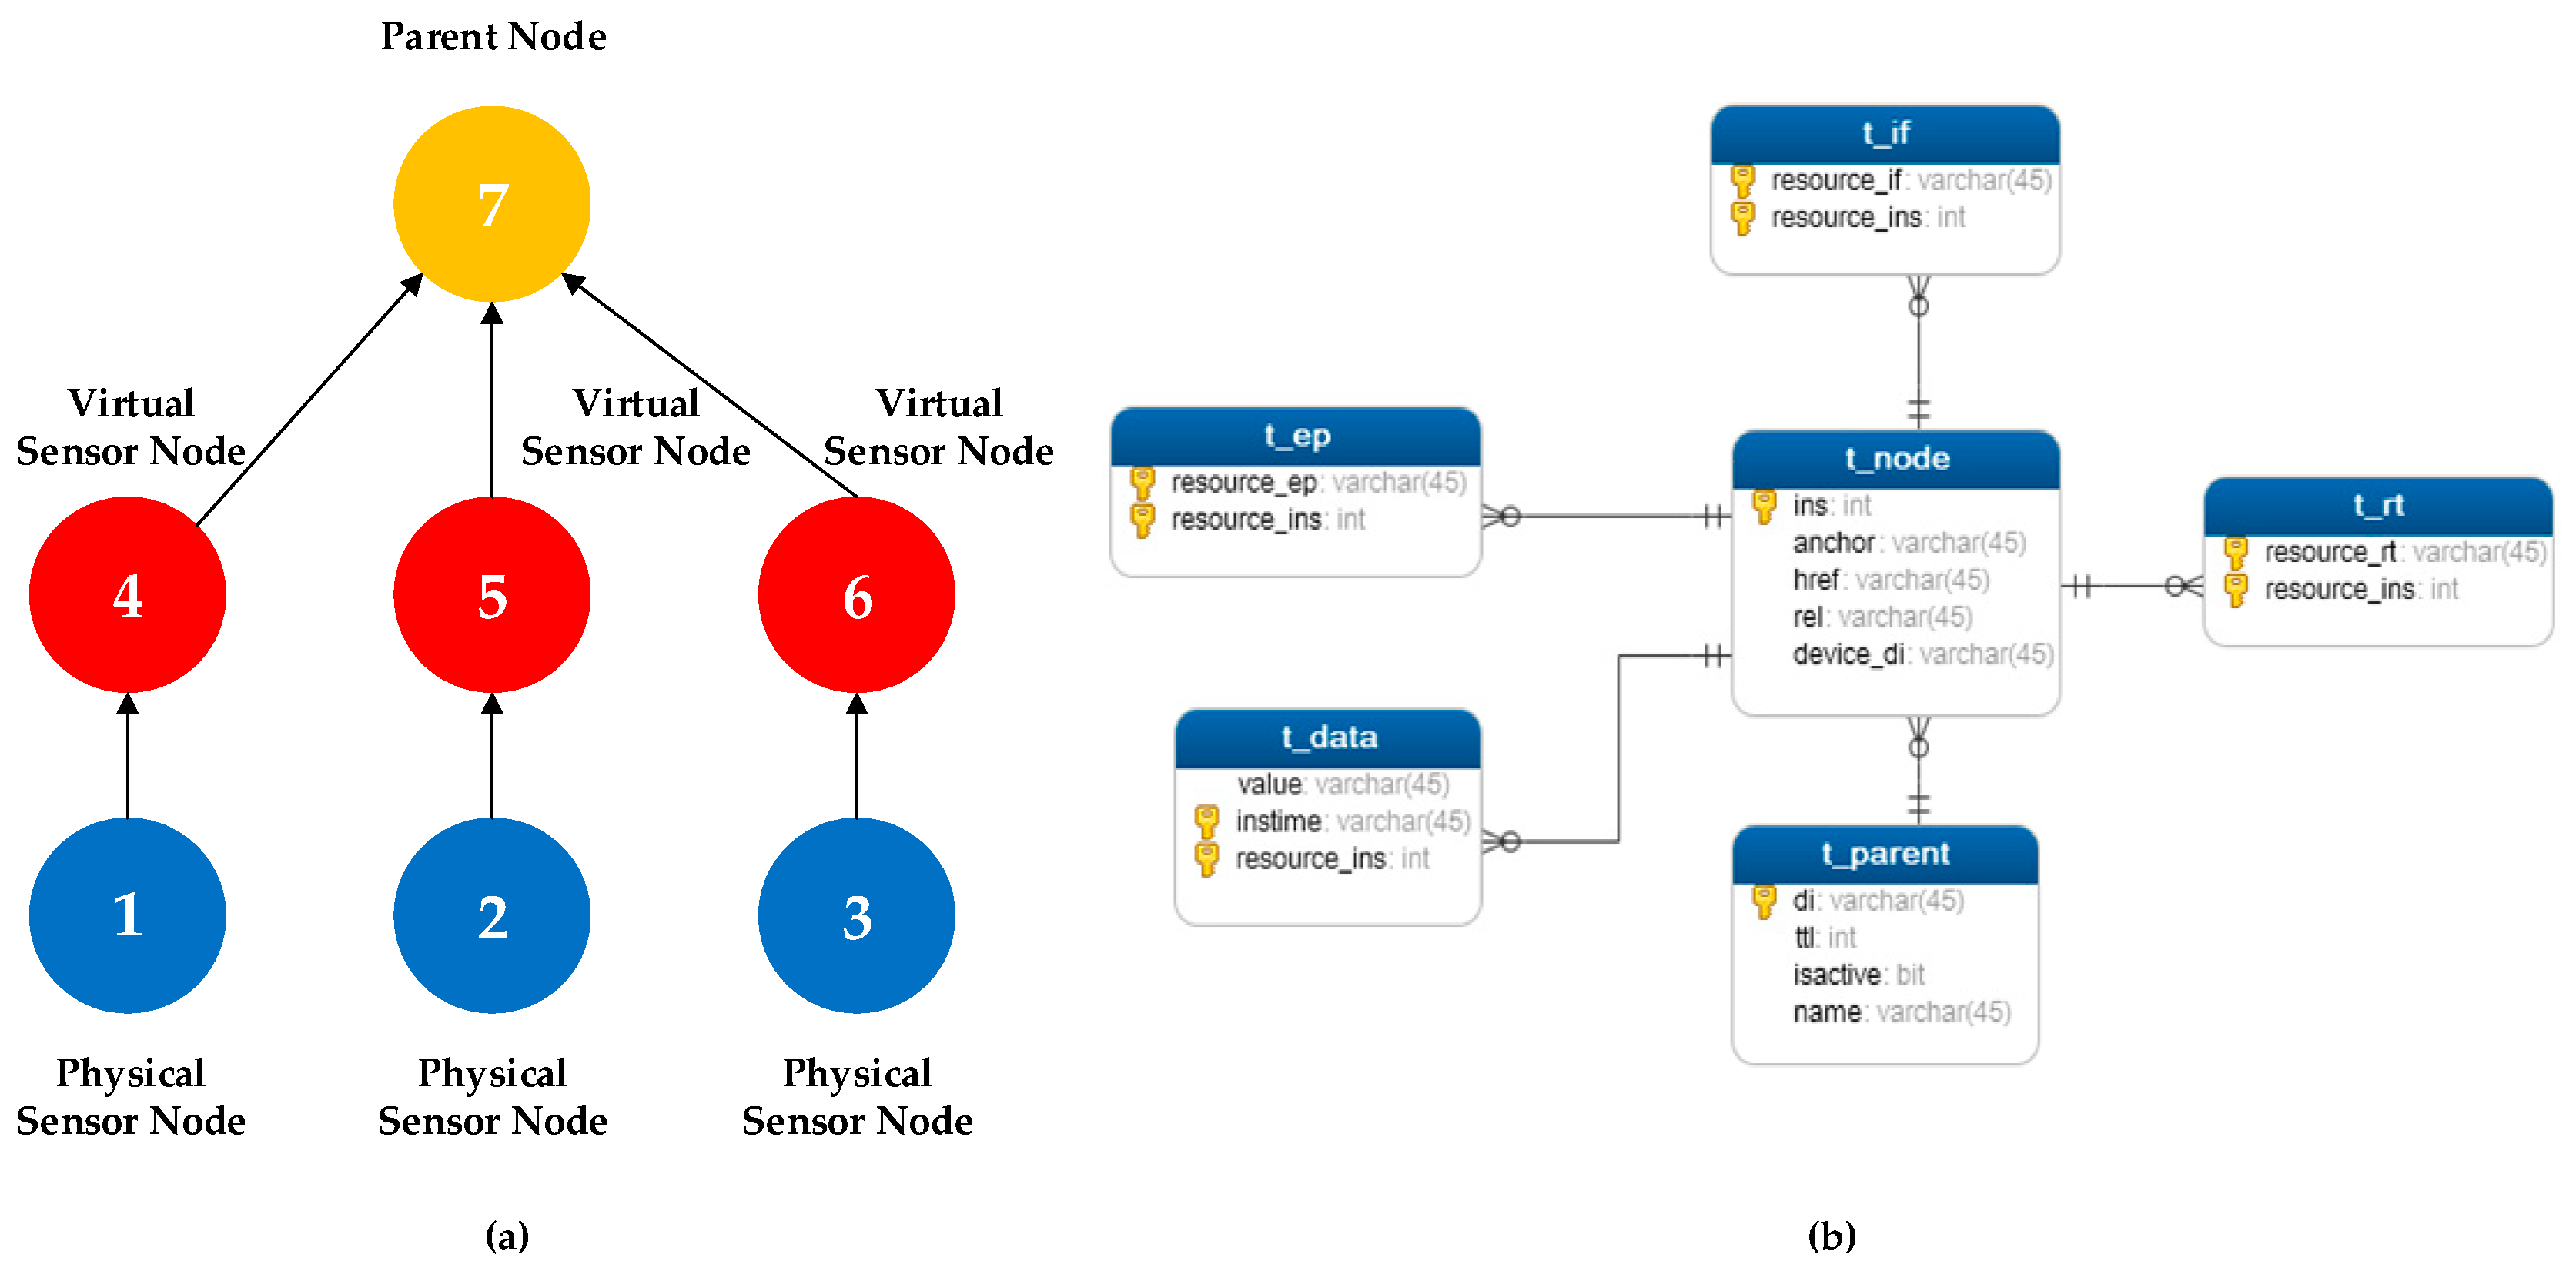
3.2. Data Representation using Virtualization and Grouping

Figure 3 shows the data production and representation for the proposed platform. The data are presented as a single instance illustrating the metadata used for that layer. The physical sensor layer comprises various physical sensors, which are the IoT resources responsible for the production of data. These IoT resources are represented as virtual sensors in the system. The metadata for a virtual sensor is depicted in the second layer of the figure. In order to register an IoT resource with the system, information must be provided corresponding to the metadata in the virtual sensor layer. This data includes the target URI of the resource, which describes the protocol and the network address of the resource so that it can be accessed from anywhere. Other metadata includes the ID of the resource so it can be identified from other resources. The type metadata is a representation associated with the resource referenced by the target URI. The interface metadata defines the instance supported by a resource that can be either a sensor or an actuator. The endpoint metadata represents the endpoint information of the target resource.
Figure 3. Metadata representation between physical sensors and virtual sensors.
The relationships among physical sensors, virtual sensors, and virtual sensor groups are discussed in Figure 4. There is a one-to-one correspondence between a virtual sensor and the physical sensor from which it was created. Although physical sensors are varied in type, size, and use, a specific application does not need to use all of them. An application uses some types of physical sensors according to the scenario and requirement. The proposed sensor-cloud system divides virtual sensors into virtual sensor groups depending on the corresponding application scenario. A virtual sensor group consists of one or more virtual sensors. Users can freely use the virtual sensors included in the group as if they are on their own. For example, they can control the behaviors of virtual sensors and check their status. The proposed platform prepares typical virtual sensor groups for the smart space, and this use case will be discussed in detail in the use case Section. Users can also create new virtual sensor groups by selecting virtual sensors according to their custom requirements.
Figure 4. Relationship among virtual sensor groups, virtual sensors, and physical sensors.

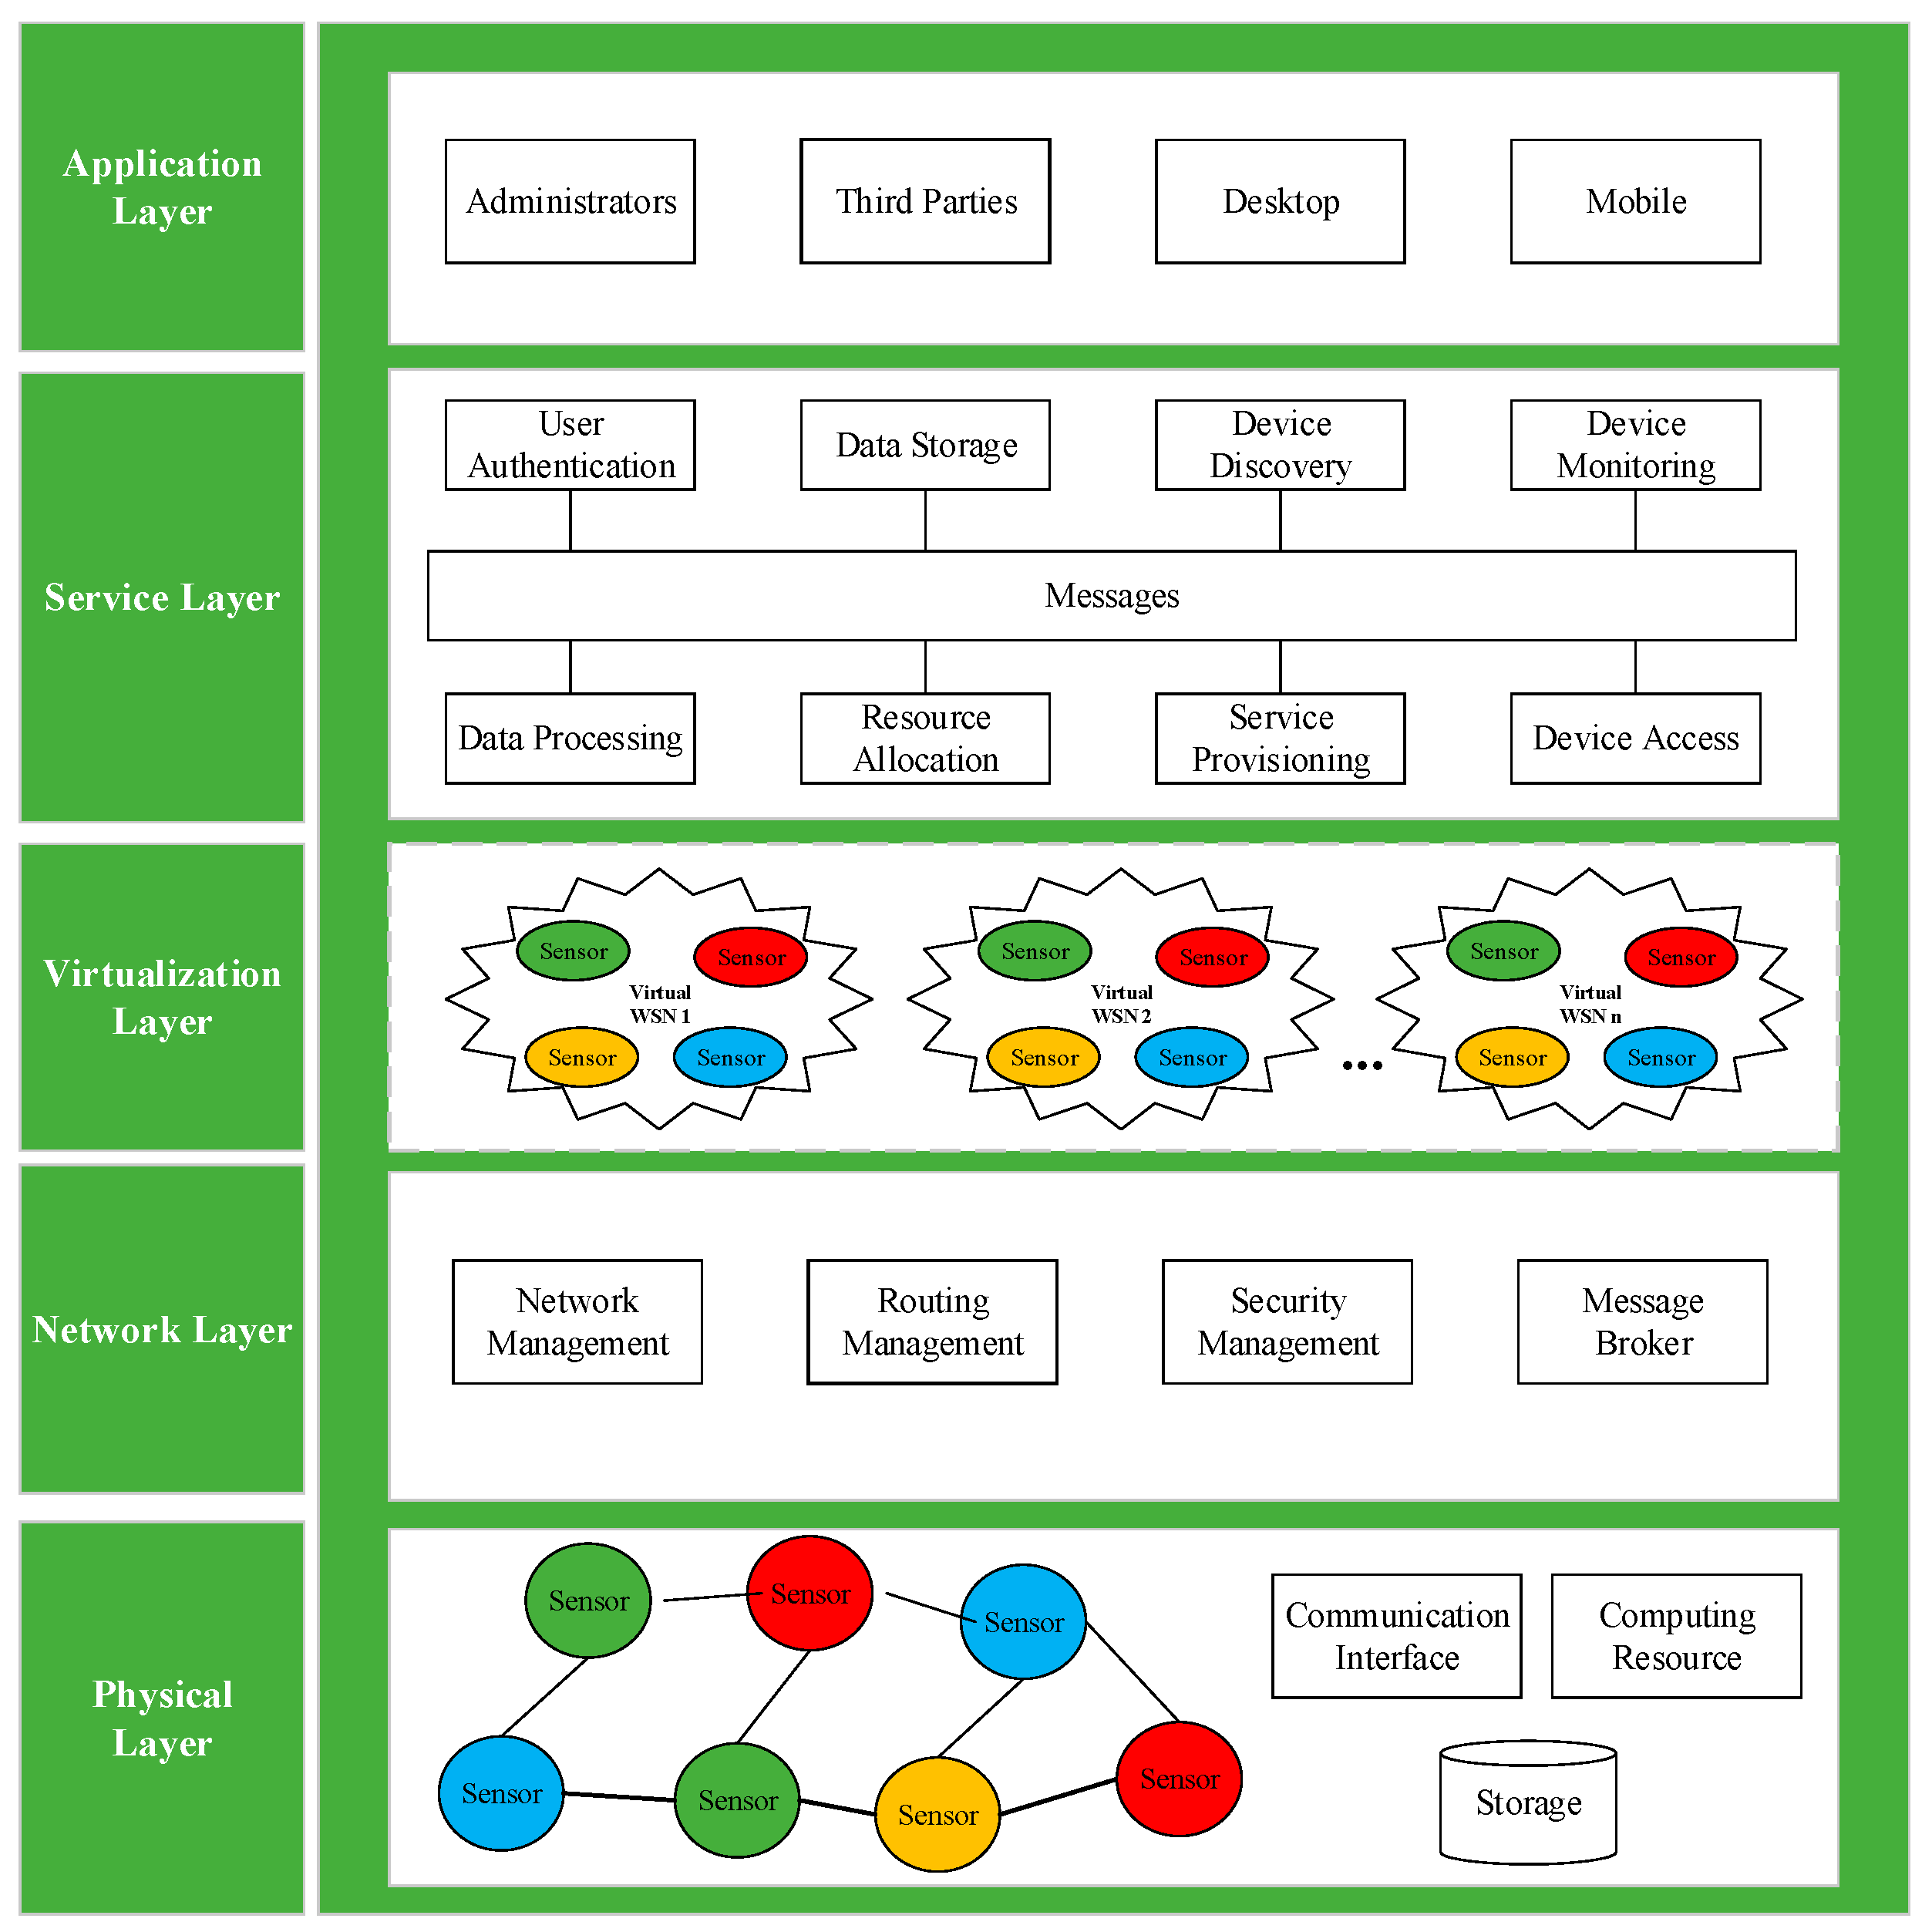
3.3. Proposed Layer-Based Platform Architecture

Figure 5 represents the layer-based architecture of the Cloud-based platform, where each layer is decoupled from other layers so that they can evolve independently. The physical layer comprises various network connected devices with the abilities of sensing, computer processing, and storage. The major function provided by the network layer is routing, as physical sensors do not have a global ID and have to be self-organized. It also contains other modules for providing services including network management, security management, and message broker. The virtualization layer represents the physical sensors as virtual sensors in cyber space. These objects contain various behaviors, including the services or functions that can be utilized by the system to interact with the corresponding physical sensors, and information such as URI and location of these objects are the attributes with them. The service layer contains all modules that organize common services for providing various features including user authentication, device monitoring, service provisioning, and the device access. The data storage provides storage space for the profile and sensing data provided by physical sensors, and contains the instructions to process such information. The data processing receives and converts the data from the sensor networks to the file format understood by the platform. The resource allocation assigns and manages the available resources to various uses such as determining whether requests for services can be responded to. The device discovery is used to detect all the available devices connected to the platform or reject access when the devices are disconnected. Finally, the message offers the required components for enabling communication among the elements of the architecture. The top layer is the application layer, this layer visualizes the physical sensor network in either desktops or mobile devices and can mash content with data or apps from third parties.
Figure 5. Proposed layer-based platform architecture.

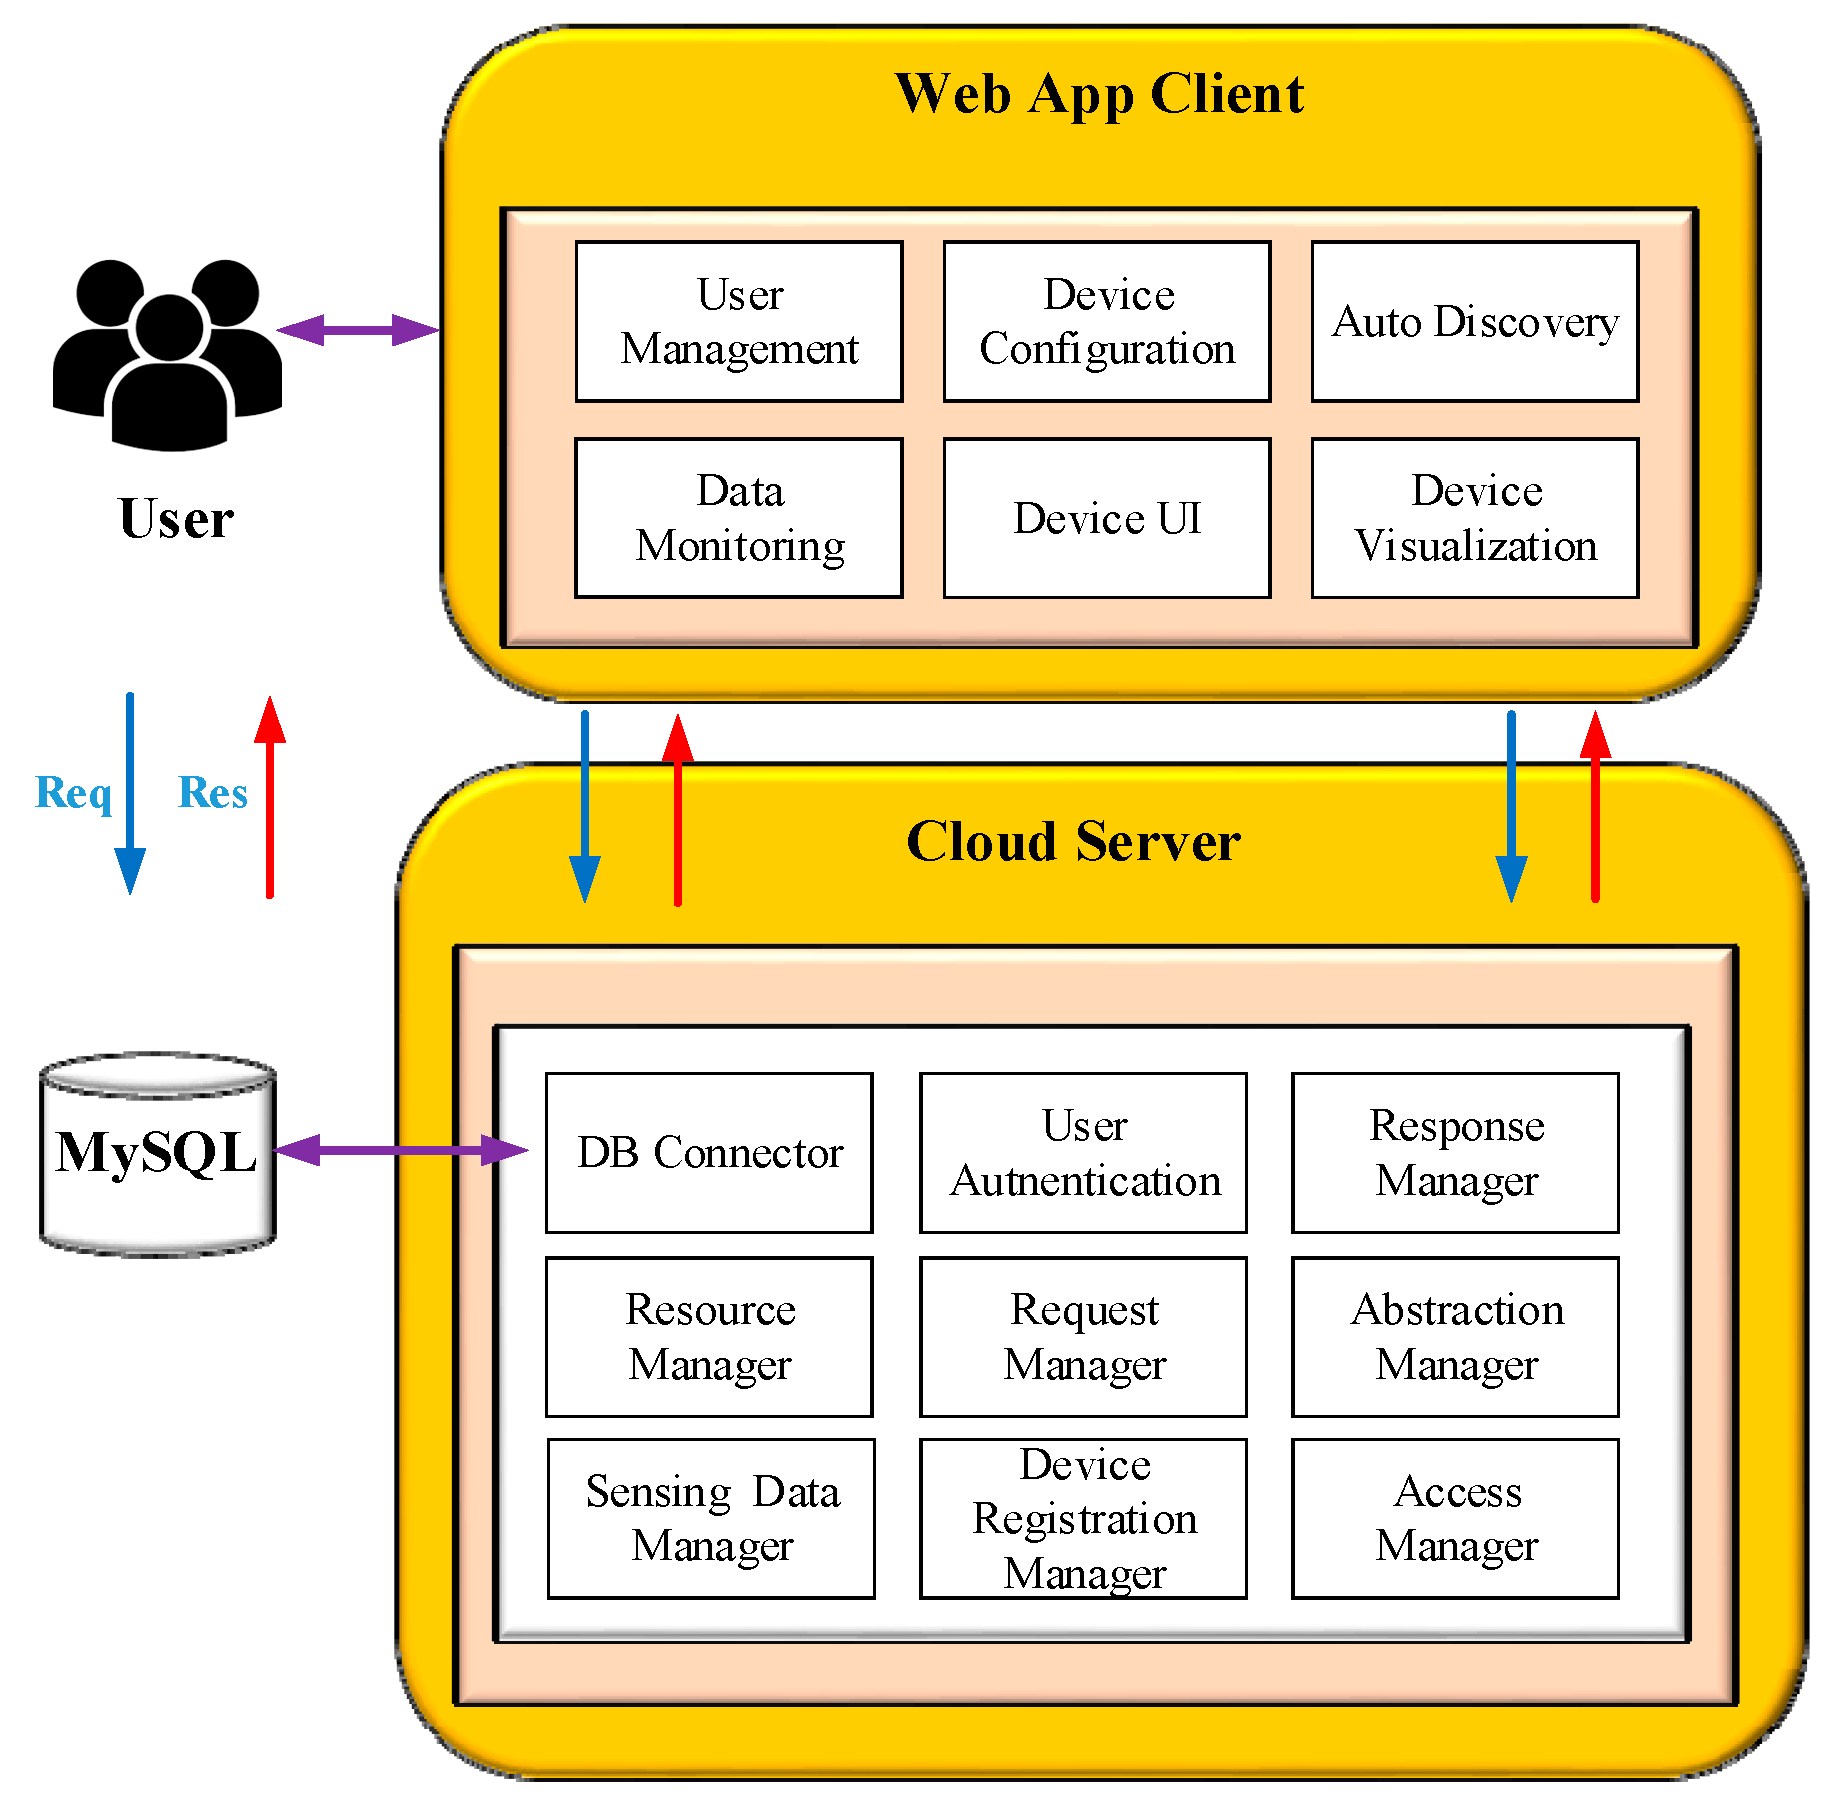
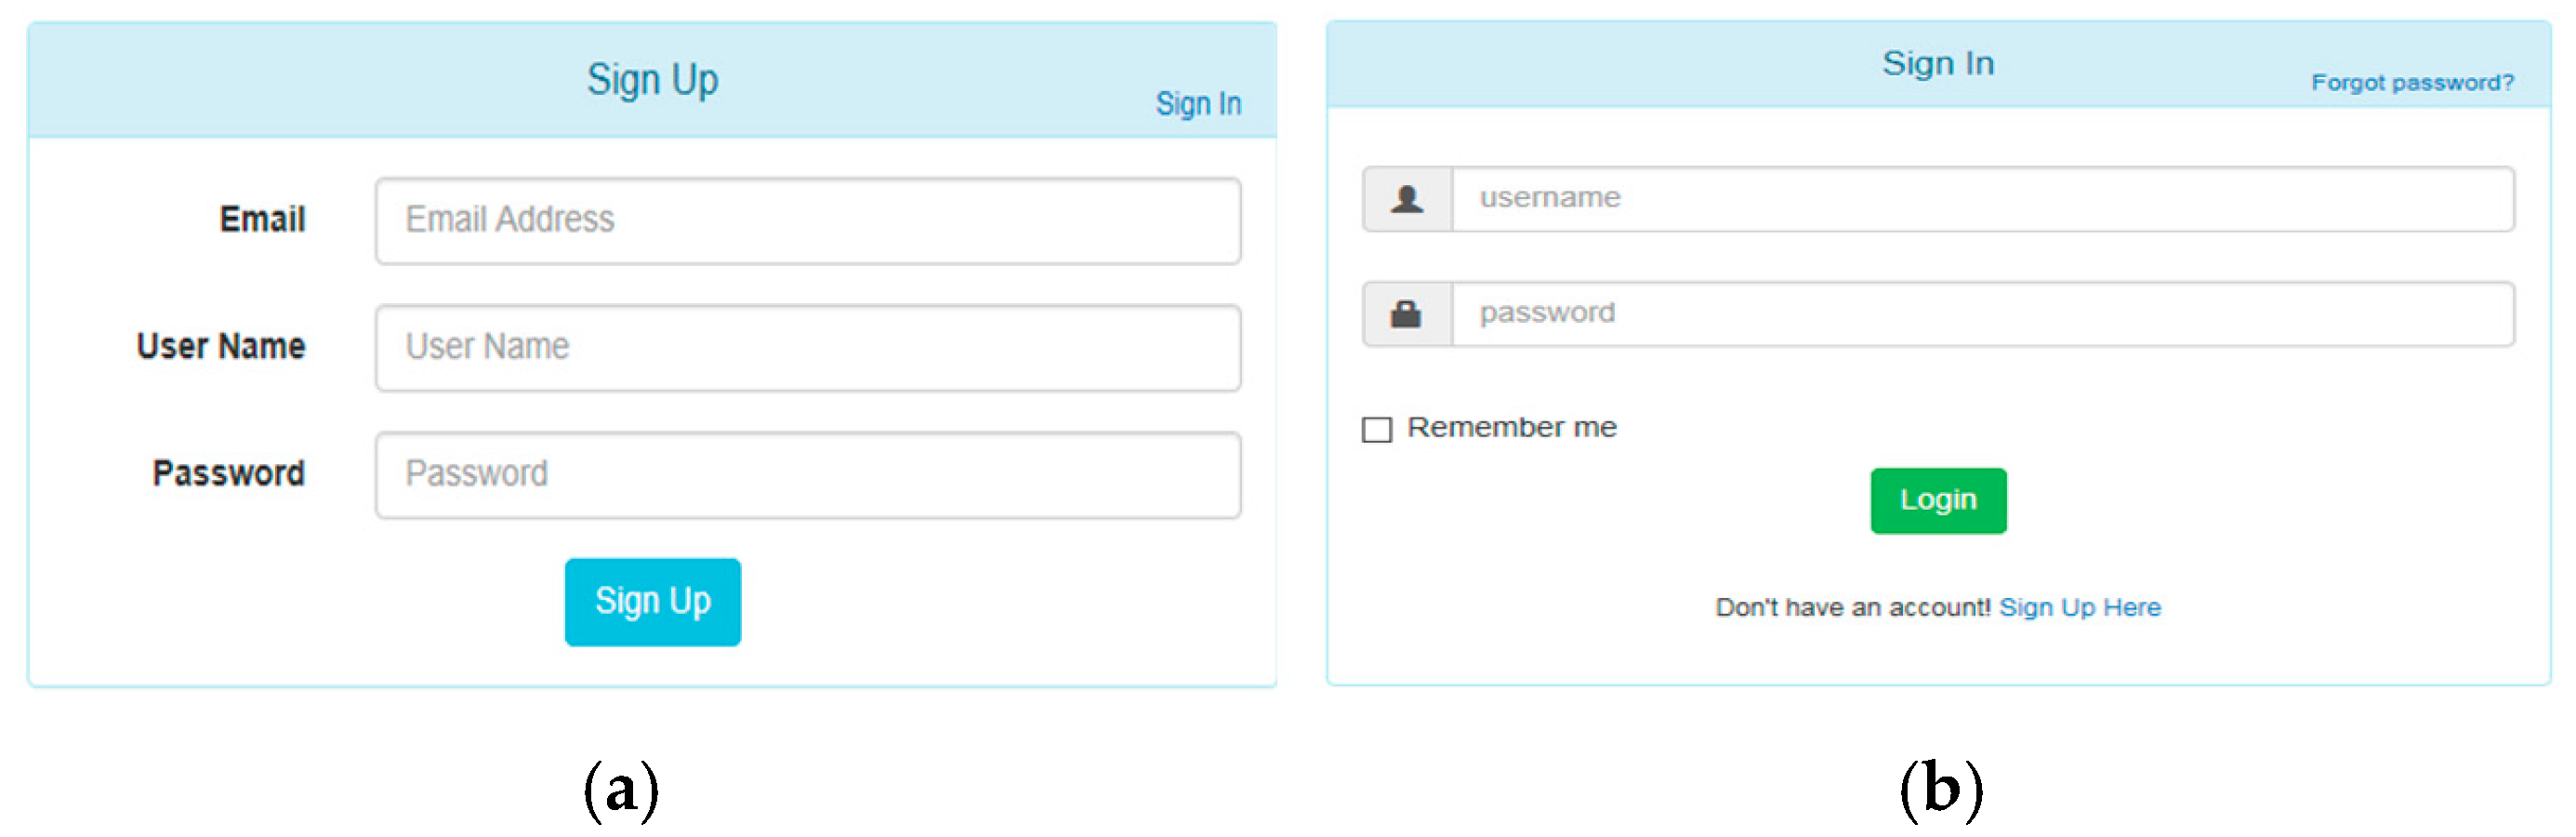
3.4. Designed Sensor-Cloud Application

Figure 6 represents the detailed functional configuration of the cloud-based web application for preserving the profiles of physical sensors. This application is deployed on the Amazon Elastic Compute Cloud (Amazon EC2) in the Amazon Web Services (AWS) cloud. The cloud plays a simple role in the proposed platform by providing a repository of profile information associated with the linked physical sensors through a more user-friendly way. Thus, exploiting a fully developed cloud platform such as AWS or Azure will be seen as overqualified [63]. The user authentication allows the system to verify the identity of all users accessing to the network resources. The resource manager hosts the resource descriptions of physical sensors and provides the functionalities to register, maintain, lookup and remove these descriptions. The DB connector provides interfaces to connect to the database and allows to run Create, Read, Update, and Delete (CRUD) procedures on the database. The resource information which contains web links to all resources is stored in the MySQL database. The abstraction manager prepares the abstract for presenting virtual resource information in a template, and this template will be released to the app client whenever the user builds the request. The access manager is responsible for network communication with physical sensors. This module is implemented in RESTful style, which is flexible enough to adapt to other communication protocols, and is not limited to a single protocol such as HTTP. The device registration manager processes the incoming device information while the sensing data manager handles the sensing data from the physical sensors. The request manager is capable of receiving and handling the request from the client. It decouples the attributes from the request in order to discover the appropriate action based on the URI requested. The response manager generates the response based on the request and converts the data in the form which the client can understand. The client provides various interfaces such as user login and registration, device configuration, and device visualization. Physical sensors can be visualized whenever a new device is connected to the system. In addition, the cloud provides a unique interface for every virtual sensor, through which the end user can monitor the state of the sensor, and consequently the physical sensor can be easily controlled through the visual interface even though the user is outside the local space.
Figure 6. Functional configuration of the cloud-based web application.

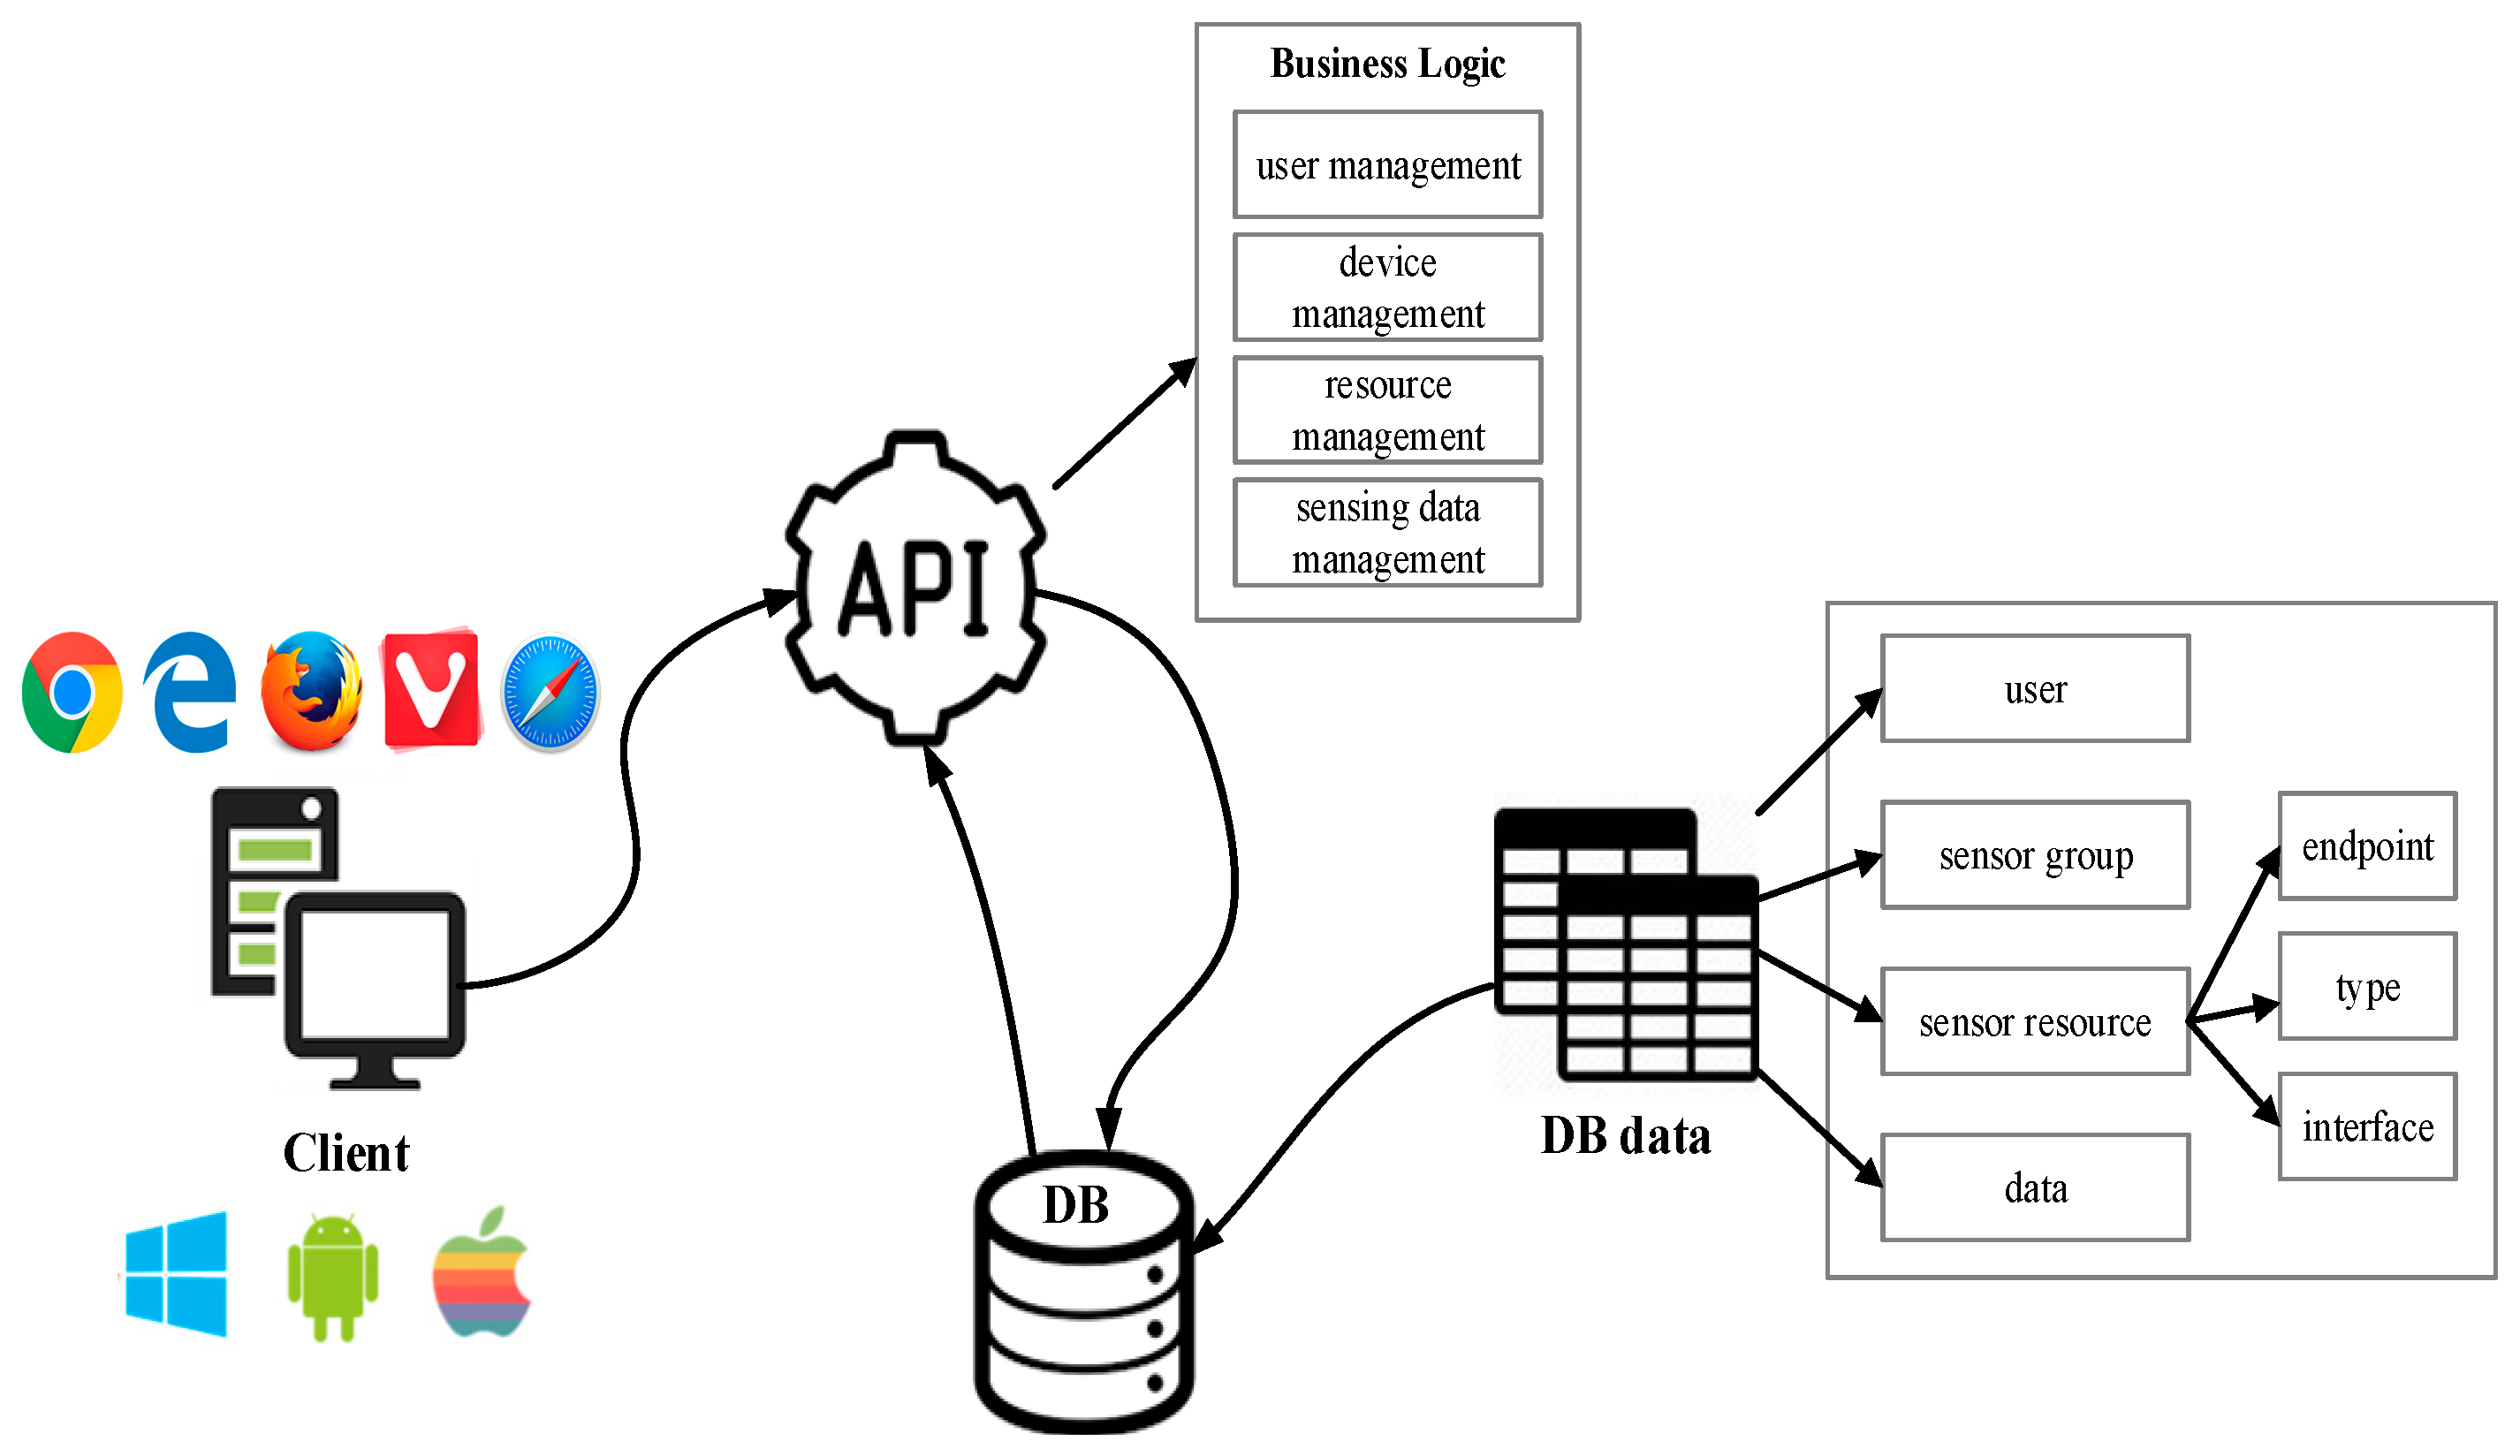
3.5. RESTful API-Based Architecture

The business logic of the cloud-based web application as shown in Figure 7 is basically built on heterogeneous web APIs, which are synonymous with online web services that client applications can use to retrieve and update data. A web API, as the name suggests, is an API over the web which can be accessed using HTTP. Processing tasks can be executed by requesting these APIs in the cloud. The business logic contains various web APIs such as user management, device management, resource management, and sensing data management. Each client application utilizes the same API to get, update, and manipulate data in the database. For example, users can perform read and write operations to a virtual sensor by calling the read and write APIs. In addition, user can retrieve the details of the virtual sensor or send requests for getting sensing data without requiring much knowledge about the specification of physical sensors, which significantly lowers the training requirements for the general public. As an open source architecture, the developer can extend his own module according to the requirements of applications and runtime environments.
Figure 7. Web Application Program Interface (API) of the cloud-based web application.

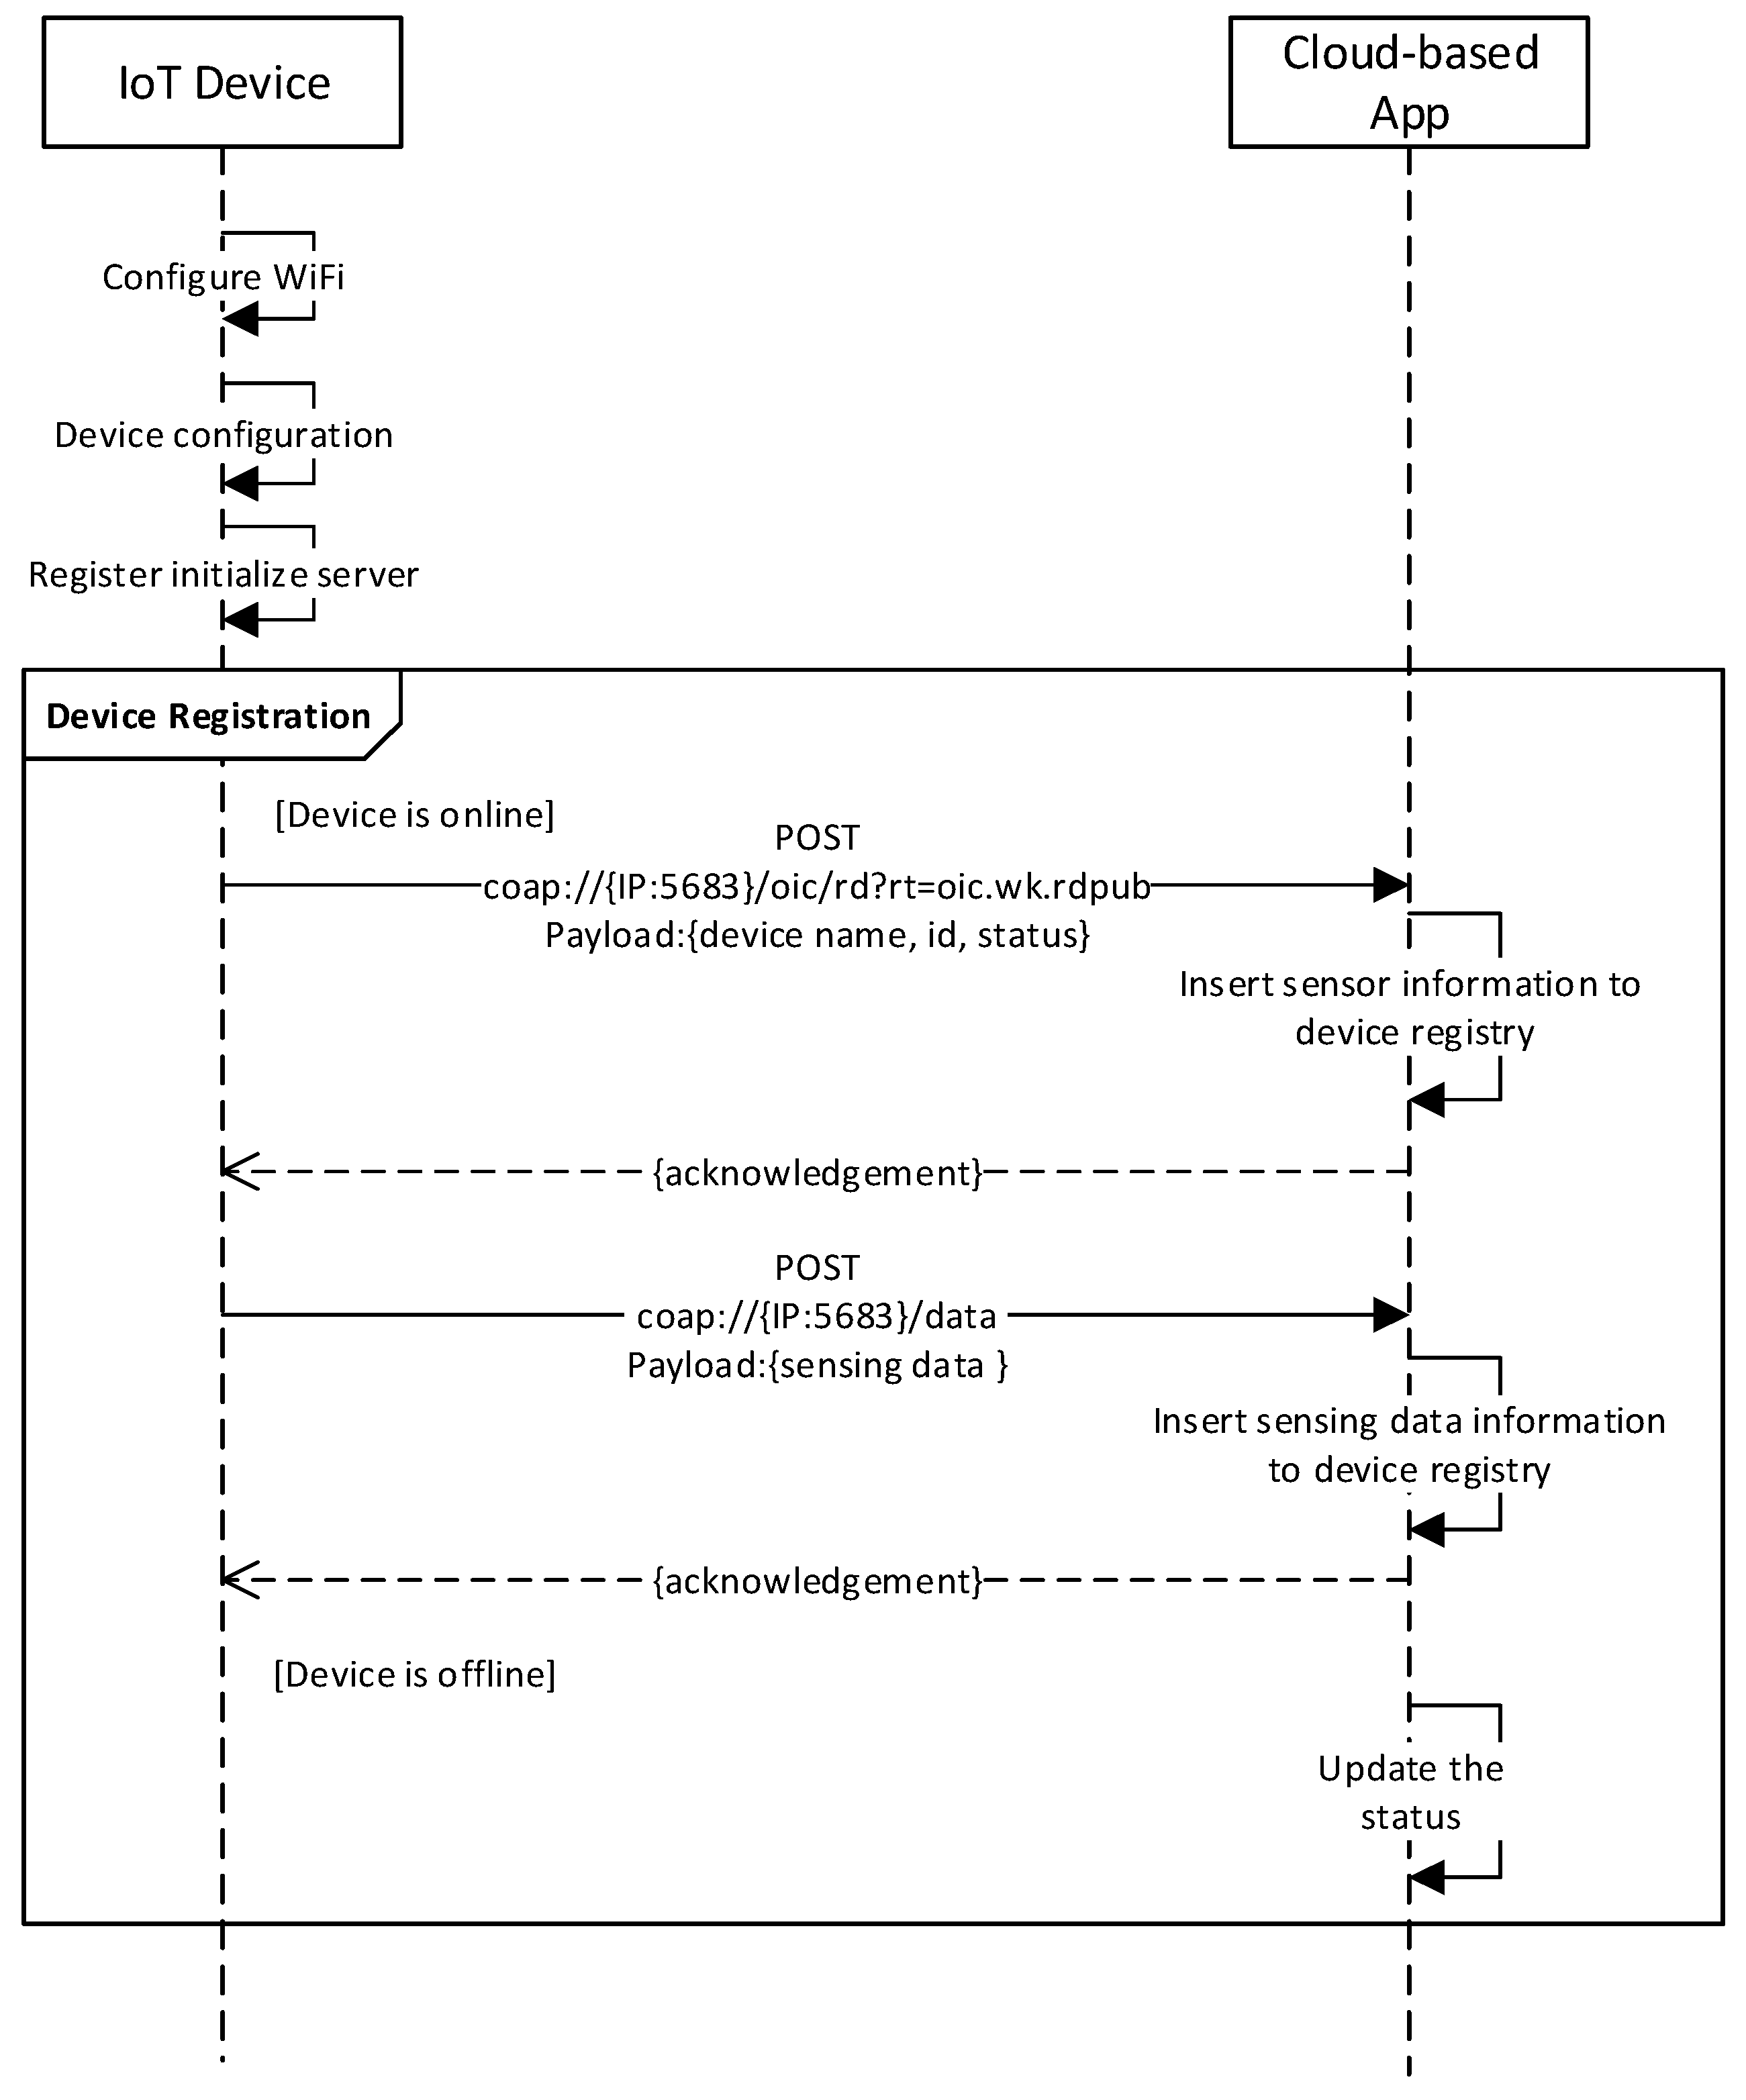
3.6. Sensor Detection Approach Using Virtual Sensors for Physical Sensor Management

A number of issues arise when directly detecting the physical sensors, not least when selecting suitable diagnostic systems and encountering difficulties of placing a sensor in the required position for a given task. These issues can be overcome by using virtual sensors which provide the knowledge obtained from the behaviors of physical sensors. Virtual sensors can collect and even replace data from physical sensors. The central premise of this approach is that the physical sensors need to be registered to the cloud before accessing through virtual sensors.
The execution sequence between the IoT device and a cloud-based application is described in Figure 8. The IoT device connects to WiFi so that the local router assigns an IP address to the server, and meanwhile configures the resources of the physical sensors as part of the server. The server inserts the device profile (name, ID, status) into the request payload and requests the cloud to upload the profile using the POST method. This information is stored in the device registry of the cloud application, and a response acknowledge message is generated by the cloud to inform that the device information was successfully registered. After registering to the cloud, the IoT device reads sensing data from physical sensors and uploads the data to the cloud. The cloud sends back a response acknowledge message to inform the device that the sensing data was uploaded. However, if the device goes wrong, such as losing the network connection, the device status value will turn into inactive, therefore, the device stops uploading the sensing data until it reconnects to the cloud. Hence, this process is implemented as a cycle process as the device status might change with time.
Figure 8. Sequence diagram of operations between Internet of Things (IoT) device and the cloud-based application.
Figure 9 proposes the virtual sensor-based detection mechanism with the architecture. Our concept is to monitor the status of virtual sensors and decide whether to continue showing updates and keep communications open between the client and the cloud-based application or to postpone them when the virtual sensors are not available. To implement this solution, we utilize one of the real-time techniques, so-called polling, to apply our concept, as it benefits from JavaScript features for providing advanced front-end user experience. Polling [64] is a time-driven technique that sends the client request to the cloud application at regular and frequent intervals (e.g., every second) to check whether an update is available to be sent back to the browser. The client initializes a request to the cloud-based application within the specified interval time that should be defined in terms of different scenarios. The application receives the request and retrieves the information from the device registry to check whether the device status is active or not. If the status is active, the application pushes the sensor information to the client, whereas it calls the postpone function when devices are inactive, to suspend sending requests to the cloud application provisionally.
Figure 9. Virtual sensor-based auto detection mechanism.

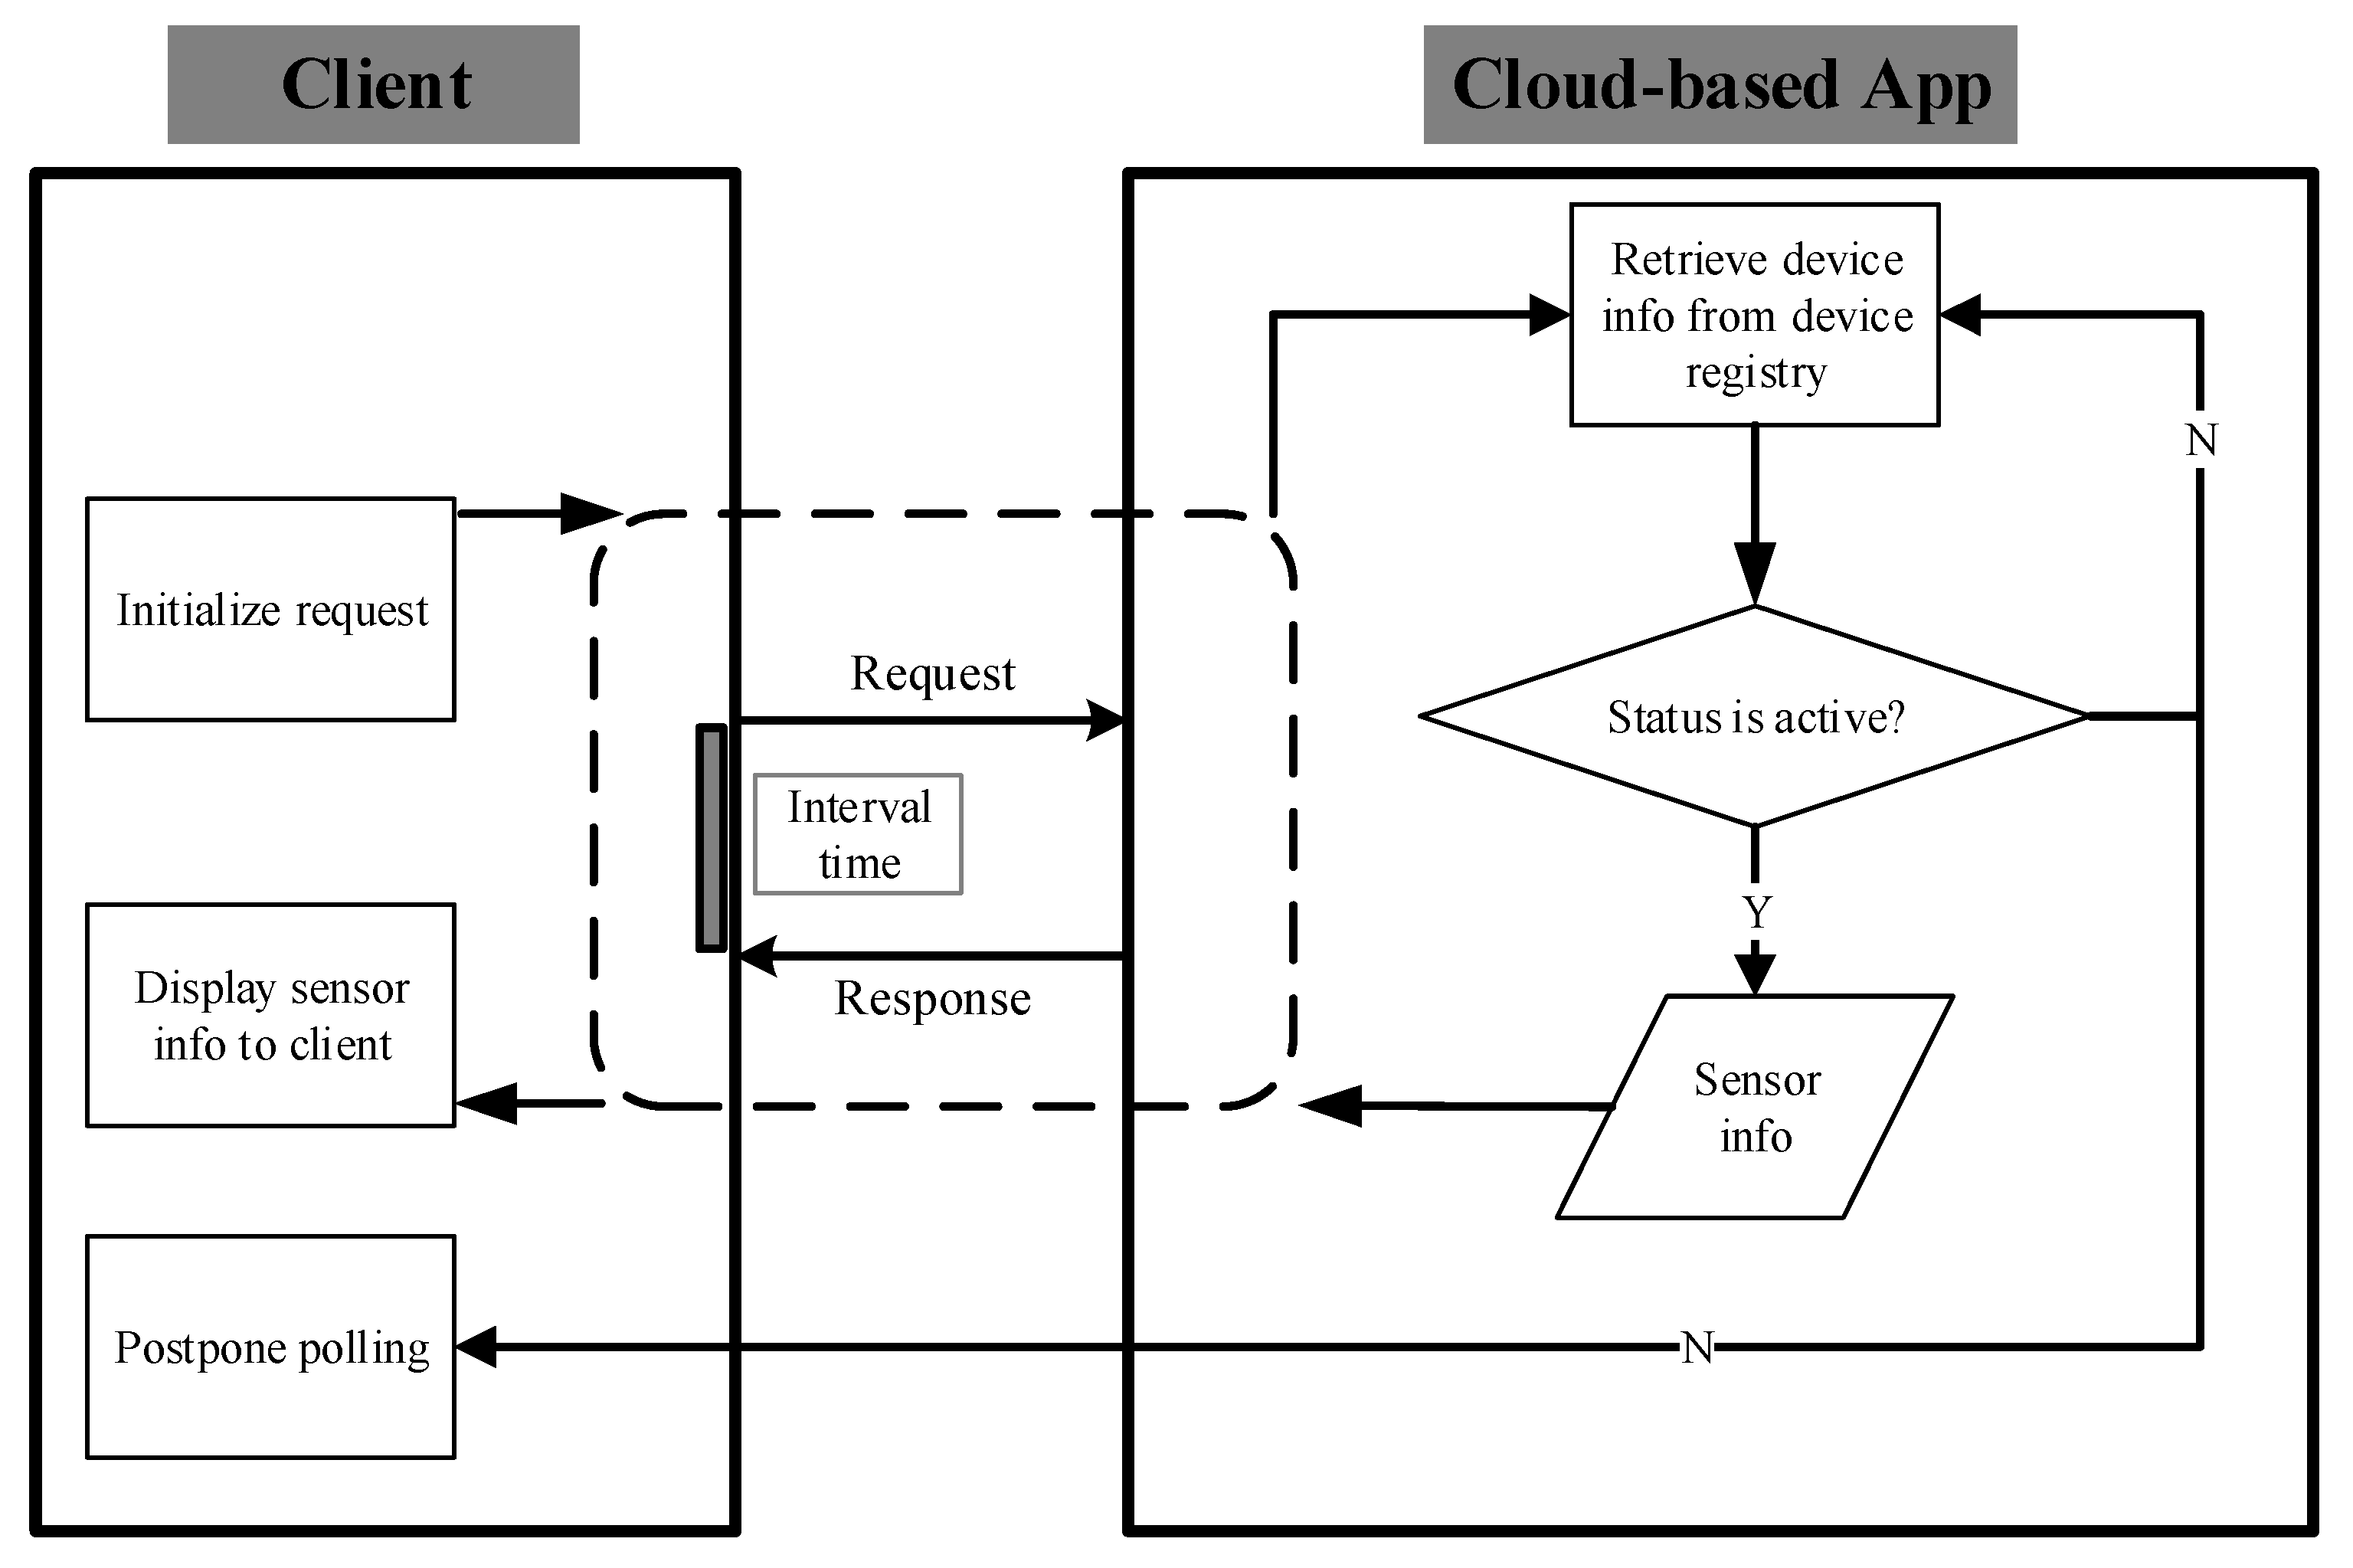
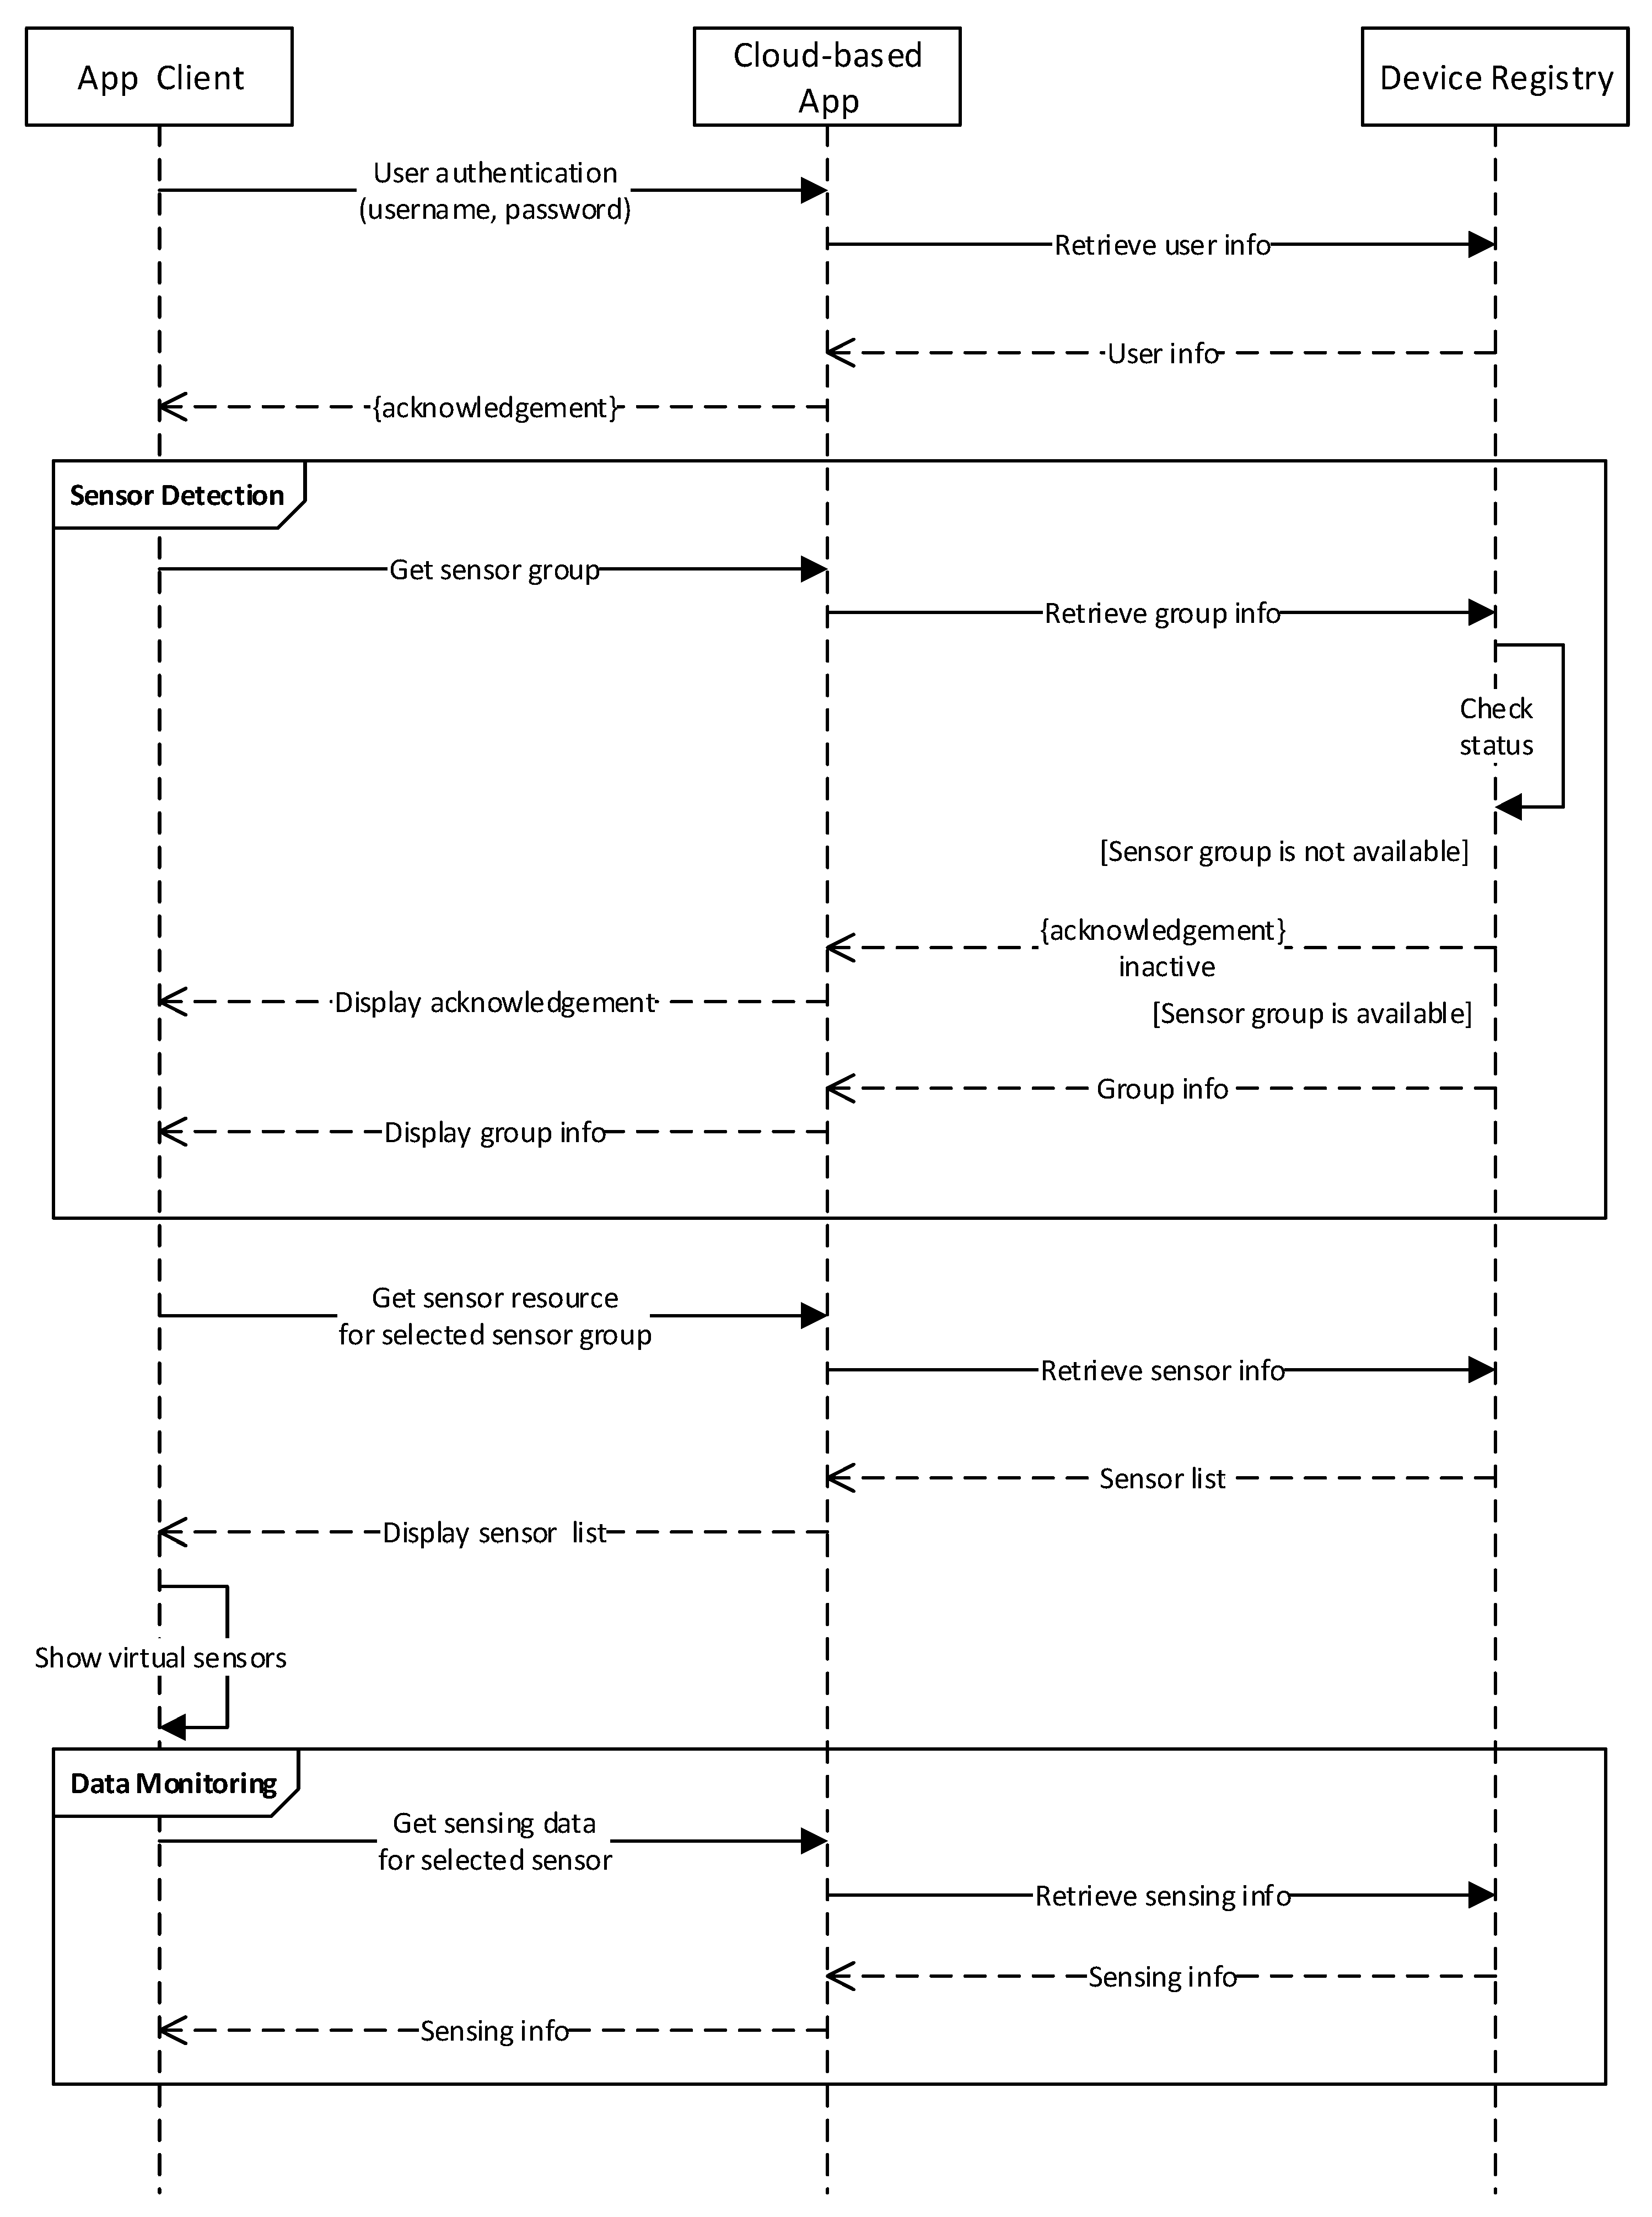
3.7. Interaction Model between Client and Cloud-Based Application

Figure 10 illustrates the various operation processes between the client and the cloud-based application. The user profile including username and password is submitted to the cloud for identity authentication. If authentication succeeds, the cloud returns the success message to the client and allows the user to access the system. The client can request the cloud for information from a sensor group, and the cloud decides whether the request can be responded to depending upon the status of the sensor group. If the sensor group status is active, the cloud provides the sensor group information to the client. The user can retrieve detailed information from the sensors from the group, and the cloud provides the sensor information which is visible to the client. Furthermore, the user can get the sensing values of a specific sensor by a single click, and then the cloud continuously feedbacks the behaviors and readings of the selected sensor.
Figure 10. Sequence diagram of various operations within the cloud-based application.

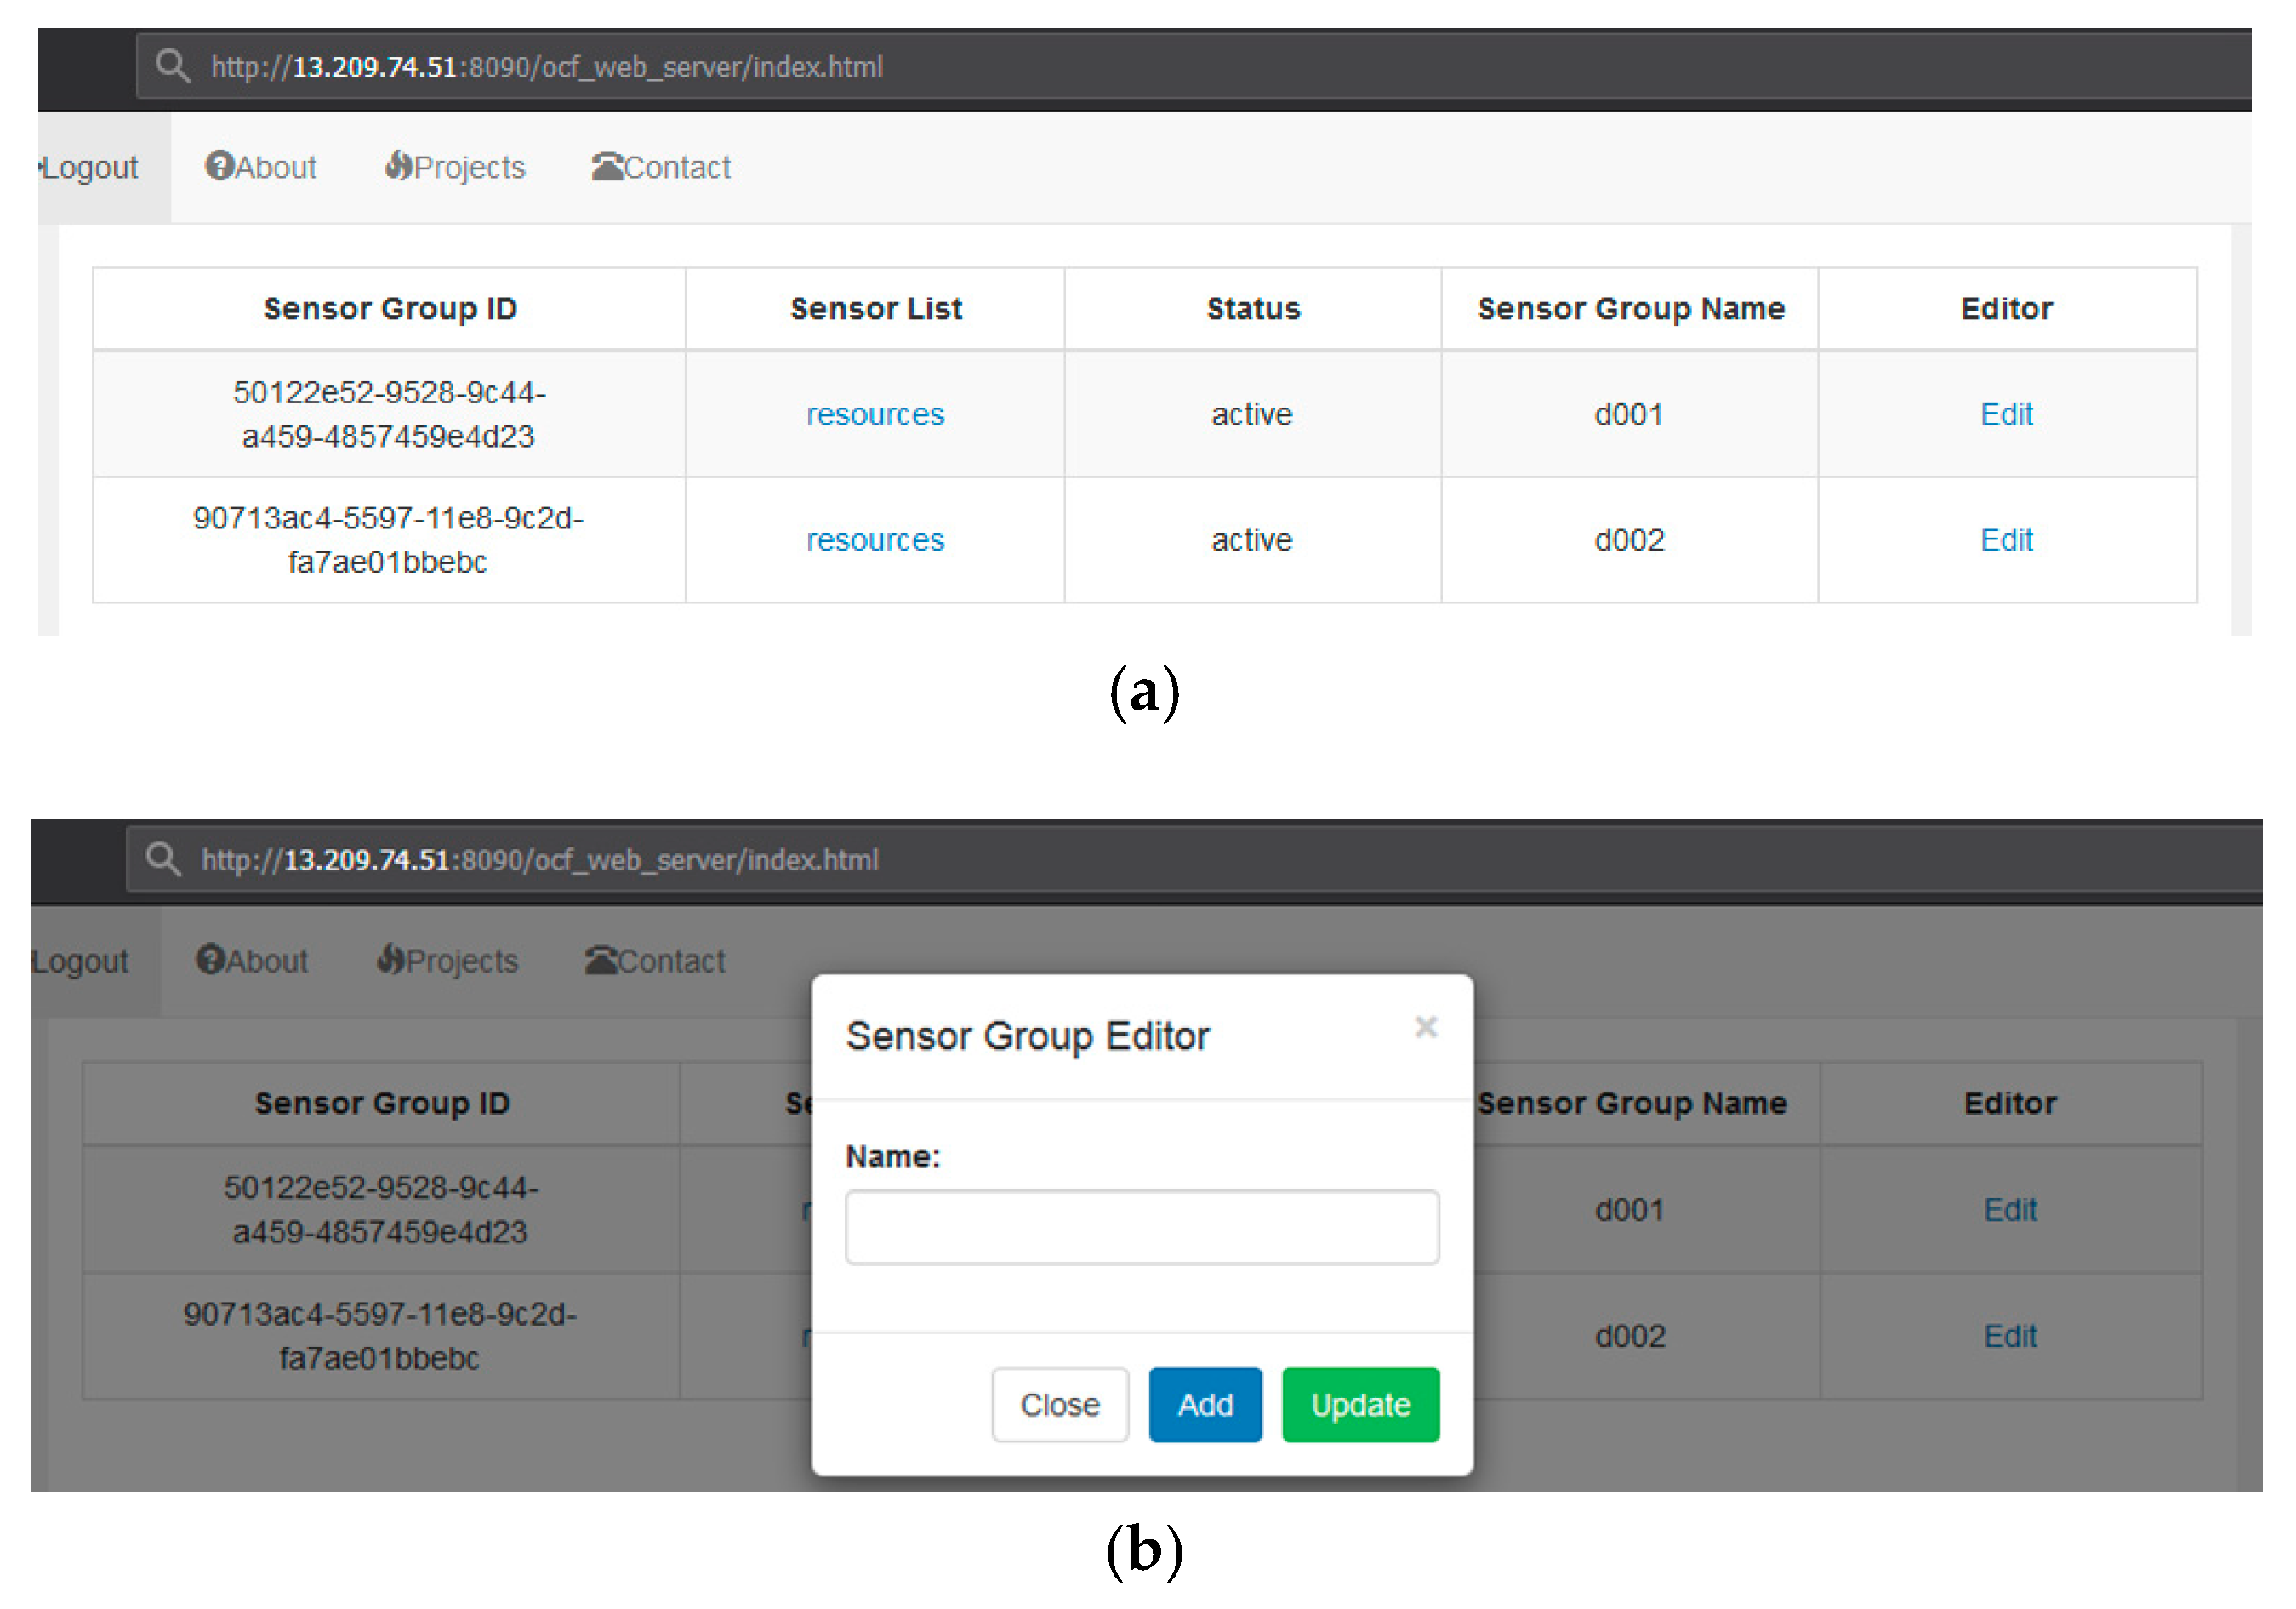
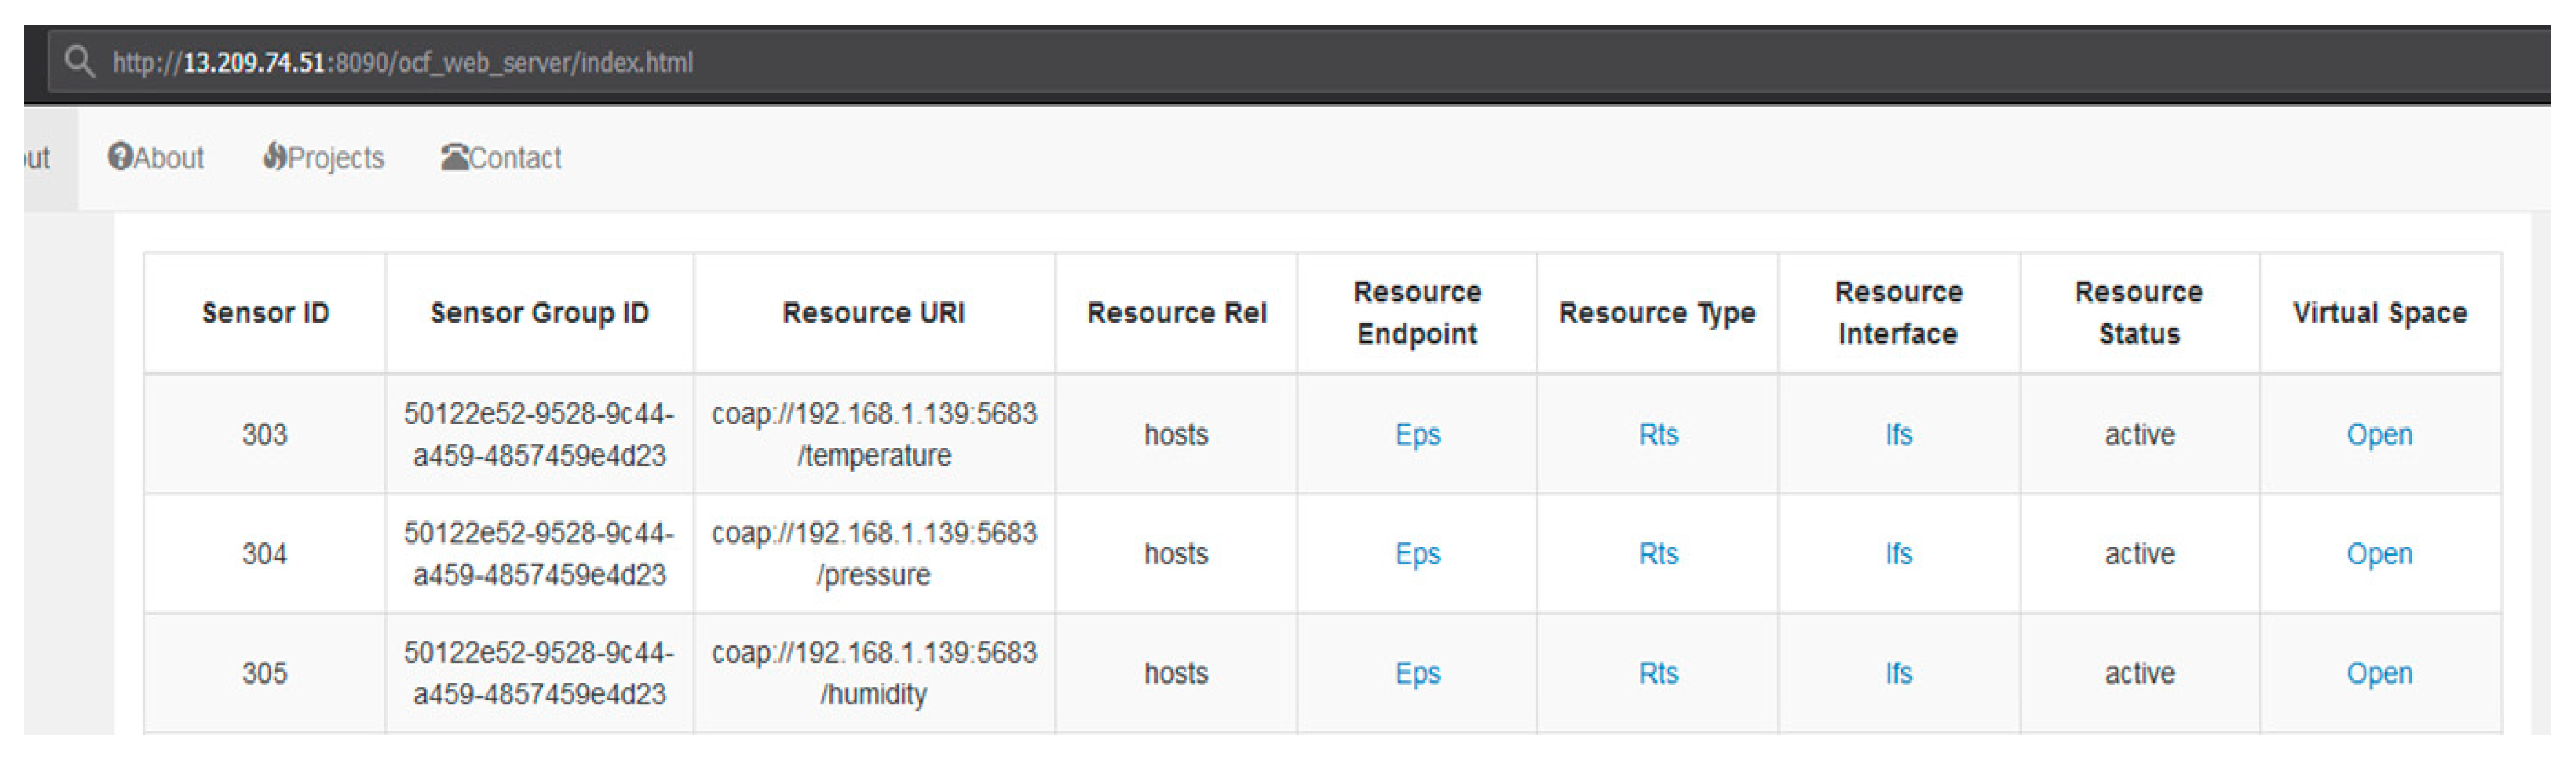
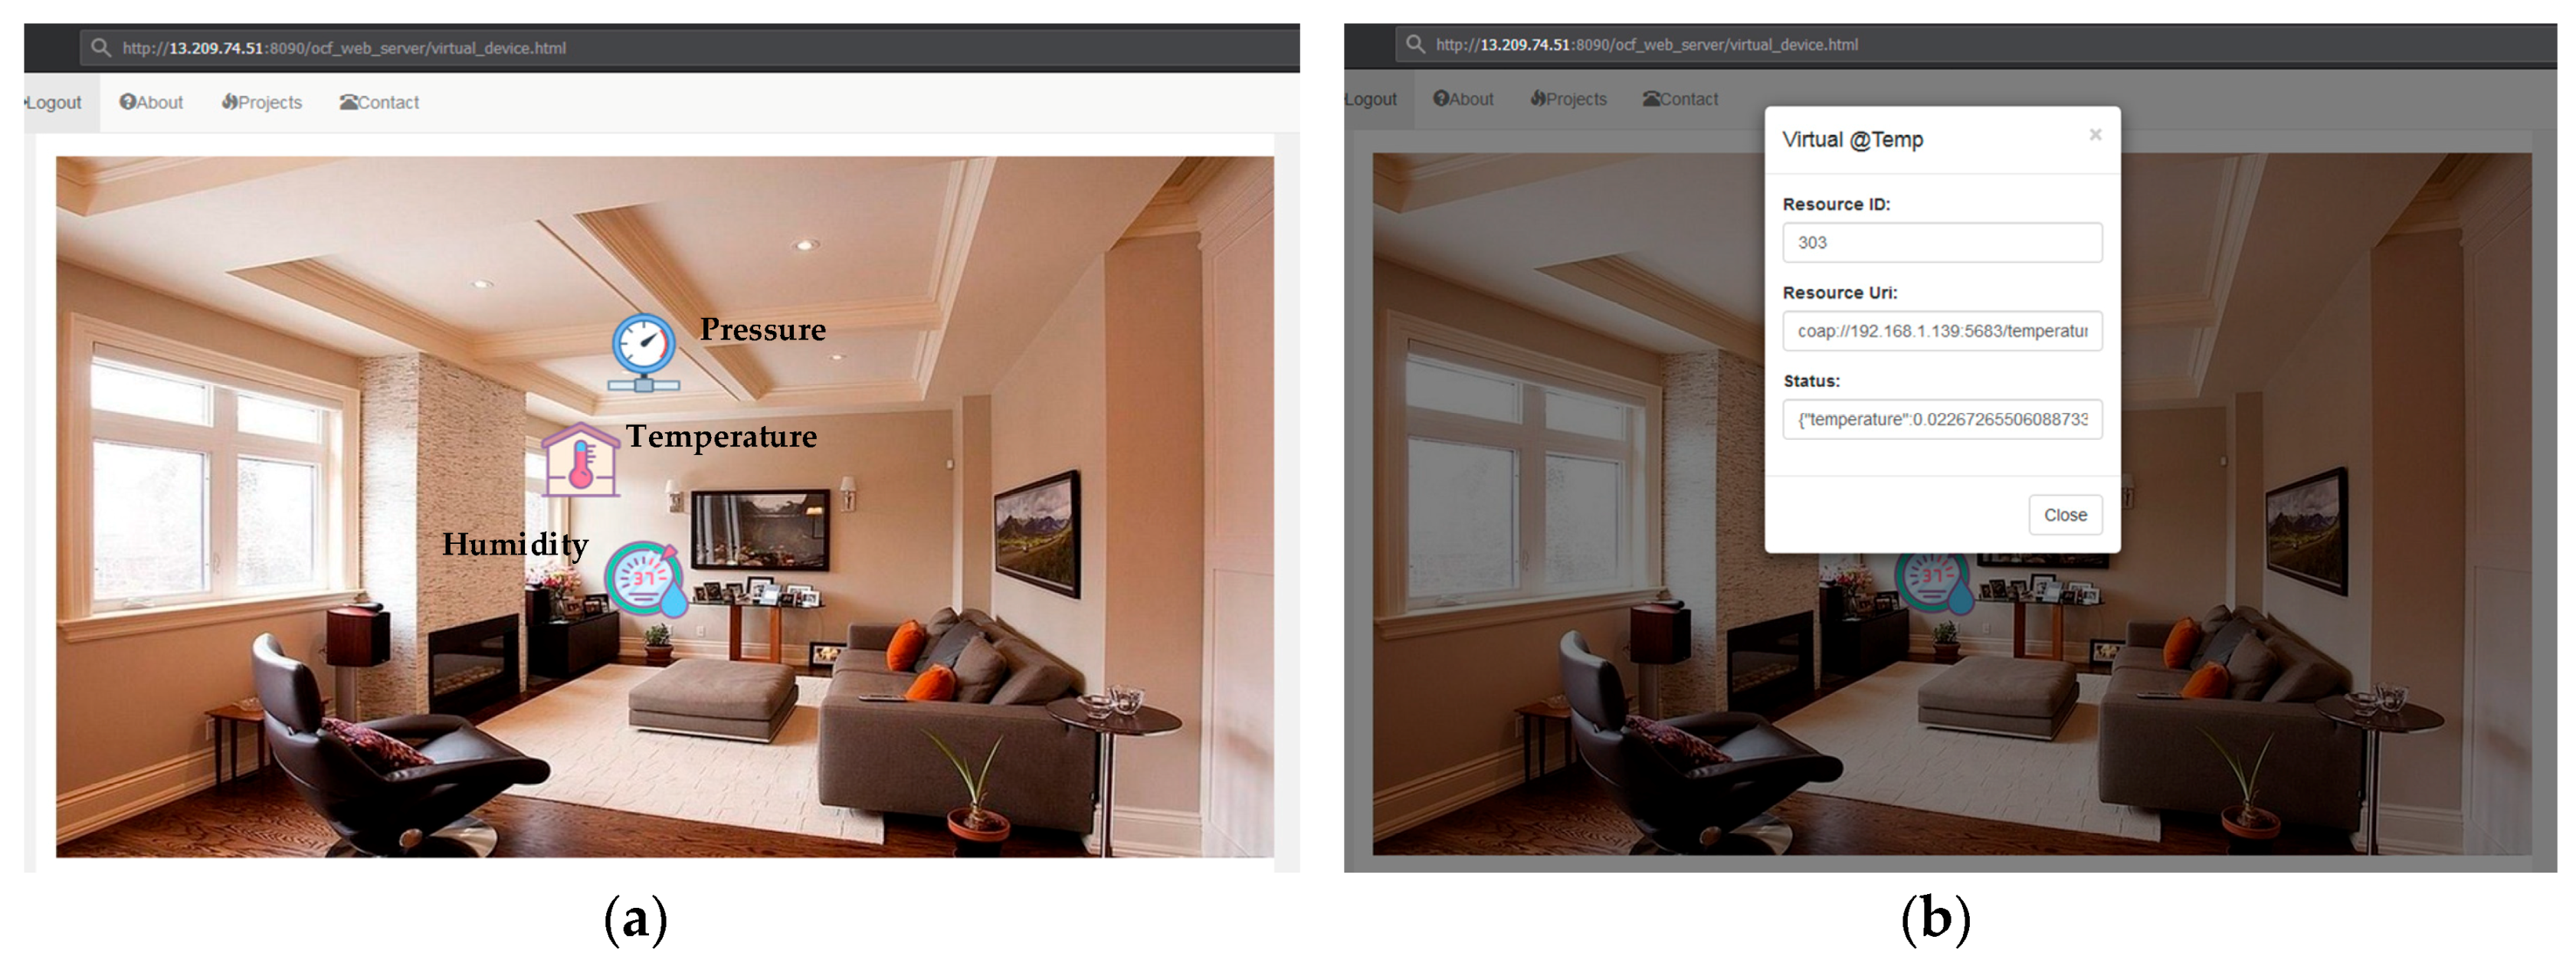
4. Prototype Implementation of Sensor-Cloud Platform in Smart Space

This section describes the topology of virtual sensors and introduces a review of the implementation Integrated Development Environments (IDEs), hardware, and technologies used to develop the smart space use case. Figure 11a presents the hierarchical topology of virtual sensors, where the parent node is the network itself, grouping any number of virtual sensor nodes. Given that the end user requires data from the parent node (7), which is a virtual sensor group, all intermediate nodes (4, 5, and 6) in the topology are virtual sensors, and all leaf nodes (1, 2, and 3) represent the physical sensors in the WSN. The data objects used to form virtual sensors consist of various data tables as illustrated in Figure 11b. Table t_parent summaries the information of a virtual sensor group, where the di is used as the identifier so that each group can be distinguished from each other. Furthermore, the isactive attribute represents the status value (active or inactive) of the group, the ttl attribute stands for the live time of the group, and the name attribute represents the group name which can also be used as the identifier. Table t_node, t_if, t_rt, and t_ep represent the properties referred to in a virtual sensor, while table t_data records the data and the timestamp of the sensing.
Figure 11. (a) Hierarchical virtual sensor topology; (b) data objects of virtual sensors.
The project consists of three main modules so that the development environments have been categorized into three tables to describe the development environment for each module separately.
Table 1 depicts the development tools and technologies utilized for implementing the IoT server hosted on the Raspberry Pi. The operating system on the Raspberry Pi is flashed into Android Things so that the applications can be developed using the Java programming language. To support the communication between the IoT server and the cloud, the IoTivity framework for Advanced RISC Machine (ARM) architecture is used. Physical sensors measuring temperature, humidity, and pressure have been implemented into resources as part of the IoTivity server. Each resource is assigned with a unique URI so that it can be identified by the server.
Table 1. Development environment of the IoT server.
Table 2 describes the development tools and technologies used for the cloud-based application. The application is deployed to the AWS EWC2 and is developed in the Java programming language. Apache Tomcat was used as the container to host the web content and applications. A MySQL database was used as the repository to hold resources from the IoT server. The cloud listens for the request on the appointed port and performs the operation on the corresponding resources.
Table 2. Development environment of cloud-based application.
Table 3 presents the technology stack for developing the web client. The client is implemented using various web techniques, including HTML, Cascading Style Sheets (CSS), and JavaScript. In order to present the information in a more user-friendly way, we utilized Bootstrap and JQuery, which are two open-source toolkits for quick web application prototyping. The client can interact with the cloud-based application to operate on the resources and perform their functionalities by HTTP methods like GET and POST.
Table 3. Development environment of web client application.
For the purpose of assessing the usability of the designed system, we have realized a smart space case study as part of the experimental work. Figure 12 illustrates the implementation environment for the case study, and also presents the means of interconnection between the IoT nodes, the cloud application, and the web client. The HTTP is used for the communication between the cloud and client application, while IoTivity is used between the cloud and physical resources. The Raspberry Pi serves on the IoT server, which is integrated with some physical sensors. The temperature, humidity, and pressure sensors were used for the smart space case study, which is apparent in the figure.
Figure 12. Implementation environment and use case deployment.
A set number of endpoints for communication used between the web client and cloud application are summarized in Table 4. The resource typically represents the data entity and the verb sent along with the request informs the API what to do with the resource, for instance, a request with GET is used to get data about an entity, while a POST request creates a new entity on the resource. There is an observance in place such that a GET request to an entity URI such as /getDevice returns a list of devices, probably matching some criteria that are sent with the request. Query string parameters are also allowed to be used in an API, for example, /getResource&id=? returns all the resources with the specific ID.
Table 4. HTTP requests in RESTful API.
The following section describes some snapshots of various interfaces depending upon the communications endpoints shown in Table 4, along with their respective responses displayed through the web interface. When developing the cloud-based application, developers should take potential security issues into account in order to ensure reliable resources and data transferring [65]. The main issues existing in the cloud can be categorized as follows: identity authenticity, availability, and data confidentiality. Identity authenticity is a core security requirement in a sensor-cloud architecture, which is to verify the identities of all the participants involved in the cloud. Data confidentiality ensures the data secrecy, as the data is only accessible to authorized end users. Availability makes sure that resources and data are available from anyplace and anytime. This paper focus on identity authentication to prevent non-authenticated users from accessing the system. Users’ credentials are stored centrally and the main advantage is that the user can just authenticate once to the server and start using the resources across the system. Figure 13a represents the user sign-up interface which requires the input of an email address, a username, and a password. The user sign-in interface shown in Figure 13b is used to submit the user information (username, password) to the cloud for identity authentication.
Figure 13. Snapshot of end user management in web. (a) User Sign Up; (b) User Sign In.
The client initializes a request to the cloud application for obtaining the information of available sensor groups after the end user is authenticated by the system. In this system, the status of the virtual sensor group is synchronous with the related physical counterpart, through which the status of the physical sensors can be remotely informed to the end user without requiring any on-site inspections. The cloud application checks the status of the virtual sensor group from the device registry at each minute, and returns the information of the sensor group if the status value is active. Figure 14a represents the snapshot of the sensor group dashboard which includes the sensor group ID, sensor list, status, and name. The dashboard provides an entry to access all the sensors belonging to the selected group and an editor which enables users to update, create, and delete the sensor group. For instance, the user can modify the properties of the sensor group as shown in Figure 14b, and after confirming the operation, the request is sent to the cloud and the dashboard will be updated accordingly.
Figure 14. Snapshot of sensor group dashboard. (a) Sensor Group Dashboard; (b) Sensor Group Setting.
The detailed sensor dashboard shown in Figure 15 depicts the descriptions of each virtual sensor from the selected sensor group along with properties such as sensor ID, resource URI, endpoint, type, interface, and status. Each line in the dashboard represents a resource that encapsulates the complete information regarding a virtual sensor.
Figure 15. Snapshot of detailed sensor dashboard.
Figure 16a represents the overview of the smart space in web, where a graphical representation is presented for each virtual sensor located in different zones of the home. Once the virtual sensor obtains a request from the end user, the virtual sensor forwards the request to the cloud-based application. A data object mentioned in the implementation details section is created at the back-end, and then the cloud application retrieves the request URI of the virtual sensor from the data object so that the application can communicate with the corresponding physical sensor in the network. The physical sensor provides the sensing data, which is then parsed to the virtual sensor accordingly. The process of reading sensing data from the temperature sensor is illustrated in Figure 16b, where the temperature sensor is clicked to display a pop-up displaying the current readings of the indoor temperature.
Figure 16. Snapshot of the web smart space. (a) Virtual Sensor Group; (b) Data Monitoring.
This work presents a real-life case study for smart space, which is implemented as part of the experiment to evaluate the scalability of the proposed system. We believe this system has the potential to be extended to larger-scaled scenarios like smart hospitals or smart cities, which can easily benefit from the significance of the work. For example, the proposed system can be expanded in the smart farm to facilitate the management of all kinds of wireless sensors and to monitor remote devices on the farm. Our designed system can frequently measure the framing sensors and store the sensing data in the cloud where the data can be additionally visible in the front-end interface which is accessible from anywhere, anytime. Furthermore, the designed sensor detection approach uses virtual sensors, which is useful, especially when farmers have to leave the farm for a long time.

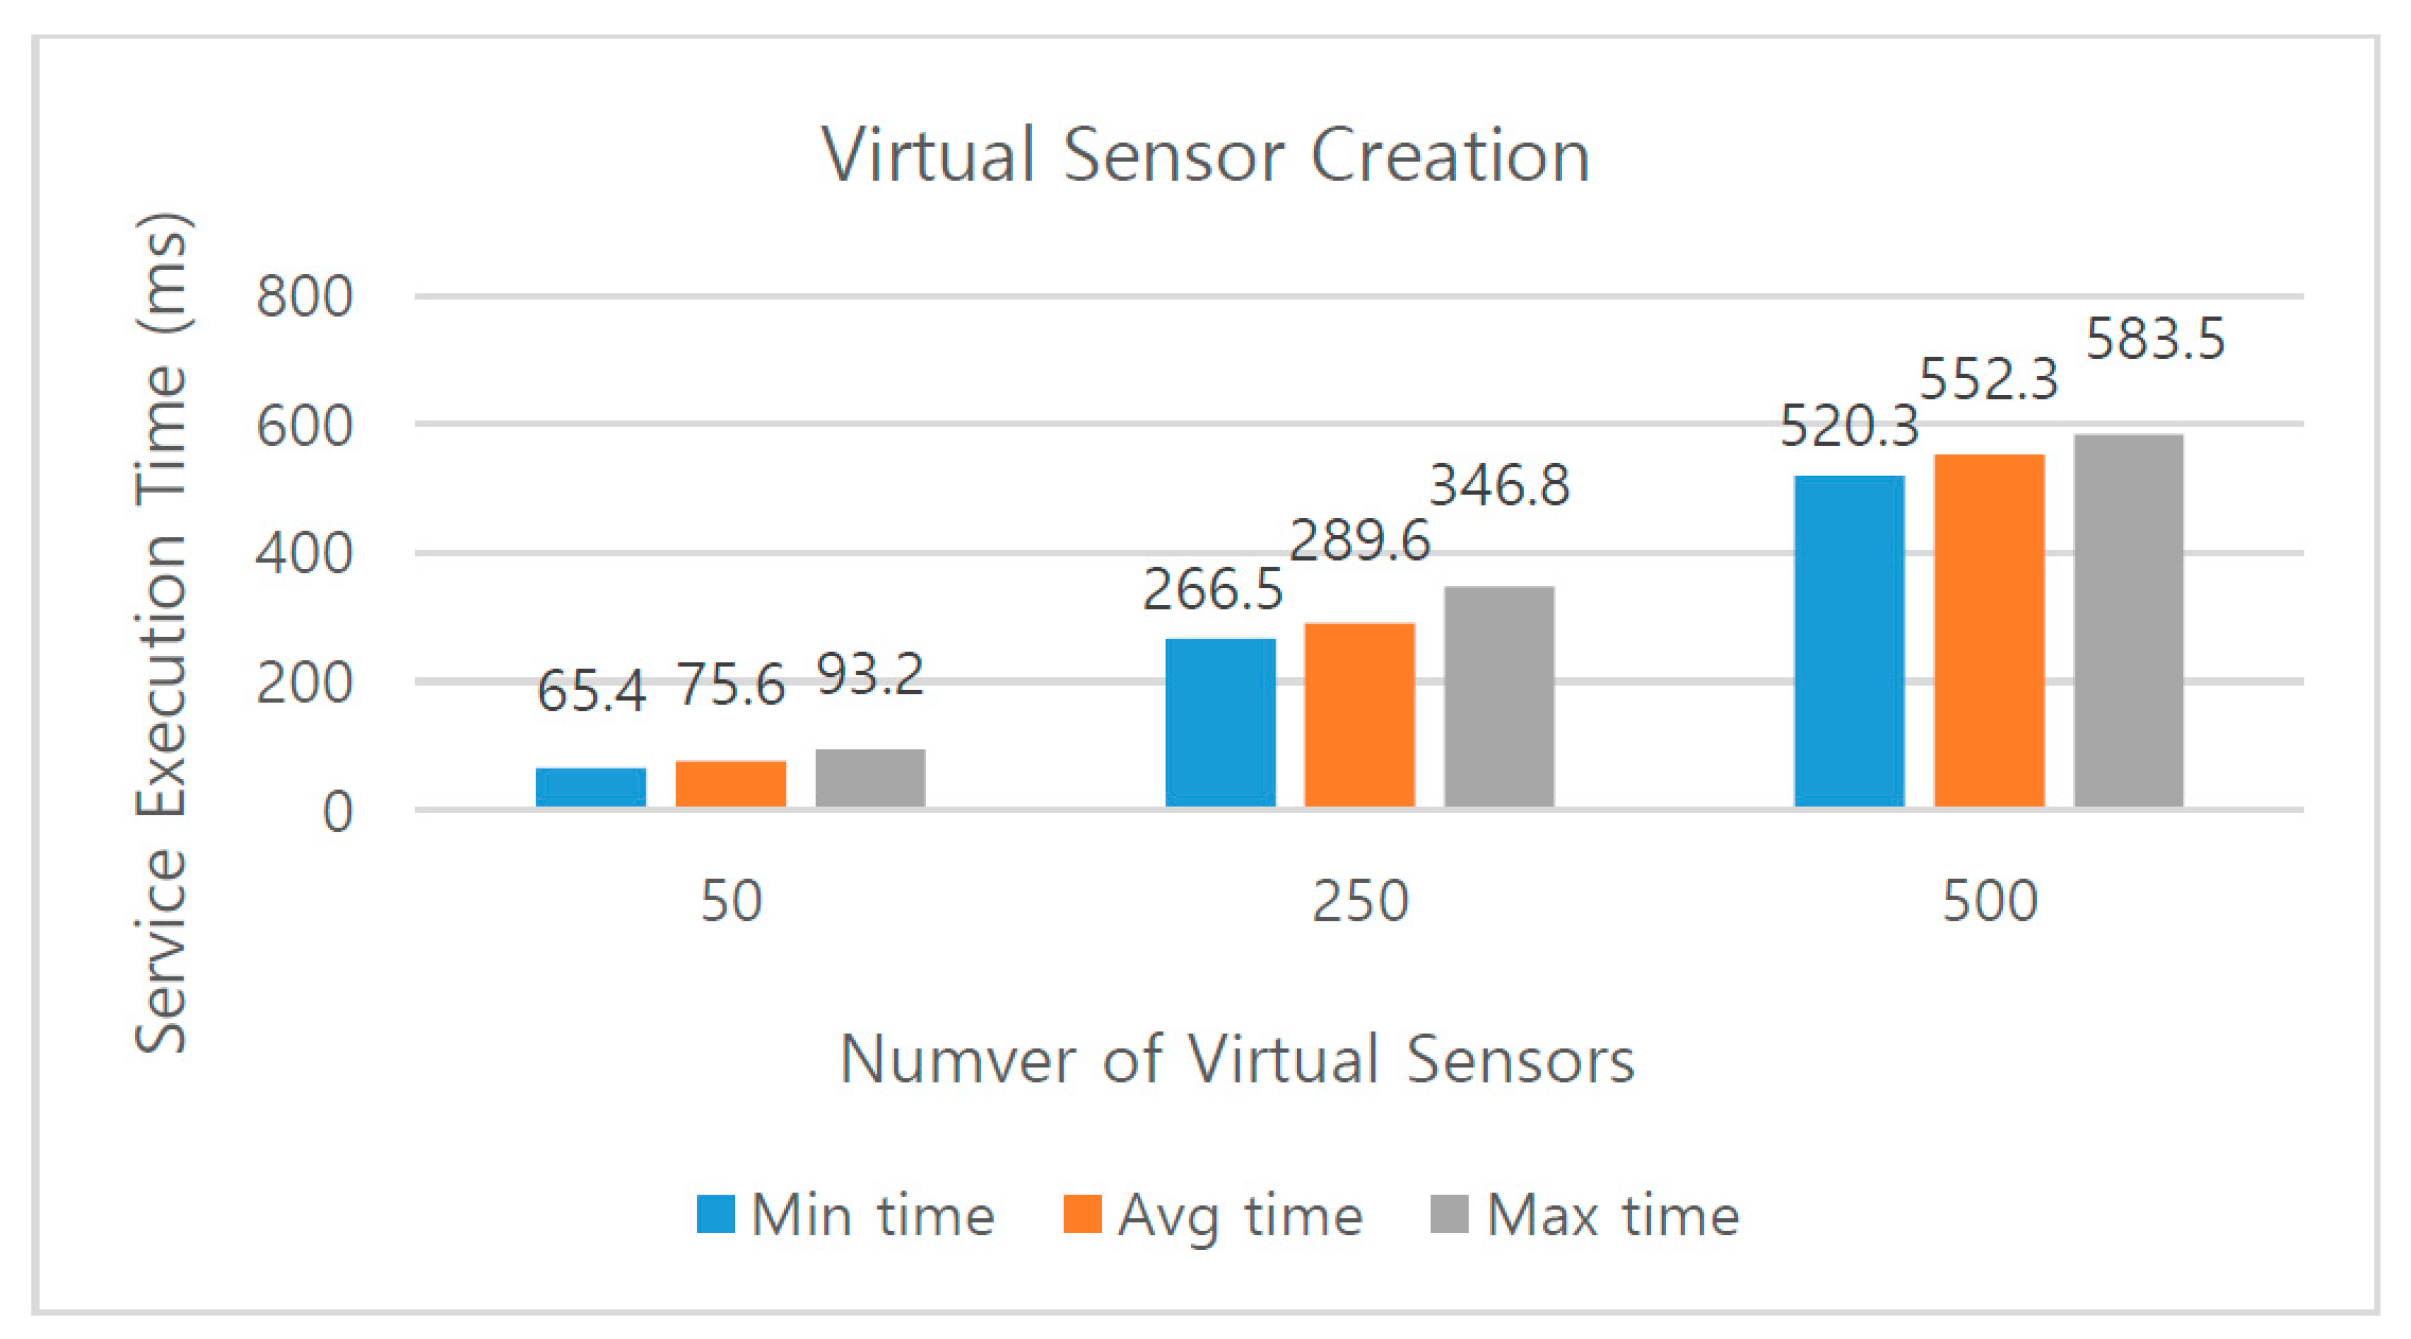
5. Performance Evaluation of Sensor-Cloud Platform

This section illustrates the evaluation results to comprehensively assess the performance of the proposed sensor-cloud platform. We evaluated the service execution time for a different number of virtual sensors under three cases. The first case corresponding to the costing time to create virtual sensors on the cloud-based web application, the second one to the time spent on detecting virtual sensors, and the last one to the time required to initialize the request to the virtual sensors. The first case was analyzed for performance and the results are displayed in Figure 17. For this analysis, three sets of 50, 250, and 500 virtual sensor information was provided to the proposed platform, and each set of virtual sensor information was allowed to be ingested by the platform ten times at randomly selected system resource utilization levels.
Figure 17. Performance analysis graph of virtual sensor creation.
The graph in Figure 17 presents the minimum, average, and maximum time in ms taken by the proposed platform to parse and instantiate the corresponding visual representations of the physical sensors. For the 50 virtual sensor information set, the minimum time taken in the ten iterations was recorded to be 65.4 ms, averaging at 75.6 ms, and the maximum delay was recorded to be 93.2 ms. For the 250 virtual sensor information set, the minimum time taken in the ten iterations was recorded to be 266.5 ms, averaging at 289.6 ms, and the maximum delay was recorded to be 346.8 ms. For the 500 virtual sensor information set, the minimum time taken in the ten iterations was recorded to be 520.3 ms, averaging at 552.3 ms, and the maximum delay was recorded to be 583.5 ms.
Similarly, the evaluation results for the second and third case are reported in Figure 18 and Figure 19, respectively. It can be seen from these above figures that the service execution time increased in accordance with the number growth of virtual sensors. However, the time increase was at such a low level that it can even be disregarded, in other words, it will not intuitively influence the user experience.
Figure 18. Performance analysis graph of virtual sensor detection.
Figure 19. Performance analysis graph of virtual sensor request.
Figure 20 measures the end-to-end access latency performance with variations of increasing numbers of virtual sensors. The end-to-end access latency means the time needed for a request to be transferred from the virtual sensor to the target physical sensor in the network. It is obvious to see from the graph that the access latency raises as the number of virtual sensors grows. The minimum, average, and maximum delay time in ms taken by the proposed platform to access the physical sensors were recorded twenty times at randomly selected system resource utilization levels. For the worst-case performance with 500 virtual sensor information set, the minimum delay taken in the twenty iterations was recorded to be 124.3 ms, averaging at 246.4 ms, and the maximum delay was recorded to be 337.2 ms. The measured end-to-end latency of the dataflow was controlled in an acceptable range and maintained under the 400 ms, which denotes that the proposed system has the ability to assure high efficiency of the end-to-end access latency.
Figure 20. Performance analysis graph of end-to-end latency with different numbers of virtual sensors.

6. Comparison and Significance

This section presents a comparative analysis of the proposed platform with some of the related projects in the related work section. A benchmark study has been executed for the purpose of demonstrating the effectiveness and feasibility of the system, and the evaluation results are depicted in Table 5. The following properties that play a pivotal role to compare the overviewed platforms are considered for this study. It is obvious to see from the table that Bluemix is a somewhat similar approach with the highest variety of IoT-related services. Message Queuing Telemetry Transport (MQTT) is utilized as the basic protocol to the Bluemix, but many other platforms just support REST-based interface. However, the Bluemix is closed source, which is not flexible for the general public, and has a limited hosting environment so that end users cannot decide the place of deployment. These two limitations are common issues existing in most of the overviewed systems. Another main problem is that some of the systems have no support for visualizing the data coming from the IoT environment, which is one of the most important features in the cloud as described in the preceding sections. Moreover, the platforms, like Parse, Heroku, Kinkey, CloudFoundry, IoTCloud, ThingSpeak, Mils-Cloud, and Cloud4sens lack the capability to detect device faults, which results in sensor network partitioning so as to reduce the WSN availability. The demand for an open source application that offers sensor detection, different protocols, and visualization is growing rapidly, and this paper aims to find out the potential to solve all these issues mentioned above.
Table 5. Comparative analysis of the proposed platform with the related platforms.

7. Conclusions and Future Direction

This paper outlines the procedures for the design and implementation of a sensor-cloud platform for providing virtualization environments to efficiently manage heterogeneous wireless sensors. The resources of the physical sensors are ingested by the cloud-based web application which provides a graphical interface for better user experience and remote availability. Raspberry Pi is used for implementing the IoT server, and an IoTivity framework was utilized for communication between the IoT sever and cloud. The cloud synchronizes the resource descriptions of the physical sensors and represents them in the form of virtual sensors. End users can either manipulate or read sensing data from the physical sensors by means of virtual sensors. The novelty of the proposed work is the sensor detection approach, which can voluntarily detect faulty sensor nodes through virtual sensors. A smart space has been implemented as the proof of concept, and a series of experiments were performed, which indicated a very steady level, allowing effective and powerful access and control of the virtual sensors. This designed system is scalable enough to be deployed across various applications domains including smart cities and other industrial fields according to the use case study. The significance of this work has been highlighted by a comparison analysis of the designed system with some existing works, and it has been shown that the proposed system performs better than the existing works. The future direction of this work is to enable users to design and deploy the application logic via virtual sensors. The virtual sensors shall be available in a widget that can be easily dragged and dropped to compose IoT services. Nowadays, the growing trend of the IoT have moved in a global ecosystem of connected devices providing services to the general public, and we believe this work has great potential for inexperienced users to prototype IoT applications according to their own requirements.

Author Contributions

L.H. conceived the idea for this paper, designed the experiments and wrote the paper; W.J. implemented the physical sensor network part of the use case; H.Y. and Y.G.H. supported the development of OCF IoTivity; D.H.K. conceived the overall idea of Sensor-Cloud platform for physical sensor management, and proof-read the manuscript, and was correspondence related to this paper.

Acknowledgments

This work was supported by the National Research Council of Science & Technology (NST) grant by the Korea government (MSIT) (No. CRC-15-05-ETRI), and this research was supported by Basic Science Research Program through the National Research Foundation of Korea (NRF) funded by the Ministry of Education, Science and Technology (2015R1D1A1A01060493).

Conflicts of Interest

The authors declare no conflict of interest.

References

  1. Gubbi, J.; Buyya, R.; Marusic, S.; Palaniswami, M. Internet of things (IoT): A vision, architectural elements, and future directions. Future Gener. Comput. Syst. 2013, 29, 1645–1660. [Google Scholar] [CrossRef]
  2. Eddy, N. Gartner: 21 Billion IoT Devices to Invade by 2020—InformationWeek. Available online: http://www.informationweek.com/mobile/mobile-devices/gartner-21-billion-iot-devices-to-invade-by-2020/d/d-id/1323081 (accessed on 8 January 2016).
  3. Kelly, S.D.T.; Suryadevara, N.K.; Mukhopadhyay, S.C. Towards the implementation of IoT for environmental condition monitoring in homes. IEEE Sens. J. 2013, 13, 3846–3853. [Google Scholar] [CrossRef]
  4. Shyam, S.M.; Prasad, G.V. Framework for IoT applications in the Cloud, is it needed? A study. In Proceedings of the 2017 International Conference on Computing Methodologies and Communication (ICCMC), Erode, India, 18–19 July 2017. [Google Scholar]
  5. Buyya, R.; Shin, C.; Venugopal, S.; Broberg, J.; Brandic, I. Cloud computing and emerging IT platforms: Vision hype and reality for delivering computing as the 5th utility. Future Gener. Comput. Syst. 2009, 25, 599–616. [Google Scholar] [CrossRef]
  6. Gai, K.; Li, S. Towards cloud computing: A literature review on cloud computing and its development trends. In Proceedings of the 2012 Fourth International Conference on Multimedia Information Networking and Security, Nanjing, China, 2–4 November 2012. [Google Scholar]
  7. Babu, S.M.; Lakshmi, A.J.; Rao, B.T. A study on cloud based internet of things: CloudIoT. In Proceedings of the 2015 Global Conference on Communication Technologies (GCCT), Thuckalay, India, 23–24 April 2015. [Google Scholar]
  8. Rimal, B.P.; Choi, E.; Lumb, I. A taxonomy and survey of cloud computing systems. In Proceedings of the 2009 Fifth International Joint Conference on INC, IMS and IDC, Seoul, Korea, 25–27 August 2009. [Google Scholar]
  9. Zeng, D.; Miyazaki, T.; Guo, S.; Tsukahara, T.; Kitamichi, J.; Hayashi, T. Evolution of software-defined sensor networks. In Proceedings of the 2013 IEEE 9th International Conference on Mobile Ad-Hoc and Sensor Networks, Dalian, China, 11–13 December 2013. [Google Scholar]
  10. Kabadayi, S.; Pridgen, A.; Julien, C. Virtual sensors: Abstracting data from physical sensors. In Proceedings of the 2006 International Symposium on a World of Wireless, Mobile and Multimedia Networks (WoWMoM'06), Buffalo-Niagara Falls, NY, USA, 26–29 June 2006. [Google Scholar]
  11. Khan, I.; Belqasmi, F.; Glitho, R.; Crespi, N. A multi-layer architecture for wireless sensor network virtualization. In Proceedings of the 6th Joint IFIP Wireless and Mobile Networking Conference (WMNC), Dubai, UAE, 23–25 April 2013. [Google Scholar]
  12. Kortuem, G.; Kawsar, F.; Sundramoorthy, V.; Fitton, D. Smart objects as building blocks for the internet of things. IEEE Internet Comput. 2010, 14, 44–51. [Google Scholar] [CrossRef]
  13. Cardone, G.; Cirri, A.; Corradi, A.; Foschini, L. The participact mobile crowd sensing living lab: The testbed for smart cities. IEEE Commun. Mag. 2014, 52, 78–85. [Google Scholar] [CrossRef]
  14. Cardone, G.; Foschini, L.; Bellavista, P.; Corradi, A.; Borcea, C.; Talasila, M.; Curtmola, R. Fostering participaction in smart cities: A geo-social crowdsensing platform. IEEE Commun. Mag. 2013, 51, 112–119. [Google Scholar] [CrossRef]
  15. Shojafar, M.; Cordeschi, N.; Baccarelli, E. Energy-efficient adaptive resource management for real-time vehicular cloud services. IEEE Trans. Cloud Comput. 2013, 51, 112–119. [Google Scholar] [CrossRef]
  16. Cordeschi, N.; Amendola, D.; Shojafar, M.; Baccarelli, E. Distributed and adaptive resource management in cloud-assisted cognitive radio vehicular networks with hard reliability guarantees. Veh. Commun. 2015, 2, 1–12. [Google Scholar] [CrossRef]
  17. Ma, Y.; Wang, L.; Liu, P.; Ranjan, R. Towards building a data-intensive index for big data computing—A case study of remote sensing data processing. Inf. Sci. 2015, 319, 171–188. [Google Scholar] [CrossRef]
  18. Biswas, S.; Das, R.; Chatterjee, P. Energy-efficient connected target coverage in multi-hop wireless sensor networks. In Industry Interactive Innovations in Science, Engineering and Technology; Bhattacharyya, S., Sen, S., Dutta, M., Biswas, P., Chattopadhyay, H., Eds.; Springer: Berlin, Germany, 2018. [Google Scholar]
  19. Jiang, M.; Luo, J.; Zou, X. Research on algorithm of three-dimensional wireless sensor networks node localization. J. Sens. 2016, 2016, 2745109. [Google Scholar] [CrossRef]
  20. Khelifi, M.; Benyahia, I.; Moussaoui, S.; Naït-Abdesselam, F. An overview of localization algorithms in mobile wireless sensor networks. In Proceedings of the 2015 International Conference on Protocol Engineering (ICPE) and International Conference on New Technologies of Distributed Systems (NTDS), Paris, France, 22–24 July 2015. [Google Scholar]
  21. Miller, J.S.; Dinda, P.; Dick, R. Evaluating a basic approach to sensor network node programming. In Proceedings of the 7th ACM Conference on Embedded Networked Sensor Systems (SenSys 2009), Berkeley, CA, USA, 4–6 November 2009. [Google Scholar]
  22. Fortino, G.; Giannantonio, R.; Gravina, R.; Kuryloski, P.; Jafari, R. Enabling effective programming and flexible management of efficient body sensor network applications. IEEE Trans. Hum.-Mach. Syst. 2013, 43, 115–133. [Google Scholar] [CrossRef]
  23. Mottola, L.; Picco, G.P. Programming wireless sensor networks: Fundamental concepts and state of the art. ACM Comput. Surv. 2011, 43, 19. [Google Scholar] [CrossRef]
  24. Manujakshi, B.C.; Ramesh, K.B. SDaaS: Framework of sensor data as a service for leveraging service in internet of things. In Proceedings of the International Conference on Emerging Research in Computing, Information, Communication and Applications, Bangalore, India, 29–30 July 2016. [Google Scholar]
  25. IoTivity. Available online: https://openconnectivity.org/developer/reference-implementation/iotivity (accessed on 5 April 2018).
  26. Shelby, Z.; Hartke, K.; Bormann, C. The Constrained Application Protocol (CoAP); Internet Engineering Task Force (IETF): Fremont, CA, USA, 2014. [Google Scholar]
  27. Botta, A.; De Donato, W.; Persico, V.; Pescapé, A. On the integration of cloud computing and internet of things. In Proceedings of the 2014 International Conference on Future Internet of Things and Cloud, Barcelona, Spain, 27–29 August 2014. [Google Scholar]
  28. Atzori, L.; Iera, A.; Morabito, G. The internet of things: A survey. Comput. Netw. 2010, 54, 2787–2805. [Google Scholar] [CrossRef]
  29. Richardson, L.; Ruby, S. RESTful Web Services; O’Reilly Media: Seville, CA, USA, 2007. [Google Scholar]
  30. Duquennoy, S.; Grimaud, G.; Vandewalle, J. The web of things: Interconnecting devices with high usability and performance. In Proceedings of the International Conference on Embedded Software and Systems, Hangzhou, China, 25–27 May 2009. [Google Scholar]
  31. Du, Z.; Yu, N.; Cheng, B.; Chen, J. Data mashup in the internet of things. In Proceedings of the International Conference on Computer Science and Network Technology (ICCSNT), Harbin, China, 24–26 December 2011. [Google Scholar]
  32. Kansal, A.; Nath, S.; Liu, J.; Zhao, F. SenseWeb: An infrastructure for shared sensing. IEEE MultiMedia 2007, 14, 8–13. [Google Scholar] [CrossRef]
  33. Guinard, D.; Trifa, V.; Mattern, F.; Wilde, E. From the internet of things to the web of things: Resource-oriented architecture and best practices architecting the internet of things. In Architecting the Internet of Things; Uckelmann, D., Harrison, M., Michahelles, F., Eds.; Springer: Berlin, Germany, 2011. [Google Scholar]
  34. Dawson-Haggerty, S.; Jiang, X.; Tolle, G.; Ortiz, J. sMAP: A simple measurement and actuation profile for physical information. In Proceedings of the 8th International Conference on Embedded Networked Sensor Systems (SenSys 2010), Zurich, Switzerland, 3–5 November 2010. [Google Scholar]
  35. SensorML. Available online: http://vast.uah.edu/SensorML/ (accessed on 10 May 2018).
  36. Leontiadis, I.; Efstratiou, C.; Mascolo, C.; Crowcroft, J. Senshare: Transforming sensor networks into multi-application sensing infrastructure. In Proceedings of the 9th European Conference on Wireless Sensor Networks, Trento, Italy, 15–17 February 2012. [Google Scholar]
  37. Vögler, M.; Schleicher, J.; Inzinger, C.; Nastic, S.; Sehic, S.; Dustdar, S. LEONORE—Large-scale provisioning of resource-constrained IoT deployments. In Proceedings of the 2015 IEEE Symposium on Service-Oriented System Engineering, San Francisco Bay, CA, USA, 30 March–3 April 2015. [Google Scholar]
  38. Madria, S.; Kumar, V.; Dalvi, R. Sensor cloud: A cloud of virtual sensors. IEEE Softw. 2014, 31, 70–77. [Google Scholar] [CrossRef]
  39. Misra, S.; Chatterjee, S.; Obaidat, M.S. On Theoretical modeling of sensor cloud: A paradigm shift from wireless sensor network. IEEE Syst. J. 2017, 11, 1084–1093. [Google Scholar] [CrossRef]
  40. Chatterjee, S.; Ladia, R.; Misra, S. Dynamic optimal pricing for heterogeneous service-oriented architecture of sensor-cloud infrastructure. IEEE Trans. Serv. Comput. 2017, 10, 203–216. [Google Scholar] [CrossRef]
  41. Dinh, T.; Kim, Y. An efficient interactive model for on-demand sensing-as-a-servicesof sensor-cloud. Sensors 2016, 16, 992. [Google Scholar] [CrossRef] [PubMed]
  42. Abdelwahab, S.; Hamdaoui, B.; Guizani, M.; Znati, T. Cloud of things for sensing-as-a-service: Architecture, algorithms, and use case. IEEE Internet Things J. 2016, 3, 1099–1112. [Google Scholar] [CrossRef]
  43. Dinh, T.; Kim, Y. Information centric sensor-cloud integration: An efficient model to improve wireless sensor networks’ lifetime. In Proceedings of the 2017 IEEE International Conference on Communications (ICC), Paris, France, 21–25 May 2017. [Google Scholar]
  44. Dinh, T.; Kim, Y. An efficient sensor-cloud interactive model for on-demand latency requirement guarantee. In Proceedings of the 2017 IEEE International Conference on Communications (ICC), Paris, France, 21–25 May 2017. [Google Scholar]
  45. Sen, A.; Madria, S. Risk assessment in a sensor cloud framework using attack graphs. IEEE Trans. Serv. Comput. 2017, 10, 942–955. [Google Scholar] [CrossRef]
  46. Misra, S.; Singh, A.; Chatterjee, S.; Obaidat, M.S. Mils-cloud: A sensor-cloud-based architecture for the integration of military tri-services operations and decision making. IEEE Syst. J. 2016, 10, 628–636. [Google Scholar] [CrossRef]
  47. Dinh, T.; Kim, Y.; Lee, H. A location-based interactive model of internet of things and cloud (IoT-Cloud) for mobile cloud computing applications. Sensors 2017, 17, 489. [Google Scholar] [CrossRef] [PubMed]
  48. Zhu, C.; Leung, V.C.M.; Wang, K.; Yang, L.T.; Zhang, Y. Multi-method data delivery for green sensor-cloud. IEEE Commun. Mag. 2017, 55, 176–182. [Google Scholar] [CrossRef]
  49. Fazio, M.; Puliafito, A. Cloud4sens: A cloud-based architecture for sensor controlling and monitoring. IEEE Commun. Mag. 2015, 53, 41–47. [Google Scholar] [CrossRef]
  50. Open Sourense IoT Cloud. Available online: https://sites.google.com/site/opensourceiotCloud/ (accessed on 9 May 2018).
  51. Thingspeak. Available online: https://www.thingspeak.com/ (accessed on 10 March 2018).
  52. DIGI. Available online: http://www.digi.com/ (accessed on 6 March 2018).
  53. Kovatsch, M.; Lanter, M.; Shelby, Z. Californium: Scalable cloud services for the internet of things with CoAP. In Proceedings of the International Conference on the Internet of Things (IOT′14), Cambridge, MA, USA, 6–8 October 2014. [Google Scholar]
  54. Available online: https://www.heroku.com/ (accessed on 10 April 2018).
  55. Available online: http://www.kinvey.com/ (accessed on 16 May 2018).
  56. Available online: http://parseplatform.org/ (accessed on 16 May 2018).
  57. Available online: http://Cloudinary.com/ (accessed on 14 May 2018).
  58. Available online: https://console.ng.bluemix.net/ (accessed on 14 May 2018).
  59. Pflanzner, T.; Kertesz, A. A survey of IoT cloud providers. In Proceedings of the 2016 39th International Convention on Information and Communication Technology, Electronics and Microelectronics (MIPRO), Opatija, Croatia, 30 May–3 June 2016. [Google Scholar]
  60. Guo, S.; Zhong, Z.; He, T. FIND: Faulty node detection for wireless sensor networks. In Proceedings of the 7th ACM Conference on Embedded Networked Sensor Systems (SenSys 2009), Berkeley, CA, USA, 4–6 November 2009. [Google Scholar]
  61. Krishnamachari, B.; Sitharama, I. Distributed Bayesian algorithms for fault-tolerant event region detection in wireless sensor networks. IEEE Trans. Comput. 2004, 53, 241–250. [Google Scholar] [CrossRef]
  62. Jadav, P.; Babu, V.K. Fuzzy logic based faulty node detection in wireless sensor network. In Proceedings of the 2017 International Conference on Communication and Signal Processing (ICCSP), Chennai, India, 6–8 April 2017. [Google Scholar]
  63. Ahmad, S.; Hang, L.; Kim, D.H. Design and implementation of cloud-centric configuration repository for DIY IoT applications. Sensors 2018, 18, 474. [Google Scholar] [CrossRef] [PubMed]
  64. Aziz, H.; Ridley, M. Real-time web applications driven by active browsing. In Proceedings of the 2017 Internet Technologies and Applications (ITA), Wrexham, UK, 12–15 September 2017. [Google Scholar]
  65. Rasslan, M.; Nasreldin, M.; Elkabbany, G.; Elshobaky, A. On the security of the sensor cloud security library (SCSlib). J. Comput. Sci. 2018, 14, 793–803. [Google Scholar] [CrossRef]

Article Metrics

Citations

Article Access Statistics

Multiple requests from the same IP address are counted as one view.