1. Introduction
In recent years, the number of satellite launches has increased significantly, leading to a growing demand for electronic systems suitable for space applications [
1]. These systems must operate reliably under harsh environmental conditions, where space radiation represents a major challenge [
2]. In particular, radiation-induced degradation, such as Total Ionizing Dose (TID) effects, can compromise the functionality and lifetime of electronic components, directly affecting mission success.
Radiation qualification is traditionally performed through irradiation testing, supported by simulation tools such as SPENVIS [
3] or FastRad [
4], among others. However, irradiation campaigns are costly, time-consuming, and inherently destructive. As a result, there is increasing interest in alternative and complementary approaches capable of predicting device degradation while reducing the need for extensive testing. The prediction of TID effects on circuits and systems is usually handled during the design phase, where corrective actions can be taken, a process known as Radiation-Hardening By Design (RHBD). The modelling process can involve physics-based TCAD simulations, experimental TID degradation data of components, or a mixture of both [
5]. However, the purpose of this paper is to predict the behavior under TID of already designed circuits, particularly Commercial Off-The-Shelf (COTS) components which may not have been designed for radiative environments. Some papers can be found in the literature that apply mainly to simple devices like transistors or diodes. In [
6], the authors propose a statistical methodology to assess the probability of failure of simple components with appropriate confidence bounds. In [
7], on the other hand, the response at the system level is studied based on the radiation results of its building blocks. Again, the considered COTS are simple transistors and the “system” under study is an amplifier. A MonteCarlo approach is used to devise the effects based on transistor swapping.
At a higher complexity level, very few contributions can be found. In [
8], the effect of degradation paths of COTS ADCs on the performance of space-borne fiber-optic gyroscopes is assessed, but the model fitting is based on accelerated radiation tests.
In this context, machine learning (ML) techniques have emerged as promising tools for the analysis and prediction of radiation effects using historical data.
Analog-to-digital converters (ADCs) are key components in space electronic systems, where they play a central role in signal acquisition and processing. Their correct operation is commonly assessed through linearity parameters, among which the Integral Non-Linearity (INL) is particularly critical. Degradation of INL directly impacts system-level performance. This issue is especially relevant in the New Space paradigm, where Commercial Off-The-Shelf (COTS) components are increasingly adopted in Low Earth Orbit (LEO) missions due to cost and availability constraints, despite their higher sensitivity to radiation compared with radiation-hardened (RadHard) devices.
This work builds upon the Advanced Predictor of Electrical Parameters (APEP) methodology, which exploits digitized historical radiation test data stored in the PRECEDER database [
9]. The APEP method, based on ML techniques, has been previously validated for discrete analog devices, such as bipolar transistors [
10] and optocouplers [
11], showing its capability to predict degradation trends from pre-irradiation measurements. However, its applicability to more complex mixed-signal devices has not yet been investigated.
Recently, machine learning techniques have been employed to model the effects of TID on semiconductor devices, demonstrating the efficacy of data-driven approaches in modelling complex non-linear relationships, without the necessity of detailed physical experimentation [
12]. These approaches have progressed towards the development of automated methodologies for predicting radiation vulnerability at the integrated circuit level, enabling more efficient evaluations and reducing the need for extensive experimental campaigns [
13]. In addition, unsupervised learning techniques have been explored to classify radiation effects in microelectronics, allowing emerging patterns to be identified without the need for preliminary data, labelled as proposed by the authors in [
14].
The objective of this paper is to extend and enhance the APEP methodology for mixed-signal components, focusing on the prediction of INL degradation in ADCs. The AD574, a 12-bit successive-approximation ADC, widely used in aerospace applications [
15], is selected as a case study due to the availability of multiple TID reports in PRECEDER [
10]. To improve the predictive capability of APEP, a multivariate analysis framework is incorporated, supported by t-Distributed Stochastic Neighbour Embedding (t-SNE) [
16,
17] to explore non-linear relationships among electrical parameters measured prior to irradiation.
The results demonstrate that combining the APEP method with dimensionality reduction techniques significantly improves clustering and prediction performance, confirming the potential of this approach as a cost-effective tool to support component selection and qualification for space applications.
2. Materials and Methods
2.1. Background and Data Source
This section describes the methodological framework adopted to extend the Advanced Predictor of Electrical Parameters (APEP) methodology [
9] to analog-to-digital converters (ADCs). All analyses are based exclusively on digitized irradiation reports retrieved from the PRECEDER database [
10], a structured SQL-based [
18] repository that ensures traceability of device metadata, test conditions, electrical parameters, and irradiation steps.
Previous studies have demonstrated the predictive capability of the APEP method for discrete analog devices under Total Ionizing Dose (TID). In this work, the methodology is adapted to mixed-signal devices, using the AD574 converter [
15], which provides the largest number of complete TID reports available in PRECEDER.
2.2. Dataset Preparation and Pre-Processing
A total of ten independent irradiation reports are considered to this study, comprising 64 samples in total. Each report corresponds to a separate irradiation campaign conducted between 2004 and 2021 and involves devices from different manufacturing batches. No samples are shared across reports. Only irradiation reports containing numerical electrical measurements at multiple TID steps were considered. Annealing data and control samples were excluded, as they do not represent cumulative radiation effects. The dose rate used in all of the reports correspond to Low Dose Rate (LDR) conditions according with the ESCC22900 [
19], ranging from 110 to 360 rad(Si)/h and testing using gamma radiation (Co-60). The reports under consideration come from different sources, including private companies, space agencies, and manufacturers.
Due to heterogeneity in dose steps across reports, a homogenization procedure was applied. Two data completion strategies were included into the methodology but not presented in this work:
Among all available parameters, the Integral Non-Linearity (INL) was selected as the target variable due to its presence in all reports, its sensitivity to cumulative TID effects, and its relevance to ADC performance.
2.3. Validation Strategy
The APEP methodology establishes a relationship between pre-irradiation electrical measurements and the subsequent radiation-induced degradation of a device. In its original formulation, a single electrical parameter measured at 0 krad is used as the input feature.
In this study, the predictive model is implemented using a single-layer perceptron. The input consists of electrical parameters measured before irradiation, while the output corresponds to the degradation class identified from post-irradiation behavior.
Due to the limited number of available samples, model validation is performed using Leave-One-Out Cross-Validation (LOOCV). In each iteration, one device is excluded from the dataset, the model is trained using the remaining samples, and the excluded device is then classified. This process is repeated until all samples have been used once as test data.
The performance of the classifier is evaluated by comparing predicted and observed degradation classes, allowing an objective assessment of the predictive capability of the methodology.
2.4. Multivariable Extension of APEP
To explore the relationships among multiple electrical parameters measured at 0 krad, dimensionality reduction techniques were applied as an exploratory step within the APEP framework. A data matrix was constructed using the electrical parameters common to all AD574 reports and measured under identical biasing conditions. Before the analysis, all variables were standardized to prevent parameters with larger numerical ranges from dominating the analysis.
t-Distributed Stochastic Neighbour Embedding (t-SNE) was employed to explore potential non-linear relationships among parameters. The algorithm was applied using a two-dimensional embedding to facilitate visual interpretation. Key hyper parameters were selected empirically and kept fixed across all experiments to ensure consistency.
The results of reduction in dimensionality and its representations were used exclusively for exploratory analysis to verify that the multivariable extension is founded in the latent relationships between the parameters. To improve the analysis, clustering was performed to classify electrical parameters based on their inherent relationships within the non-catastrophic samples. For each cluster, a regression model is fitted to estimate the slope, which served as a reference for evaluating the accuracy of the cluster assignments. Then, the slope of the INL of each sample is compared to the regression model of its cluster, and the relative offset is calculated. A threshold of 0.01 is selected to classify samples as correctly assigned to their grouping based on this offset. These results allowed us to evaluate an accuracy of the grouping assignments across all experiments.
3. Results
3.1. INL Degradation Under TID
The APEP methodology was initially validated as a successful predictive tool for Total Ionizing Dose (TID) degradation using the 2N2222 bipolar transistor in previously published work [
9,
10]. This section presents the key results from the extension and optimization of the APEP framework, focusing on its application to the AD574, analog-to-digital converter.
The present study focuses on the prediction of the degradation of the INL parameter of AD574. To facilitate the visualization, a single report was initially selected for detailed analysis.
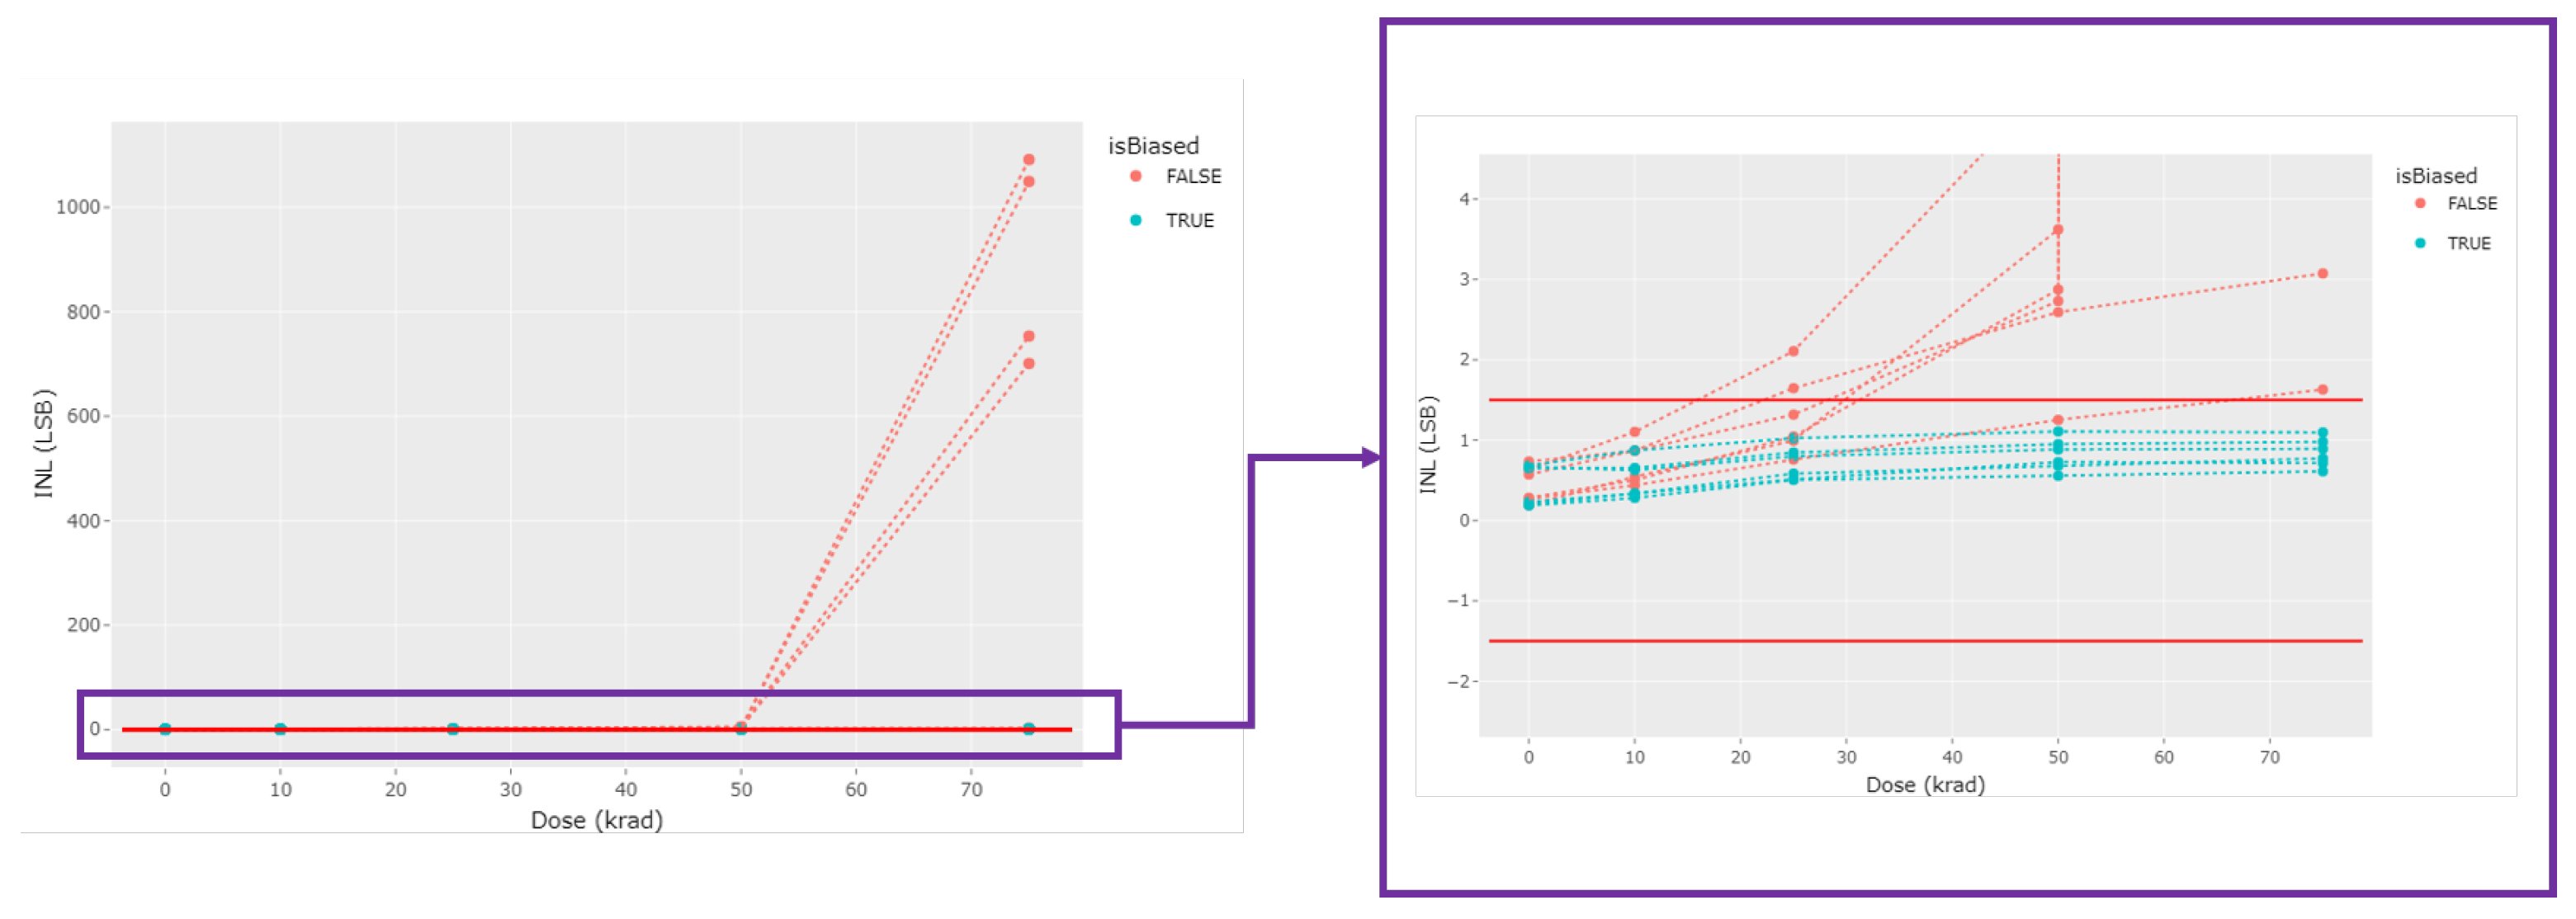
Figure 1 shows that two different biasing conditions for the same AD574 batch, irradiated under the same dose rate, temperature, pressure, and humidity, do not exhibit equivalent degradation levels. The unbiased condition (False
•), with all the pins connected to ground, presents the worst-case scenario when compared to the biased condition (True
•). This behavior is attributed to the fact that, although biased samples exhibit some degradation, their INL values remain within the manufacturer’s specified limits (red horizontal lines). In contrast, several unbiased samples exceed these limits. Moreover, some devices show catastrophic failure, hereafter referred to as blow-up, after 50 krad(Si). In this context, catastrophic failure is defined only in these cases where a sample exhibits an abrupt or singular behavior over the test.
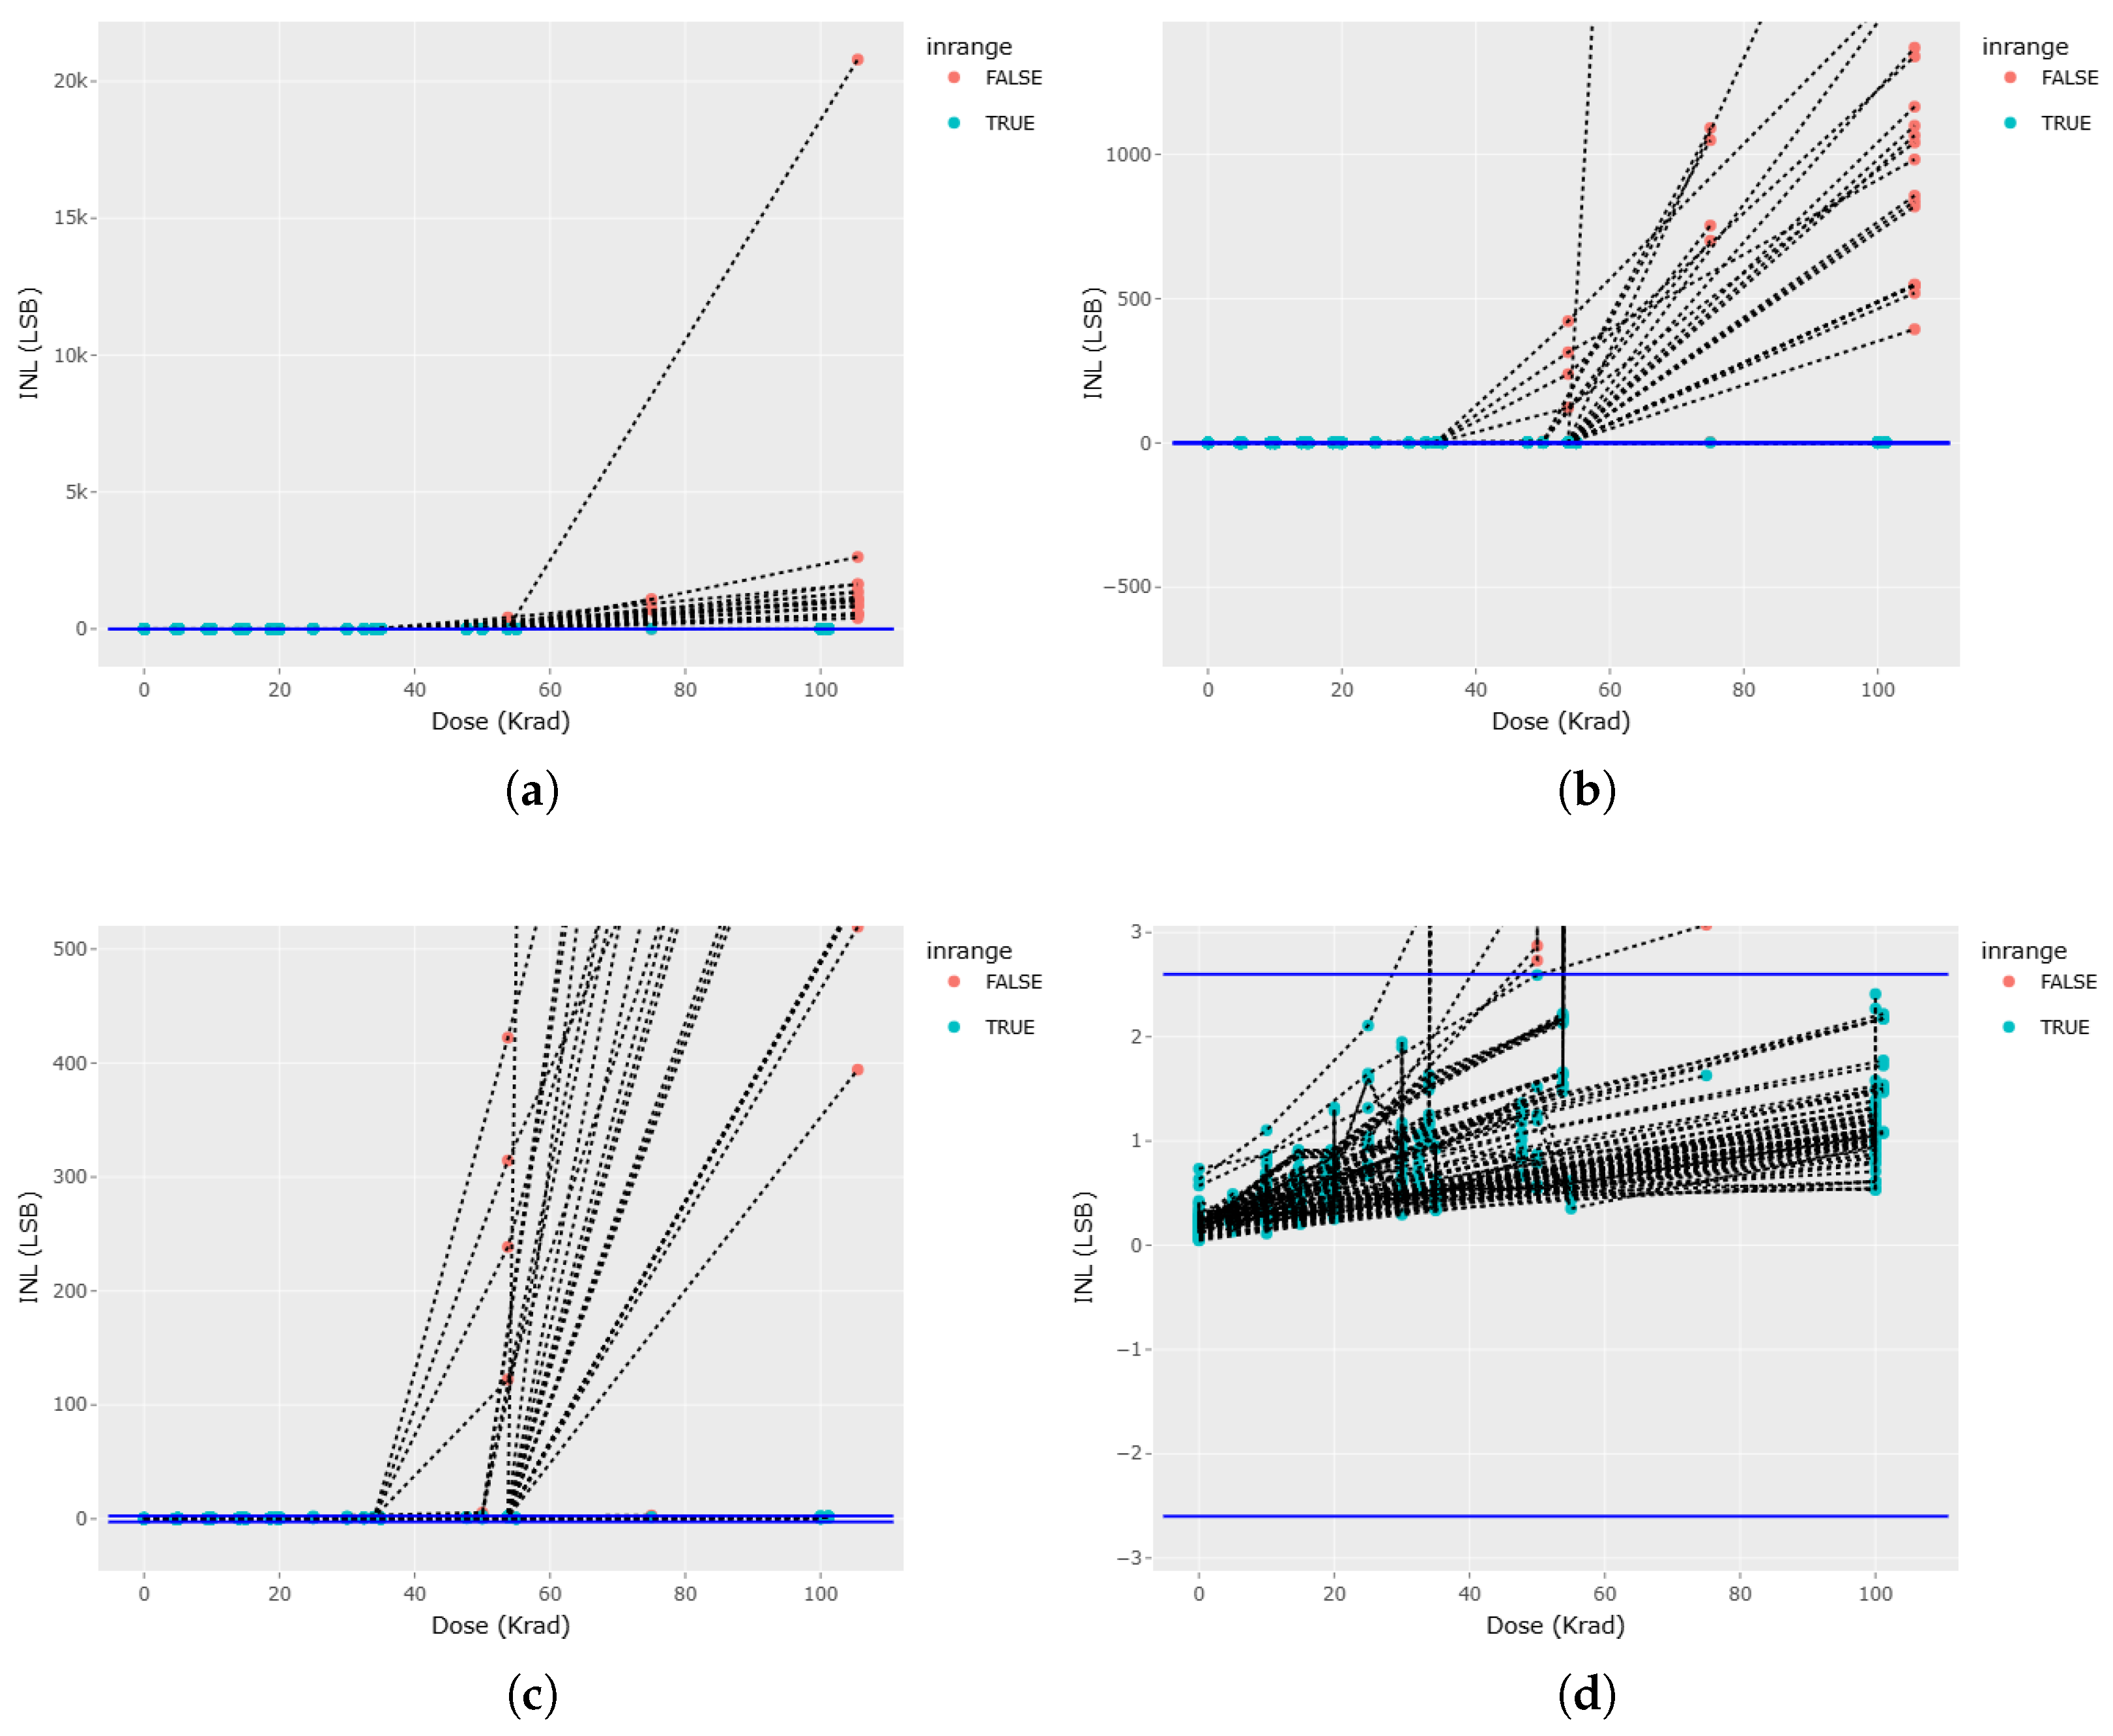
Since the unbiased condition represents the worst-case scenario and is therefore of greater interest, the analysis is continued using only the data corresponding to this condition. When extending the study to the full dataset,
Figure 2a presents the complete INL dataset for unbiased devices available in the PRECEDER database. Two distinct populations can be identified: one with a progressive degradation pattern, which mostly remain within the manufacturer’s post-irradiation limits and another exhibiting catastrophic degradation beyond some dose value, clearly exceeding these limits. In
Figure 2b, the samples with the most severe blow-up behavior are excluded for clarity. These results indicate the existence of two distinct groups based on the accumulated dose at which the INL reaches very high values. To analyze this behavior in greater detail, a zoomed view is provided in
Figure 2c, where INL singularities are observed around 35, 50, and 55 krad(Si). Finally,
Figure 2d shows the subset of data that remains within the specified limits, demonstrating that some devices operate within specification up to 100 krad(Si). It should be noted that the TRUE/FALSE labels are assigned once per ADC sample, based on its overall degradation behavior throughout the irradiation campaign. A device is labelled FALSE if its INL exceeds the specified limits at any evaluated dose level, whereas it is labelled TRUE if it remains within specification across the entire dose range.
Using the complete set of available AD574 irradiation reports, a new data subset was defined, considering all INL measurements acquired at doses equal to or greater than the critical dose D*. The critical dose D*, defined as the maximum dose for which all INL measurements remain within the specified limits, was determined to be 47.71 krad(Si). This dose is calculated as the maximum cumulative dose for which all INL values, including the value itself, are included within the defined range. It is evident that the value of D* is contingent on the specific dataset under consideration. Moreover, the simultaneous existence of two distinctly different degradation behaviors demonstrates that the INL response of the AD574 cannot be adequately described by a single global model. It is not possible to describe this behavior with a single function that can simultaneously exhibit blow-up singularity and monotonic increasing trends. These observations lend support to the adoption of a multipart modelling approach, in which separate functions are defined for the low- and high-dose regions, with model parameters that inherently vary across the available experimental data. Consequently, it has been opted to adopt the methodology proposed in [
9], based on data instead of a model-based one.
3.2. Clustering Based on INL Evolution
A clustering strategy based on the hypothesis of similar degradation behavior under TID is used. The objective of this study is to identify the presence of any meaningful patterns that may be extracted from the INL evolution data. As commented above, the different ADC files do not report the INL at the same TID points. To facilitate the implementation of the clustering algorithm, the dataset for clustering resorts to interpolation at intermediate points and linear extrapolation, a strategy implemented in the data cleaning and pre-processing stage, which includes the use of actual data from reports and generated metadata. This approach is only used in this part, for better observation of the classifications.
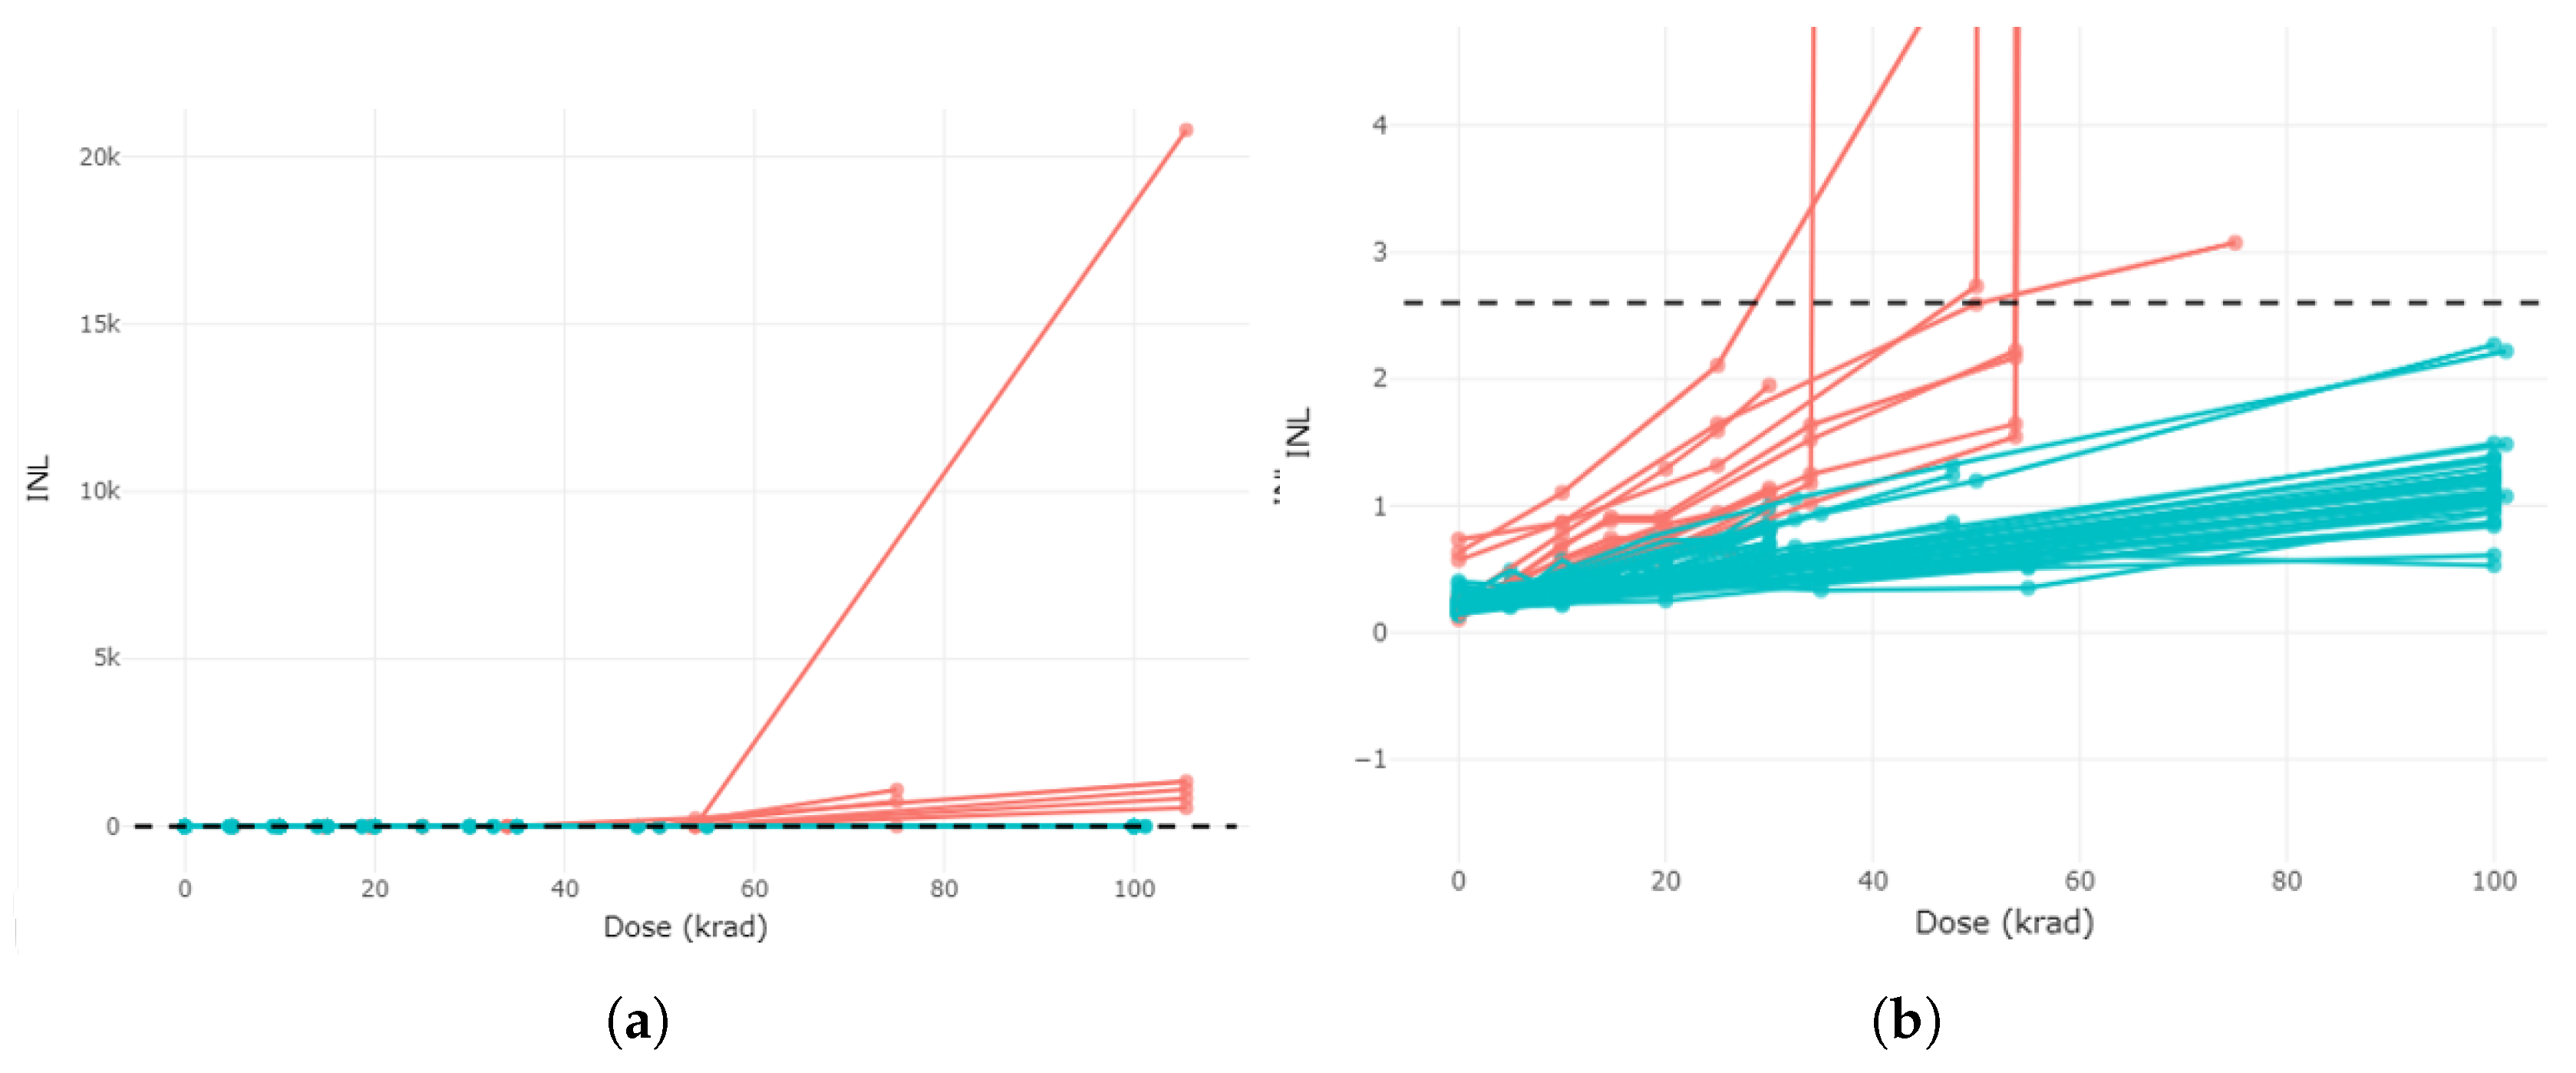
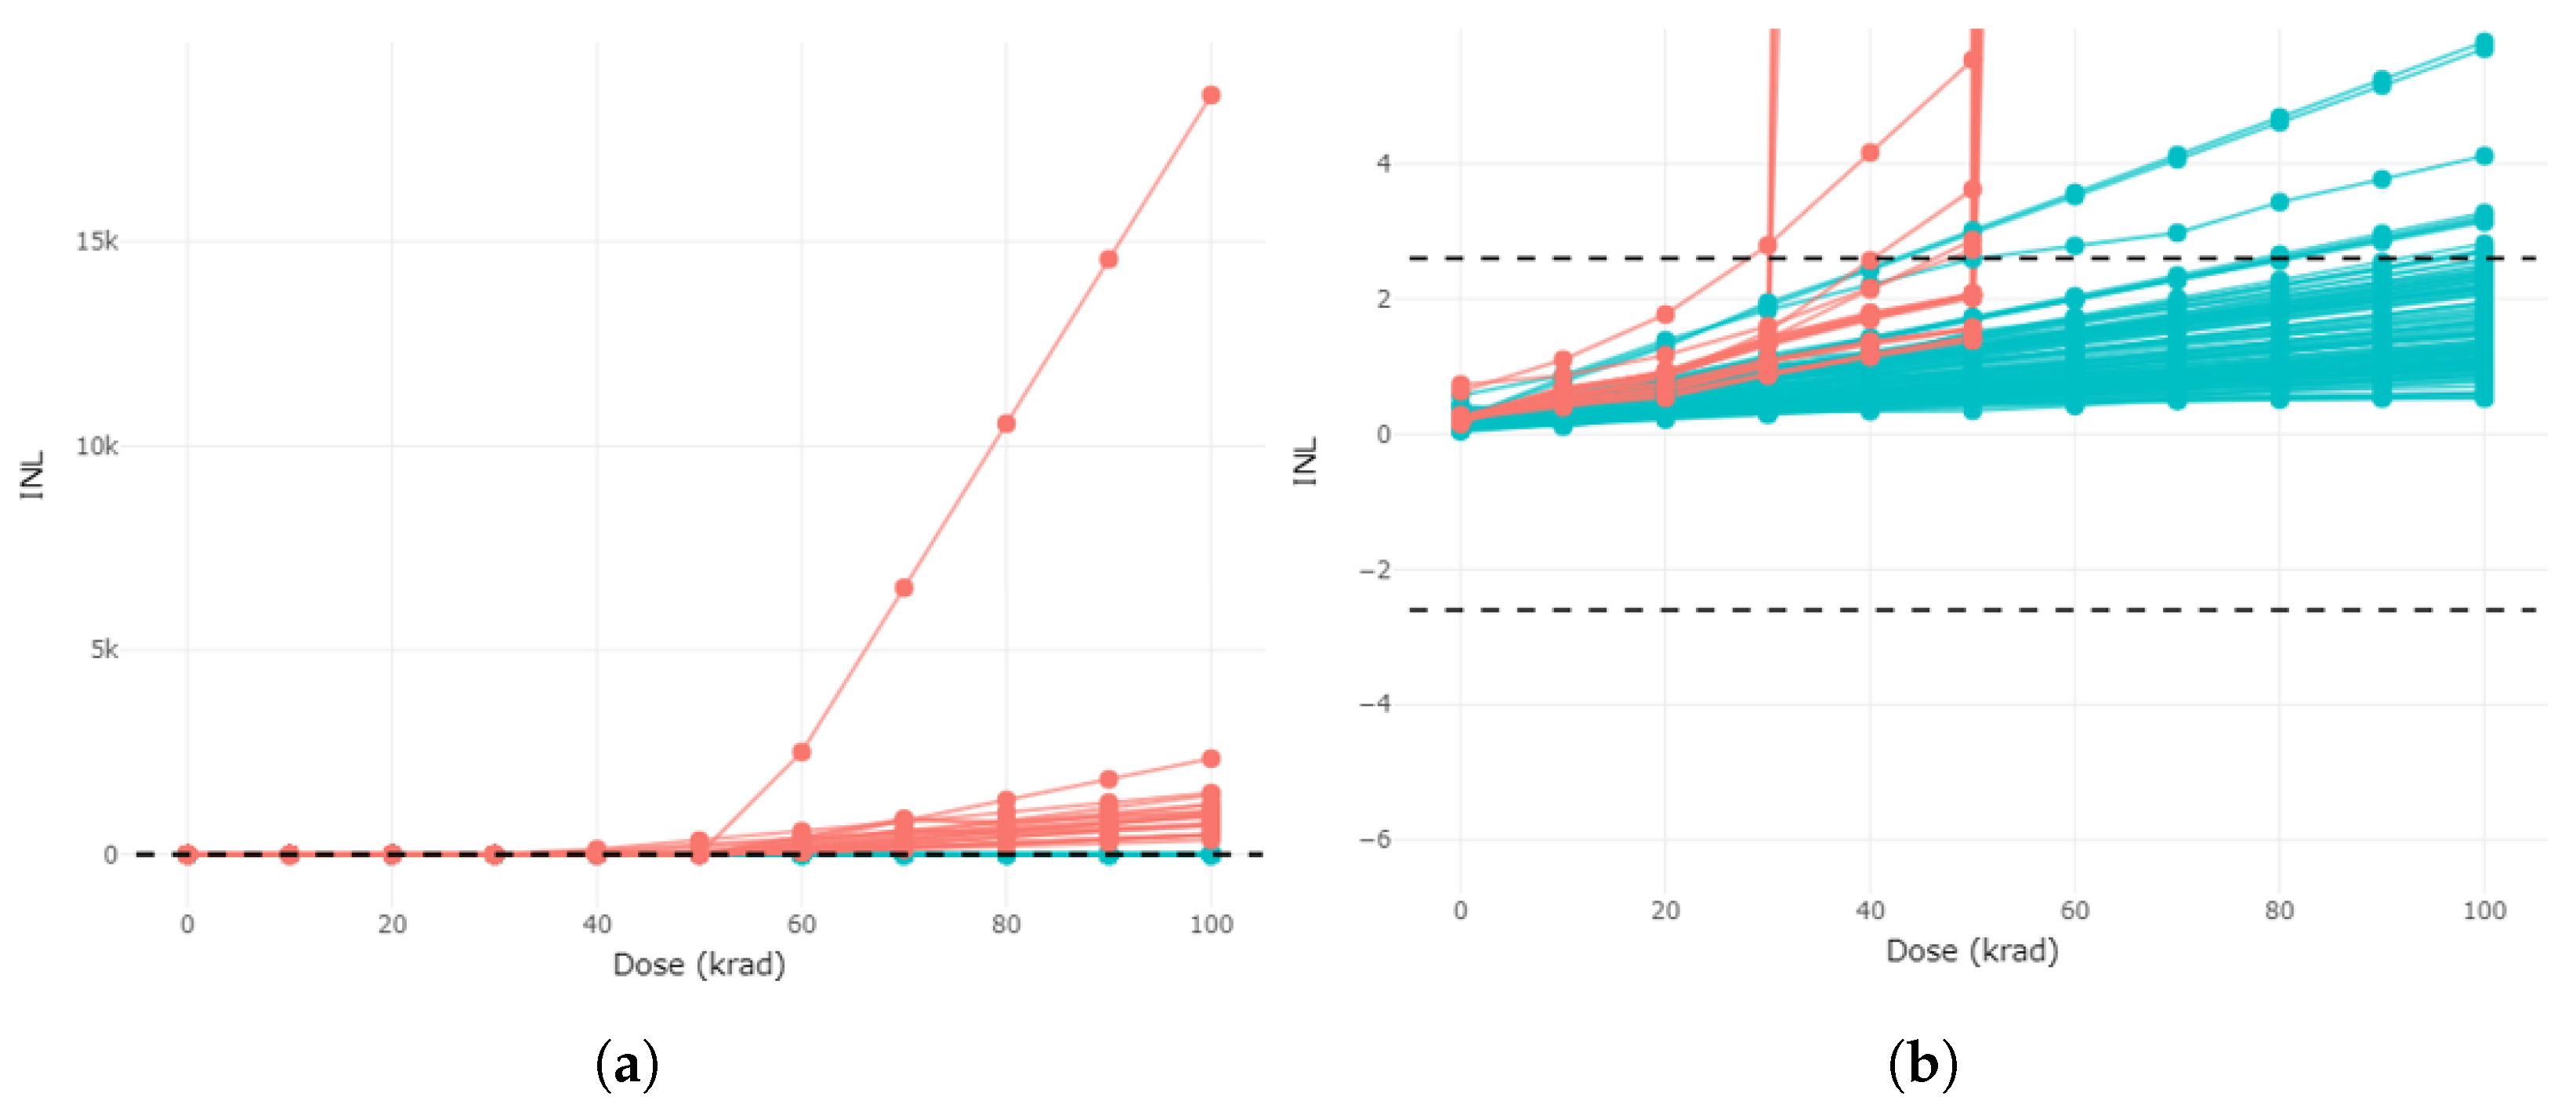
The unsupervised k-means clustering algorithm was applied to group the samples exclusively based on the similarity of their INL degradation evolution under TID. The algorithm operates only on the degradation trajectories and does not incorporate previous information regarding specification limits. In this implementation, the number of groups is fixed to two in order to analyze whether the degradation behavior naturally separates into two distinct patterns: the slowly degrading one and the catastrophic one. However, if the observation of the data suggested three or more markedly different degradation trends, the number of targeted clusters could be increased. For interpretation purposes, the results are compared with a manual classification obtained from applicability of the specification limits. This comparison allows assessment into the algorithm partition to be physically consistent with the observed degradation behaviors. The resulting classifications are presented in
Figure 3 and
Figure 4, where manual and k-means-based grouping can be directly compared.
We observe that the algorithm does not perform the same separation as the manual filter, since it considers some parts outside the range to belong to the non-failure group. However, it is clear that the algorithm can distinguish between components subject to catastrophic failure and those that exhibit more moderate degradation. It should be noted that in the previous step of the process, it was observed that once the D* dose threshold was exceeded, some components exhibited blow-up behavior, while others continued to degrade without reaching this singularity. In this case, the unsupervised algorithm can distinguish between the two scenarios. In what follows, we will use the results of this unsupervised clustering step as the target labels for further classification.
One of the main objectives of this work is to be able to predict, or at least narrow down, the behavior of the device in response to radiation using only the electrical measurement of the parameter at 0 krad.
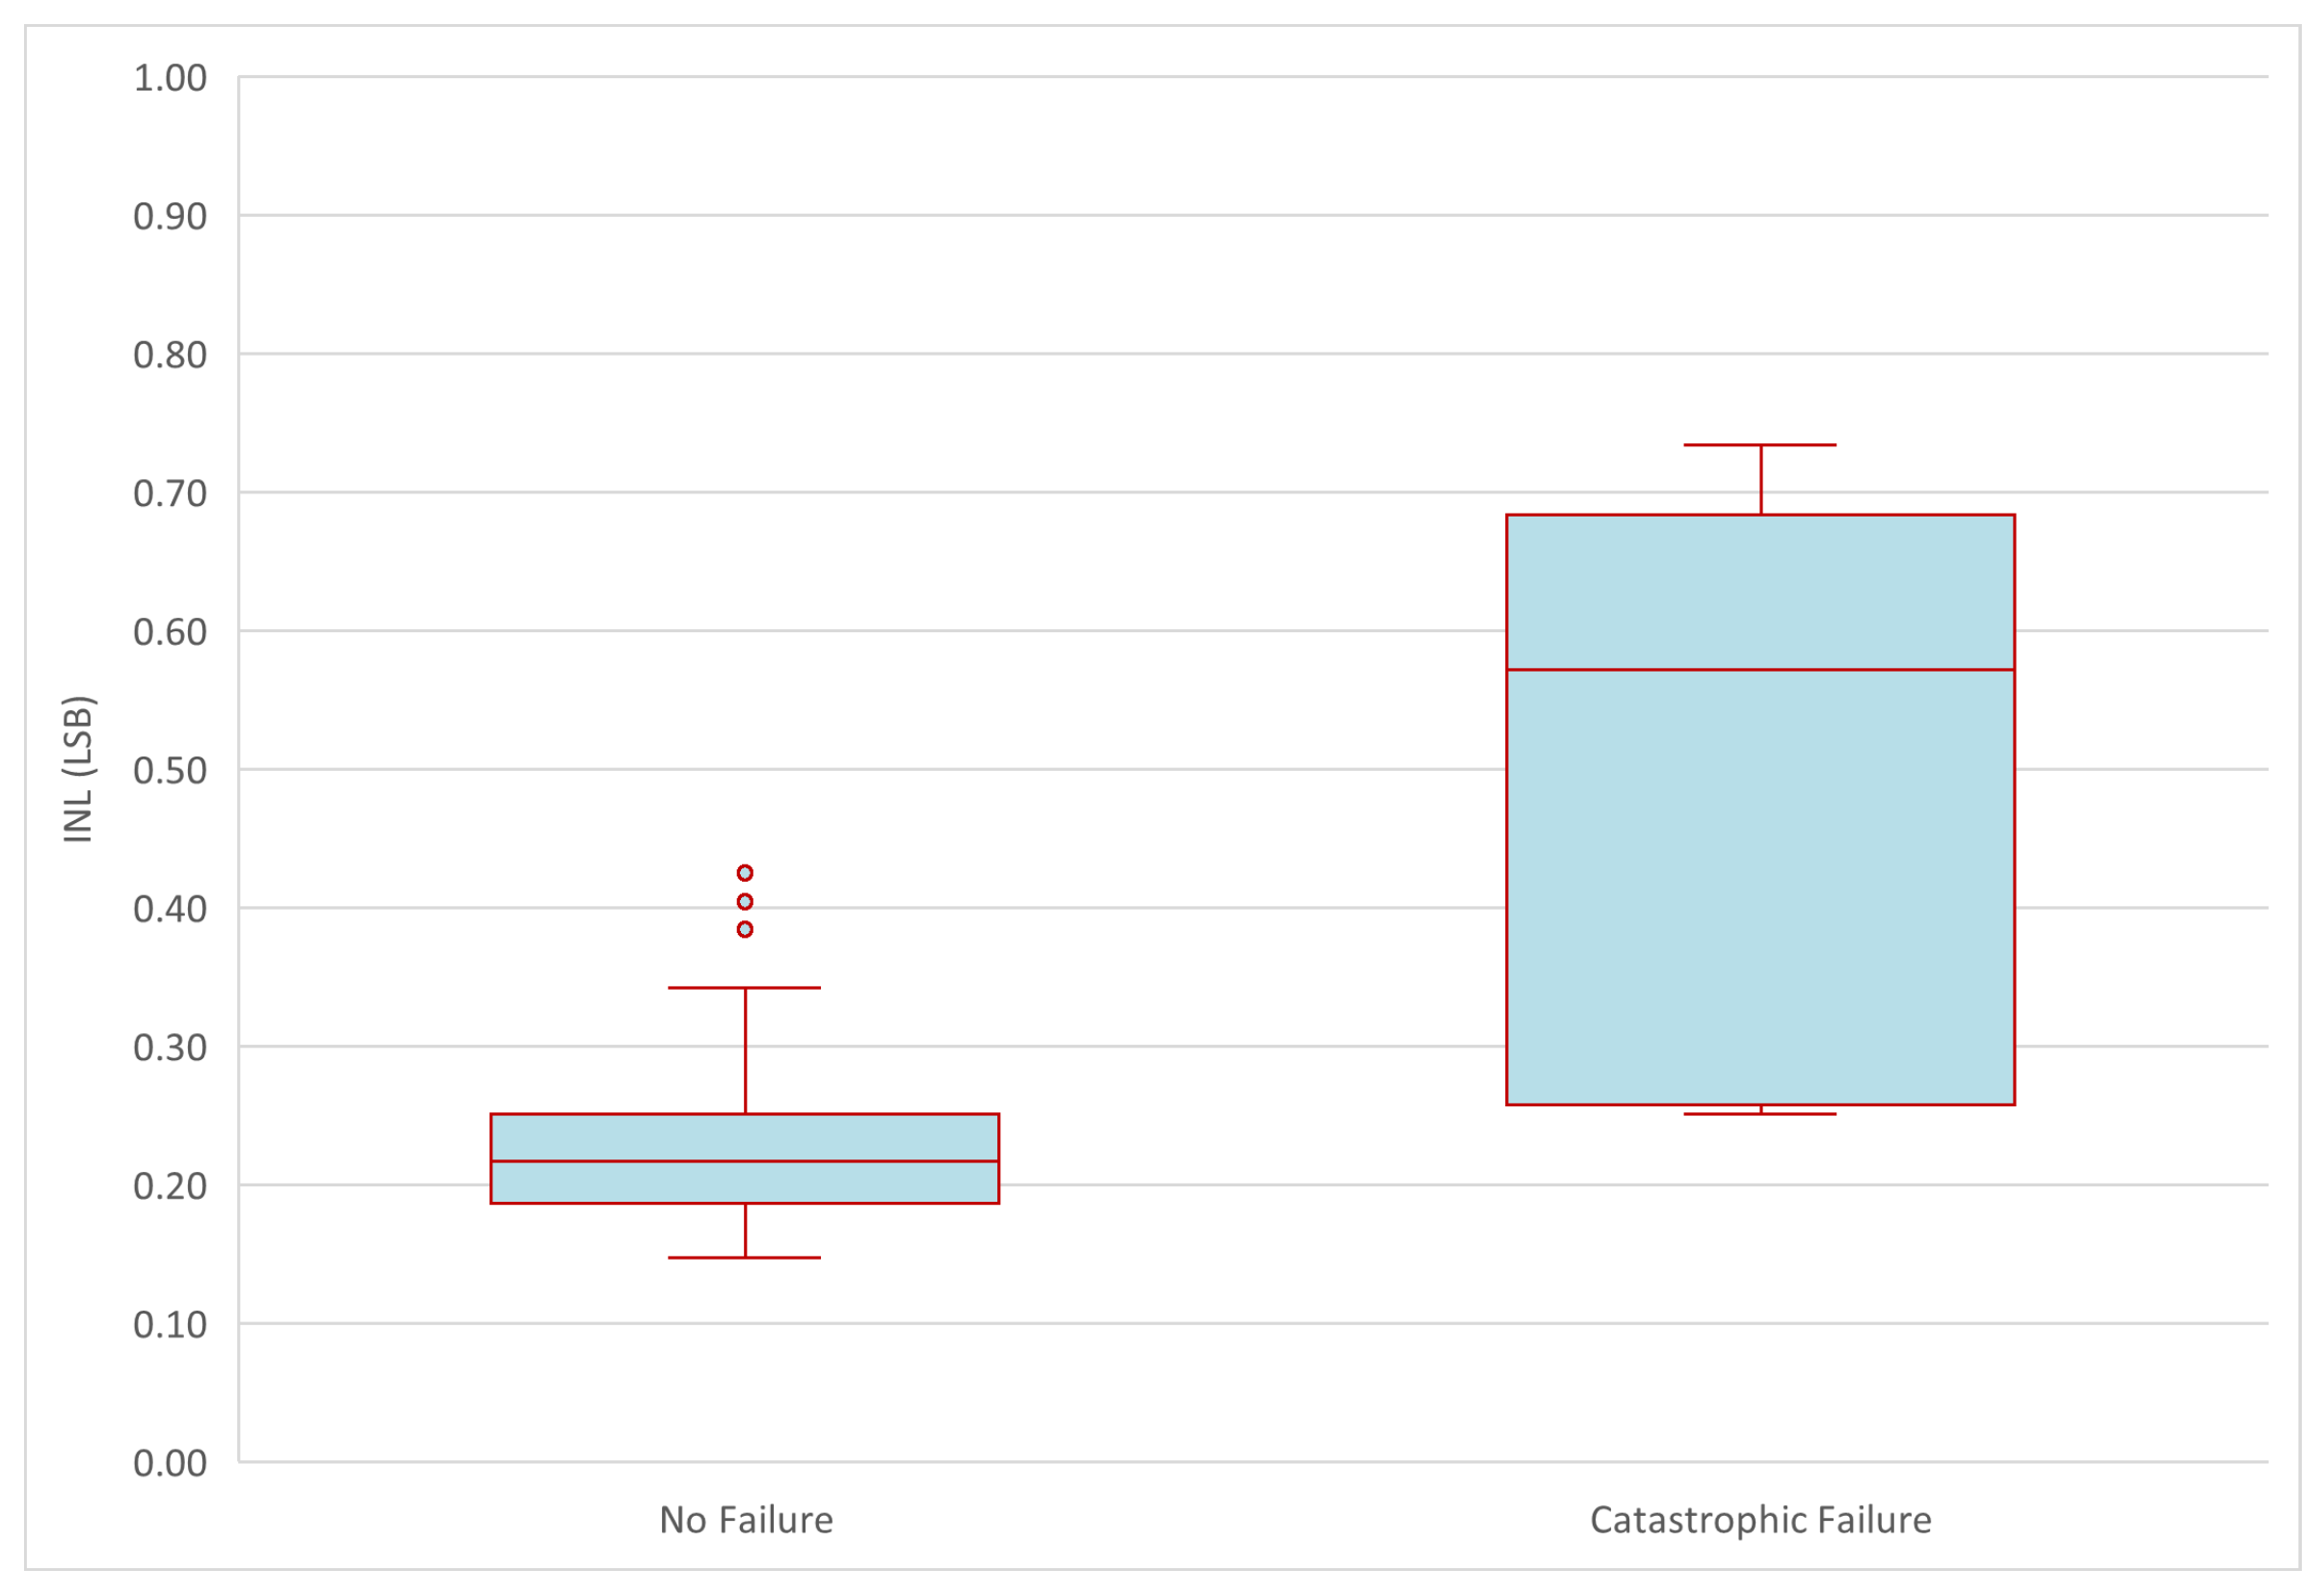
Figure 5 shows, using a boxplot diagram, the distribution of the INL at 0 krad according to the cluster assigned by k-means. The box covers the second and third quartiles, the centre line is the median, the segments extend to values not considered atypical, and the individual points indicate outliers. From a statistical perspective, the degree of overlap between the interquartile ranges provides an initial indication of the separability of the clusters in the feature space. This graph allows us to check whether the “Catastrophic Failure” and “No Failure” groups already differ in initial conditions, providing an initial qualitative validation of the consistency of the groupings made by the algorithm. In this case, there are three atypical samples in the “No Failure” set, suggesting that there could be an alternative partition (more than two groups) or that the number of parameters measured needs to be increased to classify and predict the group. However, since there is some overlap, we can readily suggest that a direct classification based solely on the INL at dose 0 will not produce perfect results.
3.3. Validation APEP Using INL at 0 Krad
Once the two groups have been determined using the k-means algorithm, it is necessary to validate whether we can correctly classify a piece that was not included in the initial dataset used to form the groups. As our dataset is limited, we have opted to use the method known as Leave-One-Out Cross Validation (LOOCV).
This method involves the following steps. Firstly, one sample is excluded from the dataset. Then, the model is trained with the remaining samples. Finally, the group to which the excluded sample corresponds is predicted. This process is repeated for each sample, ensuring that each one only functions as a test element once. This approach is time-consuming since a new classifier has to be trained for each excluded sample, but it enables the estimation of the classifier’s performance with a high degree of accuracy, eliminating the need to reserve a proportion of the set exclusively for validation. This is a significant advantage in contexts where the number of samples is limited.
The results obtained after applying the Leave-One-Out method are summarized in
Table 1. For the classifier, a simple perceptron with one hidden layer was used. A total of two cases of faulty and fifty-five cases of non-faulty behavior have been correctly identified, with seven cases of misclassification. Two false negatives were observed, i.e., parts that were clustered as catastrophic but were classified as smooth degradation pattern, implying that the algorithm failed to detect two devices that could induce important system failure under radiation. The remaining five errors are classified as borderline cases, situated within the transition zone between values that are within and outside the specified range. Although they exhibit a smooth behavior, they were classified as catastrophic. However, this category of error is the least critical as it would lead to more conservative system building.
This result demonstrates the classifier’s high capacity to correctly assign parts to their group in most cases. Specifically, this study demonstrated a high degree of reliability within the “No Failure” group. In contrast, for the “Catastrophic Failure” set, the algorithm demonstrates a notably elevated failure rate. Regarding the metrics, the overall accuracy rate is 89.1 %, suggesting that classification based on the INL value is quite good a priori. However, due to data imbalance in both sets, the prediction is unreliable precisely in the most critical cases. For the true catastrophic failure group, the prediction accuracy drops to 28.6 %.This result indicates that, in the case of AD574, the use of the APEP method appears to be inadequate without modifications.
3.4. Optimization and Extension on of the Methodology APEP
Once the APEP methodology has been validated in its original configuration on the AD574 dataset, this section proposes a series of improvements designed to expand its predictive capacity through a multivariable approach. In particular, additional electrical parameters measured at 0 krad are incorporated into the analysis. To support this new strategy, t-Distributed Stochastic Neighbour Embedding (t-SNE) [
16,
17] is used to investigate the information contained in the devices’ multiple electrical parameters.
The premise of this analysis is that other electrical parameters measured at zero dose may contain valuable information for identifying those parts with a potentially catastrophic response. In other words, this study will utilize all available information at 0 krad, rather than relying solely on the INL classification.
This new approach arises from the idea that characterizing a component by measuring its electrical parameters is significantly cheaper and quicker than conducting irradiation tests. Therefore, taking advantage of this routinely obtained information can substantially improve the APEP method’s predictive capacity without increasing the necessary experimental resources, and with relatively little effort compared to the benefits that can be obtained.
3.4.1. Extended Matrix for Multivariable Analysis
A data matrix is first constructed, with the aim of predicting device degradation from a 0 krad measurement, in accordance with the APEP methodology [
9]. Although there are methods capable of handling missing data, they are beyond the scope of this study. Consequently, the analysis was restricted to devices measured under identical biasing conditions, at a fixed and homogenized set of dose levels, and to parameters available in all reports. During the pre-processing stage, the resulting AD574 data matrix is extended for the 64 samples in 7 features: Reference Voltage Output (VREF), Integral Non-Linearity (INL), Negative Supply Current (IEE), Logic Supply Current (ILOG), Input Offset Current (VIO), Positive Supply Current (ICC), and Bipolar Zero Offset (BZ). This matrix is used to evaluate both the impact of increased feature dimensionality on the predictive performance of APEP using INL data only, as well as the applicability of dimensionality reduction techniques to ADCs.
3.4.2. Dimensionality Reduction and Multivariate Analysis
The LOOCV validation results presented in the previous section indicate that the current formulation of the APEP methodology does not exhibit satisfactory predictive performance for the ADCs. To address this limitation, the present study examines whether incorporating multiple electrical parameters could significantly improve the clustering capability of APEP, consequently enhancing its predictive power. This study aims to improve the characterization of the device by investigating the latent relationships that exist among these parameters.
We propose the hypothesis that the application of dimensionality reduction techniques in conjunction with multivariate analysis has the potential to improve the APEP method. This is based on the premise that the intrinsic correlations among electrical parameters in semiconductor devices allow dimensionality reduction methods to be used for data exploration and for revealing latent dependencies. The present study focuses on t-Distributed Stochastic Neighbour Embedding (t-SNE) [
16,
17], which is a non-linear dimensionality reduction method that preserves local neighbourhood relationships. This makes it well suited to identifying complex structures that are not captured by linear projections.
3.4.3. t-Distributed Stochastic Neighbour Embedding
This analysis explores the multidimensional feature space, using a technique that is better suited to complex device behavior.
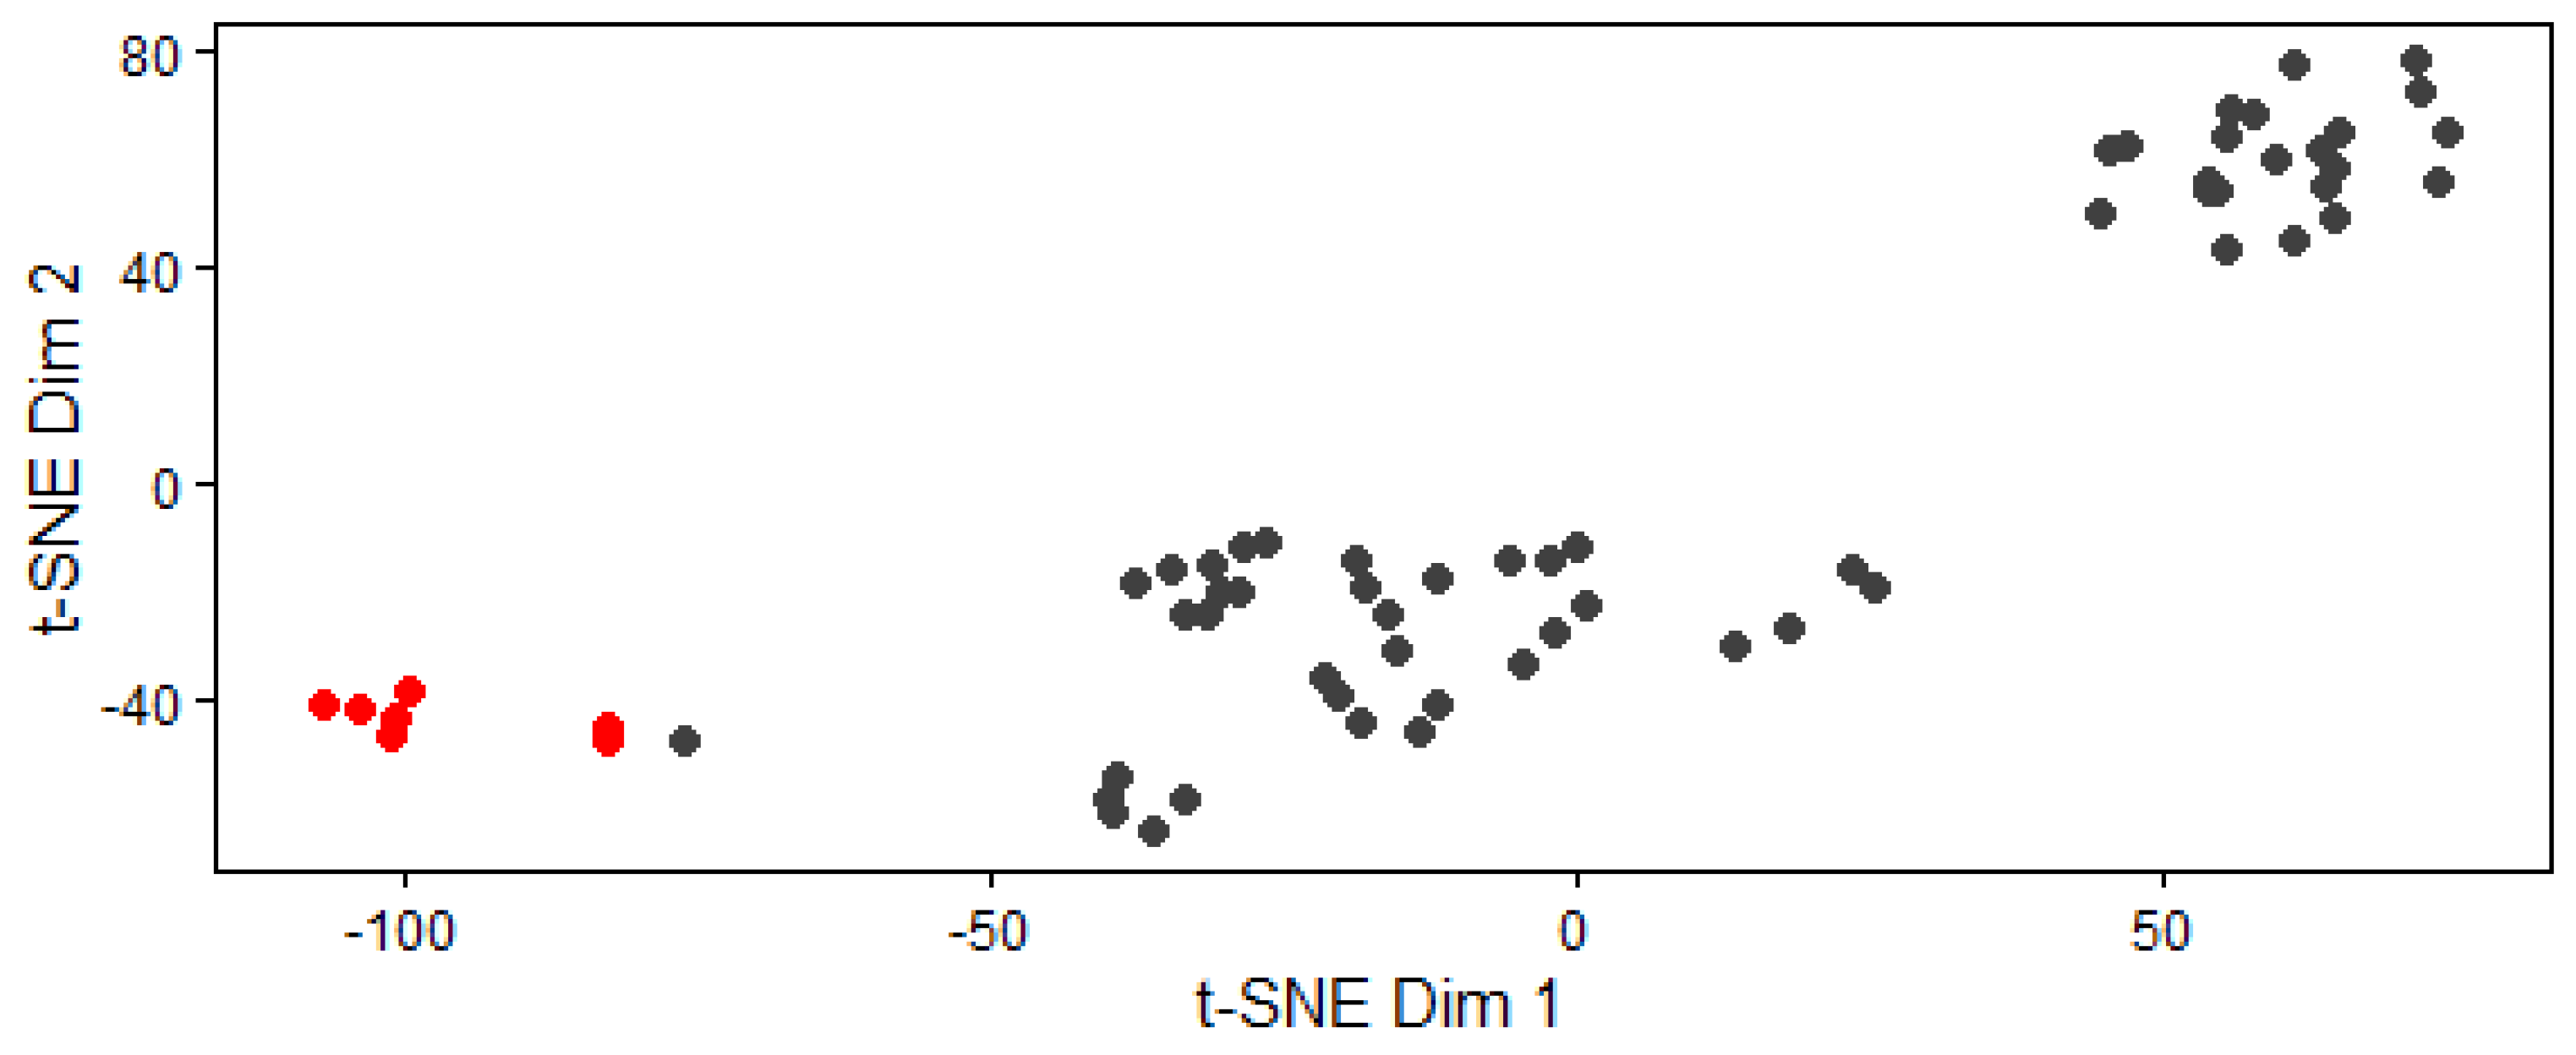
For this purpose, the t-Distributed Stochastic Neighbour Embedding (t-SNE) dimensionality reduction technique is employed, as it is extensively utilized for the visualization of complex structures in high-dimensional datasets. The t-SNE algorithm is applied to the 0 krad data, and we then represent the two-dimensional embeddings in
Figure 6, highlighting the two clusters defined by the k-means algorithm (i.e., the catastrophic and smooth INL evolutions). Several hyper parameters control the process of optimization of similarities, distances, and non-linear relationships:
Perplexity, which balances local and global structure preservation;
Learning rate, which controls convergence speed;
The maximum number of iterations;
The initialization strategy;
The early exaggeration factor.
Some overlap with samples that do not present catastrophic failure can be observed, but we can readily see that the samples with catastrophic degradation can be identified only from 0 krad measurements. Notice that these t-SNE representations were obtained using a perplexity value of eight. A range of other values were also tested; however, a value of eight was selected because it provided the most stable and consistent group configuration across runs. In this context, the term optimal is employed to denote empirical stability and consistency in cluster structure, as opposed to the formal optimization criterion. Specifically, this value was selected to avoid an artificial over-separation of samples while ensuring that there was minimal overlap between clearly differentiated groups.
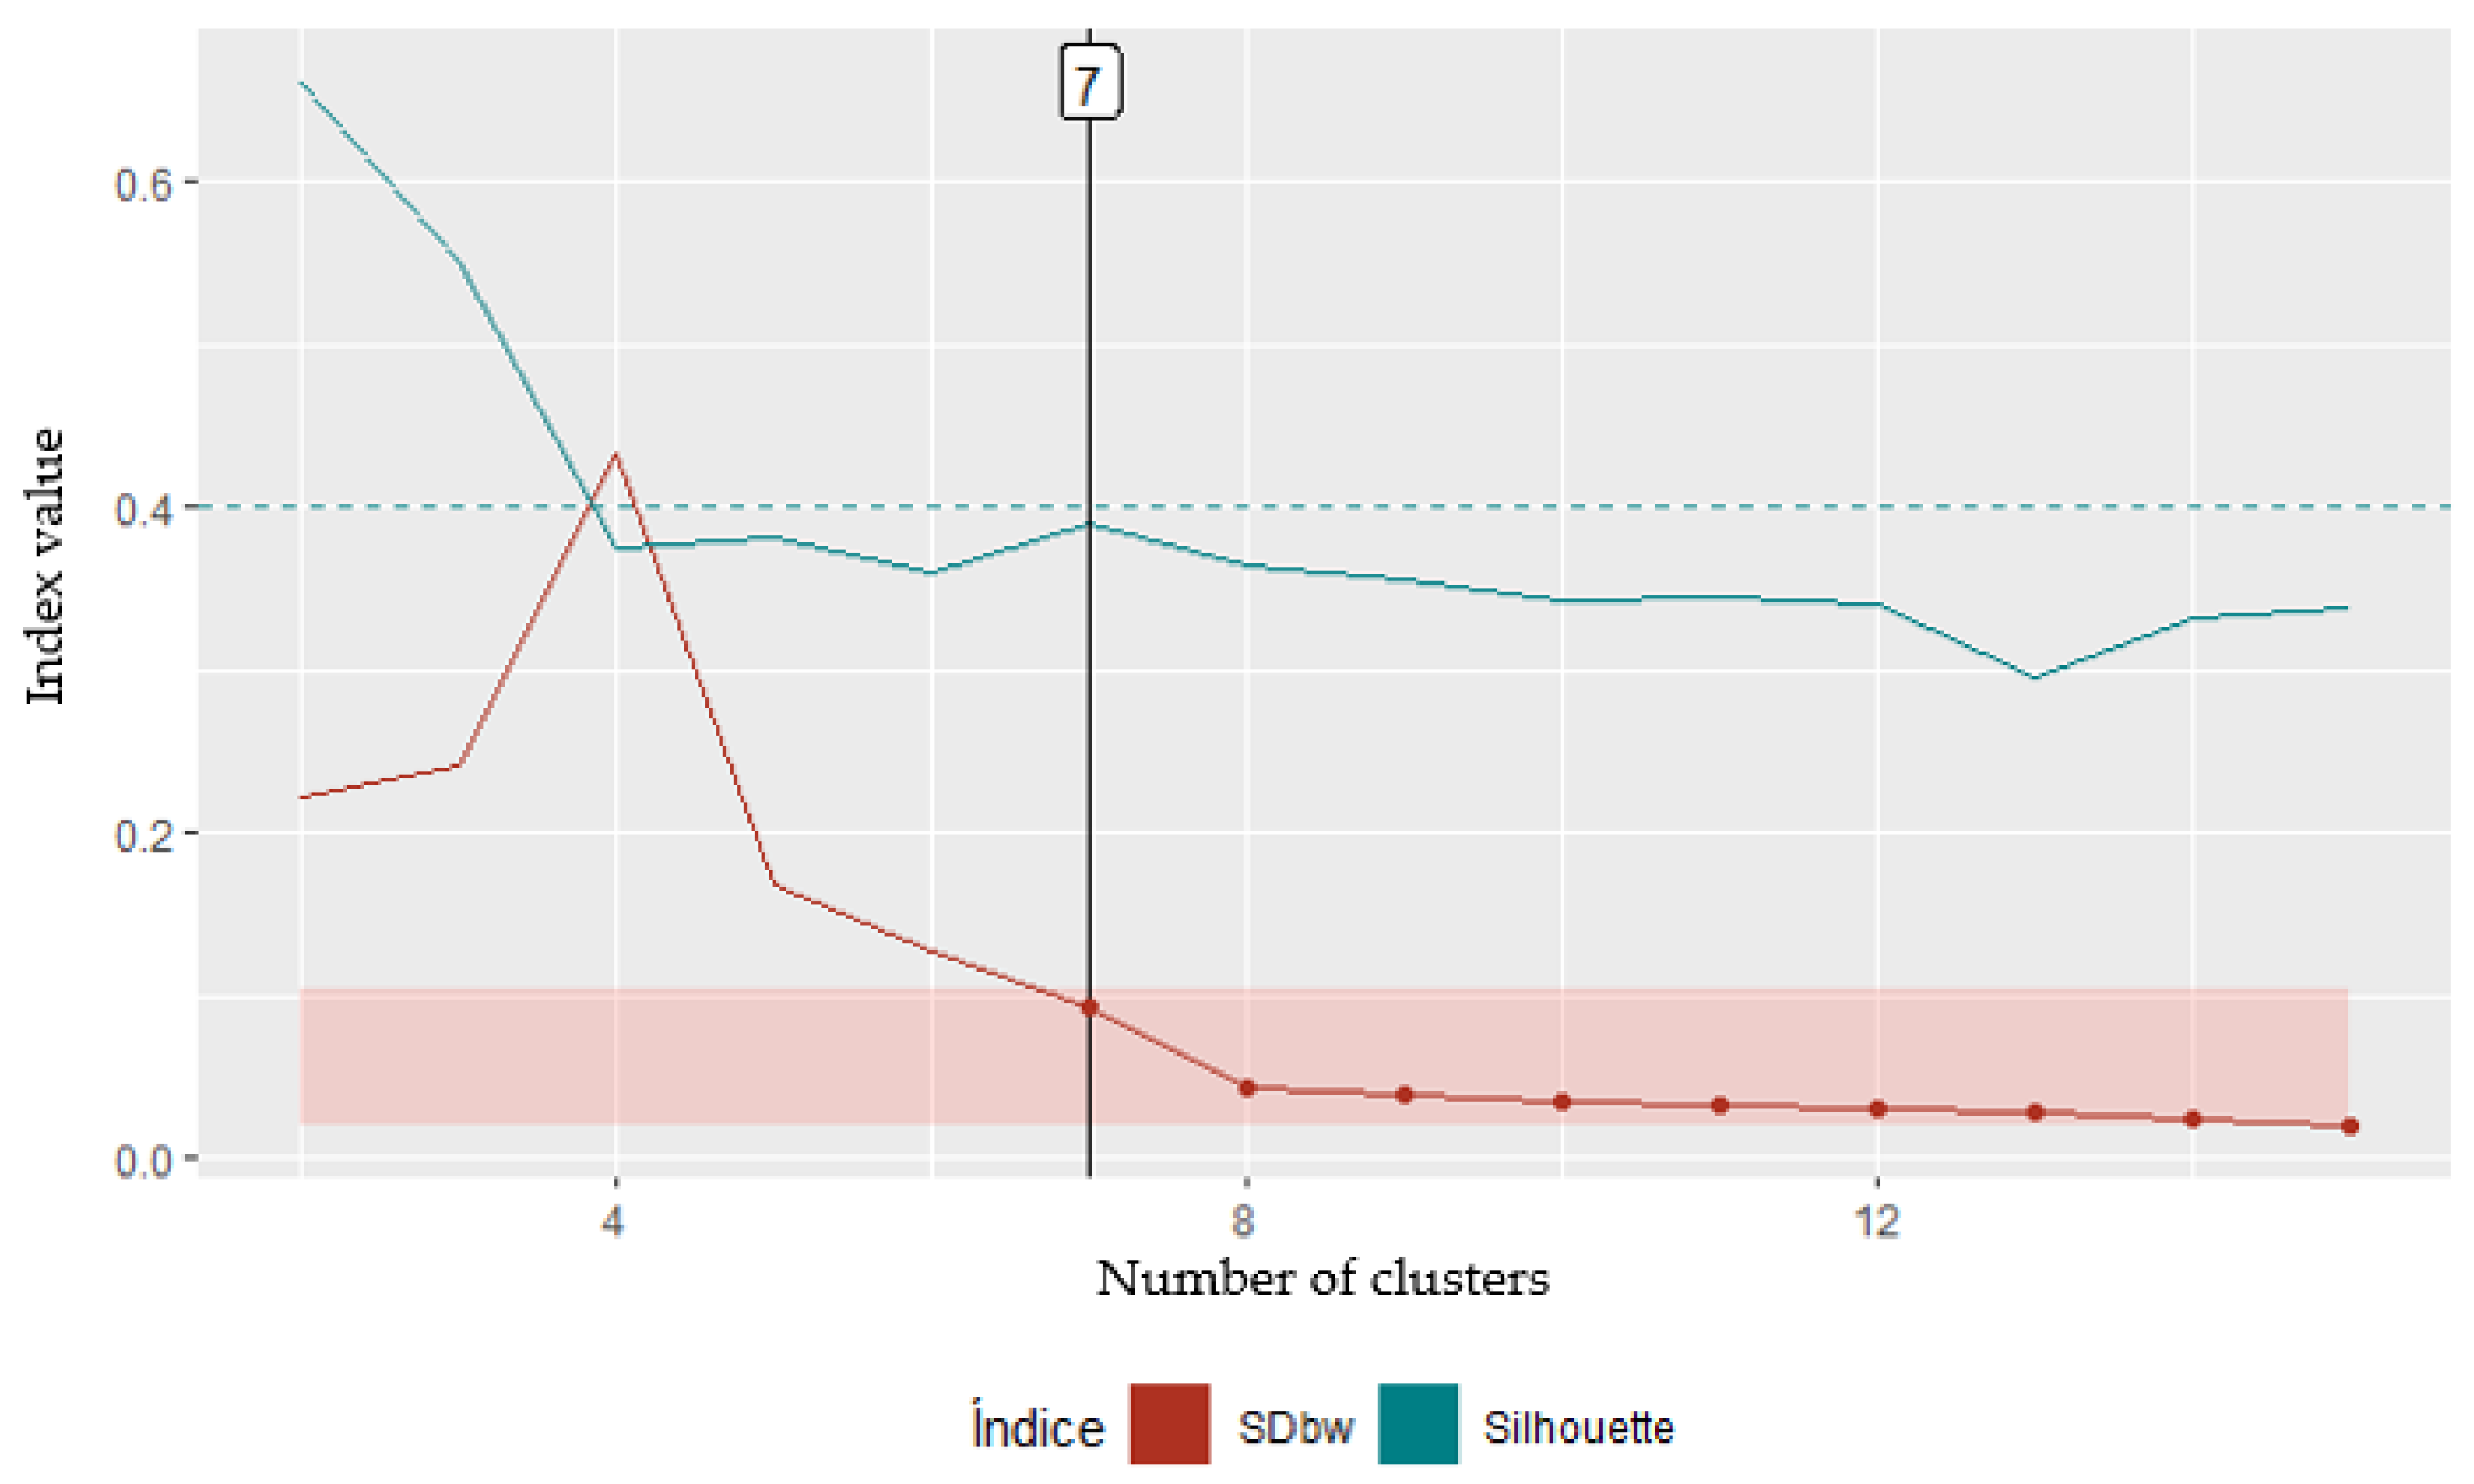
Following the approach adopted in APEP, we performed a further investigation into the potential for clustering on the three t-SNE components. The optimal number of clusters was calculated based on the S-Dbw index according to [
9].
Figure 7 illustrates the optimal number of groups, which is seven. Therefore, the analysis will proceed with seven clusters.
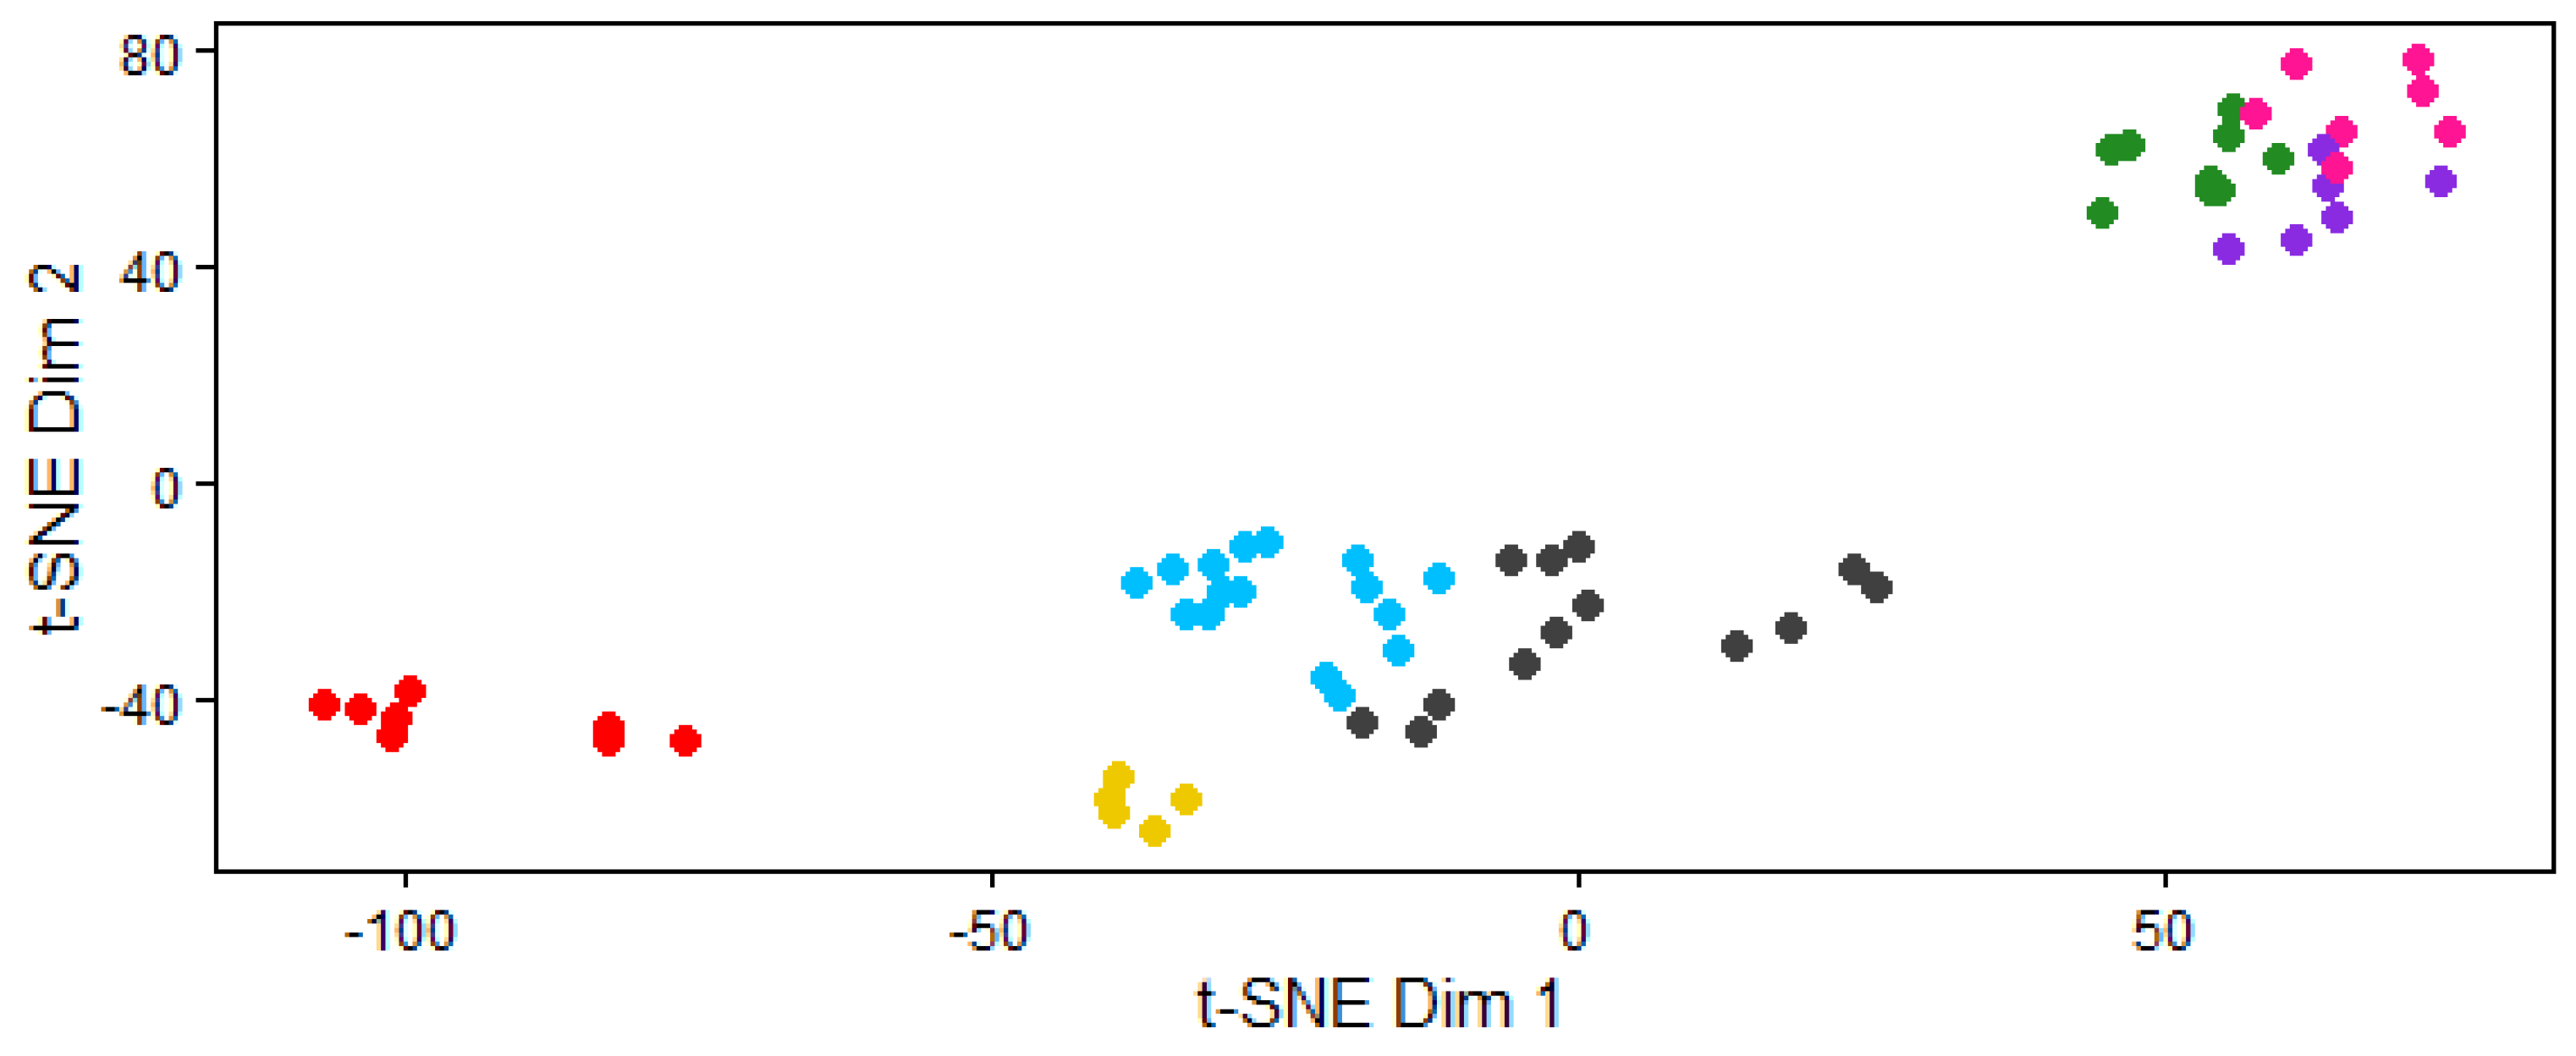
Following the analysis described above, the same two-dimensional t-SNE representation (see
Figure 6) is now colored according to the clusters obtained after applying the k-means clustering algorithm, using the optimal number of clusters determined using the S-Dbw index. Each point represents an individual AD574 where the color assignment now reflects the color of the cluster derived from the S-Dbw clustering.
As shown in the
Figure 8, the resulting partition reveals a highly similar organization of the data. The catastrophic failure samples are grouped together into one cluster (red), while the remaining samples, which exhibit progressive degradation of the INL parameter, are divided into six clusters. Although there is some overlap between the clusters, the coloring emphasizes the distinction between the catastrophic and non-catastrophic failure. And it is interesting to note that this unsupervised clustering operation is performed exclusively on 0 krad measurements. This, again, strongly suggests that we should be able to predict the nature of the INL behavior under TID.
3.4.4. Validation of Extension Using LOOCV
Following the evaluation of the power of APEP using INL values only at 0 krad, the validation process is now repeated on the expanded matrix that incorporates all electrical parameters that are common to AD574 reports, which were listed previously.
Although the clustering operation based on the first two components of the t-SNE (see
Figure 8) appears useful as a classifier, where a new sample is associated with the cluster whose centroid is closest in that space, a supervised classifier is preferred in the hope of achieving further accuracy improvements. Specifically, a perceptron-type classifier was trained using all the features at 0 krad, with the progressive degradation with TID.
The same validation scheme is employed, and, given the previous classification, the Leave-One-Out Cross Validation (LOOCV) method is utilized once again. The results are presented as a confusion matrix in
Table 2. The classifier correctly identifies fifty-six samples as ”Not Failure” and seven as ”Catastrophic Failure”, with only one misclassified sample. This indicates that the classifier, which was trained using all the data available at 0 krad, achieved high accuracy and suggests that the pre-irradiation electrical measurements contain sufficient information for classifying the behavior under TID.
In order to evaluate robustness under class imbalance, additional metrics were computed for the multidimensional classifier. The sensitivity (recall) for the catastrophic class reached 100%, while specificity for the non-failure class was 98.2%. The corresponding F1 score for the catastrophic class was 0.93, and the balanced accuracy was 99.1%. These results demonstrate that the multivariable extension not only improves overall accuracy but also effectively mitigates the bias typically induced by imbalanced datasets, ensuring reliable identification of the minority catastrophic class.
Additionally, the exhaustive exploration of signature subsets yielded an important result.
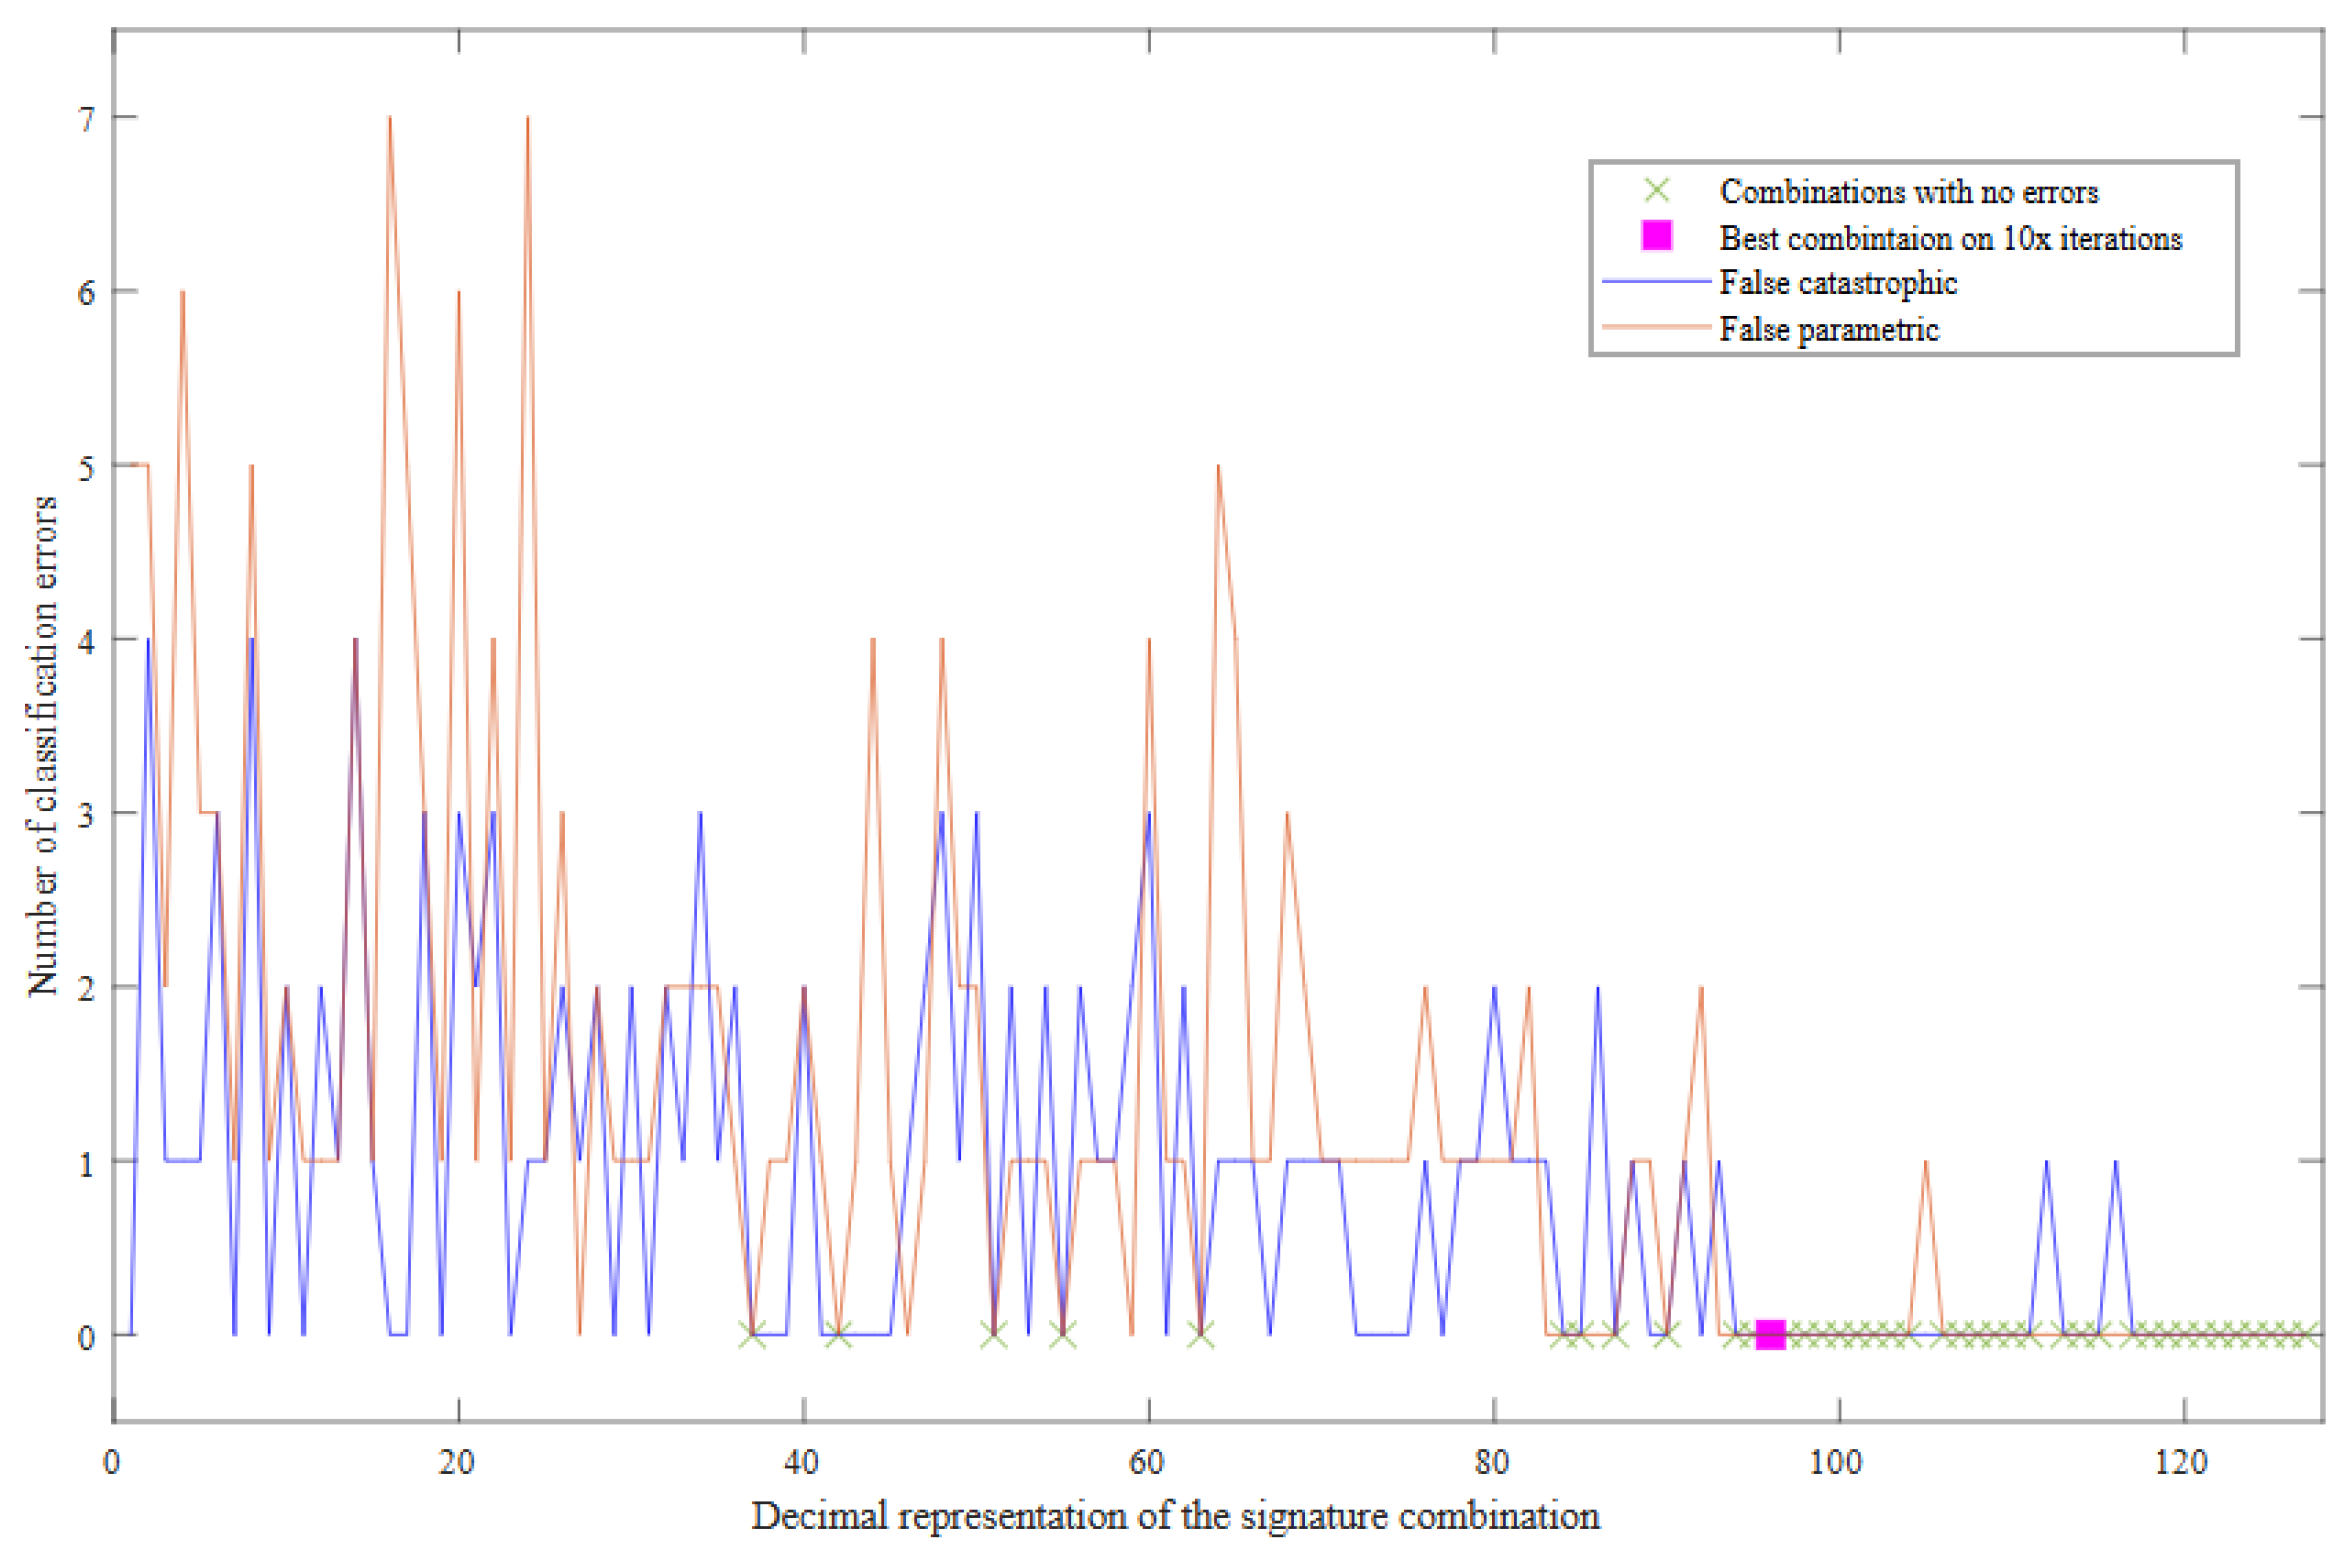
Figure 9 shows the number of classification errors obtained for each feature subset as evaluated over multiple training iterations with random sample assignments. The results indicate that a small subset composed of only two parameters (VREF and VIO measured at 0 krad) is sufficient to achieve perfect classification in most repetitions. With randomly assigned training samples, only one false catastrophic error was observed over 20 repetitions. This phenomenon demonstrates the strong latent relationship between the two parameters and their ability to distinguish between non-failure and catastrophic failure samples.
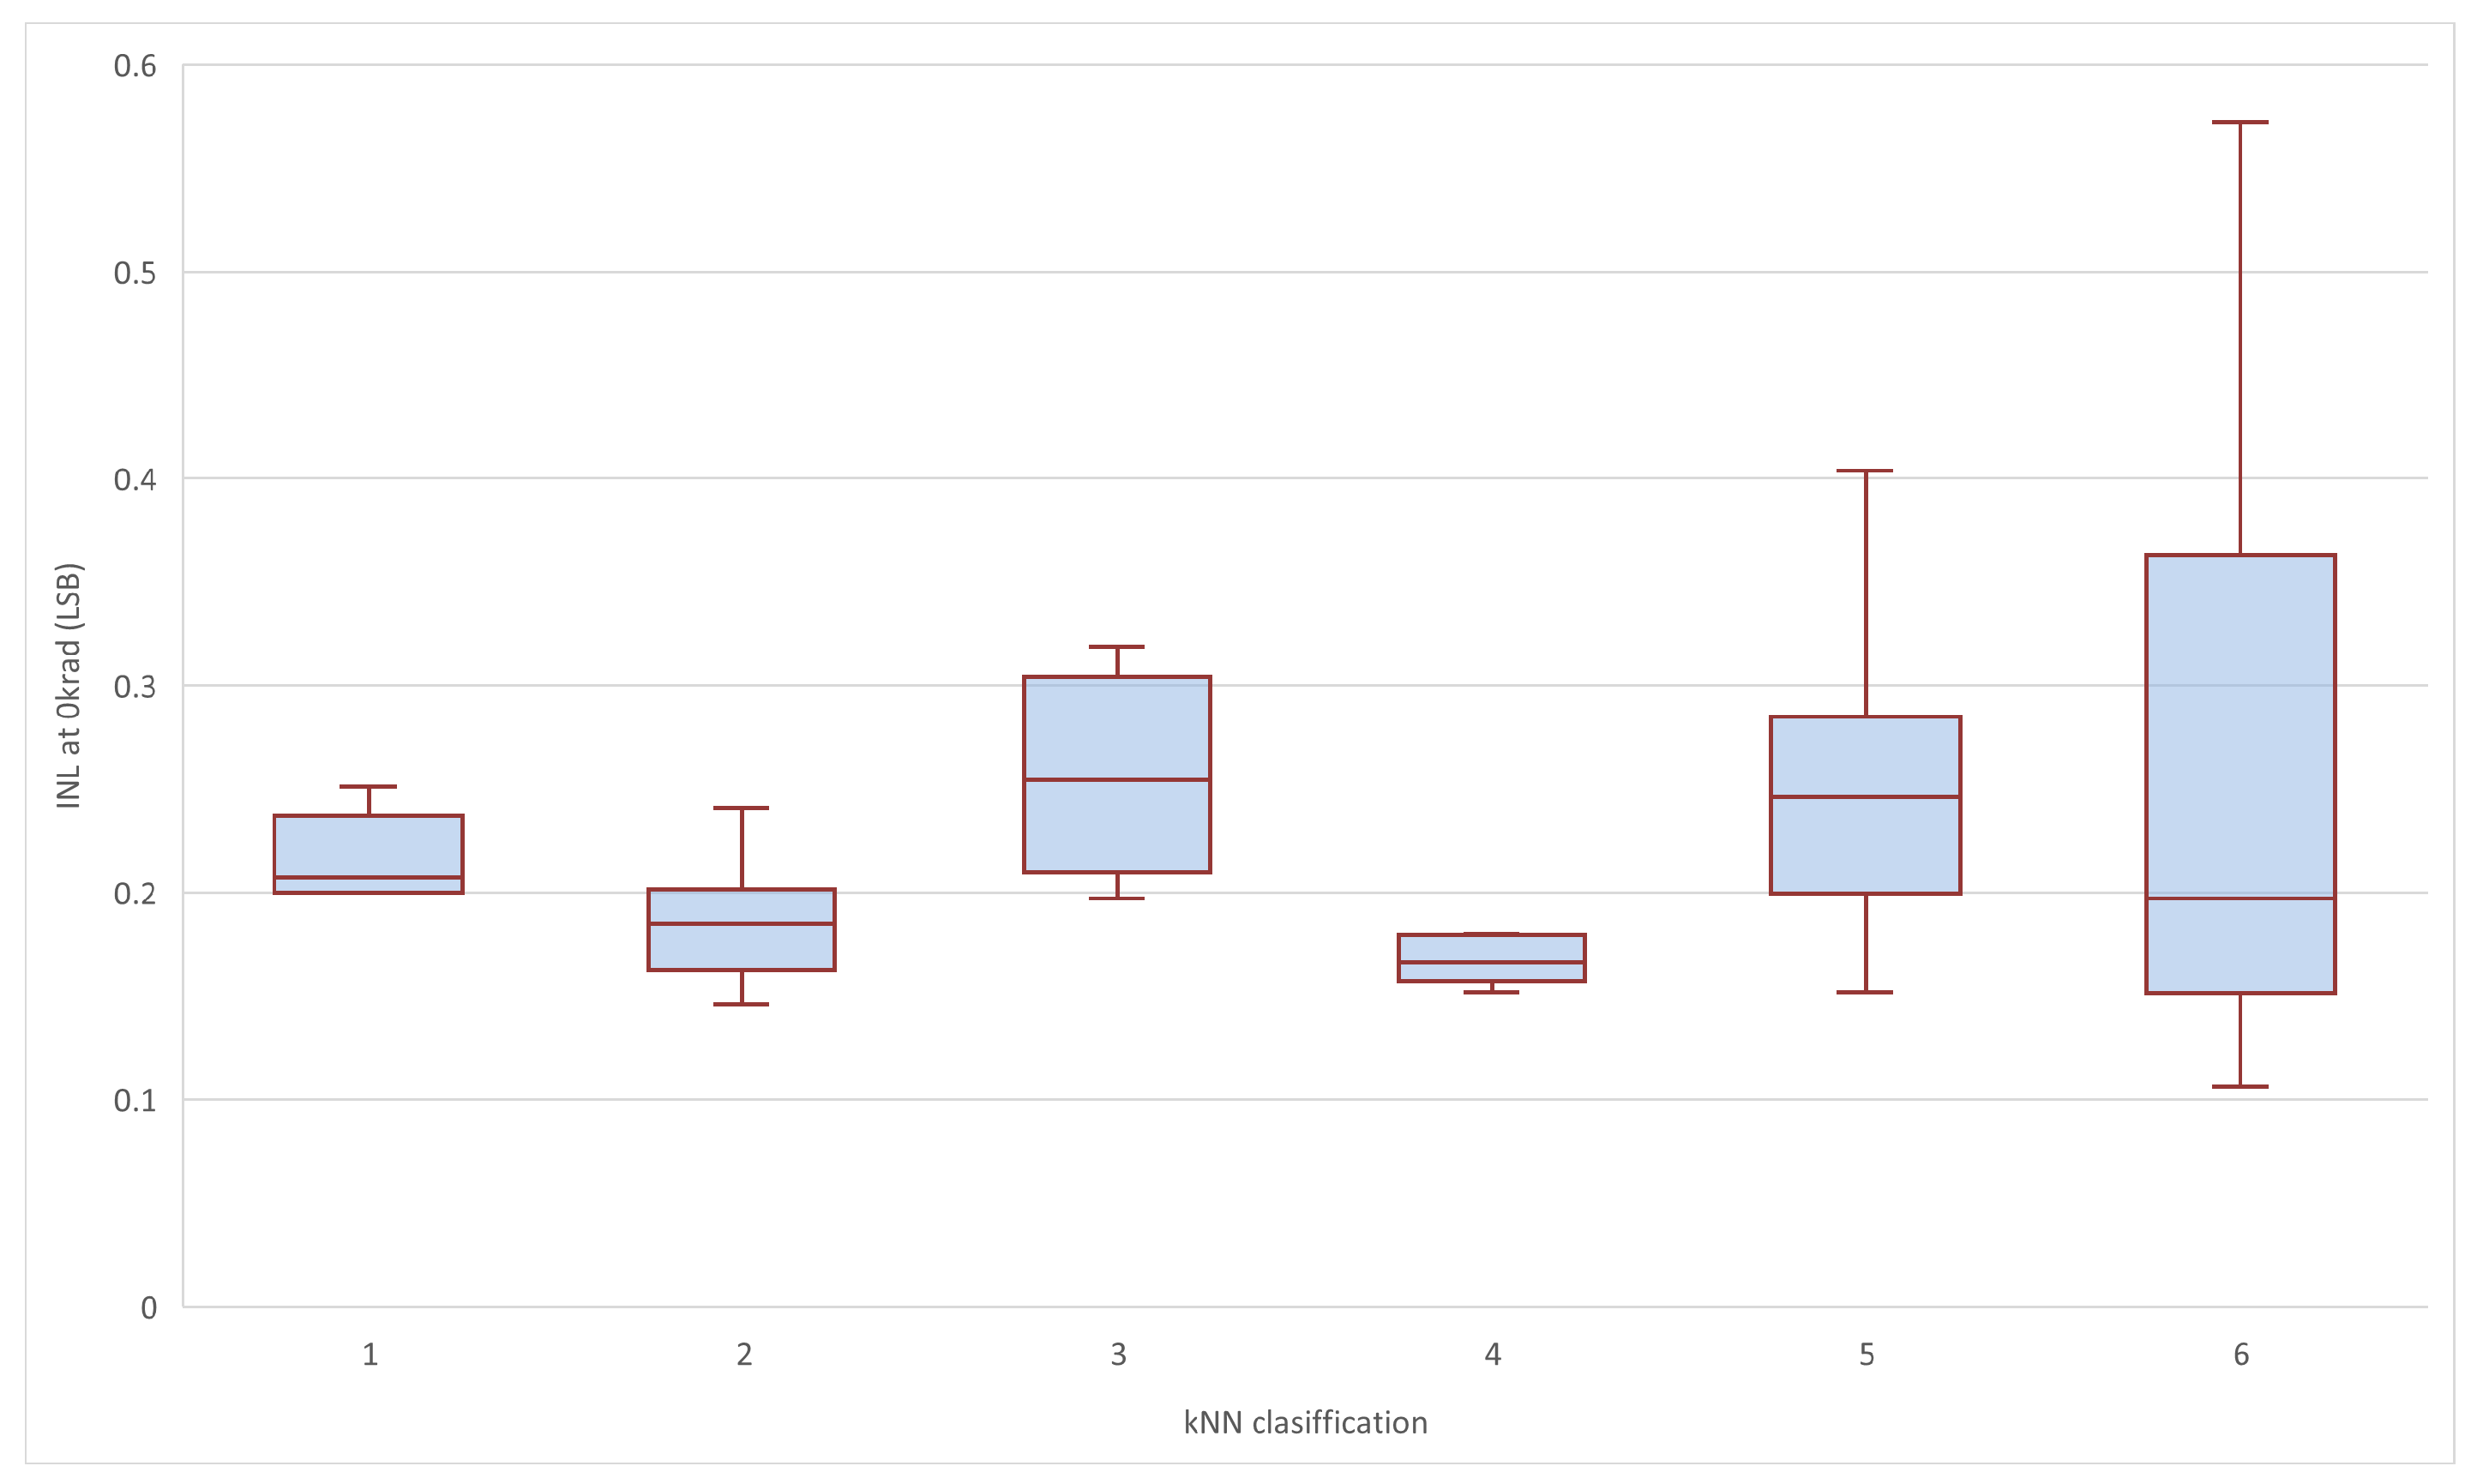
The boxplot in
Figure 10 corroborates the new clustering results, confirming the existence of a relationship between the features used to detect patterns and providing an initial validation of the clustering approach. In this new analysis, the progressive variation in median values and interquartile ranges among the six groups seems to suggest an apparently structured distribution. This behavior supports the consistency of the grouping within the previously defined class. In view of the results, a separation between clusters can be observed, which supports a more accurate partitioning of the dataset.
4. Discussion
The main objective of this study was to evaluate the ability of the Advanced Predictor of Electrical Parameters (APEP) method to predict or, at least, estimate radiation-induced degradation using pre-irradiation electrical data. This methodology is applied for the first time to mixed-signal devices, specifically, analog-to-digital converters, using historical data from the PRECEDER database. This allows the APEP method to be evaluated in more complex architectures, demonstrating its potential as a complement to irradiation testing.
The principal limitation of this study lies in the reduced number of available radiation reports. In this context, the strict data homogenization previously used in the APEP method would significantly reduce the dataset and compromise the analysis. The mixed-signal nature of ADCs introduces additional challenges compared to purely analog devices.
In particular, some parameters exhibit threshold-driven behavior rather than progressive degradation. For the AD574, the INL parameter remains stable up to a critical dose, after which sudden blow-up effects occur. A key contribution of this work is the extension of APEP from a univariate to a multidimensional approach. While the original methodology relied on a single parameter, the proposed framework incorporates multiple electrical parameters measured at 0 krad. The costs of including more measurements of different parameters before the irradiation test are lower than the costs of performing an irradiation test. Also, we suggest that the possibility of incorporating manufacturing process data, such as foundry, wafer numbers, manufacturing monitoring system data, among others, could increase the predictive power.
Using the APEP method, we could separate the samples in clusters that distinguish the samples exhibiting catastrophic behavior (INL blowup) from those that exhibit a steady and reasonable degradation. With the multivariate extension, we are able to accurately predict which cluster belongs to a new sample, based solely on measurements at 0 krad. A further improvement would consist in predicting the actual TID degradation pattern. However, the prediction of the INL as a function of TID is not possible for catastrophic failure samples. Indeed, for such a blowup behavior, which reports INL values reaching hundreds of LSBs, the INL measurement may not correspond to the reality of the ADC transfer function. Indeed, the INL is mostly evaluated through the histogram method, and one of the premises is that the transfer function is monotonic. Under a catastrophic failure, this may very well not be the case.
On the other hand, for the cases where the degradation of INL is progressive, it is possible to develop and validate a linear regression model to predict the INL as a function of the Total Ionizing Dose. Each sample is fitted with a linear model to estimate the slope of this relationship between INL and TID. Then, again with a LOOCV approach, we train a perceptron model to predict the slope of the TID degradation from the 0 krad parameter. The origin value is readily available since the INL is also measured at 0 krad.
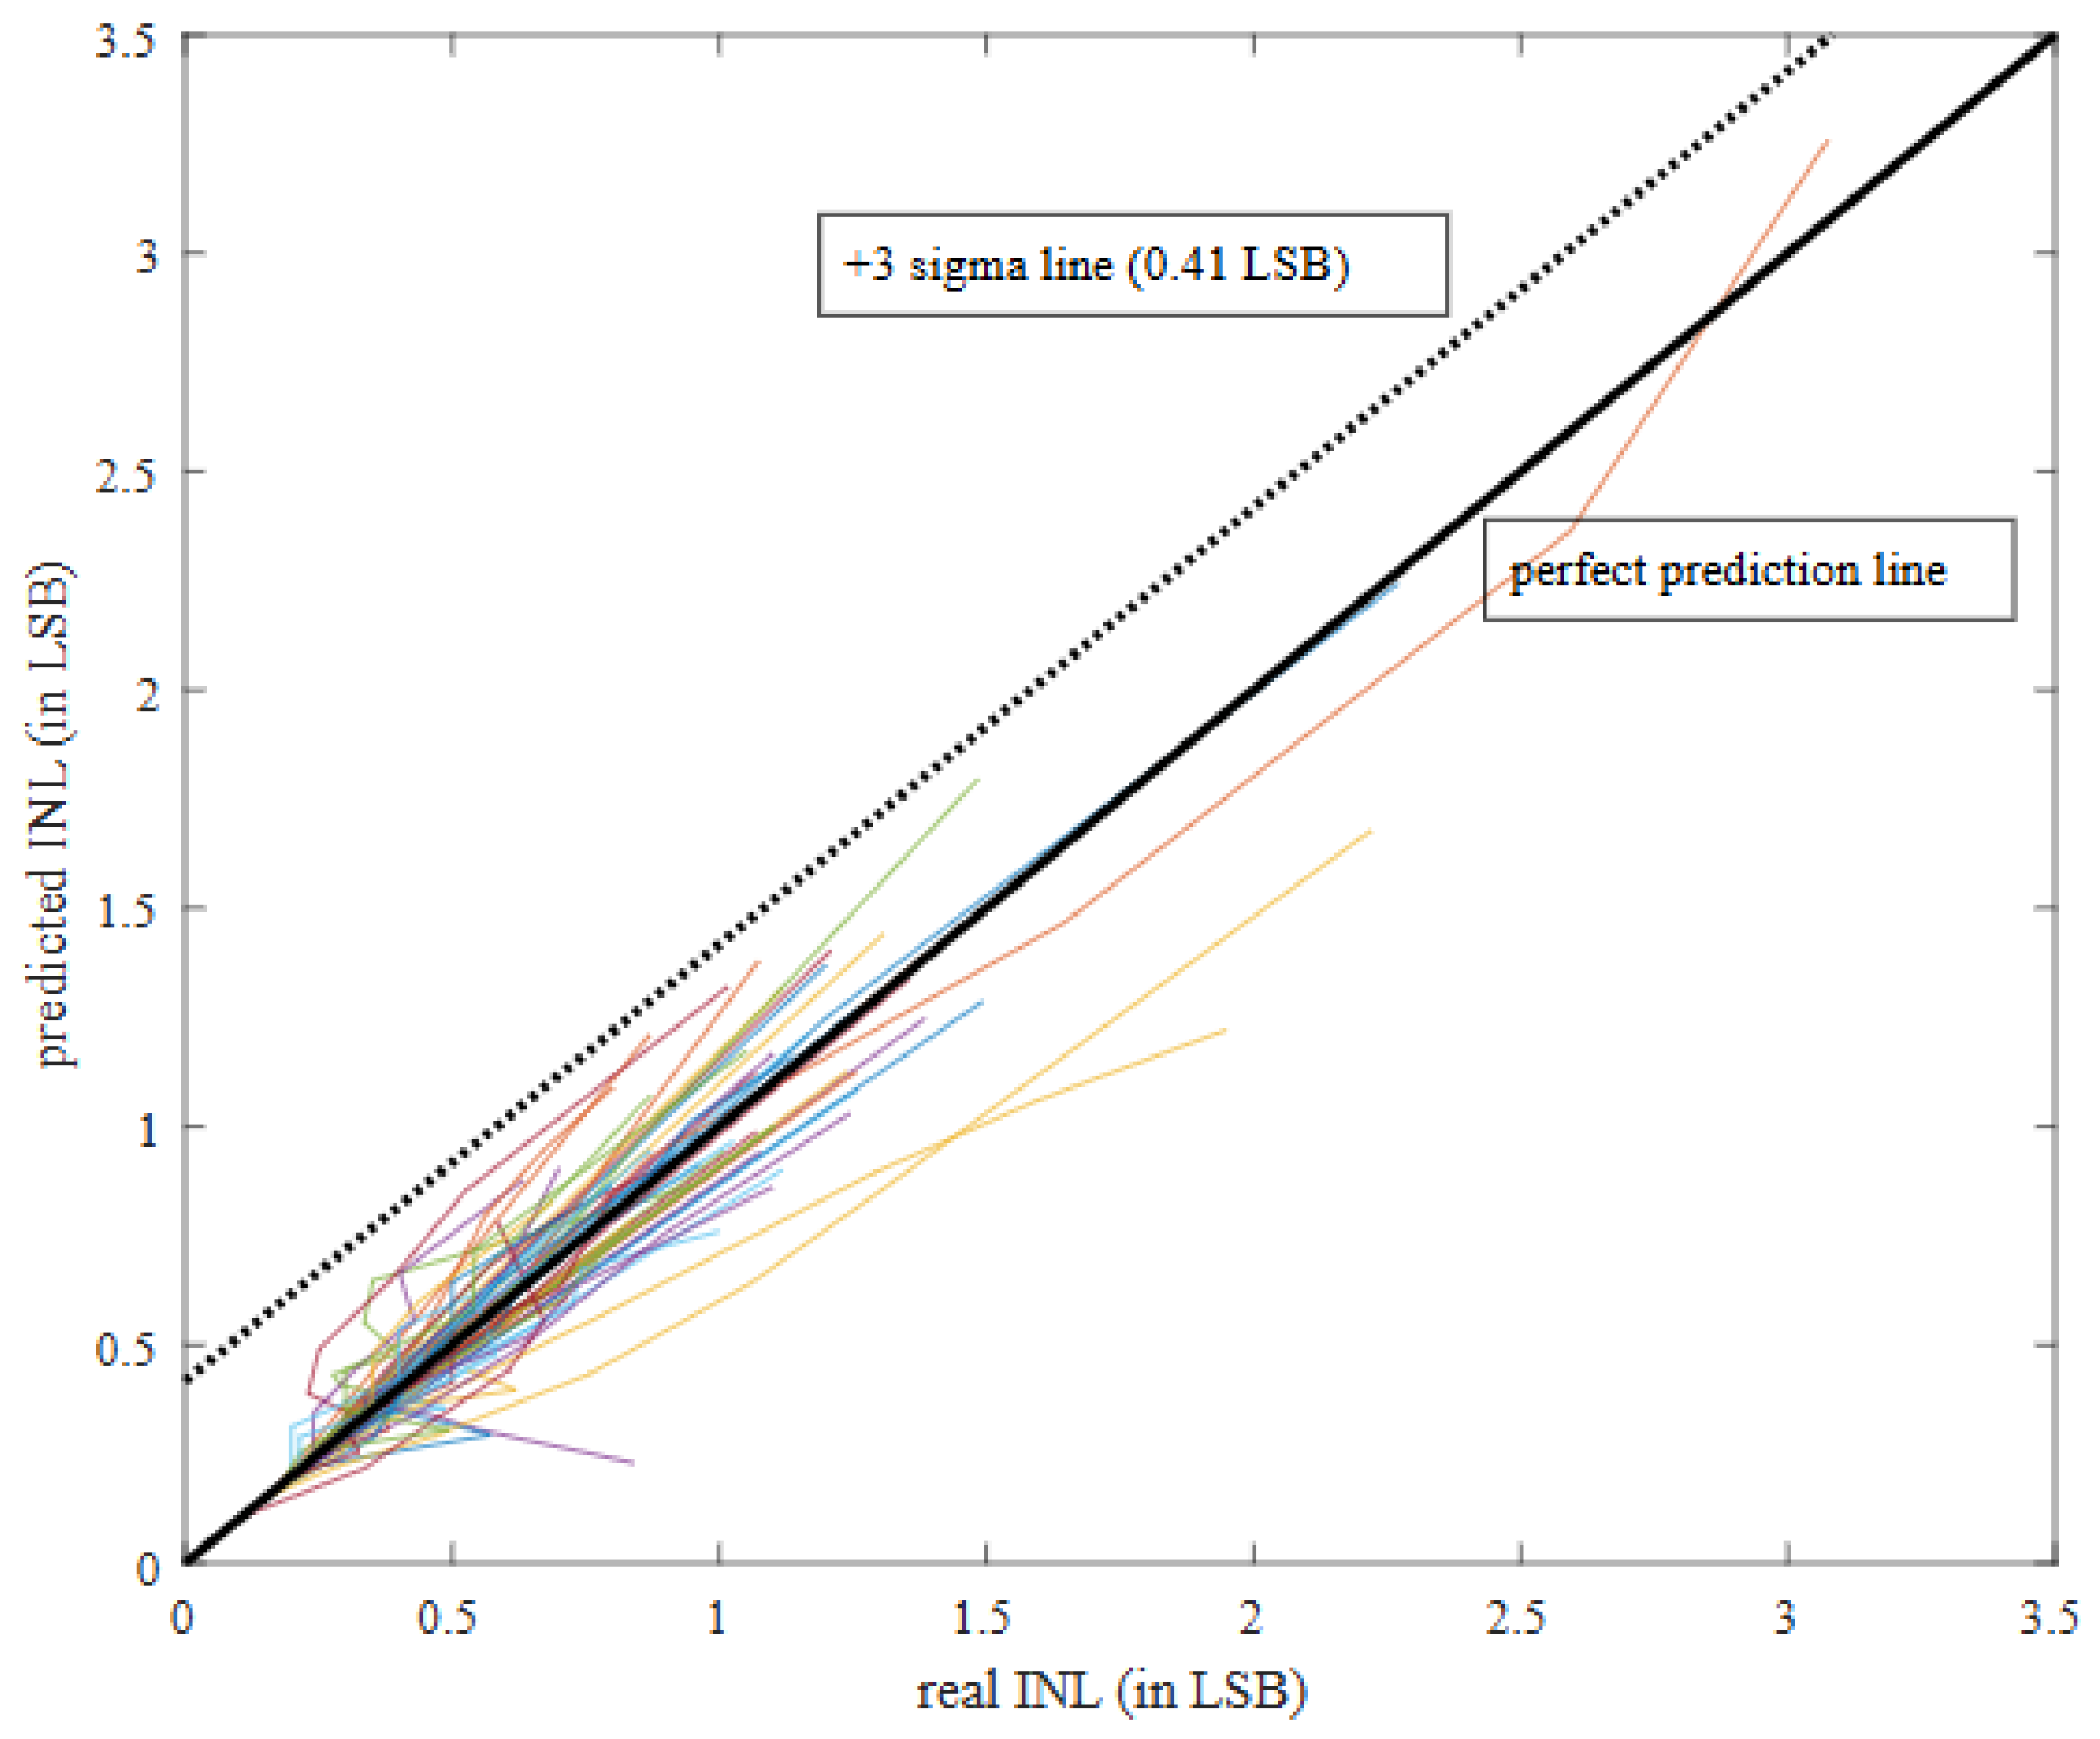
Figure 11 shows the representation of the INL prediction versus the real INL values. Each colored line correponds to one ADC across its INL degradation pattern. Notice that for this prediction, we used the INL values from the original reports, without any sort of interpolation. Clearly, adding 0.41 LSB (three times the RMS error of the prediction, corresponding to the typical three sigma margin) always causes the predicted INL values to exceeded the actual INL values. This result provides a conservative estimate of the expected INL, ensuring a safety margin when making decisions about rejecting a sample based on predicted functionality.
When applying the methodology to the clustering analysis, the difference between the relative slope of each sample and that of its assigned cluster was evaluated. This comparison quantifies the displacement between the predicted and real trend degradation, confirming the accuracy of the model. Based on this analysis, a threshold value of 0.01 was established to classify the accuracy of the clustering process. Many of the samples showed minimal displacement, indicating a high degree of consistency between the cluster model and the behavior of individual devices. Only a small fraction showed significant deviation; the mean deviation obtained was 0.9%.
While the utilization of global error metrics facilitates the quantification of predictive performance, individual device analysis is employed to obtain a more detailed evaluation of the cluster-based model’s capacity to reproduce the observed dose degradation trends, i.e., the evolution of a parameter as function of dose. This comparison illustrates the practical implications of the methodology at the device level.
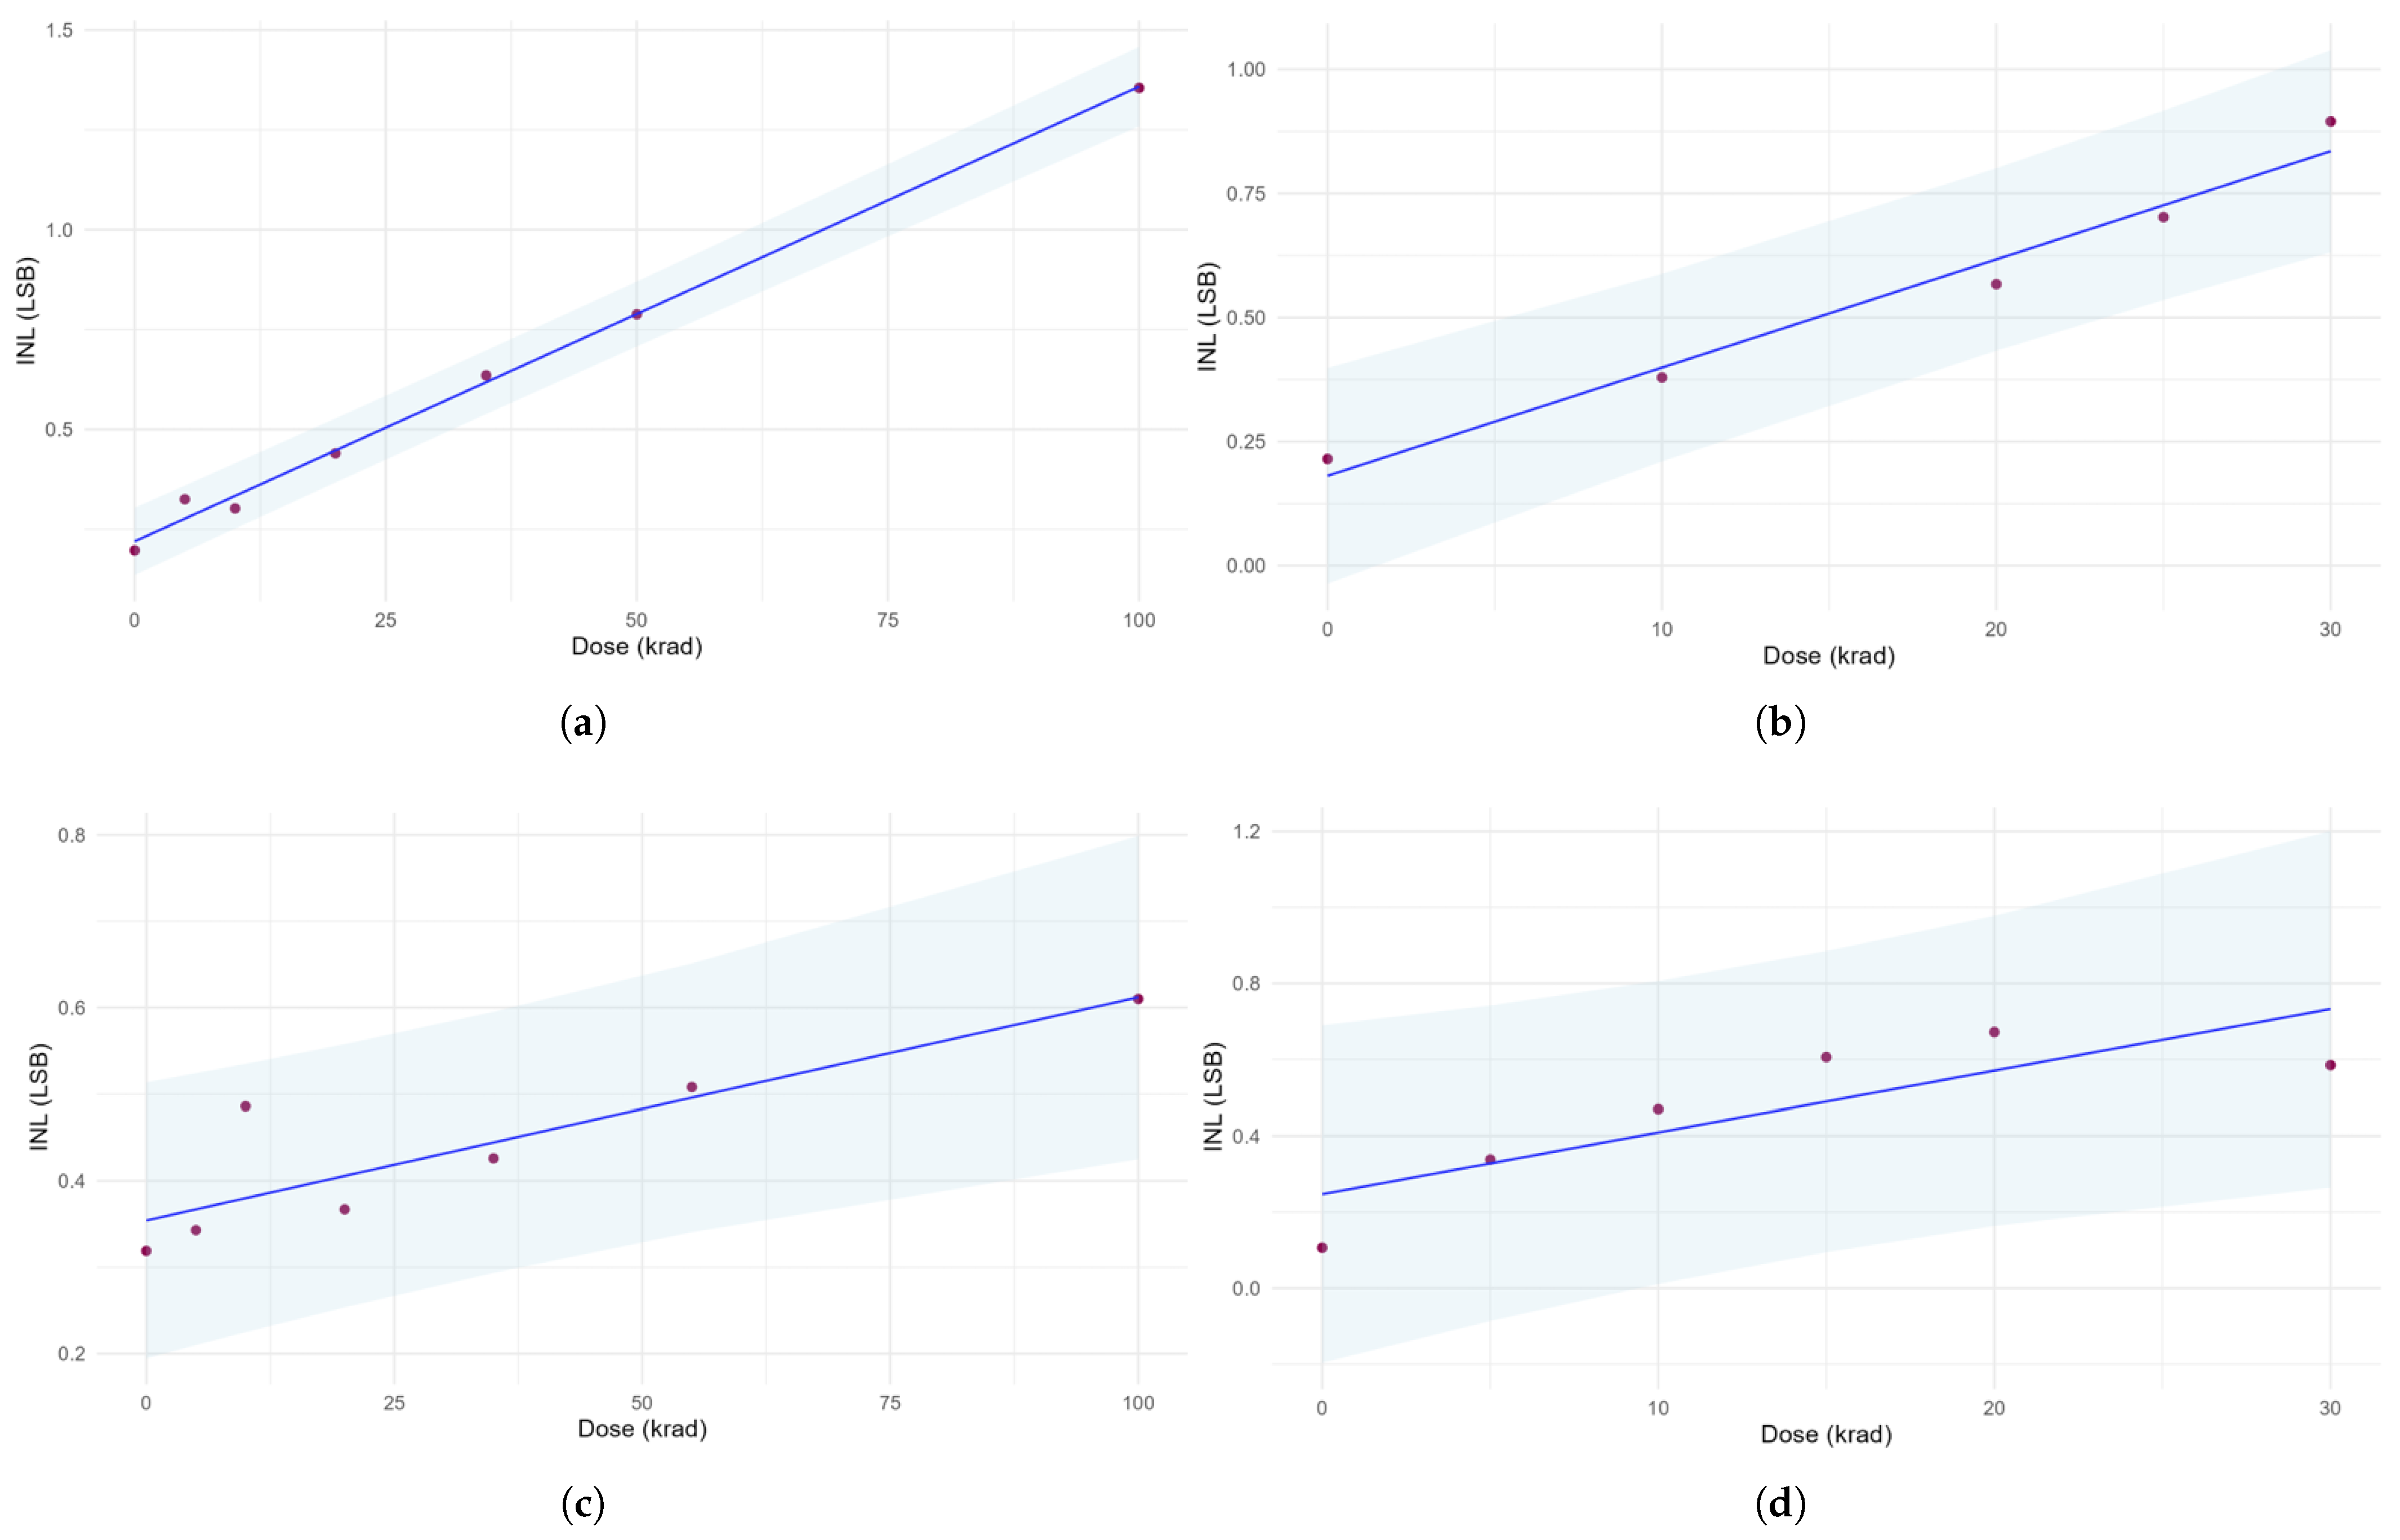
Figure 12 illustrates the evolution of the INL for four different samples, alongside the calculated model’s slope for the assigned cluster (without taking that sample into account) and the uncertainty bands. The uncertainty bands show the model’s 95.5 % confidence interval at each dose. The close agreement between the INL trends measured in reality and those of the cluster further confirms the robustness and validity of the proposed clustering approach.
The main improvement is achieved through a supervised classification stage in which a perceptron-based neural network is trained using the multidimensional pre-irradiation feature space. Leave-One-Out Cross-Validation shows a clear improvement over the original approach, with only one misclassification out of sixty-four samples. These results suggest that pre-irradiation electrical measurements provide relevant information about radiation response.
Although the supervised classifier achieves a very low error rate, analyzing the distribution of samples in the feature space provides additional information about the latent relationships between different features. In particular, reduction techniques help interpret the role of interactions between features in this case.
However, when the catastrophic and non-catastrophic failure groups are expressed in the space defined by the two features, the separation between them is not evident; for that reason, dimensionality reduction techniques are a useful tool to distinguish these behaviors. The t-SNE analysis reveals non-linear structures that improve cluster separation and is a valuable tool for visualizing complex dependency structures. This analysis confirms the importance of a multidimensional representation and reinforces the potential of the proposed methodology.
Overall, this work expands the scope of APEP to include mixed-signal devices and highlights necessary adaptations when dealing with complex degradation mechanisms. The proposed approach shows a practical tool for early-stage component selection in space applications and provides a solid basis for future developments combining radiation testing and machine learning techniques.