1. Introduction
Biosensors are electrochemical devices that translate biochemical reactions into electrical signals, enabling real-time monitoring of biological processes. They are used in applications such as glucose monitoring in diabetic patients, checking enzyme levels in cancer patients, drug efficacy trials, tracking fermentation processes, detecting artificial sweeteners in food and drink, and monitoring cell viability in cell culture experimentation [
1]. Due to printed biosensors relying on surface interactions, they are highly sensitive to contamination or fouling during operation and are therefore commonly disposed of after one use, resulting in the release of harmful and hazardous materials into the environment.
Electrochemical sensors commonly comprise three electrodes: (i) working electrode (WE) where the electrochemical reaction of interest occurs; (ii) reference electrode (RE), which provides a stable and known potential to act as a reference (if required); and (iii) counter electrode (CE) to complete the circuit [
2]. Silver, gold or carbon are often used for the WE and CE [
3], where gold provides a chemically inert surface with efficient electron transfer, and carbon offers a low-cost option with a wide potential window [
4,
5].
Silver and gold mining practices are highly environmentally damaging due to the leaching of toxic chemicals (i.e., cyanide and mercury), loss of biodiversity, and greenhouse gas emissions [
6]. Furthermore, the release of these resources to the environment via electronic waste results in the loss of valuable and finite resources, with silver release specifically reducing microbial soil populations, inhibiting enzyme activity, and disrupting plant growth [
7]. Carbon is often suggested as a promising alternative to noble metals, owing to its comparatively lower carbon footprint [
8]; however, it is often an unfeasible replacement due to carbon’s lower conductivity, which reduces device sensitivity [
9]. In addition to environmental concerns, silver and gold are greatly affected by both global instability [
10] and the increasing demand for electronic and energy harvesting devices [
11]. This is reflected in the price of silver and gold, which has increased by 49.8% and 46.2%, respectively, over the last year alone [
12,
13]. This further highlights the need and potential economic benefits for increased recovery and recycling of silver and gold.
Circularity is increasingly important in printed electronics, driven by concerns over resource use, e-waste, and EU regulation [
14]. Some exploration of silver ink recovery is evident, where enzymatic methods have been reported for silver recollection to achieve 96% silver purity [
15] and the use of silver flakes with enhanced magnetic properties has allowed magnetic separation [
16]. No mention of gold ink recovery was identified. Other metals have been explored such as stainless steel, where an interesting approach of using scrap steal chips which were reprocessed and used to create strain sensors [
17]. For mixed electronic waste, pyrometallurgical, hydrometallurgical, and bio-metallurgical methods are being actively explored for separation of high-purity metal salts from chemically complex mixtures [
18,
19], which are precursors for metallic particles and flakes. While these processes offer effective routes to separation and recovery of high-value materials, they are often convoluted, requiring the use of hazardous chemicals and high operating temperatures, ultimately facing significant economic limitations [
20]. This challenge is further exacerbated by the low recycling rate of electronic devices, which reached an average of 37.5% in 2023 across the EU, significantly lower than the 65% target [
21]. This may offer a partial explanation for the continued shortfall in recycling outputs relative to the growing demand for silver and gold [
22].
Several papers report the development of lower-environmental-impact biosensors by using recycled fossil-based polymers (e.g., polyester terephthalate (PET) and polyimides) and carbon-based reinforcements (e.g., graphene) [
23,
24]. However, to address the environmental limitations of those substrates, attention has shifted toward bio-based and recyclable alternatives, like polylactic acid (PLA), offering significantly reduced greenhouse gas emissions when compared with PET [
25]. Alternative solutions to PET or PLA substrates could be fully biodegradable materials such as paper-based substrates [
26], cellulose [
27], or gelatin-based materials [
28]. However, each of these offers an imperfect solution, whether it be the poor thermal and mechanical stability of gelatin or the porosity of paper-based substrates, properties that limit print definition and curing temperature (i.e., 80–120 °C).
Additive manufacturing (AM) is often discussed as a more sustainable route to manufacturing due to the nature of depositing only the material that is required and through producing mesh patterns to achieve sufficient percolation with less material [
29]. Much of the literature surrounding this area explores ink and thermoplastic formulations, mainly focussing on carbon, where high-resistivity active materials cannot rival gold [
30,
31]. Gold AM sensors have been developed using electrohydrodynamic printing to control microstructure topography and sputter coating onto plastic 3D printed electrodes to minimise gold usage [
32,
33]. These novel manufacturing approaches provide interesting approaches to rapid prototyping and cost saving; however, less focus is placed on integration with current manufacturing lines and scalability. Screen printing is commonly used in industry to manufacture printed biosensors, as it offers high throughput and reproducibility [
34]. Though this print method results in minimal waste, the small volumes of material lost can become costly and contribute negatively to the environmental impact of a device when working with high-value materials such as gold. This offers an opportunity for hybrid manufacturing approaches to balance scalability with material savings, such as combining screen printing with additive manufacturing, as discussed by Kalligosfyri et al. [
35].
Any effort towards enhancing sustainability in electronics should be evaluated through a life cycle assessment (LCA). The current literature indicates that PE technologies, such as roll-to-roll processing, inkjet or screen printing, and the use of biodegradable substrates, offer potential sustainability advantages compared to conventional silicon-based electronics [
36,
37]. However, several studies highlight that the production phase, particularly material preparation and large-scale printing processes, remains a major contributor to the overall environmental impact [
38]. Despite this progress, the state of the art still highlights that significant data and methodological gaps exist. For instance, reliable life cycle inventories for printed conductive inks and polymeric substrates are limited, the diversity of materials and device architectures complicates cross-comparison, and end-of-life management strategies for printed components are not yet well established. Overall, LCA applications in printed electronics are in a consolidation phase, providing valuable insights into environmental hotspots but still requiring further research on primary data collection, circularity scenarios, and ecodesign integration to support sustainable technology development.
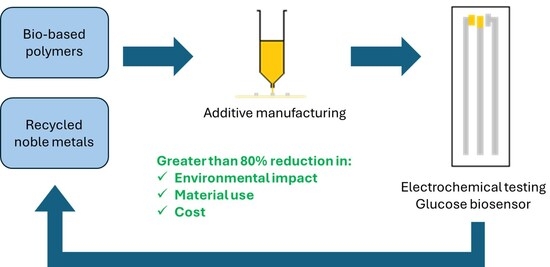
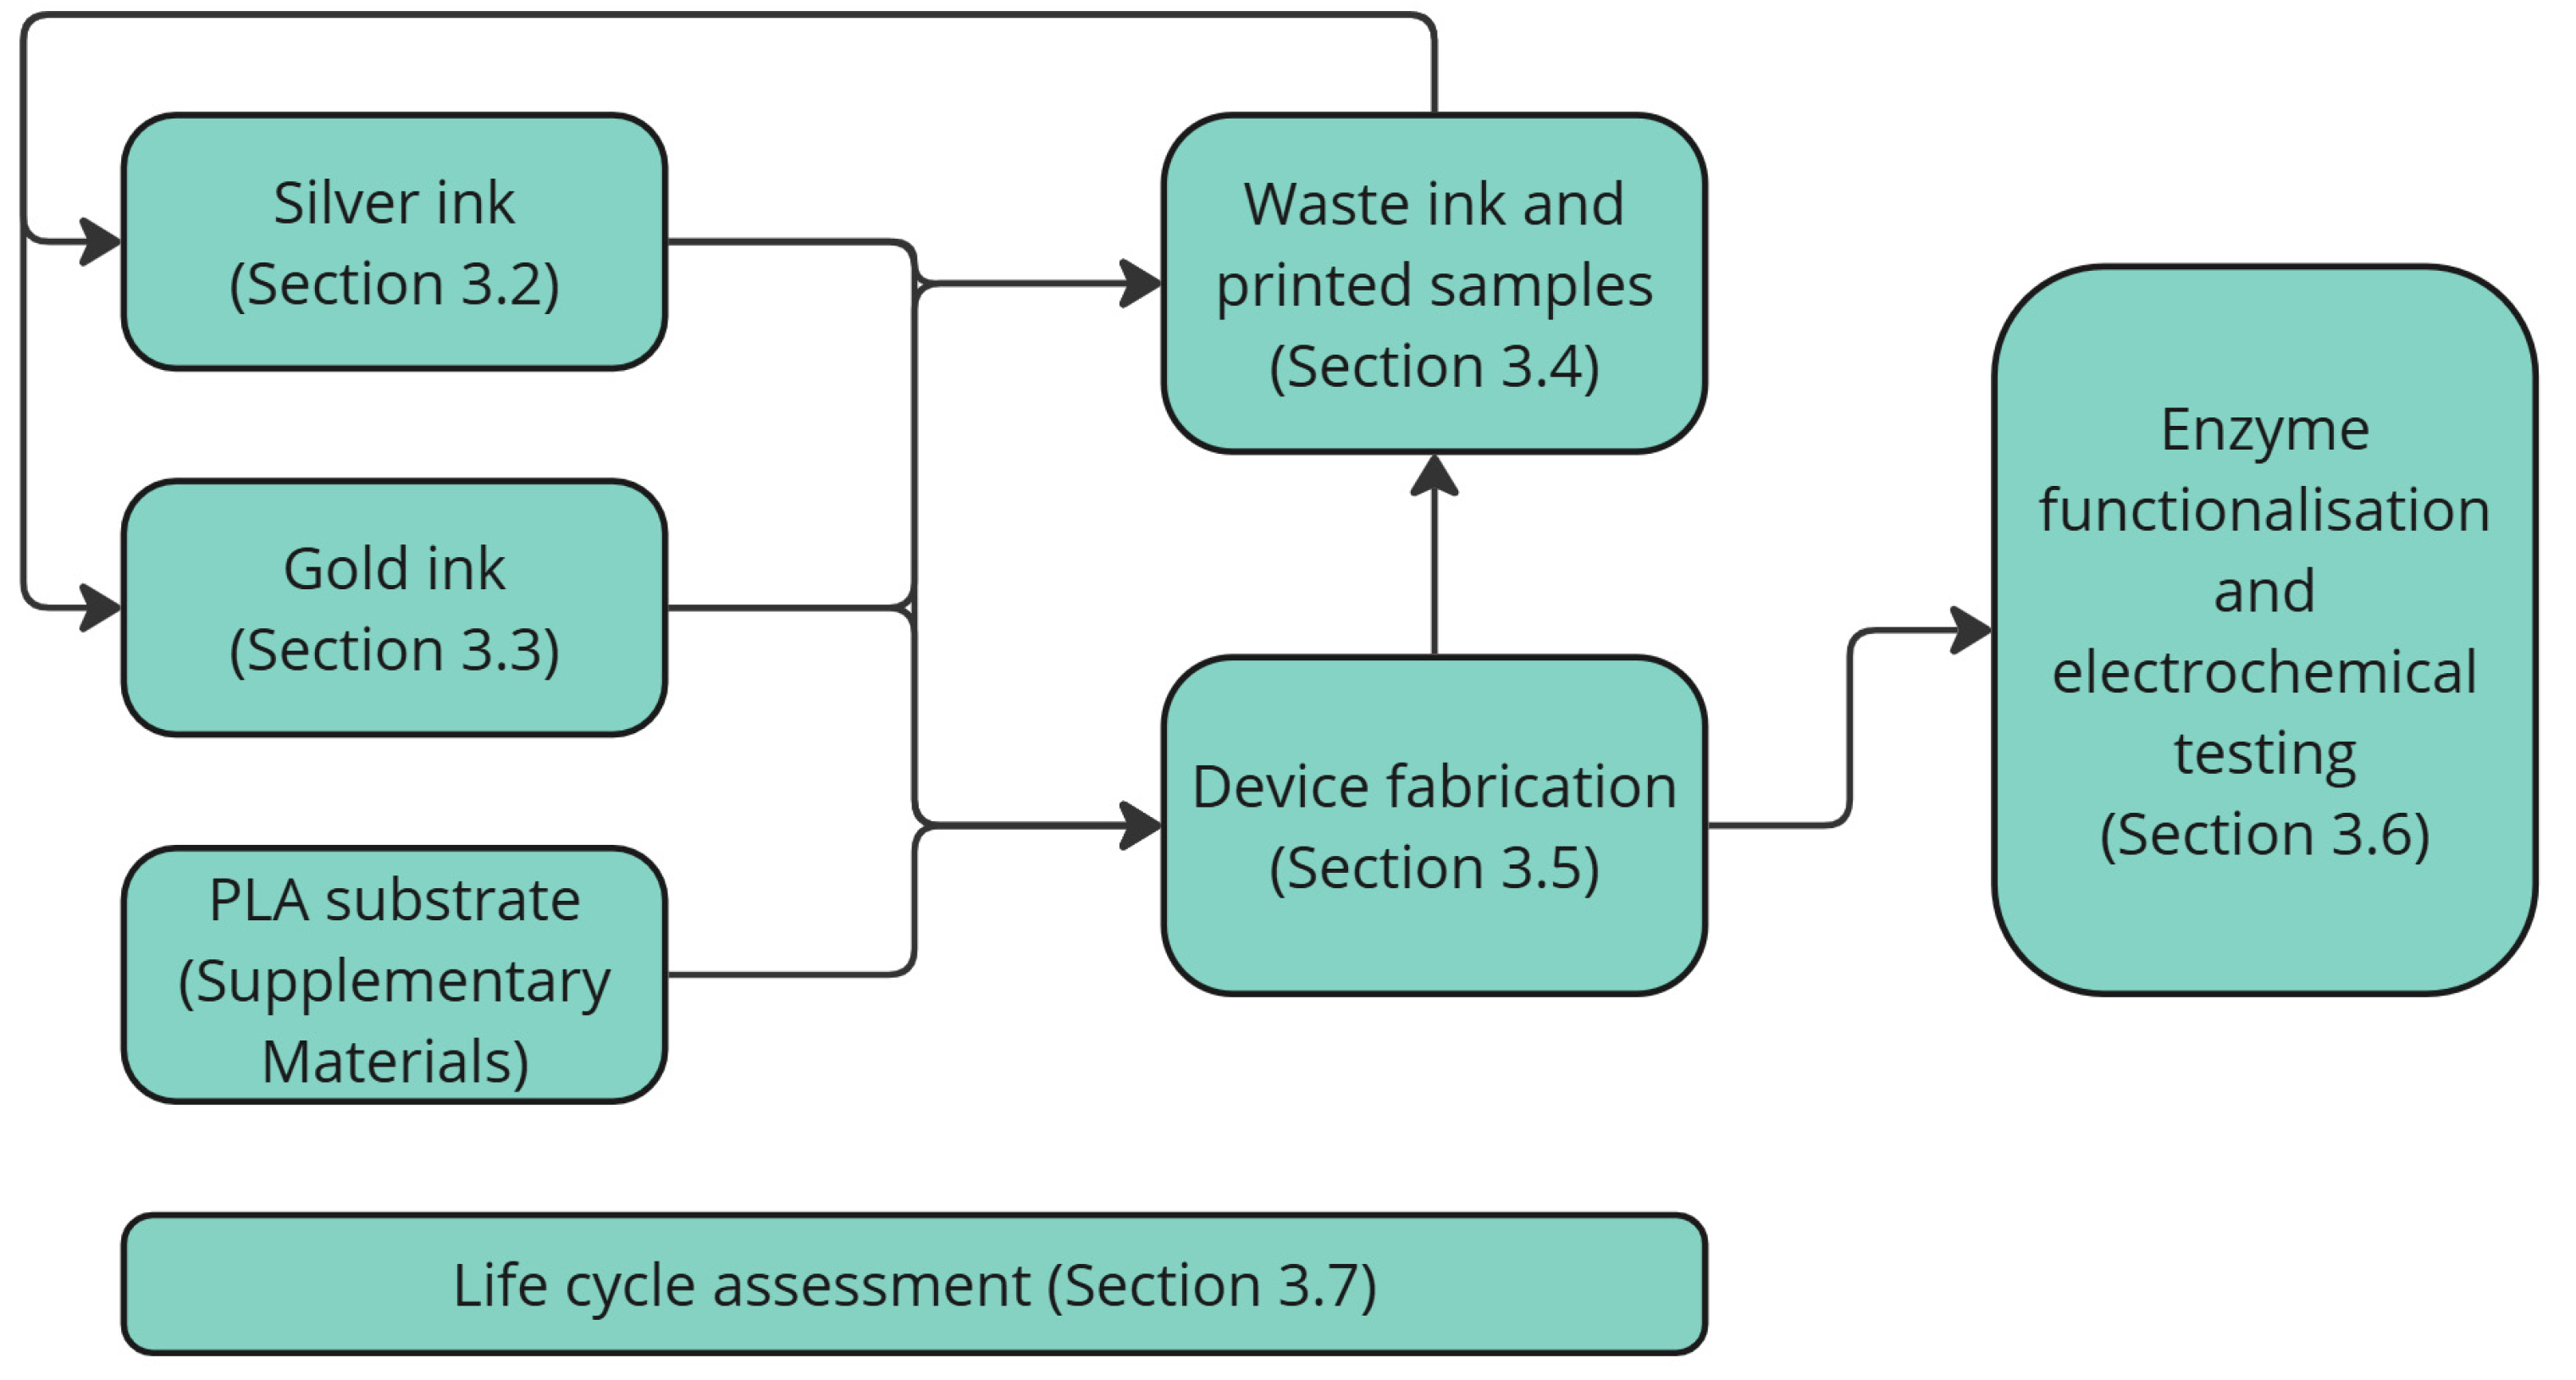
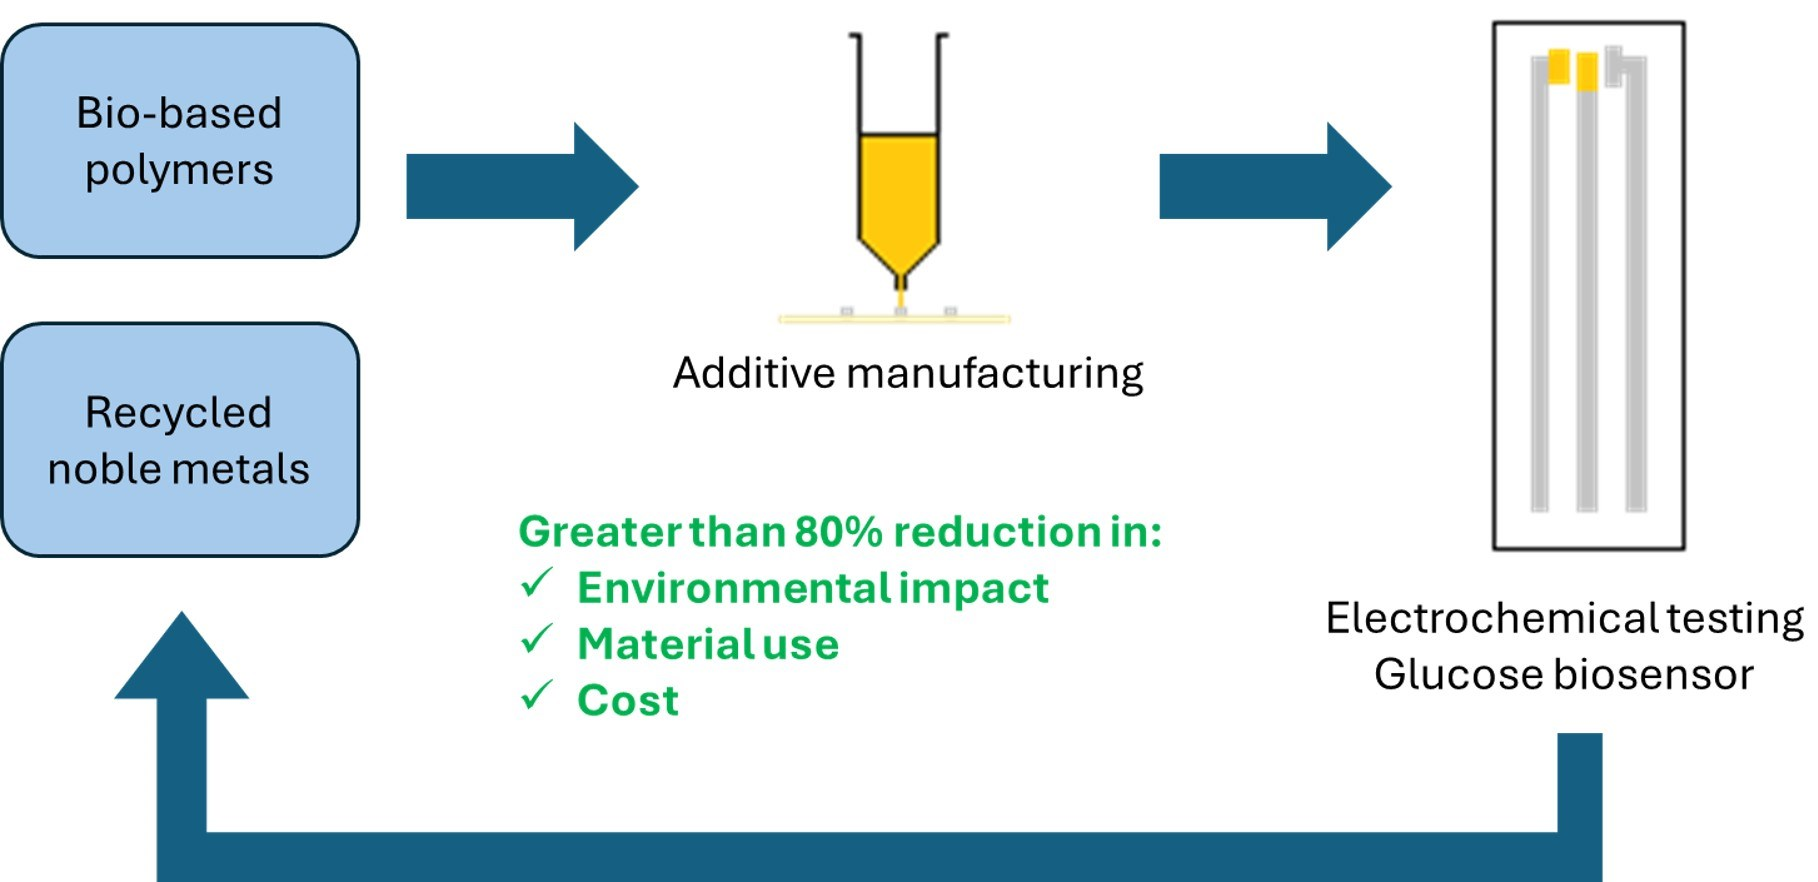
This article outlines a novel approach to sustainability in printed electronics through combined methods to reduce environmental impact: integrating low-impact starting materials, the recovery and reuse of high-impact metal flakes through low-energy solvent washing approaches, and hybrid manufacturing to minimise material waste. Device performance and environmental impact were quantified via electrochemical testing and life cycle analysis, respectively. The structure of the article is shown in
Figure 1. Firstly, ink development is outlined for a silver screen ink and gold syringe printing (Voltera) ink produced from virgin metal flakes. Secondly, metal recovery is achieved through solvent selectivity for single and mixed-metal samples, demonstrating second generation inks. Thirdly, fabrication is outlined, which employs a combination of screen printing and Voltera printing to maximise scalability while benefitting from the additive and low-waste nature of digital printing. Fourthly, sensors are validated through electrochemical testing before and after enzyme functionalisation, comparing them to an equivalent sensor produced using commercial materials and manufacturing methods. Finally, a life cycle assessment is presented that explores the impacts of these new innovations alongside a commercial baseline.
2. Materials and Methods
2.1. Materials
Polymers and solvents were sourced from Sigma Aldrich: cellulose acetate (Sigma Aldrich Corporation, Gillingham, UK, Mn 30 kDa and 39.8% acetylation, Mn 50 kDa and 39.7 wt% acetylation), polycaprolactone (Sigma Aldrich Corporation, Gillingham, UK, Mn 10 kDa and Mn 80 kDa), cyrene (Sigma Aldrich Corporation, Gillingham, UK, Biorenewable), benzyl acetate (Sigma Aldrich Corporation, Gillingham, UK, bioderived, ≥99%), ethyl acetate (Sigma Aldrich Corporation, Gillingham, UK, ≥99.5%), and acetone (Sigma Aldrich Corporation, Gillingham, UK, ≥99.5%). Silver flakes (Metalor Advanced Coatings, Saint-Fons, France, EA0295, D50 5.2 µm) and gold flakes (Metalor Advanced Coatings, Saint-Fons, France, PUAU594, D50 4.1 µm) were sourced from Metalor Advanced Coatings. Polyethylene terephthalate (PET) PMX17c (HiFi Industrial Film, Stevenage, UK) was sourced from HiFi Films. The PLA substrate was provided by the Aristotle University of Thessaloniki at 0.38 ± 0.02 mm thickness [
32,
33]. Nitric acid (Sigma Aldrich Corporation, Gillingham, UK, 67–70%) was purchased from Fisher for ICP-MS sample preparation. Potassium ferrocyanide (Sigma Aldrich Corporation, St. Louis, MO, USA, K
4[Fe(CN)
6]), potassium ferricyanide (Sigma Aldrich Corporation, St. Louis, MO, USA, K
3[Fe(CN)
6]), potassium chloride (Sigma Aldrich Corporation, St. Louis, MO, USA, KCl), d-(+)-glucose (Sigma Aldrich Corporation, St. Louis, MO, USA), Trizma
® base (Sigma Aldrich Corporation, St. Louis, MO, USA), and nitric acid (Sigma Aldrich Corporation, St. Louis, MO, USA, 65%) were purchased from Sigma-Aldrich (USA). All reagents used in sensor functionalisation and electrochemical testing were analytical grade. All solutions used in the electrochemical testing were prepared daily using type 1 ultrapure water (Direct-QTM 5 system, MilliporeSigma, Darmstadt, Germany).
2.2. Mixing
Polymers were dissolved in solvents prior to combining with metal powders using a hotplate stirrer at 60 °C and 350 rpm for 2 h. Polymer solutions and metal powders were combined and mixed using dual-axis centrifugal mixing (DAC) at 1500 rpm for 1 min. Mixing was repeated for a further 1 min after the material inside the mixing container was redistributed with a spatula. For inks containing gold, 5 mm stainless-steel ball bearings were added for 3 additional mixing steps at 2000 rpm for 30 s bursts to prevent heat buildup.
2.3. Rheology
Rheology measurements were carried out using a TA Instruments Discovery HR2 fitted with a 40 mm parallel roughened steel plate. Samples were held at 25 °C and analysed using a 500 µm gap following a 1 min equilibration. Ink behaviour was characterised by measuring viscosity at 1.5 s−1, 15 s−1, and 1000 s−1. Each shear rate was held for 60 s prior to returning the sample to 1.5 s−1 and holding until at least 10 measured points fell within a 5% tolerance. The purpose of this experiment was to simulate ink behaviour following being subjected to shearing stresses by the print process and recovering viscosity once shearing forces have been removed. To determine the time taken for solutions to solidify and heat required to enable sufficient flowability, samples were subjected to 1 Hz and 1% strain for 180 min at 20 °C, following immediate heating to 40 °C for 120 min.
2.4. Scanning Electron Microscopy
A Hitachi SU8230 field-emission electron microscope was used in secondary electron mode with an acceleration voltage of 3 kV, 10 µA emission current, and a working distance of 11.6 mm. Ink was mounted onto a silicon chip and allowed to dry in air. No conductive coatings were applied before imaging the sample.
2.5. Design of Experiments
Design of Experiment (DoE) methods were used to accelerate the development and optimisation of the silver ink formulation. DoE can be used to create a data model of a formulation by carrying out a range of experiments to understand the effects of inputs (i.e., raw material loadings) on outputs (e.g., resistivity, viscosity). A response surface was designed in JMP (version 17.0) to provide a deep level of understanding of the formulation space and explore interactions between raw materials and non-linear phenomena. Twenty-four formulations were suggested by JMP, with the inputs and outputs shown in
Table 1.
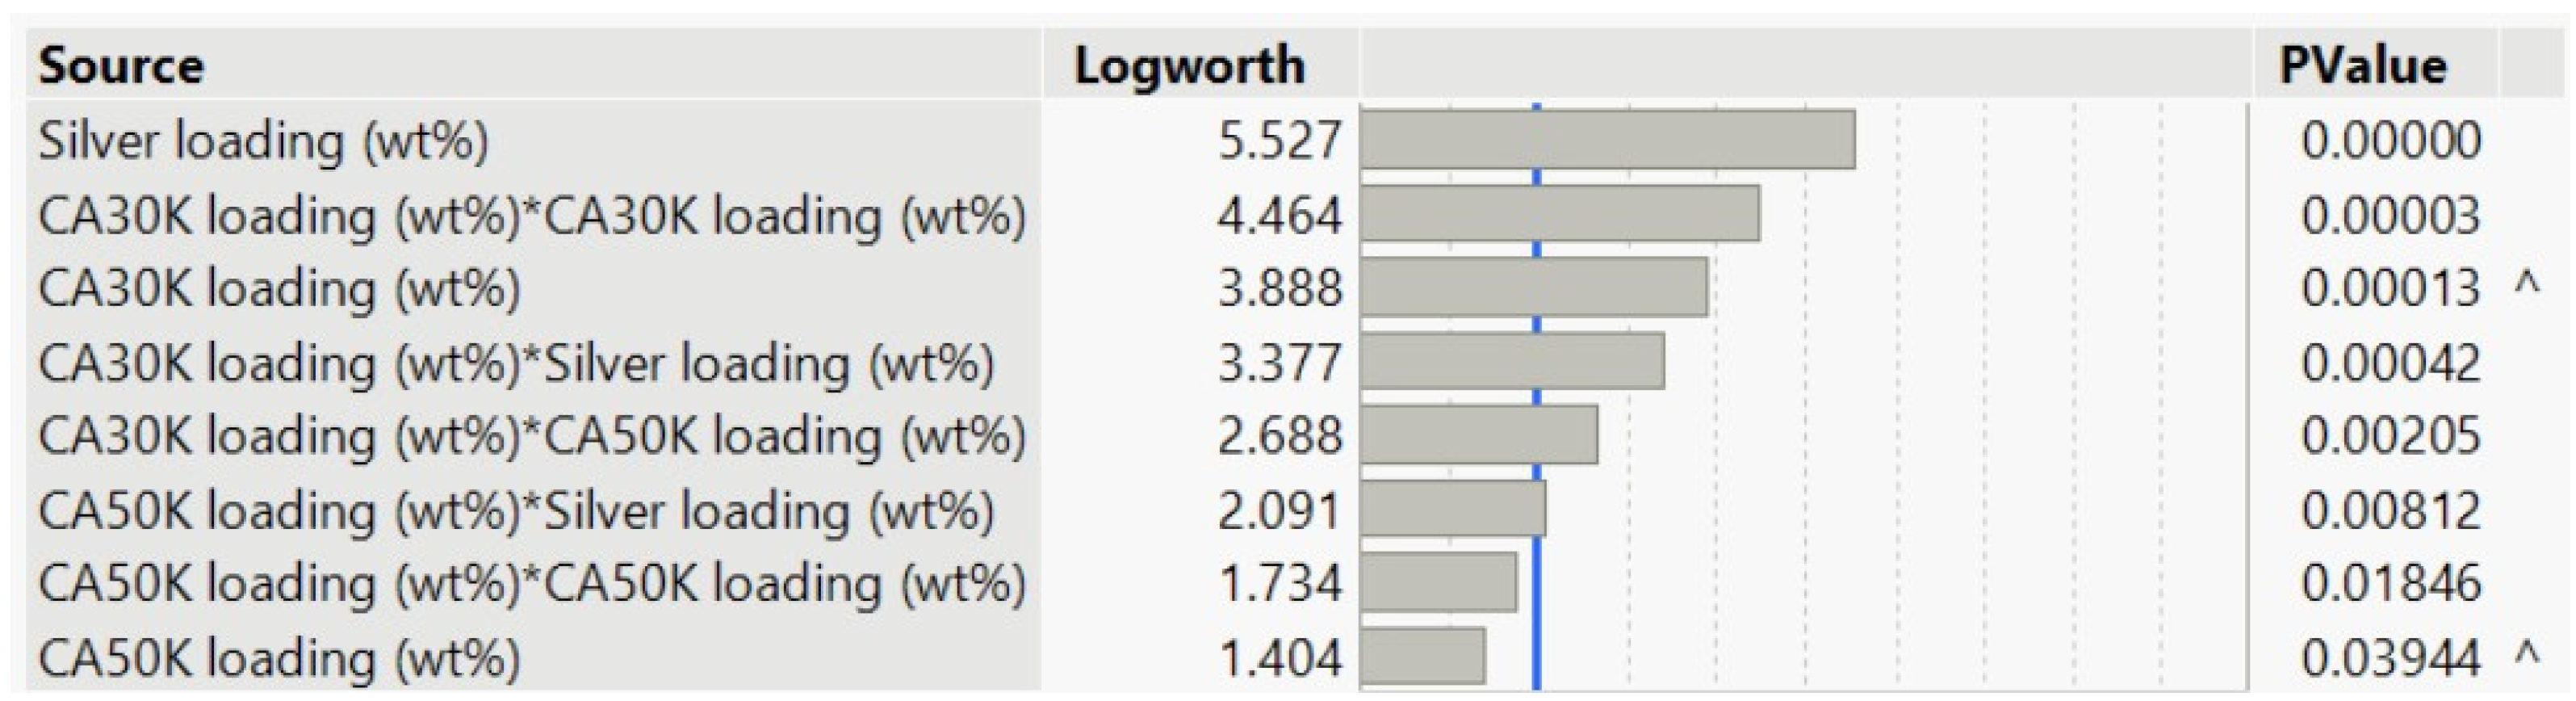
Results were fitted to a model to determine significant effects;
Figure 2 shows a summary of these effects where bars extending past the blue line are statistically significant. This table shows the inherent complexity of this formulation where inputs cannot be explored independently of one another.
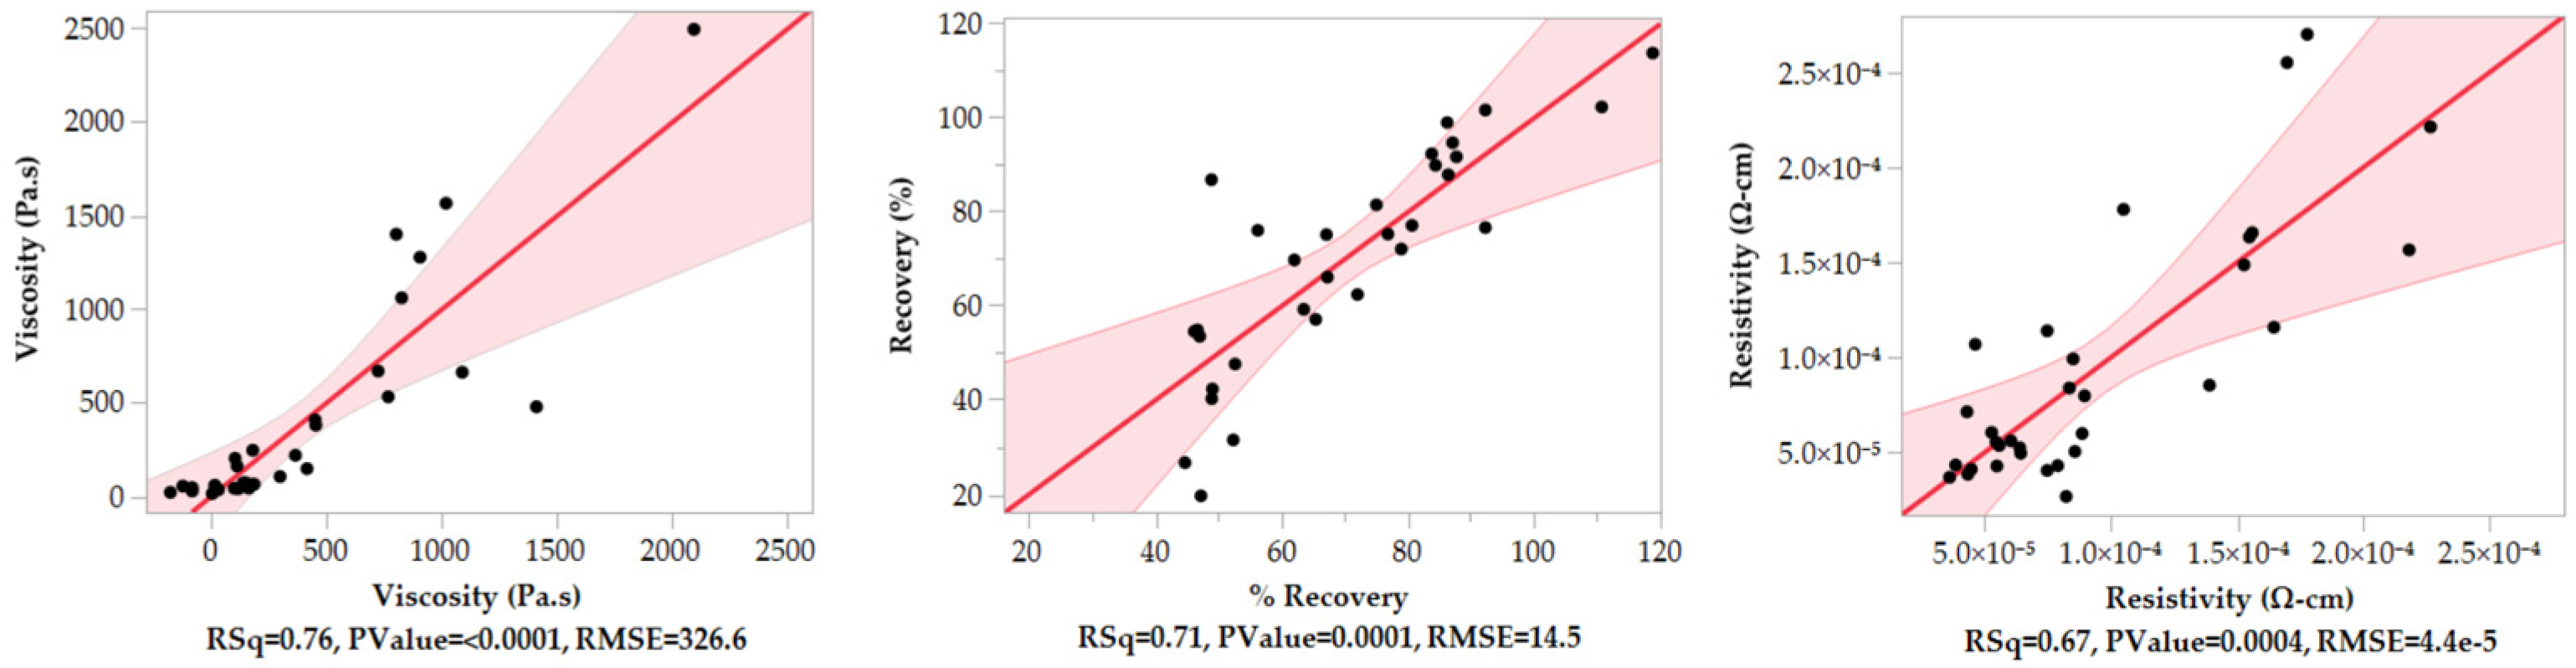
The quality of fit can be assessed by checking actual-by-predicted plots shown in
Figure 3. Quality of fit is defined by R Squared (RSq), where highest is best; above 0.7 is a high-quality fit, and above 0.5 shows good quality. All responses achieved a high-quality fit.
2.6. PLA Substrate Preparation
PLA sheets were prepared using a single screw cast film extrusion line (Microex Cast, EUR.EX.MA Lab & Pilot Technology, Syncro group, Via Salvator Allende, 7-21049 Tradate, Varese, Italy). Prior to melt mixing, the samples were dried overnight under vacuum at 60 °C. Processing temperature for PLA was set at 190 °C for zones “cylinder 2”, “box”, and “lip”; “cylinder 1” was set at 180 °C. The extrusion speed was 30 rpm, the first cylinder (calendar) was set to 0.1 m/min, 0.5 m/min was set for the second cylinder (haul off), and the third cylinder (winder) was set at 80% [
39,
40]. Stretch-induced crystallisation was used to mimic biaxial stretching used in polymer substrate manufacturing, whereby a metal frame was used to clamp PLA sheets, promoting nucleation and growth of crystalline regions during annealing (
Supplementary Materials S1, S2, Figures S1 and S2) [
41,
42].
2.7. Test Coatings and Basic Testing
To produce coatings for evaluation during the rapid screening of early formulations, a fixed gap was created using two lines of 50 µm thick tape adhered to a PET substrate. A microscope slide was then used to doctor the ink into the gap. Inks that were coated onto PET were dried in an oven at 120 °C; PLA coatings were left to dry in air overnight. Coatings were assessed for sheet resistance and resistivity by measuring the current and resistance using a Keithley 2480 source meter attached to a four-point probe comprising 100 µm diameter pins with a 1 mm tip spacing and by measuring thickness using a Hanatek FT3-Lab probe thickness gauge (Rhopoint Instruments, Sussex, UK). Sheet resistance and resistivity were calculated using the equations shown in Gorman et al. [
43]. Adhesion was assessed by following ISO2409 using a 1542 crosshatch test kit (Elcometer Limited, Manchester, UK). Briefly, a crosshatch was created in the coating, and tape (meeting the ISO2409 specification) was applied and then removed at a 45° angle. Finally, the amount of material that had been removed was visually assessed and quantified according to ISO2409 [
44].
2.8. Device Fabrication
Biosensors were designed to minimise the material required for fabrication, particularly with respect to the gold regions. The design incorporated three silver tracks of 1.2 mm wide and 31.75 mm long with a gap of 1.5 mm. The silver RE active area was 2.2 × 0.7 mm. Gold WE and CE active areas were 2.2 × 0.7 mm and 2.6 mm × 0.7 mm, respectively. A gap of 0.7 mm was used between each electrode. Polyimide tape was used to isolate electrode areas on the fabricated devices.
Novel devices were produced using a hybrid approach to balance scalability (screen printing) and material savings (digital printing). Silver tracks were printed using screen printing, obtaining 36 sets of tracks per print. These were isolated to sets of 6 electrodes to enable compatibility with Voltera printing, where gold was deposited onto 6 devices per print run.
Screen printing was carried out using a DEK Horizon 03iX (ASMPT DEK Solutions, Almere, The Netherlands) and a squeegee with a shore A hardness of 70–75 and an angle of 45°. Silver tracks were printed using a polyester screen with a thread count of 120 threads per cm using threads with a diameter of 34 µm and a screen emulsion of 12 µm. The screen was flooded at a speed of 150 mm/sec, and printing was carried out at 125 mm/sec with a print gap of 2.0 mm.
A Speedy 300 Laser (Trotec Laser, Marchtrenk, Austria) was used to cut the individual sensors out of the larger sheet. A power of 18 W with a speed of 1 mm/sec was used for both polymer substrates.
Voltera printing was conducted using a V-One printer (Voltera, Waterloo, ON, Canada) fitted with a 225 µm inner diameter metal dispensing tip. The printer was placed in a heated enclosure that was held at 30 °C. The gold inks were preconditioned at 40 °C and then loaded onto the Voltera V-One. The calibration cycle and printing began after a 5 min equilibration. Printing was carried out with the following ink settings: pass spacing, 0.2 mm; dispense height, 0.15 mm; feed rate, 350 mm/min; trim length, 50 mm; trace penetration, 0.15 mm; anti-stringing distance, 1.0 mm; kick, 0.35 mm; soft start ratio, 0.2; soft stop ratio, 0.15; and rheological setpoint, 0.35.
2.9. Silver and Gold Recovery
Silver and gold flakes were recovered from two formats: (1) from waste ink formulations and single component printed samples, generated during ink and process development, and (2) from printed sensors containing both inks.
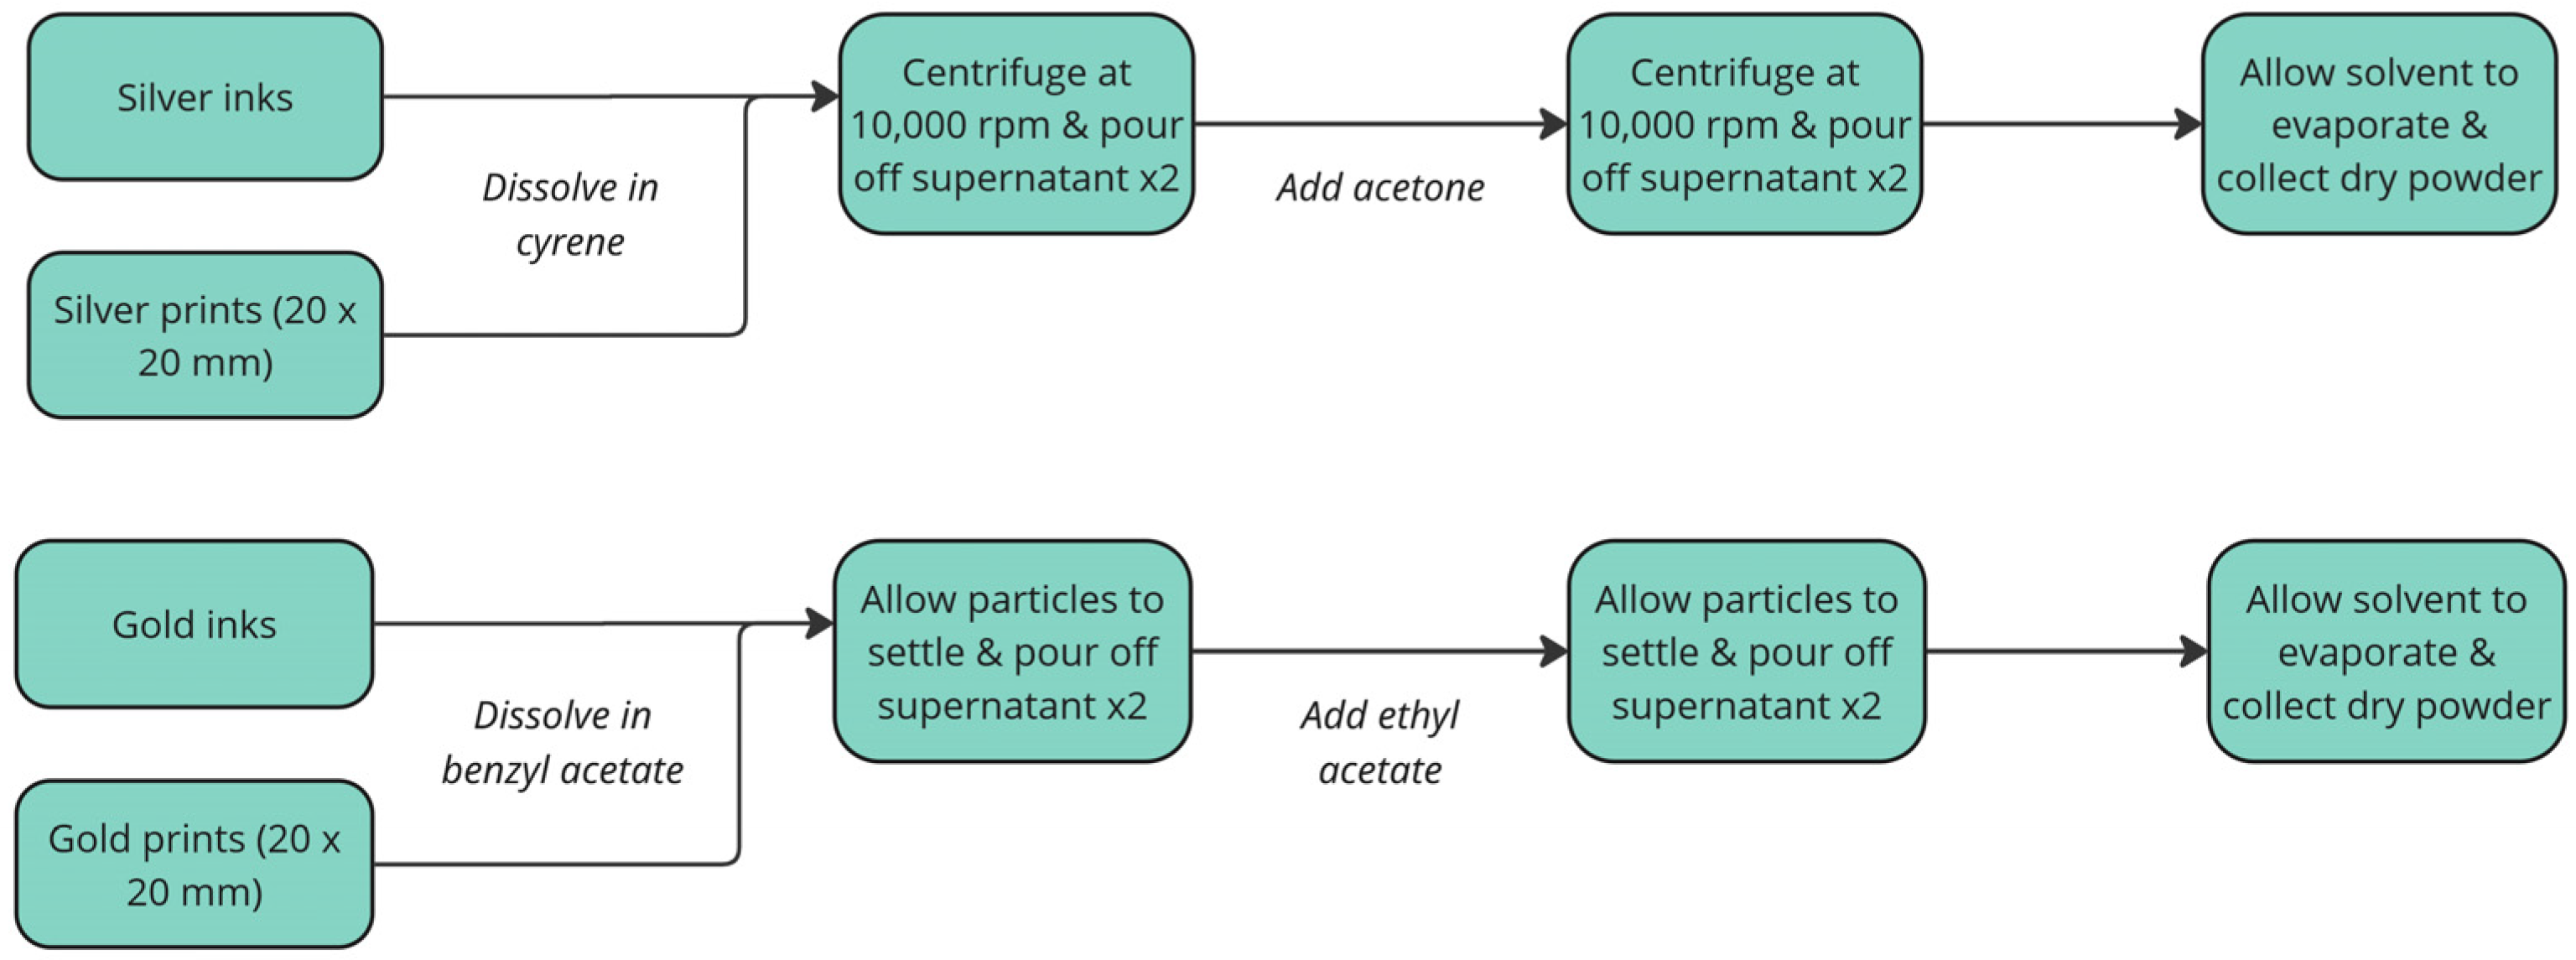
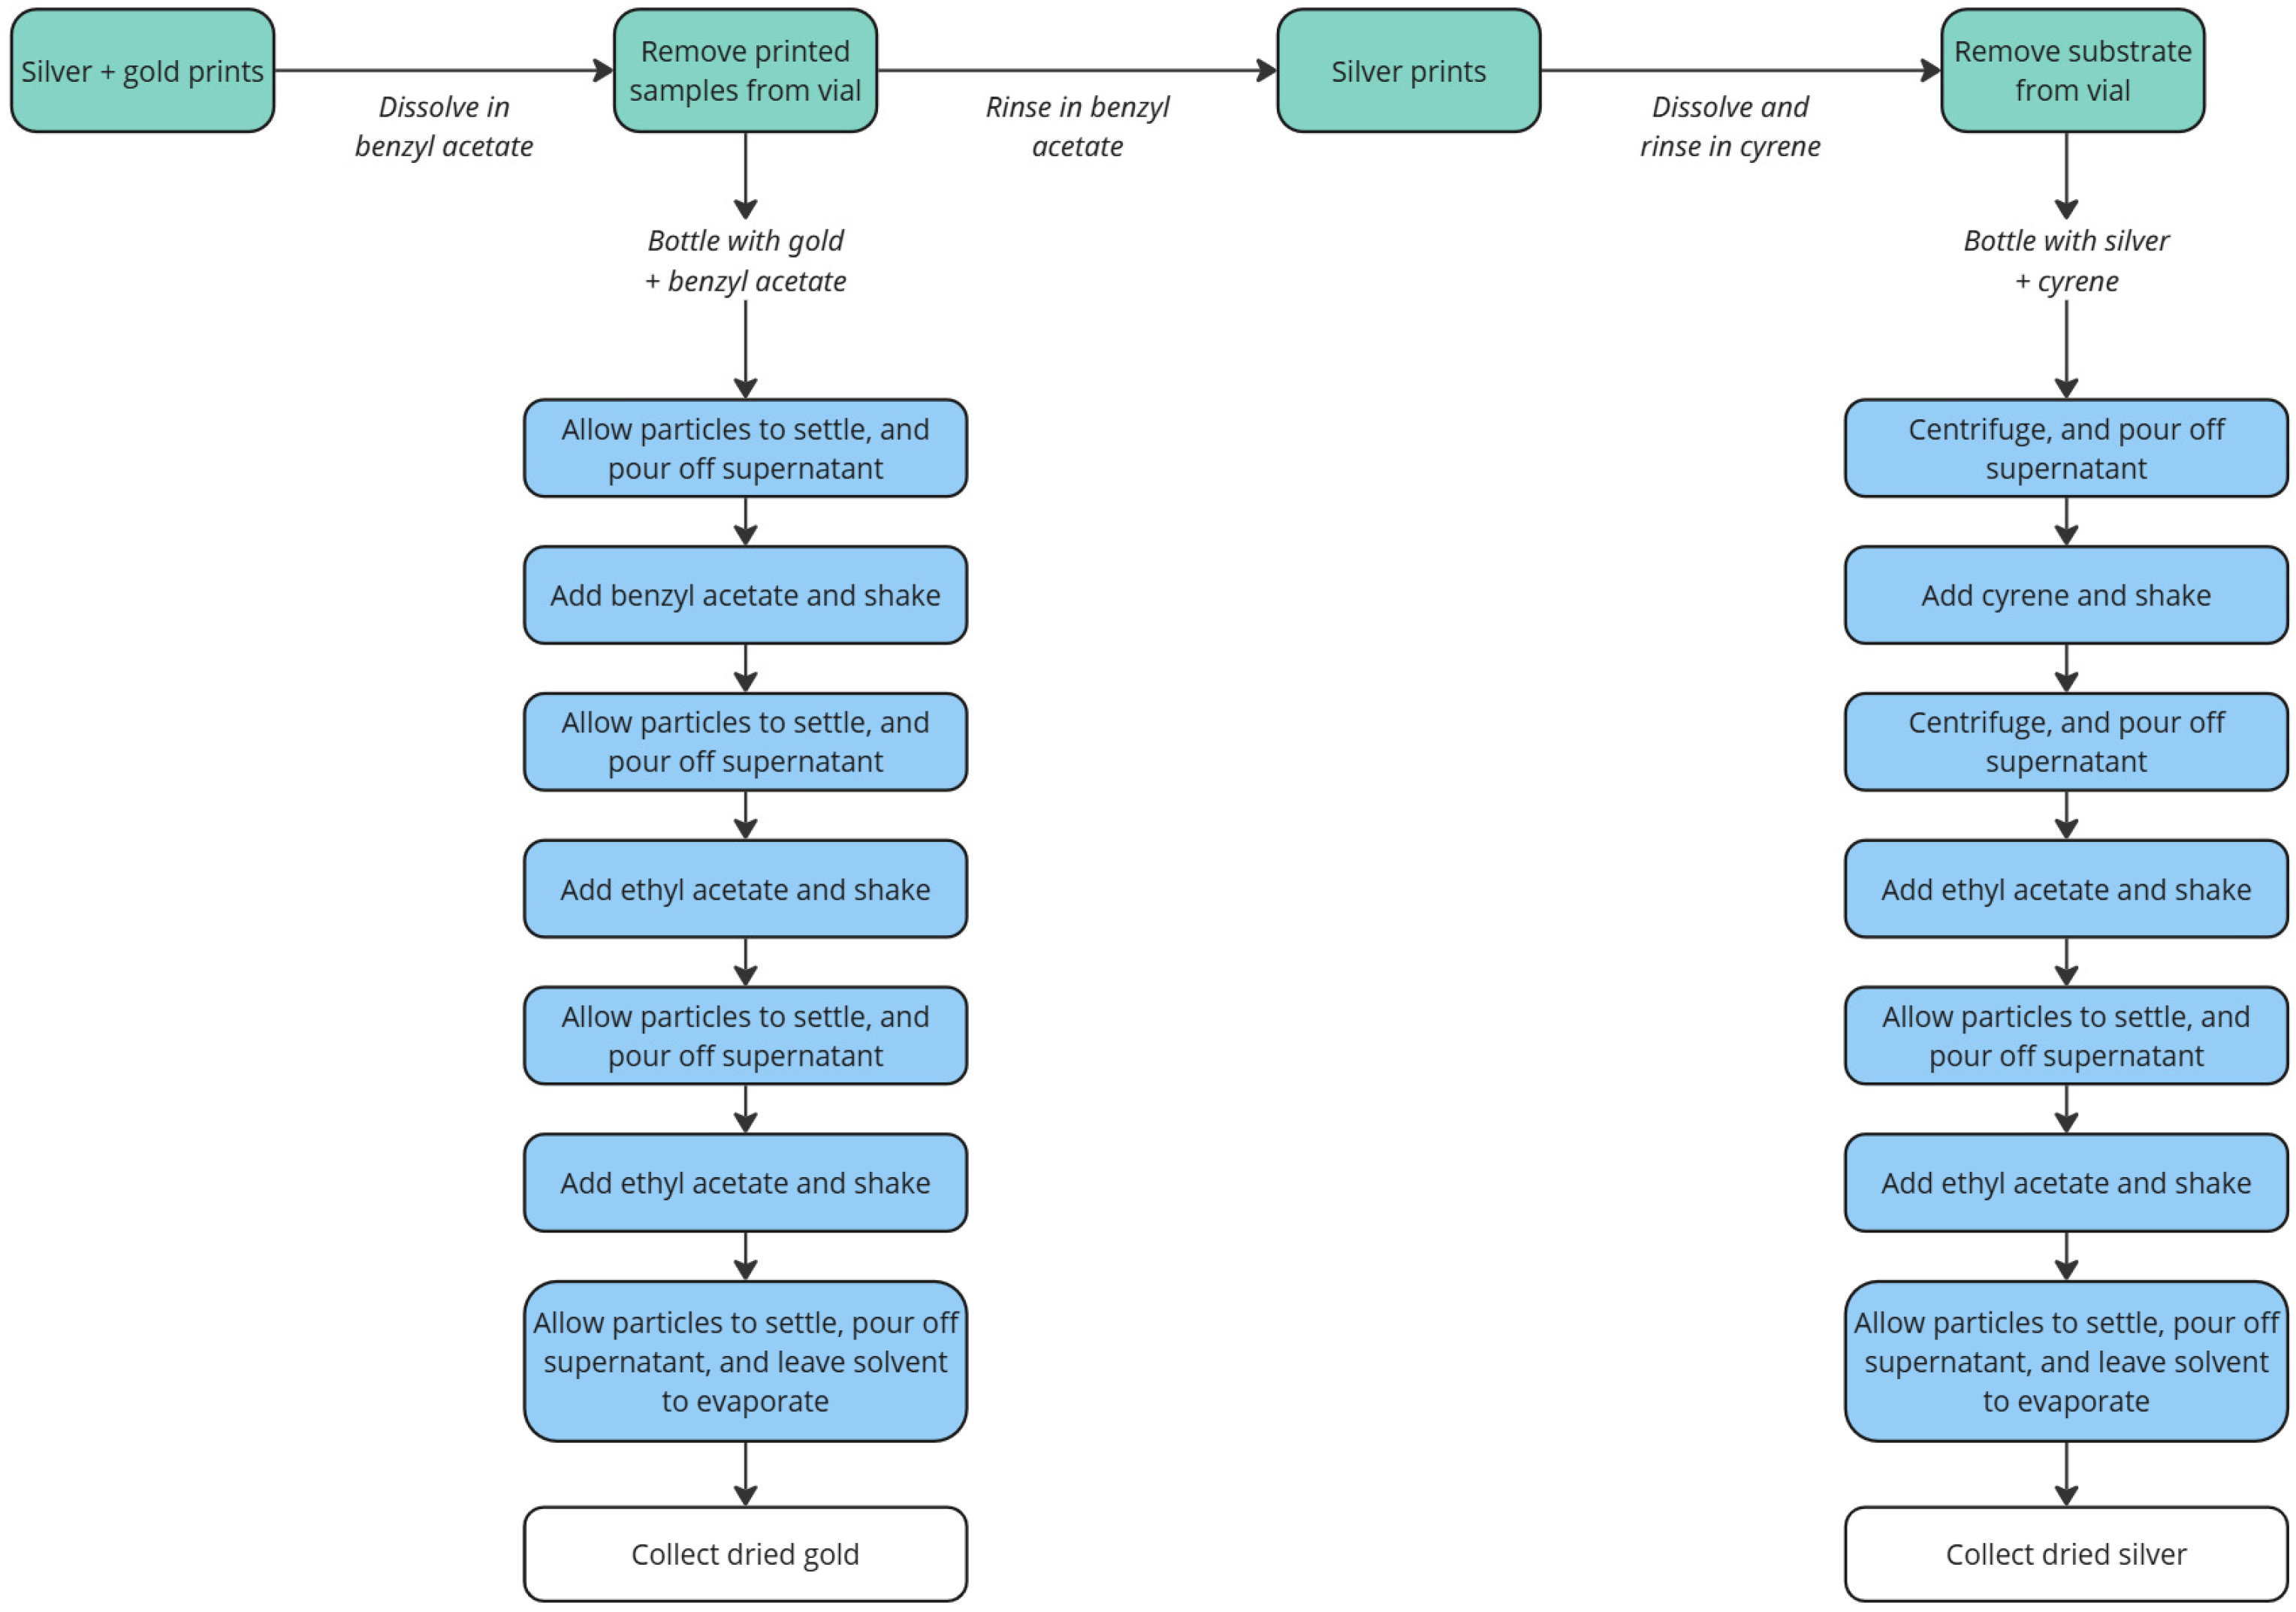
The processes used to recover silver and gold from samples in the first format is shown in
Figure 4. When recovering silver, centrifuge steps were employed using a Sorvall Legend XFR (Thermo Fisher Scientific, Waltham, MA, USA), at 10,000 rpm for 5 min. For gold recovery, washings were allowed to sediment under atmospheric conditions for 5 min. Fully washed samples were left in a fumehood overnight to allow for any solvent to evaporate; the resulting powder could be easily loosened with a spatula.
For the second format, mixed-metal coatings and devices, printed samples were cut into approximately 20 × 20 mm sections. Sequential washing steps were used to first recover gold, then recover silver. Cleaning steps used were as previously described;
Figure 5 shows an overview of the process.
2.10. ICP-MS
Analysis was performed using a iCAP-TQ ICP-MS (Thermo Fisher Scientific, Waltham, MA, USA) operated in SQ KED mode. Samples were prepared by dissolving approximately 0.1–0.15 g in a minimal quantity of 70% nitric acid prior to dilution with 2% w/w nitric acid (50 mL) to be within the calibrated range of the instrument. Instrument calibration was performed using a 23-element ICP standard (Sigma Aldrich Corporation, Gillingham, UK), diluted with 2% nitric acid to give solutions in the range of 1–1000 ppb of silver (R2 of the calibration = 0.9992).
2.11. Enzyme Functionalisation
The screen-printed working electrode was functionalised with glucose oxidase (GOx) to enable selective detection of glucose. Prior to enzyme immobilisation, the electrode surface was rinsed with type 1 ultrapure water prior to applying a nitrogen flow to remove impurities and improve adhesion. GOx was immobilised onto the electrode by drop-casting the enzyme–water solution (2 µL of 10 mg/mL). Redox mediators were incorporated to facilitate electron transfer between the enzyme and the electrode surface; this was achieved by replicating a proprietary protocol used in the manufacturing of commercial glucose sensors (Metrohm DropSens, Valencia, Spain). The functionalised electrode was then dried under controlled conditions (40% RH, 25 °C) and protected from light exposure. The sensor could be used immediately or stored in a refrigerator at 4 °C and protected from light until required. This modification allowed the electrode to act as a biosensing platform, where the enzymatic oxidation of glucose generates an electrochemical signal proportional to its concentration.
2.12. Electrochemical Testing
All electrochemical measurements were performed with µStat-i M8ONE multichannel impedance analyser (Metrohm DropSens, Valencia, Spain) controlled by DropView 8400M software (version 2.1.19). To obtain the electrochemical analytical signals, aliquots (30 µL) of the indicated solution for each methodology were deposited onto the three-electrode system of the screen-printed electrodes (SPEs).
Cyclic voltammetry was carried out at 450 mV to −300 mV potential at different scan rates (5, 10, 25, 50, 75, 100, 250, and 500 mV/s) to determine the electroactive surface area, using K3[Fe(CN)6] as the analyte. EIS experiments were performed at open circuit potential with 10 mV amplitude potential in a frequency range between 100,000 and 0.01 Hz in a 1 mM ferrocyanide/ferricyanide 100 mM KCl solution. Chronoamperometry was carried out by applying a detection potential of +0.3 V for 60 s with different glucose concentration solutions from 1 to 100 mM in 100 mM TRIS pH 7.2 buffer solution.
The electrochemical results obtained with the SPE developed in this work were compared with those obtained using DRP-220BT (Metrohm DropSens) SPEs, customised to match the electrode geometry of the devices fabricated in this study, named from this point forward as the baseline device (Base0).
2.13. Life Cycle Assessment
A life cycle assessment (LCA) was conducted to quantify and compare the potential environmental impacts of the novel device that incorporated circular innovations against the baseline device that follow a linear economy model. LCA is the most widely accepted methodology to evaluate the environmental burdens of a defined system, either a product or a process. The LCA presented herein was conducted by following ISO 14040/14044 guidelines, which included four phases: (1) goal and scope definition, (2) inventory analysis, (3) impact assessment, and (4) interpretation [
45,
46].
The goal and scope definition determined the guidelines to be followed during the rest of the study by specifying the reason for conducting the study, intended use of the results, system boundaries, functional unit, data requirements, and study limitations. The inventory analysis involved collecting data to create a life cycle inventory (LCI) of the inputs (energy and materials) and outputs (environmental releases and waste) associated with each stage of the life cycle. The impact assessment translated the LCI data into potential environmental impacts, using predefined impact assessment methods that incorporate characterisation factors for diverse environmental impact categories (e.g., climate change, acidification, eutrophication, human toxicity, etc). Finally, the interpretation phase combined and summarised the results from inventory analysis and impact assessment (consistent with the defined goal and scope) in order to reach conclusions and recommendations. In brief, LCA involves a material and energy balance applied to the product’s system, combined with an assessment of the environmental impacts related to the input and outputs to and from the product system.
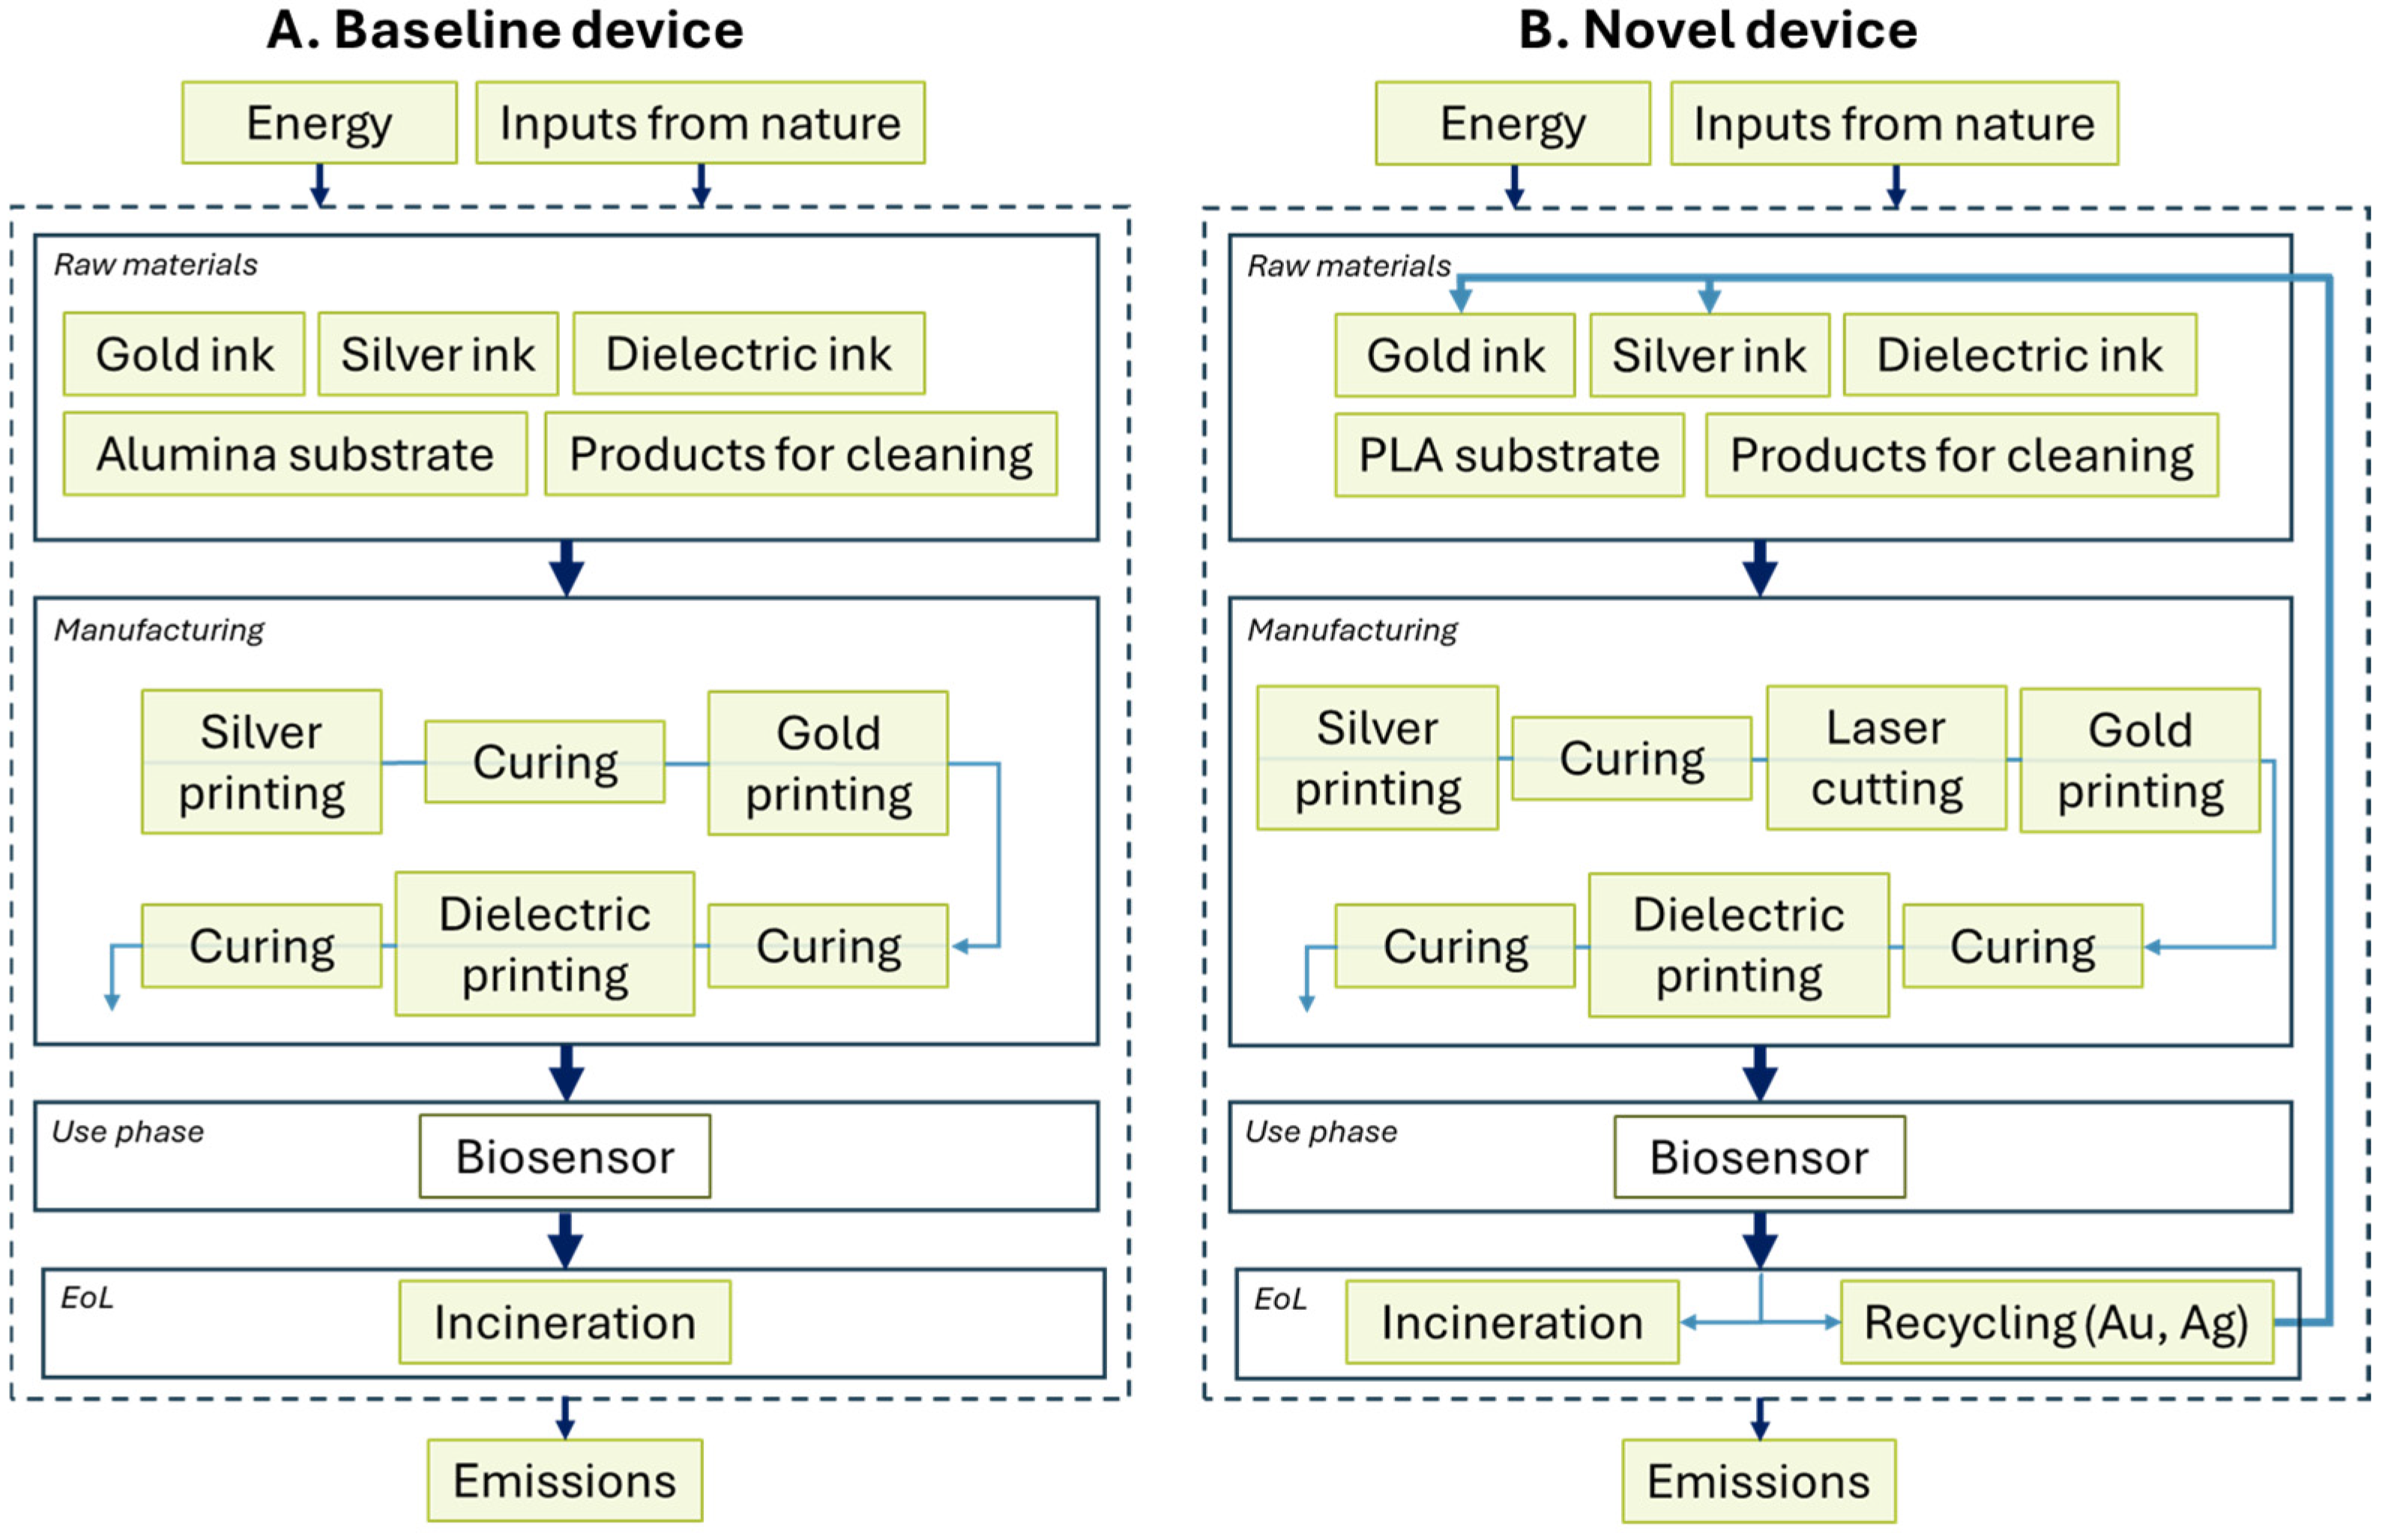
In the present study, the functional unit was defined as one biosensor, both for the novel and for the baseline devices. The scope was cradle-to-cradle, meaning that the study covered the totality of the life cycle, from raw material extraction through fabrication of the device components and their assembly up to the end-of-life (EoL) treatment, including the recovery and reuse of materials to produce new devices (in the case of the novel device). The system boundaries are presented in
Figure 6, including extraction of raw materials, formulation of inks, manufacturing steps, use phase, and, finally, EoL treatment. For the latter stage, 100% incineration with energy recovery for the baseline device was assumed, whereas for the novel device, a 40% recycling rate (and 60% energy recovery) was considered to enable the partial recovery of gold and silver. The environmental impacts and credits of the recycling process were allocated between the EoL recycling of biosensor and the further use of recycled materials in new devices using the circular footprint formula (CFF) established in the product environmental footprint (PEF) methodology of the European Commission [
14]. Default values provided by PEF developers for CFF parameters were used: the allocation of burdens and credits from recycling between the supplier and the user of the recycled gold and silver (or between recyclability at EoL and use of recycled content) was set at 80/20, while the allocation factor of burdens and credits from energy recovery was 100/0 (i.e., all burdens and credits were allocated to the EoL device) [
47]. Note that in this case a dielectric ink was not incorporated into the physical device; however, it was included in the LCA to provide a fair comparison to the baseline device.
The materials and energy inventory in
Section 3.7 was based on primary data. For background processes for which primary data were not available (e.g., raw materials or electricity production), secondary data were taken from the Ecoinvent database (version 3.10) [
48] and/or modelled using literature data and the stoichiometry-based method proposed by Langhorst et al. [
49]. The impact assessment method used to convert the inventory data into environmental impacts was the Environmental Footprint (EF, version 3.1) [
14], as incorporated in SimaPro software. EF 3.1 was used to assess 16 environmental impact categories at the midpoint level, including climate change (CC), ozone depletion (OD), ionising radiation (IR), photochemical ozone formation (POF), particulate matter (PM), non-carcinogenic human toxicity (HTNc), carcinogenic human toxicity (HTc), acidification (A), eutrophication freshwater (Ef), eutrophication marine (Em), eutrophication terrestrial (Et), ecotoxicity freshwater (E), land use (LU), water use (WU), fossil resource use (RUF), mineral, and metal resource use (RUMM).
3. Results
3.1. Ink Binder Selection
When selecting materials, several factors were considered: safety, solvent compatibility, and sustainability, e.g., bio-based, bio-derived, or biodegradable. The selective solubility of the ink binder was particularly important due to the intended goal of solvent-based recovery of silver and gold inks from the same device; given that silver and gold flakes will be bound by the polymers once printed and dried, it is polymer solubility that will enable separation via polymer dissolution. It was therefore crucial that the silver ink was insoluble in at least one solvent that the gold ink was highly soluble in and vice versa.
Sustainability criteria were used to select raw materials with low environmental impact, alongside Hansen solubility parameters (HSP,
Table 2) for solvent compatibility and selectivity. Cellulose acetate (CA, a cellulose-derivative commonly used in the ink industry) was selected for the silver ink due to the bio-derived nature of this polymer and its potential for degradation under industrial composting conditions [
50]. CA is a hydrophobic polymer not soluble in commonly used polar solvents such as alcohols and esters, yet it was found to be readily soluble in green-solvent cyrene [
51]. For the gold ink, polycaprolactone (PCL) was selected due to its well-documented biodegradability [
52] and solubility in benzyl acetate—a bio-based solvent that can be produced via microbial fermentation [
53]. Furthermore, both polymers boast the advantage of a non-hazardous classification. With respect to the solvents, cyrene is an eye irritant, and benzyl acetate poses environmental hazards [
54]. Despite this, all chemicals were deemed suitable for use in commercial printing environments, which typically lack sufficient engineering controls, such as localised ventilation, to handle toxic chemicals. HSP values were comparable across all materials for dispersive and hydrogen-bonding components. However, there was a marked difference in polar HSP values, suggesting polymer polarity was the key driving factor in the selective solubility of these polymers in chosen solvent systems.
3.2. Silver Ink Development
A silver ink was developed using the DoE outlined in
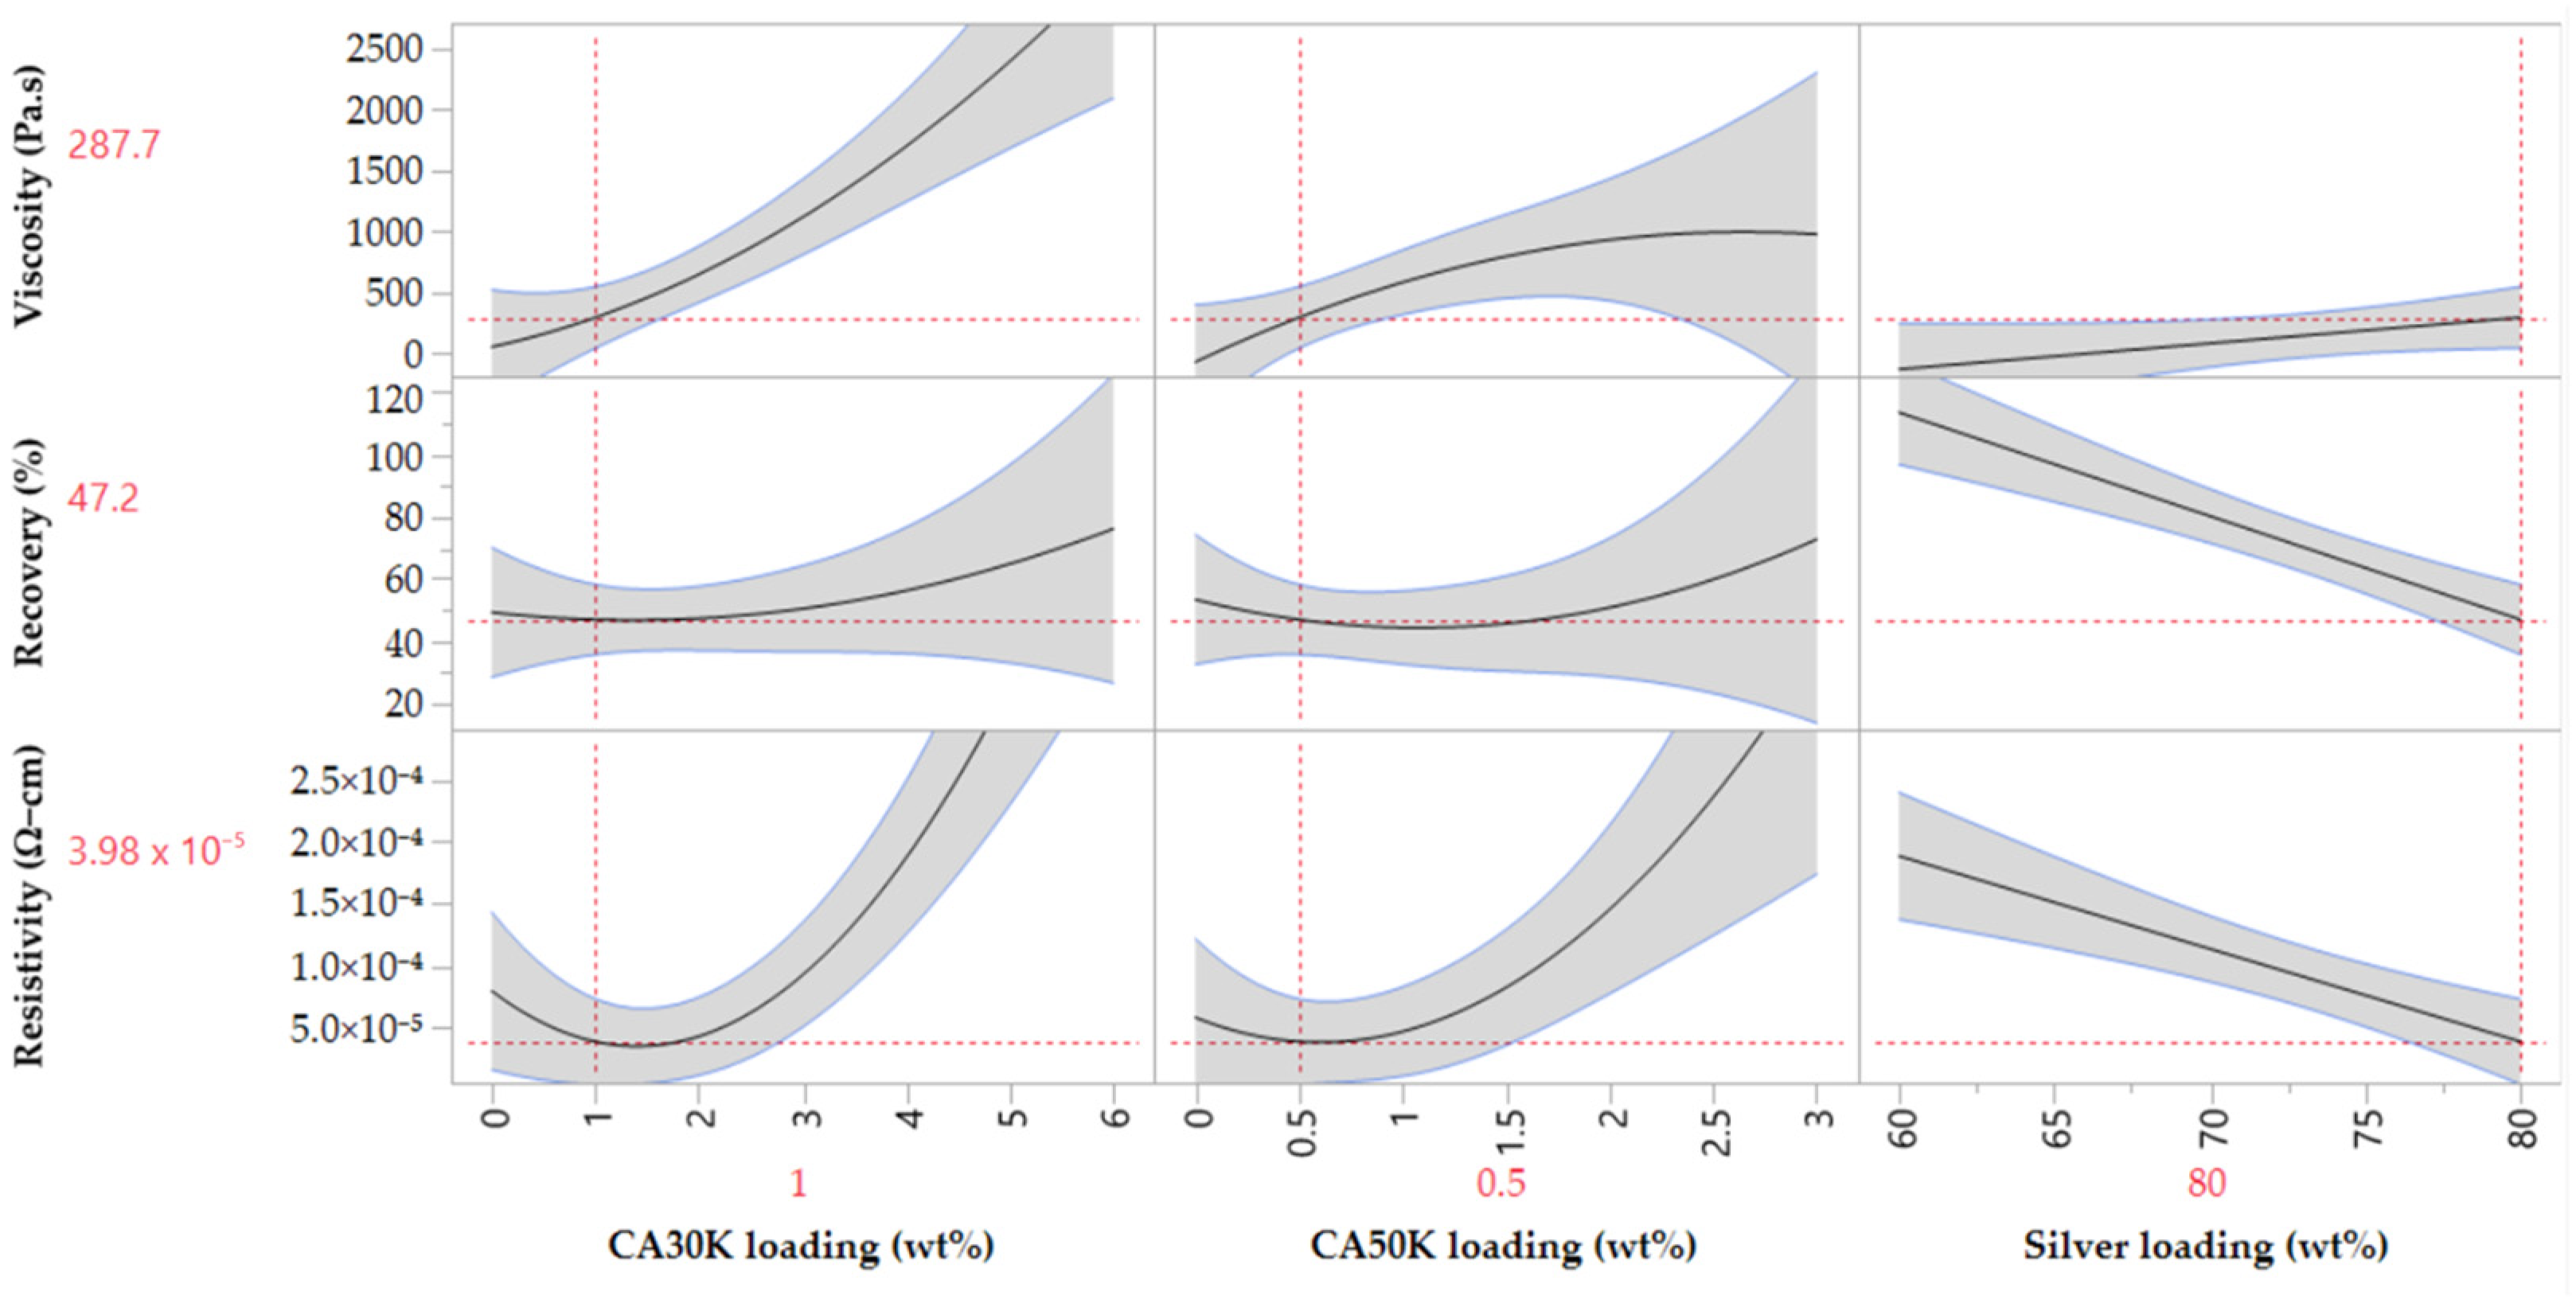
Section 2.5, and resultant experimental data were used to build a digital model of the formulation, enabling prediction of future experiments. JMP incorporates a ‘profile predictor’, which allows for prediction of properties for a suggested formulation, or the desired properties can be defined, and the model will predict a formulation to achieve those properties.
Figure 7 shows an example of the profile predictor.
This method also allowed for key trends to be identified. CA30K and CA50K loading had a proportional relationship to viscosity, where increasing loading resulted in a higher viscosity. Increasing the silver loading resulted in poorer viscosity recovery, while increasing CA30K and CA50K content improved viscosity recovery, likely due to polymer entanglement, i.e., polymer chains partially wrapping around one another to create a ‘spring-like’ effect to retain the molecular structure of the ink during printing [
59]. Resistivity was increased by increasing the CA30K and CA50K content due to the higher proportion of non-conductive components in the ink. Conversely, silver loading decreased ink resistivity by resulting in a higher degree of particle–particle contacts between conductive flakes to achieve high percolation, i.e., sufficient contact between flakes to allow electrons to flow from one flake to another [
60].
The model suggested a formulation containing 2.35 wt% CA30K, 0.67 wt% CA50K, and 62 wt% silver. This ink was produced and characterised; predicted and experimental values were comparable (
Table 3).
3.3. Gold Ink Development
Due to the high cost of gold, it was unfeasible to carry out a DoE to fully optimise the ink. Polycaprolactone 10 kDa at 20 wt% loading in benzyl acetate (PCL10K) and PCL 80 kDa at 10 wt% loading in benzyl acetate (PCL80K) were combined at 1:2, 1:1, and 2:1 ratios to achieve sufficient viscosity while minimising stringing behaviour, where a 2:1 ratio gave the best visible results. Stringing is a phenomenon that occurs due to the entanglement of polymers chains at a molecular level. It is commonly encountered in inks that contain high-molecular-weight polymers, where disentanglement is impossible [
61]. This can cause significant issues for additive processes, where ink detachment from the nozzle is crucial to preventing defects in the print.
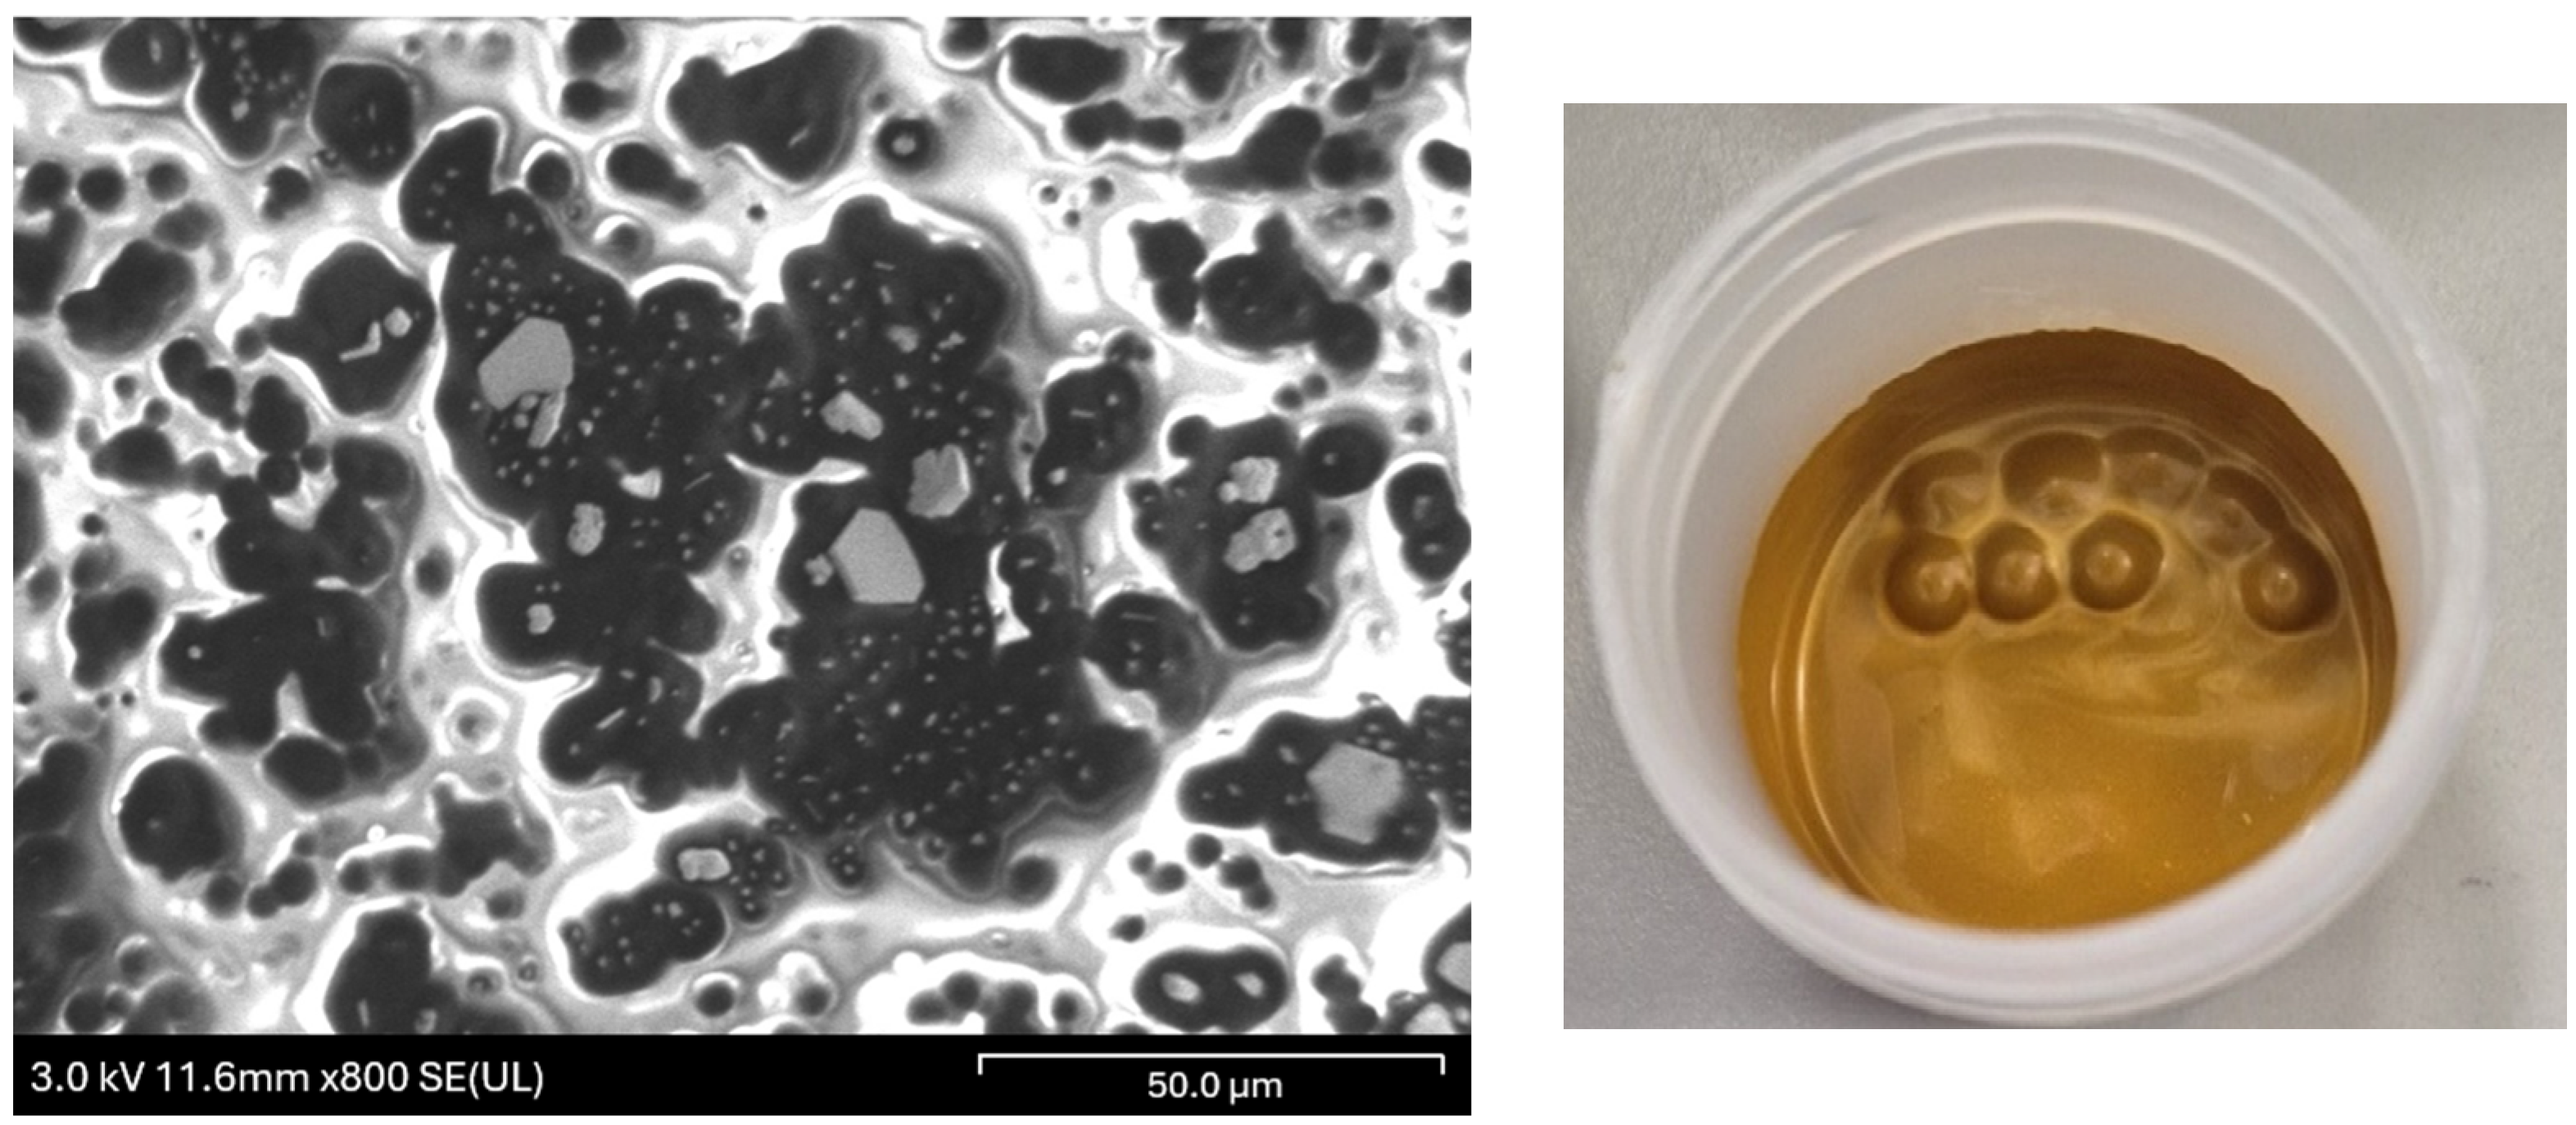
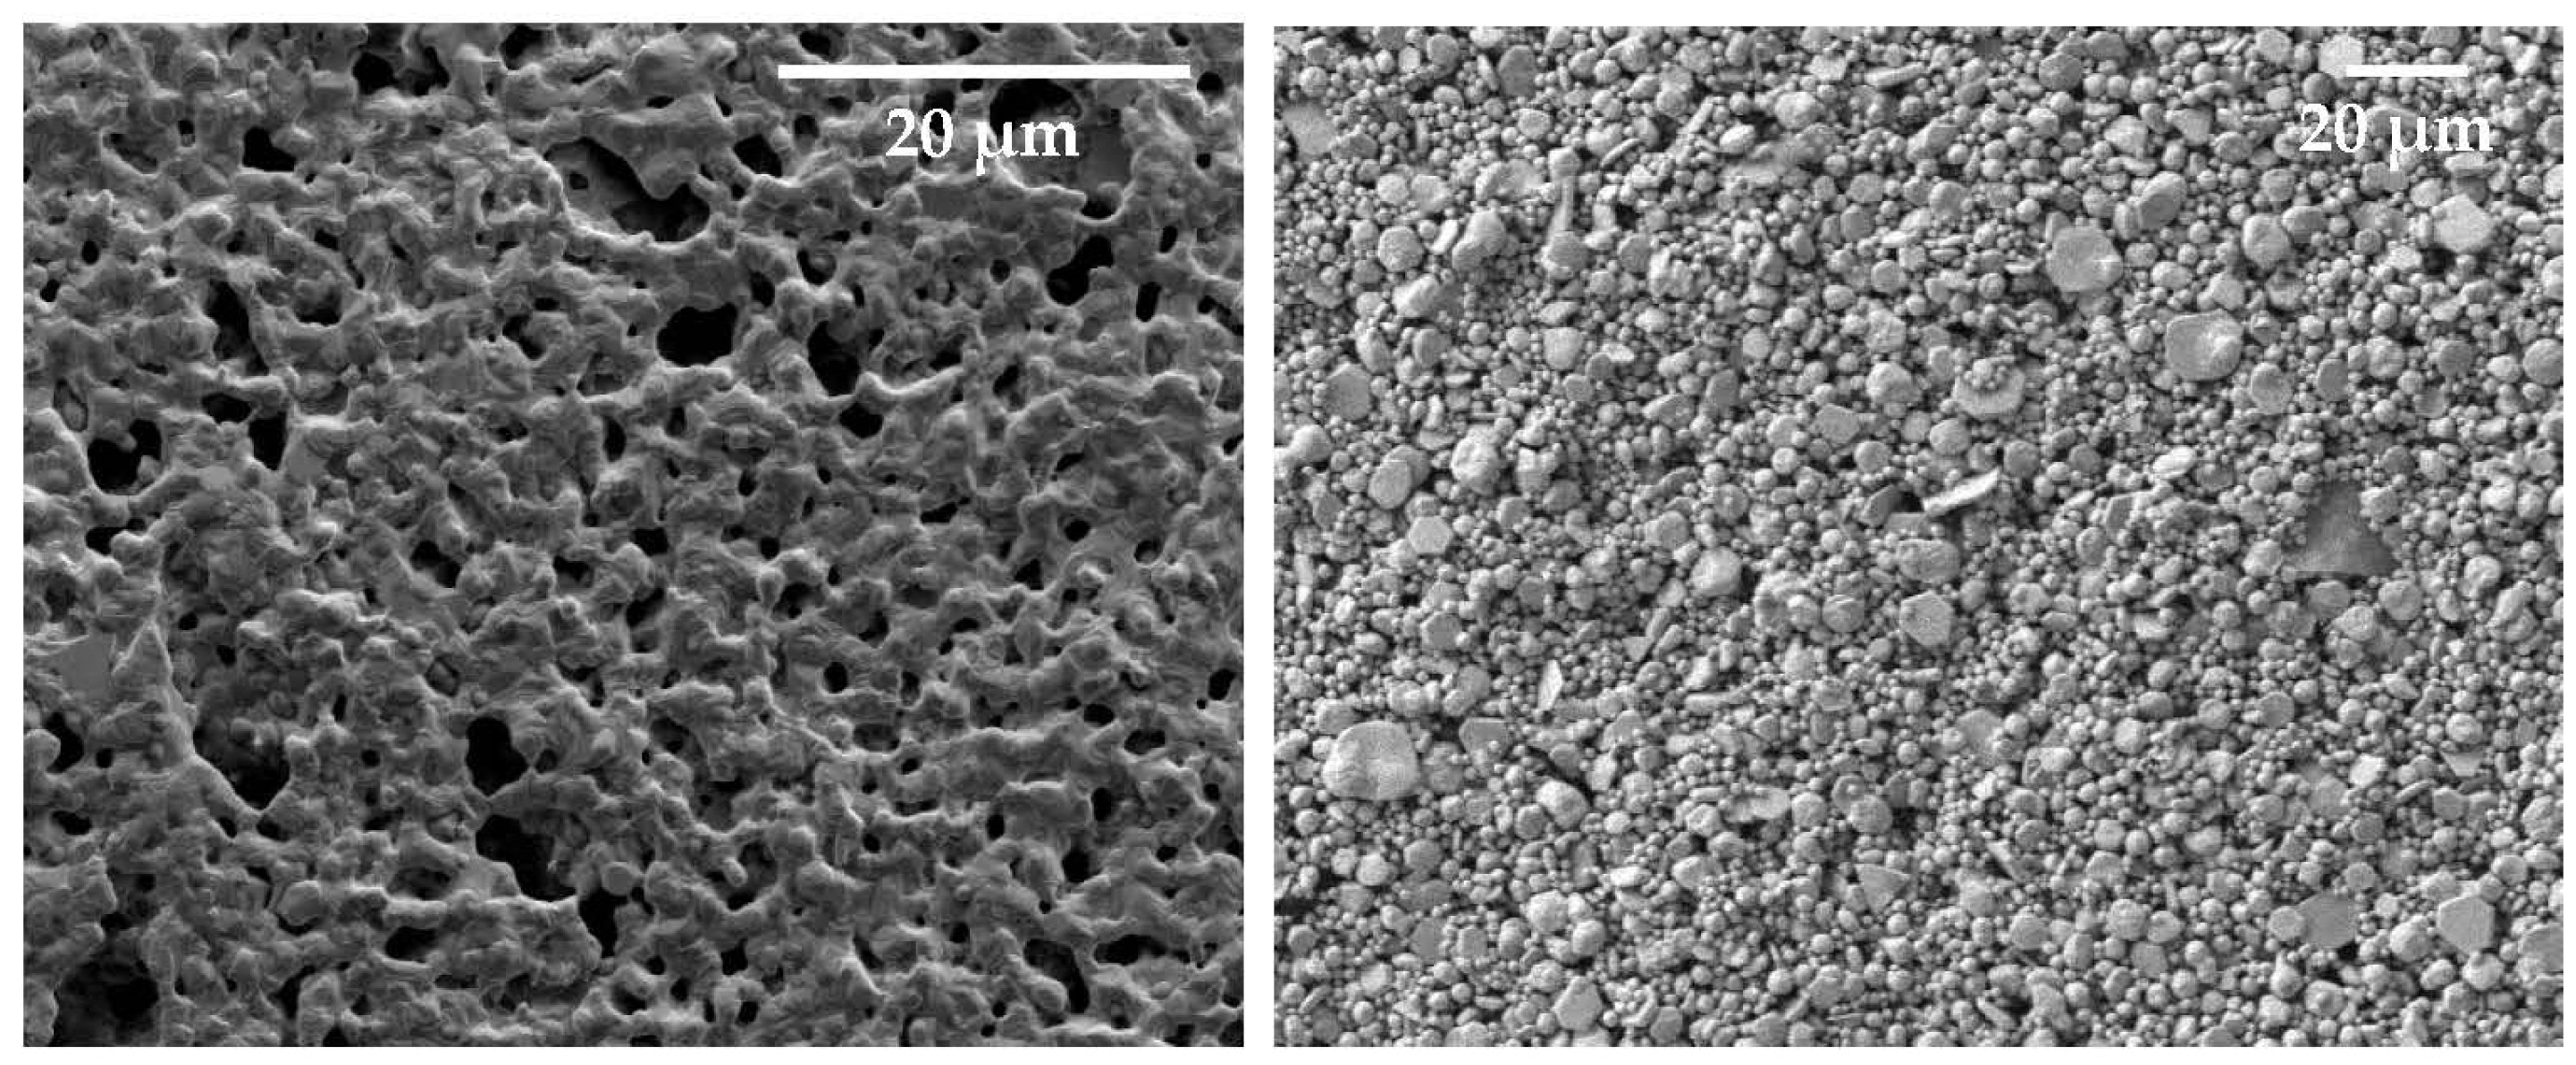
Gold was added initially at 75 wt%, 80 wt%, and 85 wt% loading, and the ink was DAC mixed; however, none of the inks exhibited conductivity. Scanning electron microscopy was carried out to determine whether there was sufficient contact between gold flakes to enable percolation.
Figure 8 (left) shows an image where particle agglomeration and regions of pure polymer, i.e., non-conductive regions, were evident. This suggested deagglomeration was required through higher-intensity mixing methods. While several methods exist, such as three-roll milling, this method requires high volumes of ink (at least 25 g), and the rollers present a high chance of contamination when used in an R&D environment. A more feasible solution was the use of stainless-steel ball bearings in a DAC mixer pot (
Figure 8, right) to increase deagglomeration while working with low volumes of ink and minimising risk of contamination. Note that issues of contamination and ink volume are unlikely to translate to industrial manufacturing; therefore, three-roll milling could be a viable commercial option.
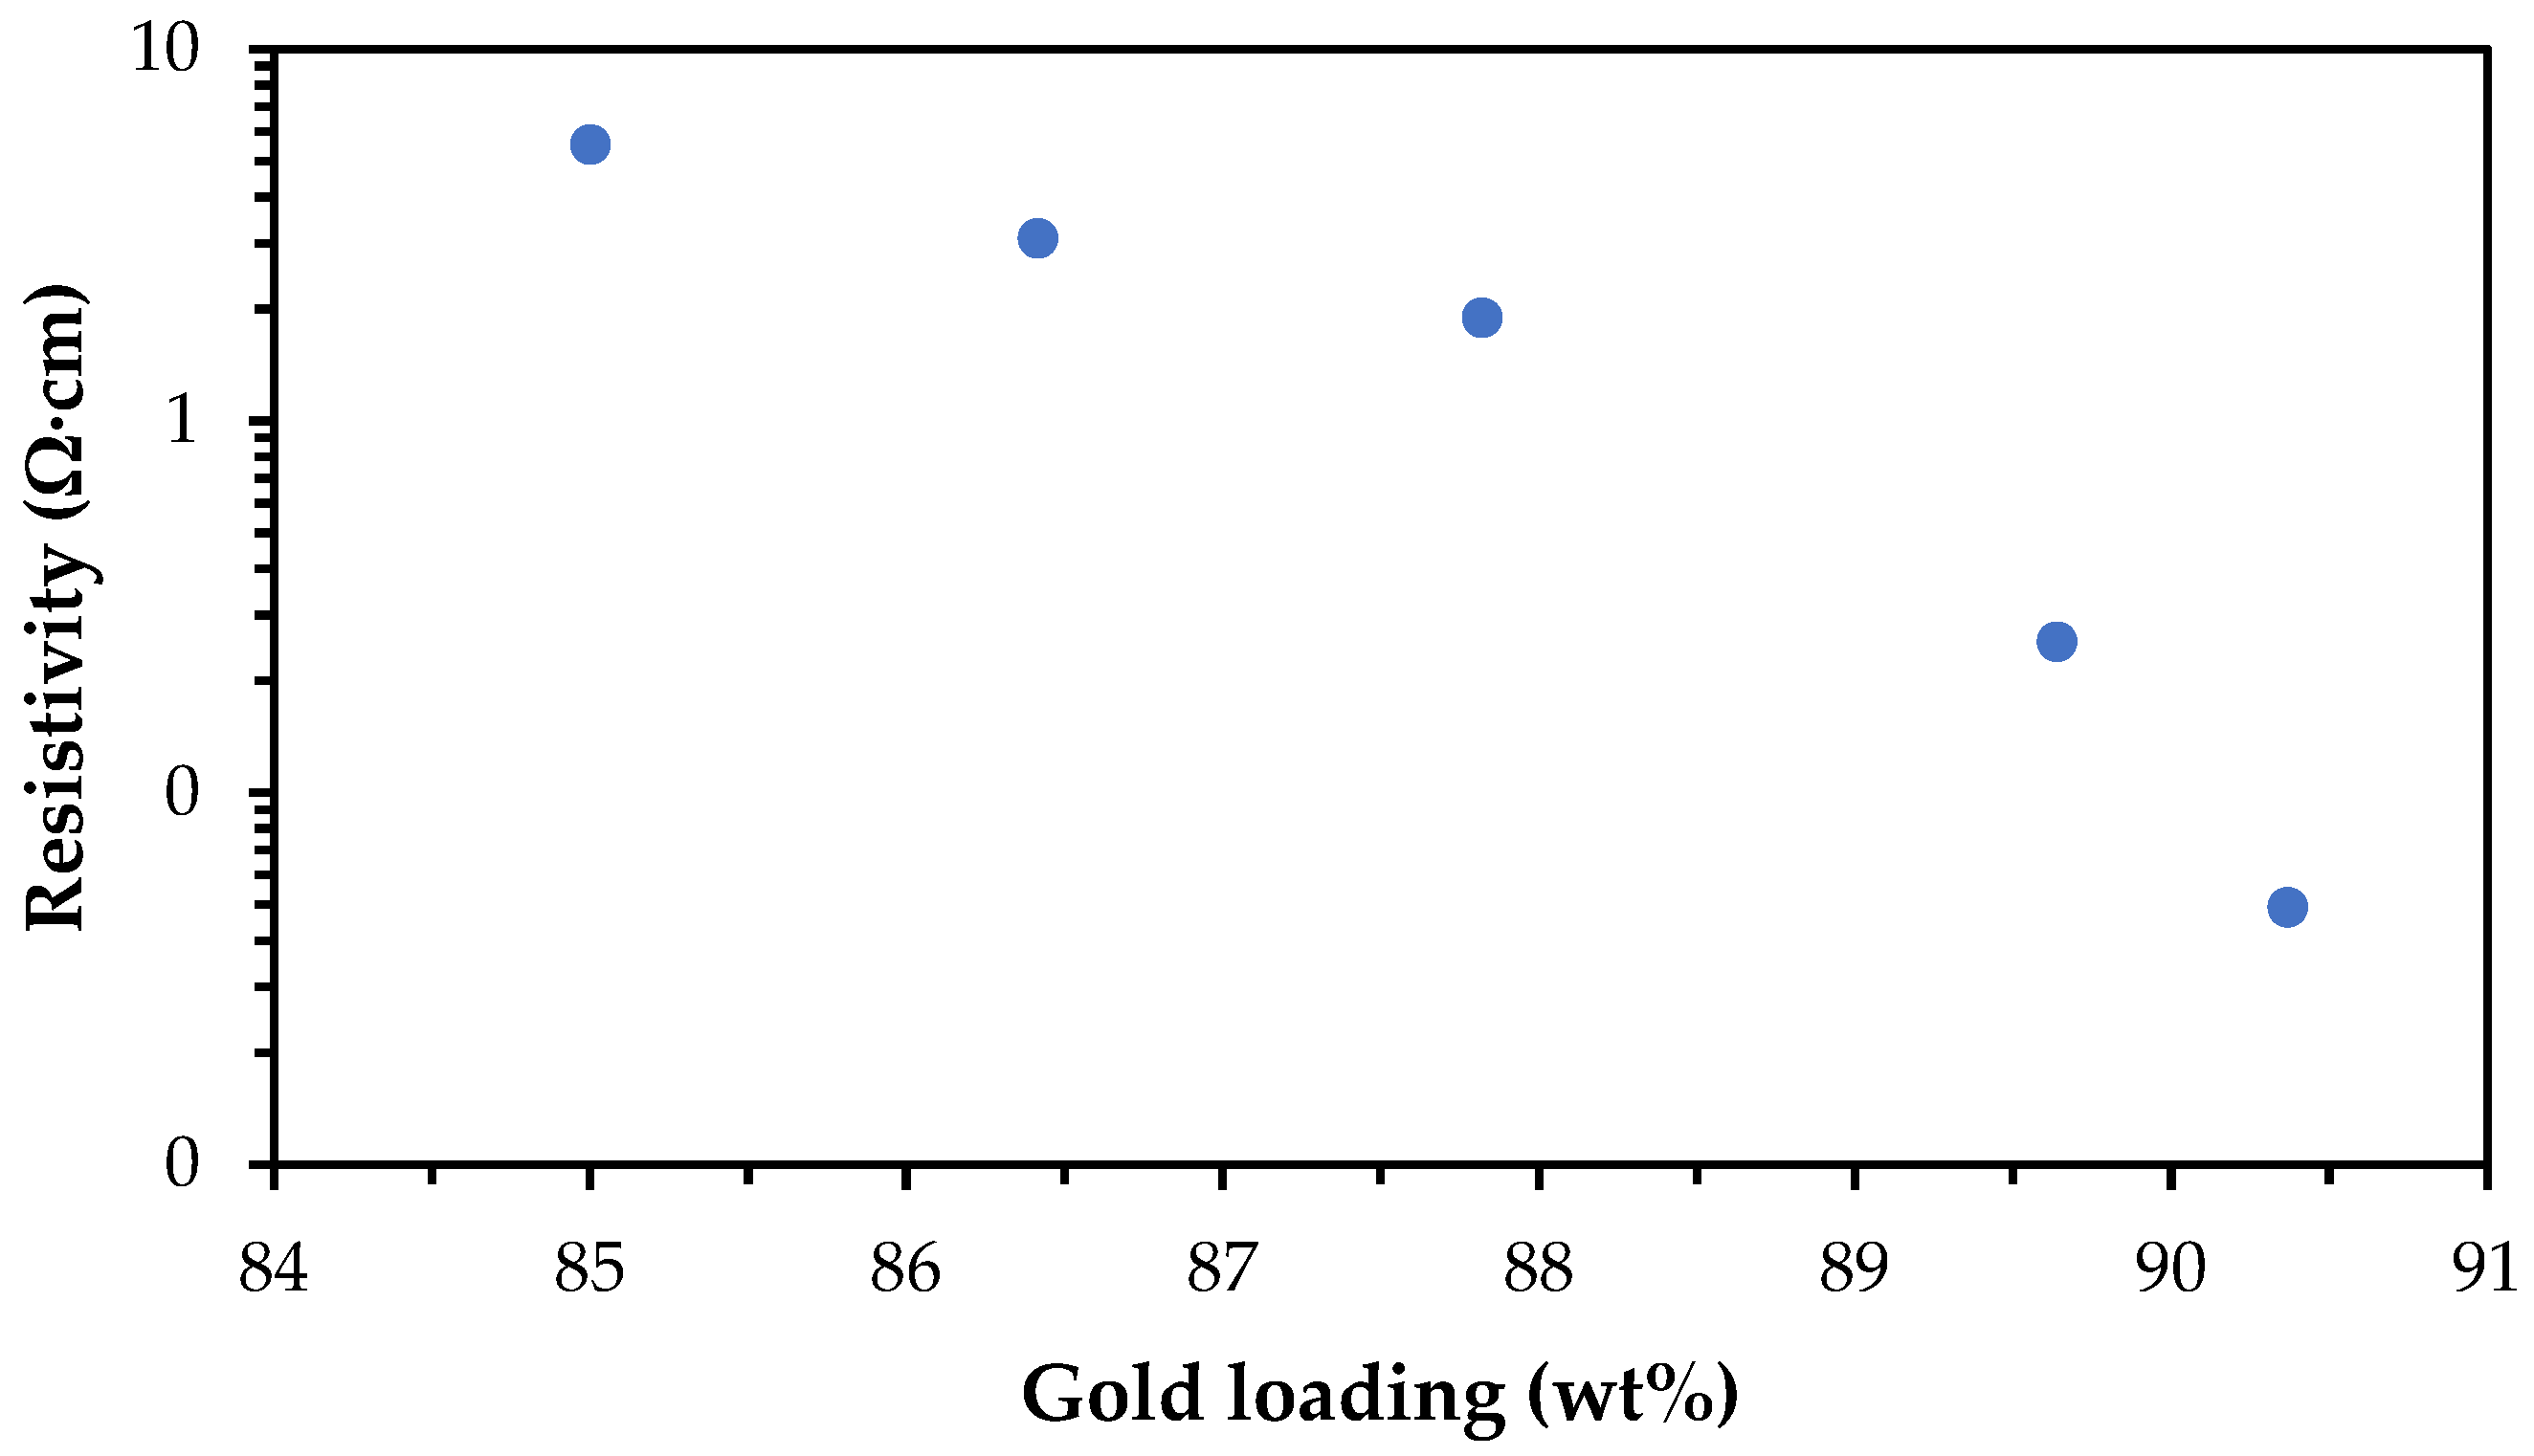
Following the mixing improvements, the ink containing 85 wt% gold flake was found to be conductive. The conductivity was optimised for the target application by increasing the gold loading to 90.5 wt%, which achieved a resistivity of 4.92 × 10
−2 Ω·cm (
Figure 9).
3.4. Recovery and Reuse of Silver and Gold
A key goal of this work was to recover and reuse silver and gold from the metallic components of a fully fabricated electronic device. In this situation, the conventional method of recovery would involve the chemical leaching of metallic salts and then subsequent resynthesis into particles or flakes. This is a long, expensive, and complex process [
18]. Given that this work had full control of the ink components, closed-loop recycling using a solvent extraction process was developed.
The process outlined in
Section 2.9 was initially carried out on waste inks generated during development work and test substrates where only one ink type, either silver or gold, had been printed. The recovered silver and gold powders were found to be contaminant free when analysed by ICP-MS, with 100% of the recovered mass attributed to either silver or gold.
Figure 10 shows images of silver sediment, dried powder, gold sediment, and gold powder from left to right.
Both recovered metal powders were then used to produce second-generation inks, which demonstrated near identical electrical performance,
Table 4. However, a reduction in viscosity recovery for the silver ink was notable. The silver flake used in the ink formulation is known to be coated with low-molecular-weight molecules to enhance the rheological stability and prevent sedimentation. It was hypothesised that the recycling process had removed this organic coating from the silver flake’s surface, therefore altering the intermolecular interactions between the silver flake and surrounding polymer solution and the inks’ resultant rheology. Furthermore, the reduction in resistivity of the silver and gold inks would support this hypothesis.
To demonstrate the selective solubilities of the silver and gold polymeric binders, substrates that contained both silver and gold inks were separated using the sequential washing steps outlined in
Section 2.9. The recovered silver powder was found to be pure, containing 100% silver. Conversely, a small amount of silver contamination (1.03%) was found in the recovered gold powder, as measured by ICP-MS. This was thought to be due to the presence of partially unbound silver on the surface of the tracks and mechanical agitation resulting in physical removal of a small amount of silver.
Both virgin and recycled silver inks were compared to a commercial equivalent (
Table 5). Novel inks showed slightly increased resistivity relative to a commercial counterpart at equivalent silver loading and curing temperature.
Gold inks were compared with a commercially available screen ink, as no commercial gold ink that was compatible with the Voltera printer existed. The ink that was developed within the project achieved a significantly higher resistivity due to sintering (i.e., melting of nano-sized metallic particles into a uniform film [
63]) not being employed; therefore, conductivity relied on percolation between flakes (
Table 6). However, the drying and sintering temperatures for the commercial ink were significantly higher, resulting in greater energy usage.
3.5. Sensor Fabrication
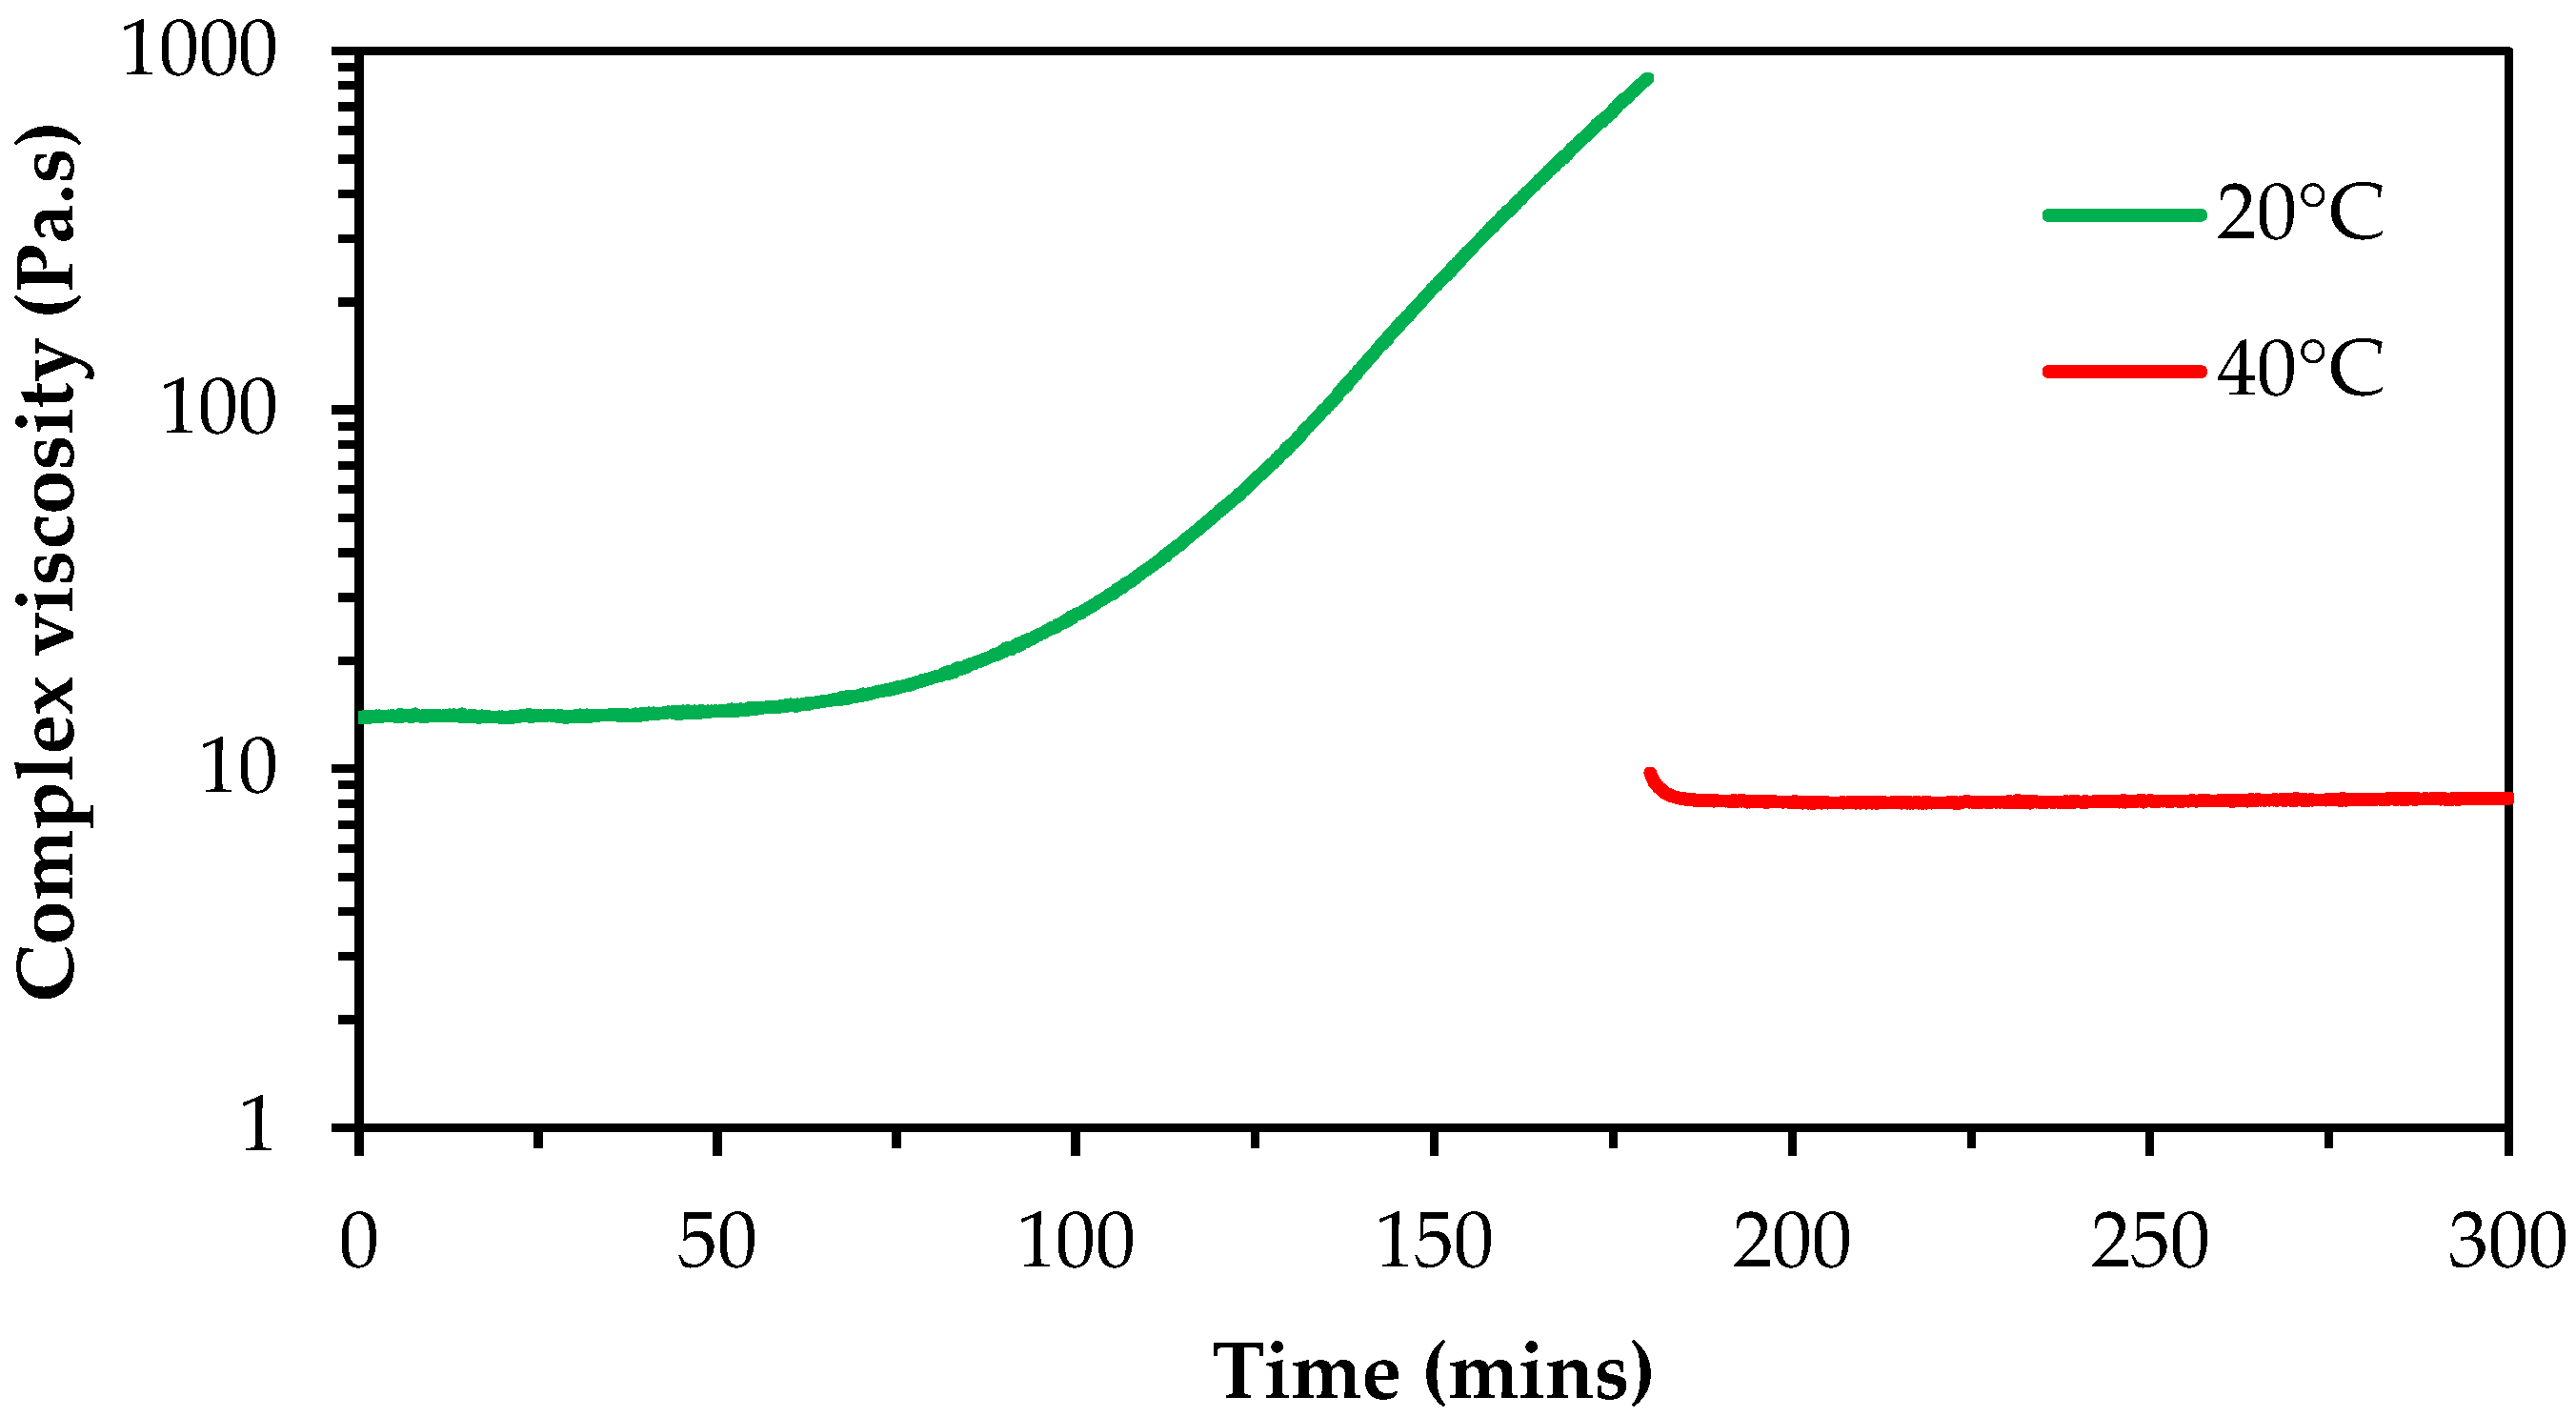
Virgin and recycled silver inks were screen printed to produce base electrodes; no notable differences between the two inks were observed during printing. The virgin gold ink was printed using the Voltera V-One, where print settings were modified to achieve high reproducibility and ink coverage, i.e., no gaps in the printed pads. However, variability in print performance over time was noted, resulting in the nozzle becoming blocked after an hour of printing. This was attributed to the ink solidifying in the syringe during printing. This was also observed when inks were left in ambient conditions in a sealed sample vial for an hour after mixing; therefore, it was hypothesised that this change was due to the ink cooling rather than a result of shearing occurring during printing. To quantify this change and ascertain the effect of reheating the ink, the base polymer solution was analysed using rheology, whereby the same sample was assessed at 20 °C and subsequently heated to 40 °C. It was noted that a significant increase in viscosity occurred after 1 h (
Figure 11, green line), which limits the useability of the ink. However, heating the sample had an immediate and notable effect on reducing the viscosity and maintaining viscosity over a useful time period (
Figure 11, red line).
Clearly, it was desirable to print the ink while in a heated state. Unfortunately, the Voltera V-One printer does not possess the capability to heat the ink-filled syringe during printing. Therefore, the printer was housed inside of a heated enclosure. This resulted in significantly improved reproducibility of the printed sensors and allowed for printing to be carried out over the course of four hours without the print performance suffering or failing.
Optimisation of the sensor print settings focused on the anti-stringing distance, feed rate, and dispense height [
65]. Anti-stringing distance can be used to increase the distance the syringe raises from the substrate when moving between print regions to ensure no excess material remains attached to the nozzle. Failure to correctly optimise this setting can result in bridging between printed areas, leading to electrical shorts in the printed device. Feed rate and dispense height were interdependent; high feed rates usually require a low dispense height to ensure complete coverage, and low feed rates benefit from a high dispense height to minimise material build up and overprinting.
Devices were produced using the settings shown in
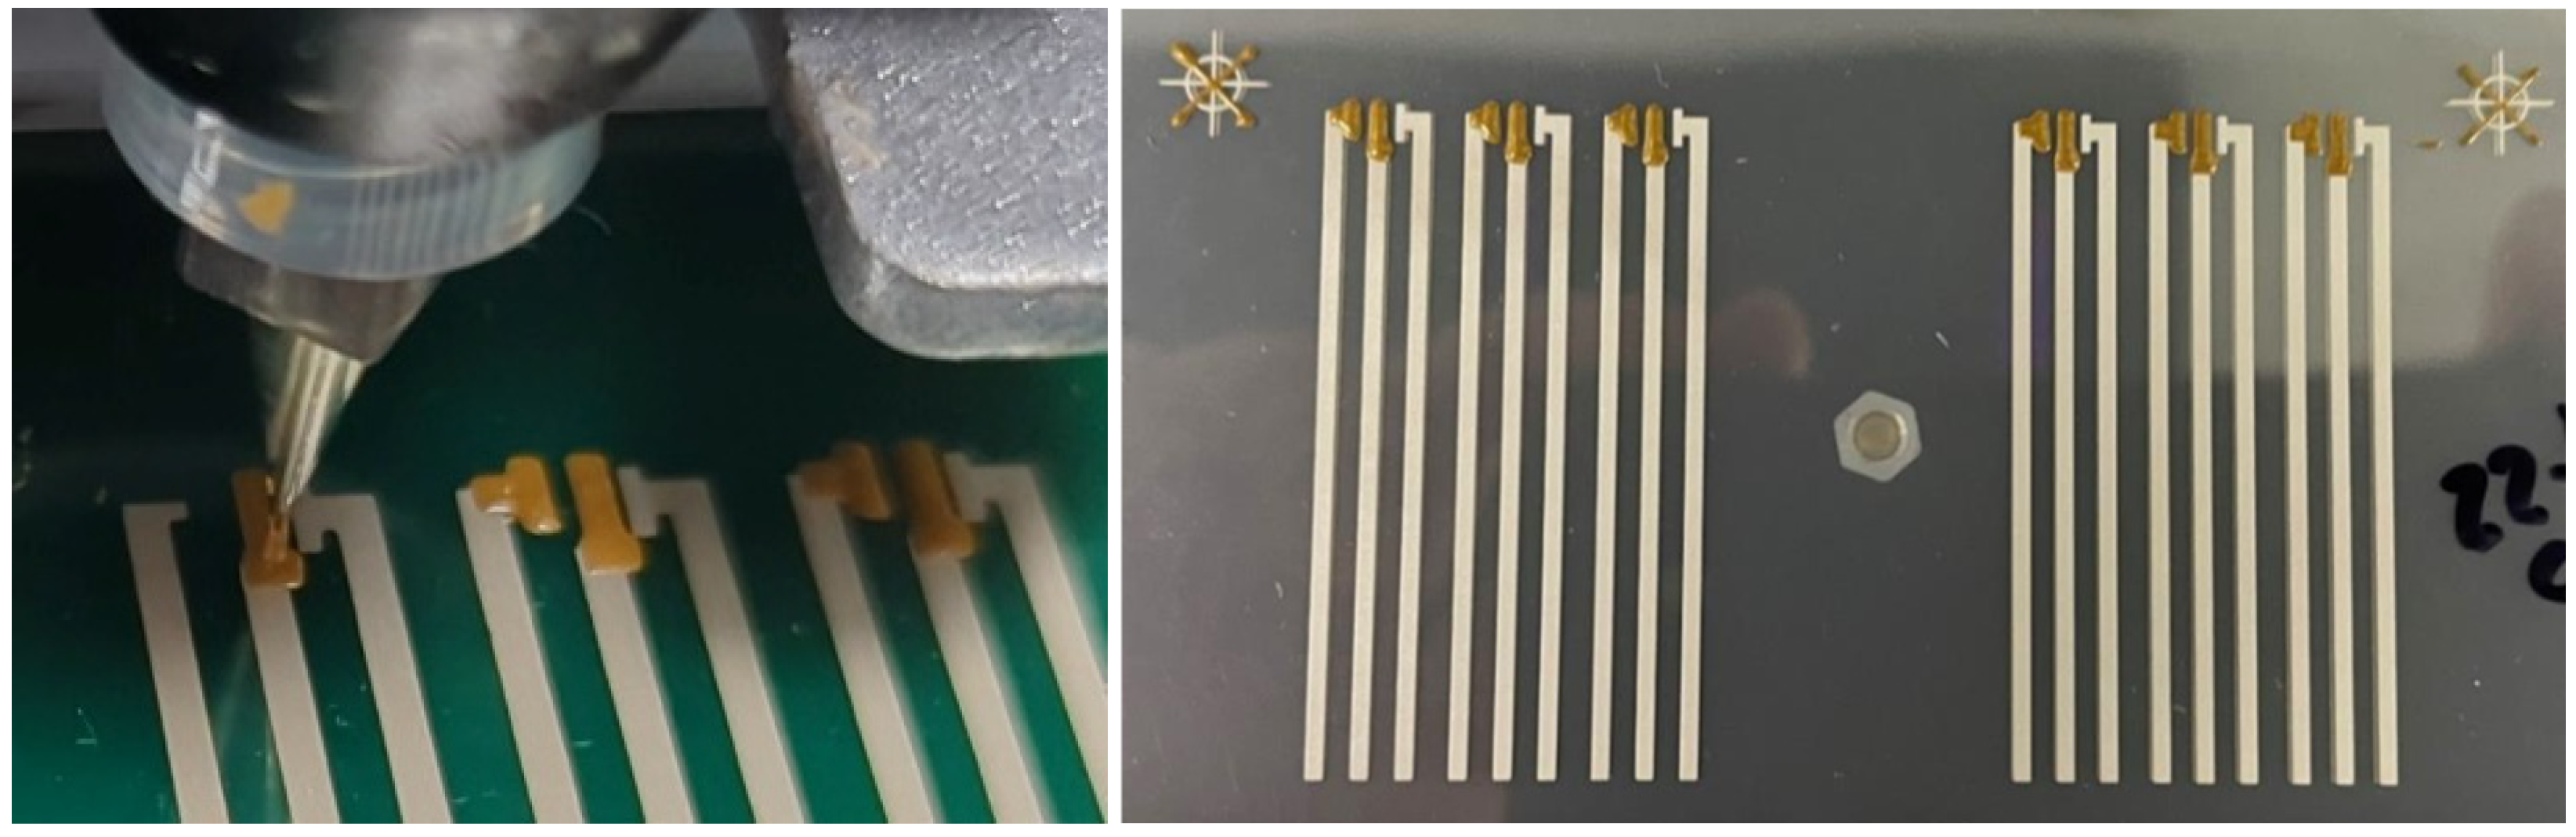
Section 2.8 with virgin and recycled gold ink onto virgin and recycled silver electrodes on PET and PLA. The same print settings were used for all device variations. Final devices showed gold pads to be well defined, and no stringing was observed, as shown in
Figure 12.
Four sets of devices were fabricated: (i) Sensor1—PET with virgin Ag and Au inks, (ii) Sensor2—PET with recycled Ag and Au inks, (iii) Sensor3—PLA with virgin Ag and Au inks, and (iv) Sensor4—PLA with recycled Ag and Au inks. Note that adhesion was comparable for inks on both substrates where an ISO crosshatch test revealed no ink could be removed (ISO classification 0). This was significant because PET contained an adhesion promoter and the PLA did not.
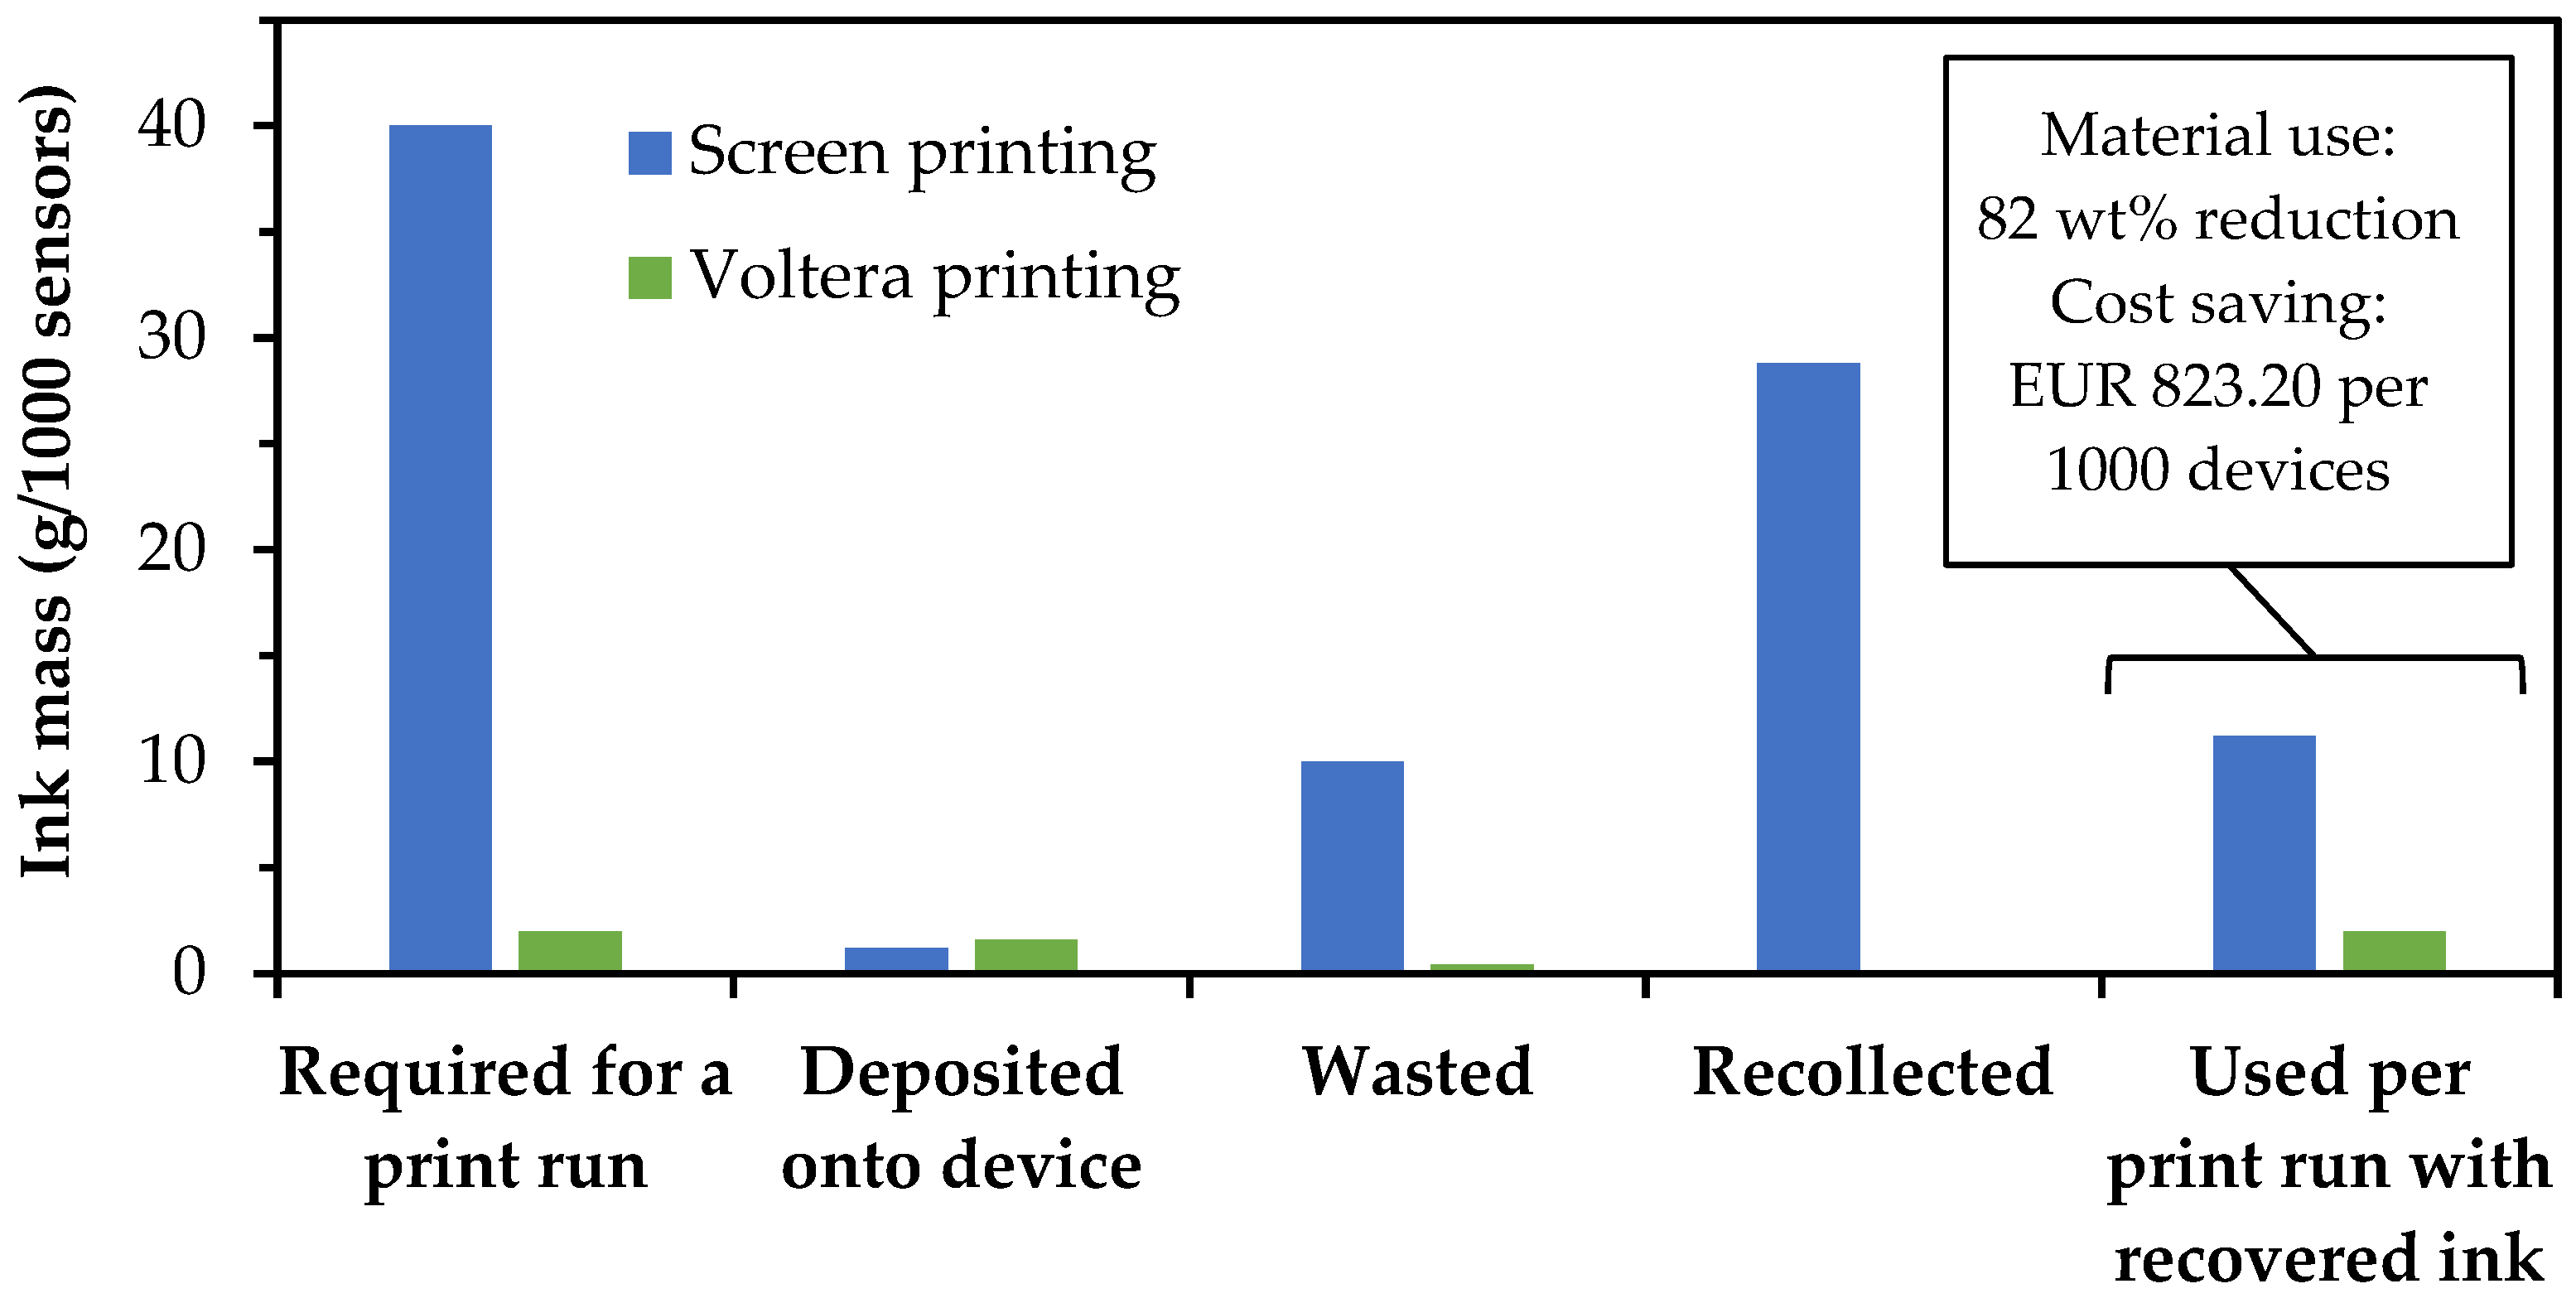
Printed biosensors are fully screen printed when manufactured commercially; therefore, a desk-based evaluation was carried out to compare ink usage for screen printing and Voltera printing to assess commercial viability. The mass of ink used and lost was recorded at each stage of a commercial 1000 device biosensor screen print run using a commercially available gold screen ink: (i) ink applied to the screen at the start the process, (ii) ink recovered after printing 1000 devices, (iii) ink mass applied to the substrate, and (iv) calculated the ink wasted. The losses during Voltera printing of 18 devices were also weighed and recorded at the following stages (i) ink lost during transfer from DAC pots to the syringe, (ii) ink applied to the substrate, and (iii) calculated ink remaining in the syringe that was not possible to recover. These values were extrapolated to 1000 devices to enable a fair comparison.
Figure 13 shows the comparison where the final column represents the significant drop in material usage when factoring in the amount of ink recovered from the screen after printing. This material saving was converted to a cost saving using a gold price of EUR 89.46 per gram, as quoted by Metalor on 17 October 2024.
3.6. Functionalisation and Electrochemical Testing
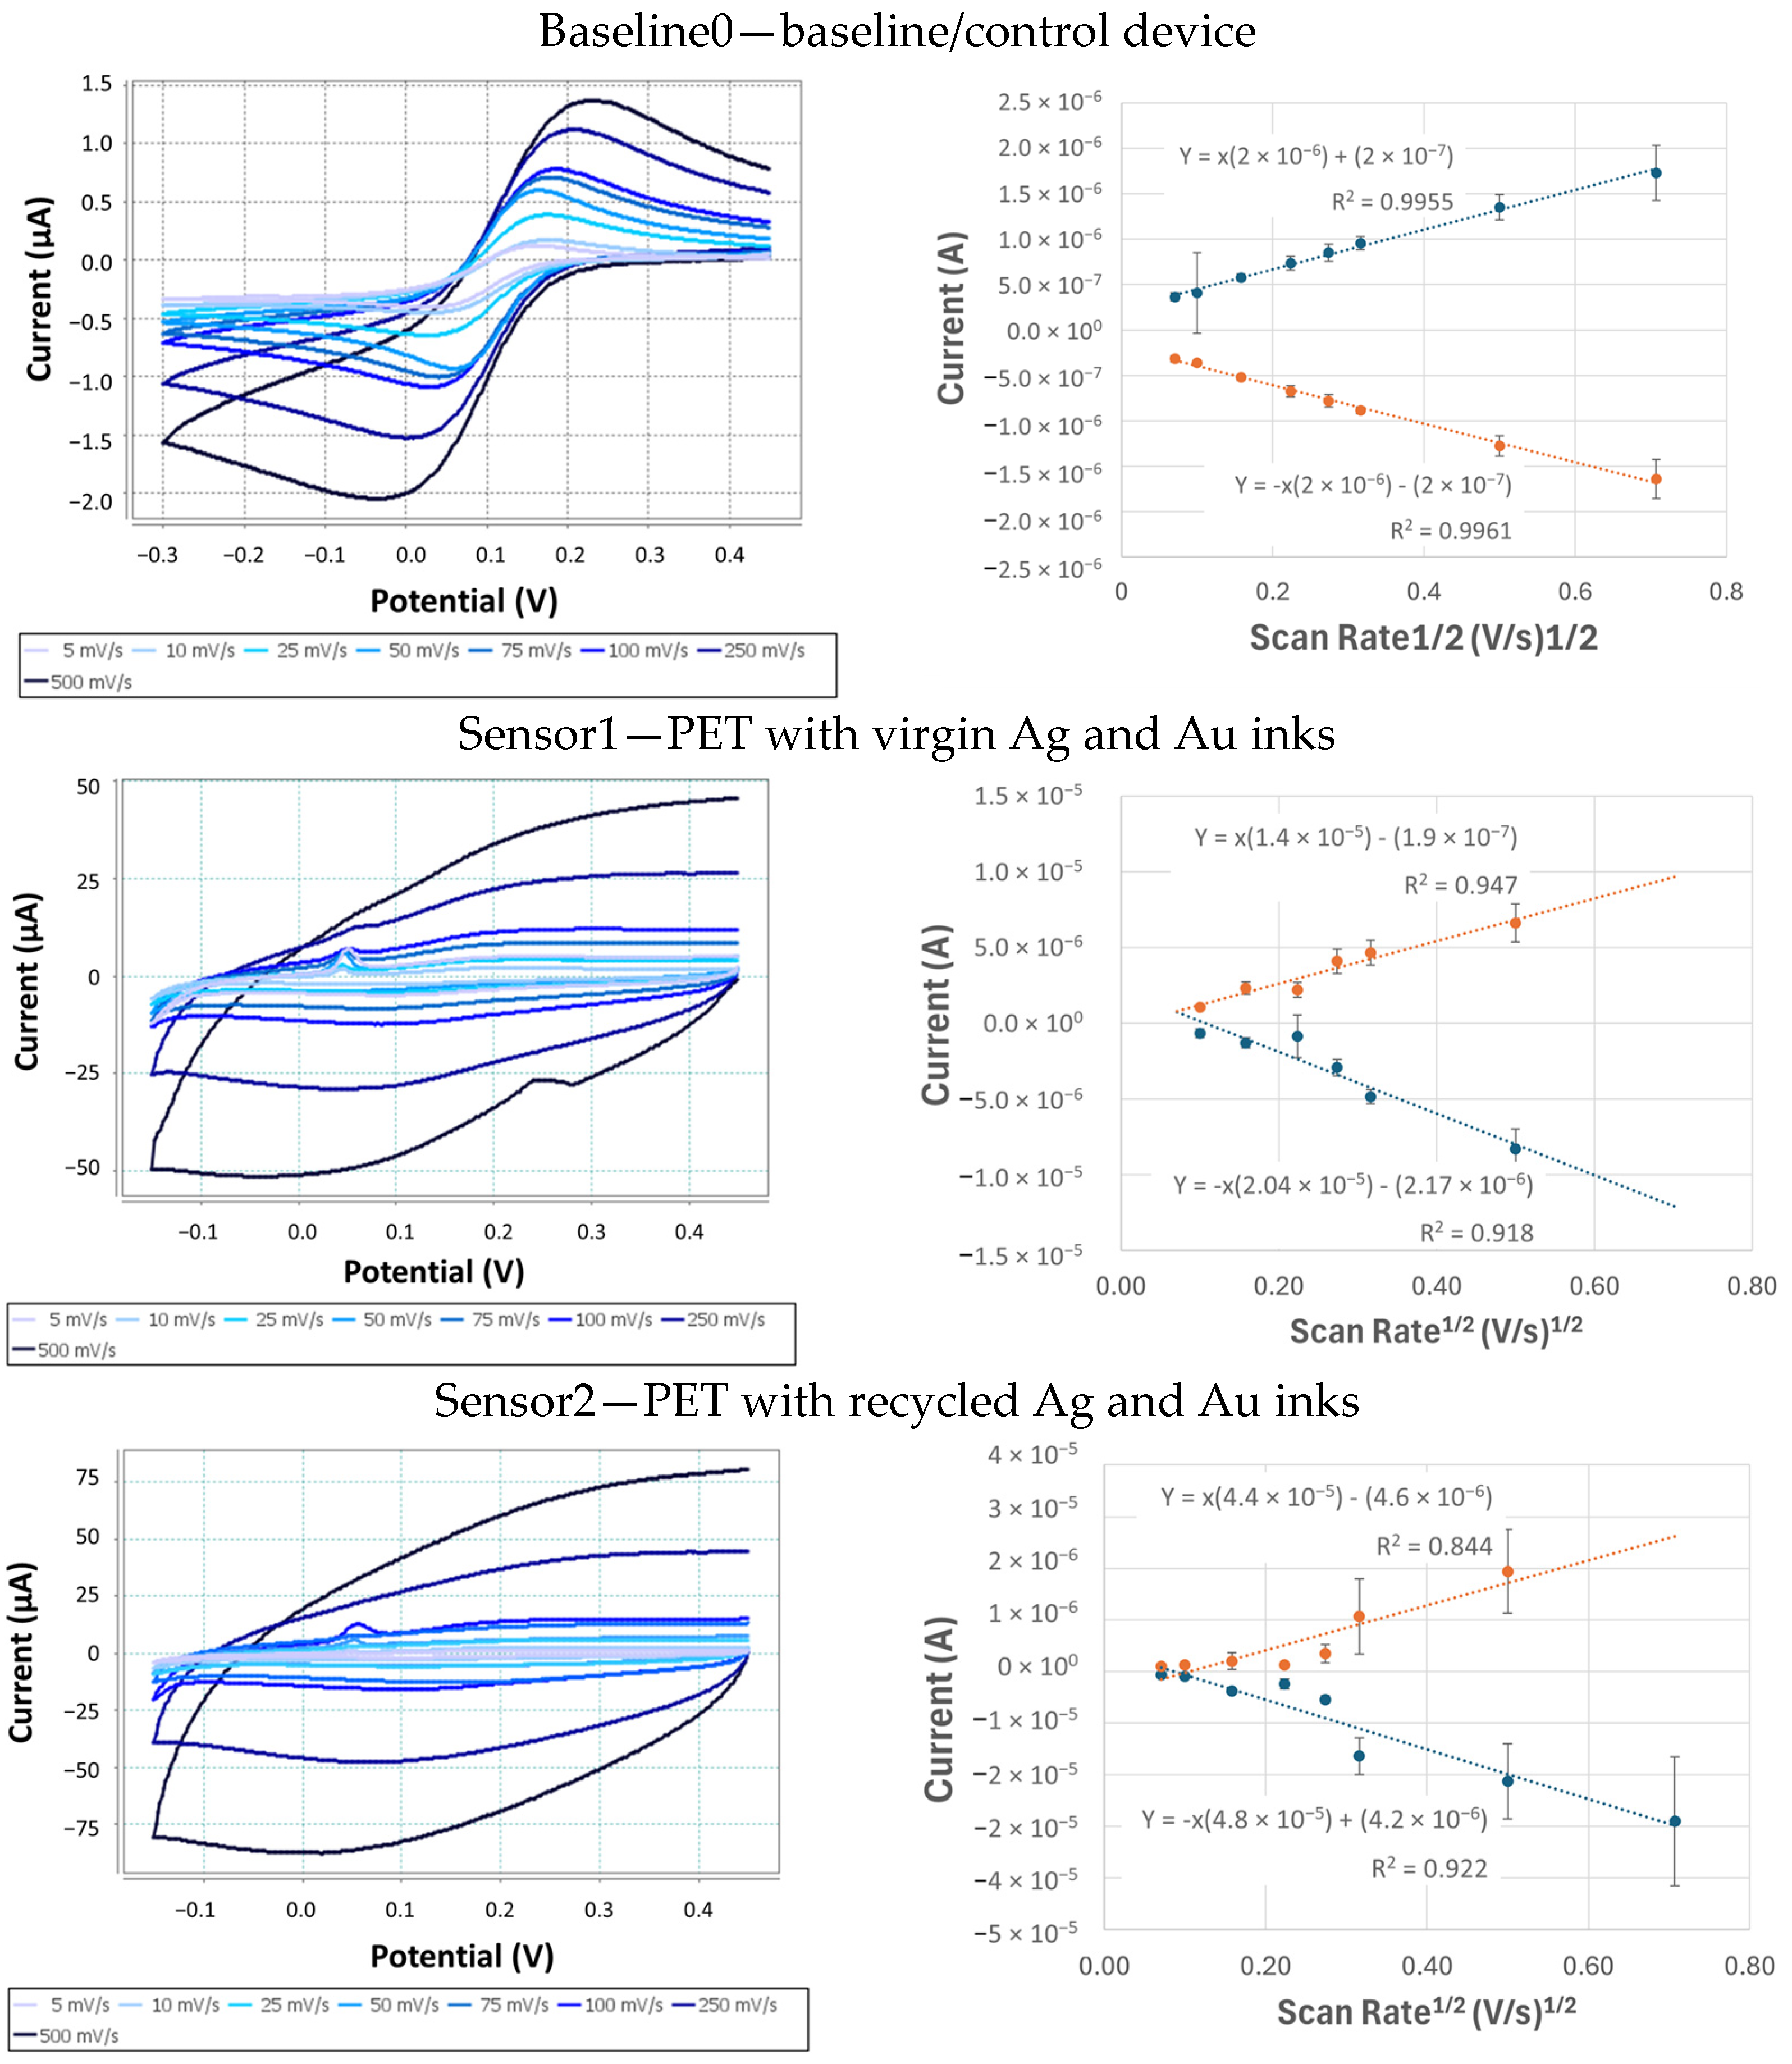
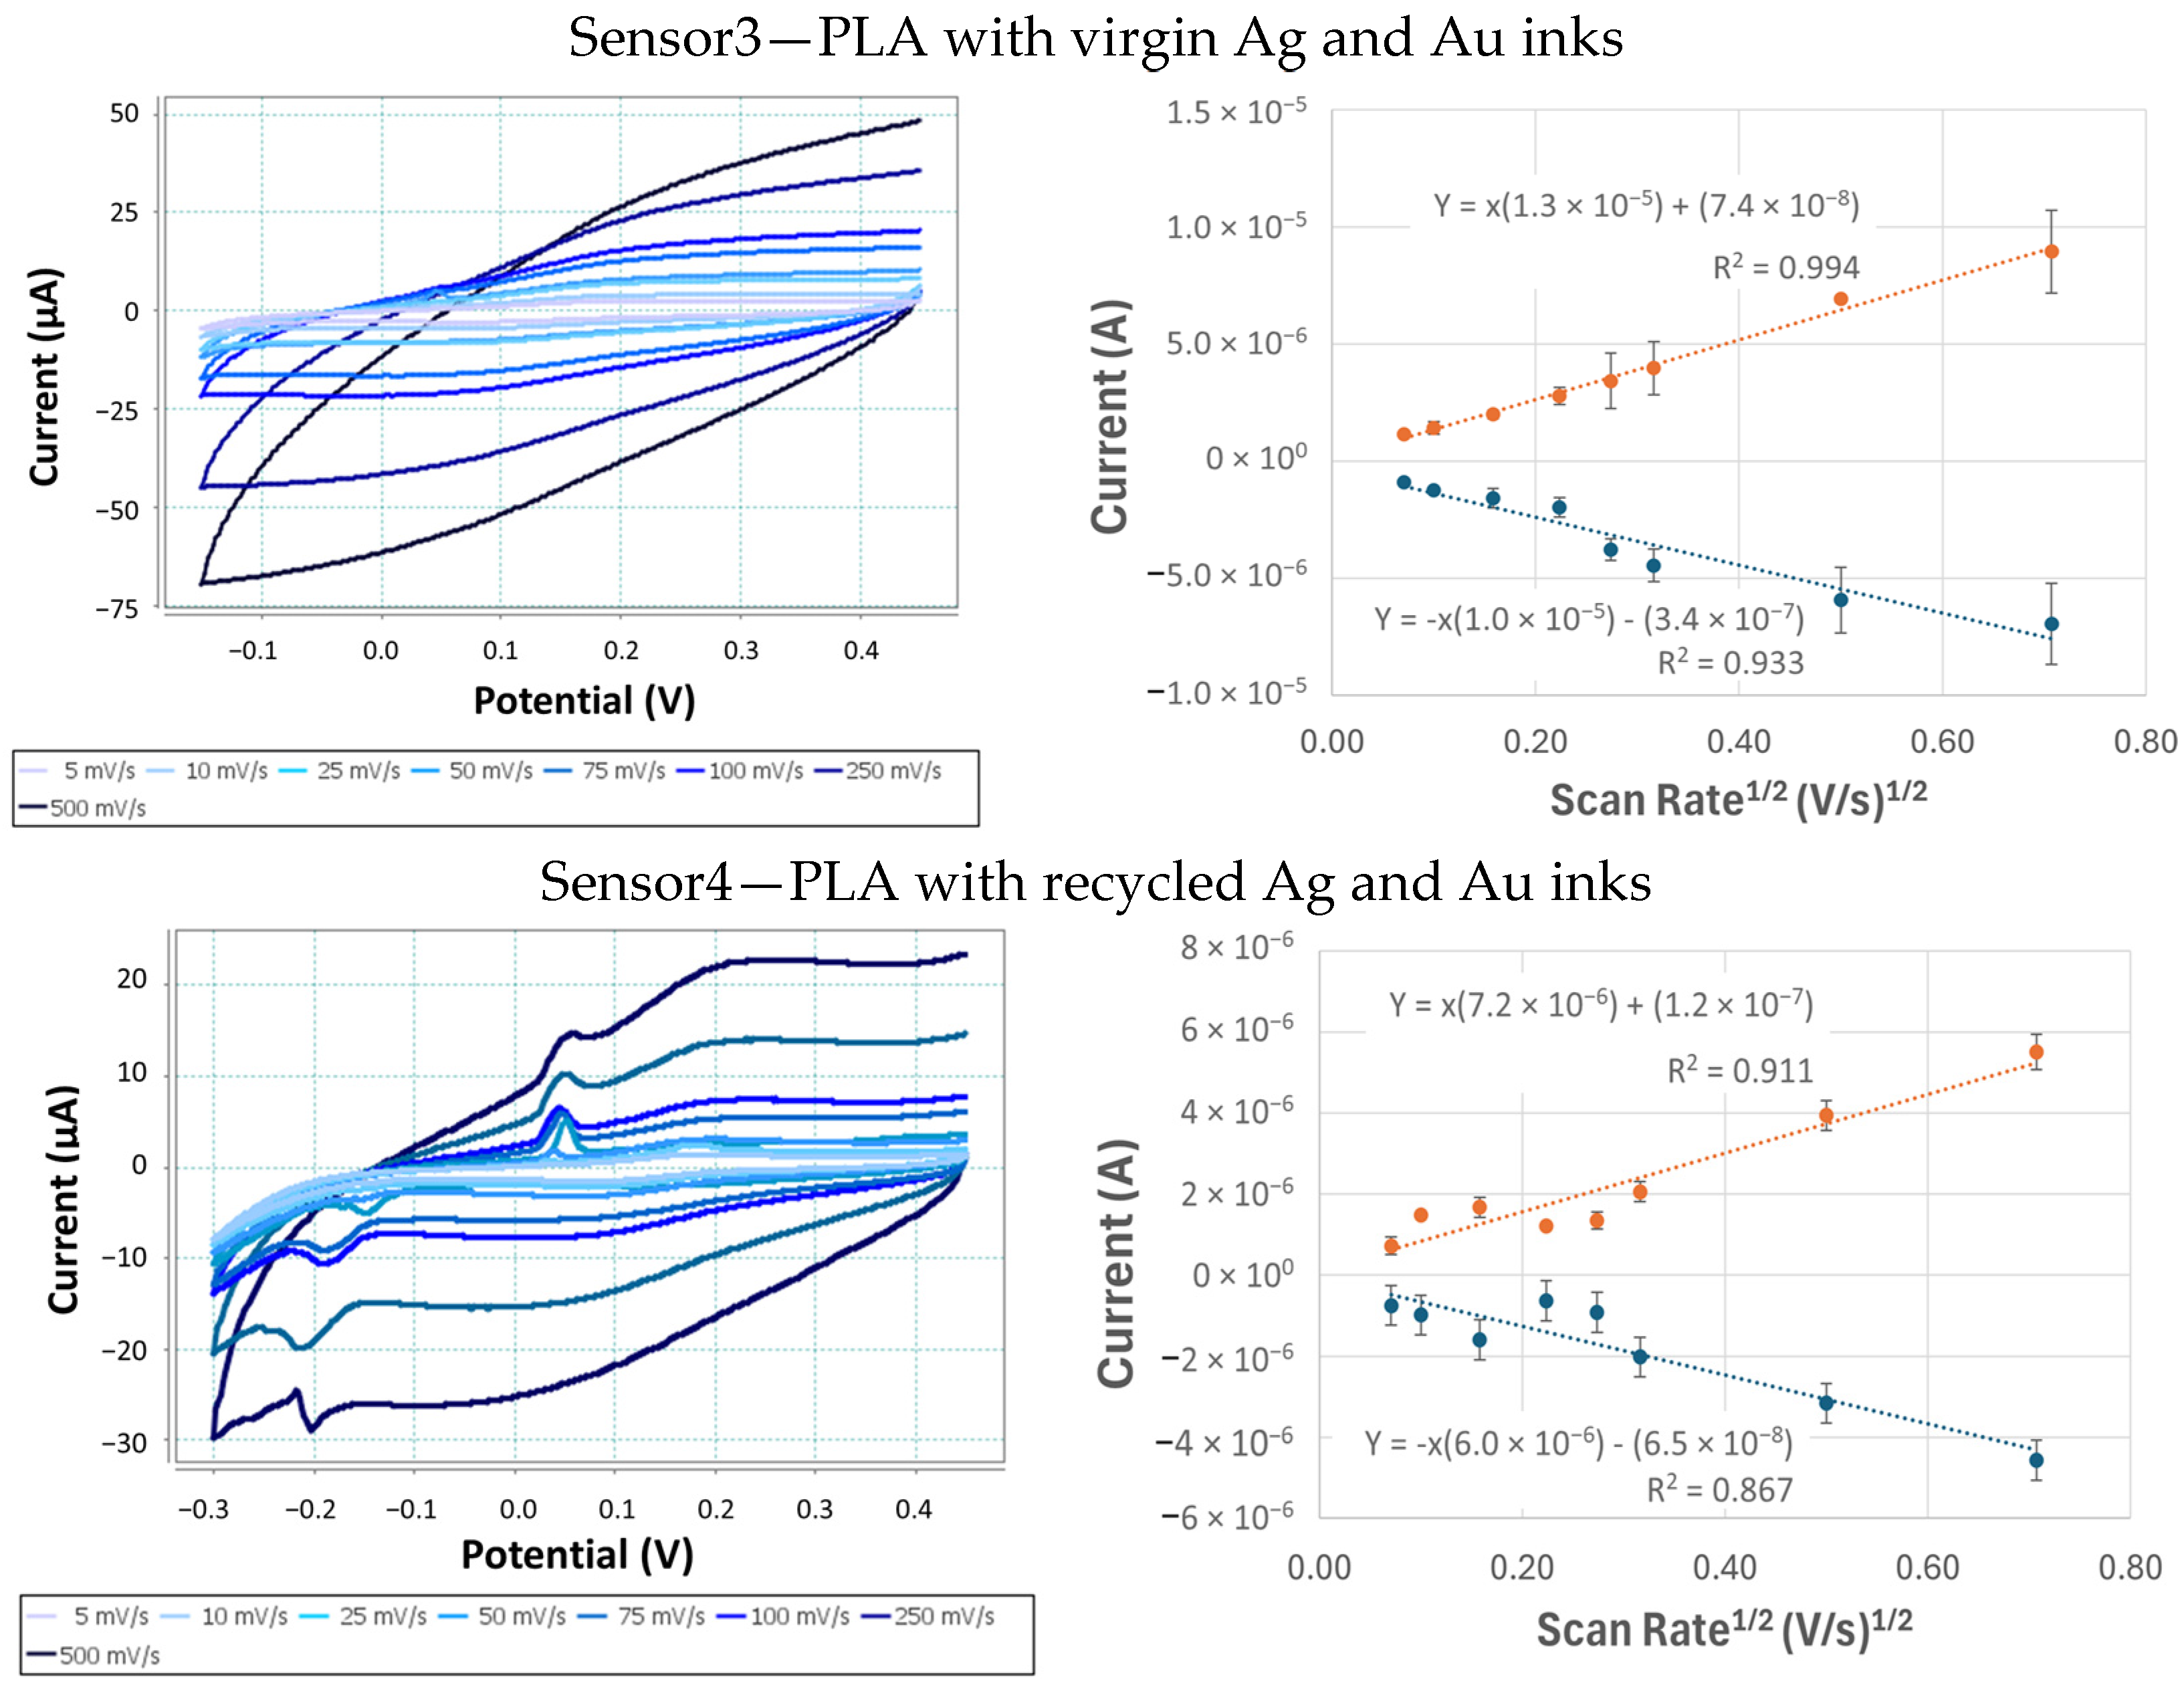
Novel and baseline biosensors were evaluated using electrochemical test methods to determine their performance as glucose biosensors. Cyclic voltammetry was employed to calculate the electroactive area of the working electrode according to the Randles–Ševćik equation (Equation (1)) [
66]. This parameter is crucial for understanding and optimizing its analytical performance, as this parameter determines the effective amount of surface area available for electron transfer between the electrode and the analyte, in this case K
3[Fe(CN)
6]. A larger electroactive area generally translates into a higher density of active sites, which increases sensitivity and improves the kinetics of electrochemical reactions. In the case of screen-printed electrodes, it is necessary that the electroactive area of the different screen-printed electrodes be as similar and reproducible as possible.
where
Ip is the peak current of redox couple,
n is the number of electrons participating in the redox reaction,
A is the electroactive surface area (cm
2),
D is the diffusion coefficient of K
3[Fe(CN)
6] in the solution (cm
2/s),
C is the concentration of K
3[Fe(CN)
6] in the bulk solution (mol/cm
3), and
ν is the scan rate (V/s). The electrode areas calculated using the Randles–Ševćik equation and cyclic voltammetry were undertaken with eight different scan rates (5, 10, 25, 50, 75, 100, 250, and 500 mV s
−1),
Figure 14.
It can be observed that unlike the control electrode, which has well-defined peaks, the developed electrodes exhibit a high capacitive current, making it difficult to accurately determine the electrochemical peaks corresponding to the faradaic charge, potentially due to a difference in surface topography or a high double-layer capacitance. SEM analysis was carried out to assess the gold sensor surface for visual quality,
Figure 15.
Once the voltametric study of the electrodes at different scan rates was carried out, the current peak height was calculated. This was performed for both the anodic and cathodic peaks, and calibration curves were created representing the square root of the scan rate versus the current. From the equation of the curve for each of the peaks and Randles– Ševćik equation (Equation (1)), the electroactive area of the electrode can be obtained.
Table 7 shows the results of the average of the values obtained for the electroactive area and variability for each of the electrodes studied compared to the theoretical geometric area.
All novel devices exhibited a higher electroactive surface area, potentially due to the increased surface roughness created by using flakes rather than a smooth sintered surface. The variability observed for the novel devices was higher than the baseline device and significantly higher for the PET when compared with PLA. This was thought to be due to a difference in drying conditions for device sets; PET devices were dried at 120 °C, whereas PLA samples were dried at ambient temperature. Slower drying results in a higher degree of ink spreading, allowing for the surface of the sensor to level to result in a more homogenous topography. Variability of reproducibility was due to a combination of variation in electrode print area through Voltera printing and manual placement of a dielectric tape. This is an opportunity for further improvement in future by employing screen printing for the dielectric layer to create a reproducible opening area for the electrodes.
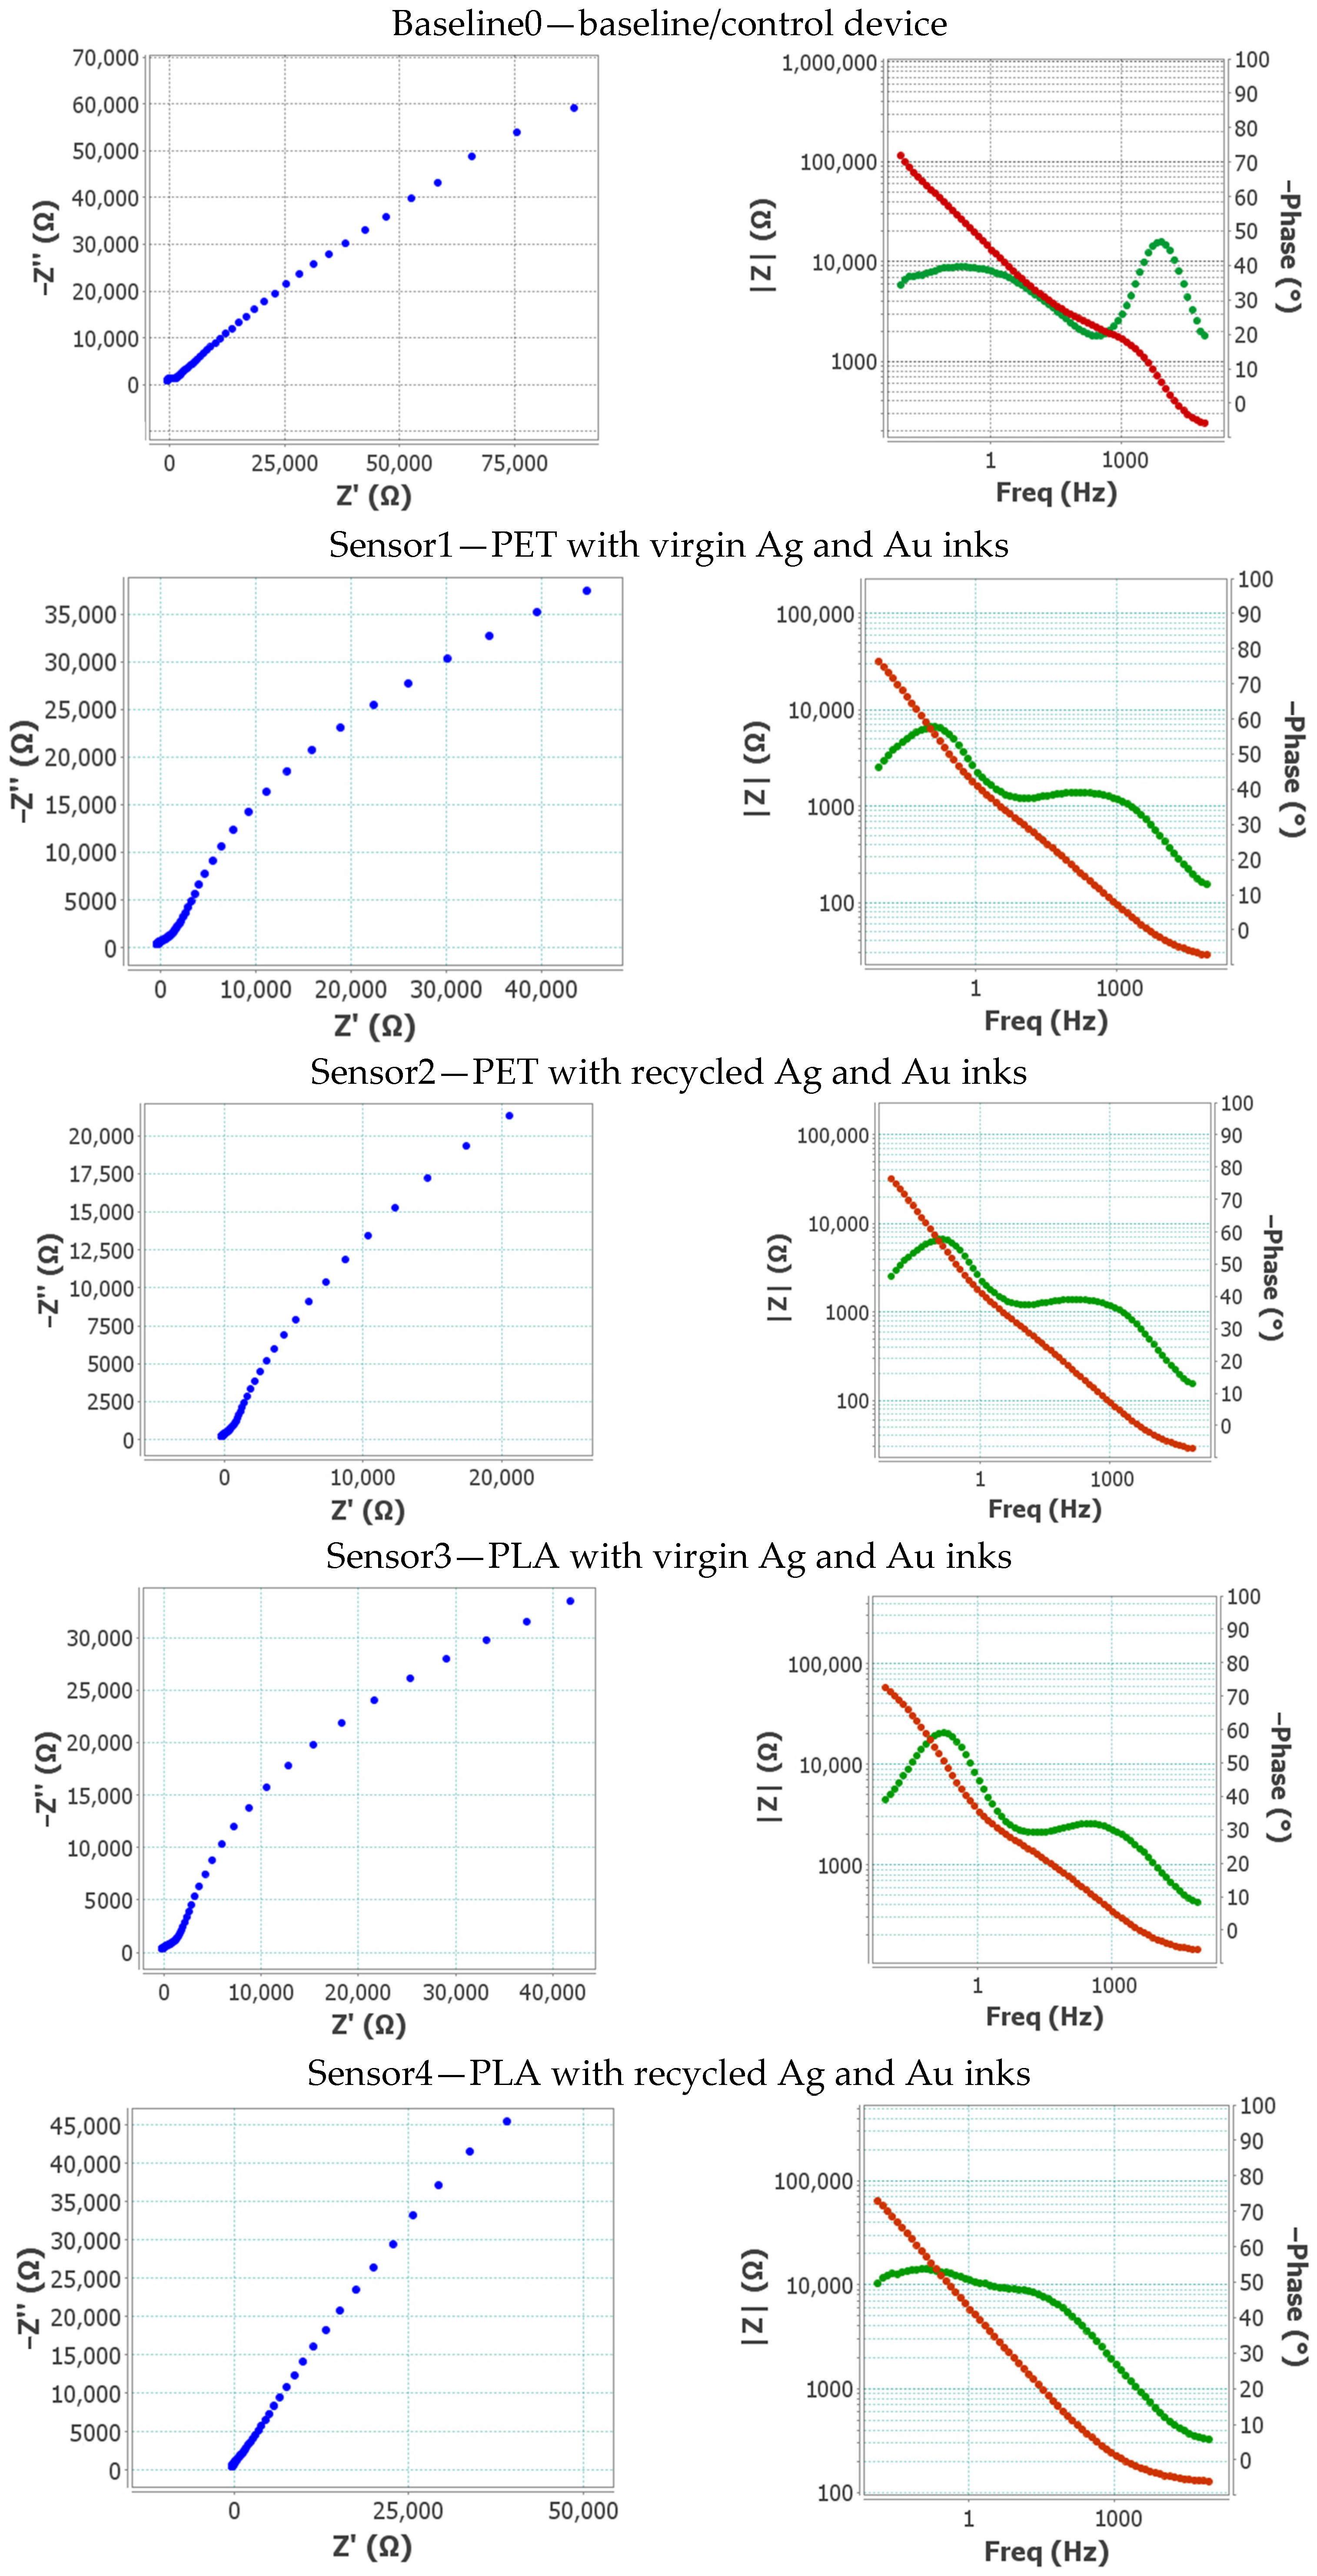
Furthermore, electrochemical impedance spectroscopy (EIS) was employed to characterise the behaviour of the developed screen-printed electrode. This technique provides detailed insights into the processes occurring at the electrode–electrolyte interface, such as charge transfer, double-layer formation, and ionic diffusion. By fitting the impedance data to equivalent circuit models, key parameters including solution resistance, interfacial capacitance, and charge-transfer resistance were extracted, offering a comprehensive evaluation of electrochemical performance of the electrode,
Figure 16.
The Nyquist and Bode plots demonstrated a low degree of charge-transfer resistance, indicating a high level of surface availability of gold. The recycled inks demonstrated lower charge-transfer resistance than virgin inks, which is in line with the theory that the organic coating was being removed by the recovery process.
Based on the curves in
Figure 16, equivalent circuits to a Randles circuit were calculated to obtain various parameters. It can be observed that the initial resistance of the electrodes was higher in the control devices (around 200 Ω) than in the novel electrodes; it is lower, around 50 Ω for devices with a PET substrate and 140 Ω for devices made with PLA. Similarly, it is worth noting that the capacitance of the developed devices was about an order of magnitude lower than that of electrodes developed with virgin inks and five times lower than that of recycled inks. This confirmed the earlier observation of the electroactive area, indicating a less homogenous surface topography and therefore a higher capacitance of the double layer of the manufactured electrodes.
Table 8 shows the initial resistance (R), double-layer capacitance (C
DL), and charge-transfer resistance (R
CT) for all devices.
When examining the resistance to charge transfer, it can be observed that the control device had the highest resistance, followed by PET and finally PLA. This was likely due to a combination of difference in the surface topography of the gold electrodes and print homogeneity due to different drying conditions, as previously noted.
Once the electrochemical performance of the electrochemical transducers had been validated, the biosensor was functionalised with GOx using the method outlined in
Section 2.11. The biosensor consisted of the modified transducer with the sensing phase containing the recognition element, in this case GOx. This characterisation aimed to determine if the electrochemical sensor would function as a glucose biosensor. During the electrochemical detection of glucose, the analyte underwent enzymatic oxidation catalysed by GOx, resulting in the formation of H
2O
2 following the chemical reaction (Equation (2)). The generated H
2O
2 by the enzymatic reaction was subsequently detected at the electrode interface, generating a quantifiable current response.
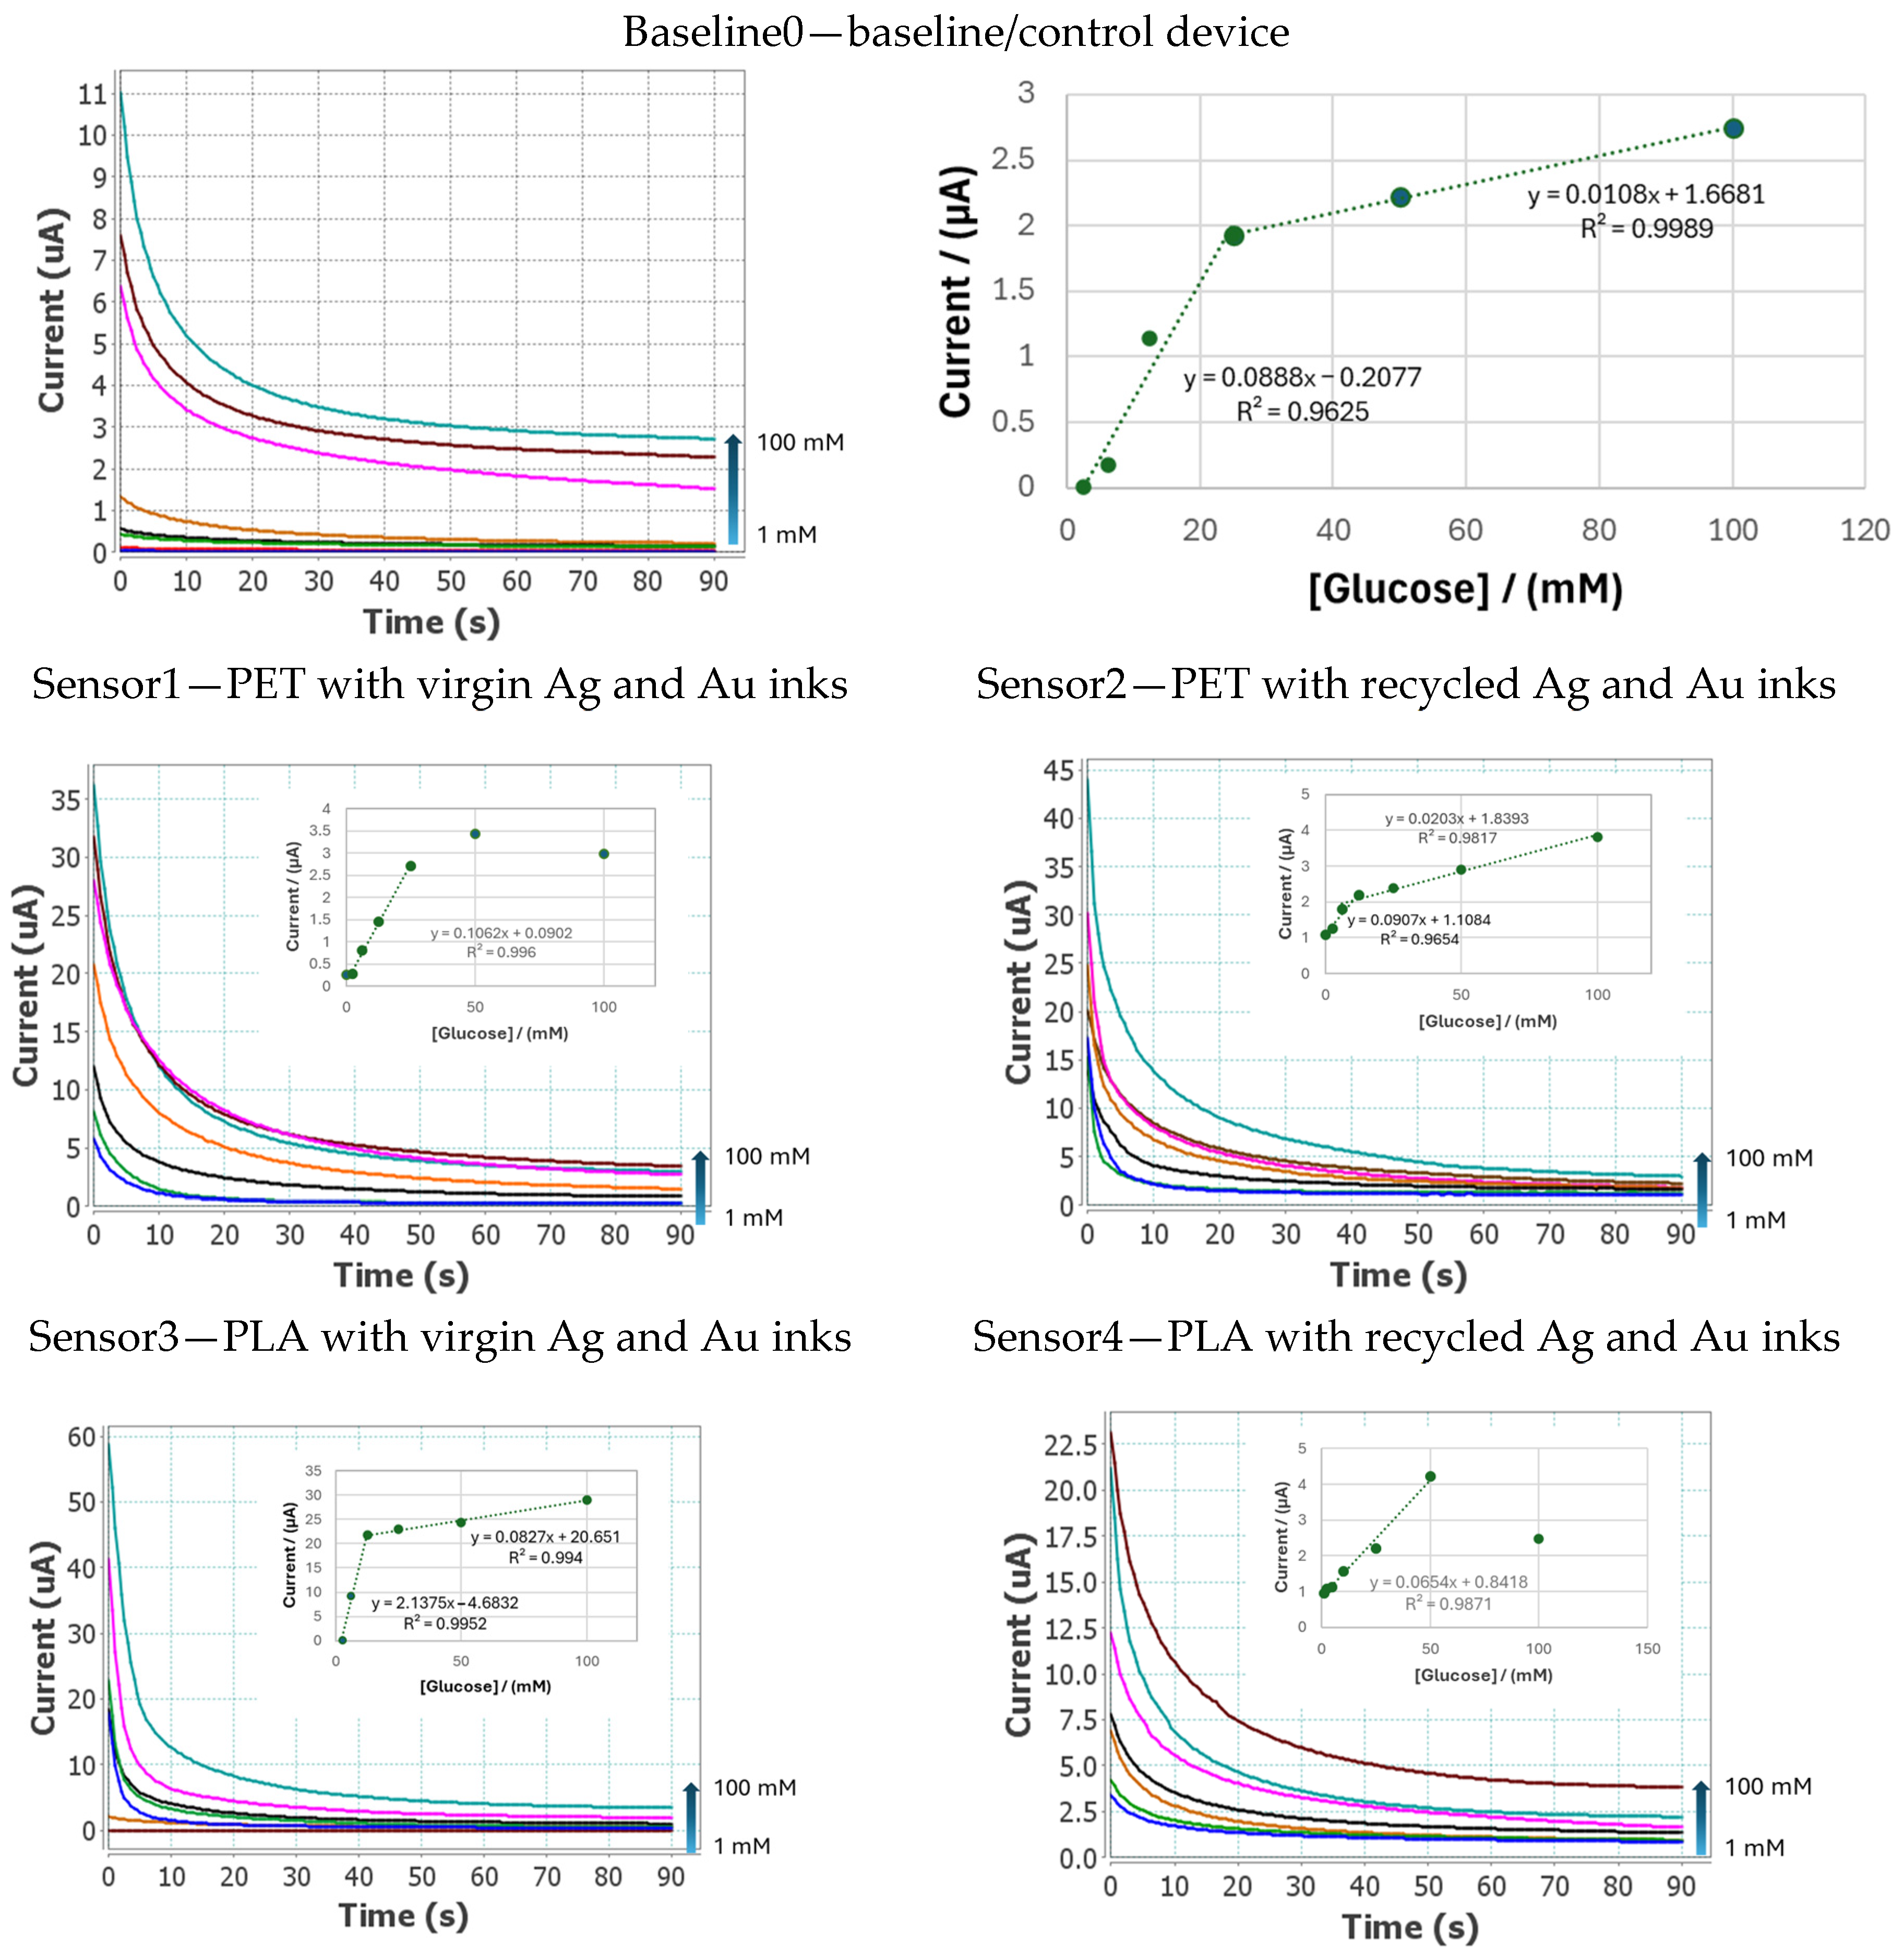
To obtain the analytical signal, a drop of 30 µL of glucose solution at different concentrations was place on the electrode surface and evaluated by chronoamperometry. This applied a detection potential of +0.3 V for 60 s with different glucose concentration solution from 1 to 100 mM in 100 mM TRIS pH 7.2 buffer solution,
Figure 17.
In all cases, it was possible to obtain a reliable glucose concentration curve between 1 and 50 mM.
Figure 17 demonstrates current intensity signal variability as a function of concentration. Novel devices exhibited a higher current intensity than the control device, resulting in greater sensitivity at lower glucose concentrations. However, this effect can lead to a loss of the calibration range at high concentrations, as seen in the curves of sensors 1 and 4, where only one calibration range could be obtained.
3.7. Environmental Impact Assessment
A full LCA was carried out from cradle to cradle to compare these new innovations to a commercial baseline based on the inventories collected for both the baseline and novel devices. In
Table 9, the differences in material and processes are highlighted. The alumina substrate was replaced by a bio-based PLA substrate in the novel device (requiring a new cutting step), the cleaning agents used for manufacturing were modified, and a different curing method was considered. Due to a redesign of the biosensor, the quantities of substrate and inks and the overall weight of the device were reduced. For novel processes, industrial-scale electricity consumption was estimated to be comparable for the baseline and novel devices. A 95% recovery rate was considered for the solvents used in the recycling step in order to be in line with industrial practices.
The baseline device was assumed to be incinerated, while 40% of the novel device was collected for recycling of gold and silver, as inventoried in
Table 9. A recovery yield of 68% was used both for gold and silver, while 100% purity was considered for both metals in line with ICP-MS measurements. The CFF was used to allocate the environmental impacts and credits of the recycling process between the EoL recycling of biosensors and the further use of recycled metals in new devices, using 80/20 allocation factor. Furthermore, economic allocation was applied to distribute the recycling process impacts between resulting gold and silver based on average London Bullion Market Association (LBMA) prices for first half of 2025 (EUR 90,200 per kg of gold and EUR 964.2 per kg of silver).
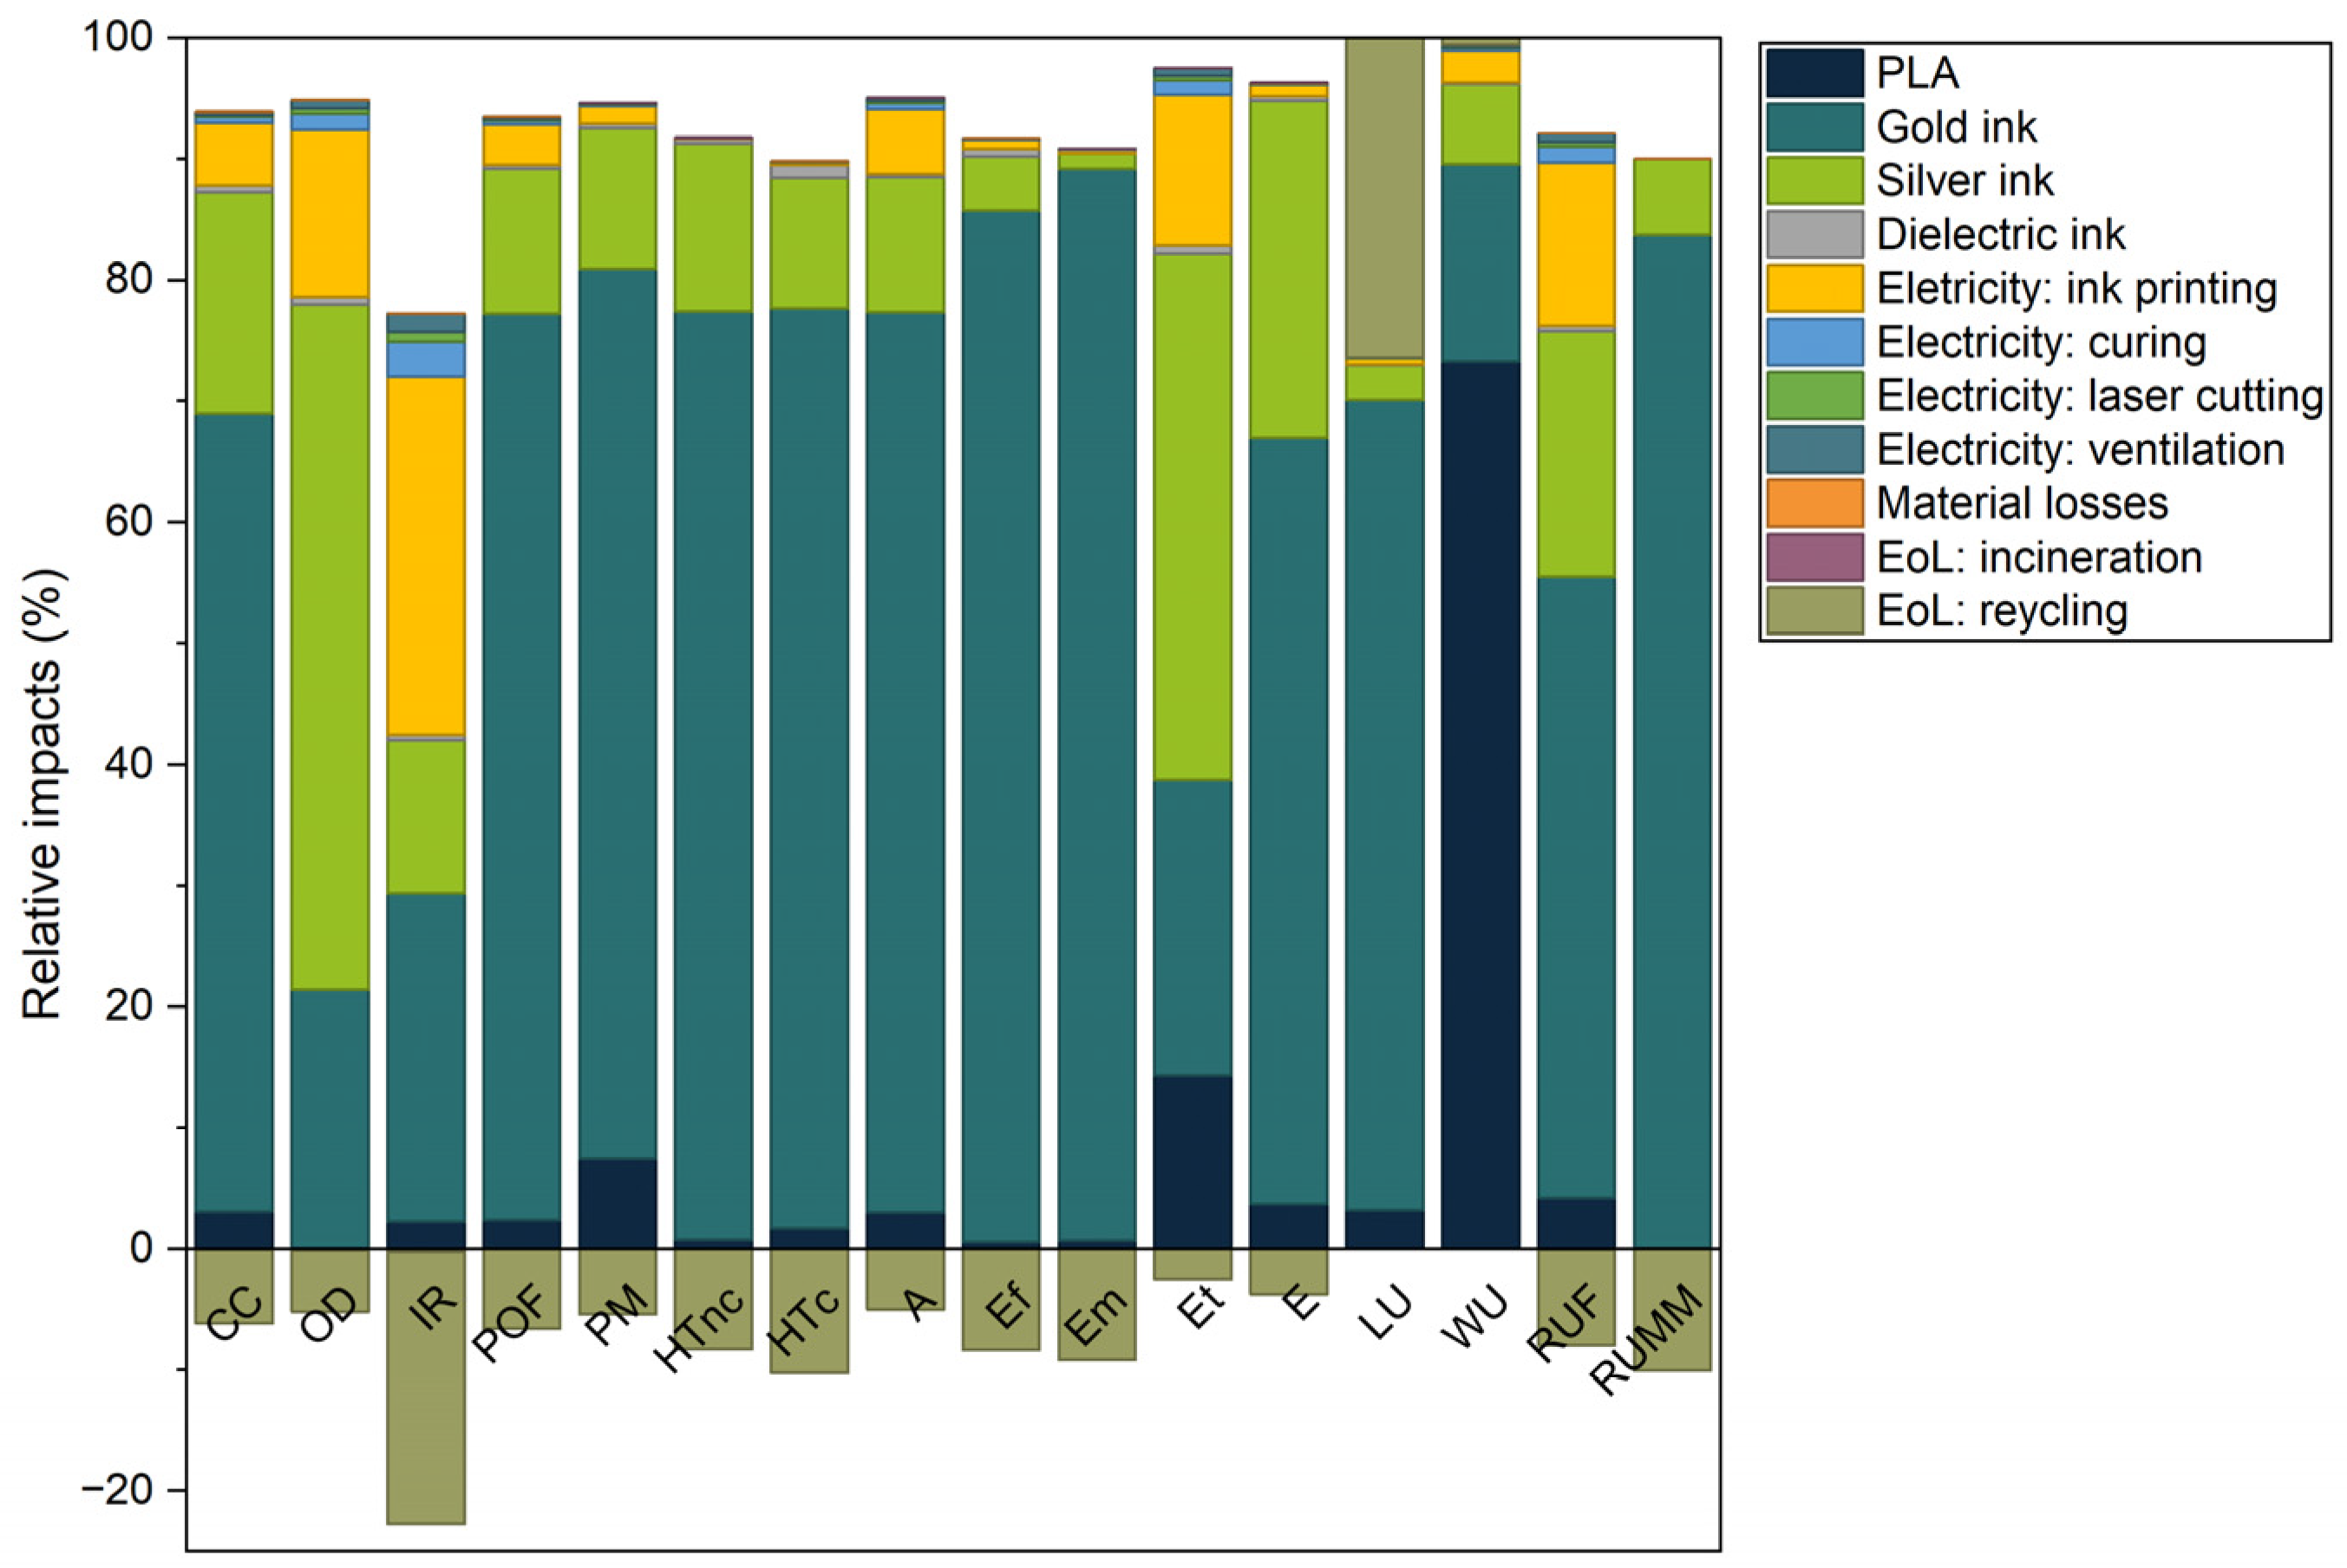
Figure 18 presents the main impact contributors of the novel device from the comparative LCA study. It was clear that the gold and silver inks were the main hotspots, accounting for up to 87% and up to 55%, respectively, of the total impacts depending on the categories. PLA was the main contributor towards water use (WU), with 73% of total impact, followed by EoL recycling, which uses some bio-based solvents. This was due to their bio-based origin, which requires large volumes of water for biomass growth. The electricity consumed for ink printing had a limited contribution to the total impacts, while the impact contributions from the dielectric ink, electricity for laser cutting and ventilation, material losses, and incineration at EoL were negligible. Negative impacts (or environmental credits) due to EoL recycling of devices were attributed to the novel recycling process presented herein, therefore reducing the need to extract fresh metals.
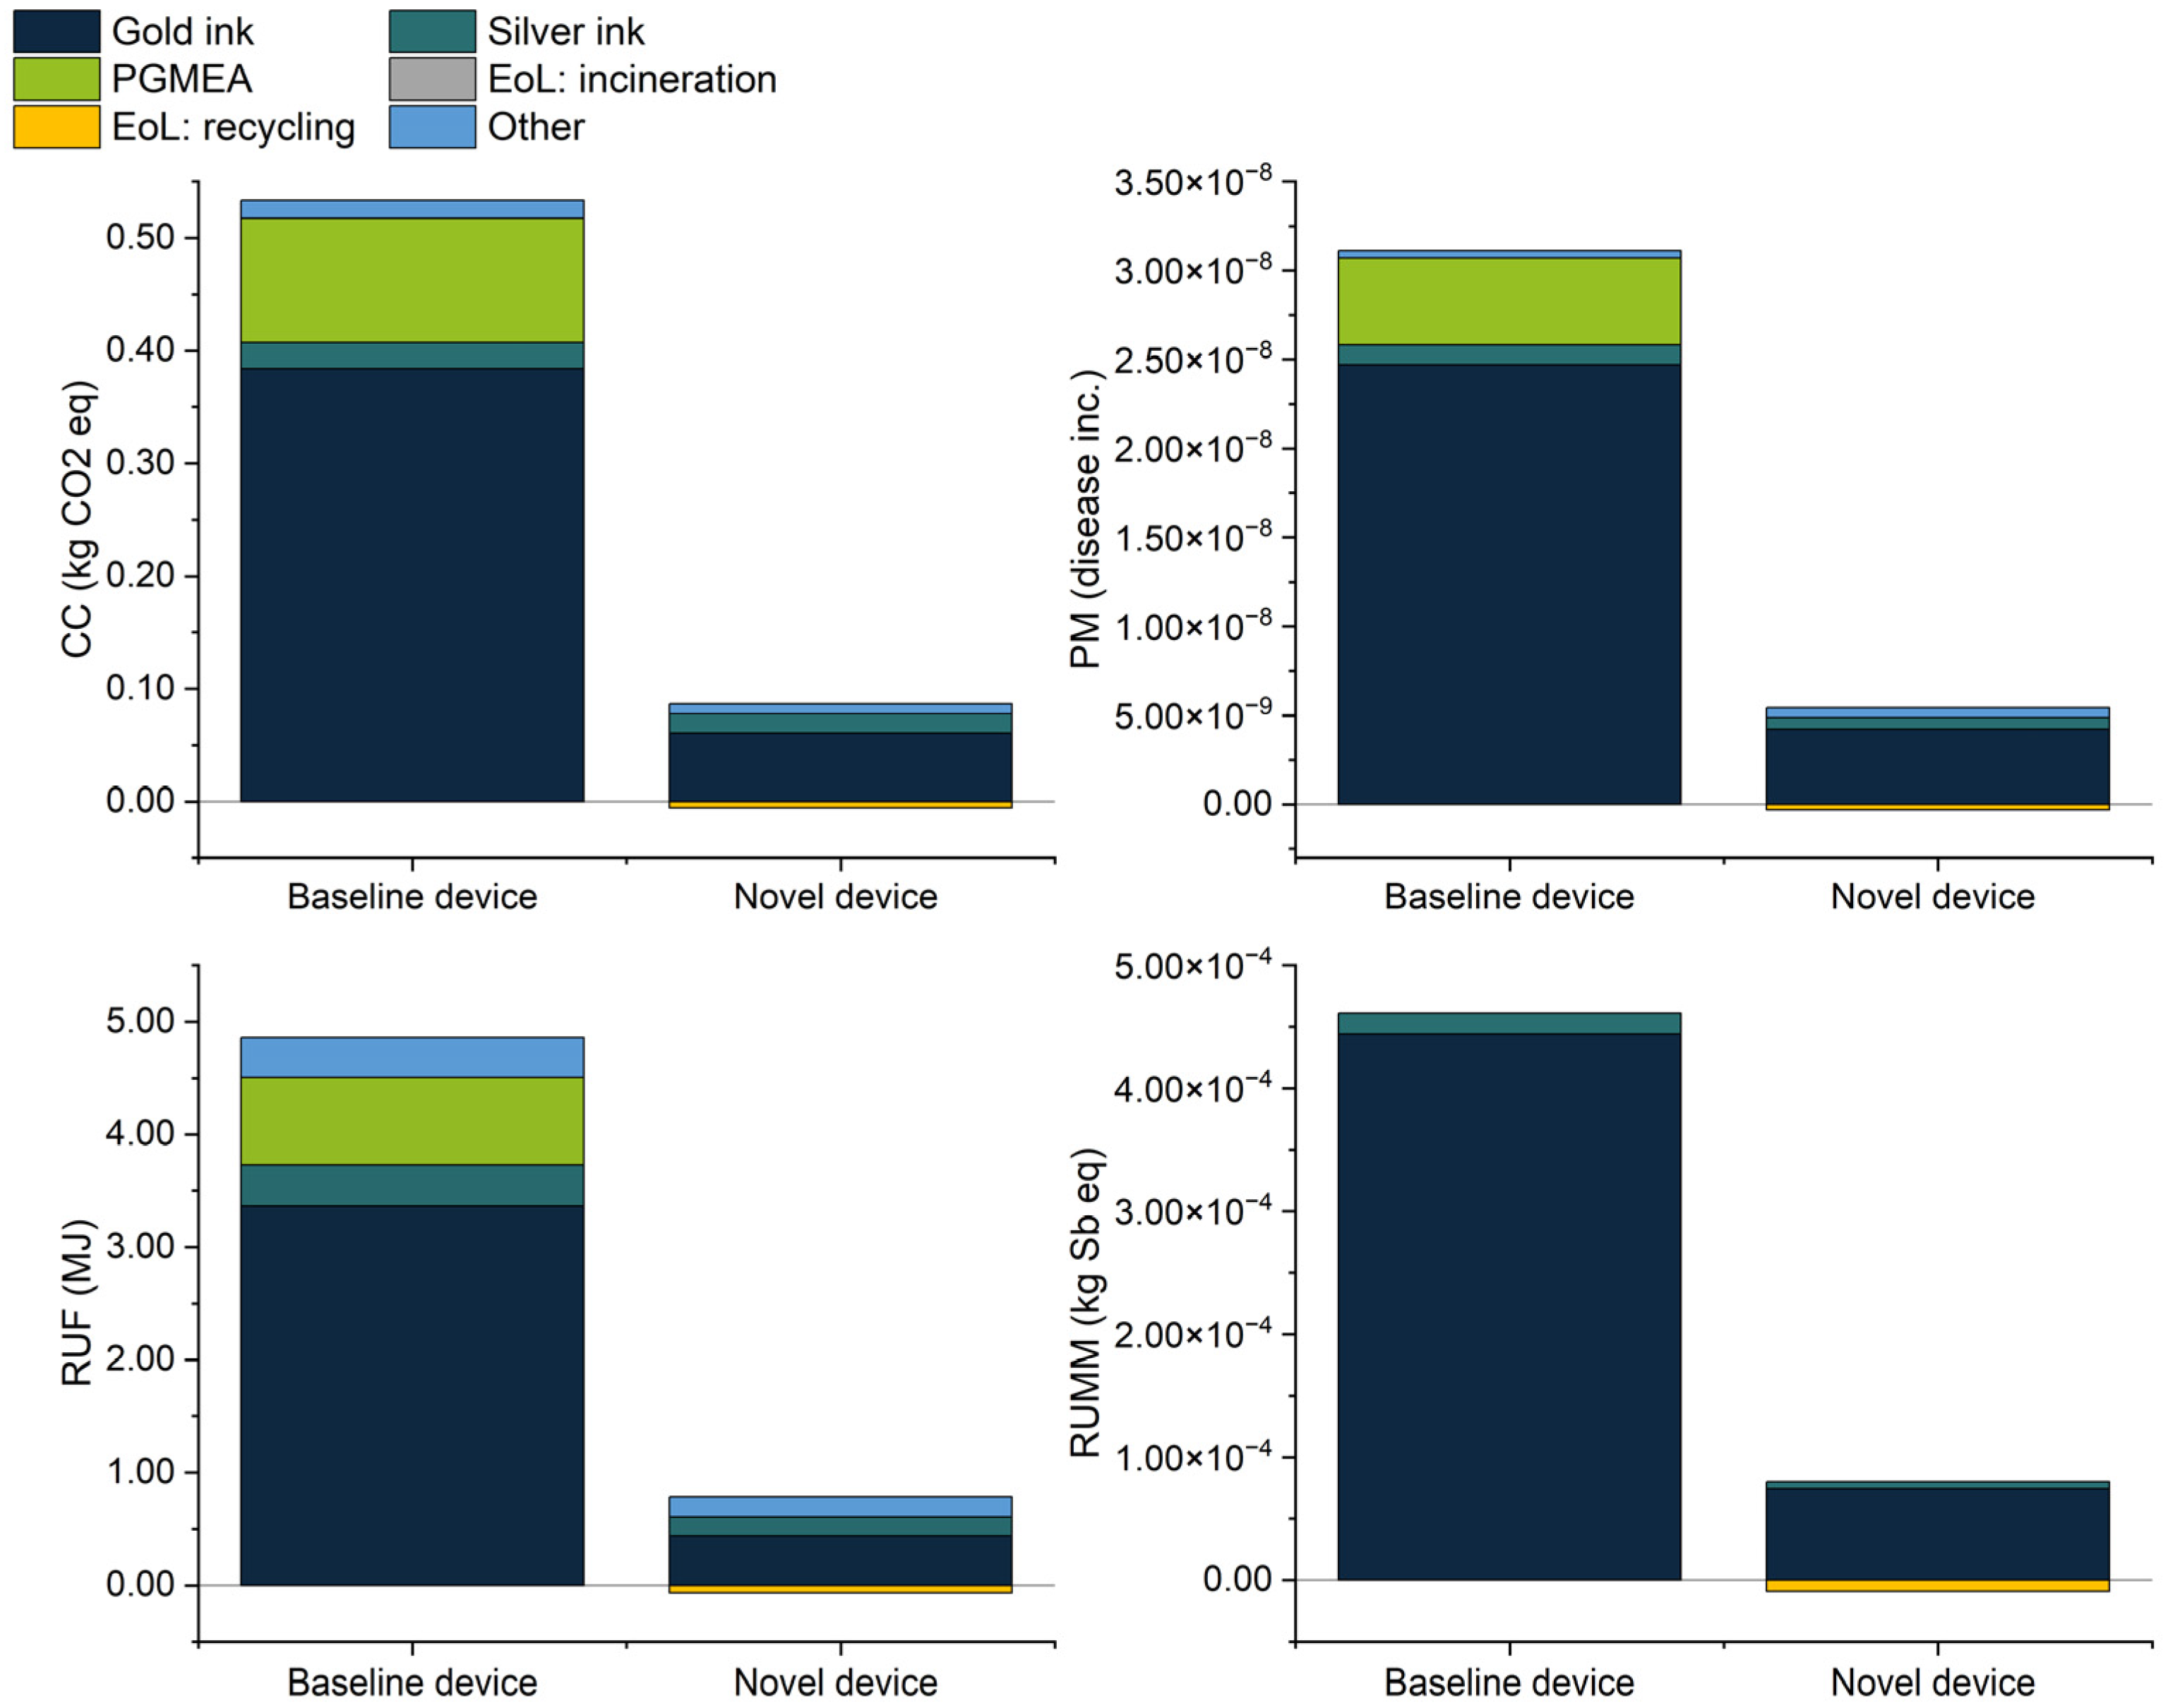
The comparative LCA study revealed that the novel biosensor had a significantly lower environmental impact than the baseline sensor for all impact categories; with the exception of water use (WU), whereby the values were similar in both cases, and marine eutrophication (Em), which showed an increase in the new device. For all other impact categories, the reduction exceeded 80%.
Figure 19 compares the environmental impacts of both the baseline and the novel device for the most relevant impact categories according to EF category rules for IT equipment [
14], including climate change (CC), particulate matter (PM), fossil resource use (RUF), and mineral and metal resource use (RUMM). The hotspots remained the same in both devices; with the main contributor in the four categories represented by the gold ink, carrying about two-thirds of the impacts. Any remaining impacts were primarily distributed between propylene glycol methyl ether acetate (PGMEA) (only used in the baseline) and the silver ink, while the other components (including ceramic/PLA substrate, dielectric ink, electricity, and waste) had minor contributions. The drastic diminution of environmental impacts was due to the redesign of the biosensor in combination with the reduction of ink usage, ink losses during processing, and importantly, the closed-loop recycling of gold and silver.
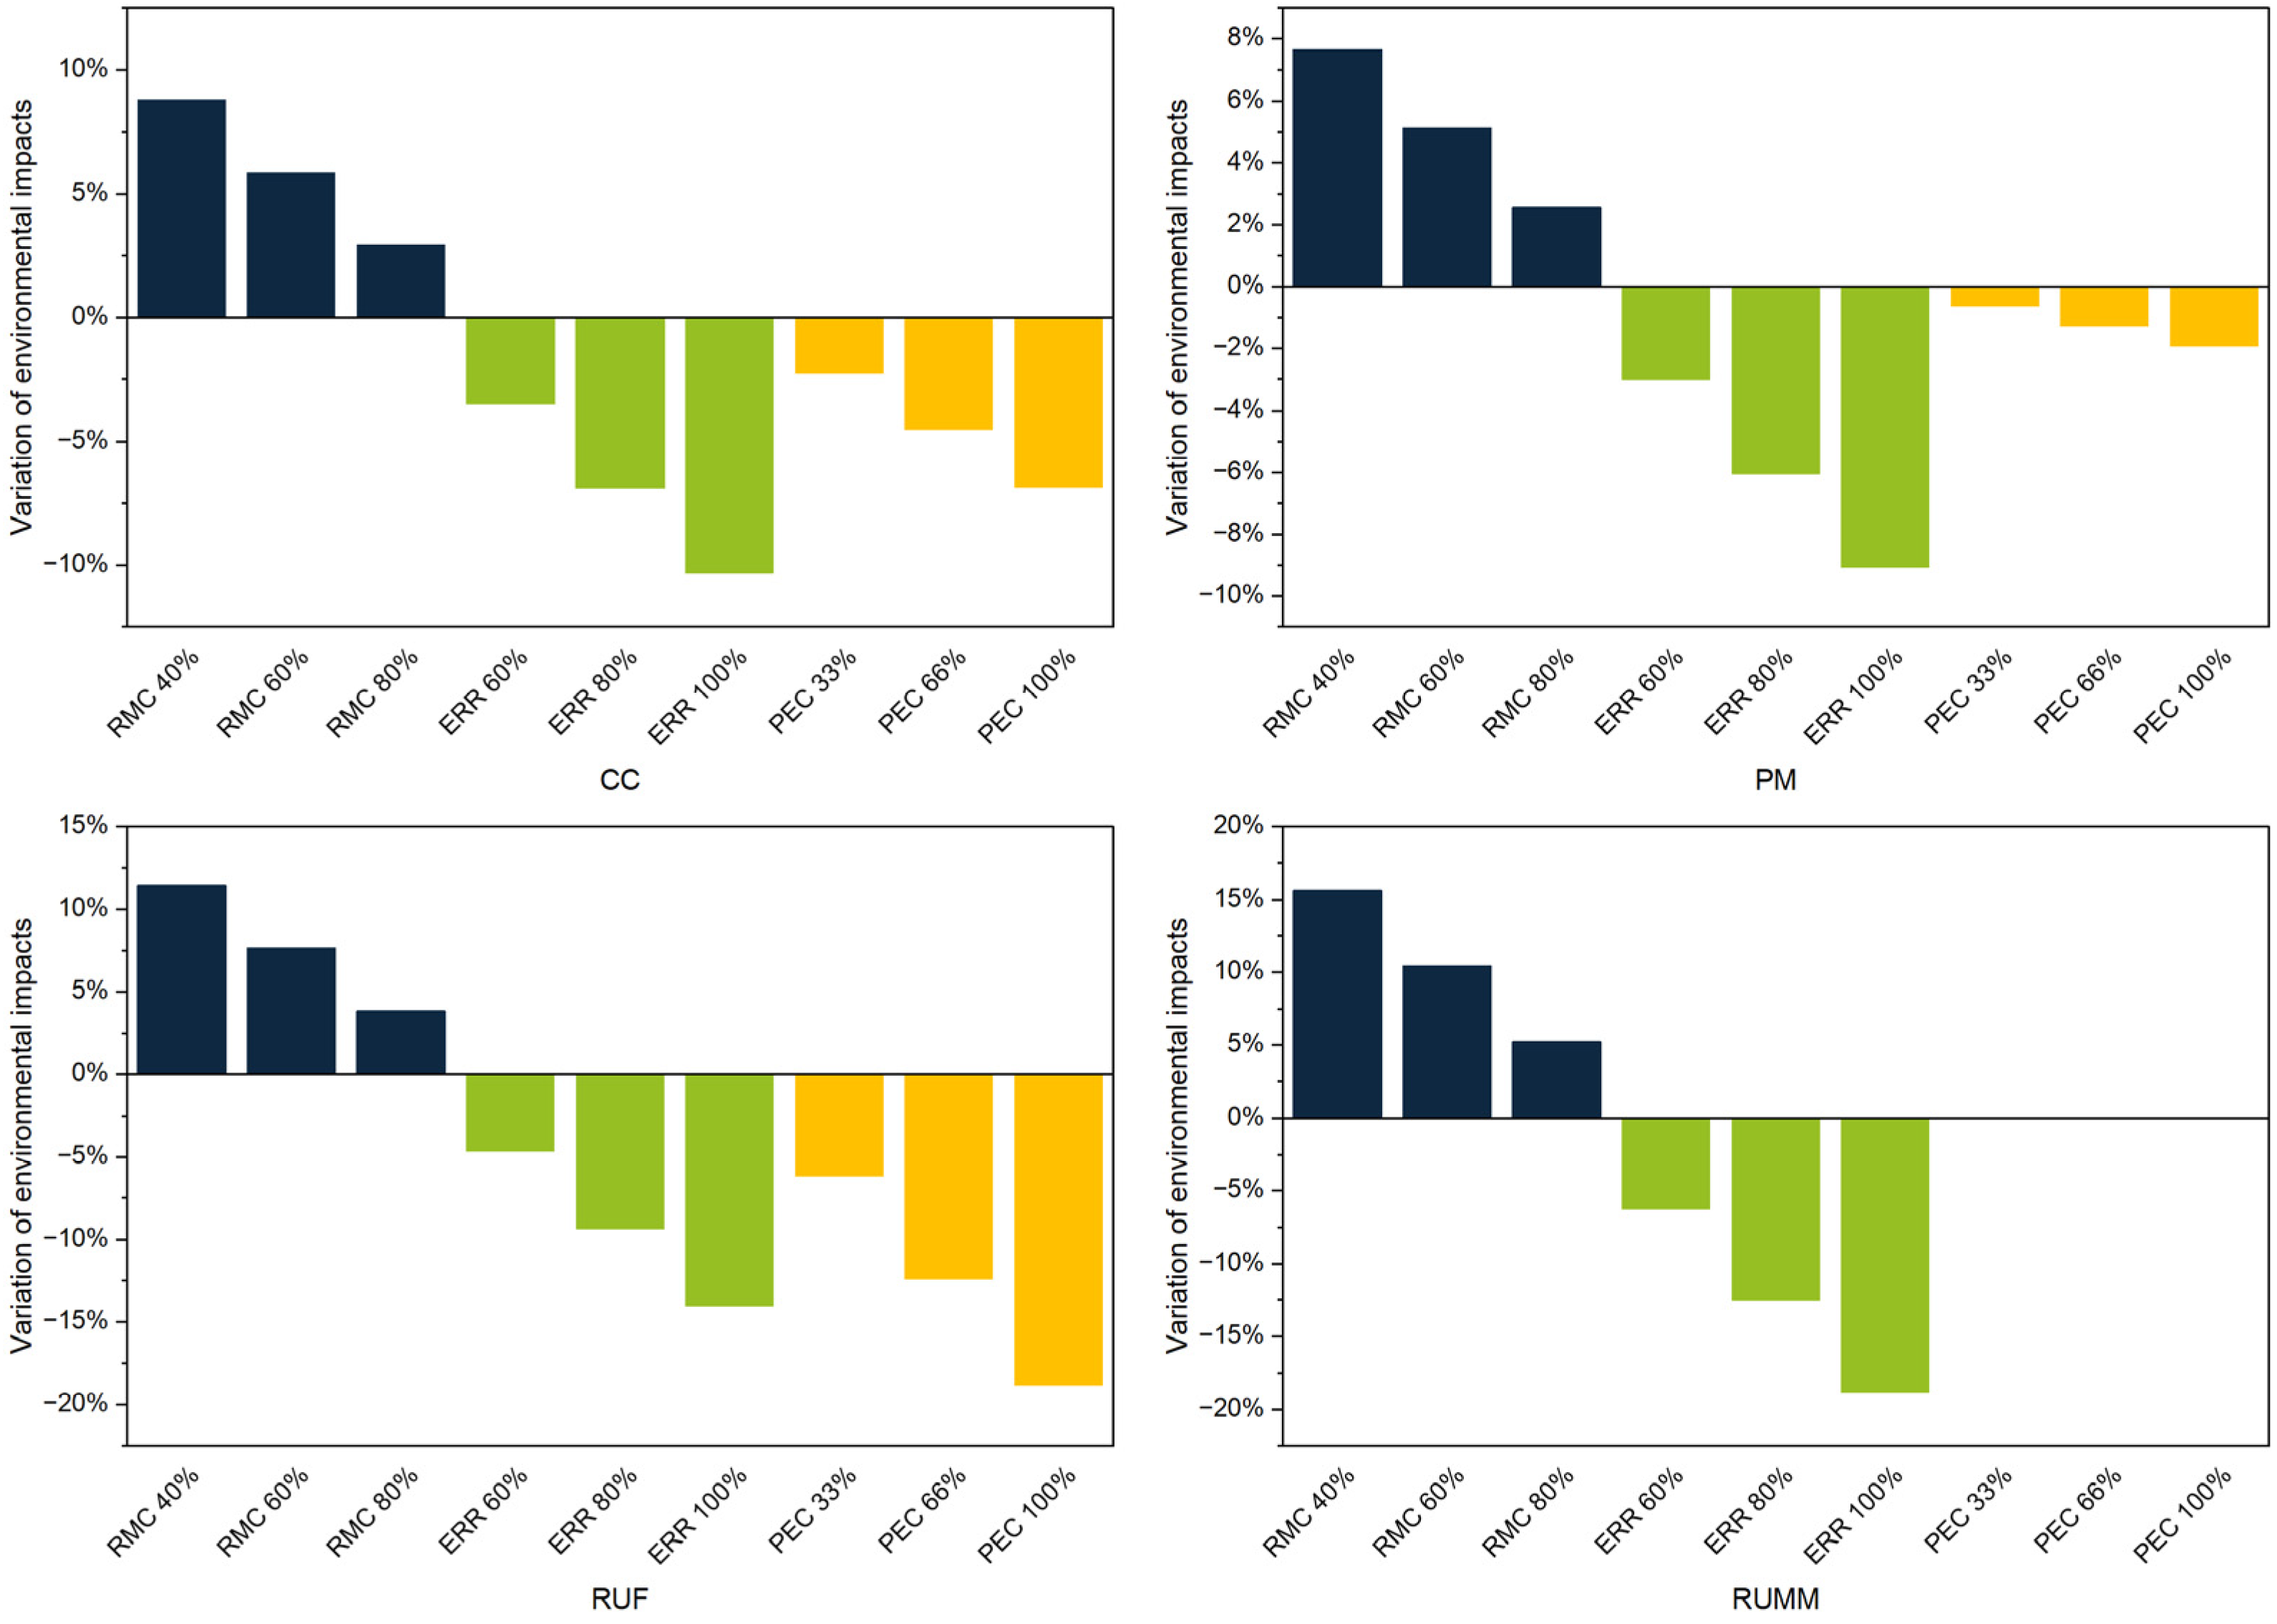
A sensitivity analysis was performed to evaluate different hypothetical scenarios related to the life cycle of the novel device. This allowed for forecasting of the environmental impacts of key changes in production and EoL parameters. The following alternatives were evaluated: variations in recycled metal content in conductive inks to 40% (RMC 40%), 60% (RMC 60%), and 80% (RMC 80%); increases in EoL recycling rate up to 60% (ERR 60%), 80% (ERR 80%), and 100% (ERR 100%); and the substitution of grid electricity with solar photovoltaic energy by one-third (PEC 33%), two-thirds (PEC 66%), or in full (PEC 100%). The reference scenario (inventoried in
Table 9) corresponded to the novel device with 100% recycled metal content in the conductive inks, an EoL recycling rate of 40%, and grid electricity consumption based on the average Spanish electricity mix. The results of the sensitivity analysis are summarised in
Figure 20, which presents the percentage variation in environmental impacts associated with each alternative scenario compared with the reference scenario, shown in
Figure 19.
Figure 20 indicates that reducing the recycled metal content to 40% would increase impacts in all categories, especially the carbon footprint (CC) by 9% and mineral and metal resource use (RUMM) by 16%. Conversely, increasing the EoL recycling rate to between 60% and 100% reduces impacts across all categories by between 3% and 19% compared with the reference scenario. Similarly, modifying the electricity supply to increase the share of solar photovoltaic energy has significant effects on climate change (CC) and fossil resource use (RUF) impact categories with reductions up to 7% and 19%, respectively. However, no noticeable effect is observed on the mineral and metal resource use (RUMM).
Overall, the sensitivity analysis indicates that the underlying assumptions are generally robust; however, the results also show that variations in key parameters can lead to noticeable changes in specific impact categories. This highlights the importance of these parameters in influencing the life cycle environmental performance of the novel device.
4. Discussion
Using a DoE approach to design a silver ink enabled rapid formulation and optimisation through a well-fitted model. The model was validated when the predicted properties of the ink were comparable to those that were experimentally determined. The ink achieved a resistivity within the same order of magnitude as a commercial equivalent and enabled the demonstration of closed-loop recycling for silver flakes.
The gold ink achieved a significantly lower conductivity than the commercial equivalent due to the lack of sintering being employed; however, the energy savings achieved through lack of heating were significant. The usefulness of this ink will depend on the required performance of a particular biosensor, but where feasible, this ink provides an option with a significantly lower environmental impact, potentially lower production costs, and compatibility with polymer substrates. Furthermore, the electrochemical data demonstrated the high-performance nature of this ink, indicating that the surface availability of gold was more crucial than resistivity. It should be noted that while the gold content of the ink is higher for the novel gold ink, less ink was required per print run.
The solidification of the gold ink was hypothesised to be due to low solubility of PCL in benzyl acetate. Additionally, PCL has a melting temperature of 60 °C; therefore, mixing could introduce sufficient heat to cause PCL to melt. Both theories could be contributing, and this should be explored as part of future work. Nevertheless, this effect and the resulting performance of the ink was consistent; therefore, it was practical to progress the ink to fabrication trials. Gold ink solidification enabled an unexpected benefit; liquid inks are not infinitely stable, and the high-density gold particles will inevitably sediment over time. It is common practice for syringe-based inks to be stored frozen to slow the processes behind the instabilities and prevent printing inconsistencies. However, due to this solidification, the need for cold storage was removed. Many syringe dispensing systems employ syringe heating up to 60 °C; therefore, pairing this ink with a more capable syringe-based printer would enable reproducible printing without the need for pre-heating or placing the printer into a heated enclosure.
The PLA substrate provided a viable alternative to substrates such as PET that are more commonly used in the printed electronics industry. Electroactive surface area variability was notably lower for devices fabricated on PLA when compared with PET, and high ink adhesion was observed without requiring the addition of an adhesion promoter, while PET often requires the application of an adhesion promoter, limiting the recyclability at end of life. Further efforts should be carried out to develop suitable curing processes that are compatible with bio-based and temperature-sensitive substrates; with methods such as NIR curing becoming more commonplace, this may provide a solution for faster drying while minimising heat exposure to the substrate.
Silver and gold recycling for single component systems was successful, with second generation devices achieving comparable results to first generation devices. This demonstrates a method that could be used by researchers to minimize their own costs and environmental impact by reusing materials from the development process. Is it is recommended that recycled metals be sufficiently characterised to ensure high purity (e.g., ICP-MS, EIS), and further investigation is required to understand the impact of potentially removing the coatings provided on the flakes by the manufacturer. By designing the inks to be selectively soluble in the solvents used in device fabrication, noble metals were successfully separated. Further optimisation is required, as the recovered gold was found to be contaminated with 1.03% silver. Given cellulose acetate’s insolubility in benzyl acetate, unbound silver and mechanical agitation partially are the most likely reasons for the presence of silver in the recovered gold feedstock. In a gold biosensor layer, this contamination would likely impact sensing performance of a second-generation device.
These results, while very promising, demonstrate that further optimisation is required to maintain high purity gold after recycling. Future remediation steps could include soaking samples in solvent rather or a gentler agitation or the use of methylsulfonic acid and hydrogen peroxide to selectively remove silver from recollected gold [
67]. With further optimisation, there is a high potential for this recovery method given the processes’ simplicity and low toxicity nature. This closed-loop offering could be employed by a biosensor device or ink manufacturers to lower their production costs by enabling the reuse of the expensive raw materials. Moreover, this is especially appealing due to the lack of requirements for specialist capital equipment investment or the use of toxic chemicals. By recovering valuable components, manufacturers could offset the cost of setting up device return schemes with their customers and have more control over the quality of the inks used in their devices. Additionally, polymers could be recovered if this route proves to be economically and environmentally beneficial. It should be noted that no recycling was carried out following device functionalisation with glucose oxidase; this must be explored to determine whether biological species or other contaminants can be removed prior to recovering silver and gold.
Screen printing is a fast and highly scalable printing method; however, a minimum amount of ink is required per run to ensure full coverage of the screen. A significant proportion of this ink is recovered after printing, which is usually negligible when working with carbon or silver inks. However, due to the high cost of gold, this waste becomes an issue. Significant material and cost savings were identified through incorporating digital printing for the gold layer. By employing screen printing for layers with greater ink coverage, i.e., silver tracks and Voltera printing for the gold, the production time for the full device was not significantly increased. Gold layers took less than a minute per six devices, and while a full study should be carried out to compare production time and cost to incorporate digital printing, this highlighted the potential for digital printing to be impactful when implemented thoughtfully.
An estimation of the electroactive area using the Randles–Ševćik equation showed a significant increase in the electroactive surface areas in the second-generation sensors, especially in configurations with recycled layers of Ag and Au on PET and PLA substrates. This increase suggested a higher density of active sites available for electron transfer, which was consistent with the observed improvement in redox kinetics. The correlation between electroactive areas and amperometric sensitivity supported the hypothesis that the surface morphology and roughness induced by Voltera printing, the use of gold flakes, and the removal of organic coatings favoured an improvement in adsorption and catalytic efficiency of the electrode surface. It should be noted that the variability was higher for the novel devices; while this is to be expected for an experimental process, the variability for PET-based devices was significant. This was most likely due to the differences in drying conditions, where PET devices were dried at 120 °C and PLA was dried in ambient lab conditions. The slower drying time for PLA allows for the ink to level, likely resulting in a more homogenous surface. It is however notable that the novel PLA substrate achieved a good level of reproducibility given the dielectric layer was manually applied and shows the potential of this substrate for printed biosensors and printed electronics more generally. The effect of drying conditions on printed devices should be further explored in the future to ascertain the optimal compromise between processing time and device performance.
EIS was used as a key technique to evaluate the electrochemical interface of the functionalised sensors, providing information on charge-transfer resistance (R
CT), double-layer capacitance (C
dl), and other parameters related to the kinetics of redox processes on the electrode surface. The Nyquist plots obtained showed well-defined semicircles in the high-frequency region, indicating typical behaviour for charge-transfer controlled systems. The reduction in the semicircle diameter in the second-generation sensors show a significant decrease in the R
CT, which was indicative of improved electron transfer efficiency between the redox probe and the electrode. This improvement was attributed to a larger electroactive area, as verified by cyclic voltammetry, and the potential removal of the organic coating on gold flakes. Novel devices exhibited a lower double-layer capacitance and therefore a higher current intensity during glucose sensing when compared to the baseline device. This resulted in better sensitivity at lower glucose concentrations; however, this can lead to a loss of the calibration range at high concentrations. Therefore, it is crucial to design the sensor for the glucose concentration range of interest. In the Bode plots (
Figure 16), a shift towards higher frequencies in the maximum phase angle was observed, indicating a faster response of the electrochemical system. Furthermore, the slope of the impedance modulus curve in the low-frequency region was lower in the second-generation sensors, suggesting lower diffusive resistance and better accessibility of the analyte to the active surface. It should be noted that long-term stability was not assessed and should be a key consideration for researchers looking to further explore the use of recycled metal flakes in electrochemical sensors.
Through a detailed comparison with the baseline biosensor, we showed that the novel device presented a significantly improved environmental profile. The environmental performances were enhanced by the redesign of the device to reduce ink usage, reduced ink waste by using digital printing, and the circular route that leads to closed-loop recycling of metals that are reintroduced into ink formulations. The identification of environmental hotspots allowed us to pave the way for future actions to continue progressing towards sustainability in PE devices. The sensitivity analysis demonstrated the robustness of this process; reducing the recycled metal content in inks to 40% would still result in a reduction in environmental impact by at least 65%, with the possibility of additional gains through increased recovery rate and the use of solar energy.
Gold and silver inks were found to exhibit the highest environmental impacts due to the processes used to mine noble metals. This impact could be minimised by three approaches: (i) the use of carbon-based conductive inks to replace metal-based inks when technically feasible, (ii) improvements to gold and silver recycling processes to increase commercial attractiveness, and (iii) a redesign of devices to enable easier extraction of metals to further improve economic viability. One of the main bottlenecks still resides in the collection of PE waste to allow for the recycling and reuse of noble metals; the logistics behind this waste stream are still largely unexploited by manufacturers, further reducing attractiveness of recycling, as the economies of scale remain very low.





 ,
,