Article

A Novel Water-Flow Live-Insect Monitoring Device for Measuring the Light-Trap Attraction Rate of Insects


College of Smart Agriculture (College of Artificial Intelligence), Nanjing Agricultural University, Nanjing 210031, China
*
Author to whom correspondence should be addressed.
Electronics 2026, 15(3), 714; https://doi.org/10.3390/electronics15030714
Submission received: 7 January 2026 / Revised: 4 February 2026 / Accepted: 4 February 2026 / Published: 6 February 2026

Abstract

The light-trap attraction rate (LTARI) is an important metric for characterizing diel activity patterns and supports studies in insect behavioral ecology and pest management. However, conventional automatic light-trap devices often rely on lethal methods (e.g., high-voltage grids or infrared heating), causing high mortality of non-target insects and severe image obstruction due to stacking of insect bodies. These issues disturb natural populations and bias attempts to quantify LTARI. Our primary objective is to develop and evaluate a non-lethal monitoring system as a methodological basis for future LTARI research, rather than to provide head-to-head quantitative comparisons with conventional traps. To address the above limitations, we propose a live-insect monitoring instrument that integrates a wind-suction trap with a Water-Flow Dispersion and Transport Structure (WF-DTS). The non-destructive trapping–dispersion–release process limits body stacking, allows captured insects to be released, and yields a community-level post-capture survival rate of 94% under the conditions tested. Experimental results show that the prototype maintains image integrity with clearly isolated single insects and achieves a detection performance of 95.6% (mAP@0.5) using the YOLOv8s model. At the inference stage, only the standard resizing and normalization operations of YOLOv8s are applied, without additional denoising, background subtraction, or data augmentation. These observations suggest that the WF-DTS generates images that are easier to segment and classify than those from conventional devices. The high detection accuracy is largely attributable to the physical dispersion of specimens and the uniform white matte background provided by the hardware design. Overall, the system constitutes a non-lethal hardware–software platform that may reduce backend processing complexity and provide a methodological basis for more accurate LTARI estimation in future, dedicated field studies.

1. Introduction

1.1. Background

The light-trap attraction rate (LTARI) of insects describes how the number of insects attracted to a light source varies over time. LTARI can guide the time-scheduled on/off control and spectral optimization of light sources and improve the efficiency of precision pest control. It can also reduce non-target trapping and support the monitoring of insect biodiversity [1]. Automatic mechatronic devices for insect image collection are a key technology in this context. Widely deployed in agricultural fields, they support pest forecasting and population monitoring and provide valuable data for integrated pest management and precision agriculture [2].
Conventional automatic insect monitoring devices typically rely on lethal capture and accumulate insect carcasses before imaging (see Section 2.1 for an illustration). These limitations distort the underlying population structure and degrade image quality, limiting the reliability of any LTARI-related analysis based on such data. Beyond traditional light-trap systems, a wide range of automatic insect-monitoring approaches have been developed internationally, including sensor-based traps, camera-equipped monitoring devices, and low-cost LED-based light traps for field sampling [3,4,5]. However, many of these systems still rely on lethal capture, which can bias abundance estimates. Moreover, image-based devices often suffer from occlusion and misidentification when multiple individuals overlap or adhere to trap surfaces, especially under field conditions.
In this study, LTARI is not treated as an endpoint metric but as an application context motivating the system design. The focus of this work is the development and validation of a non-lethal, high-fidelity monitoring system that can provide the methodological basis for future LTARI research under field conditions.

1.2. Related Work

Advances and limitations of insect monitoring techniques. Insect monitoring is a cornerstone of modern integrated pest management. Over recent decades, the field has witnessed significant technological progress, leading to the widespread deployment of various monitoring systems in agriculture. However, existing methods differ substantially in their principles, accuracy, and ecological impact. To systematically frame these differences and identify current gaps, Table 1 provides a comparative analysis of mainstream insect monitoring methodologies, categorizing them and summarizing their advantages, disadvantages, and relationships to LTARI-related research. Recent reviews and case studies have also highlighted both the potential and the limitations of automatic camera-equipped traps for pest monitoring, particularly with respect to target selectivity and long-term field robustness [3,4].
Commercial insect monitoring devices and their limitations. The growing demand for pest monitoring has spurred the commercialization of automated insect detection lamps, particularly in China, where numerous enterprises now offer such products (representative examples are summarized in Table 2). A critical analysis of these commercial devices reveals a pervasive limitation: a strong trend toward functional homogenization centered on lethal capture. The prevailing design paradigm relies on exterminating insects before imaging, which inherently conflicts with the principles of sustainable pest management by eliminating beneficial fauna and precluding longitudinal behavioral studies. This widespread reliance on lethal methods highlights a practical gap in the current market, which the present research aims to explore through a prototype non-lethal alternative.
Methodological gap in studying insect phototactic rhythms. Understanding the phototactic rhythms of insects is crucial for deciphering their behavioral ecology and optimizing pest monitoring strategies. However, prevailing methodologies are constrained by significant limitations. For example, Li et al. [6] investigated the light-trap rhythm of Sogatella furcifera in Yunnan Province using insecticidal lamps combined with manual counting, while Wang et al. [7] studied the rhythm of Chilo suppressalis in Harbin through light traps and laboratory-reared insects. Similarly, Cheng et al. [8] examined the rhythm of Cnaphalocrocis medinalis in Jiangsu Province via manual capture. These methods kill or otherwise heavily disturb the insects under observation, thereby altering or terminating the behavioral processes being studied and failing to capture the true in situ rhythmic activity of free-living insect populations.
Consequently, there remains an important methodological limitation in our ability to conduct non-invasive, longitudinal observations of phototactic behavior in natural ecosystems. The live-insect monitoring system proposed in this study aims to help bridge this gap. By achieving non-lethal capture, automated field imaging, and live release of insects, it provides a feasible tool for studying the undisturbed phototactic rhythms of insect populations in their ecological environment.
Table 1. The majority of methods for insect monitoring.
Technical CategoryAdvantagesDisadvantagesResearch Methods for LTARI
Armyworm trap plate recognition [9]Low hardware cost.Low data-collection efficiency and strong subjectivity.Insects are killed before counting, which reduces population size and is highly inefficient.
Insect sex attractant [10]The device is environmentally friendly and non-lethal to insects.The device only targets certain insect species.Killing insects before counting disrupts the population count. It relies on manual identification, lacking objectivity.
Insect detection lamp [11]The device has high recognition accuracy.Data acquisition relies on front-end image quality.Insects are killed before counting, which reduces population size and is highly inefficient.
Insect radar [12,13]The radar provides good performance for monitoring migratory insects over large spatial scales.The device is expensive and lacks intuitive image data.The device effectively monitors the rhythms of insect populations, but lacks image data collection.
Sound signal recognition [14]Simple hardware structure and operation.Data acquisition is influenced by environmental noise.Environmental noise can interfere with signal acquisition, complicating the derivation of reliable LTARI estimates.
Live insect monitoring [15,16]Helps maintain the integrity of insect populations.The collected images still suffer from body stacking and occlusion.This device can support LTARI estimation but may still suffer from image occlusion.
Table 2. Product statistics of insect monitoring light traps. N/A indicates that the parameter is not applicable. This product does not involve insecticides.
Company IdentificationProduct ModelRecognition TechniqueLethal Capture
Yunfei Technology Development Co. (Zhengzhou, China) [17]YFCB-IVHigh-definition photographyYes
Ecoman Biotechnology Co. (Beijing, China) [18]IID-RSHigh-definition photographyYes
BEYOND Technology Co. (Chengdu, China) [19]IID-RDAutomatic photographyYes
Wanxianghuanjing Technology Co. (Jinan, China) [20]WX-SDXElectronic sensorsN/A
Deshen Electronic Technology Co. (Zhengzhou, China) [21]IMS-IMLRemote photographyYes
Senno IoT Technology Co. (Jinan, China) [22]SNAutomatic photographyN/A
Zhice Yunlian Technology Co. (Qingdao, China) [23]CTID-RLHigh-definition photographyYes
Yatong Environmental Technology Co. (Nanjing, China) [24]D-PWIPMSHigh-definition photographyYes

1.3. Challenges

To realize the desired system functions, two core technical challenges must be addressed:
  • Design and integration of a novel mechanical structure. The system requires coordinated stages of capture, dispersion, transport, and safe release—a sequence not commonly found in existing designs. Its mechanical architecture therefore requires substantial original design work, including the conceptual design of components, determination of critical dimensions, and resolution of assembly interfaces, with relatively few mature reference models available.
  • Development of a dedicated multi-function control system. The introduction of suction and water-flow transmission modules necessitates a custom printed circuit board (PCB) and control framework to integrate and coordinate these additional functions. The new PCB and software must incorporate optimized driver modules (e.g., fan and pump control, power management) and satisfy long-term on-site operational requirements for stability and environmental robustness, which significantly increases design complexity.

1.4. Contributions

The main contributions of this study can be summarized as follows:
  • We designed and implemented a Wind-Suction Attraction Lamp (WSAL) as an alternative to traditional high-voltage grid insecticidal lamps. The WSAL is intended to stun and capture insects rather than kill them. By reducing the mortality of non-target beneficial insects and maintaining the short-term survival of captured individuals under the tested conditions, this design supports live-insect monitoring and behavioral observation.
  • We introduce a Water-Flow Dispersion and Transport Structure (WF-DTS) that separates and transports individual insects sequentially for imaging. Upon entry, each insect is rapidly isolated and carried by a shallow surface water flow, which limits adhesion and stacking and facilitates the acquisition of single-insect images. This design aims to alleviate data degradation effects that are common in conventional traps.
  • By implementing (1) and (2) and validating image quality and short-term survival under field conditions, we show that the system may provide a practical, non-lethal platform for future LTARI-related research in real agricultural environments, thereby contributing to ongoing efforts to reduce methodological biases in ecological monitoring.

2. Analysis and Design of a Live-Insect Detection Scheme

2.1. System Architecture and Operating Concept

Conventional insect monitoring light traps typically kill not only target pest species but also non-target beneficial insects. Such lethal operation poses a substantial threat to biodiversity and ecosystem services and conflicts with the goals of sustainable agriculture [25]. Figure 1 illustrates a representative conventional automated insect monitoring device and typical image data obtained under lethal capture conditions. Figure 1a shows an insect monitoring light trap, and Figure 1b shows example images captured by the device. Its operating principle relies on nocturnal phototaxis to attract insects, which are then killed and imaged.
However, this widely used approach suffers from three fundamental limitations:
  • Stacking of insect bodies. Insect carcasses accumulate in the trap before imaging, leading to severe stacking and occlusion. This results in low-quality images with a high rate of overlapping individuals. For example, in the widely used Pest24 dataset (n = 25,378), nearly half of the images (46.5%, 11,802 images) are affected by such artifacts, demonstrating the pervasiveness of this problem [26].
  • Indiscriminate death of non-target insects. Lethal light traps are inherently non-selective. A trapping experiment reported in [27] showed that although most captured individuals (~85.01%) were target pest species, a substantial fraction (~14.99%) consisted of non-target insects, including beneficial species.
  • Inability to study the activity patterns of living insects. Methods that rely on killed insects limit the study of the phototactic behavior and diel activity patterns of living insects in nature, and therefore are poorly suited for obtaining ecologically meaningful LTARI estimates.
To address the above issues, we propose a research prototype centered on a non-lethal workflow. The device integrates a wind-suction trap with a Water-Flow Dispersion and Transport Structure (WF-DTS). Insects attracted to the light are gently drawn in by suction and immediately carried away by a thin flowing water film, which physically separates individuals. A fiber-optic sensor at the WF-DTS inlet triggers the camera so that each insect is imaged individually and promptly upon entry. This design reduces the conditions that cause adhesion and stacking, facilitating the more consistent acquisition of single-insect images.
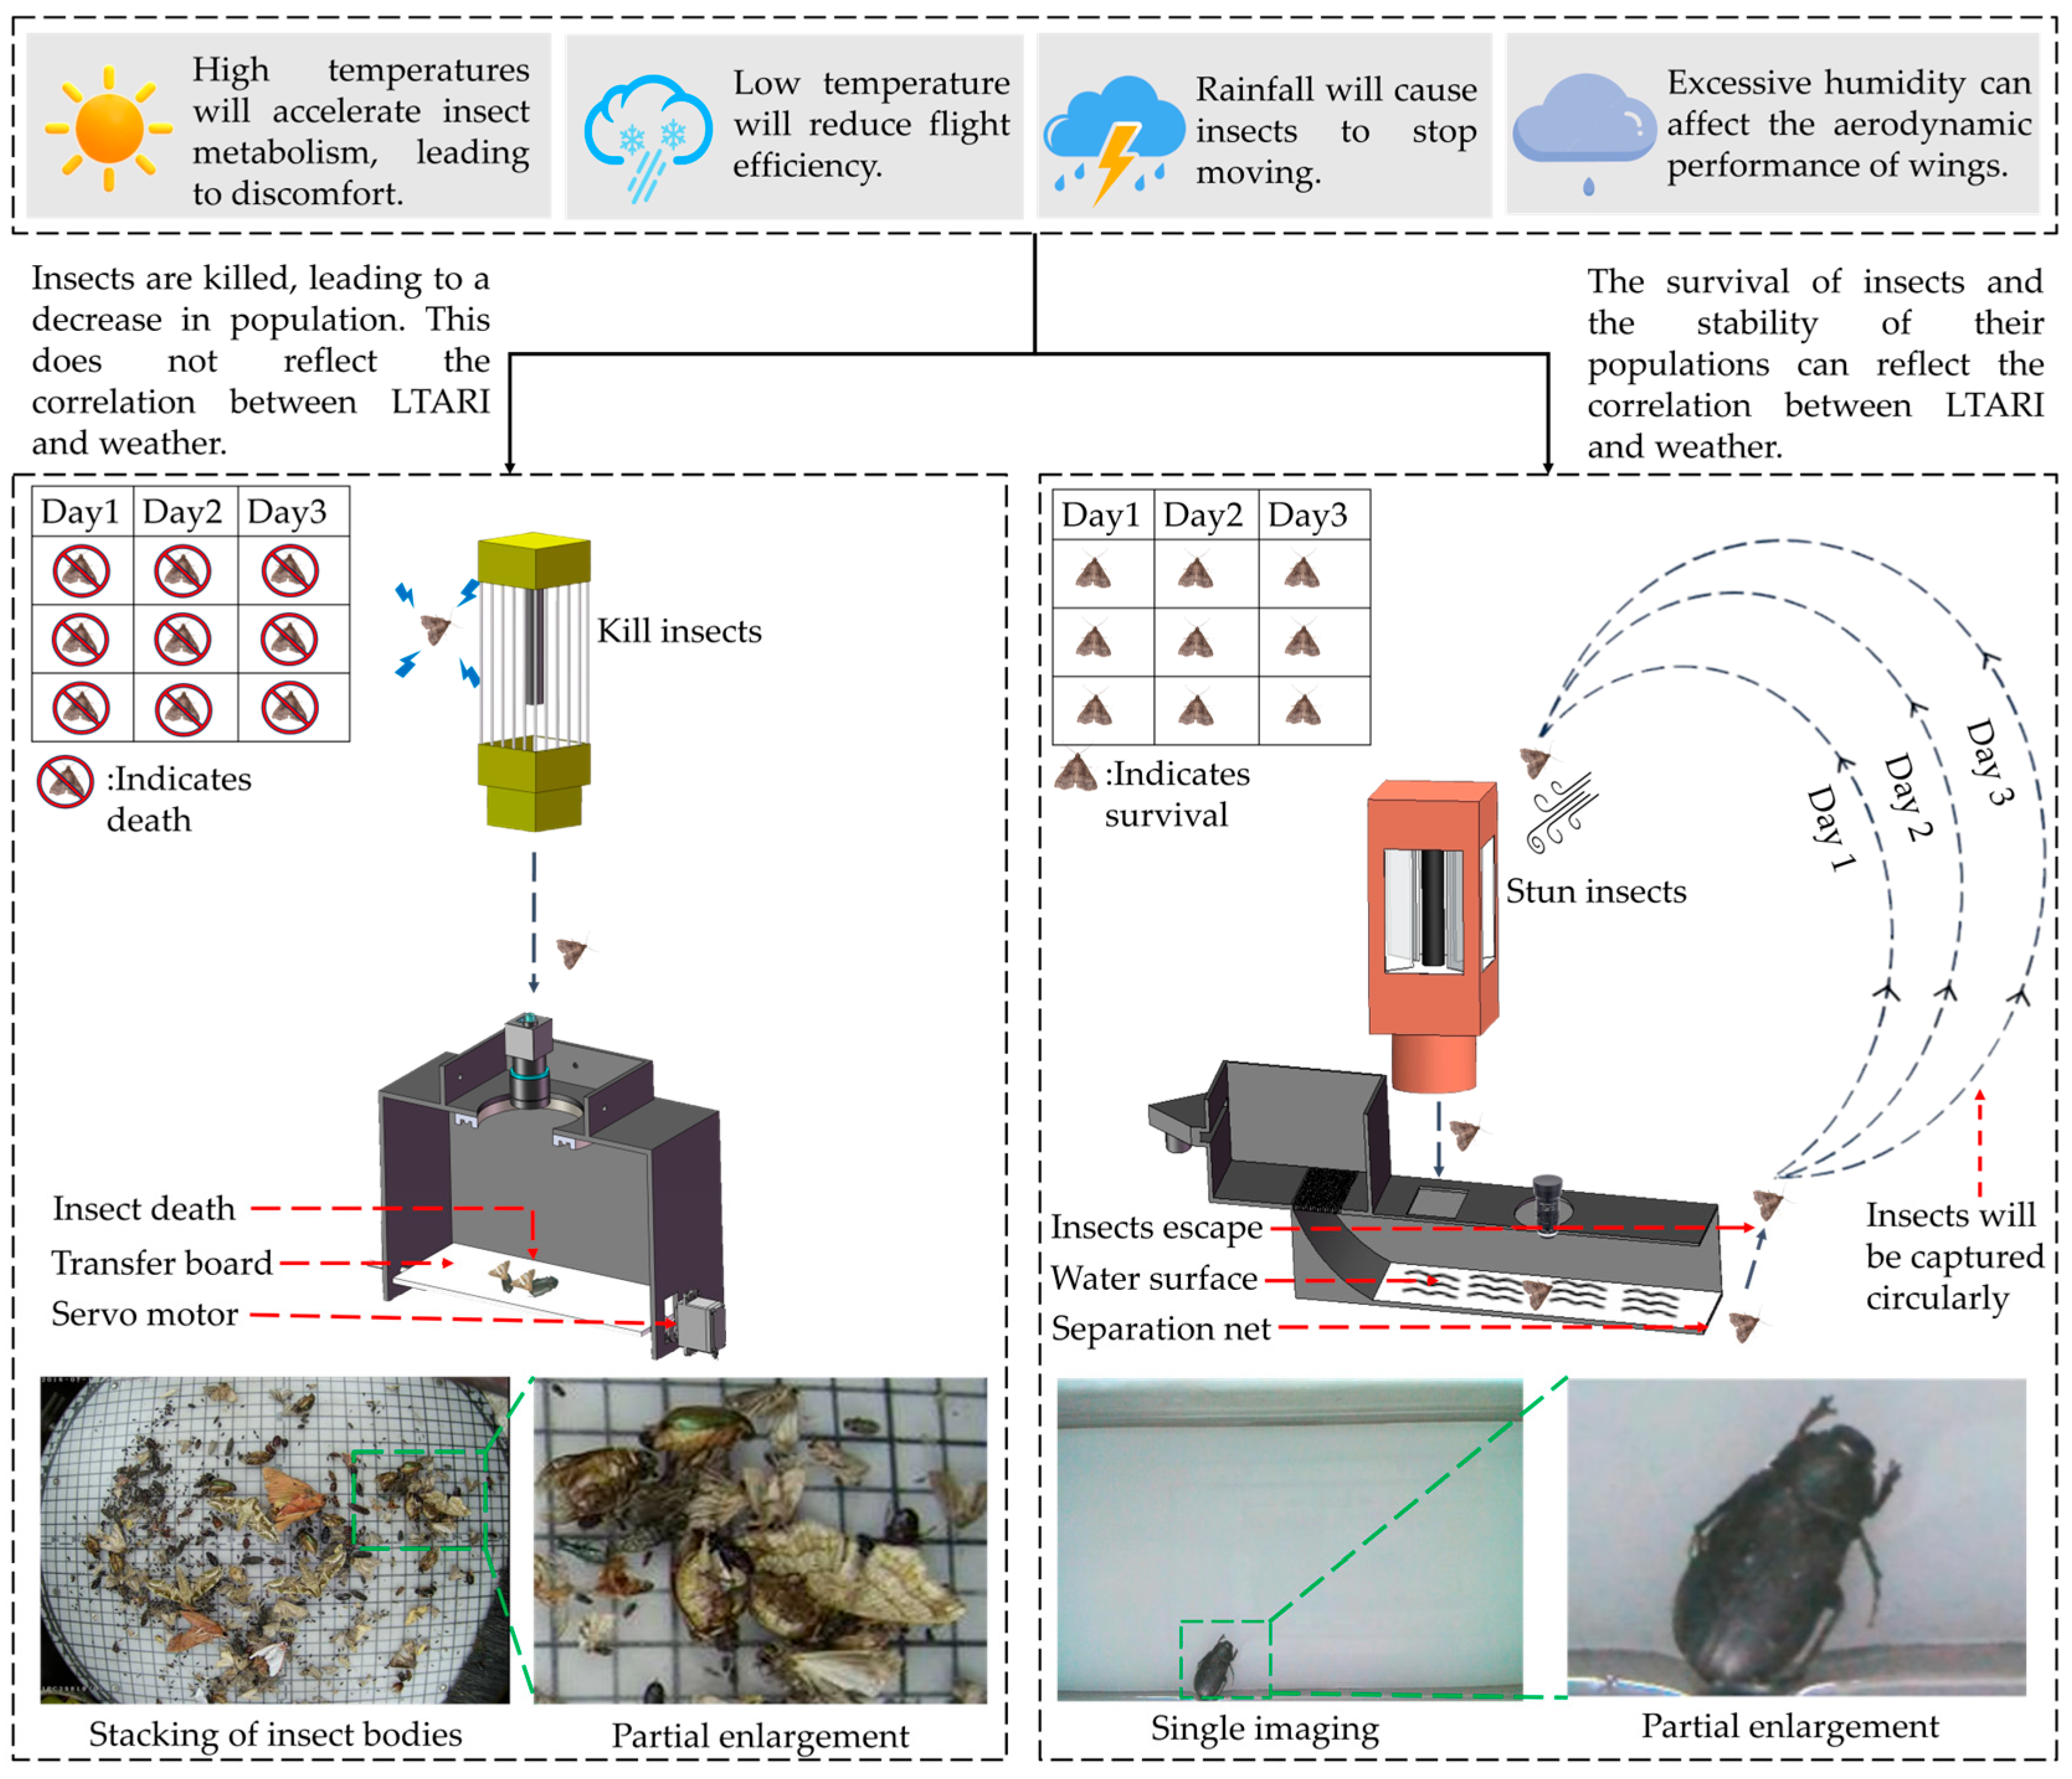
Figure 2 contrasts the operating principles of a conventional automated insect monitoring device (left) and the proposed live-insect monitoring device (right). The conventional system relies on lethal capture via a high-voltage grid: insect carcasses inevitably accumulate and stack, leading to severe occlusion and poor specimen separation in the images, while the destructive sampling method prevents detailed study of live insect behavior and alters population dynamics. In contrast, the proposed device is based on non-lethal capture using an integrated wind-suction and water-flow mechanism. Immediate hydraulic dispersion and transport effectively prevent stacking of insect bodies and ensure that single-insect image data are obtained. At the same time, this non-destructive sampling preserves the local insect population, providing a practical basis for studying authentic phototactic rhythms in the field.
Because activity patterns inferred solely from killed insects are inherently biased, it is necessary to develop non-lethal monitoring systems that allow the construction of reliable LTARI models linked to meteorological and environmental factors.
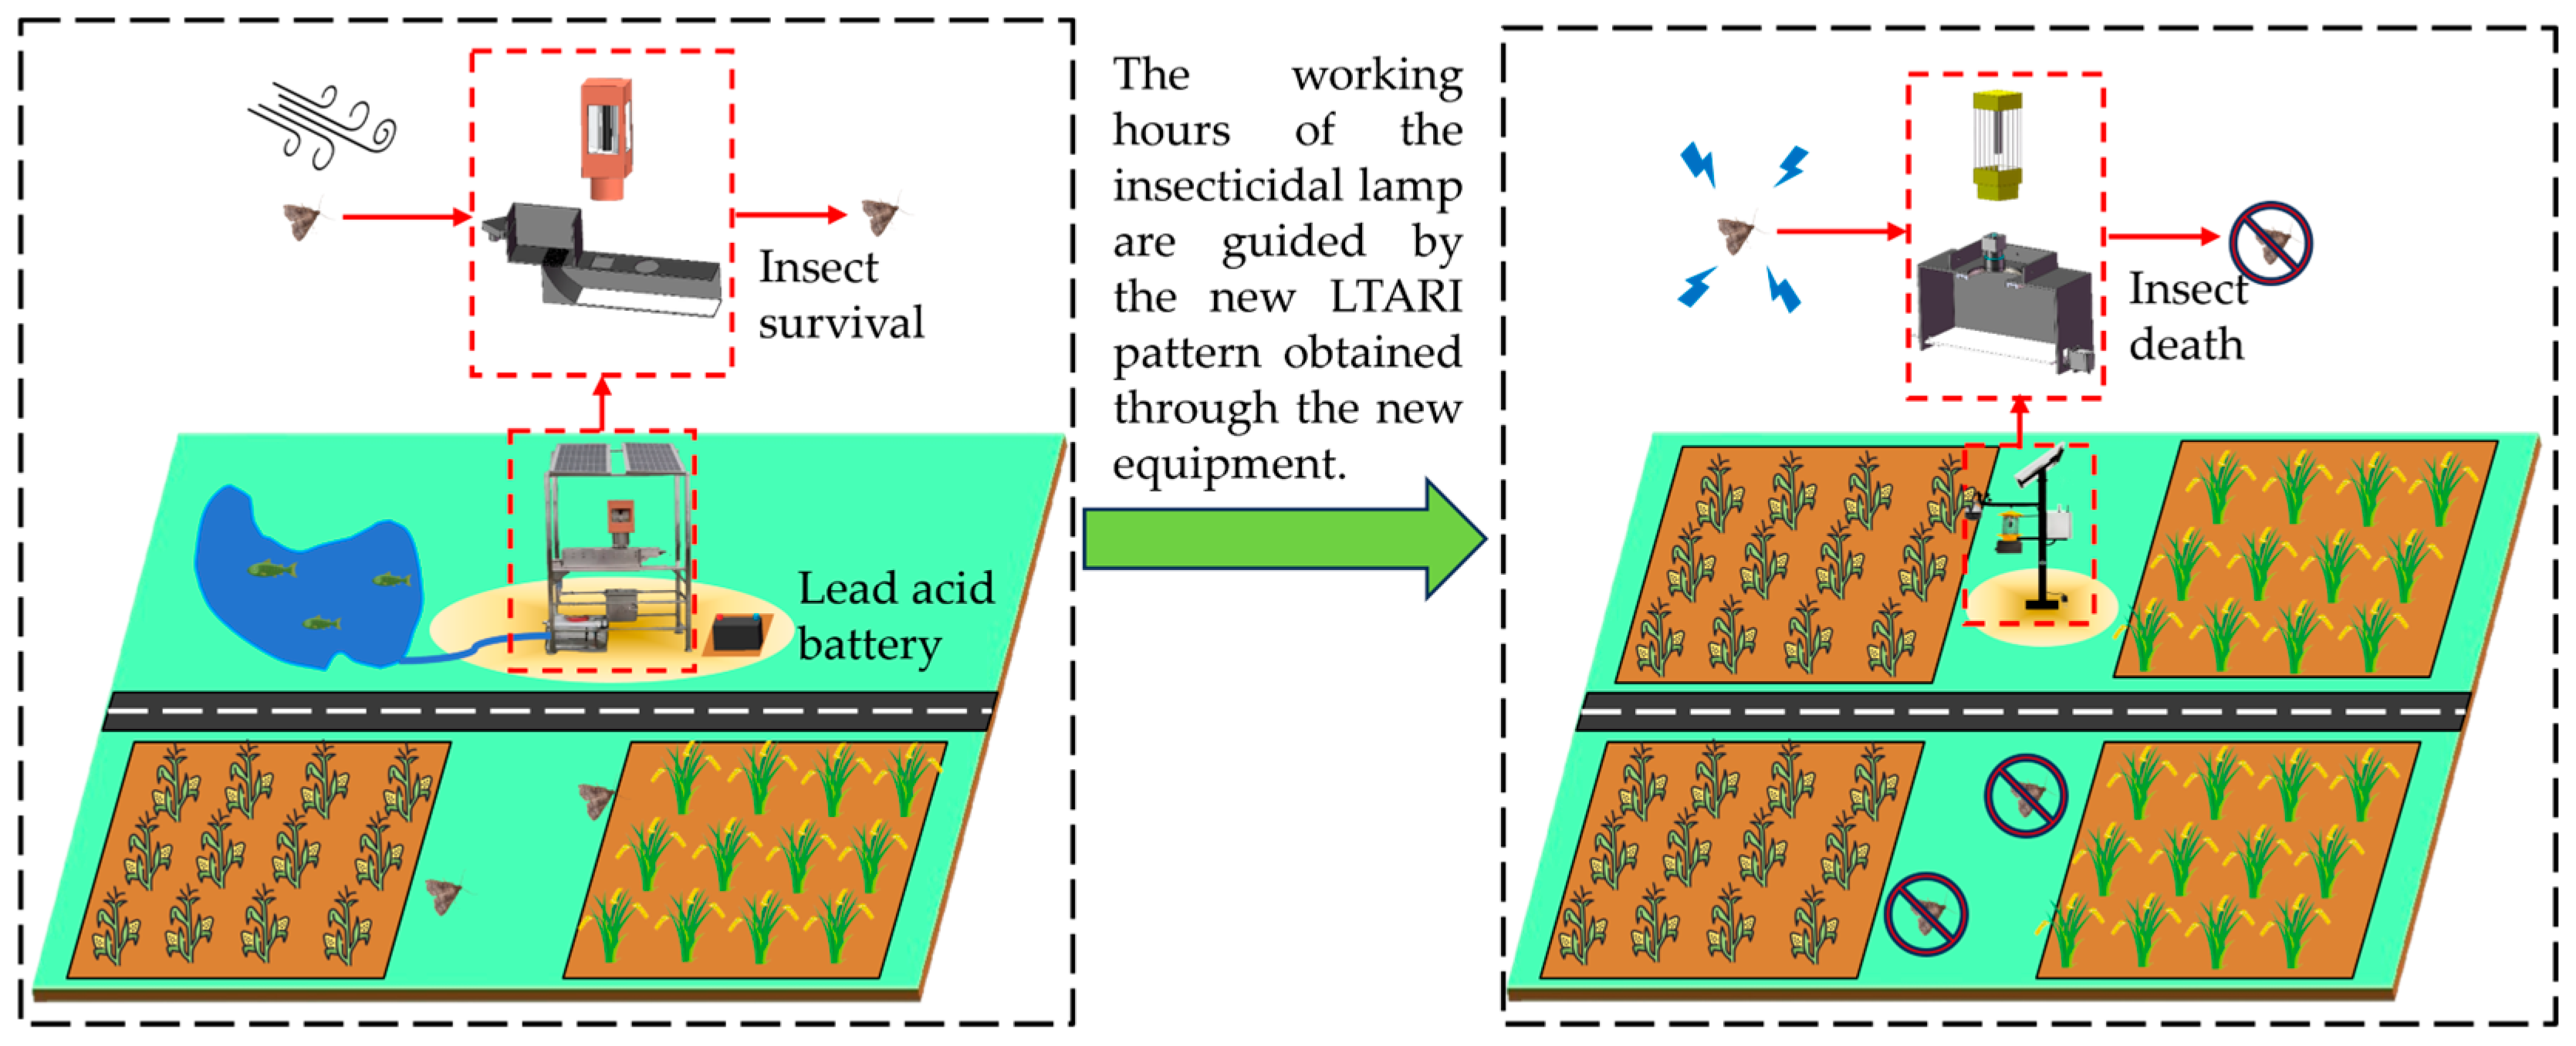
Based on the above system design and operating principles, a potential application workflow for LTARI-oriented pest management is outlined in Figure 3. Conventional automatic mechatronic devices deployed in the field for insect image acquisition face two persistent challenges: they cannot distinguish target from non-target insects, leading to non-selective elimination of beneficial species, and their images are often severely degraded by insect adhesion and stacking.
To overcome these limitations, we propose a non-lethal insect monitoring system specifically designed for in-field deployment. The system enables safe capture, non-contact dispersion, and high-fidelity imaging of live insects, thereby supporting ecological research while minimizing unintended capture and mortality of non-target insects. In the envisioned workflow, LTARI-related patterns obtained from the proposed device are used to optimize the operating schedule of insecticidal lamps, improving control efficiency while reducing ecological impact.
Traditional monitoring equipment can cause substantial physical damage and loss to insect populations when studying the rhythm of light-trap attraction, which directly affects the observation and statistical estimation of the true light-trap attraction rate (LTARI). In contrast, the proposed non-lethal monitoring system can help reduce damage to local insect populations and thus may provide a technical basis for studying the phototactic rhythms of live insect populations under natural or near-natural conditions.

2.2. Hardware Framework Diagram of the System

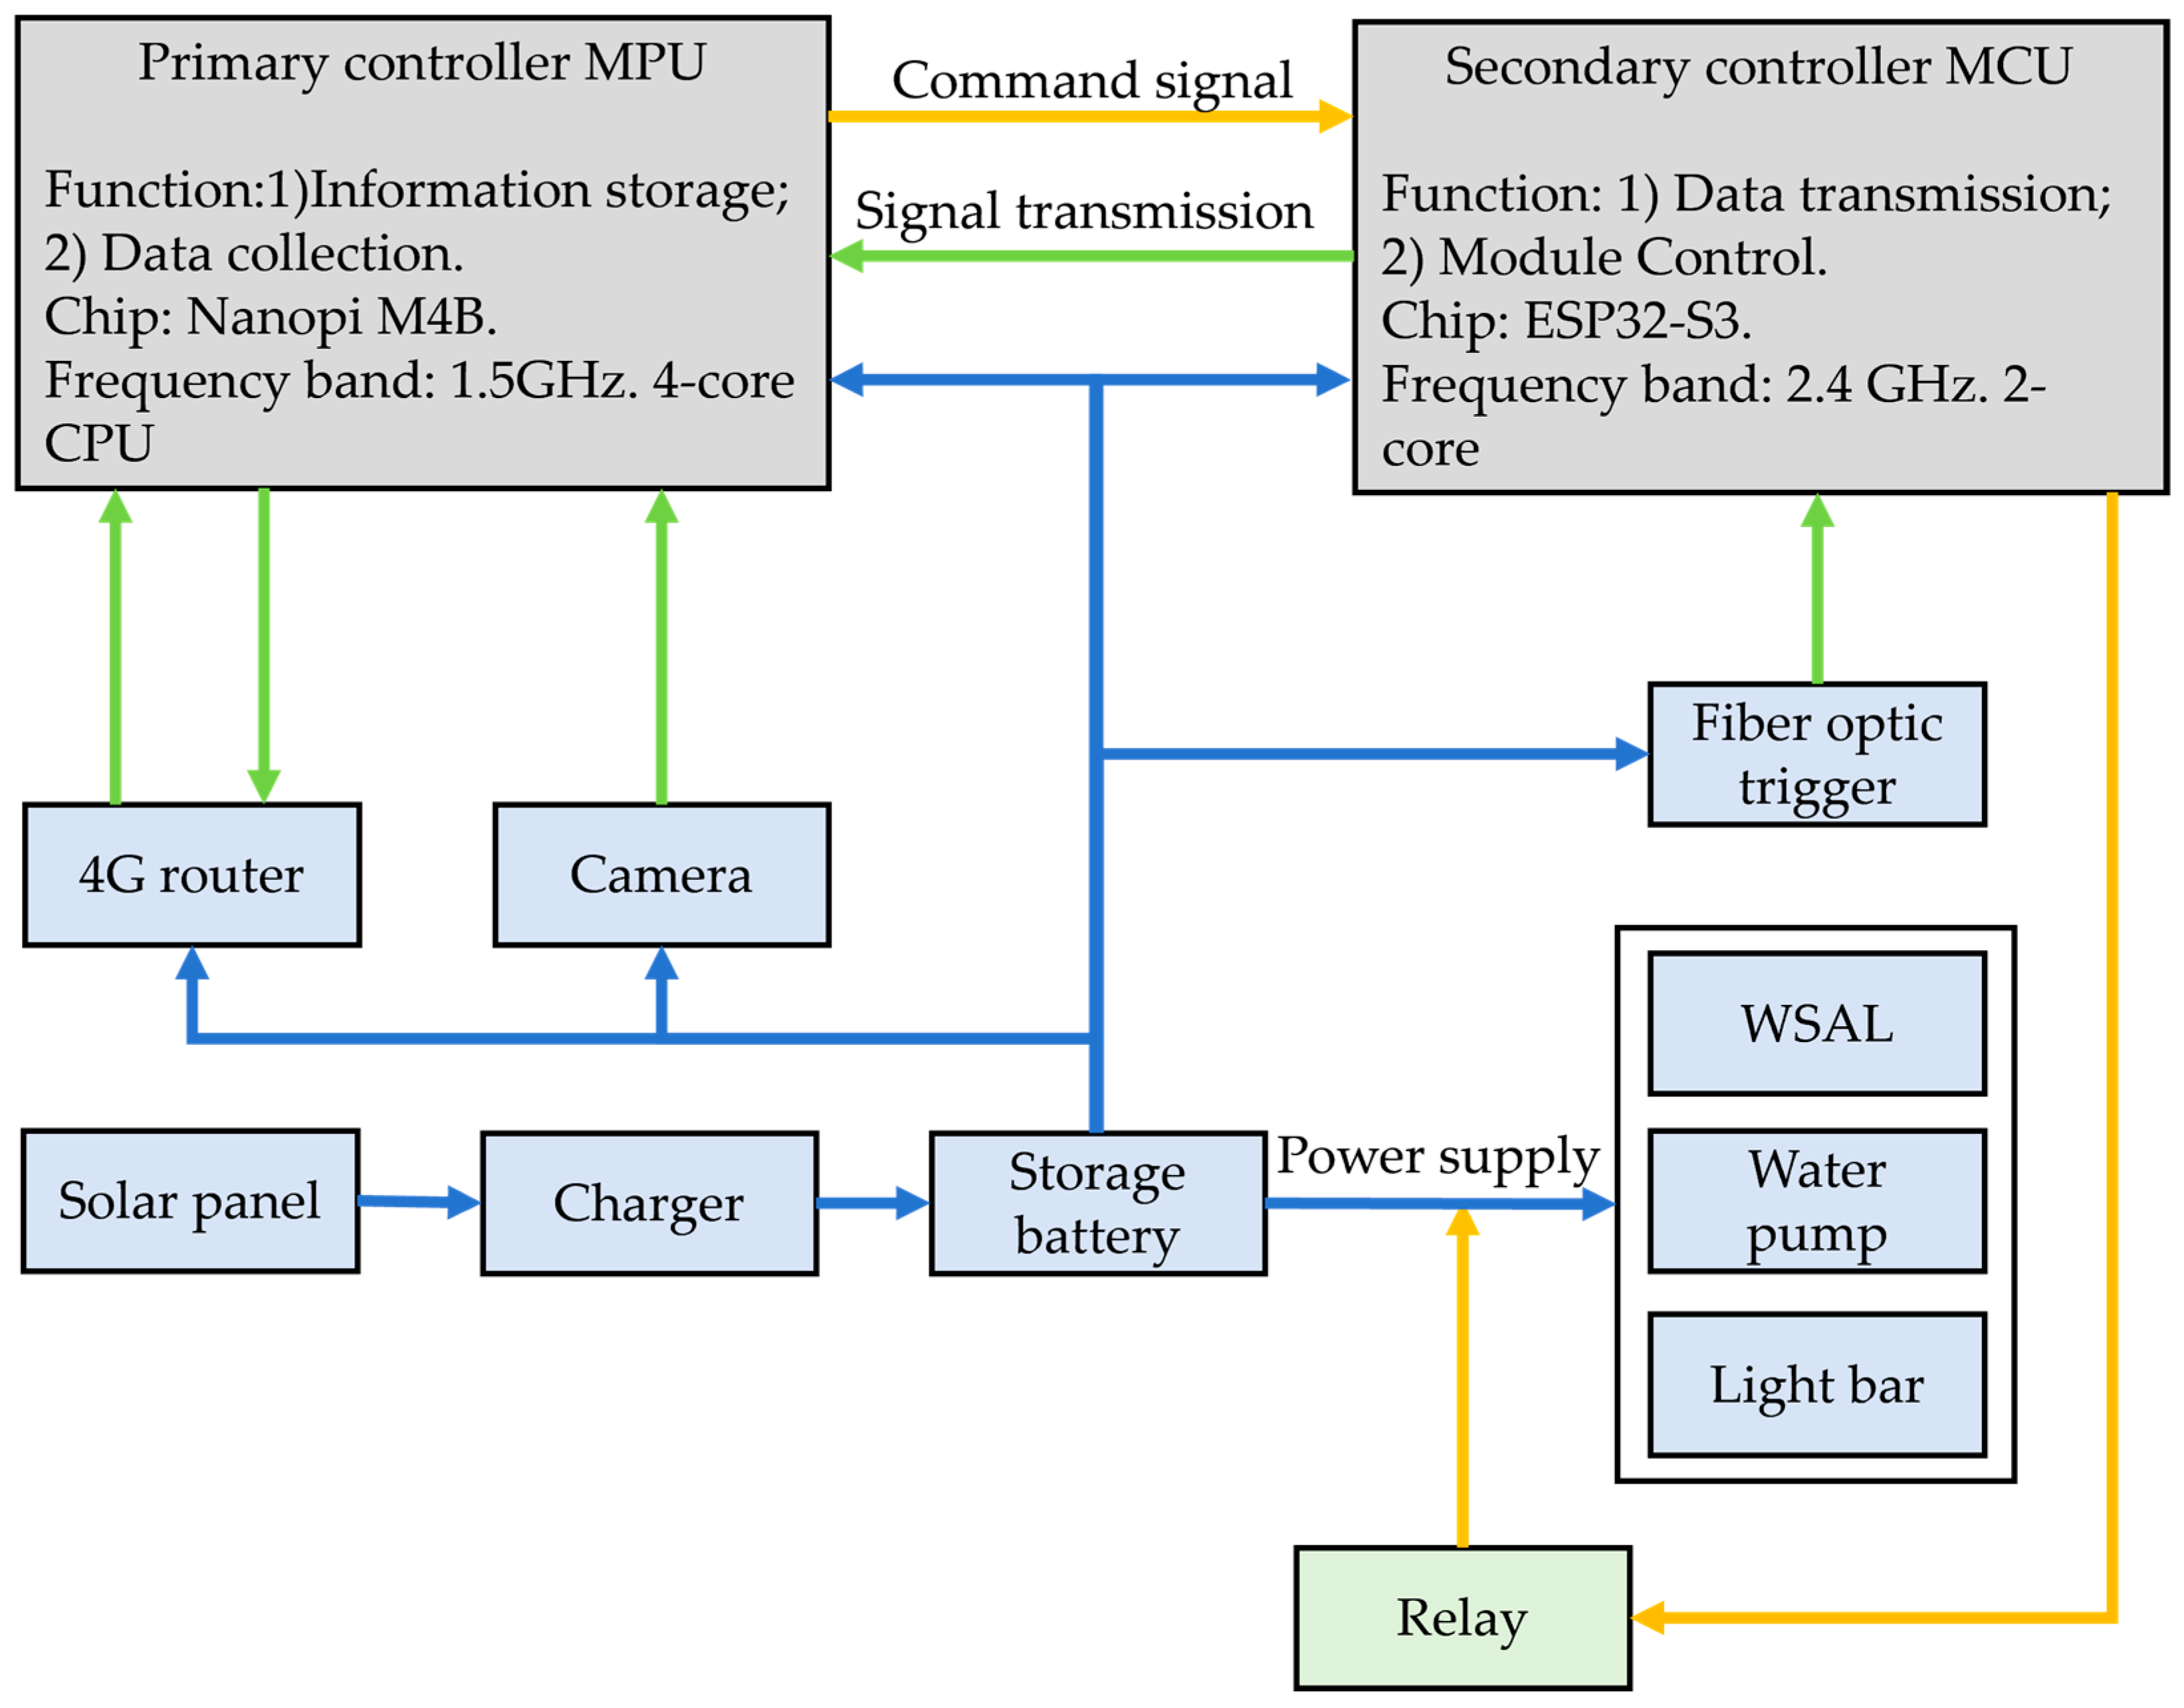
Figure 4 illustrates the overall hardware architecture of the system. The device adopts a hierarchical control scheme comprising a primary controller (MPU) and a secondary controller (MCU). The primary controller, implemented with a NanoPi M4B, oversees system-wide time synchronization and task scheduling. Through its network interface, it coordinates overall operation and manages high-level tasks, including image acquisition, local data storage, system maintenance, and data transmission.
The secondary controller, an ESP32-S3, is dedicated to power management and real-time hardware control. It directly interfaces with all functional modules and executes critical real-time tasks such as water-level monitoring and insect-presence detection via the fiber-optic sensor.

2.3. Feasibility Analysis

To ensure that the proposed WF-DTS can be deployed in real-world outdoor agricultural environments, we conducted an engineering feasibility analysis focusing on mechanical robustness, hardware maturity, software reliability, and ease of maintenance.
First, the main frame and outer housing are fabricated from stainless steel with sealed panels, providing resistance to rain, dust, and long-term UV exposure. The internal circulation system (water tank, pump, pipes, and nozzles) is configured as a closed loop, which reduces water consumption and helps prevent external contamination. The structure relies on welded frames and standard fittings rather than high-precision machining, facilitating fabrication and repair in typical agricultural engineering workshops.
Second, the hardware modules were deliberately selected from widely used, mature products. The attraction lamp adopts a commercial light source suitable for outdoor agricultural monitoring; the water-circulation module uses a 12 V DC pump; and the imaging subsystem is based on an industrial camera with a simple mounting structure. To determine suitable operating conditions, preliminary bench-top experiments were carried out to select the type and installation position of the attraction light strip and to identify an appropriate range of water-flow velocities that ensures stable insect transport and dispersion without overflow or excessive splashing. The qualitative results of these tests and the final parameter settings are summarized in Supplementary Material S3. To facilitate global reproducibility, all electronic modules (pumps, sensors, and controllers) are specified by their functional parameters (e.g., voltage, current, and power rating) rather than by vendor-specific part numbers. This allows users in different regions to substitute locally available components with similar specifications.
Third, the control system is implemented on a widely used embedded platform programmed in the C language, which is common in industrial and agricultural applications. This reduces the risk associated with experimental software stacks and makes the system easier to maintain and extend for engineers familiar with conventional embedded development. A 4G router is used as the communication gateway to provide stable uplink and downlink data transmission via existing mobile networks in rural areas.
Finally, preliminary field operation and power measurements (Section 6.1 and Section 7.2) confirmed that the selected energy-storage and circulation configurations are sufficient to support multi-night monitoring. Under typical conditions, the prototype can operate continuously for approximately 2.5 days without solar supplementation, using a 90 L closed-loop water tank. Routine maintenance is limited to replacing the filter sponge every 2–3 days and cleaning the imaging area as needed. The detailed circuit design, measurement setup, and sample power-consumption data are provided in Supplementary Material S2. These results indicate that the WF-DTS design is feasible for practical deployment, while further optimization will target long-term robustness under more extreme weather conditions.

3. Mechanical Design

3.1. WF-DTS Structure Diagram

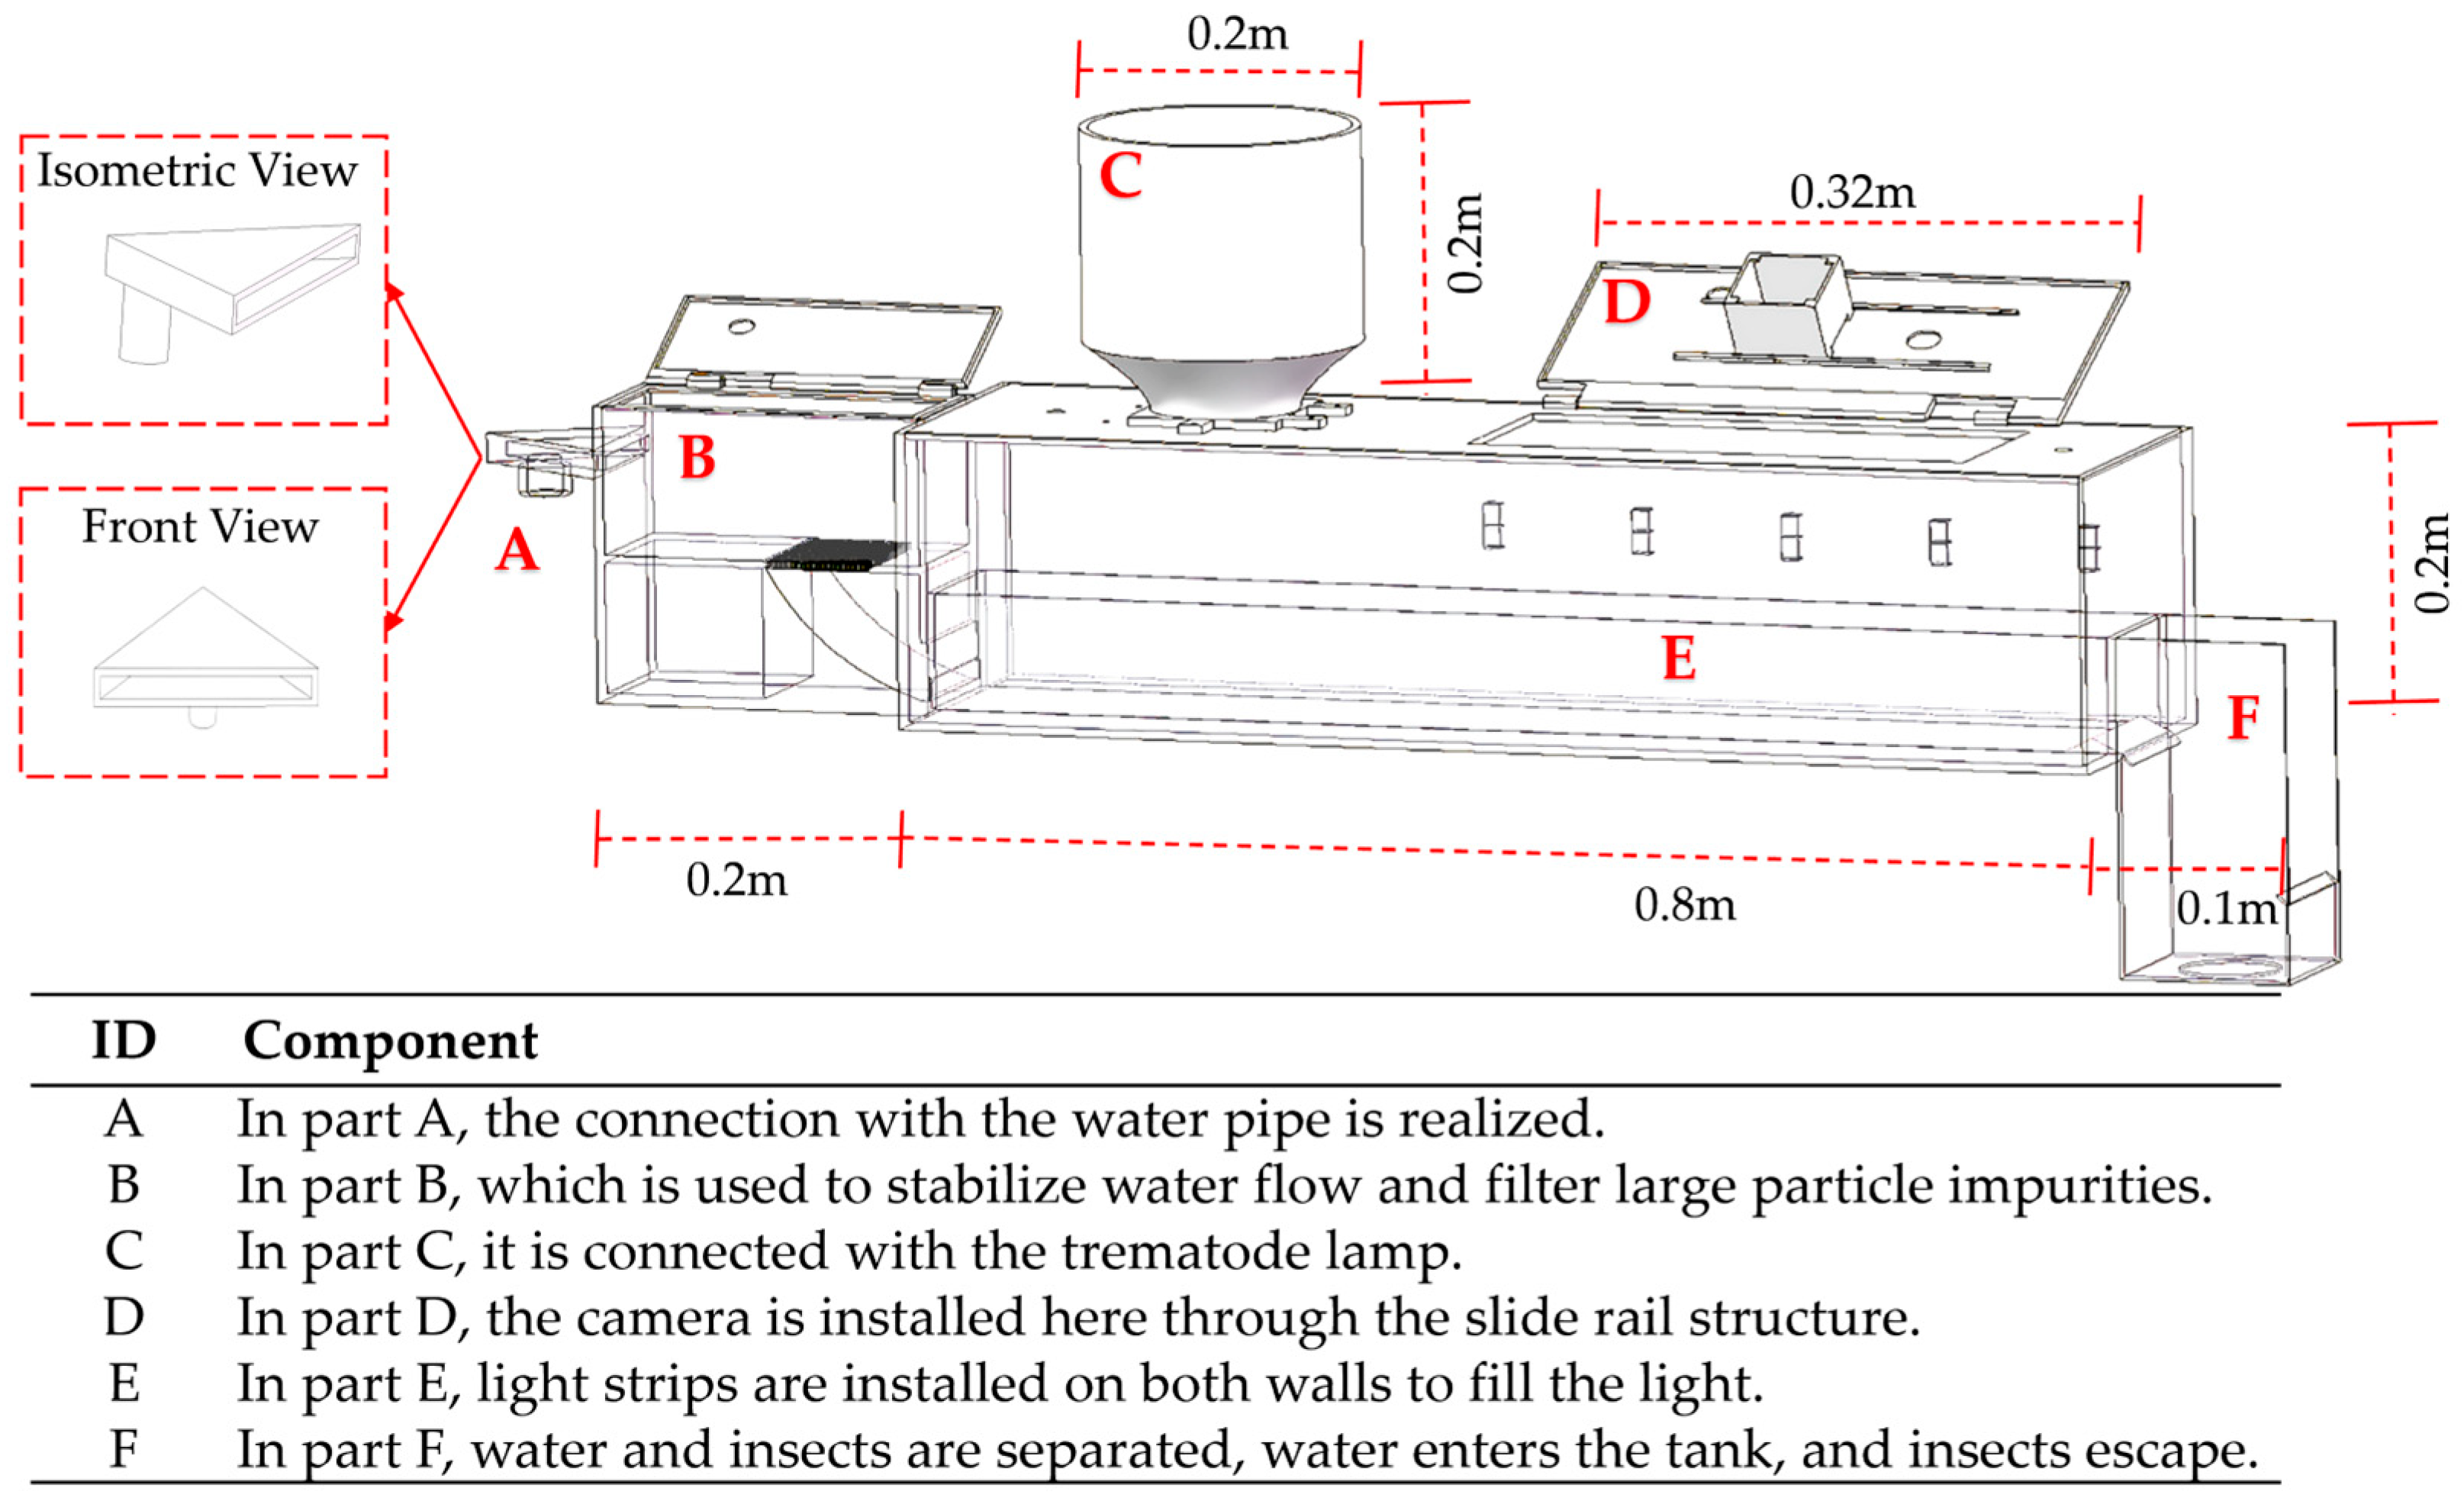
The proposed monitoring system consists of several functional modules, among which the Water-Flow Dispersion and Transport Structure (WF-DTS) is the core component for live insect capture and imaging. The WF-DTS integrates controlled airflow, water-assisted transport, and optical imaging to achieve individual insect dispersion and non-lethal handling. In this section, the detailed design of the WF-DTS is introduced first, followed by the description of the overall mechanical structure.
Figure 5 shows the mechanical structure of the WF-DTS, which measures approximately 1 m (L) × 0.2 m (W) × 0.2 m (H). Its main workflow is as follows: water enters the device at Position A; insects attracted and briefly stunned by the WSAL are then carried into the imaging area by the underlying water flow; after image acquisition, the insects are guided out of the system through the outlet. The workflow of the WF-DTS is described in more detail below with reference to the diagram.
  • Position A: Water pump inlet with a combined four-way internal thread and duck-foot geometry. The inlet of the dispersion tank adopts a “duck-foot” shape, which redirects the incoming vertical jet into a laterally expanded, shallow horizontal sheet of water. By increasing the cross-sectional area and smoothly turning the flow, this structure reduces the local flow velocity and suppresses deep plunging jets and strong free-surface turbulence in the imaging region. As a result, the water layer above the imaging window becomes more uniform and stable, which is beneficial for obtaining clear images with a consistent background and for avoiding bubbles and splashes that could occlude insects. In addition, the predominantly horizontal, gentle flow allows insects to be transported smoothly across the field of view, reducing sudden impacts and collisions with the tank walls and helping to maintain isolated trajectories during imaging.
  • Position B: Filtration and buffering structure comprising filter sponges and densely perforated plates. The filter sponge performs preliminary water filtration to prevent debris from entering the imaging area, while the perforated plates act as a hydraulic buffer, further stabilizing the flow before it reaches the imaging window.
  • Position C: Connection and sensing module with a long strip-shaped threaded port for fixed attachment to different WSAL models and a fiber-optic sensor mounted beneath. Once an insect is captured by the WSAL and passes through the inlet, it interrupts the fiber-optic beam, and the sensor immediately transmits a trigger signal to the controller, initiating automatic image acquisition.
  • Position D: Camera housing with a custom detachable slide-rail mount. This compartment serves as a sealed camera housing and incorporates a self-designed detachable slide-rail mount. The structure allows flexible adjustment of the camera position and viewing angle, simplifies installation and maintenance, and helps to keep the camera and lens protected from moisture and splashes.
  • Position E: Data collection area with E-shaped notches on both sidewalls for mounting the light strip. At the bottom of the data collection area, a 1 mm thick white matte sheet is installed, providing a clean, uniform background and effectively reducing interference from debris or complex patterns when imaging target insects.
  • Position F: Outlet separation section with a 45° wire-mesh slope to separate water and insects as flow exits.

3.2. Overall Mechanical Structure

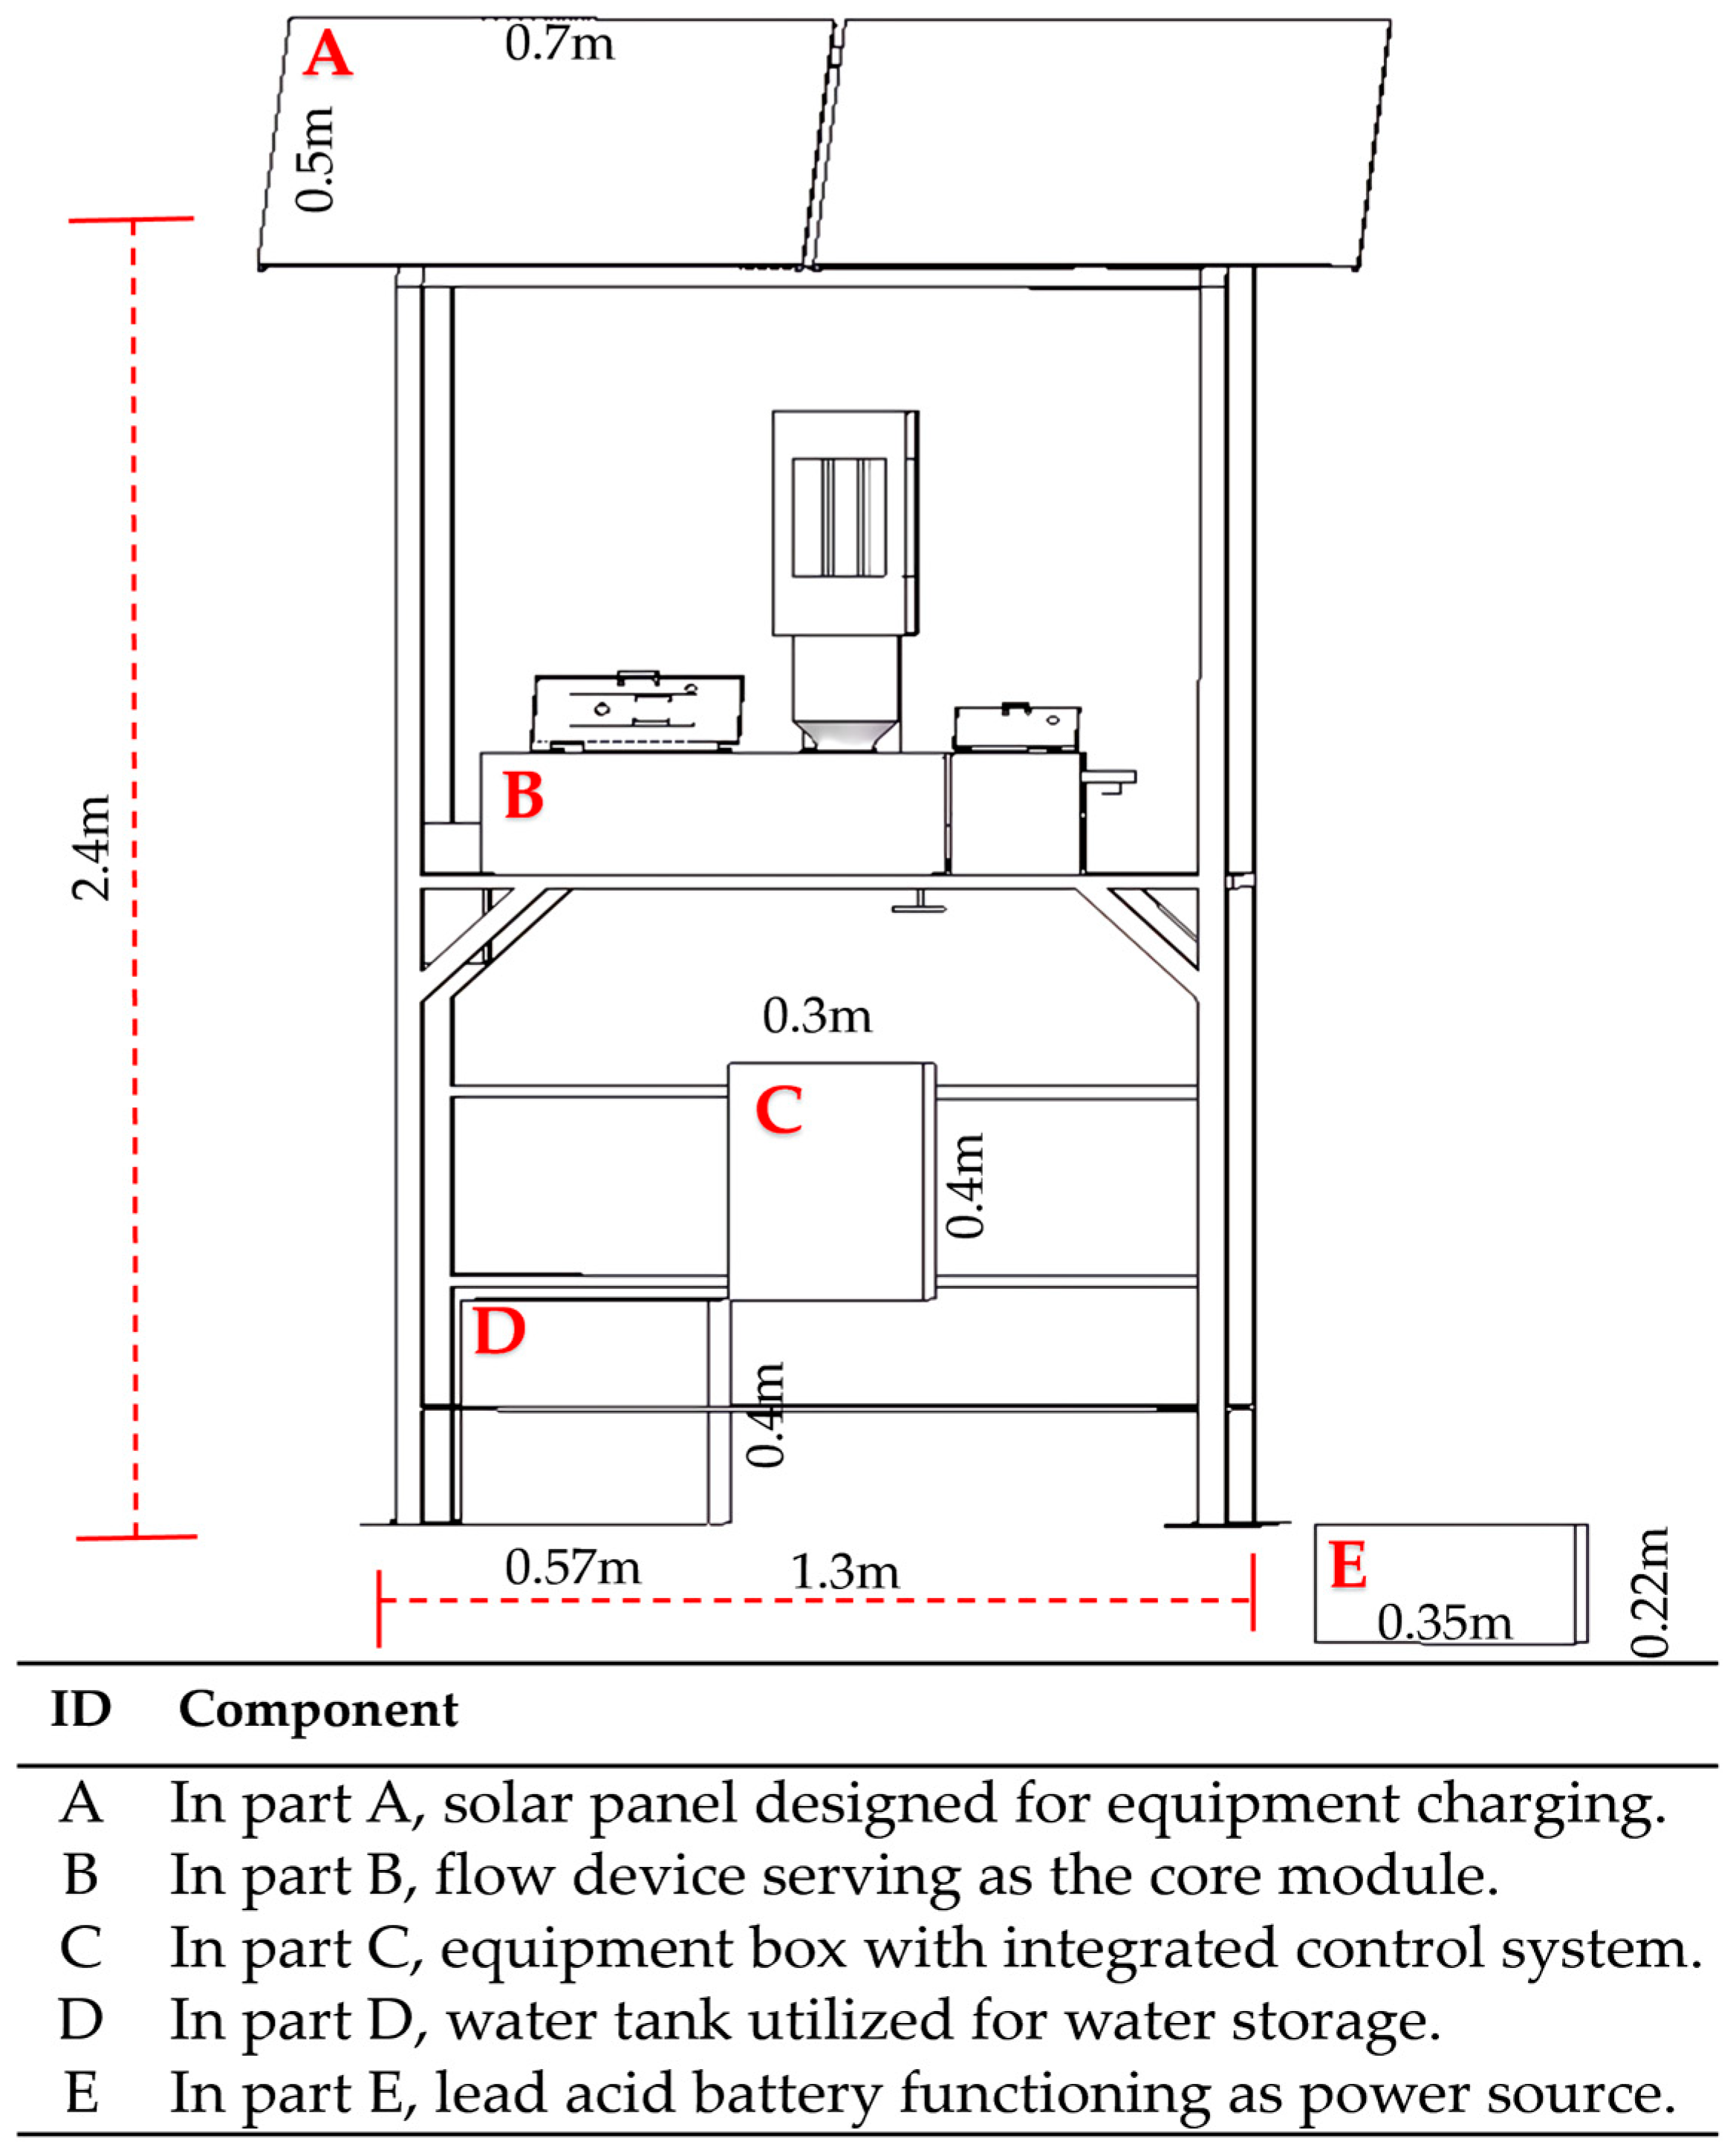
Figure 6 illustrates the mechanical structure of the system, which is fabricated from 201 stainless steel using sheet-metal processing. The overall dimensions are 2.4 m (H) × 1.3 m (L) × 0.4 m (W). The functional layout integrates:
  • Position A: Two solar panels (0.5 × 0.7 m each, 60 W maximum charging power) that provide continuous power to the device.
  • Position B: A custom-designed WF-DTS module that disperses insect bodies and prevents physical contact among individuals.
  • Position C: A control box (0.4 × 0.3 × 0.2 m) that houses the central control system and associated circuits, featuring a compact structure and a high protection rating.
  • Position D: A 90 L water tank that supports a closed-loop circulation system driven by a 12 V, 1200 L/h DC pump.
  • Position E: A buried battery compartment with a durable waterproof plastic housing containing a 12 V/80 Ah lead-acid battery.
Through this integrated and optimized layout, the system combines live-insect handling with robust automation, ensuring reliable long-term performance in outdoor environments.
Figure 6. Overall mechanical design of the system.
Electronics 15 00714 g006
The mechanical system integrates functional modules—energy management, insect processing, and automated control—through structural optimization and rational layout. This design ensures stable long-term outdoor operation.
Table 3 lists the key parameters of the device. The imaging camera employs the IMX377 sensor. The water pump is a 12 V DC unit with a flow rate of 1200 L/h and a head of 3.3 m.

4. Hardware Design

4.1. Diagram of the Overall System Framework Design

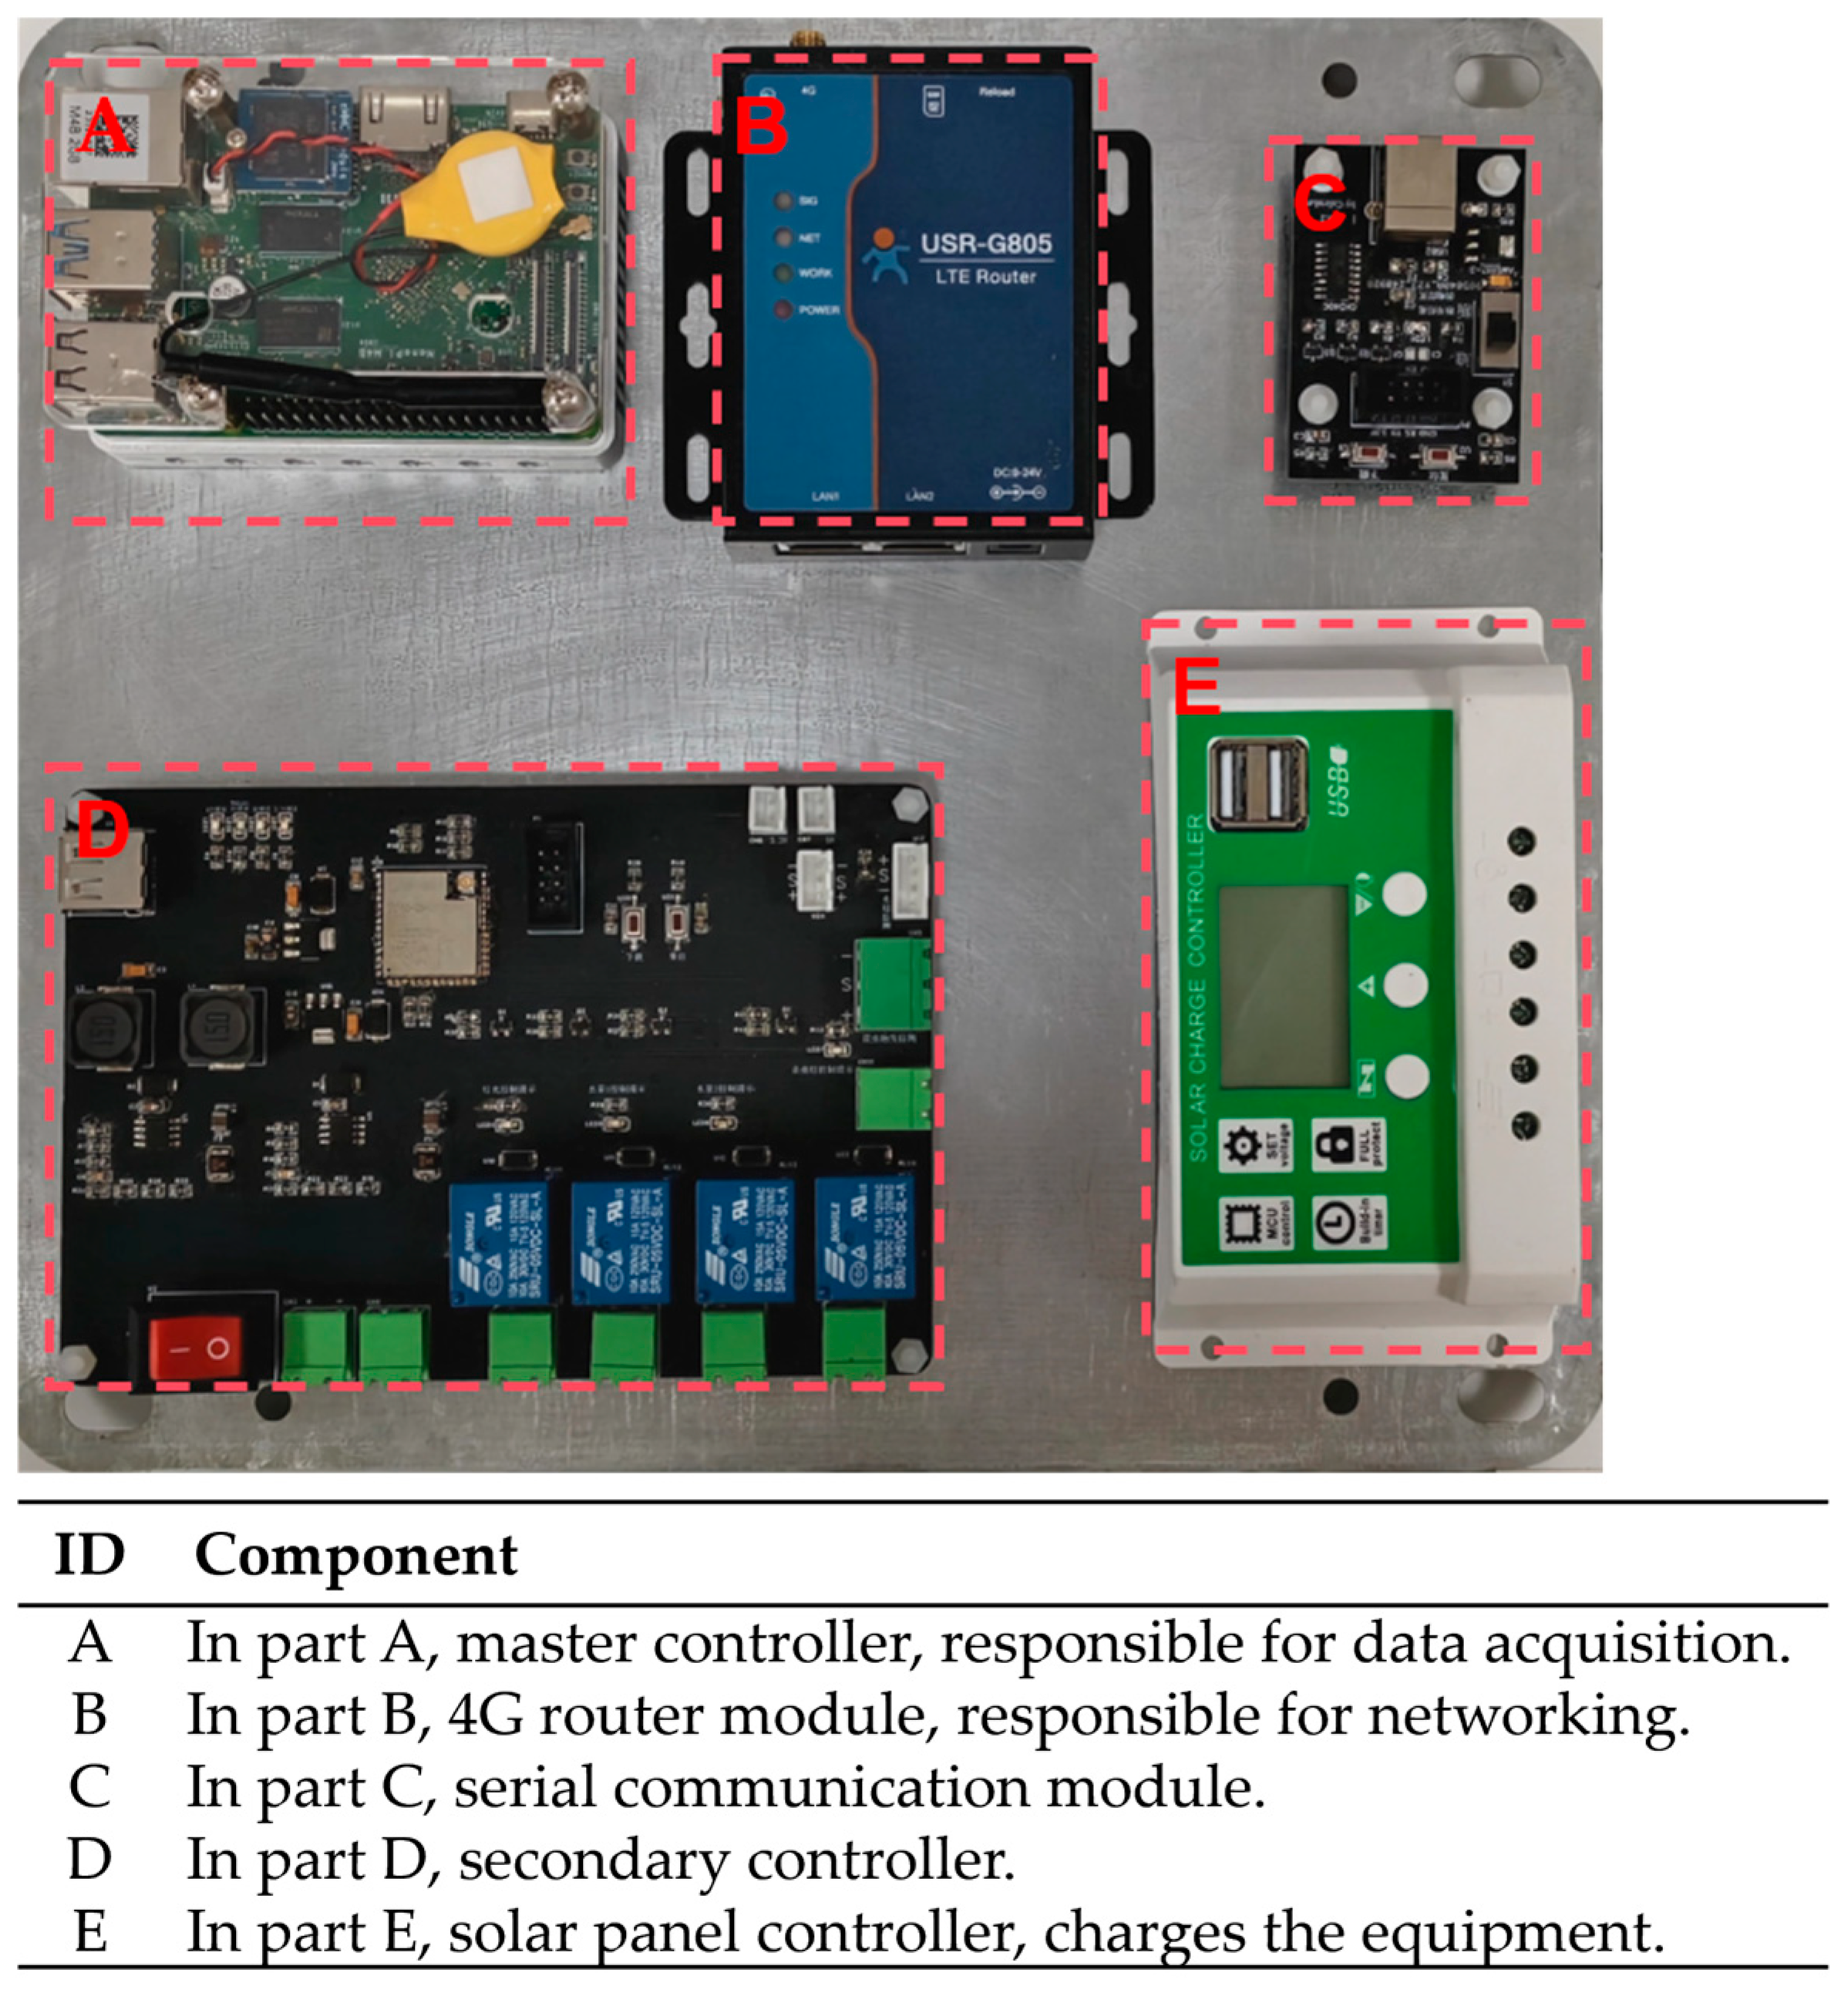
Figure 7 shows the layout of the system hardware architecture.
  • Position A: Main controller (NanoPi M4B), which performs system time synchronization, controls image capture, manages data storage and transmission, and serves as the host that sends commands to the subordinate controllers.
  • Position B: 4G router compartment, which provides wireless data transmission between the device and the remote server.
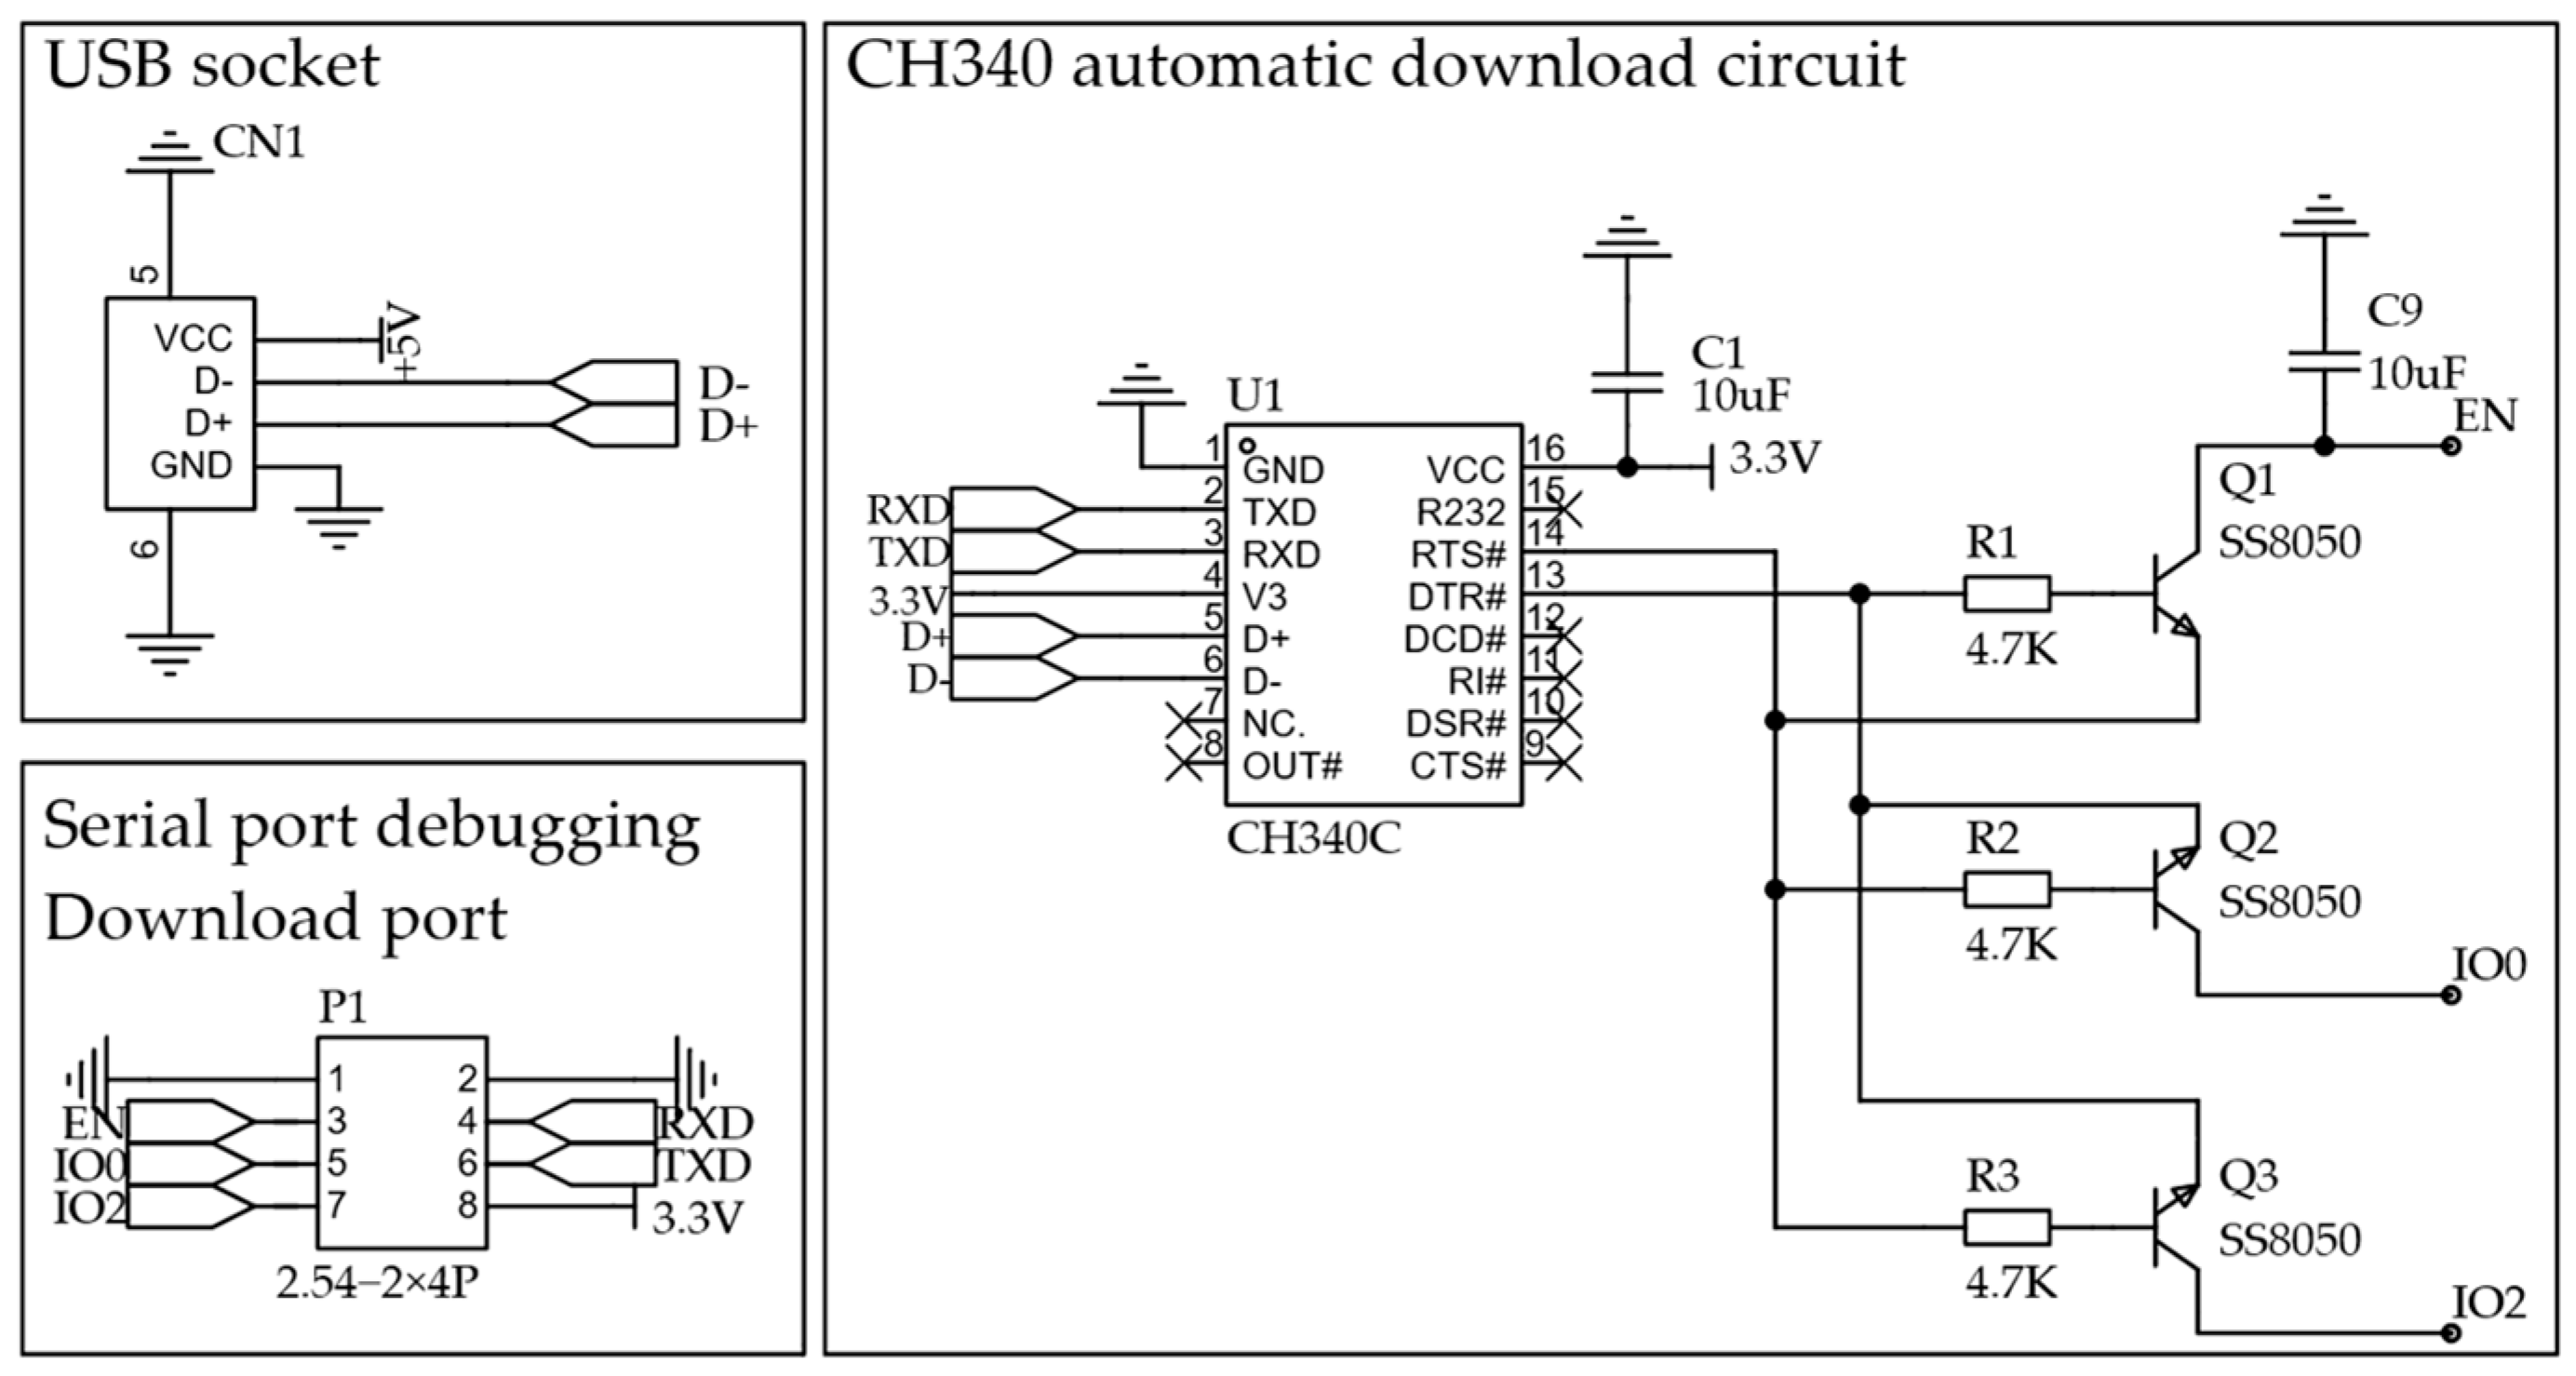
  • Position C: Serial communication module, which manages the communication link between the primary and secondary controllers and includes an auto-download function for firmware and system upgrades.
  • Position D: Custom control unit based on the ESP32-S3 microcontroller, responsible for component power management, timed control of the Wind-Suction Attraction Lamp (WSAL), and switching control of other high-power devices.
  • Position E: Solar charging module, which coordinates and manages power distribution among the solar panels, the battery, and the overall system.
Figure 7. The system hardware architecture layout.
Electronics 15 00714 g007
This section primarily outlines the hardware architecture layout of the system. The following section provides a detailed description of the independently designed secondary control unit.

4.2. Secondary Control Circuit Board Implementation

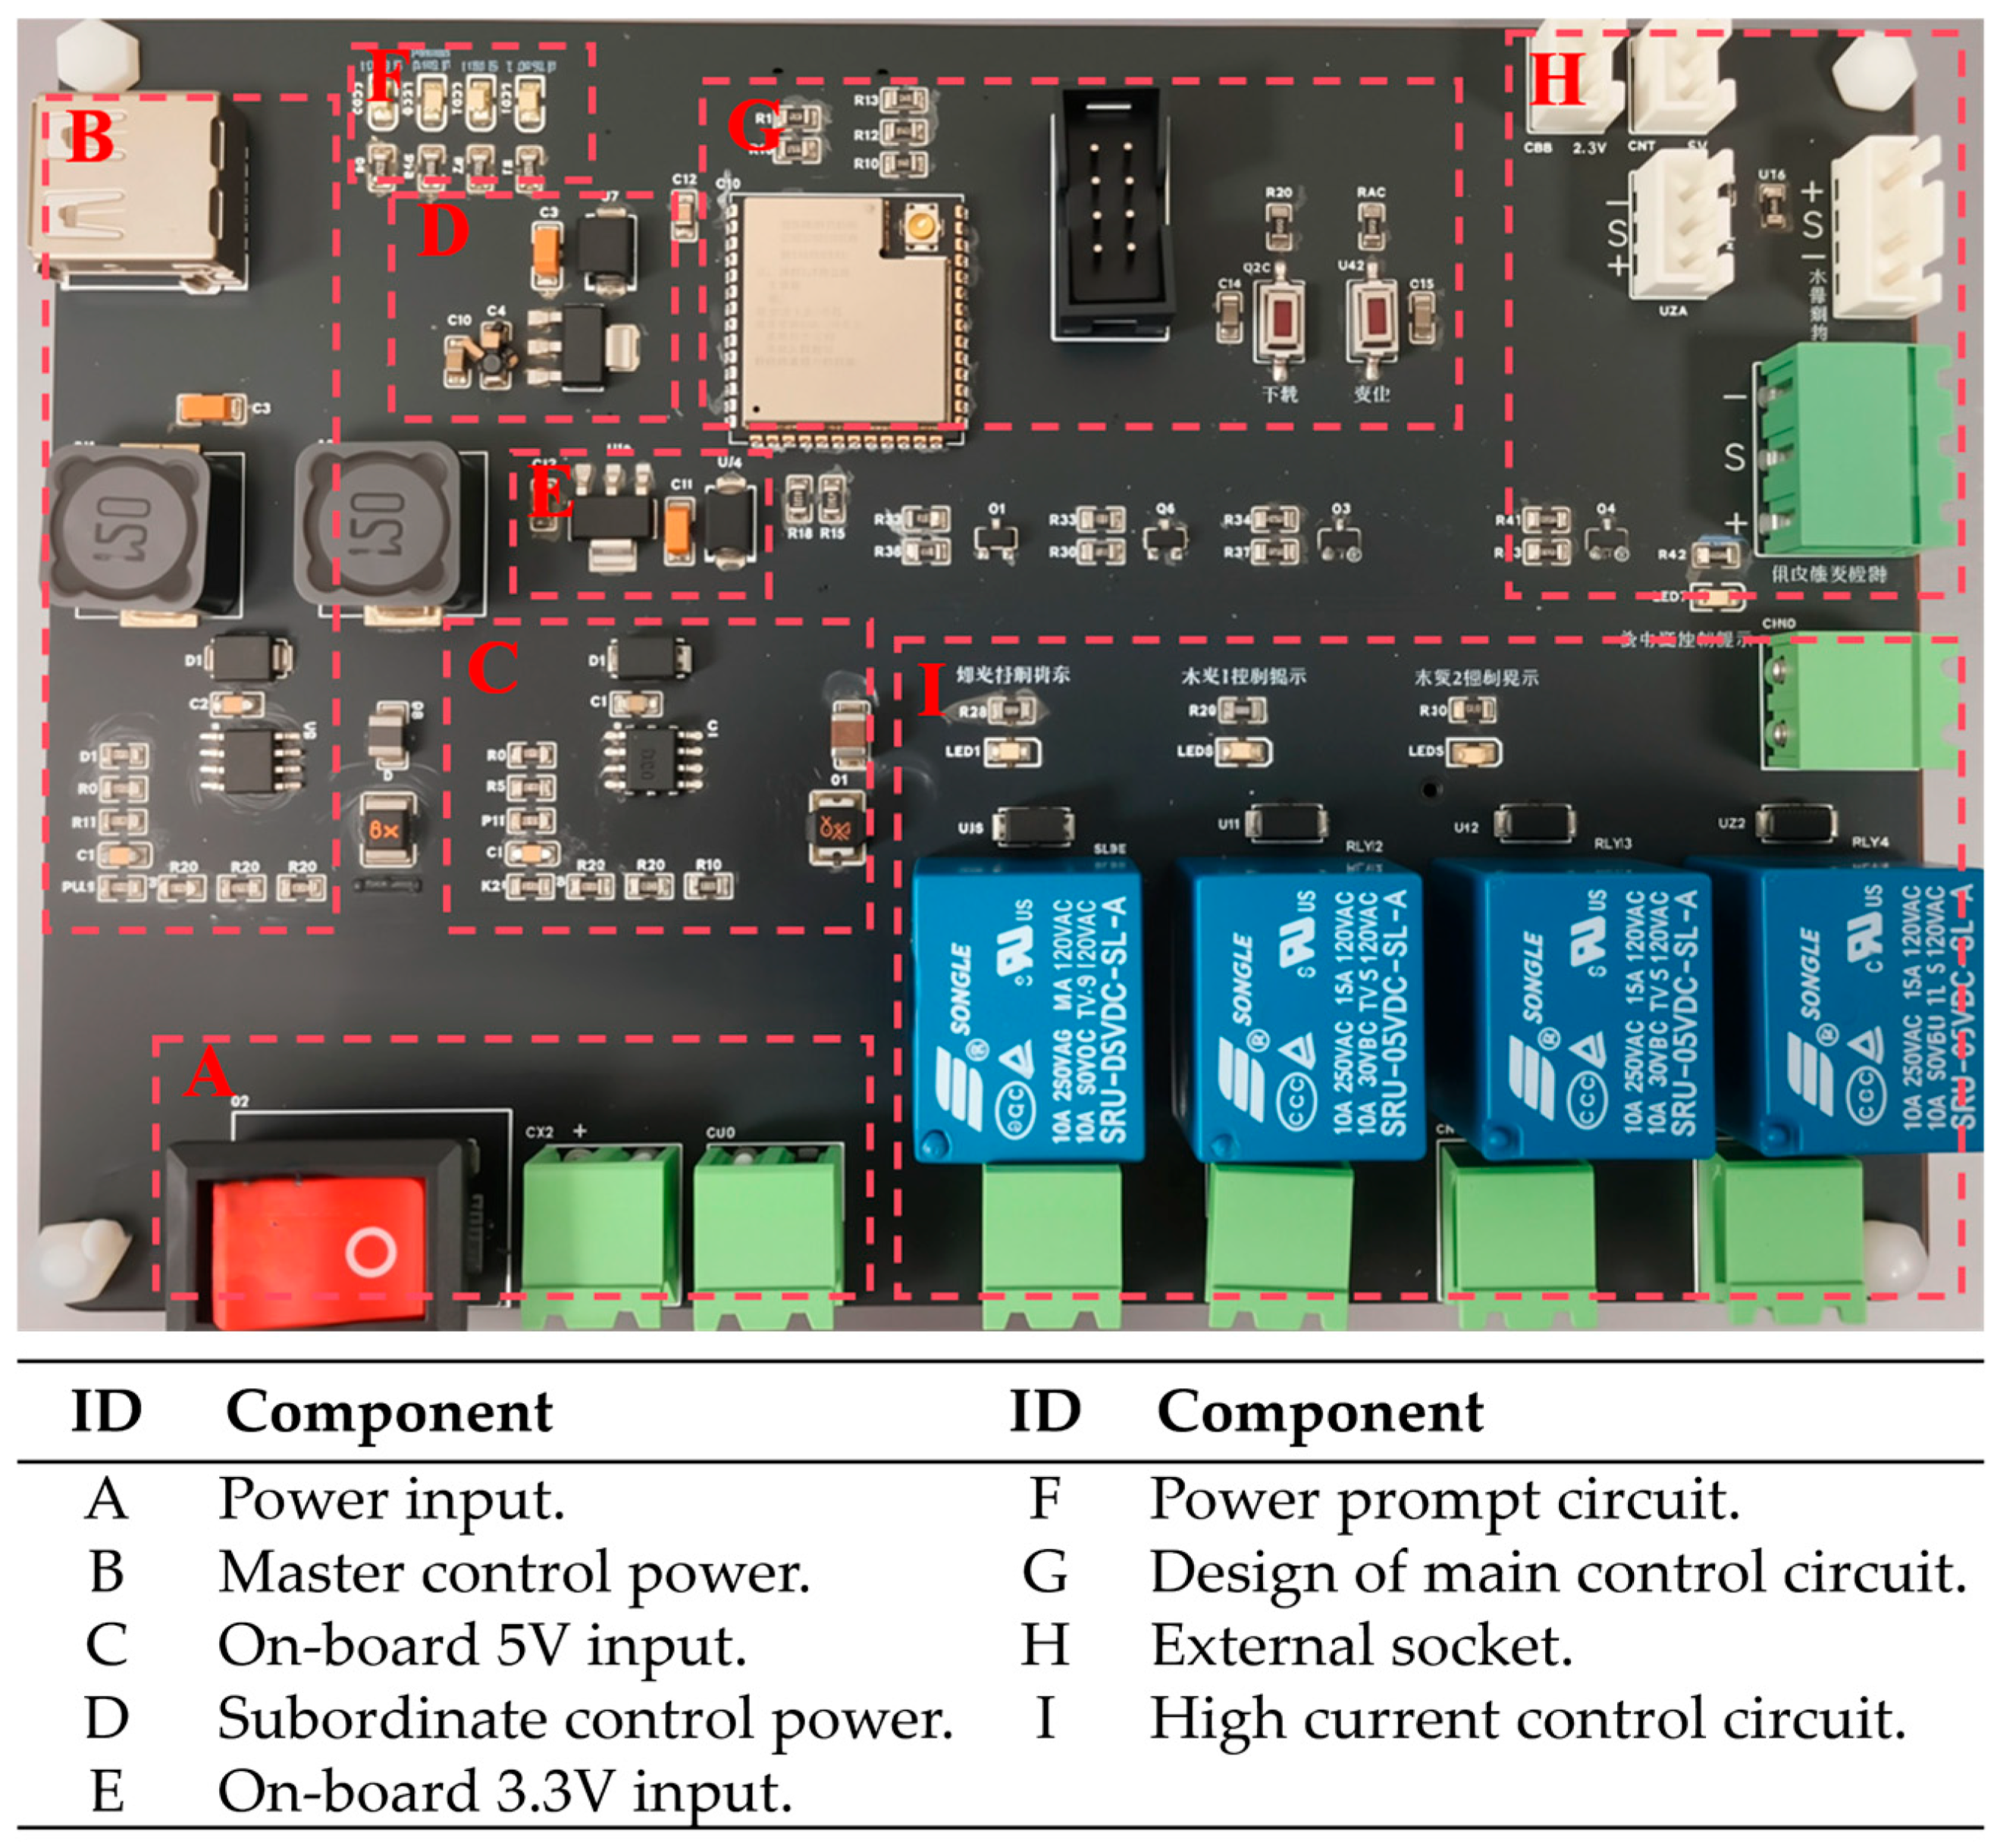
Figure 8 illustrates the secondary control circuit board:
  • Position A: This section serves as the 12 V battery power inlet, which supplies power to the development board via a toggle switch.
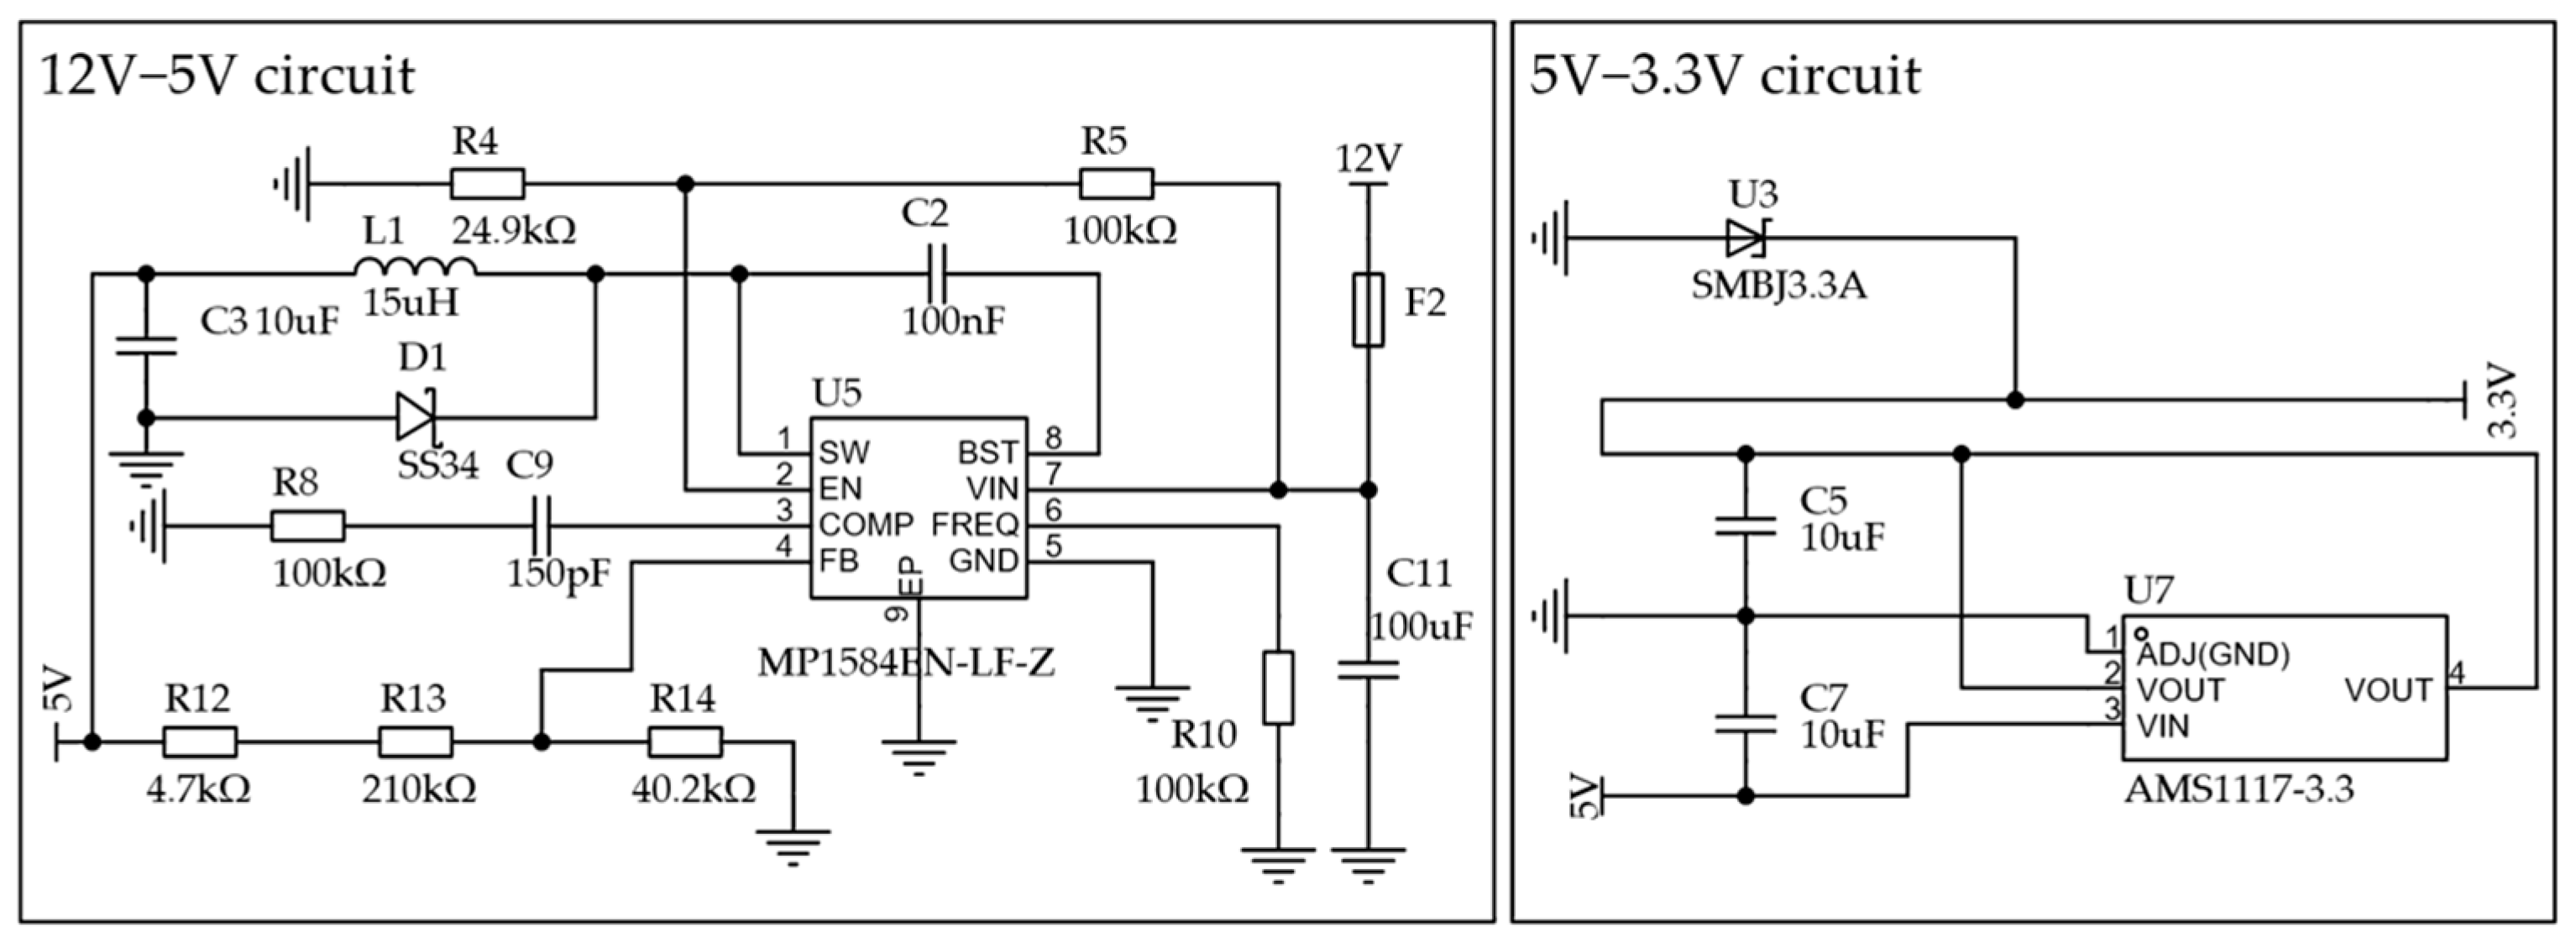
  • Position B: This section incorporates an MP1584 circuit and a 5 V USB output, which provide power to the main controller, the NanoPi M4B.
  • Position C: This section integrates an additional MP1584 step-down circuit, which supplies power to the remaining components of the development board.
  • Position D: This section comprises an AMS1117 voltage regulator circuit, which provides a dedicated and stable power supply to the ESP32 module.
  • Position E: This section includes an additional 3.3 V step-down circuit, which supplies power to the remaining modules on the development board.
  • Position F: This section comprises a fault-indicator circuit that uses LED status to monitor and display the operational state of the 12 V, 5 V, and 3.3 V power rails.
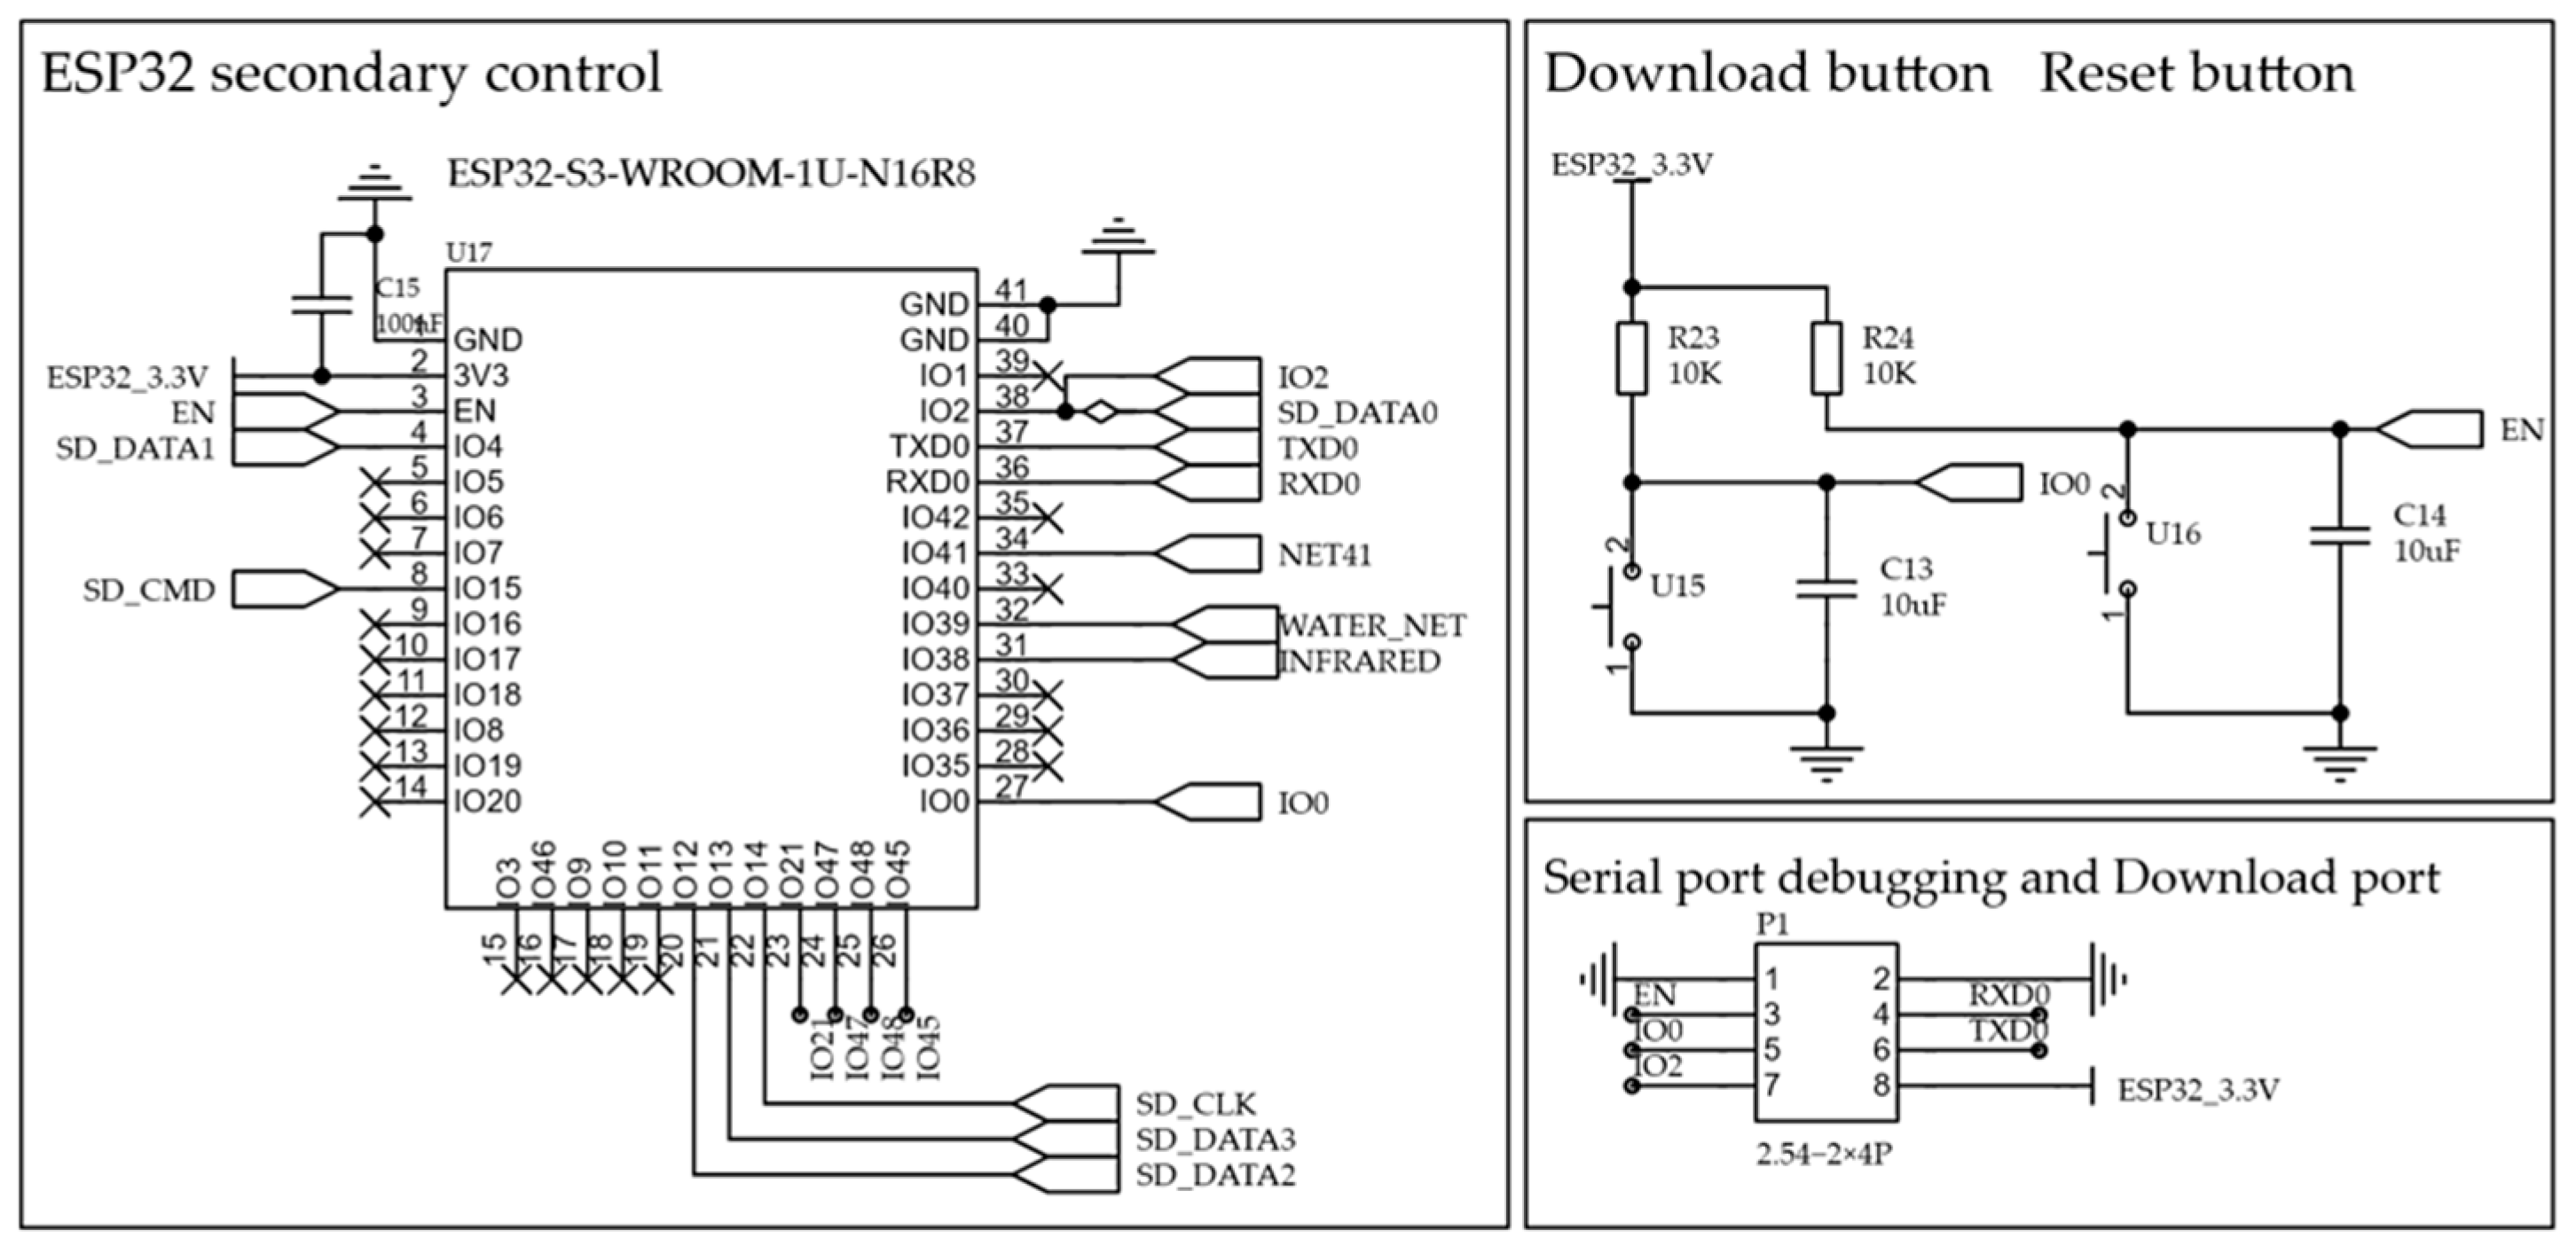
  • Position G: This section houses the secondary control circuit, which also integrates the auto-download, reset, and serial communication functionalities.
  • Position H: This section provides interfaces for external sensors (e.g., water level sensor, optical fiber sensor) and includes reserved 5 V and 3.3 V power outputs.
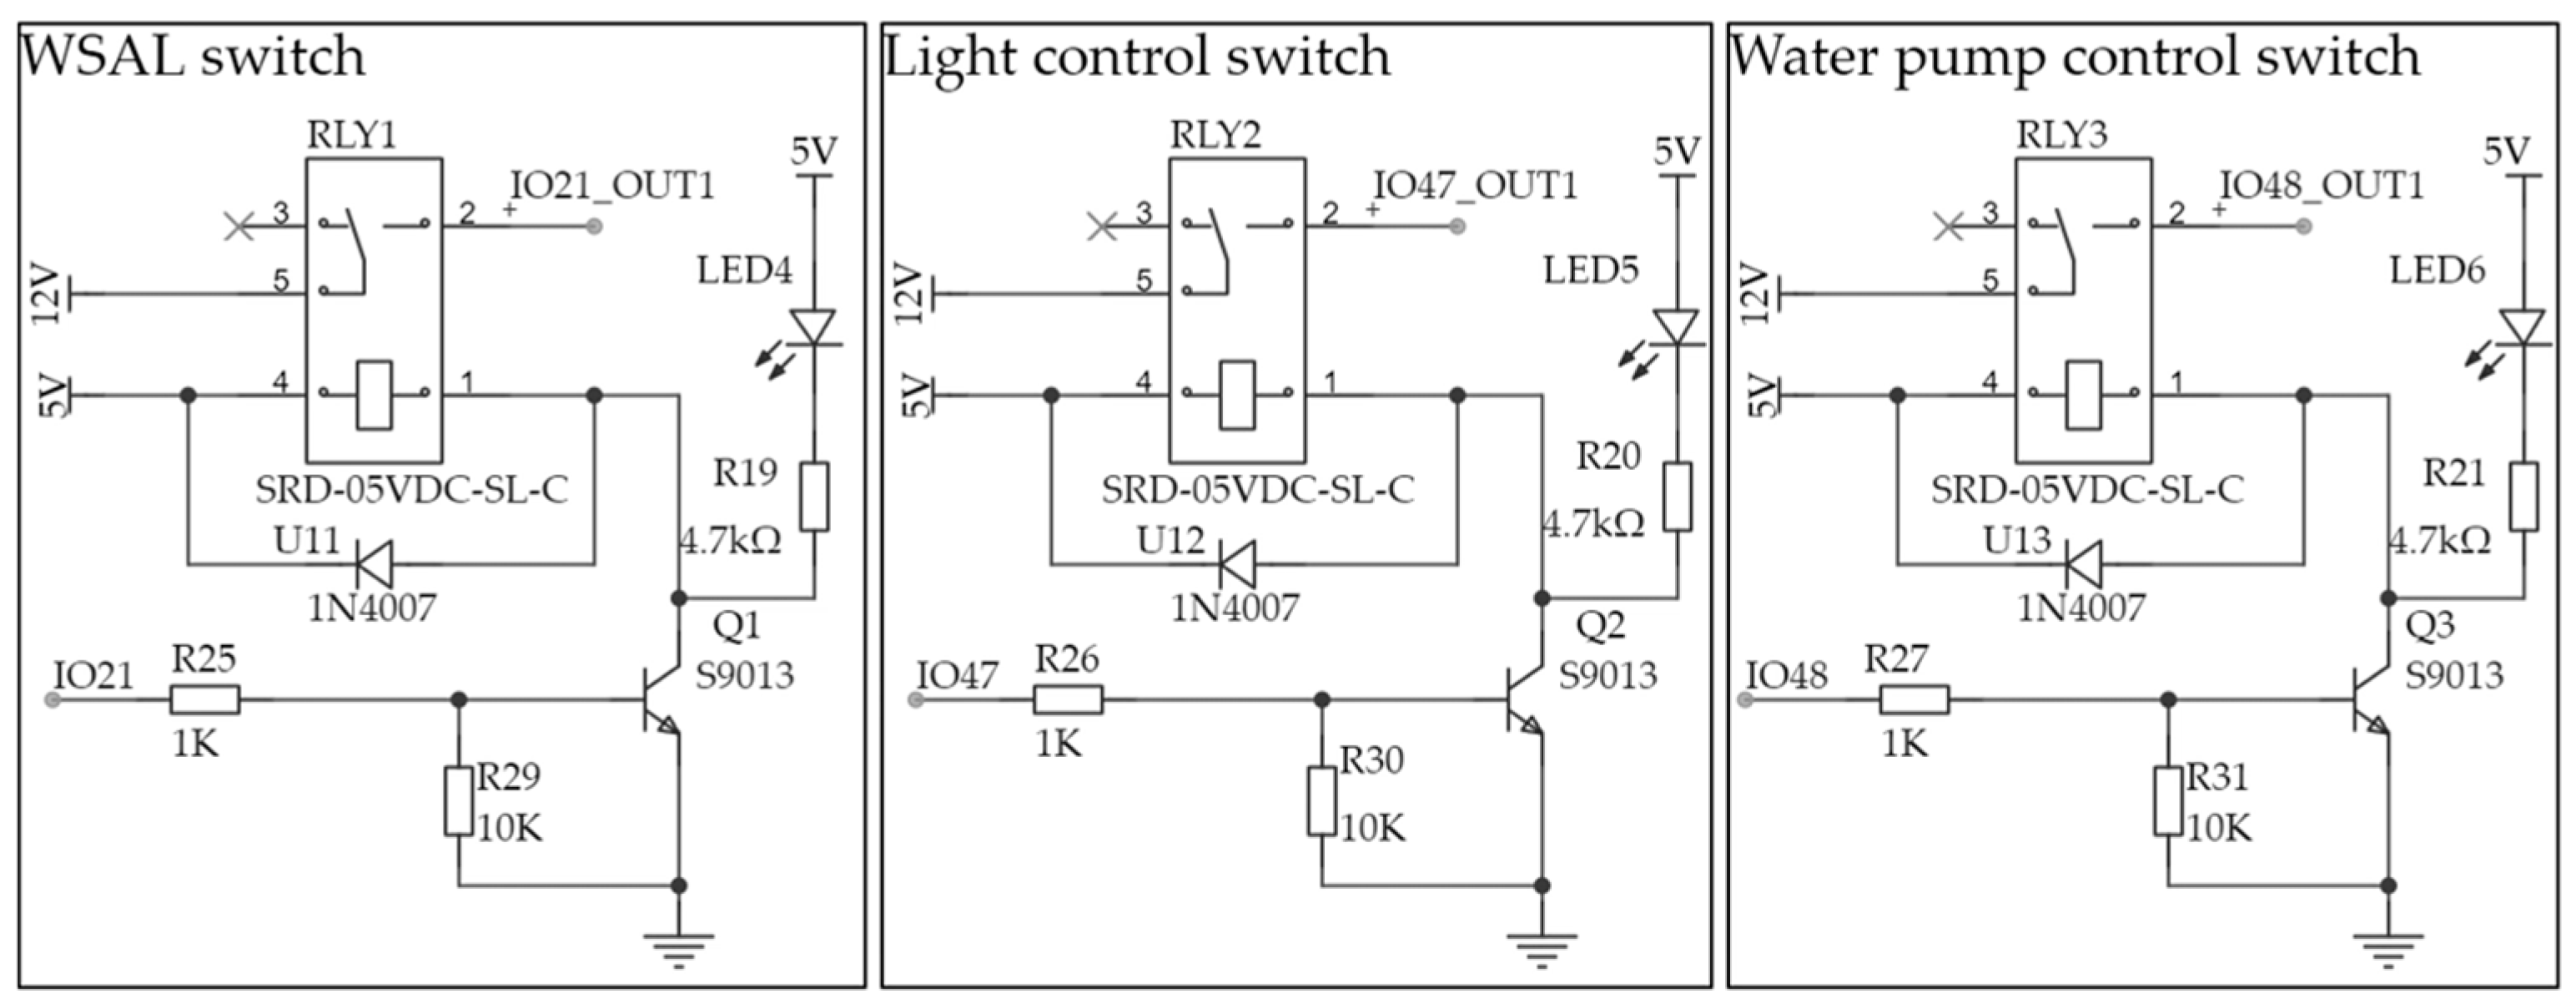
  • Position I: This section consists of the high-power module control output circuit, managing the suction insect lamp, water pump, and lighting via a separate external 12 V input and a transistor-relay control structure for effective isolation and enhanced system stability.
Figure 8. Photograph of the secondary control circuit board.
Electronics 15 00714 g008
This section presents the auxiliary control circuit board, and the following section describes the design of the functional circuits for each part.

4.3. Schematic Diagram for Secondary Control Implementation

Figure 9 shows the schematic of the ESP32-S3 secondary control scheme. The system uses a dual-core ESP32-S3 microcontroller, which provides sufficient performance and robust anti-interference capability under typical field conditions. It communicates with the primary controller via a serial interface and directly drives the peripheral modules. The design also includes circuitry for automatic program download and manual reset, with a push button for reinitialization.

4.4. Schematic Design of Power Supply Circuit

Figure 10 shows the schematic of the module power-supply circuitry. The system adopts two independent conversion stages from the 12 V supply.
A buck-converter stage (based on the MP1584) generates two 5 V rails: one dedicated to the primary controller to isolate it from other 5 V loads, and another for the remaining 5 V devices with independent switch control.
A linear-regulator stage (based on the AMS1117) then converts 5 V to 3.3 V along two branches: one dedicated to the secondary controller to reduce interference from other 3.3 V peripherals, and one shared by the remaining 3.3 V modules.

4.5. Control Schematic Design of High Power Module

Figure 11 shows the schematic of the high-current load driver, which controls high-power loads such as the WSAL, water pump, and auxiliary lighting. The circuit uses a transistor-driven relay to provide signal amplification and electrical isolation between the control logic and the 12 V power line. A flyback diode is connected across the relay coil, and a simple indicator circuit at the transistor collector is used to display the on/off state of each load, which facilitates debugging and real-time monitoring.

4.6. Schematic Design of Automatic Downloading Circuit Based on CH340

Figure 12 shows the schematic of the automatic program download and debug interface. The CH340C chip is used as the USB-to-serial bridge, providing a standard USB connection for firmware download and serial debugging of the controller. This interface supports reliable data communication between the device and a host computer during development and maintenance.

5. Software Design

5.1. Time-Scheduled Control Strategy

The software control logic of the system follows a time-scheduled, event-driven strategy that coordinates the WSAL, water-flow circulation, and imaging subsystem.
The device operates on a daily monitoring schedule. When the preset time window for nocturnal insect activity is reached (19:00–05:00 local time), the ESP32-based secondary controller switches the Wind-Suction Attraction Lamp (WSAL) to the ON state and keeps both the attraction light and the suction fan continuously active. At the same time, the low-power circulation pump is turned on and maintained in continuous operation, forming a stable, shallow sheet of water above the imaging window.
Neither the operating point of the water-flow velocity nor the illumination configuration is adjusted dynamically during individual capture events. Instead, both are fixed to experimentally determined settings that balance imaging quality and insect safety. As described in Supplementary Material S3, bench-top pre-experiments were conducted to test different water-flow velocities and different types and installation positions of the light strip. The final configuration was selected to provide:
  • Shallow-flow transport that moves insects across the field of view within a short time while avoiding prolonged submergence.
  • Low-glare, spatially uniform lighting on the matte white background, yielding stronger insect–background contrast.
Outside the monitoring window (05:00–19:00), the ESP32 turns off the WSAL, the suction fan, and the circulation pump to reduce energy consumption, while the NanoPi M4B remains in a low-duty state for timekeeping, health monitoring, and scheduled data upload. During the night-time monitoring period, the WSAL and water pump remain continuously on, and only the camera and high-level processing are activated transiently in response to insect-trigger events. This coordinated strategy keeps the hydraulic and optical conditions in the WF-DTS stable for imaging, while power-hungry components such as the camera are used in a duty-cycled, event-driven manner.

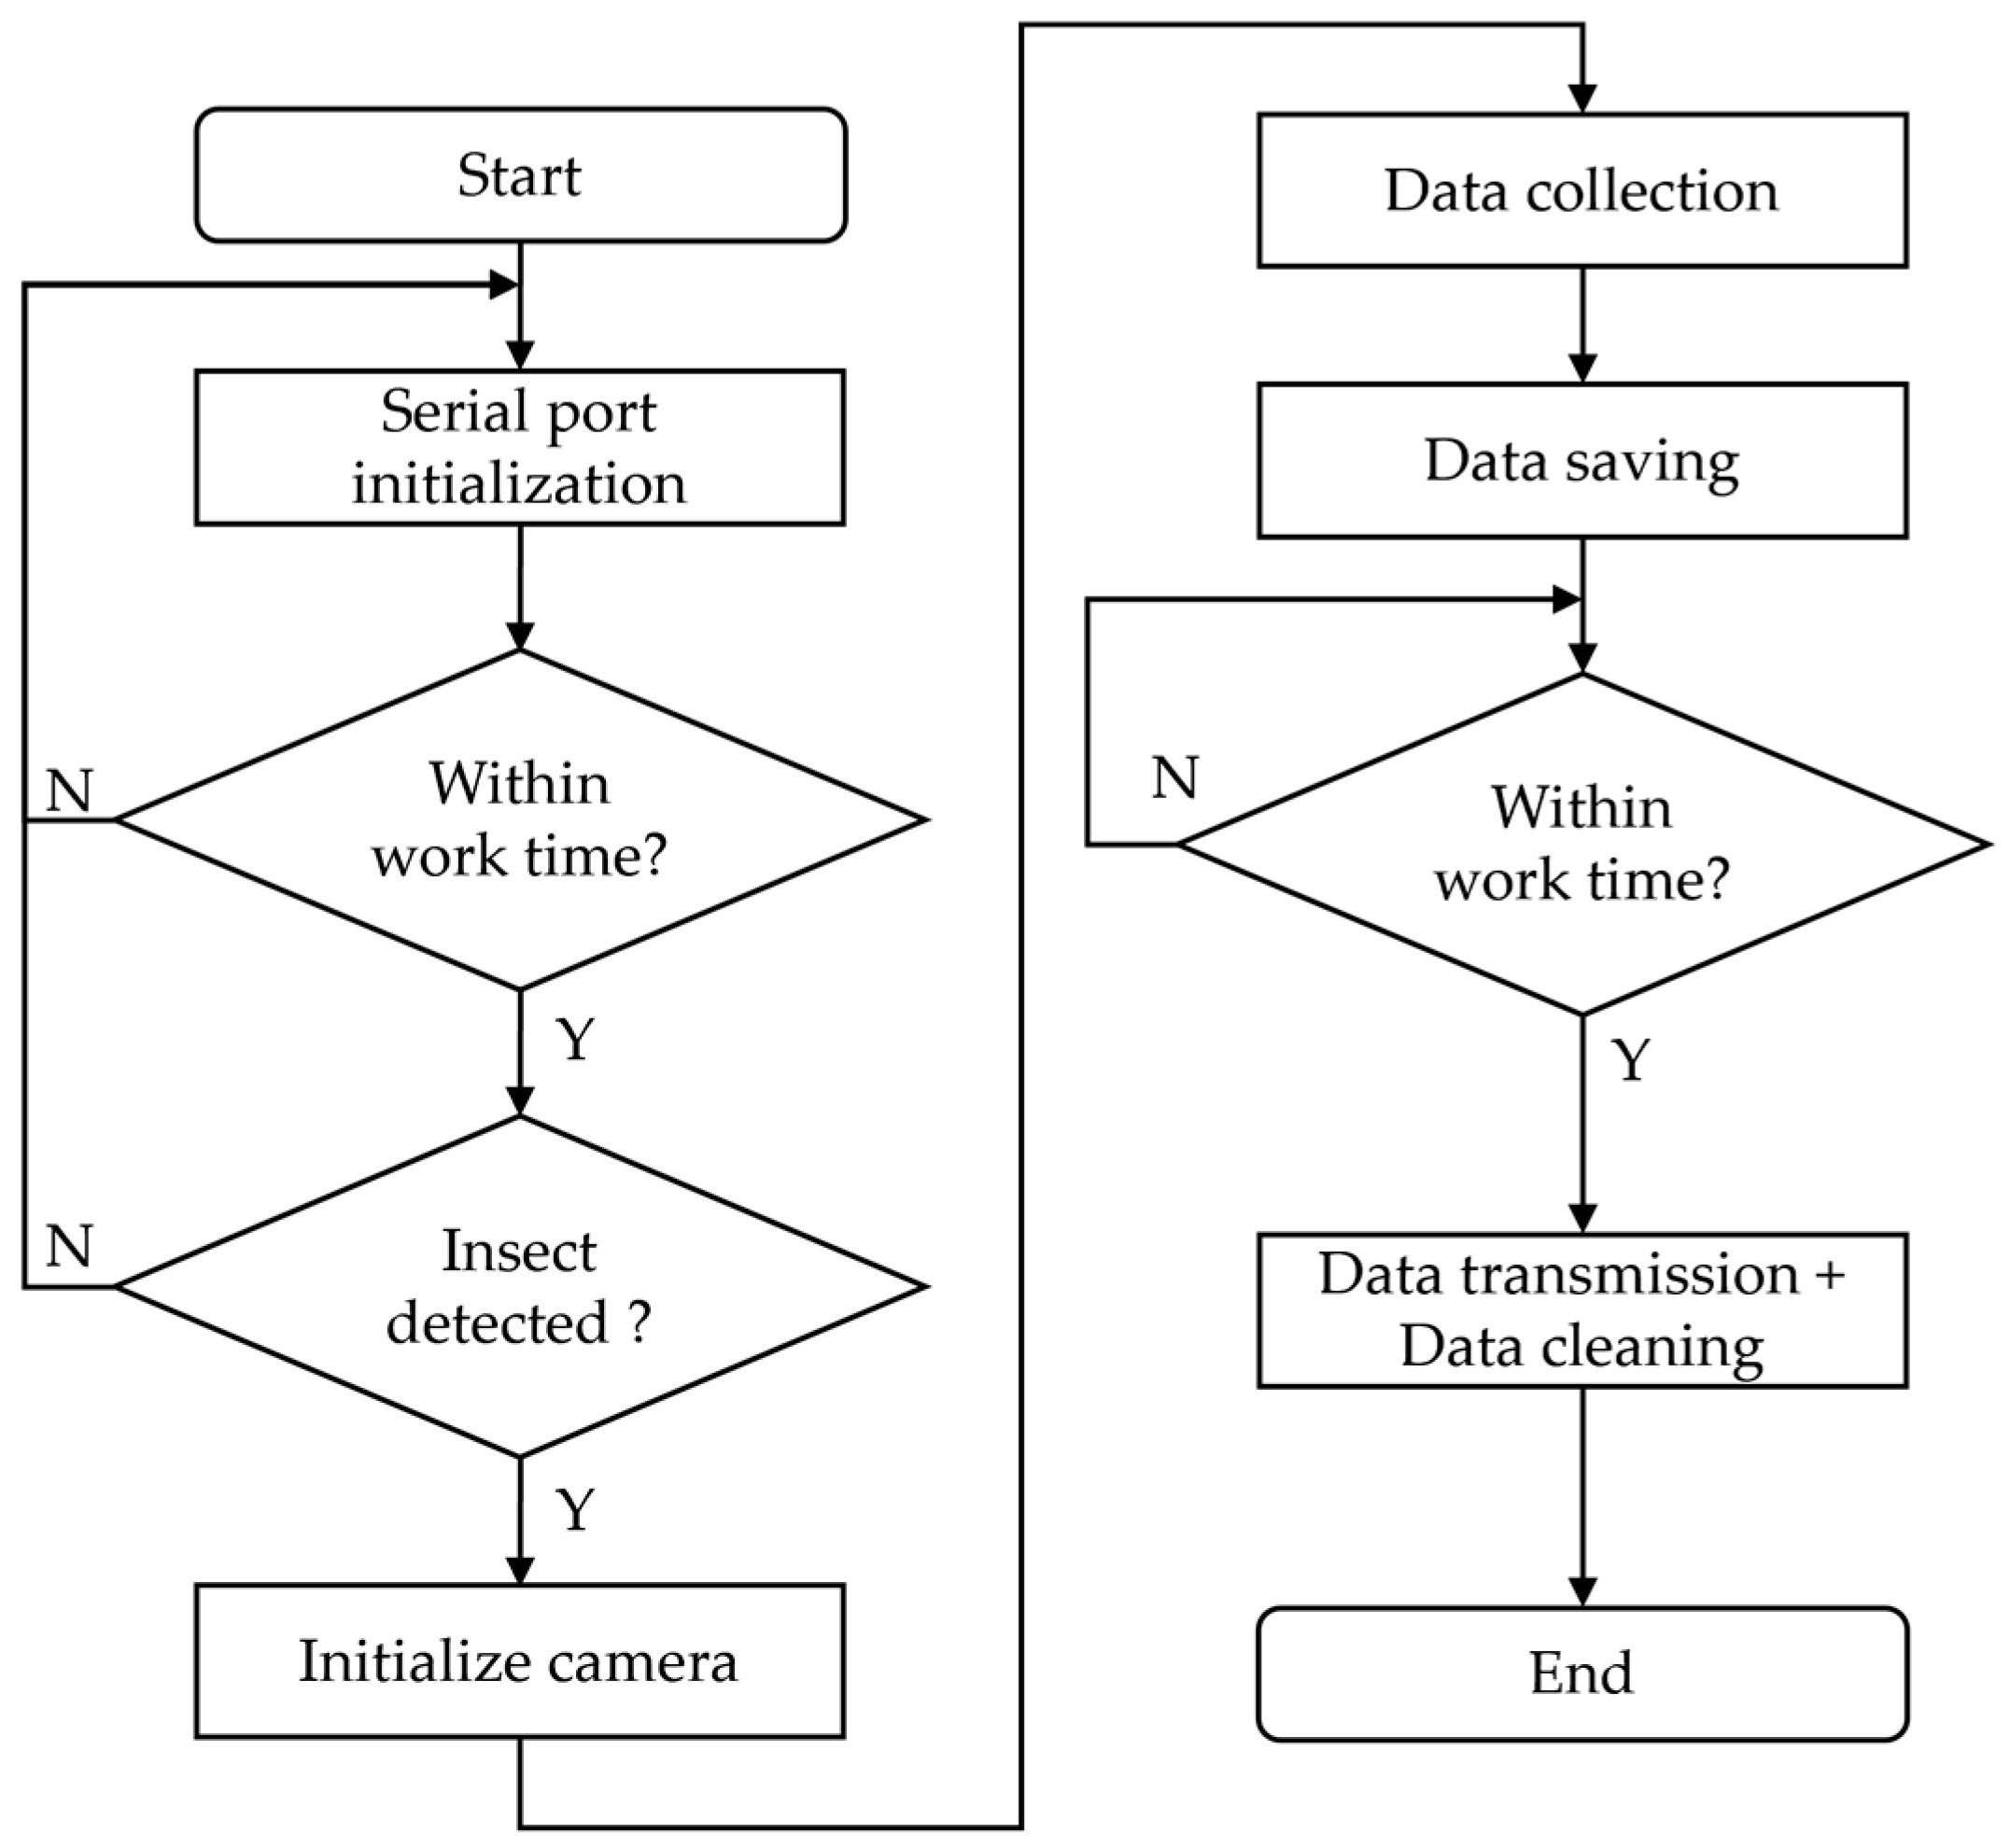
5.2. Image Acquisition and Data-Transmission Workflow

Figure 13 illustrates the data-acquisition workflow of the system.
First, the device initializes the communication interfaces and checks the operating time window:
  • Initialize communication interfaces. The system configures all required serial ports for sensors and actuators, including baud rate, parity, and data-frame format.
  • Check operating time window. The system enters a periodic checking loop, polling the current time once per minute. If the time is outside the predefined monitoring window (19:00–05:00), it remains in standby. The subsequent steps are executed only when the current time falls within this window.
  • Detect insect capture via fiber-optic sensor. During the monitoring window, the system continuously listens to the fiber-optic sensor at the capture channel. When an insect is detected, the sensor generates a hardware interrupt.
  • Trigger camera via interrupt-driven command. In response to the interrupt, the secondary controller immediately sends an activation command through the serial port to the camera module, ensuring minimal latency between the capture event and the start of image acquisition.
Once a capture event is triggered, the system acquires, transmits, and manages image data according to the following steps:
  • Activate camera and capture images. After receiving the activation command, the camera enters the working state and begins continuous image capture, recording high-fidelity image sequences of the trapped insect.
  • Buffer and transmit image data. The acquired images are first stored in a local temporary buffer. At predefined intervals, the buffered data are packaged and uploaded via the 4G router to a remote server for long-term storage and analysis.
  • Automatically clean temporary cache. To prevent storage exhaustion and ensure sustained operation, the system periodically deletes obsolete temporary data from the local buffer when predefined time or capacity thresholds are reached.
Building on the completed design of the software system for data acquisition, transmission, and recognition, we now turn to empirical validation. Field experiments were conducted to evaluate the practical performance of the proposed device, focusing on two critical aspects: the quality and usability of the acquired image data and the post-capture survival rate of insects.

6. Data Collection and Verification

6.1. Experimental Environment

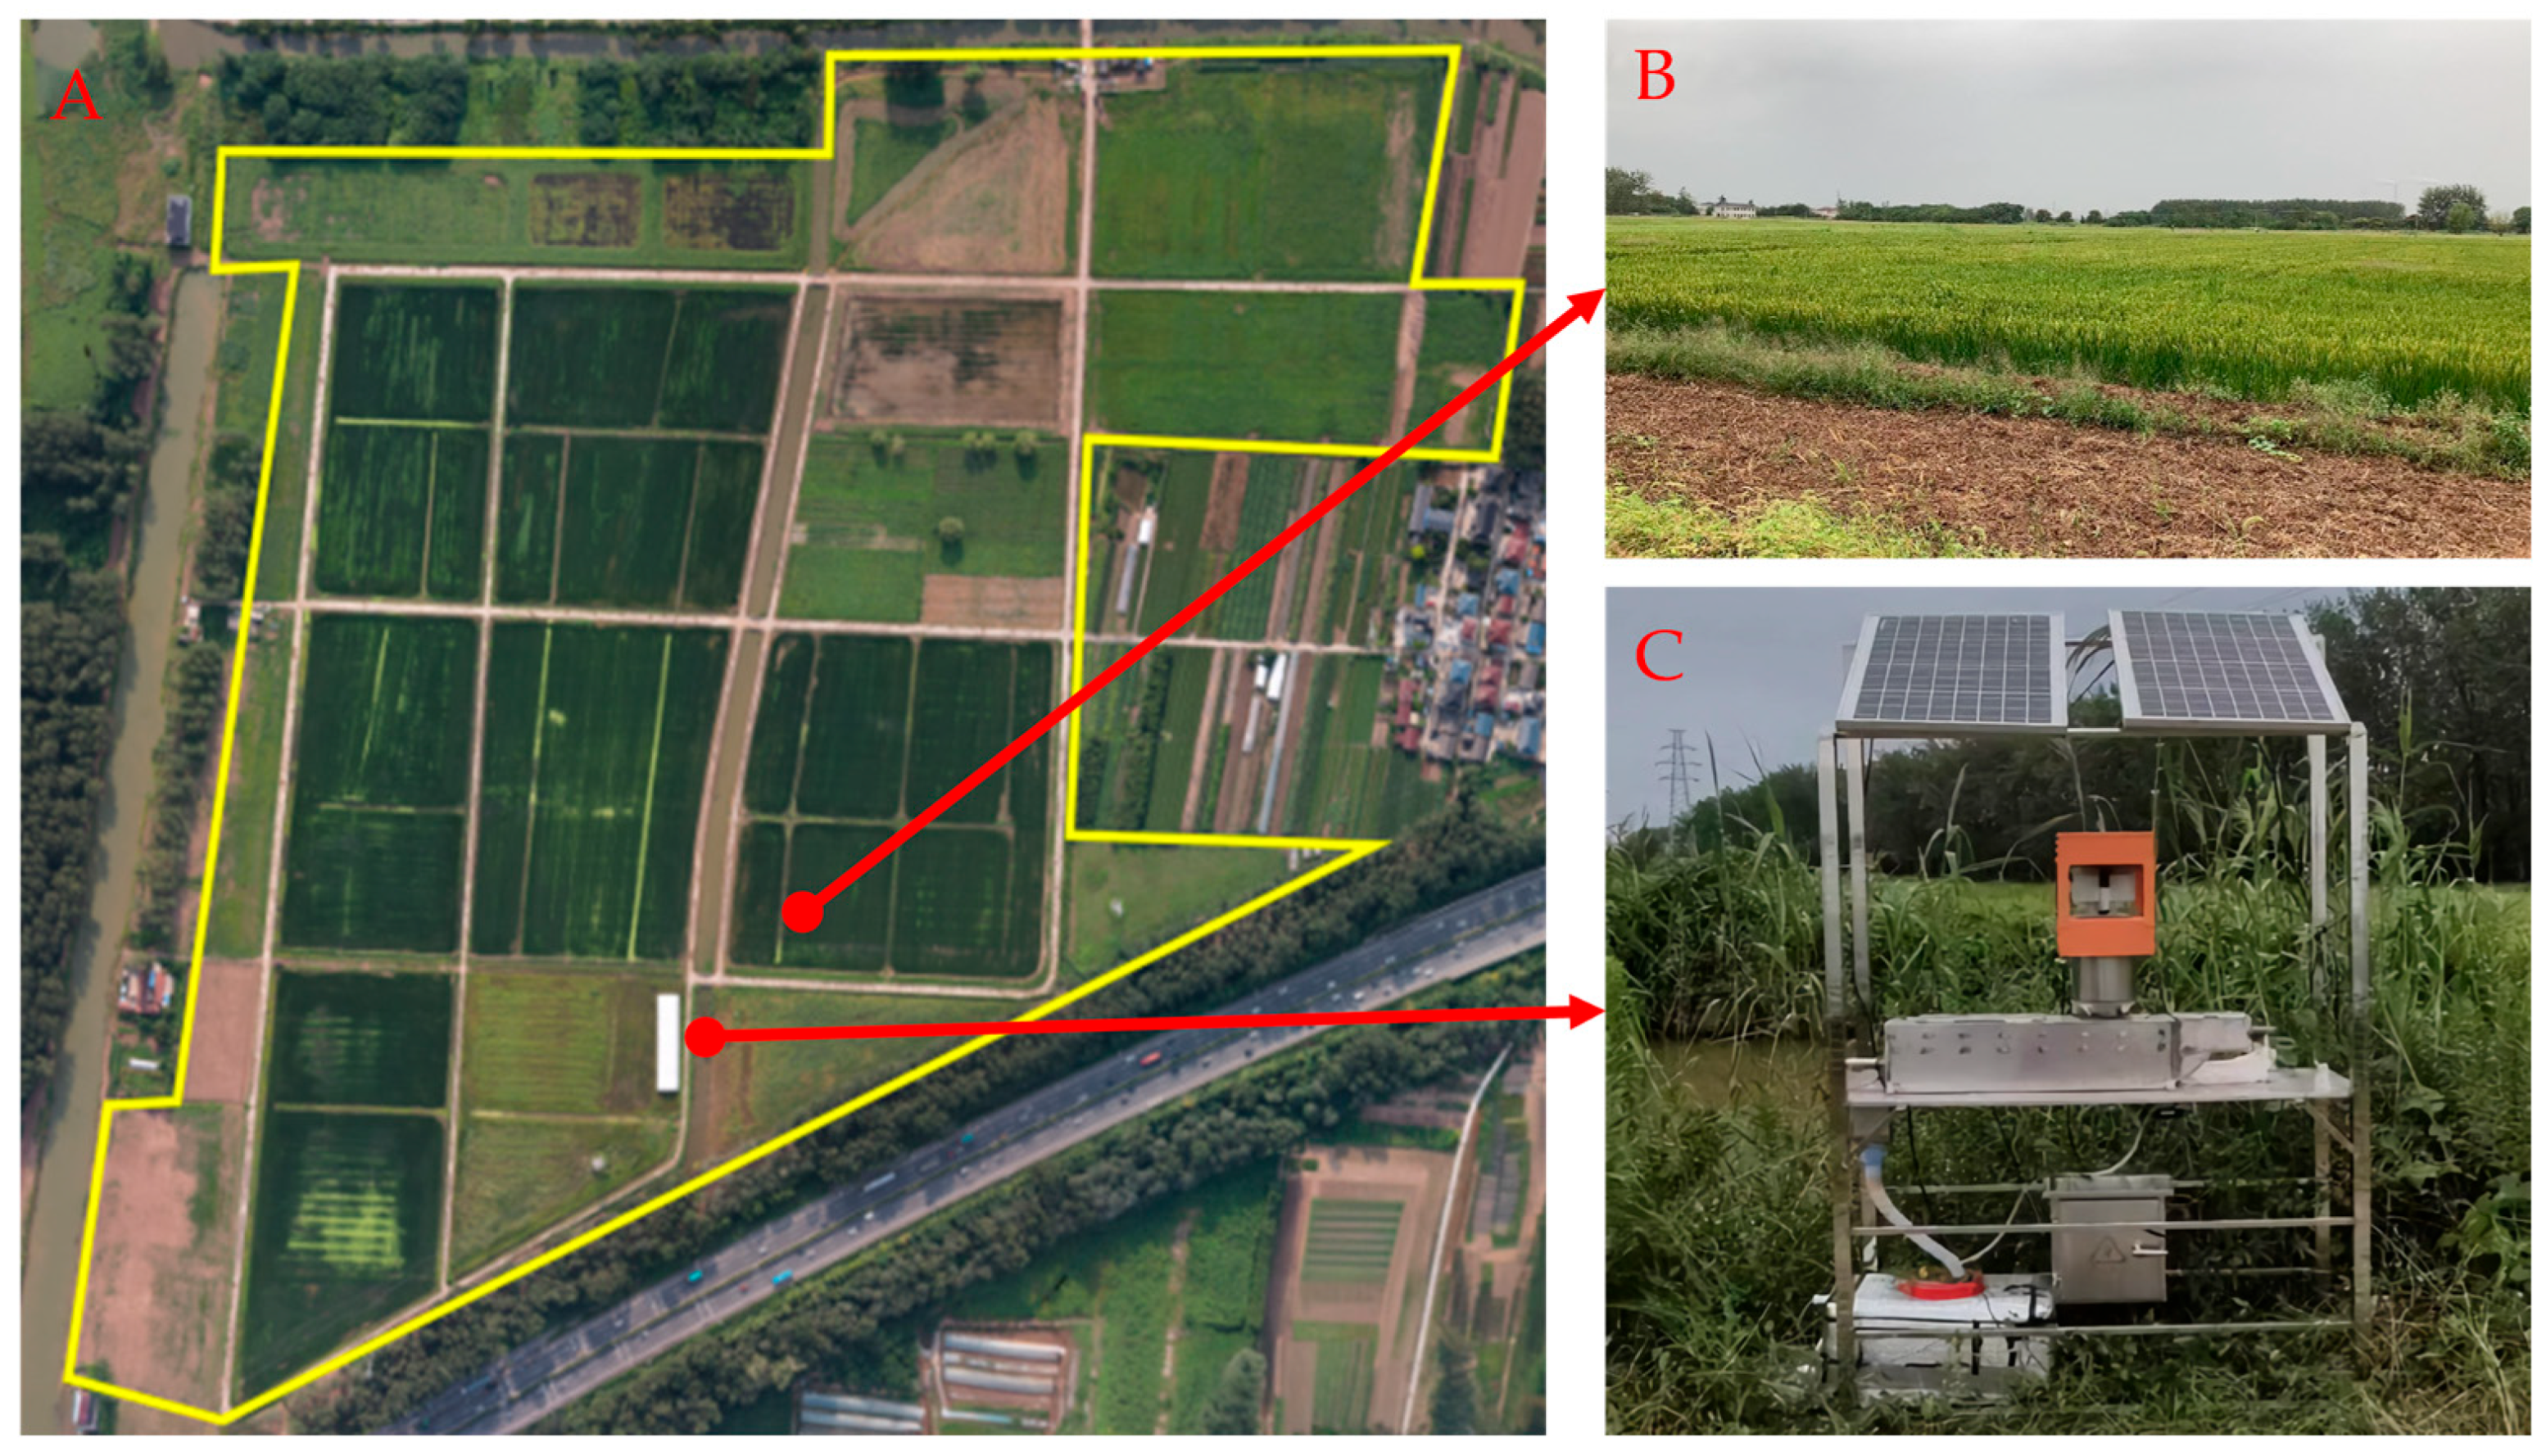
Figure 14 illustrates the field deployment of the system in the agricultural environment of Bagua Island (Baguzhou), Qixia District, Nanjing. Bagua Island is a river island in the Yangtze River, and during the experimental data-collection period the primary crop cultivated at the test site was rice.
In terms of practical operation, power measurements conducted under typical field conditions in March 2025 using a dedicated measurement board (see Supplementary Material S2) showed that the complete WF-DTS prototype can operate continuously for approximately 2.5 days without solar supplementation. During the deployment reported in this study, the device completed several consecutive nights of monitoring without major functional failures. The system uses a 90 L water tank as a closed-loop reservoir, with a filter sponge installed at the water inlet to remove debris; replacing this sponge every 2–3 days was sufficient to prevent clogging and to maintain stable water flow throughout the experiments.

6.2. Construction of the Dataset

6.2.1. Overview of Data Collection

The monitoring device was deployed in the field from 23 June 2025 to 30 September 2025, capturing a total of 11,107 images encompassing 23 insect species. The device operated with a fixed sampling interval of one image per second. It should also be noted that the effective data-collection scope was constrained by the presence of other commercial insecticidal lamps in the vicinity, which likely competed for insect attraction. In addition, the current prototype exhibits limitations in detecting very small target insects. This deficiency may be attributable to the suction capacity of the airflow system and/or the sensitivity threshold of the optical trigger mechanism.
In the same experimental area, other monitoring devices belonging to parallel projects, such as sticky traps, were deployed concurrently. These co-located devices captured very small insects such as midges and thrips with body lengths of approximately 1 mm, whereas such taxa were essentially absent from the WF-DTS image dataset. Representative field photographs illustrating small-bodied insects on sticky traps from the same field are provided in Supplementary Material S1 for qualitative illustration. This discrepancy indicates that the current WF-DTS prototype under-samples extremely small insects, likely because such individuals are either inefficiently attracted and lifted by the WSAL airflow or fail to trigger the optical sensor at the present sensitivity threshold. Consequently, in its current form the system is primarily effective for monitoring medium- and larger-bodied insects, and the under-capture of very small insects is explicitly recognized as a limitation.

6.2.2. Composition and Presentation of Dataset

This section visually presents and explains the dataset constructed in this study from two perspectives: the structure of the image data and the file naming conventions. The format of the raw monitoring images and the standardized naming rules together provide a uniform input format for subsequent data processing and a traceable index for model training.
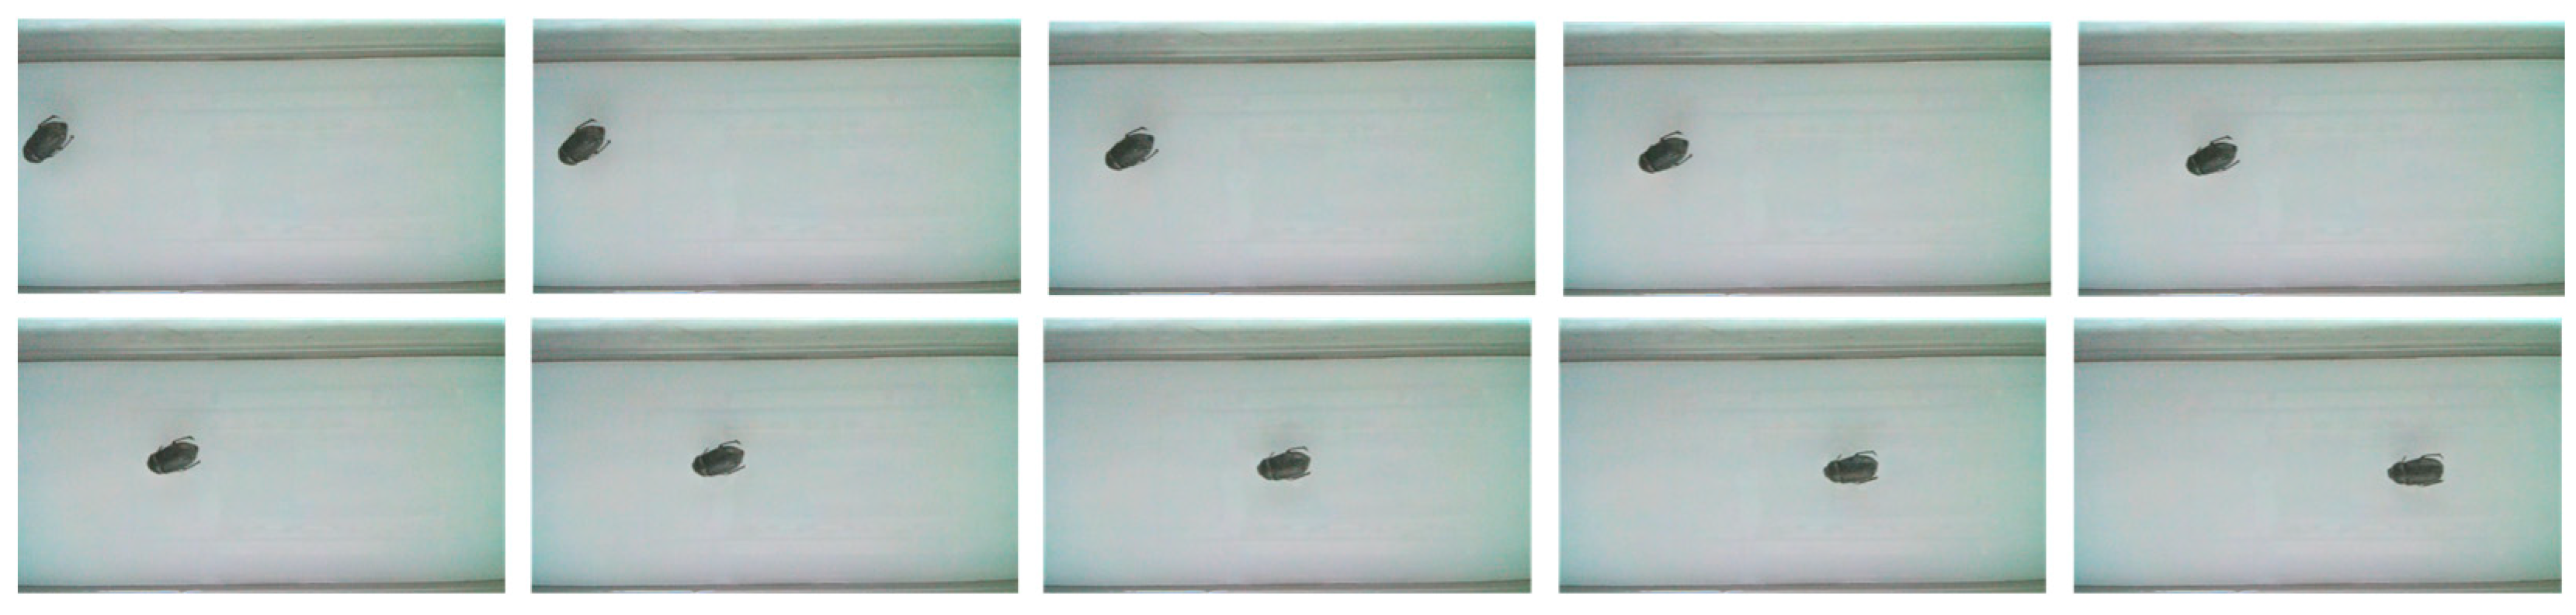
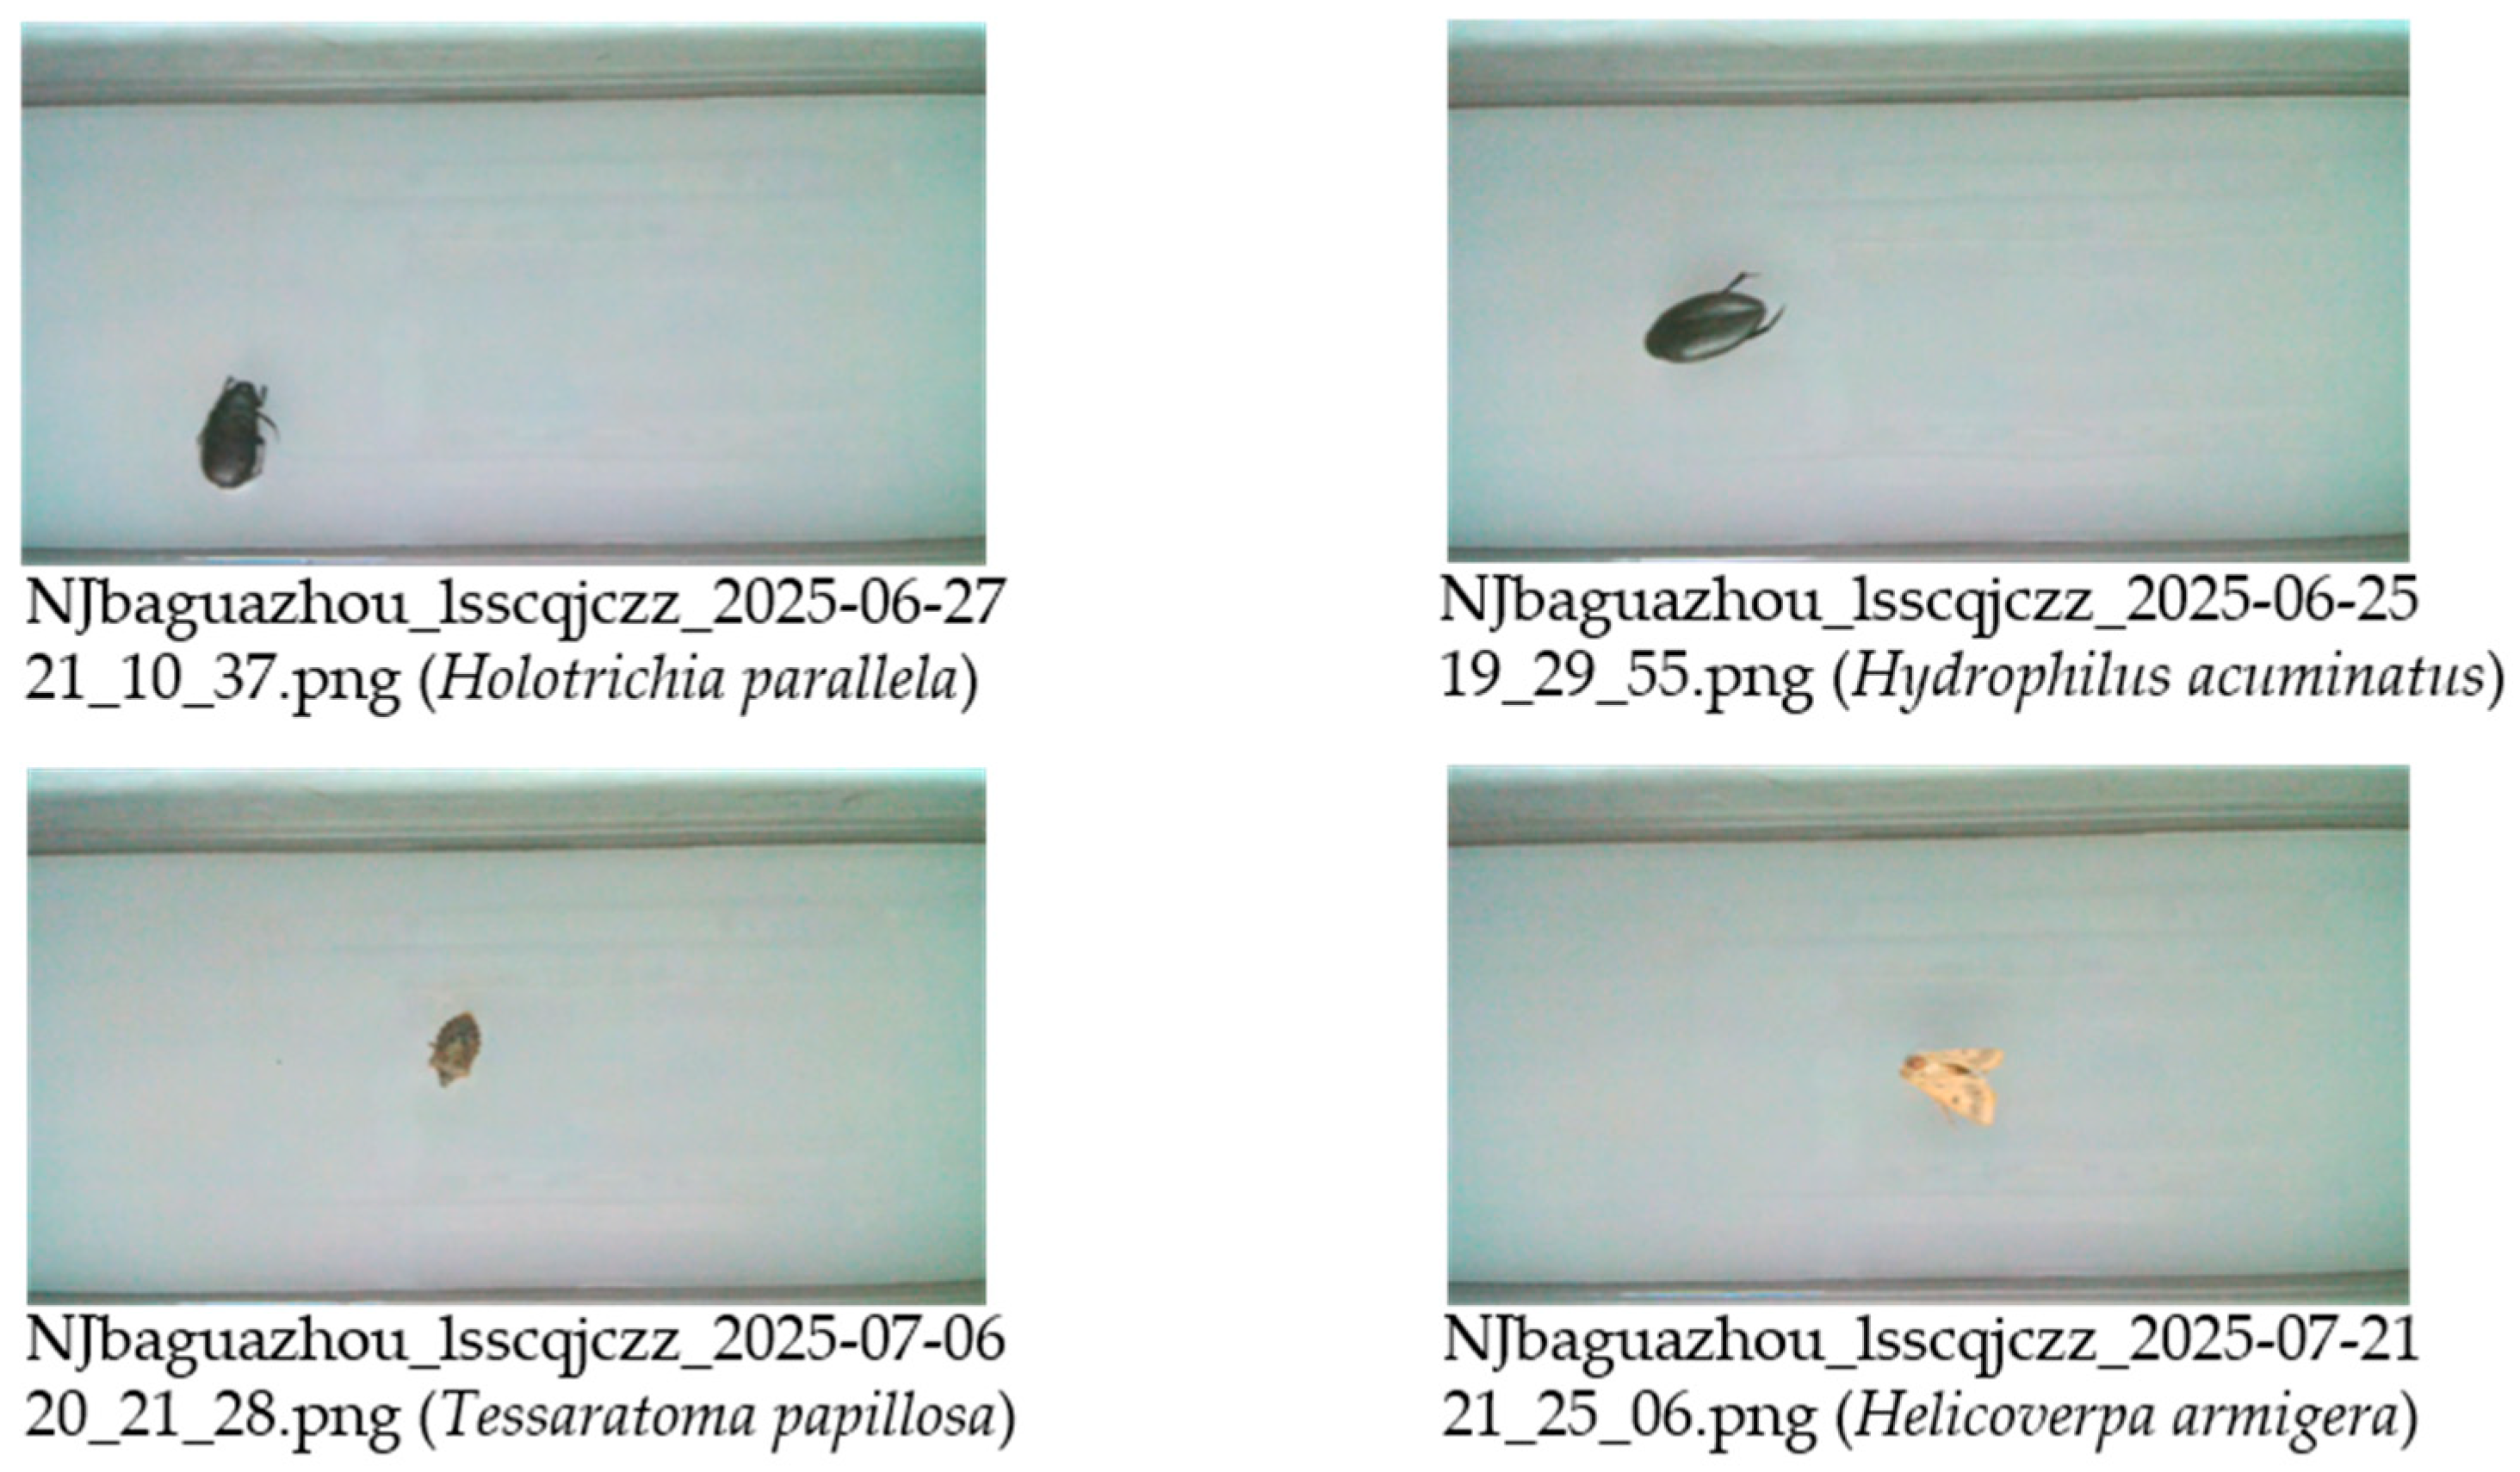
Figure 15 shows a complete sequence of images captured continuously after an insect enters the device. Figure 16 illustrates the naming convention for the collected images, in which each image set is labeled by location and date.
Table 4 provides an overview of the dataset, including a representative image, Latin scientific name, and the number of images for each species. To better highlight morphological features, the images shown in the table are cropped versions of the original frames.
In contrast to data from conventional devices, which are often marred by specimen adhesion and occlusion, the proposed system captures images at the level of isolated individuals, substantially reducing problems caused by stacking of insect bodies.

6.3. Availability Verification of Insect Image Based on YOLOv8s

Following the construction and characterization of the dataset, we conducted a comprehensive performance evaluation of the trained model to validate the effectiveness of the proposed approach. The evaluation results are presented below using quantitative metrics and visual analyses.
To assess the utility of the collected image data, we validated it using the YOLOv8s object detection model. Deep-learning-based pest detection frameworks such as Pest-YOLO have demonstrated the effectiveness of convolutional detectors for pest targets in complex field scenes [28]. In this study, we focus on showing that the images produced by the proposed WF-DTS are inherently well suited for such off-the-shelf detectors. As reported in [26], images acquired from conventional light traps exhibit a 46.5% rate of overlapping or stacked insects. In contrast, in the dataset collected by the proposed system for YOLOv8s evaluation, no such overlapping was observed, owing to the water-flow dispersion design that separates individual insects prior to imaging. For this purpose, a balanced subset was constructed by selecting eight representative insect species, with 800 images per species. This dataset was then partitioned into training and validation sets at an 8:2 ratio.
The validation was performed using the standard YOLOv8s model, where the images produced by the proposed system were fed directly into the detector using only the default resizing and normalization operations of YOLOv8s, without any additional denoising, background subtraction, ad hoc enhancement, or data-augmentation steps at the inference stage. This setting was adopted to evaluate the inherent suitability and quality of the images generated by the hardware system. The detailed configurations of the experimental environment and model parameters are provided in Table 5.
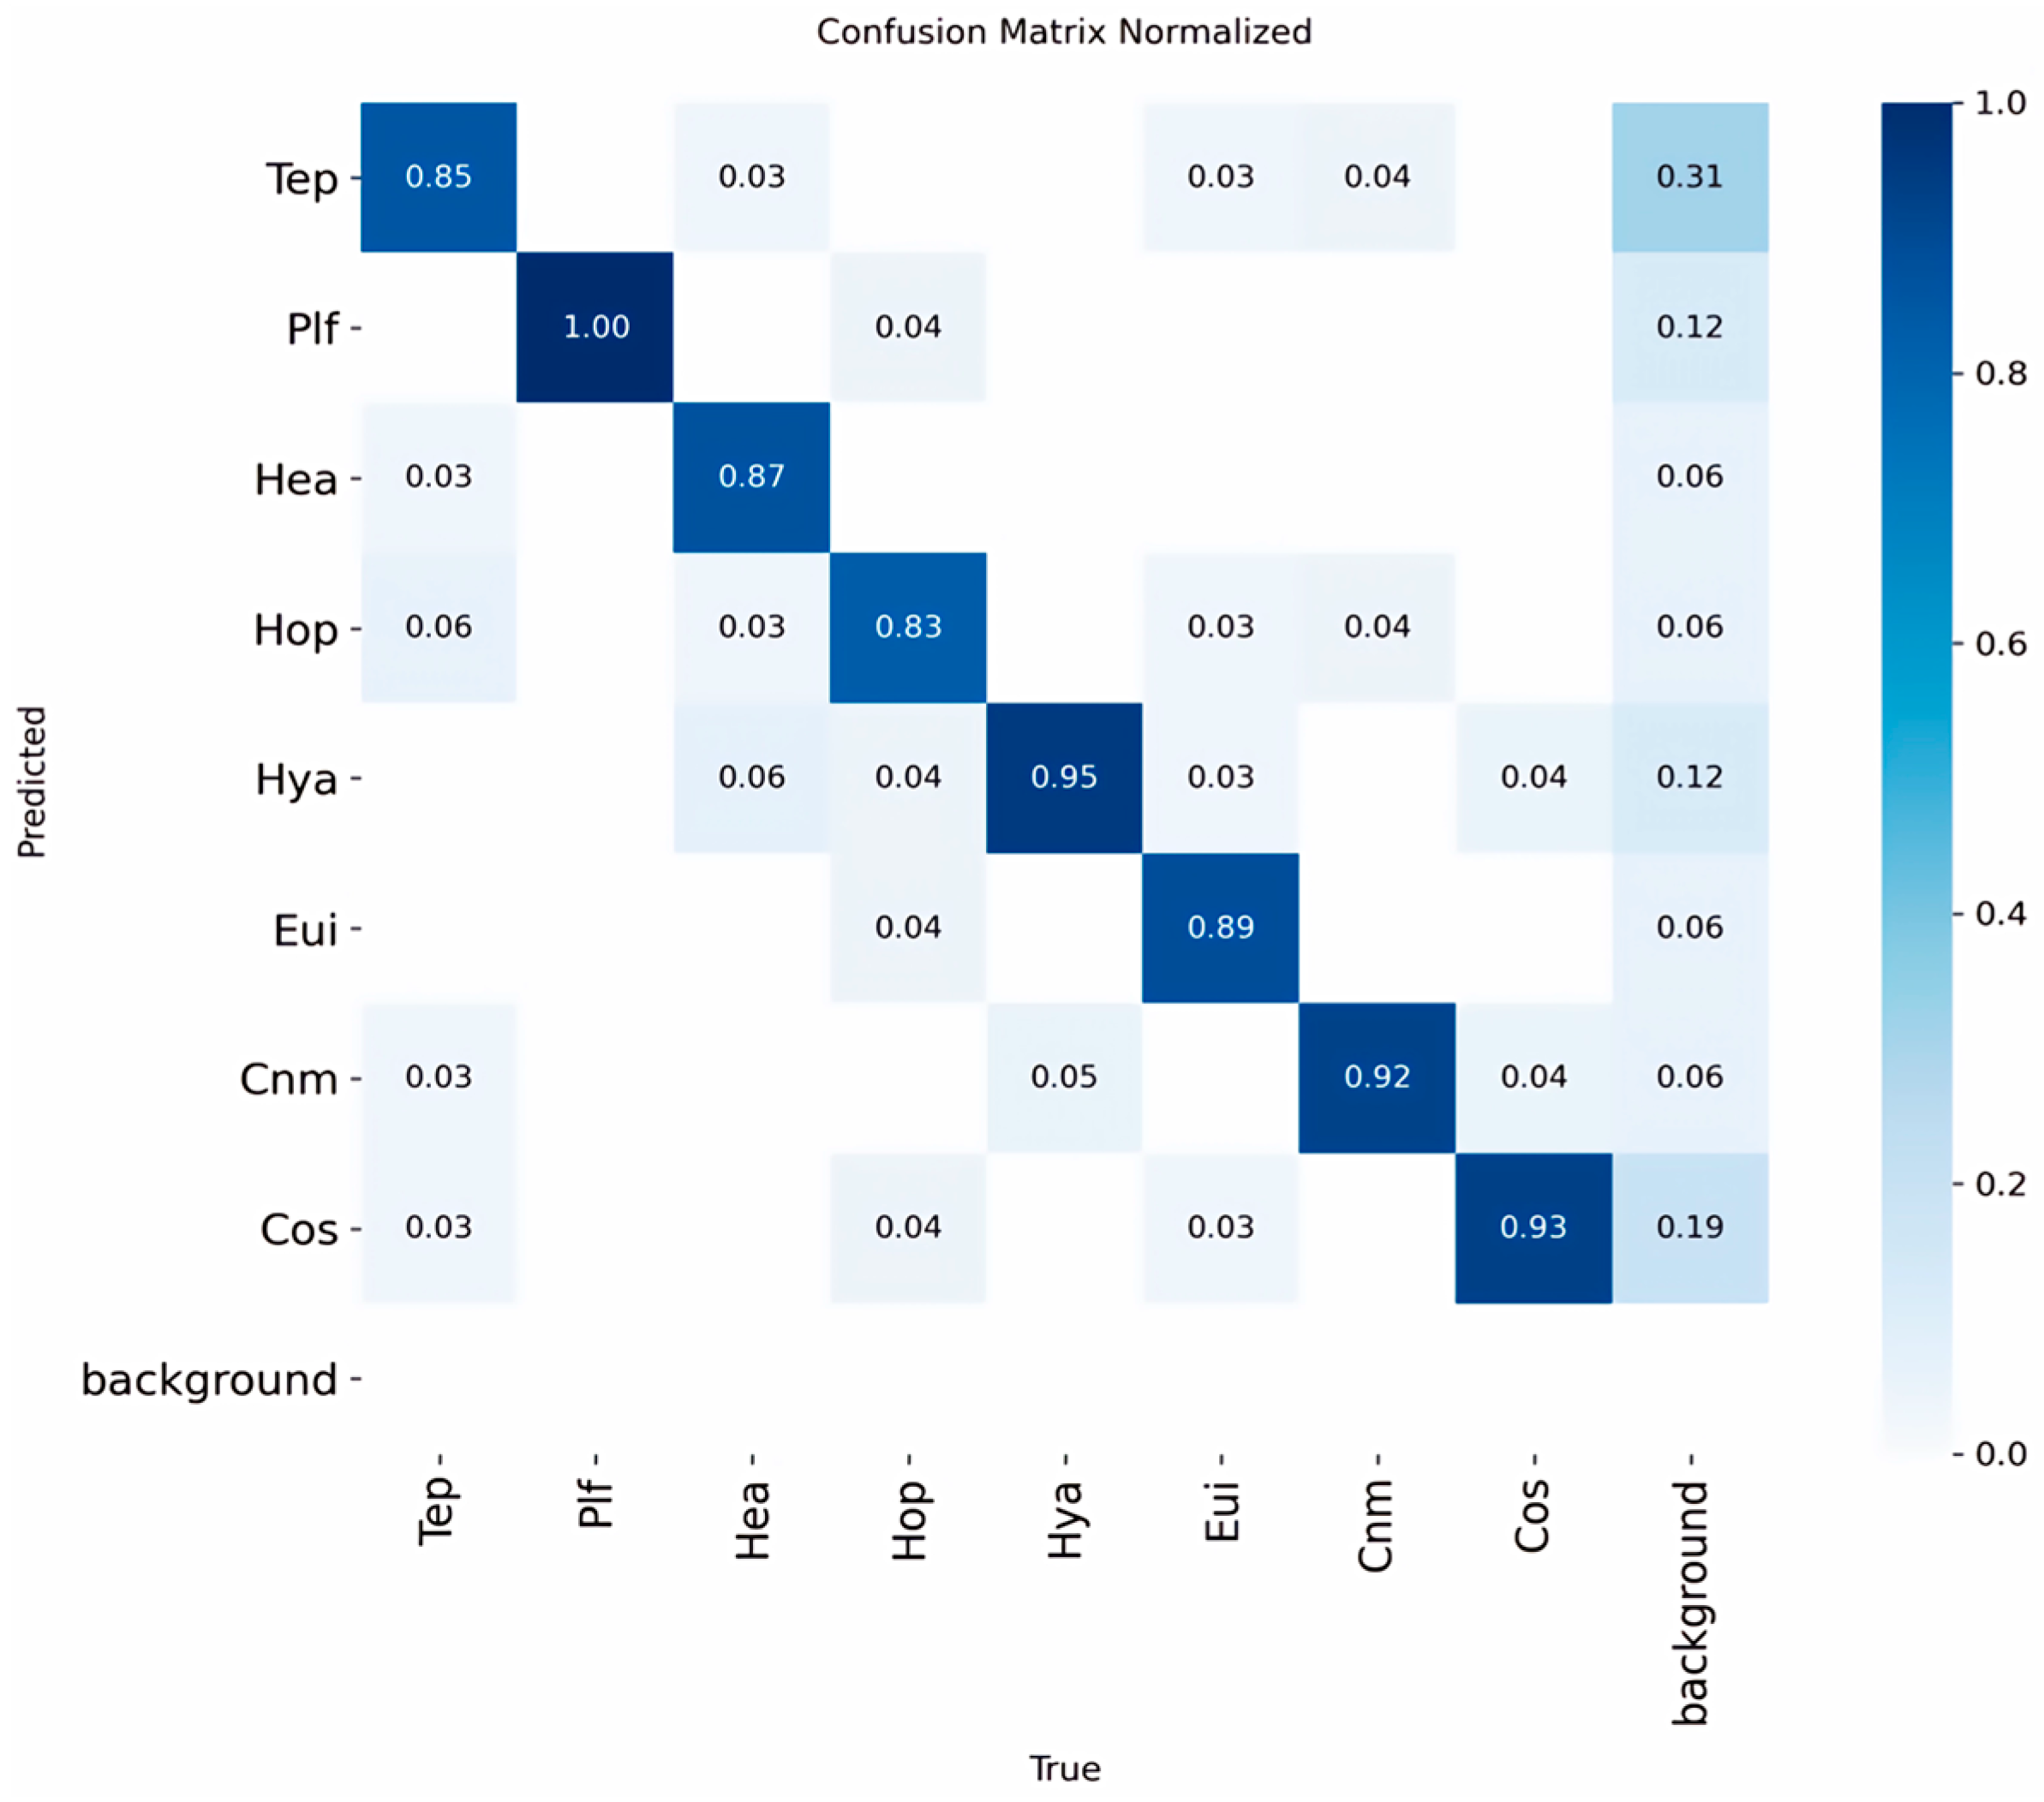
Owing to the water-flow dispersion and transport mechanism and the 1 mm thick white matte imaging panel described in Section 3.1, the images used in this experiment contain isolated single insects without visible mutual occlusion or overlapping, and the background is a clean, low-texture white surface that effectively suppresses clutter. The eight species are abbreviated as follows: Tessaratoma papillosa (Tep), Plautia fimbriata (Plf), Helicoverpa armigera (Hea), Holotrichia parallela (Hop), Hydrophilus acuminatus (Hya), Eurygaster integriceps (Eui), Cnaphalocrocis medinalis (Cnm), and Coccinella septempunctata (Cos).
Figure 17 shows that the values on the main diagonal of the confusion matrix are much higher than the off-diagonal values, indicating high predictive accuracy and good discriminative ability across all categories. In this confusion matrix, the “Background” class corresponds to frames or regions where no insect is present, i.e., the empty white imaging panel.
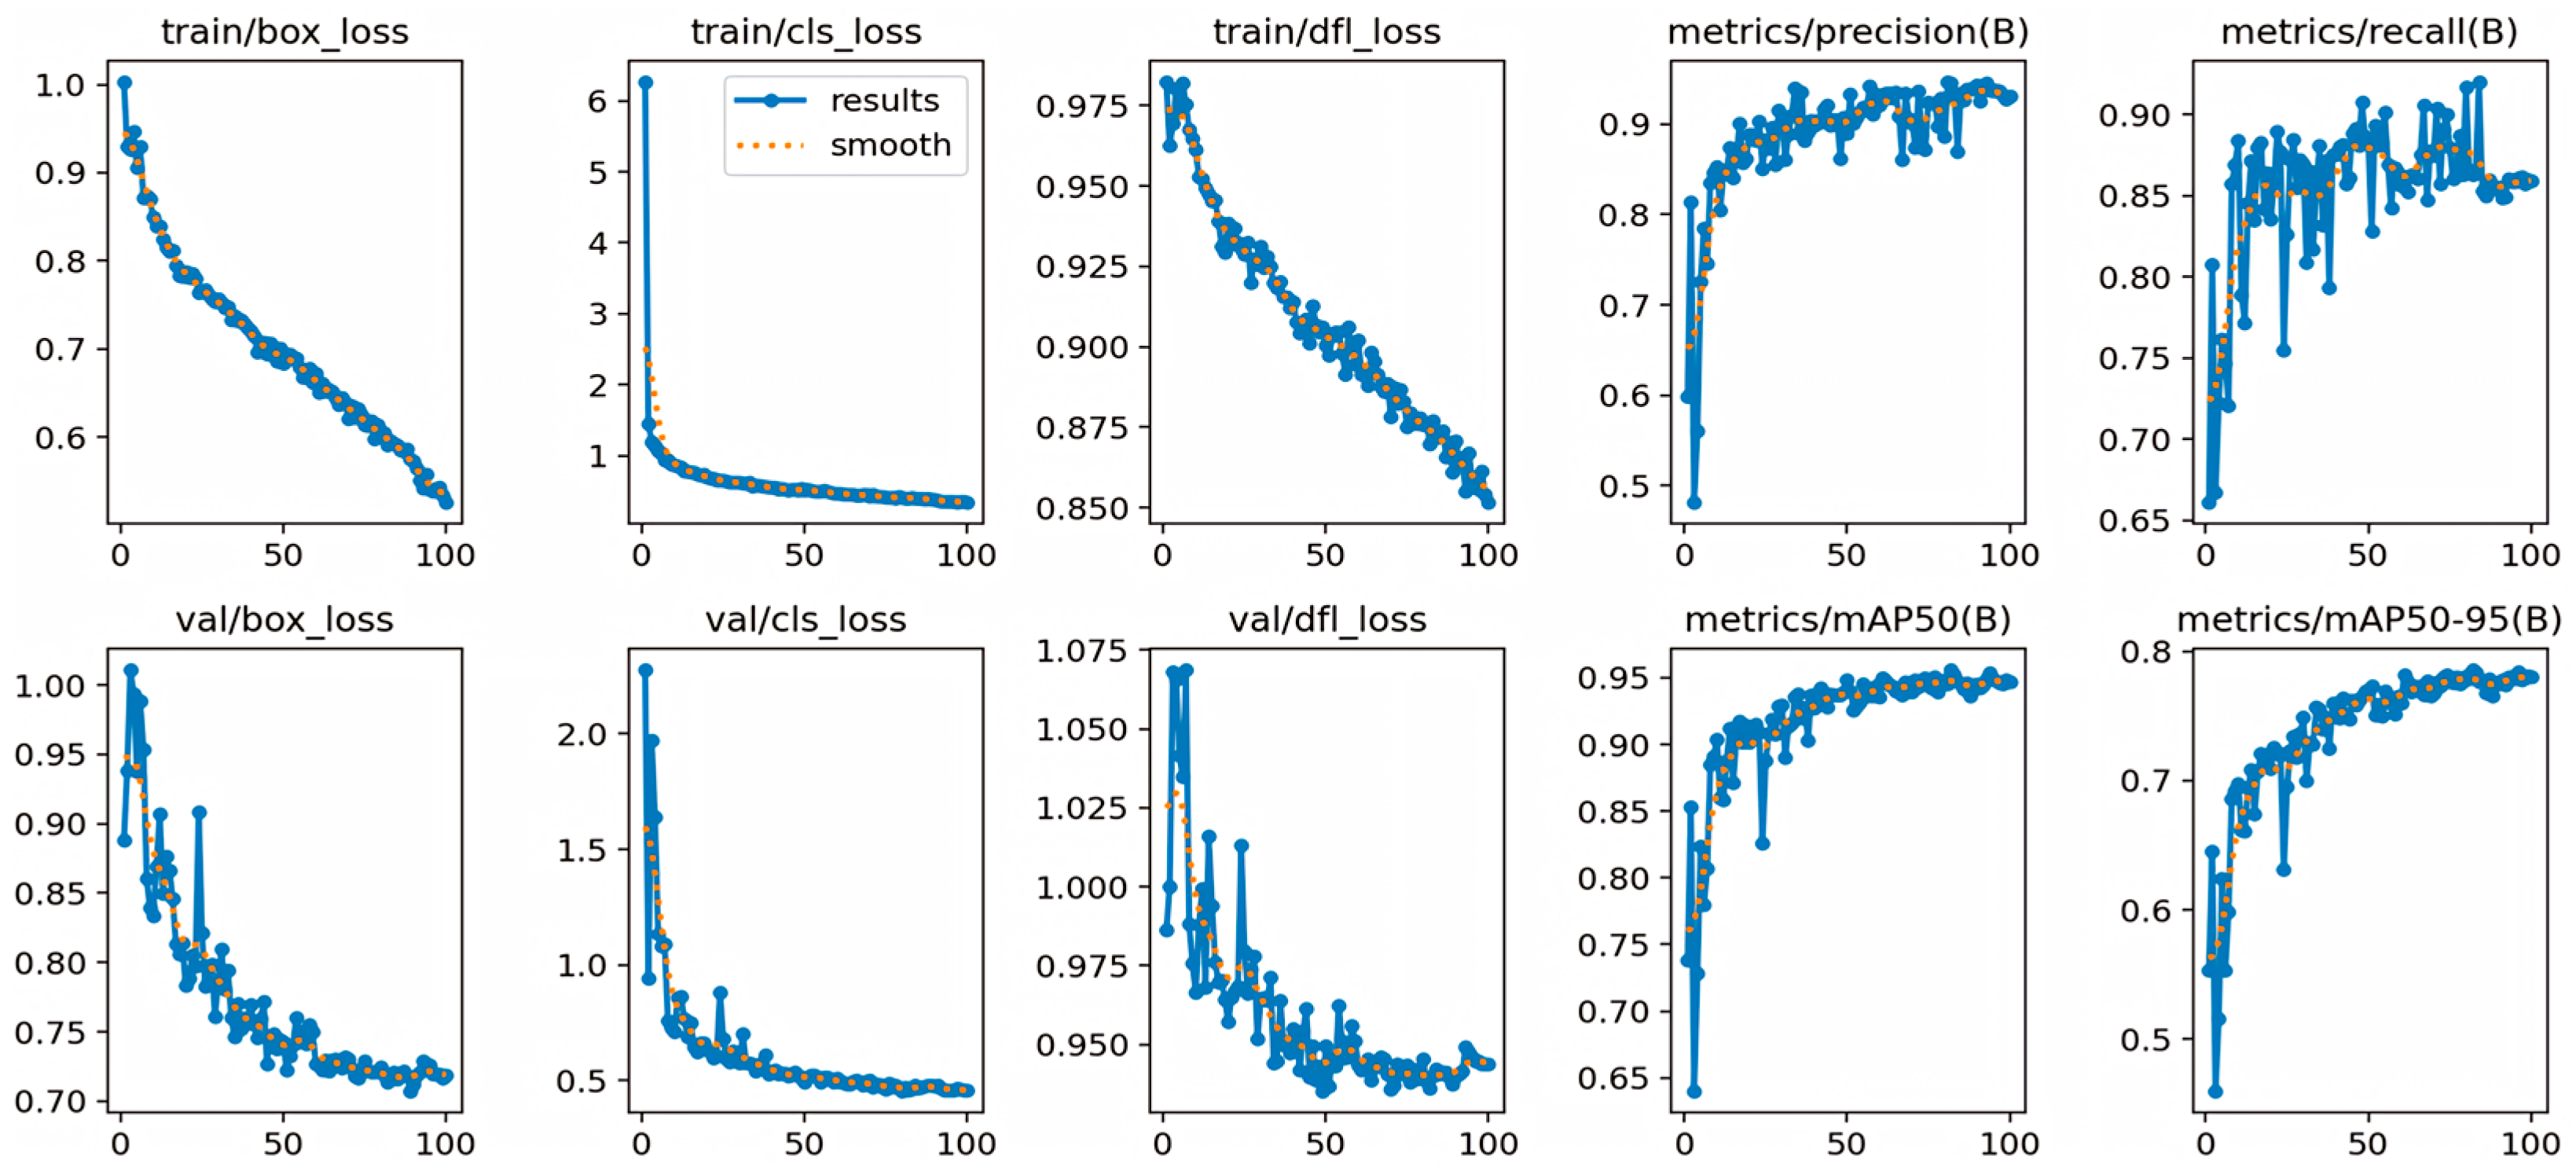
Figure 18 depicts the convergence trends of the training and validation metrics, confirming that the model has been fully trained and stabilized.
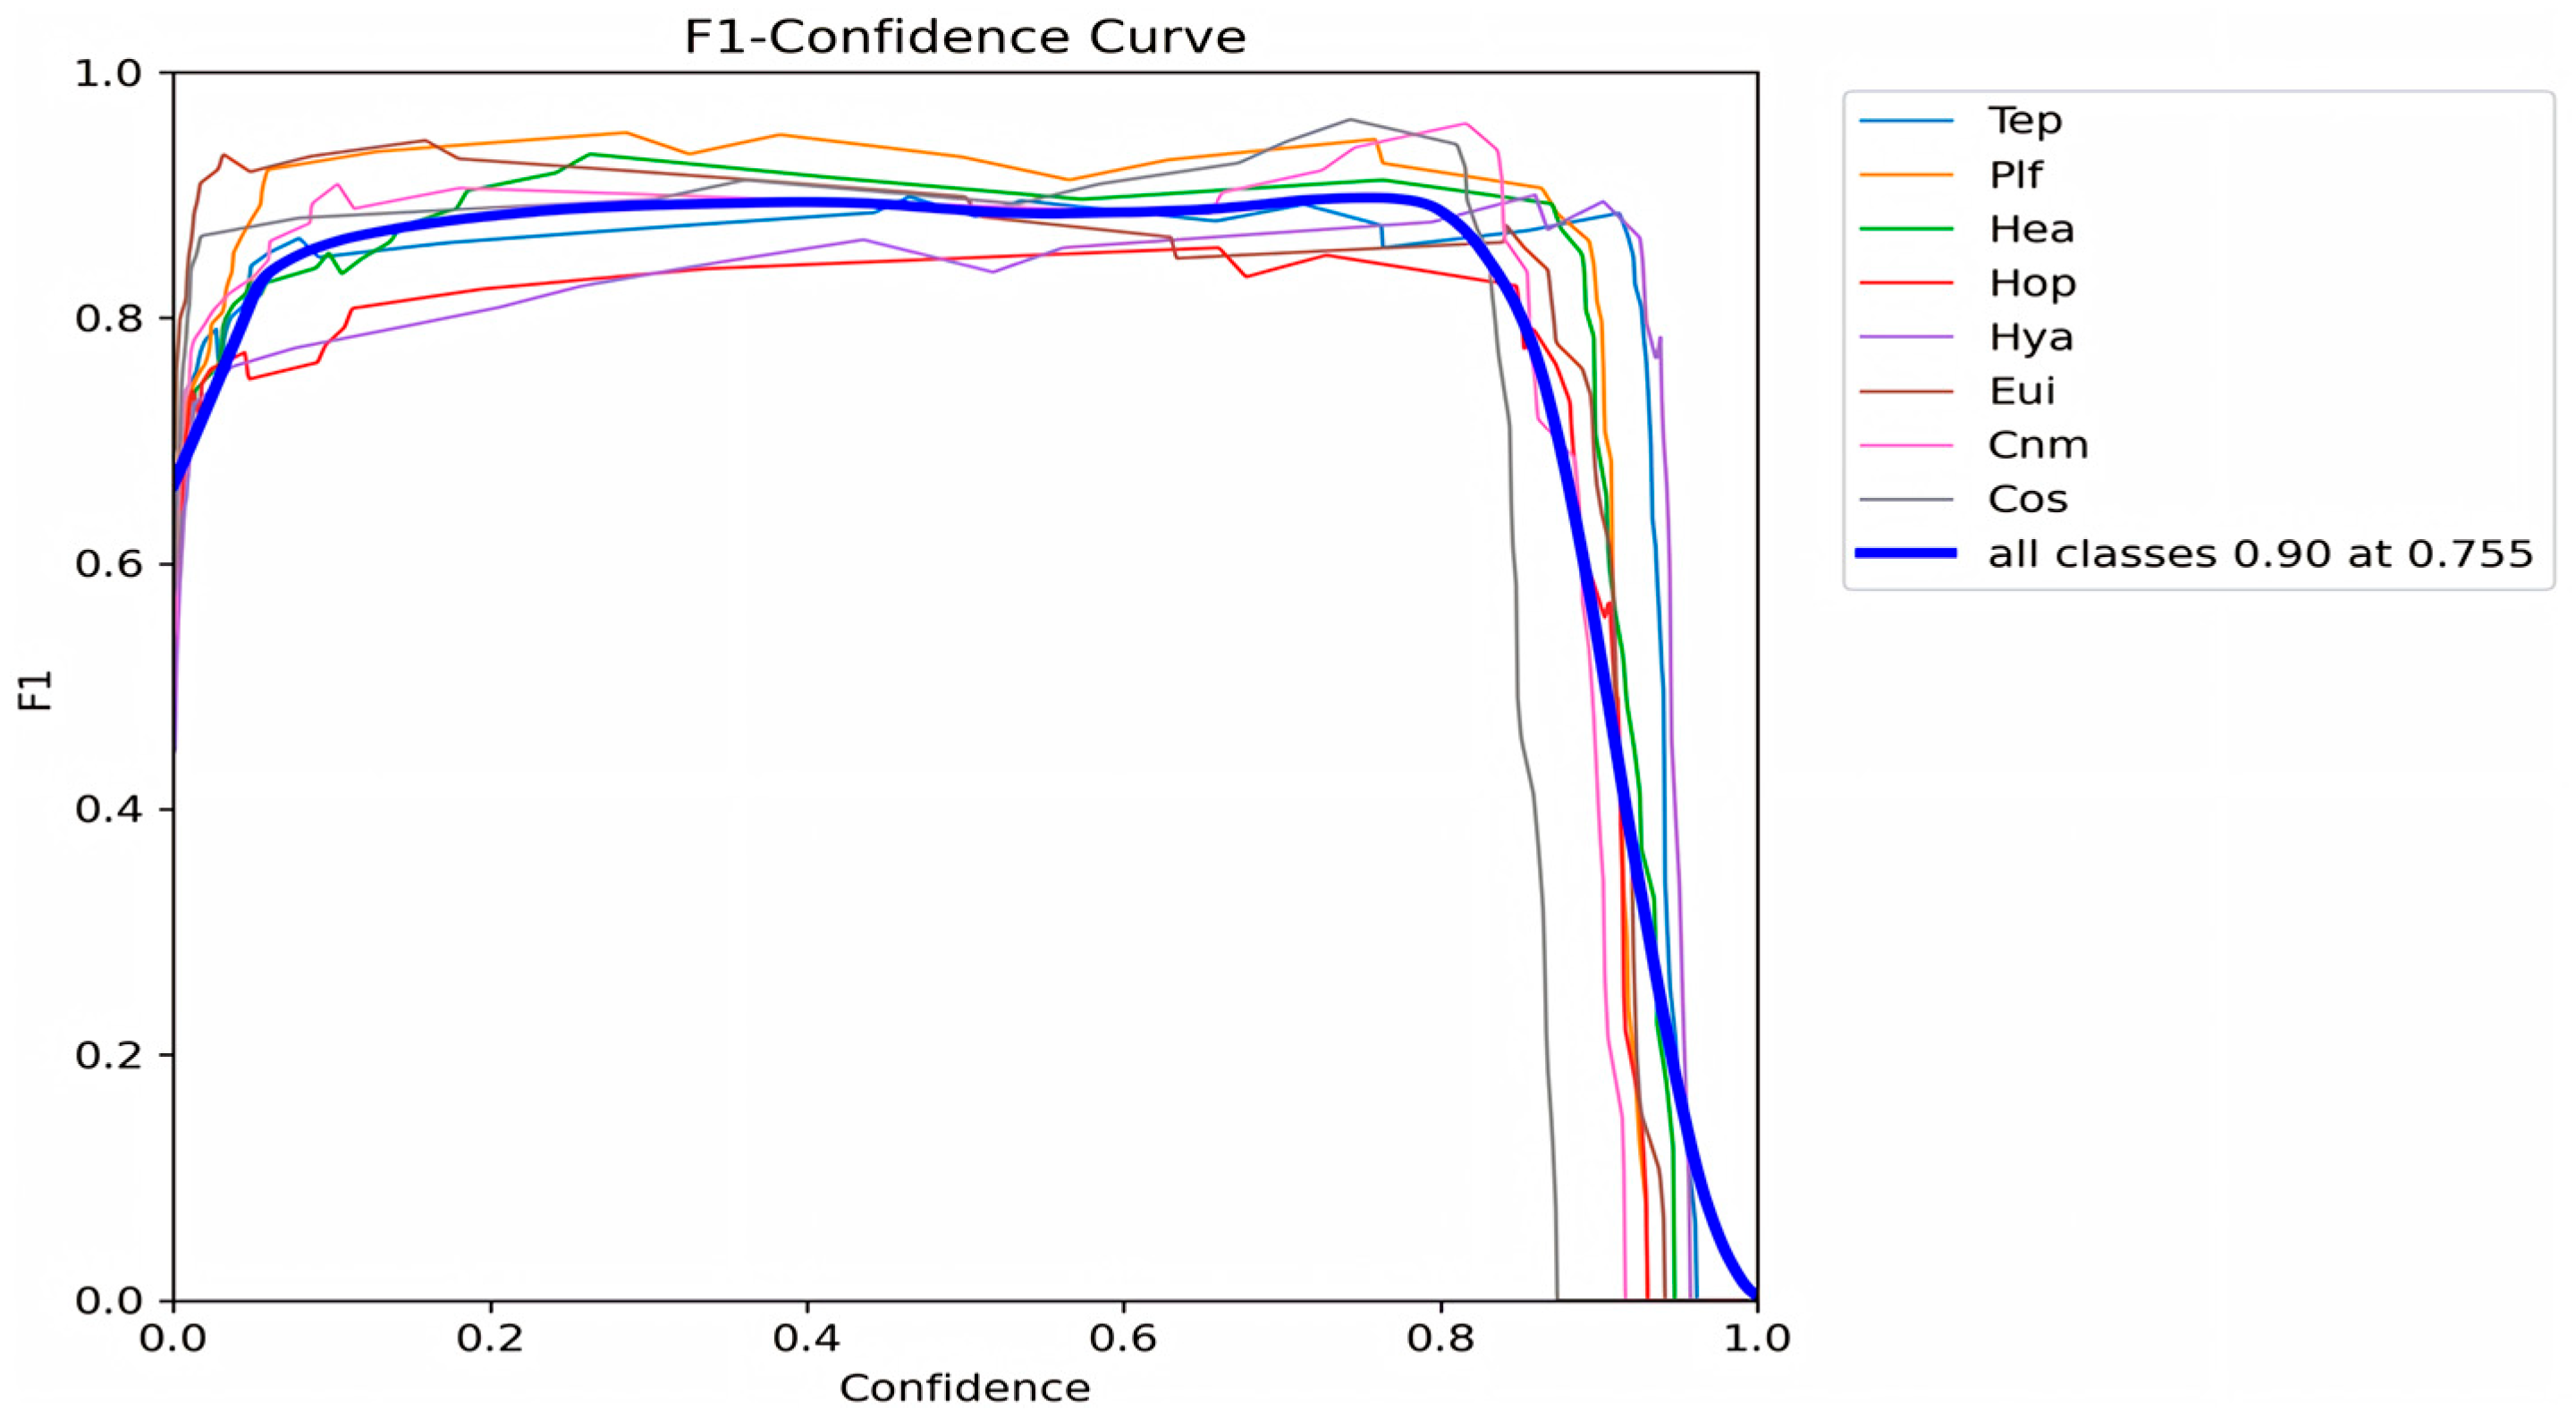
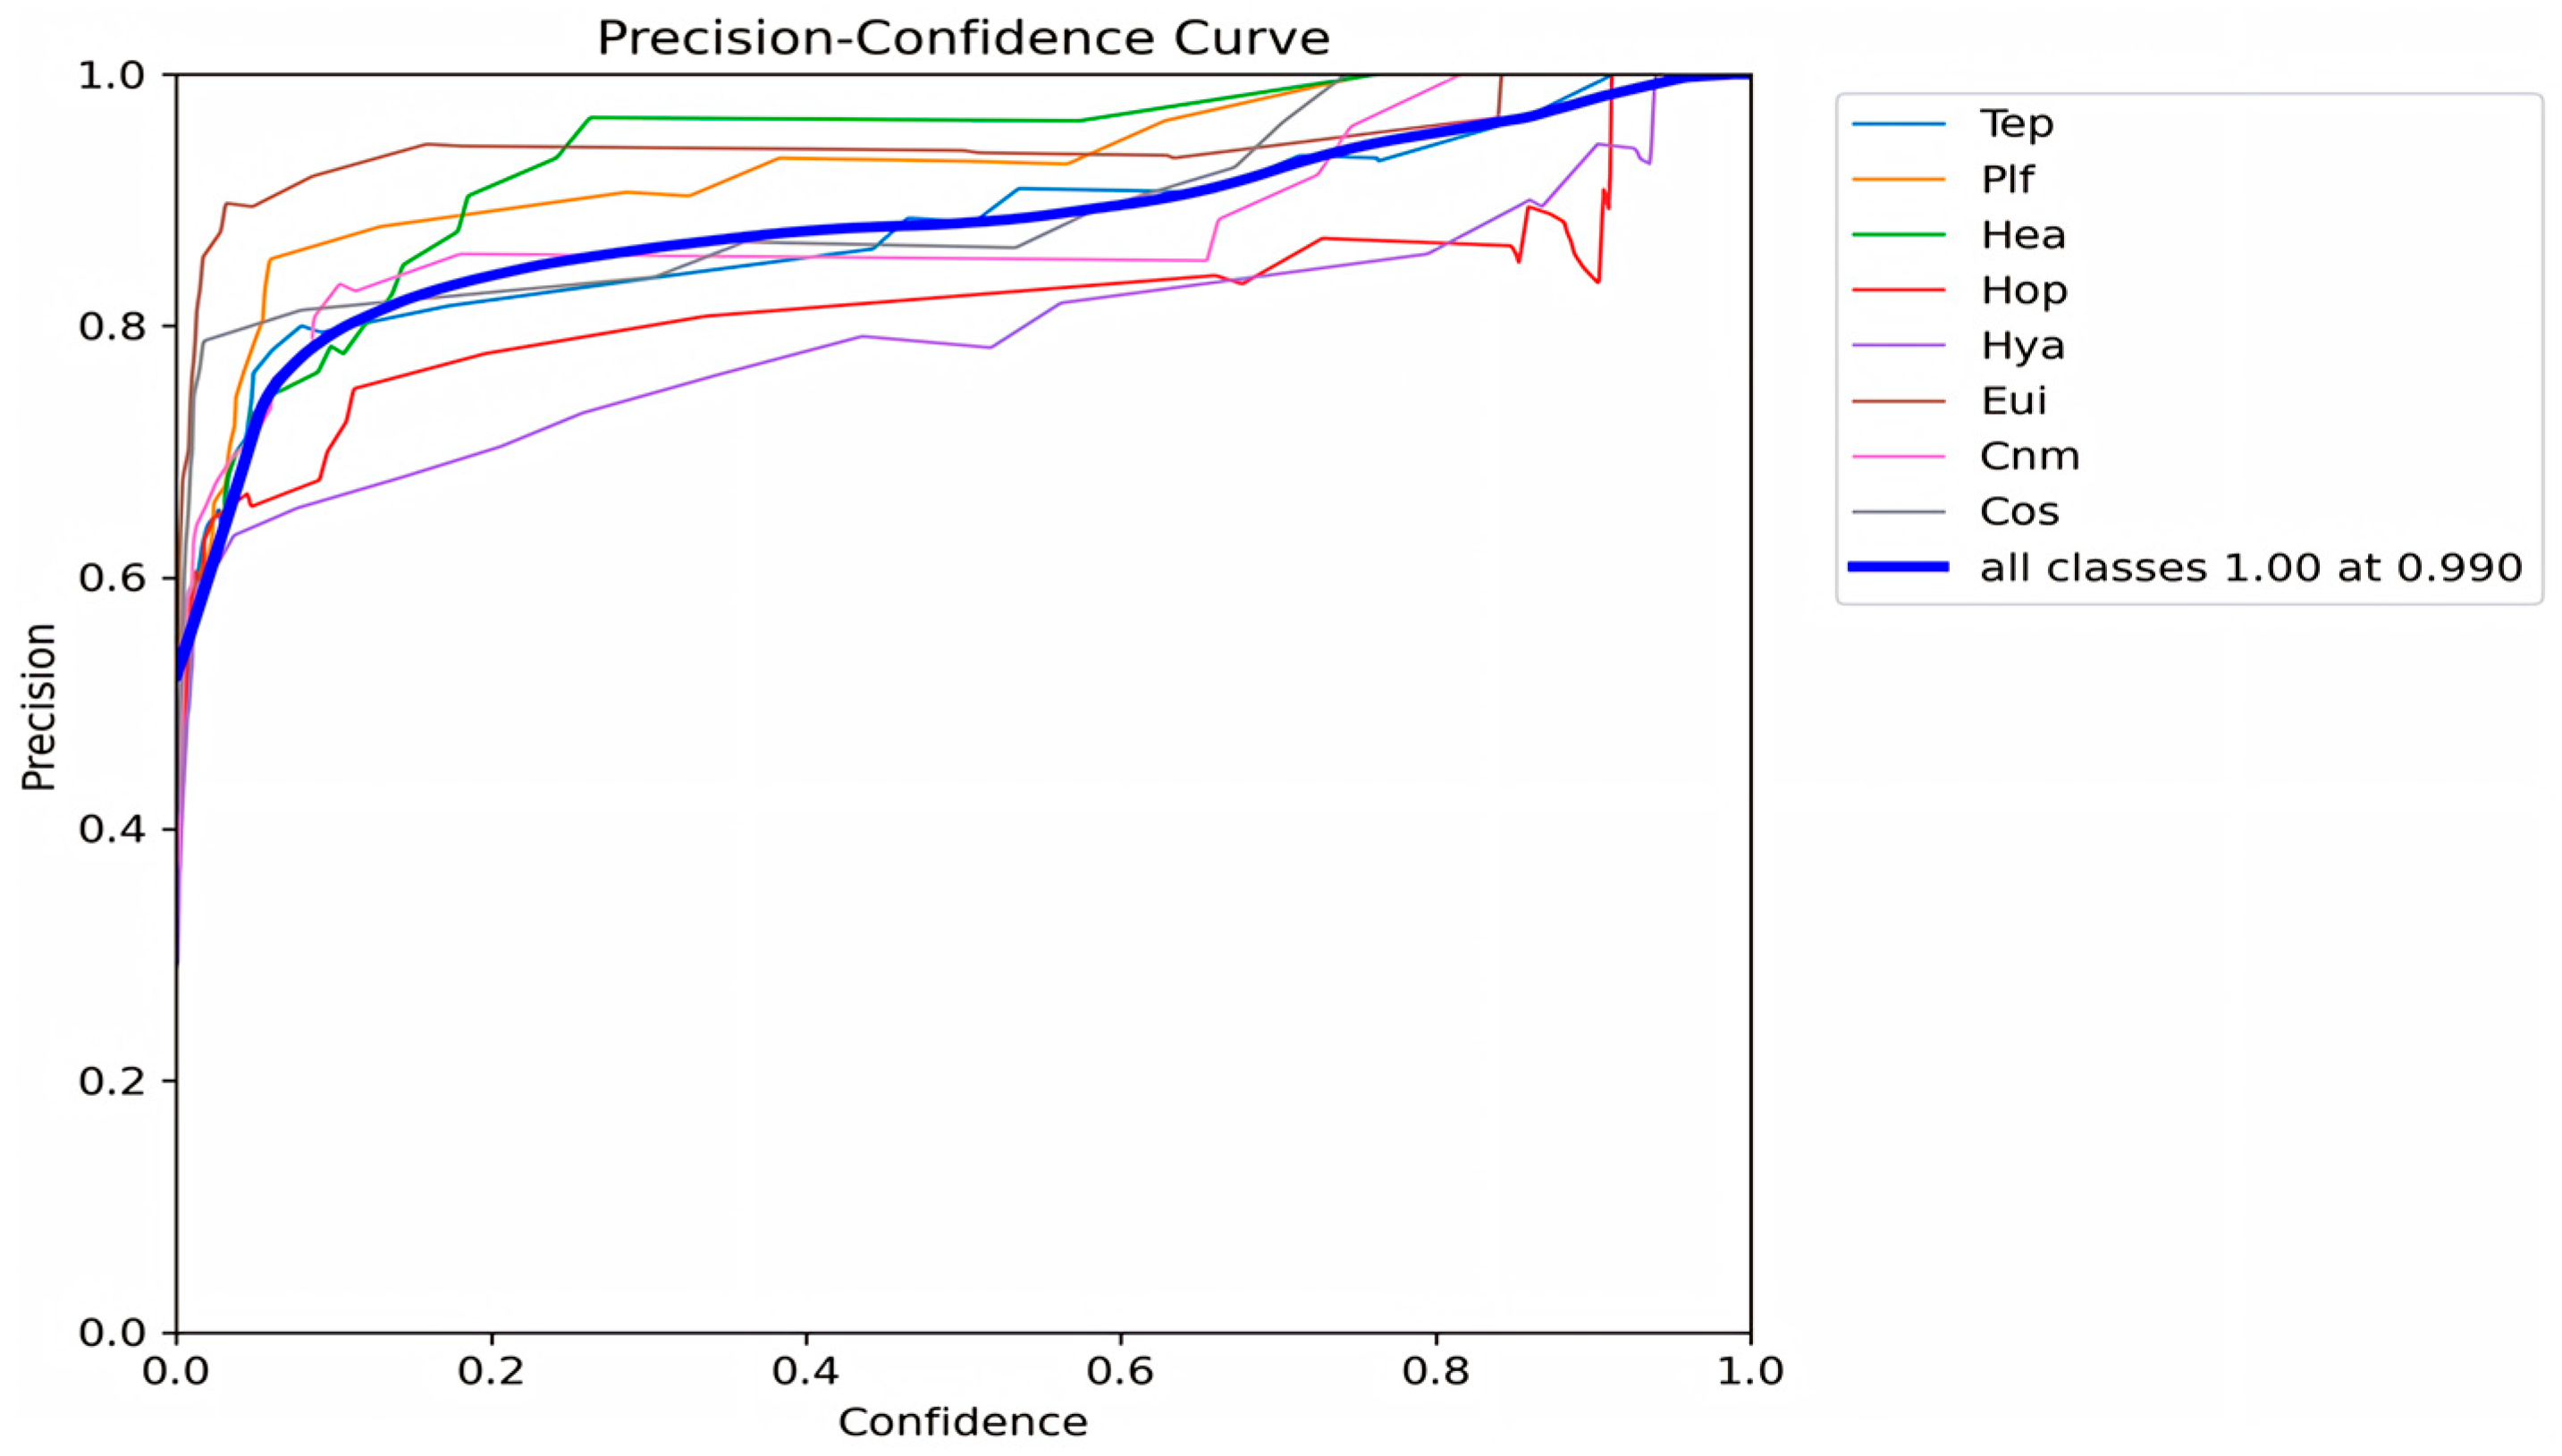
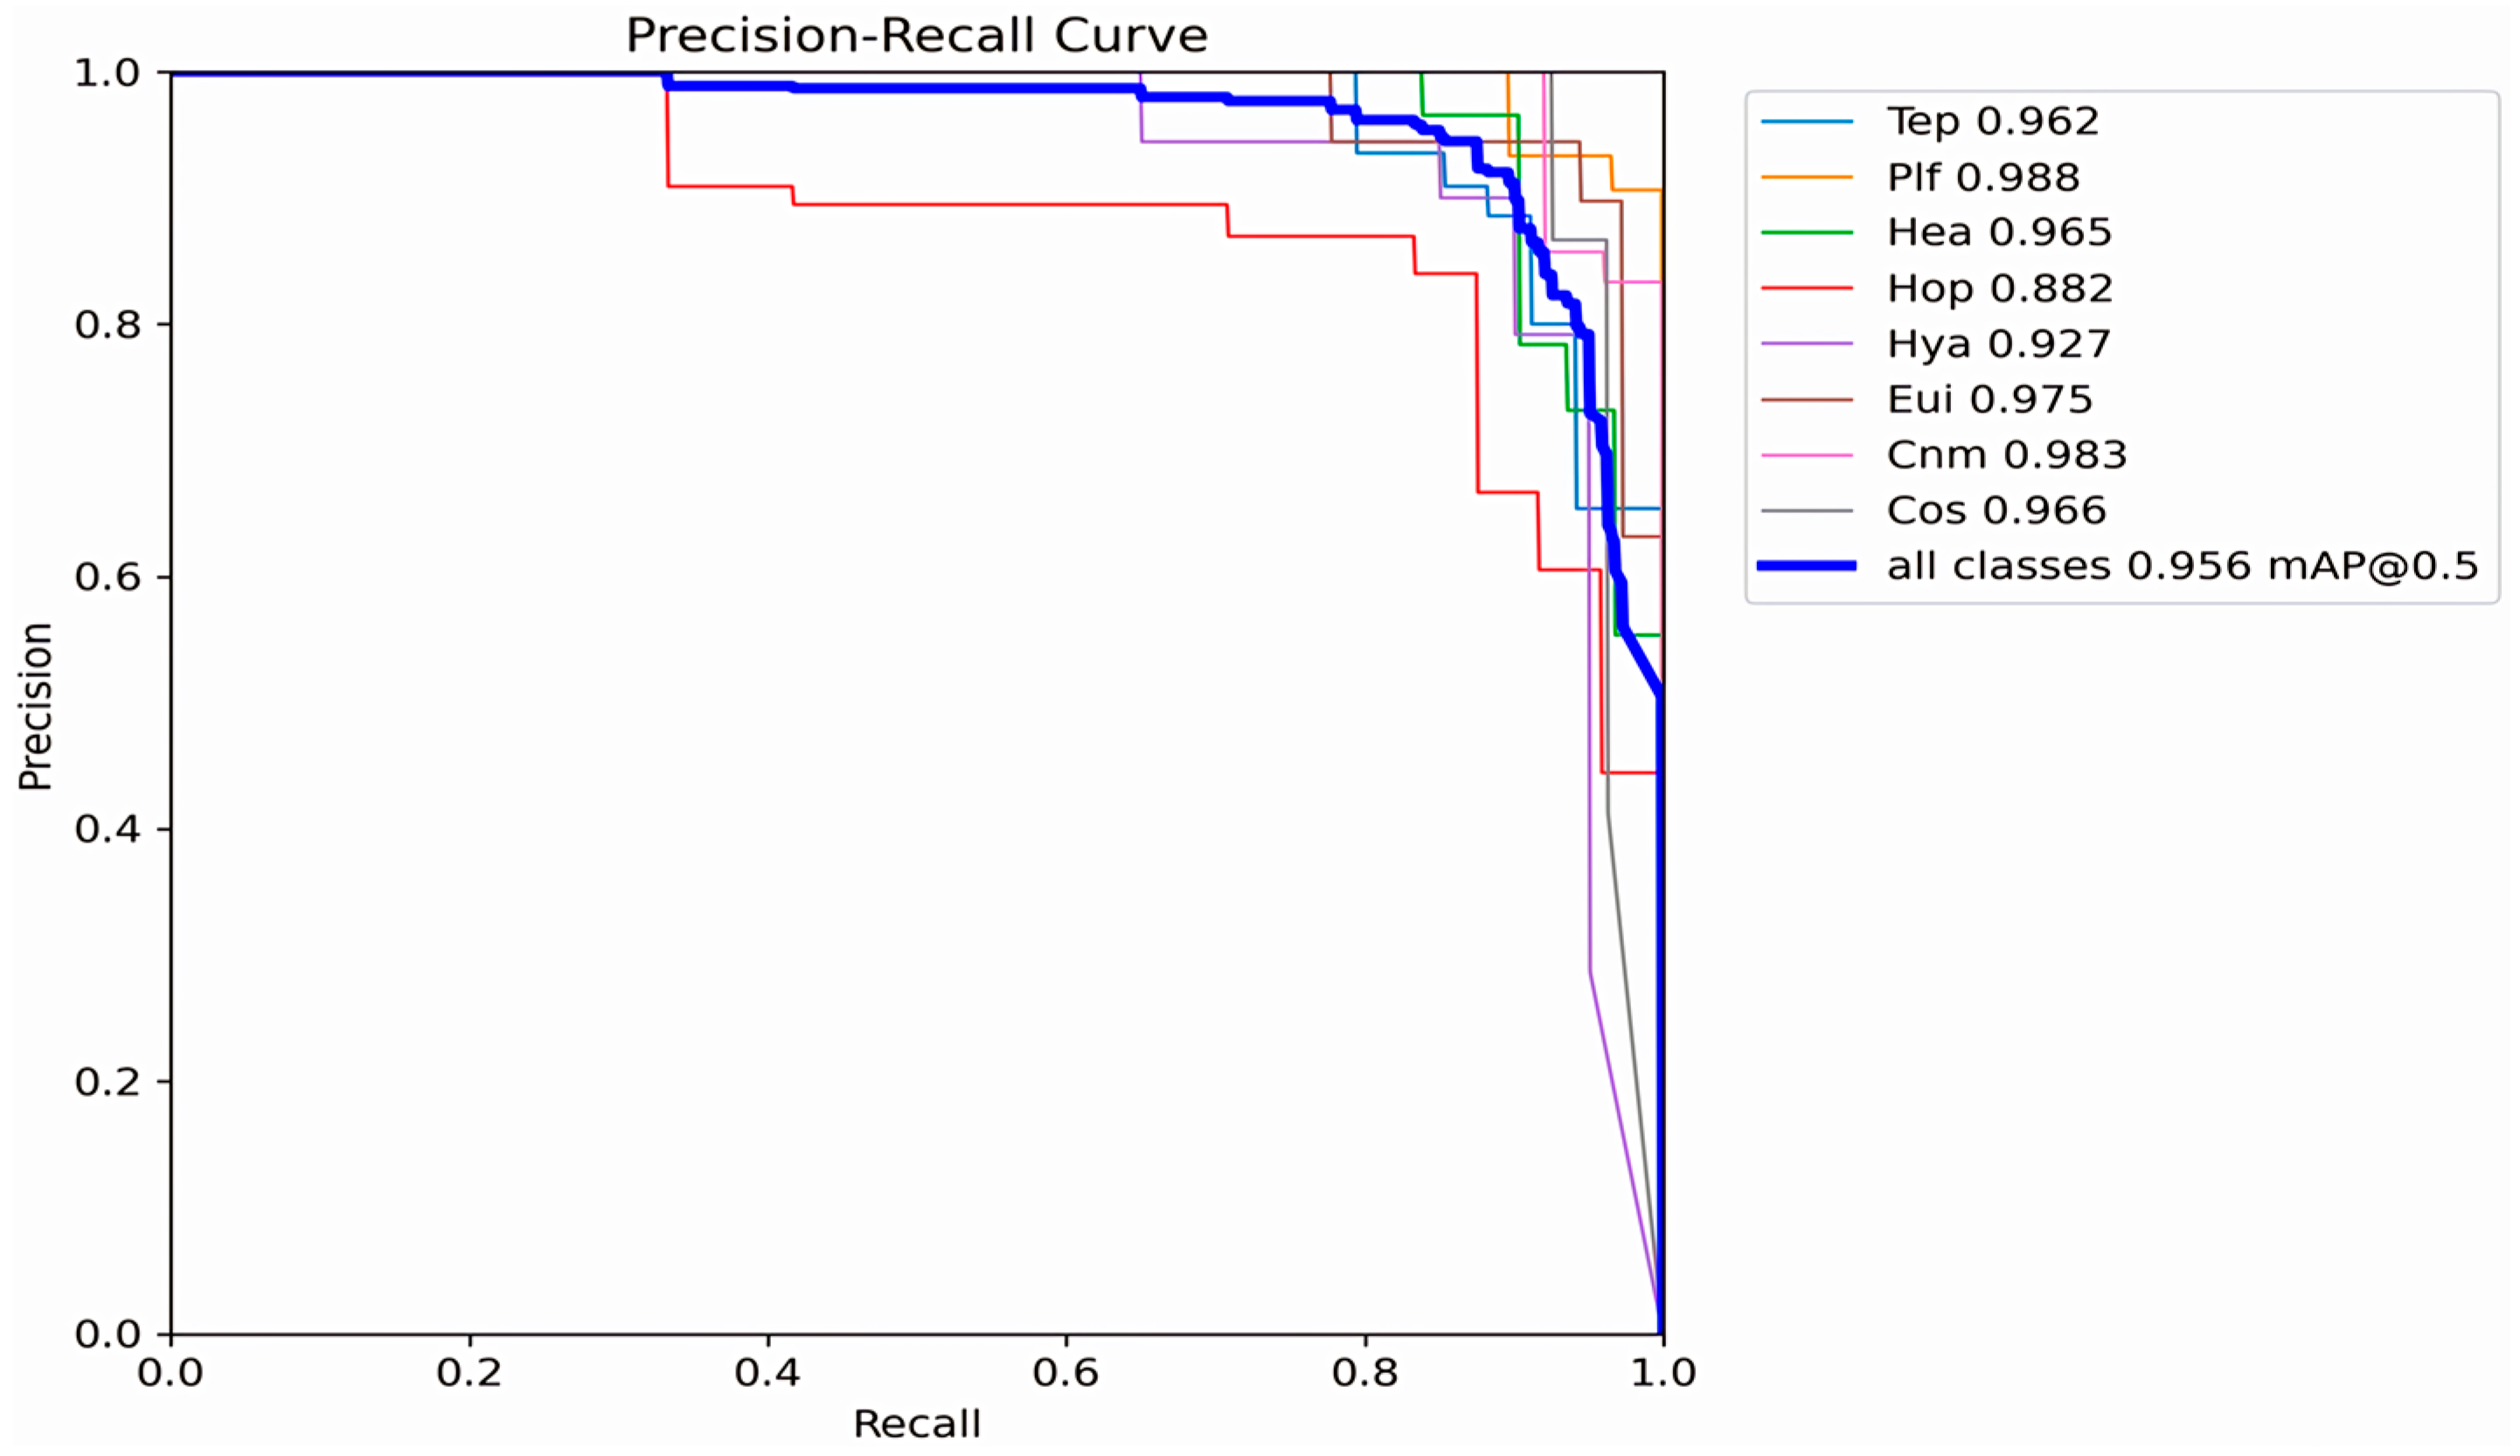
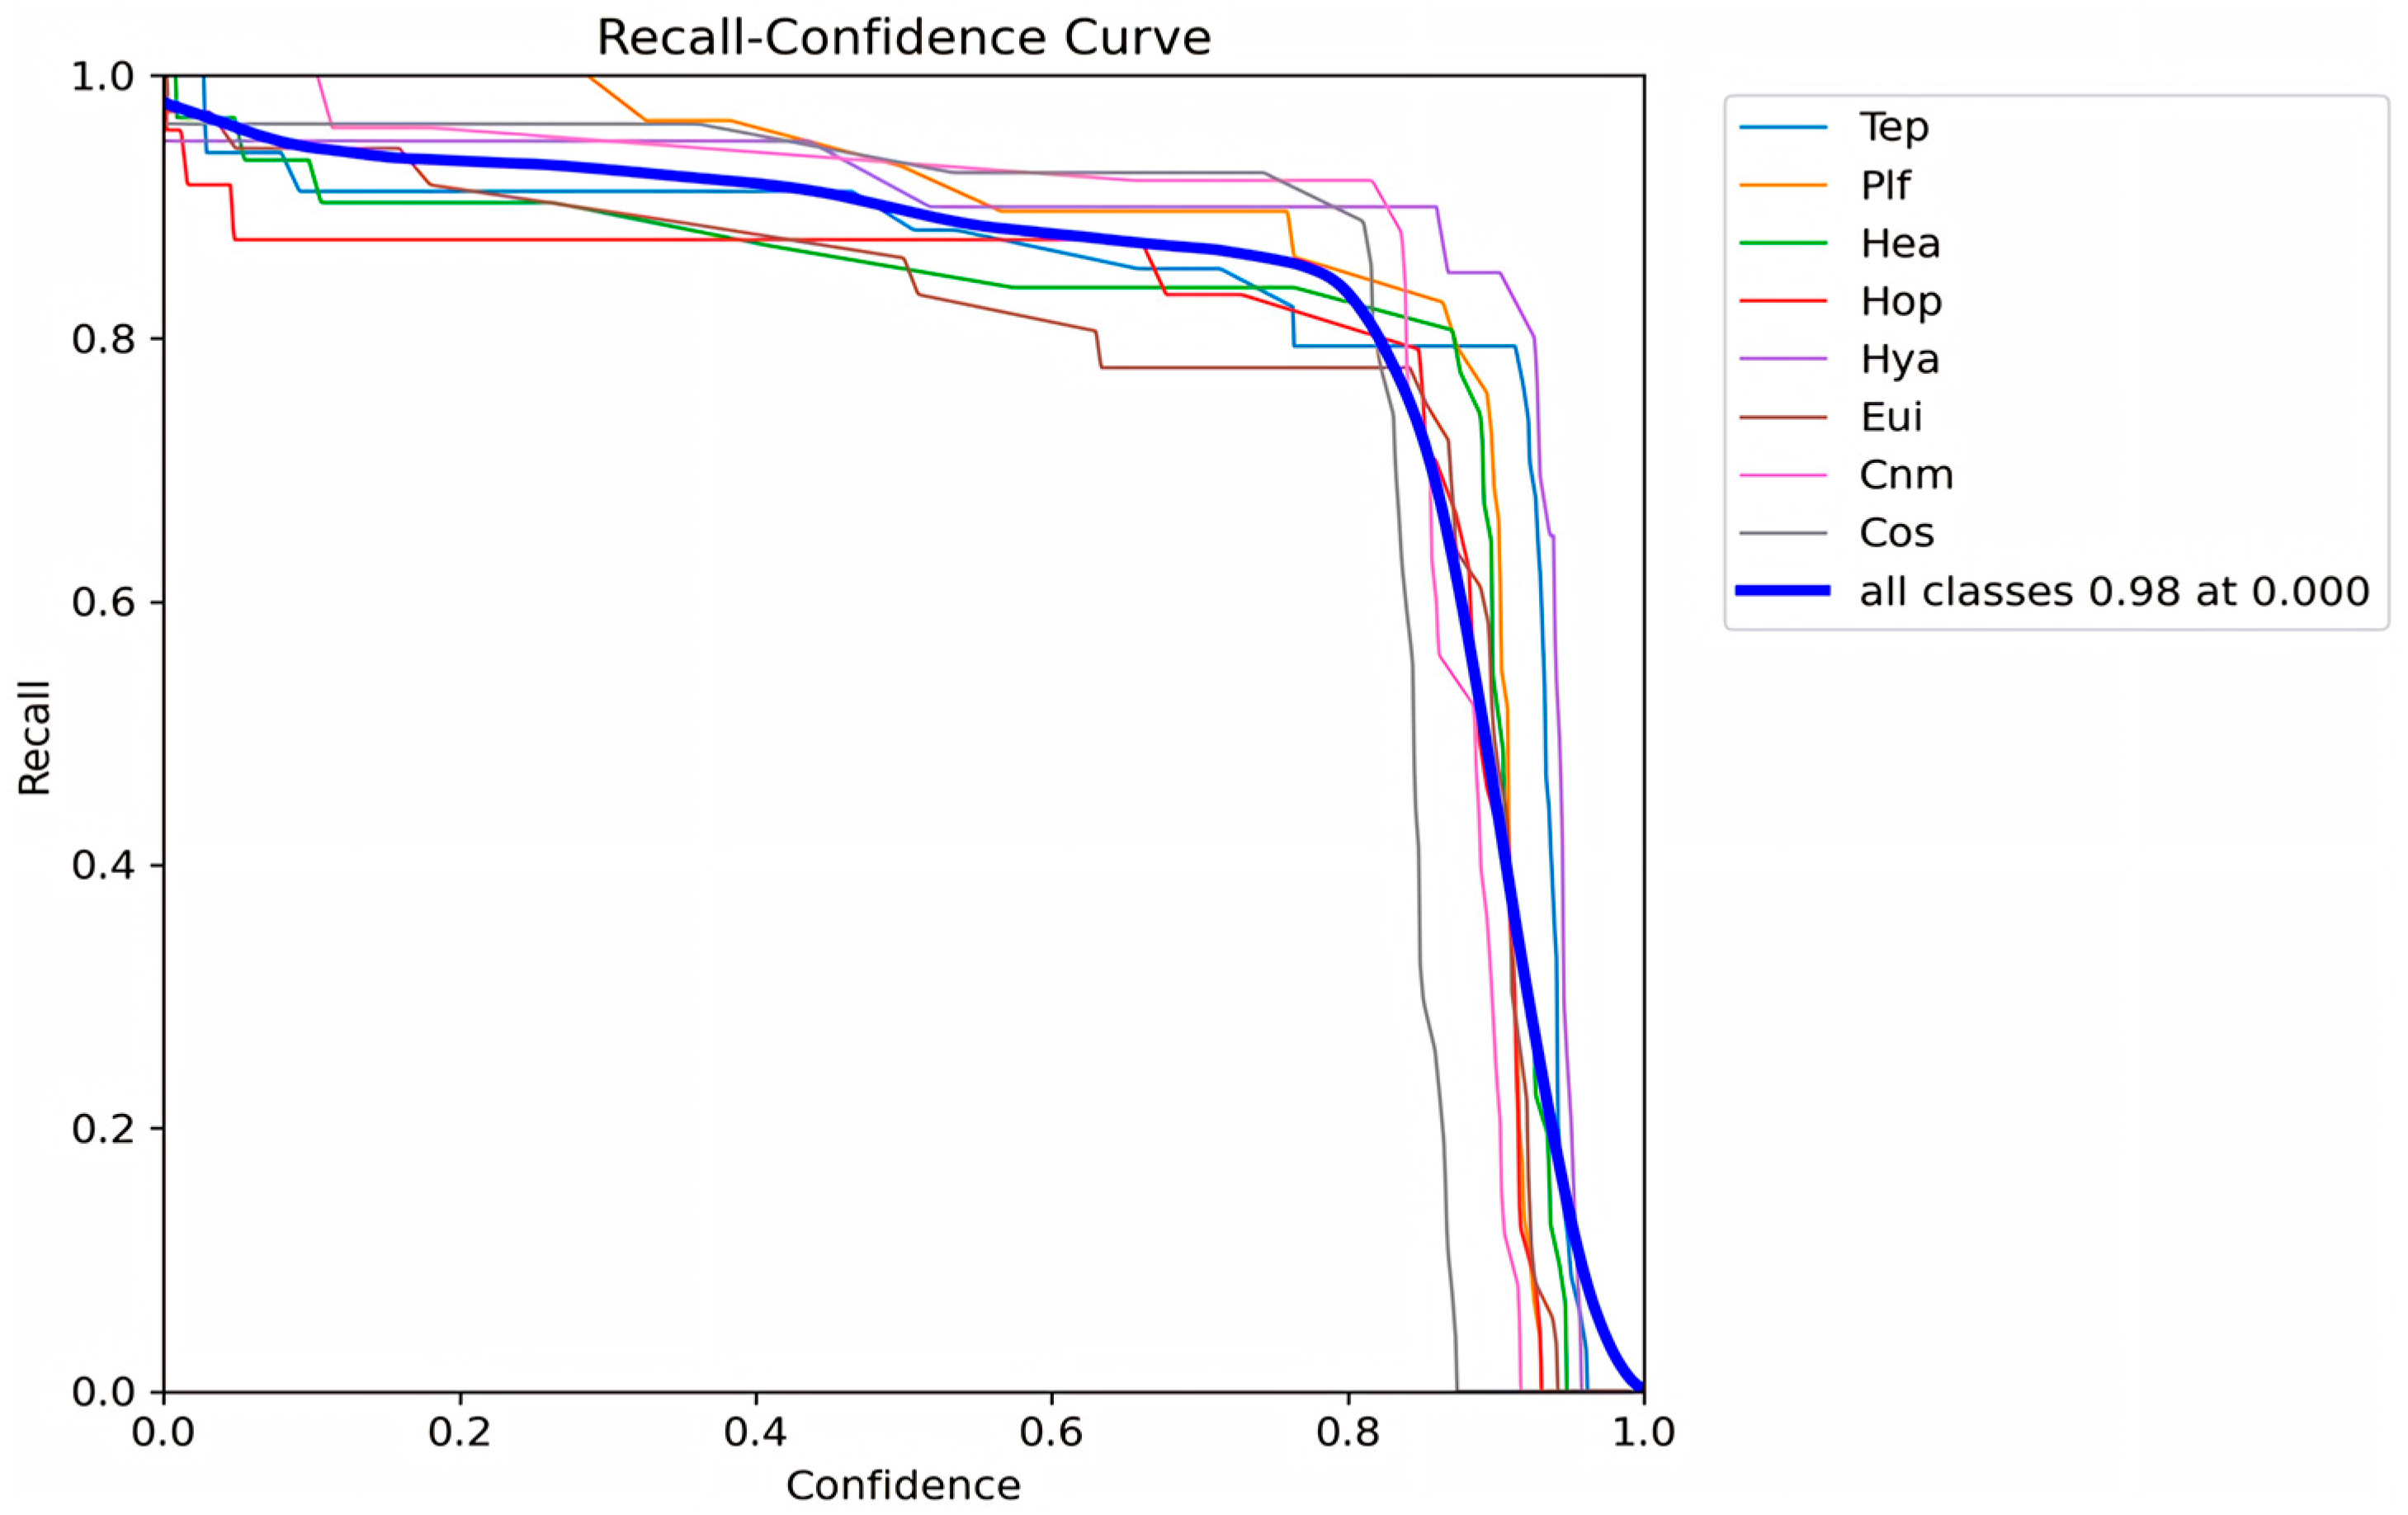
Figure 19 presents the F1-confidence curve, where an overall F1-score of 0.9 across all categories is achieved at a confidence threshold of 0.755. Figure 20 shows the precision–confidence curve, indicating that a similar performance level (F1 ≈ 0.9) is already attained at a lower confidence threshold of 0.5. Figure 21 displays the precision–recall curves, with a high mean Average Precision (mAP@0.5) of 0.956 for all categories. Figure 22 shows the recall–confidence curve, demonstrating a recall rate approaching 0.98 even at relatively low confidence thresholds.
Taken together, these indicators show that the model converged successfully and that the final YOLOv8s detector achieves high performance on the eight insect classes under the controlled imaging conditions provided by the proposed system. These results suggest that the images generated by the WF-DTS are well suited for off-the-shelf object detection without system-specific preprocessing and thus provide a practical foundation for subsequent LTARI-related studies based on time-resolved insect image data. It should be emphasized that this performance is primarily enabled by the hardware design—namely the water-flow-based physical dispersion that strongly reduces overlap between individuals and yields predominantly isolated specimens in the field of view, together with the uniform white matte imaging background—which greatly simplifies the visual scene. The methodological contribution of this work therefore lies in hardware optimization that reduces backend processing complexity, rather than in proposing a new detection algorithm.

6.4. Validation of Live Insect Results

To assess the system’s success in preserving insect viability—a core design objective—we conducted targeted live-capture validation trials. These trials were carried out during the main experimental period (23 June–30 September 2025), with a focused sampling effort in July 2025. Some experiments were temporarily interrupted by unexpected typhoons and heavy rainfall. As detailed in Appendix A, a custom 30-mesh screen collector was installed at the insect outlet to intercept and retain specimens. Each trial lasted for 24 h, and the survival status of the collected insects was assessed on the following day. An insect was classified as “alive” if it showed clear, obvious activity, such as crawling on the mesh or flying/attempting to fly inside the cage; individuals that exhibited no visible movement at all during the observation were classified as “dead”. The following abbreviations are used: Spodoptera litura (Spl), Ostrinia furnacalis (Osf), Spodoptera frugiperda (Spf), and cricket (Cri).
A total of 150 insects, including individuals from several orders such as Coleoptera and Lepidoptera, were tested. Of these, 94% survived according to the above criteria (141/150; 94% confidence interval: approximately 88–100%). Qualitative post-release observations indicated that many Lepidoptera individuals were able to resume normal movement and flight after recovery. The raw survival data and specimen classification details are provided in Appendix A. In addition, a complete set of on-site experimental photographs and the time-stamped capture records for all insects used in the survival verification trials are provided in Supplementary Material S4. These results indicate that, under the tested conditions, the device functions effectively as an insect image-acquisition tool while preserving insect viability to a substantial degree. This is consistent with the design objective of “minimizing ecological impact” and may provide a basis for studying the phototactic rhythms of live insects in their natural habitats.
During the survival verification experiment, on-site video recordings were acquired to document insect behavior while passing through the WF-DTS and during the post-capture recovery period. Representative video sequences of live insects, including Lepidoptera, passing through the WF-DTS and then resuming normal movement and flight after a short recovery have been uploaded to the following GitHub repository as qualitative evidence supporting the survival assessment: <https://github.com/157550/my-project.git> (accessed on 1 February 2026). The repository contains the full, unedited video sequences corresponding to the survival-validation trials, complementing the still-image records provided in Supplementary Material S4.
At the same time, the reported 94% survival rate should be interpreted as a short-term, community-level indicator. It does not exclude the possibility of sublethal effects caused by water contact, such as partial scale loss and impaired flight in vulnerable taxa like Lepidoptera. Quantifying such potential sublethal impacts will require targeted behavioral and physiological experiments in future work.

7. Discussion

7.1. Advantages of the Proposed System

The proposed live-insect monitoring system is intended as a methodological alternative to conventional light-trap-based monitoring devices. By integrating wind-suction non-destructive trapping, water-flow-assisted dispersion for imaging, and gentle water–insect separation for release, the system establishes a fully automated, non-lethal trapping–imaging–release workflow that can be deployed in field environments.
A key practical advantage of the design is its ability to limit physical contact and stacking among captured insects. The water-flow dispersion mechanism helps to isolate individual specimens during imaging, producing high-fidelity single-insect images against a clean background. This directly addresses a long-standing limitation of conventional automated monitoring devices, in which insect stacking and adhesion severely degrade image quality and constrain the performance of image-based recognition algorithms. Under these conditions, high detection accuracy can be achieved with relatively simple, off-the-shelf detectors, and the main advance of the present work lies in the hardware-enabled simplification of the imaging scene rather than in a purely algorithmic breakthrough.
In addition, the non-lethal nature of the system may reduce unintended impacts on non-target and beneficial insect populations compared with lethal light traps. Lethal devices may alter local insect communities and preclude repeated observation of the same individuals. In contrast, the proposed system allows insects to be captured, imaged, and subsequently released, with a high short-term post-capture survival rate under the tested conditions. This improves the ecological compatibility of the monitoring process and supports repeated, time-resolved observations under natural field conditions.
By reducing specimen stacking and the influence of trap-induced mortality on the captured data, the proposed system may provide a practical methodological basis for future LTARI-related research. Rather than attempting to establish definitive LTARI values within this study, the system is intended to support flexible experimental designs and long-term field observations, thereby facilitating more detailed investigations of light-attraction dynamics in living insect populations.

7.2. Limitations and Future Work

Several limitations of the present prototype should be acknowledged. First, as a non-lethal monitoring system, the WF-DTS releases insects alive, so the same individuals may be captured multiple times across nights. In this study, we focused on image quality and short-term post-capture survival rather than on deriving absolute abundance indices, and repeated capture was not explicitly tracked or corrected. Future LTARI-oriented work will therefore require dedicated experiments that combine WF-DTS monitoring with individual marking or tracking strategies if population-level estimates are desired.
Second, the present study did not include head-to-head comparative experiments with conventional lethal light traps operated under identical field conditions. As a result, the data reported here cannot be used to draw direct quantitative conclusions about differences in LTARI between the WF-DTS and existing traps. Instead, the current work should be understood as establishing a non-lethal monitoring platform that is intended to reduce biases associated with carcass stacking and trap-induced mortality. Future studies will need to deploy the WF-DTS side-by-side with representative conventional devices to obtain comparative LTARI estimates and to evaluate how non-lethal monitoring modifies inferred attraction patterns.
Third, the current prototype exhibits clear size-dependent limitations. As discussed in Section 6.2.1 and illustrated in Supplementary Material S1, co-located sticky traps captured very small insects (≈1 mm; e.g., midges and thrips), whereas such taxa were essentially absent from the WF-DTS dataset.
Fourth, the survival experiment represents a first-stage feasibility assessment rather than a comprehensive physiological study. The sample size is moderate, explicit control treatments (e.g., wind-only, water-only, or conventional traps) were not included, and the survival metric is a community-level indicator rather than a group-specific measure. Although Lepidoptera and other major orders were present, and many individuals were qualitatively observed to recover normal movement and flight after passing through the WF-DTS, future work should include taxonomically stratified survival analyses and explicit evaluation of potential sublethal effects, especially for key pest and beneficial taxa.
Finally, the evaluation of long-term operation and environmental robustness remains preliminary. The reported field deployment was conducted under relatively favorable weather, without prolonged heavy rainfall or extreme temperatures. While the stainless-steel housing and sealed panels protected the internal modules during occasional light to moderate rain, the stability of the mechanical structure, water-circulation components, and electronics under sustained heavy rainfall, strong winds, or heat waves has not yet been systematically assessed. Power measurements and field operation (Section 6.1; Supplementary Material S2) indicate that the prototype can operate continuously for approximately 2.5 days without solar supplementation and that routine maintenance (e.g., replacing the filter sponge every 2–3 days) is sufficient under the tested conditions, but extended deployments with environmental monitoring will be needed to quantify performance across different weather regimes.
In its current form, the WF-DTS should therefore be regarded as a research-oriented monitoring platform and methodological basis for non-lethal, image-based insect surveillance and exploratory LTARI studies, rather than an immediate drop-in replacement for all existing operational light-trap systems. Future work will focus on improving size coverage, refining biological validation, correcting for repeated capture when deriving abundance indices, and strengthening long-term robustness across diverse agroecological and climatic conditions.

8. Conclusions

This study presents a live-insect monitoring system based on a water-flow-assisted dispersion and transport mechanism. By combining wind-suction trapping, water-flow-assisted dispersion for imaging, and water–insect separation for release, the prototype implements a fully automated, non-lethal trapping–imaging–release workflow suitable for deployment in field environments.
Experimental evaluation under the reported conditions indicates that the system can mitigate two common limitations of conventional insect monitoring devices: stacking of insect bodies, which degrades image quality, and indiscriminate mortality of both target and non-target insects. In the field tests, the device enabled the acquisition of isolated single-insect images and yielded a community-level post-capture survival rate of 94%, thereby supporting image-based monitoring while limiting direct impacts on local insect populations.
This study does not aim to establish definitive LTARI values; instead, it provides a methodological foundation for future LTARI research.

Supplementary Materials

The following supporting information can be download at: https://www.mdpi.com/article/10.3390/electronics15030714/s1. Supplementary S1: Small-sized insects captured by sticky insect traps and representative photographs of insect monitoring and trapping lamps. Supplementary S2: Summary of power consumption testing and maintenance status. Supplementary S3: Light strip type and position testing, and evaluation of different water-flow velocities. Supplementary S4: Live insect survival validation.

Author Contributions

Conceptualization, L.S.; methodology, L.S. and J.F.; hardware, J.F.; software, J.F.; validation, J.F.; formal analysis, J.F.; investigation, J.F.; resources, L.S.; data curation, J.F.; writing—original draft preparation, J.F.; writing—review and editing, J.F.; visualization, J.F., W.L.; supervision, L.S. and R.H.; project administration, K.L. All authors have read and agreed to the published version of the manuscript.

Funding

This research received no external funding.

Data Availability Statement

Some of the image and annotation data generated and analyzed in this study are publicly available at https://dx.doi.org/10.21227/q7k4-fe73. The shared subset contains the insect bounding-box annotations and category labels used in the experiments reported in this article. A README file on the dataset landing page documents the data organization, file structure, and annotation procedure. The dataset is released for supporting evidence and research purposes. The complete dataset is not publicly available at this time. Users are requested to cite this article when using the data. No additional methodological content beyond what is described in this manuscript is included.

Conflicts of Interest

The authors declare no conflicts of interest.

Abbreviations

The following abbreviations are used in this manuscript:
LTARIThe light-trap attraction rate of insects
WF-DTSWater-Flow Dispersion and Transport Structure
WSALThe Wind-Suction Attraction Lamp

Appendix A

Table A1. Live insect survival validation.
Experiment DateTotal Collected InsectsSurvivorsDeaths
30 June12Hop (n = 5), Tep (n = 4), Cos (n = 2).Cos (n = 1).
1 July8Hop (n = 2), Hya (n = 1), Hea (n = 2), Cos (n = 2), Spl (n = 1).0
2 July13Hop (n = 4), Tep (n = 3), Cos (n = 1), Hea (n = 2), Osf (n = 1).0
3 July10Hop (n = 5), Hya (n = 1), Cos (n = 2), Osf (n = 1).Cri (n = 1).
6 July10Tep (n = 2), Cri (n = 1), Spl (n = 3), Osf (n = 1), Spf (n = 2).0
7 July9Hop (n = 2), Tep (n = 1), Hea (n = 4), Cri (n = 1).Tep (n = 1).
14 July10Hop (n = 3), Hya (n = 4), Cos (n = 2).0
16 July11Hop (n = 4), Tep (n = 2), Cos (n = 1), Hea (n = 1), Spf (n = 1).Tep (n = 1).
17 July8Hop (n = 2), Tep (n = 2), Cos (n = 1), Spl (n = 1), Hea (n = 1).Cos (n = 1).
18 July11Hop (n = 4), Hya (n = 3), Tep (n = 1), Osf (n = 1).Hya (n = 1).
19 July9Hop (n = 2), Tep (n = 1), Cos (n = 1), Spf (n = 1), Osf (n = 2), Cri (n = 2).0
23 July9Tep (n = 1), Cos (n = 2), Cri (n = 2), Osf (n = 1), Spl (n = 2).0
24 July3Osf (n = 1), Hea (n = 1), Spl (n = 1).0
25 July8Tep (n = 1), Cos (n = 1), Cri (n = 2), Osf (n = 1), Hea (n = 2).Cos (n = 1).
29 July10Hop (n = 2), Tep (n = 1), Spf (n = 1), Spl (n = 1), Osf (n = 1), Cri (n = 2), Cos (n = 1)Cos (n = 1).

References

  1. Yao, H.; Shu, L.; Yang, F.; Jin, Y.; Yang, Y. The Phototactic Rhythm of Pests for the Solar Insecticidal Lamp: A Review. Front. Plant Sci. 2023, 13, 1018711. [Google Scholar] [CrossRef] [Scilit] [PubMed]
  2. Tang, T.S. A Classification and Trapping Lamp for Agricultural and Forestry Pests; Technical Manual; Minghai Forest Farm: Lanzhou, China, 2024. [Google Scholar]
  3. Cardim Ferreira Lima, M.; Damascena de Almeida Leandro, M.E.; Valero, C.; Pereira Coronel, L.C.; Gonçalves Bazzo, C.O. Automatic Detection and Monitoring of Insect Pests—A Review. Agriculture 2020, 10, 161. [Google Scholar] [CrossRef] [Scilit]
  4. Preti, M.; Verheggen, F.; Angeli, S. Insect Pest Monitoring with Camera-Equipped Traps: Strengths and Limitations. J. Pest Sci. 2021, 94, 203–217. [Google Scholar] [CrossRef] [Scilit]
  5. Price, B.; Baker, E. NightLife: A Cheap, Robust, LED-Based Light Trap for Collecting Aquatic Insects in Remote Areas. Biodivers. Data J. 2016, 4, e7648. [Google Scholar] [CrossRef] [Scilit] [PubMed]
  6. Li, X.R. Population Dynamics and Lamp-Attracted Behavioral Rhythms of Nilaparvata lugens and Its Natural Enemies in Yuanjiang. Master’s Thesis, Nanjing Agricultural University, Nanjing, China, 2022. [Google Scholar] [CrossRef]
  7. Wang, Z.J.; Ren, Z.J.; Song, X.D.; Wang, C.R.; Zhang, Q.F.; Yu, H.C. Occurrence Patterns of Chilo suppressalis in Rice Fields in Harbin Region. Chin. J. Appl. Entomol. 2023, 60, 913–921. [Google Scholar]
  8. Chen, Y.L.; Li, W.Y.; Luo, Y.Y.; Wu, L.; Gong, J.J.; Shu, H.Q.; Li, J.Y. Occurrence Patterns and Control Strategies of Cnaphalocrocis medinalis in Jurong City from 2022 to 2024. Agric. Equip. Technol. 2025, 51, 16–20. [Google Scholar]
  9. Zhang, Z.H. Development of Remote Monitoring and Identification Equipment for Major Pests in Paddy Fields. Master’s Thesis, Shandong Agricultural University, Jinan, China, 2022. [Google Scholar] [CrossRef]
  10. Wu, L.H. Application Research of Food Attractants and Sex Attractants Under Soybean-Corn Compound Planting. Bachelor’s Thesis, Henan Agricultural University, Zhengzhou, China, 2025. [Google Scholar] [CrossRef]
  11. Sun, W.; Liu, H.F.; Zhang, Q.; Li, X.G.; Zhang, J.; Wang, Z.P.; Shi, F.M.; Zhou, J.C.; Gao, Y.B. Monitoring the Occurrence Dynamics of Loxostege sticticalis in Jilin Province Using Light Traps. J. Northeast Agric. Sci. 2025; in press. [CrossRef]
  12. Wang, R.; Ren, J.; Li, W.; Yu, T.; Zhang, F.; Wang, J. Application of Instance Segmentation to Identifying Insect Concentrations in Data from an Entomological Radar. Remote Sens. 2024, 16, 3330. [Google Scholar] [CrossRef] [Scilit]
  13. Drake, A.V.; Hao, Z.; Wang, H. Monitoring Insect Numbers and Biodiversity with a Vertical-Beam Entomological Radar. Philos. Trans. R. Soc. B Biol. Sci. 2024, 379, 20230117. [Google Scholar] [CrossRef] [Scilit] [PubMed]
  14. Jia, Q. Agricultural Pest Identification System Based on Acoustic Signal Processing. Bachelor’s Thesis, Shandong University, Jinan, China, 2016. [Google Scholar]
  15. She, J.H. Application Research on Real-Time Detection and Counting of Orchard Pests Based on Fusion of Optical Flow Method and Deep Learning Algorithm. Master’s Thesis, Yangtze University, Jingzhou, China, 2023. Available online: https://kns.cnki.net/kcms2/article/abstract?v=dKcr_PZ1zctmAGn7i-hKEPtfZa-kvKRJw8hXXoD-R-3dYds_06AYWzir0gYJuccNxJwV_JMDWAZlDnlAkCnQ6_BvMWIDeKrZ6exObPx-IfvIY2myjCqc4AMRPvGJeoaSswDdKSRA_mb2B_S9z8Ld07afZnROaWDExlj6DprCAIVmnBgJfgoSG400X-f8d47q&uniplatform=NZKPT&language=CHS (accessed on 6 January 2026).
  16. Henan Yunfei Technology Development Co., Ltd.; Institute of Plant Protection, Henan Academy of Agricultural Sciences. A Method for Pest Monitoring Based on Photographing and Identification of Individual Live Insects. China Patent CN202410721444.8, 4 June 2024. [Google Scholar]
  17. Henan Yunfei Technology Development: YFCB-IV. Available online: https://www.hnyfkj.com.cn/newshow.asp?Cid=31&Pid=5141 (accessed on 29 November 2025).
  18. Beijing Ecoman Biotechnology: IID-RS. Available online: https://www.ecomanbiotech.com/h-pd-90.html (accessed on 29 November 2025).
  19. Chengdu BEYOND Technology: IID-RD. Available online: https://www.cdbeyond.com/a/37.html (accessed on 29 November 2025).
  20. Shandong Wanxianghuanjing Technology: WX-SDX. Available online: http://www.wxqxjcz.com/pd.jsp?id=660 (accessed on 29 November 2025).
  21. Zhengzhou Deshen Electronic Technology: IMS-IML. Available online: https://item.taobao.com/item.htm?id=743385957957&mi_id=0000F21Y5xBt4mY4GmbPyoQ8g8j1BA0CKb4JbDM-44enzVI&spm=a21xtw.29178619.0.0 (accessed on 29 November 2025).
  22. Shandong Senno IoT Technology: SN. Available online: http://www.slofzx.com (accessed on 29 November 2025).
  23. Qingdao Zhice Yunlian Technology: CTID-RL. Available online: https://www.zhiceyunlian.com/zhinengjianceyitiji.html (accessed on 29 November 2025).
  24. Jiangsu Yatong Environmental Technology: D-PWIPMS. Available online: http://www.ythb.com (accessed on 29 November 2025).
  25. Owens, A.C.S.; Cochard, P.; Durrant, J.; Farnworth, B.; Perkin, E.K.; Seymoure, B. Light Pollution is a Driver of Insect Declines. Biol. Conserv. 2020, 241, 108259. [Google Scholar] [CrossRef] [Scilit]
  26. Wang, Q.-J.; Zhang, S.-Y.; Dong, S.-F.; Zhang, G.-C.; Yang, J.; Li, R.; Wang, H.-Q. Pest24: A Large-Scale Very Small Object Data Set of Agricultural Pests for Multi-Target Detection. Comput. Electron. Agric. 2020, 175, 105585. [Google Scholar] [CrossRef] [Scilit]
  27. Liu, L.L.; Wang, F.F.; Chen, C.; Guan, Y.; Liang, J.H.; Liu, Z. Study on the Application Effect of Intelligent Wind-Absorbing Solar Insect Forecasting Lamp on Vegetables. Mod. Agric. Sci. Technol. 2023, 8, 4–6+15. [Google Scholar]
  28. Wen, C.; Chen, H.; Ma, Z.; Zhang, T.; Yang, C.; Su, H.; Chen, H. Pest-YOLO: A Model for Large-Scale Multi-Class Dense and Tiny Pest Detection and Counting. Front. Plant Sci. 2022, 13, 973985. [Google Scholar] [CrossRef] [Scilit] [PubMed]
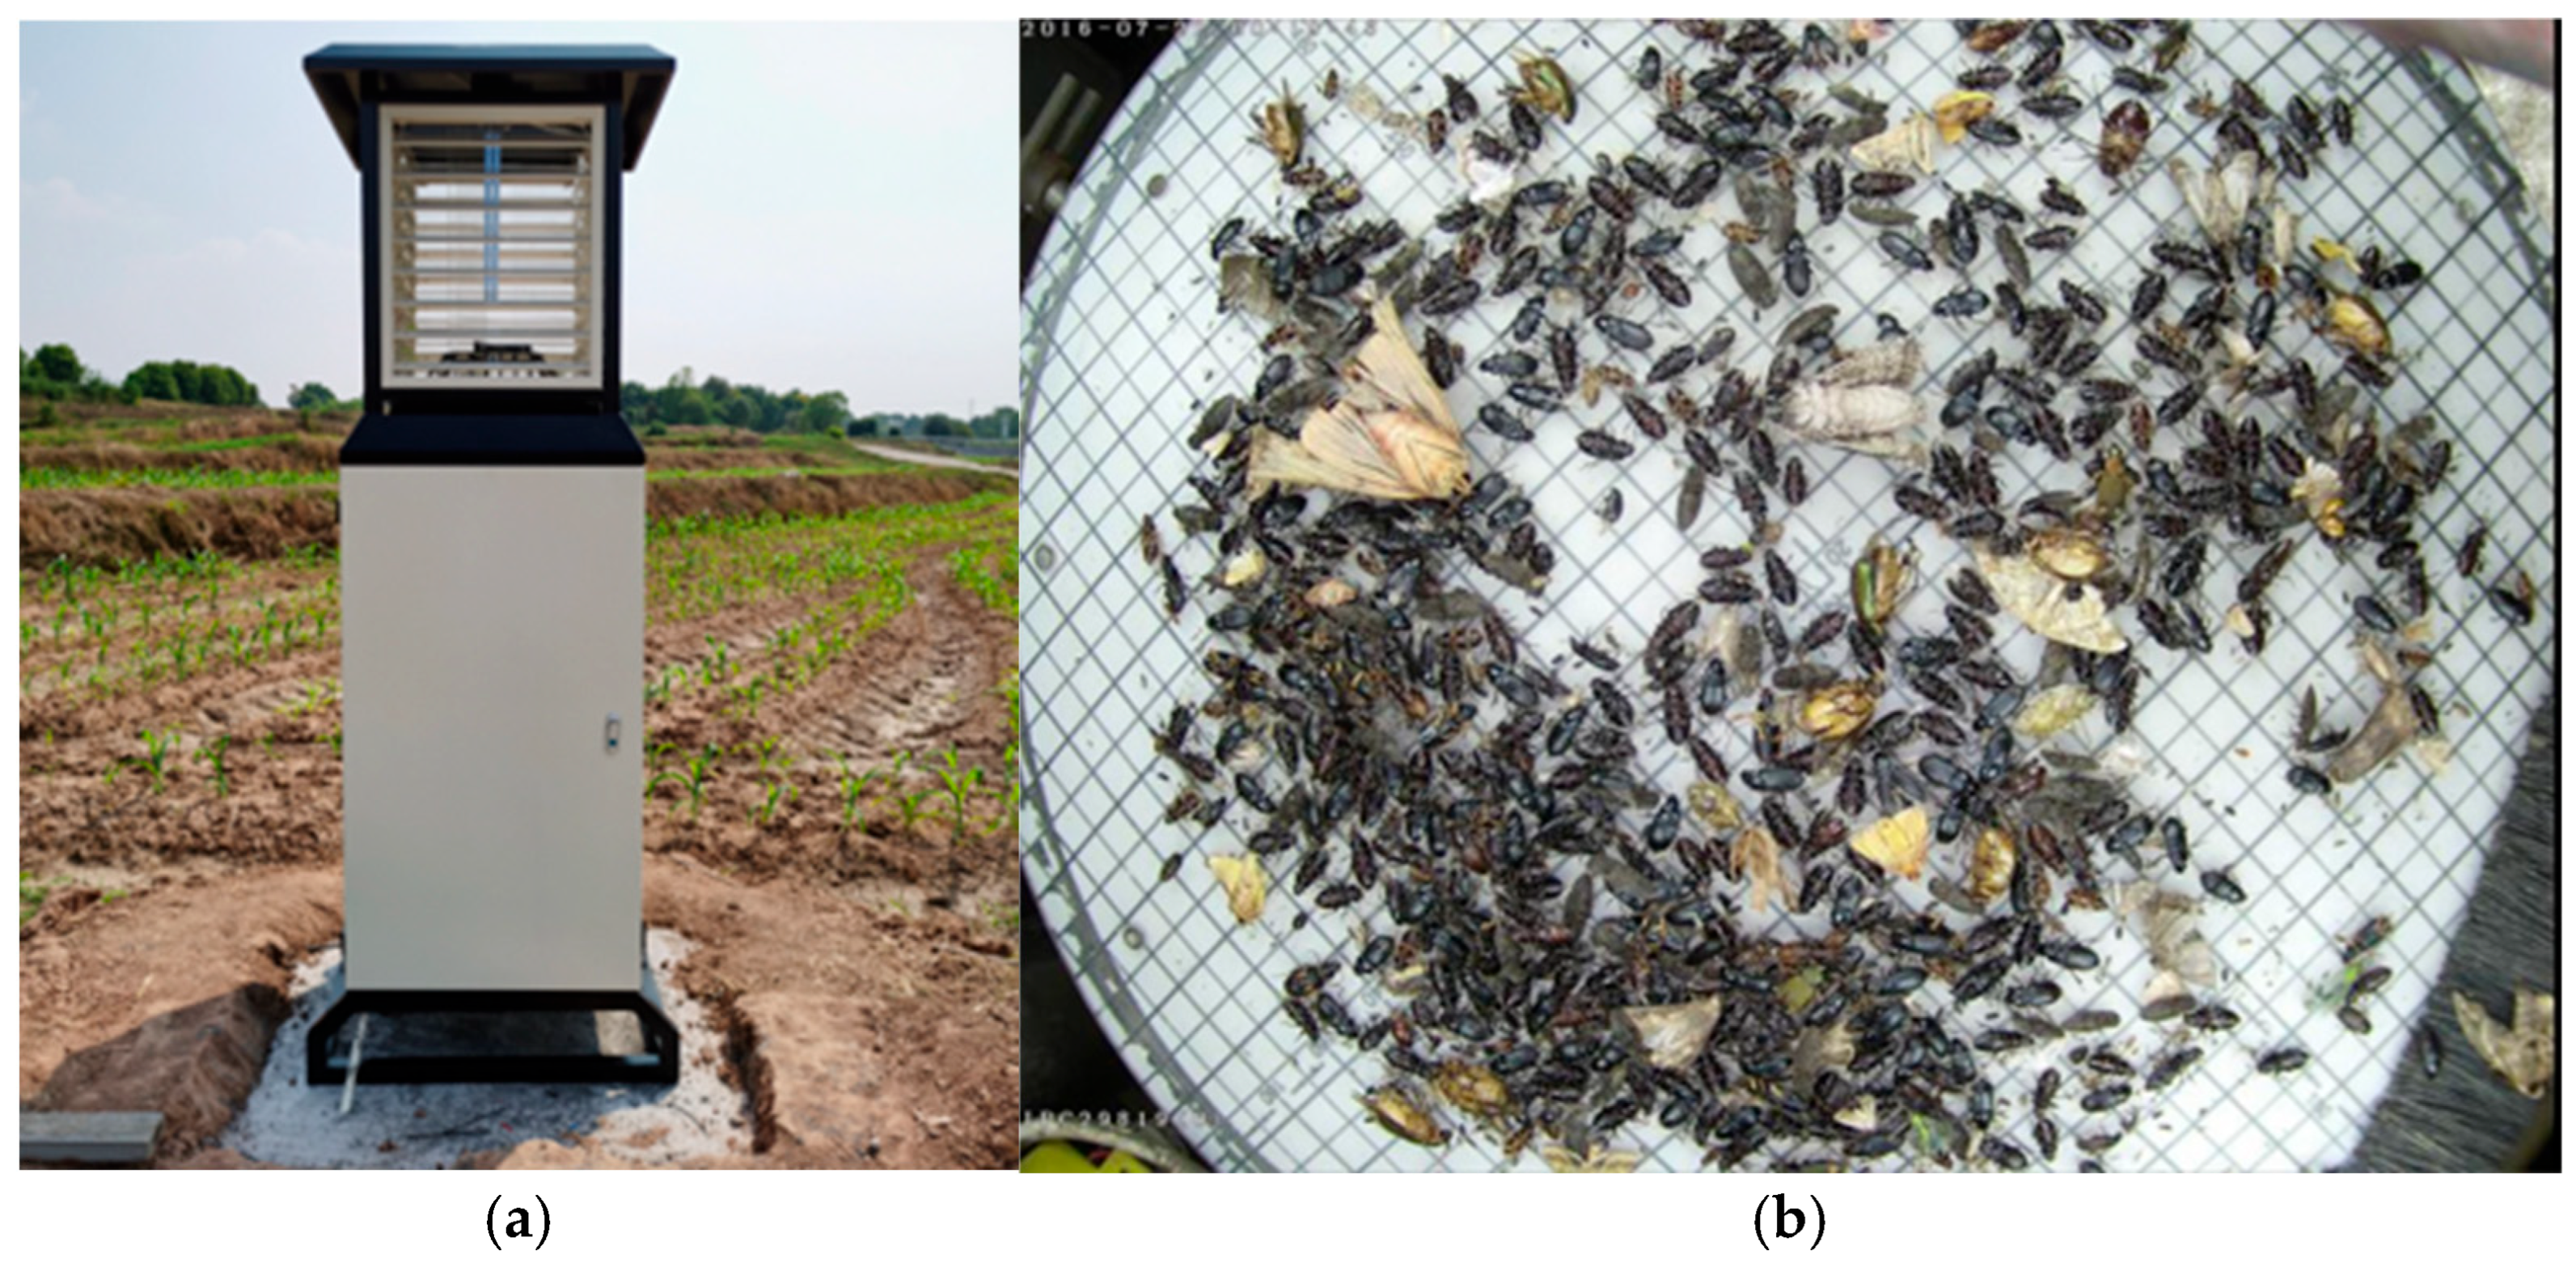
Figure 1. The automatic mechatronic device for insect image collection: (a) An insect monitoring light trap; (b) The image captured by the device (Source: The image is sourced from the dataset published by Wang et al. [26]).
Electronics 15 00714 g001
Figure 2. Comparison between a conventional lethal light-trap device (left) and the proposed non-lethal live-insect monitoring system (right).
Electronics 15 00714 g002
Figure 3. Schematic diagram of the different operating modes of the proposed live-insect monitoring system.
Electronics 15 00714 g003
Figure 4. Overall hardware structure diagram of the system (The gray box represents the control unit, the blue box represents the hardware unit, and the green box represents the relay. The yellow line represents the control line, the green line represents the signal line, and the blue line represents the power supply line).
Electronics 15 00714 g004
Figure 5. The mechanical structure diagram of WF-DTS.
Electronics 15 00714 g005
Figure 9. Schematic of the secondary control scheme. “×” indicates an unconnected (open) port.
Electronics 15 00714 g009
Figure 10. Schematic diagram for module power supply circuit.
Electronics 15 00714 g010
Figure 11. Schematic diagram for high-current loads. Arrows are standard symbols used in circuit diagrams.
Electronics 15 00714 g011
Figure 12. Schematic diagram for automatic program download/debug interface. The symbol “#” denotes specific chip pin designations.
Electronics 15 00714 g012
Figure 13. The data collection flowchart.
Electronics 15 00714 g013
Figure 14. The device was deployed in the field ((A) is a high-altitude aerial view of the Bagua Island area in Nanjing City, with farmland enclosed within the yellow solid line. (B) depicts the rice fields nearby. (C) presents a physical image of the device).
Electronics 15 00714 g014
Figure 15. Continuous image acquisition of an insect (In this figure, Holotrichia parallela is selected for demonstration).
Electronics 15 00714 g015
Figure 16. Naming convention for image data (After naming, the Latin scientific name of the insect was added).
Electronics 15 00714 g016
Figure 17. Confusion matrix normalized. The “Background” class denotes frames with no insect present (empty white imaging panel).
Electronics 15 00714 g017
Figure 18. Training and validation loss and accuracy curves generated by the object detection model.
Electronics 15 00714 g018
Figure 19. F1-score confidence curve graph.
Electronics 15 00714 g019
Figure 20. Precision–confidence curve.
Electronics 15 00714 g020
Figure 21. Precision–recall (P–R) curves.
Electronics 15 00714 g021
Figure 22. Recall–confidence curve.
Electronics 15 00714 g022
Table 3. The main parameters of this device.
TypeParameter
CameraCamera model: IMX377
Module dimensions: 38 mm × 38 mm
Operating Temperature: −20 °C to 70 °C
Resolution: 1920 × 1080 pixels
Focal length: 4.2 mm
Sensor Size: 1/2.3″
Water pumpPump flow rate: 1200 L/h
Pump head: 3.3 m
Voltage: 12 V
Power supply componentsSolar panel: 60 W (max) × 2
Battery type: Lead-acid battery
Battery capacity: 12 V/80 Ah
Estimated operating time: 48 h
Table 4. Complete data display.
Image DisplayLatin NameNumber of ImagesImage DisplayLatin NameNumber of Images
Electronics 15 00714 i001Tessaratoma papillosa (Drury, 1770)915Electronics 15 00714 i002Eurygaster integriceps (Puton, 1881)930
Electronics 15 00714 i003Cnaphalocrocis medinalis (Guenée, 1854)1097Electronics 15 00714 i004Harpalus griseus (Panzer, 1796)153
Electronics 15 00714 i005Velarifictorus aspersus (Walker, 1869)228Electronics 15 00714 i006Helicoverpa armigera (Hübner, 1808)1020
Electronics 15 00714 i007Amsacta lactinea (Cramer, 1777)123Electronics 15 00714 i008Pelopidas agna (Moore, 1865)102
Electronics 15 00714 i009Harpalus rufipes (De Geer, 1774)640Electronics 15 00714 i010Plautia fimbriata (Fabricius, 1787)920
Electronics 15 00714 i011Chlaenius rufipes (Dejean, 1826)601Electronics 15 00714 i012Coccinella septempunctata (Linnaeus, 1758)985
Electronics 15 00714 i013Sycanus croceovittatus (Dohrn, 1859) 187Electronics 15 00714 i014Amathes kollari (Lederer, 1853)71
Electronics 15 00714 i015Cybister tripunctatus (Olivier, 1795)359Electronics 15 00714 i016Physopelta gutta (Burmeister, 1834)122
Electronics 15 00714 i017Holotrichia parallela (Motschulsky, 1854)1185Electronics 15 00714 i018Carabus manifestus (Kraatz, 1881)215
Electronics 15 00714 i019Hydrophilus acuminatus (Motschulsky, 1854)885Electronics 15 00714 i020Spodoptera litura (Fabricius, 1775)88
Electronics 15 00714 i021Ostrinia furnacalis (Guenée, 1854)118Electronics 15 00714 i022Theretra oldenlandiae (Fabricius, 1775)57
Electronics 15 00714 i023Calospilos suspecta (Warren, 1894)106
Table 5. Experimental environment and parameter settings.
TypeParameter
Operating systemWindows 11
CPUIntel Core i5-13490F
GPUNVIDIA RTX 4070 SUPER
Python3.8.8
Pytorch2.3.1
Cuda12.1.1
OptimizerThe Adam optimizer (PyTorch)
Epochs100
Initial learning rate1 × 10−2
Batch size36
Disclaimer/Publisher’s Note: The statements, opinions and data contained in all publications are solely those of the individual author(s) and contributor(s) and not of MDPI and/or the editor(s). MDPI and/or the editor(s) disclaim responsibility for any injury to people or property resulting from any ideas, methods, instructions or products referred to in the content.