Article

Heterogeneous Multi-Domain Dataset Synthesis to Facilitate Privacy and Risk Assessments in Smart City IoT

1
Department of Electrical and Computer Engineering, University of Nebraska-Lincoln, Lincoln, NE 68588, USA
2
Oak Ridge National Laboratory, Oak Ridge, TN 37831, USA
*
Author to whom correspondence should be addressed.
Current address: School of Electrical Engineering and Computer Science, Oregon State University, Corvallis, OR 97331, USA.
Electronics 2026, 15(3), 692; https://doi.org/10.3390/electronics15030692
Submission received: 23 December 2025 / Revised: 30 January 2026 / Accepted: 2 February 2026 / Published: 5 February 2026

Abstract

The emergence of the Smart Cities paradigm and the rapid expansion and integration of Internet of Things (IoT) technologies within this context have created unprecedented opportunities for high-resolution behavioral analytics, urban optimization, and context-aware services. However, this same proliferation intensifies privacy risks, particularly those arising from cross-modal data linkage across heterogeneous sensing platforms. To address these challenges, this paper introduces a comprehensive, statistically grounded framework for generating synthetic, multimodal IoT datasets tailored to Smart City research. The framework produces behaviorally plausible synthetic data suitable for preliminary privacy risk assessment and as a benchmark for future re-identification studies, as well as for evaluating algorithms in mobility modeling, urban informatics, and privacy-enhancing technologies. As part of our approach, we formalize probabilistic methods for synthesizing three heterogeneous and operationally relevant data streams—cellular mobility traces, payment terminal transaction logs, and Smart Retail nutrition records—capturing the behaviors of a large number of synthetically generated urban residents over a 12-week period. The framework integrates spatially explicit merchant selection using K-Dimensional (KD)-tree nearest-neighbor algorithms, temporally correlated anchor-based mobility simulation reflective of daily urban rhythms, and dietary-constraint filtering to preserve ecological validity in consumption patterns. In total, the system generates approximately 116 million mobility pings, 5.4 million transactions, and 1.9 million itemized purchases, yielding a reproducible benchmark for evaluating multimodal analytics, privacy-preserving computation, and secure IoT data-sharing protocols. To show the validity of this dataset, the underlying distributions of these residents were successfully validated against reported distributions in published research. We present preliminary uniqueness and cross-modal linkage indicators; comprehensive re-identification benchmarking against specific attack algorithms is planned as future work. This framework can be easily adapted to various scenarios of interest in Smart Cities and other IoT applications. By aligning methodological rigor with the operational needs of Smart City ecosystems, this work fills critical gaps in synthetic data generation for privacy-sensitive domains, including intelligent transportation systems, urban health informatics, and next-generation digital commerce infrastructures.

1. Introduction

The rapid expansion of the Internet of Things (IoT) has become a foundational enabler of the Smart City paradigm, fundamentally reshaping the collection, integration, and utilization of behavioral traces across urban, commercial, and healthcare environments within our modern cities and lifestyles. Tens of billions of interconnected devices now generate continuous streams of fine-grained signals through cellular and residential networks, payment terminal ecosystems, geolocation services, wearable health monitors, and sensor-rich retail systems. These pervasive sensing modalities enable and support personalized services, real-time situational awareness, emergency management, and data-driven urban planning. However, they simultaneously introduce significant privacy risks, as the high temporal and spatial resolution of IoT data can facilitate sensitive inferences and cross-modal re-identification at both individual and population scales.
A central source of risk is that IoT traces are inherently behavioral, high-dimensional, and highly stable over time for a given user and their corresponding behavioral traits. Even when explicit identifiers, such as names and account numbers, are removed, the combination of location, timestamps, and merchant identifiers often suffices for unique re-identification of individuals within large datasets [1]. That risk of re-identification is the key motivation behind privacy preservation techniques such as Differential Privacy [2,3]. Thus, as IoT deployments proliferate and data from various multimodal application domains are increasingly combined, the potential for cross-modal linkage attacks grows significantly. Understanding and quantifying these risks in realistic scenarios is thus essential for designing effective technical and regulatory safeguards while also protecting the benefits and capabilities of Smart City IoT.
Conventional anonymization approaches, such as k-anonymity and -diversity, were developed for relatively low-dimensional tabular data and offer limited protection against linkage attacks on rich, multimodal behavioral traces. Seminal work by de Montjoye et al. showed that four randomly selected spatio-temporal points from cellular network logs uniquely identify 95% of individuals in a 1.5 million-user mobility dataset [4]. Similar results were later demonstrated for financial transaction data: combinations of a few merchant identifiers and coarse timestamps can lead to re-identification of the majority of users, even after removal of direct identifiers [1]. These findings highlight that human mobility and spending patterns are far more distinctive than previously assumed, and that even coarse-grained, partially perturbed data can remain highly identifying.
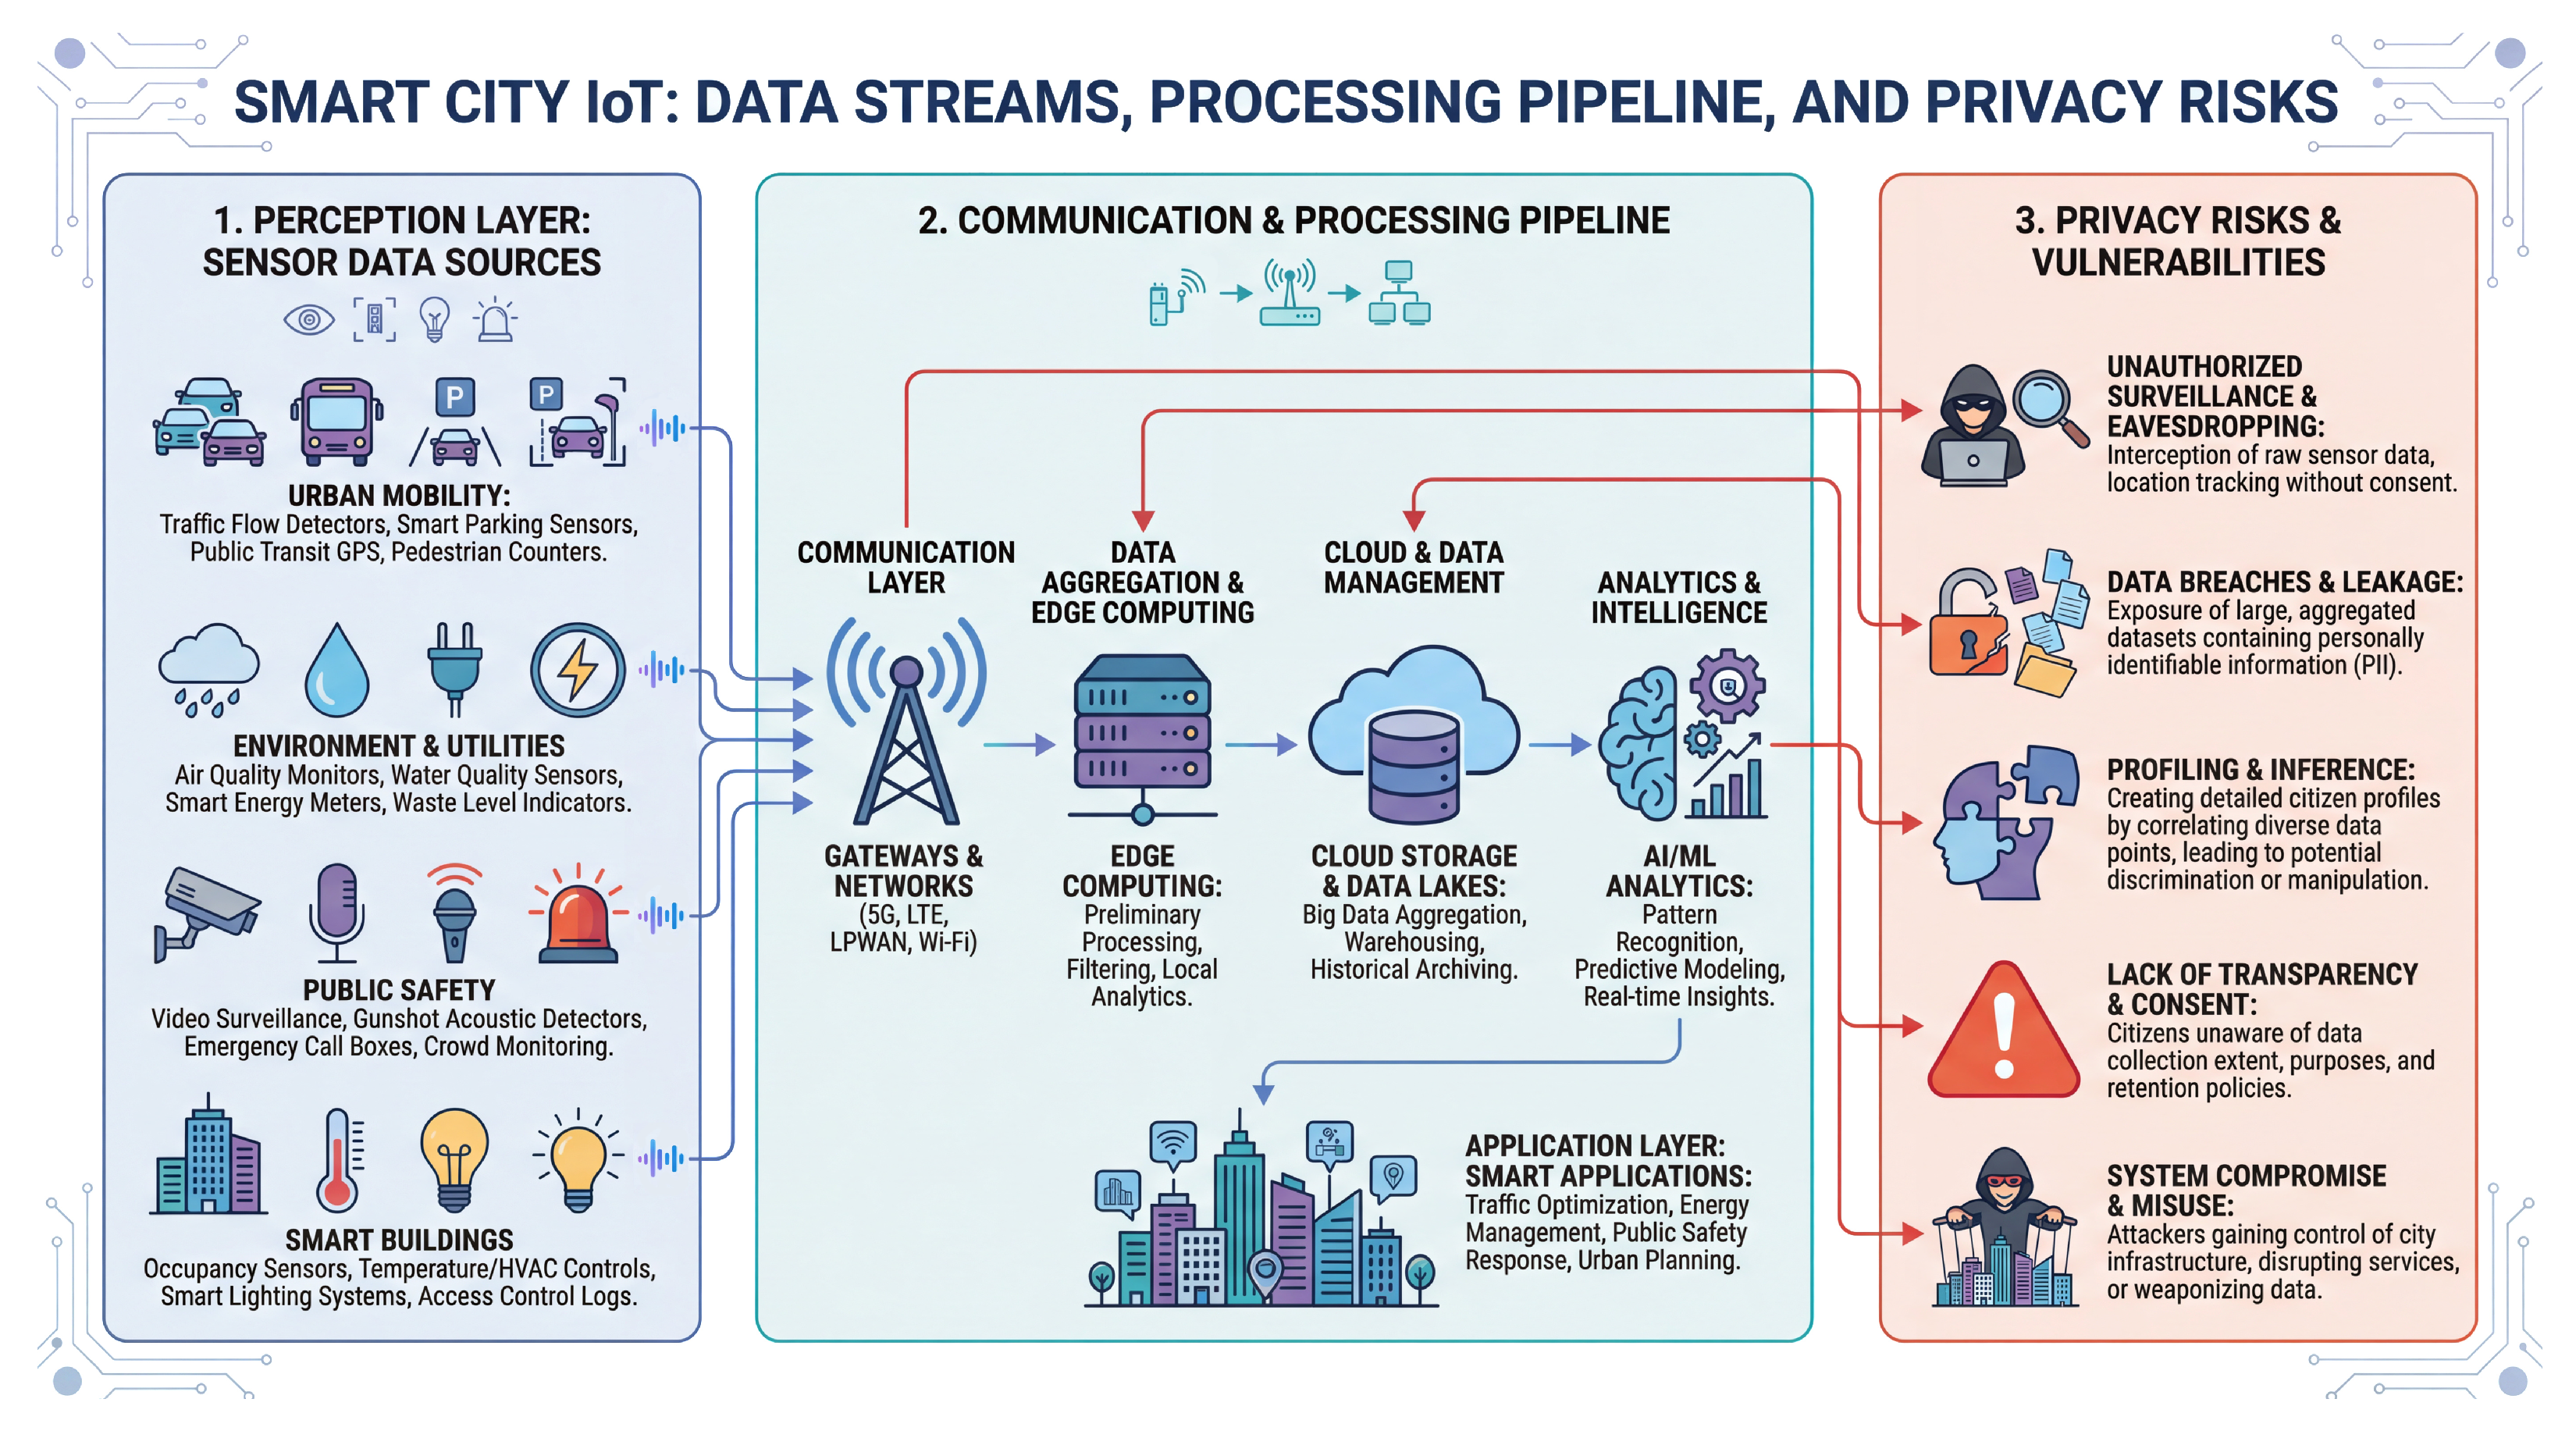
These vulnerabilities are not purely theoretical. High-profile data breaches and unauthorized data-sharing incidents have exposed millions of individuals to identity theft, profiling, and surveillance [5]. An overview of possible threats is outlined in Figure 1. In response, organizations are increasingly exploring synthetic data generation as a methodological approach to reconcile the deep tension between stringent privacy preservation requirements and the need to analyze and operationalize large-scale datasets. Instead of sharing original records, they release samples from models intended to approximate the distribution of the original data [6]. However, a growing body of work suggests that synthetic data may still encode identifying patterns, be susceptible to membership and linkage attacks, and preserve the uniqueness characteristics of the underlying population. These issues are magnified if the datasets are derived from real individuals’ records [7,8].
These concerns become even more acute in multimodal IoT settings. In realistic deployments, mobility, transaction, and domain-specific sensor streams from sources such as smart retail or health-related IoT are often observed for the same individuals. Cross-modal correlations, like the link between commuting patterns, restaurant visits, and grocery purchases, can dramatically amplify re-identification risks when multiple synthetic datasets are released independently or combined by an adversary to link to an individual dataset. Yet, most existing work and benchmarks focus on single-modality datasets and do not provide a way to systematically study cross-modal linkage attack in a controlled, privacy-audited environment.
Consequently, this work is motivated by the following questions:
  • How can we generate synthetic multimodal IoT datasets that exhibit realistic spatio-temporal and behavioral patterns across several domains while being suitable for research on privacy and linkage attacks?
  • How can such datasets be structured so that they can later be used to study uniqueness, cross-modal linkage properties, and to stress test anonymization strategies and formal privacy mechanisms before deployment on real data?
To address these questions, we develop and evaluate a unified framework for generating synthetic multimodal IoT data and assessing privacy risks. The main contributions of this paper are as follows:
1.
Unified multimodal synthesis framework:We introduce a scalable, modular pipeline for generating heterogeneous IoT datasets. Our initial framework includes support for three interconnected behavioral modalities: cellular mobility traces, payment terminal transactions, and itemized grocery purchases. The framework was utilized to produce realistic spatio-temporal correlations across 40,000 synthetic users over a 12-week time horizon, with approximately 346 mobility pings, 1.6 payment transactions, and 3.5 grocery items per user-day.
2.
Privacy-aware design: We designed this synthesis framework with privacy research applications in mind, ensuring that the generated data retains realistic behavioral structure while avoiding any direct dependence on real individuals or locations. We emphasize that this constitutes independence from real records rather than formal privacy guarantees such as differential privacy.
3.
Realism mechanisms: We incorporate a spatially constrained merchant selection approach via KD-tree nearest-neighbor search, anchor-based mobility simulation, and dietary-constraint filtering to ensure that the generated behaviors remain plausible at both the individual and aggregate level. The resulting datasets realistically reproduce key empirical patterns such as commute peaks, shopping and exercise routines, and realistic spatial clustering.
4.
Multimodal benchmark dataset: We utilized our framework to generate a large-scale synthetic dataset comprising 116 million mobility records, 5.4 million transactions, and 1.9 million nutrition entries. The dataset is designed to serve as a benchmark for evaluating anonymization techniques, differential privacy mechanisms, and machine learning models in various IoT contexts, such as city planning and healthcare, with all generative assumptions documented.

Privacy Scope and Threat Model

To clarify the privacy orientation of this work, we distinguish between two distinct notations:
1.
Not derived from real individuals: the synthetic data contains no information originating from actual persons’ records
2.
Formal privacy guarantees: Privacy guarantees such as Differential Privacy [2,3] provide mathematical bounds on informaiton leakage. This framework provides the former and does not enforce the latter
The intended use case of this work is a benchmark for studying re-identification risk under a realistic thrat model. We assume an adversary who possesses auxiliary information about a target individual, and aims to link records across modalities or to uniquely identify individuals within a single modality using sparse observations.
The remainder of this paper is organized as follows: Section 2 reviews prior work on privacy risks in IoT data, synthetic data generation techniques, and multimodal data synthesis. Section 3 describes our multimodal synthesis methodology, including user profile generation, mobility simulation, transaction modeling, and nutrition data generation. Section 4 details the software architecture and data pipeline used to implement the framework. Section 5 provides an overview and validation of the dataset created within this work, and Section 6 discusses contributions, limitations, and ethical considerations. Section 7 concludes this paper and outlines directions for future research.

2. Related Work

2.1. Privacy Risks in IoT Data

With the proliferation of IoT, numerous works have studied its benefits as well as its challenges and risks. Specifically, focusing on privacy risks emerging from public infrastructure in Smart Cities, several facets warrant closer attention.
Cellular network infrastructure generates fine-grained mobility traces as mobile devices continuously ping nearby towers to maintain connectivity. De Montjoye et al. analyzed 15 months of cellular tower data for 1.5 million users, demonstrating that 95% of individuals could be uniquely identified using only four randomly selected spatio-temporal points [4]. This remarkable result revealed that human mobility patterns exhibit far greater uniqueness attributed to each user than previously assumed, with entropy calculations showing that typical urban trajectories contain 12–18 bits of identifying information per location-timestamp pair.
The sparsity and predictability of human mobility create a fundamental tension: while accumulated mobility data can enable valuable applications (such as traffic optimization, epidemic modeling, and urban planning), individual-level trajectories remain highly distinctive and can easily be linked to identities. Even coarse-grained data, such as hourly location summaries and cell-tower-level granularity, retains sufficient uniqueness for re-identification when combined with modest auxiliary information such as home/work locations [9].
Similarly, financial transaction datasets from credit card networks, mobile payment platforms, and point-of-sale systems create complementary privacy risks. De Montjoye et al. analyzed three months of credit card transactions for 1.1 million users, showing that 90% of individuals could be uniquely re-identified using just four purchase records specified by merchant and approximate time [1]. Unlike mobility data, where users traverse continuous trajectories, transaction data exhibits extreme sparsity—the median user visits only 7–8 distinct merchants per month from tens of thousands of possible locations—in the process creating highly distinctive behavioral signatures.
Purchase timing patterns further amplify uniqueness: morning coffee purchases, lunch restaurants, evening grocery shopping, and weekend retail visits collectively form temporal fingerprints that are resilient to moderate temporal perturbation (±1–2 h). The combination of spatial (i.e., which merchants) and temporal (i.e., when visited) dimensions creates a high-dimensional feature space where individuals occupy near-unique positions [10].
Public transit systems present similar re-identification vulnerabilities through automated fare collection systems (AFC). Yang et al. examined eight days of MetroCard data from Chengdu, China, demonstrating that three randomly selected trajectory points with minute-level resolution were sufficient to uniquely identify over 90% of Metro users [11]. Even when temporal resolution was limited to hour-level granularity, 67% of users remained uniquely identifiable. The high re-identification rates persist due to the constrained movement patterns of public transit. Entry and exit points, combined with timing information, generate quasi-identifiers that distinguish individual commuters even in datasets containing millions of users [12].
Smart parking systems employing automated license plate recognition (ALPR) generate continuous location traces, enabling both real-time tracking and the reconstruction of historical trajectories [13]. Unlike transit systems with fixed station networks, parking data captures fine-grained destination information across distributed urban spaces. When vehicles are tracked across multiple parking facilities—whether through commercial parking operators, municipal systems, or private lots—the accumulated entry and exit timestamps create mobility patterns that are comparable in uniqueness to those derived from cellular tower data. License plate numbers serve as persistent identifiers that link observations across time and space, enabling trajectory assembly even when individual parking sessions appear anonymous [14]. The privacy implications extend beyond tracking: parking locations reveal sensitive destinations including medical facilities, religious institutions, political venues, and private residences.

2.2. Synthetic Data Generation Techniques

Traditional statistical simulation methods fit parametric models to original data distributions and generate samples from these models [15]. While computationally efficient and providing formal inference guarantees, these approaches struggle to capture complex nonlinear dependencies characteristic of behavioral traces. For instance, mobility patterns exhibit hierarchical structure (e.g., daily routines nested within weekly cycles), long-range temporal correlations (e.g., weekend vs. weekday behaviors), and spatial clustering (e.g., locations visited frequently) that resist parametric modeling.
Modern deep generative models, particularly Generative Adversarial Networks (GANs) [16] and Variational Autoencoders (VAEs) [17], provide flexible frameworks that can learn high-dimensional distributions. However, these models introduce new privacy vulnerabilities: membership inference attacks can determine whether a specific individual’s data was used in training [18], while model inversion attacks can reconstruct sensitive attributes from trained generators [19].
Differential privacy (DP) provides a rigorous mathematical framework for quantifying privacy loss [2]. A randomized algorithm M is ( ϵ , δ ) -is said to be differentially private if for any two adjacent datasets D and D differing in a single record, and for all possible outputs S:  
P [ M ( D ) S ] e ϵ · P [ M ( D ) S ] + δ
This formalism enables principled privacy–utility trade-offs, though practical implementations often face challenges in calibrating privacy parameters while maintaining utility for downstream tasks [20].

2.3. Multimodal Data Synthesis

Most synthetic data research focuses on unimodal generation in isolation, such as mobility traces [21], transaction records [22], or health records [23]. However, real-world IoT ecosystems generate closely correlated multimodal data streams, where behaviors in one domain, such as gym visits, correlate with behaviors in others (e.g., healthy grocery purchases, protein supplement transactions).
Few studies systematically address multimodal synthesis with cross-domain consistency. Beaulieu-Jones et al. explored clinical data sharing using privacy-preserving generative models, but focused on electronic health records rather than IoT sensor data [24]. Li et al. proposed methods for generating small multimodal datasets with preserved correlations, but did not address scalability or IoT-specific challenges [25].
This gap motivates our work: a unified framework for multimodal IoT data synthesis that preserves within-domain realism, such as plausible mobility trajectories, while maintaining cross-domain correlations (for example, showing that gym-goers tend to buy healthier groceries), and enabling systematic privacy risk assessment through this framework and its generated datasets. This gap is illustrated in Table 1.

3. Methodology

This section describes the design of our multimodal synthetic IoT data generation framework, including the overall system architecture, geographic scope, user profile modeling, and the generation of mobility, transaction, and nutrition data streams. The design goal is to produce heterogeneous datasets that exhibit realistic spatio-temporal patterns and cross-domain behavioral correlations while retaining full transparency and interpretability. We emphasize that no real-world individual data, location records, or behavioral traces are used at any stage of this framework; all coordinates, user profiles, and behavioral patterns are fully synthetic.

3.1. System Architecture

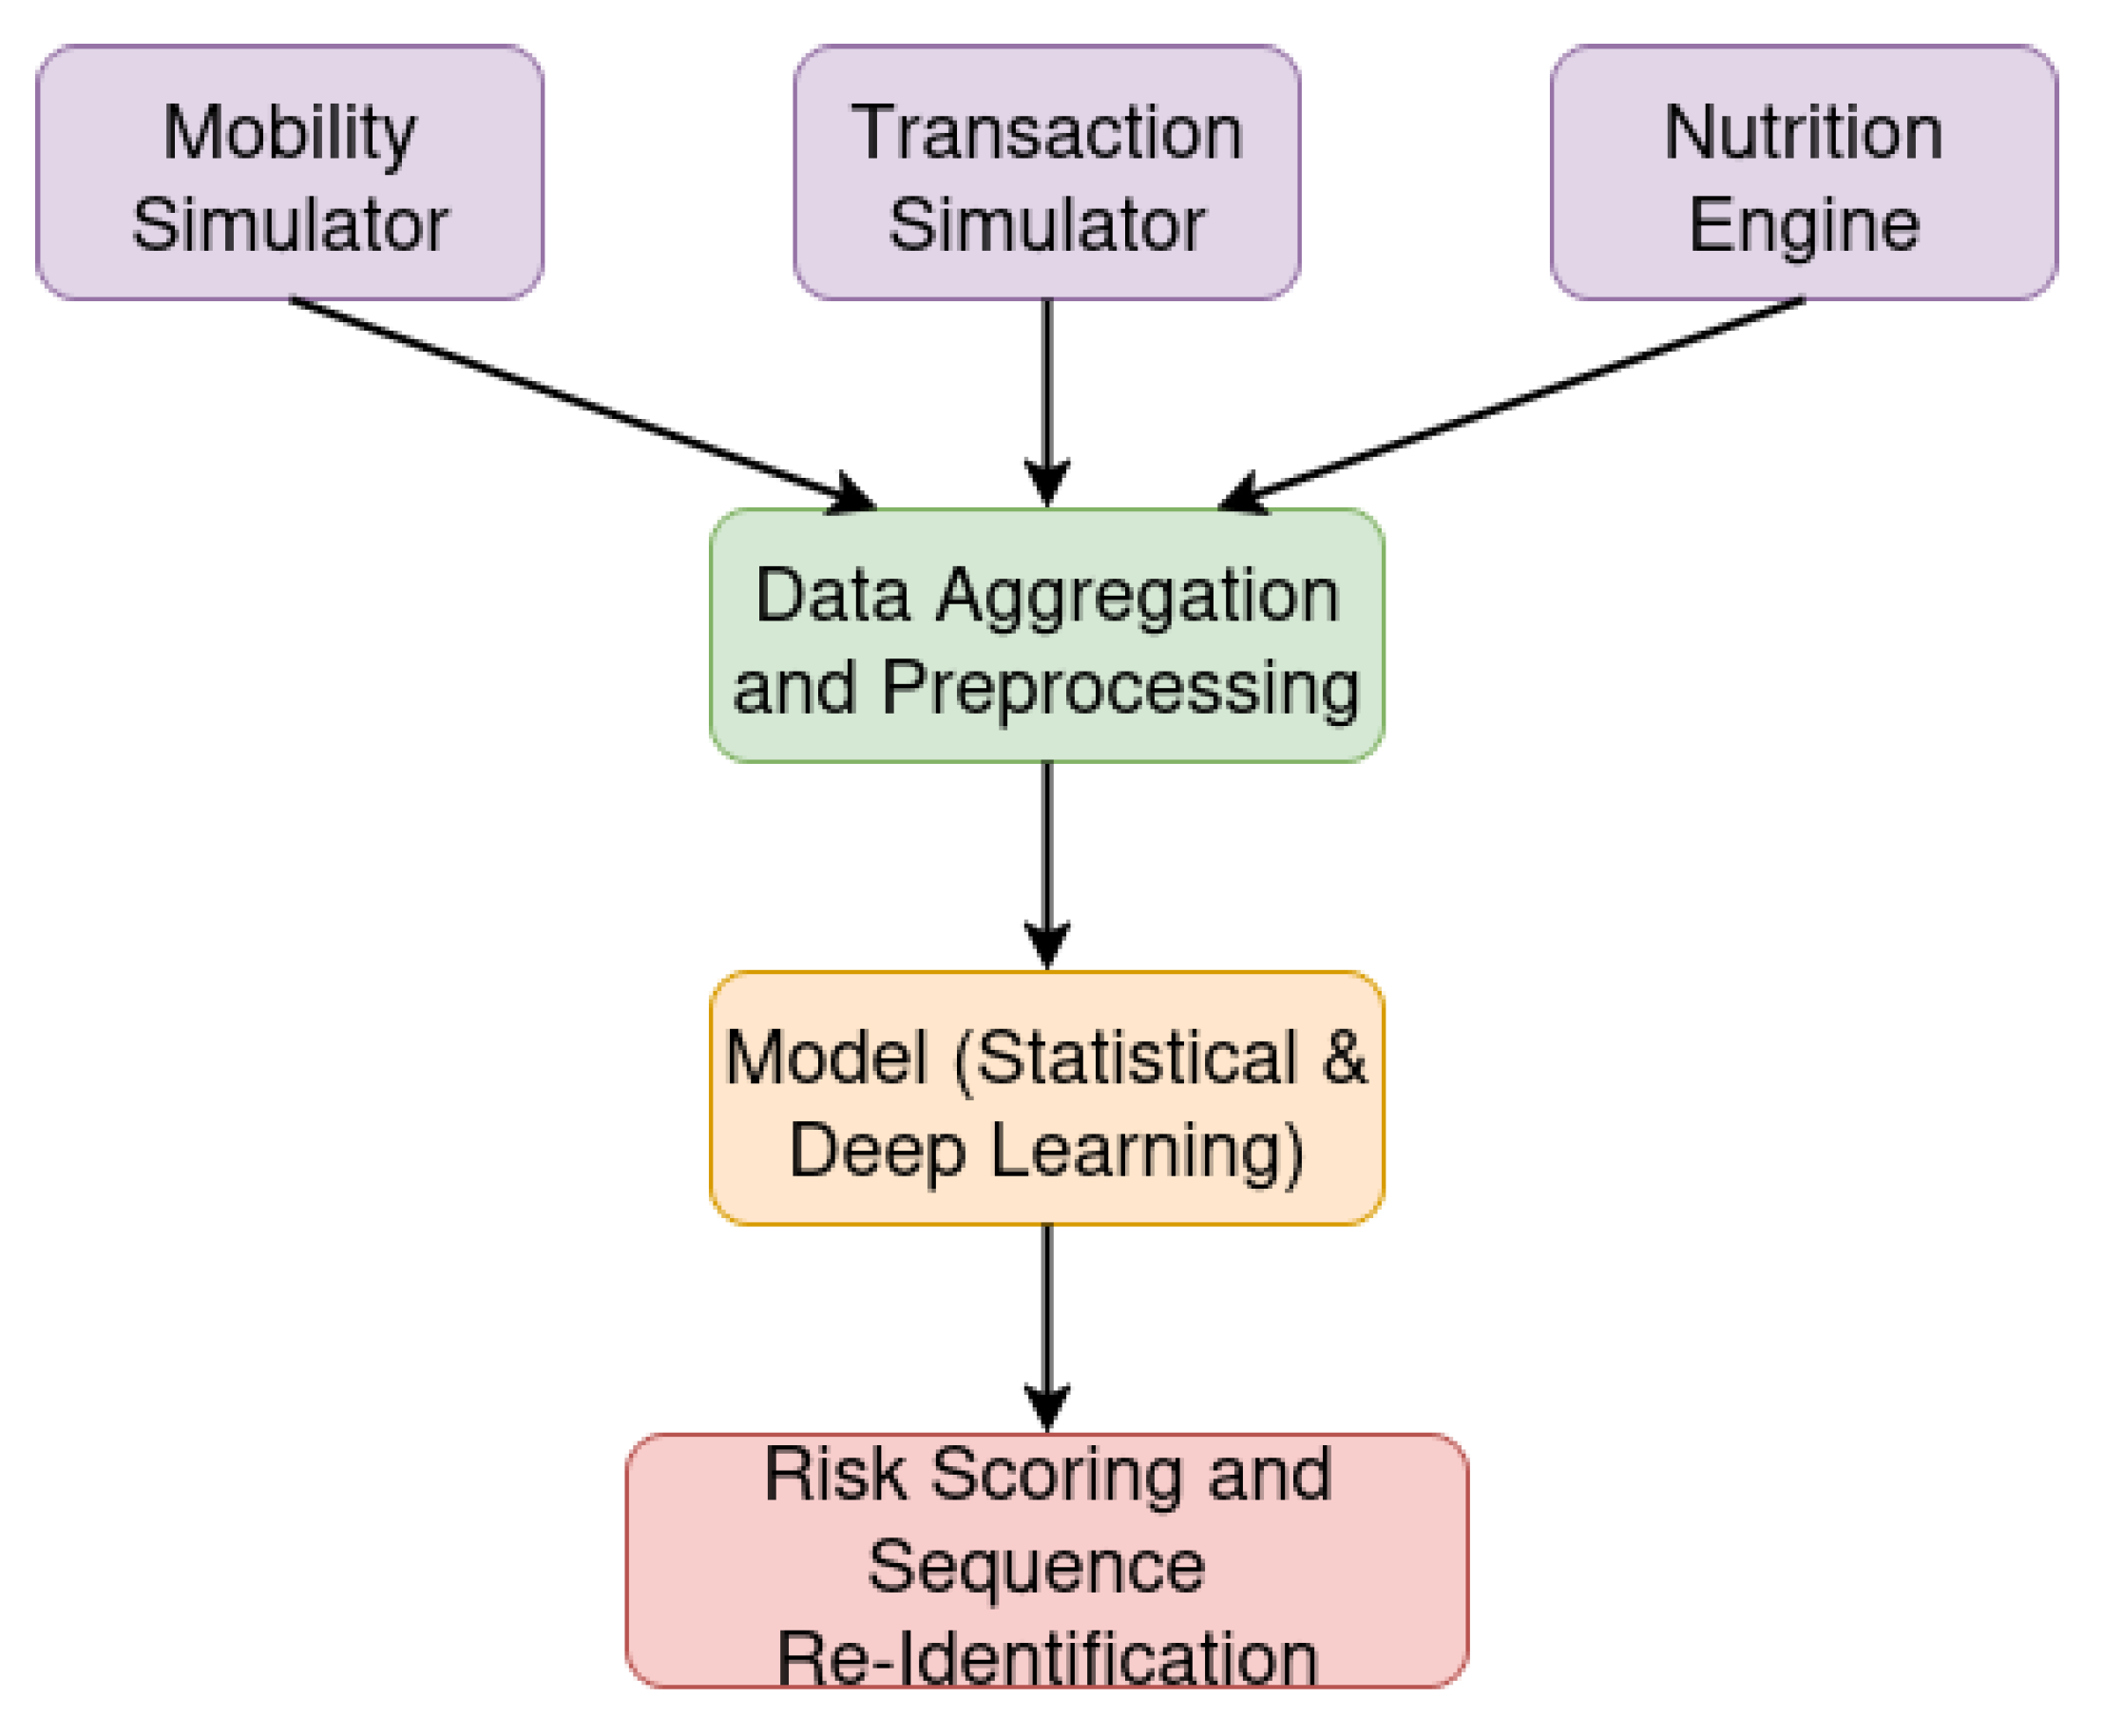
Figure 2 illustrates the architecture of the proposed synthesis framework. Five modular components operate sequentially to produce three coherent behavioral trace streams for each user:
1.
User profile generator: assigns demographic, mobility, exercise, shopping, and dietary attributes that collectively determine per-user behavioral tendencies.
2.
Mobility simulator: generates cellular tower ping sequences using anchor-based state machines and interpolated transit paths.
3.
Transaction simulator: produces payment terminal transactions based on spatial proximity, temporal context, merchant category, and user budget constraints.
4.
Nutrition engine: generates itemized grocery basket contents aligned with dietary profiles and merchant categories.
5.
Aggregation layer: integrates outputs across modalities and exports them into relational tables and columnar storage formats.
The modular design enables independent modification in each behavioral modality while preserving shared user profiles and all cross-modal dependencies.

3.2. Geographic Scope and Synthetic Population

All synthetic behaviors are generated within a realistic but fully artificial representation of a metropolitan region. The simulation space spans approximately 312 km2 with a population density comparable to that of an urban environment, chosen randomly to represent a city [27]. For the geographical area represented in our simulation, we randomly selected a metropolitan area from within the continental United States, which resulted in the selection of the greater Boston area, without any explicit or implied correlation to Boston’s street network, residents, or infrastructure.
We configured our framework to simulate 40,000 users, corresponding to approximately 2.1% of the region’s true population. This scale provides a sufficiently diverse population to capture heterogeneous routines, such as irregular commuting or varied dietary behavior, while maintaining tractable computational requirements. No real locations or user traces are used. All location coordinates, infrastructures, and behaviors are fully synthetic, driven by the configured generator properties.

3.3. User Profile Generation

Each synthetic user is assigned a behavioral profile that determines activity frequency, spatio-temporal movement, and consumer choices across all modalities. The generation process proceeds through three stages.

3.3.1. Demographic and Location Assignment

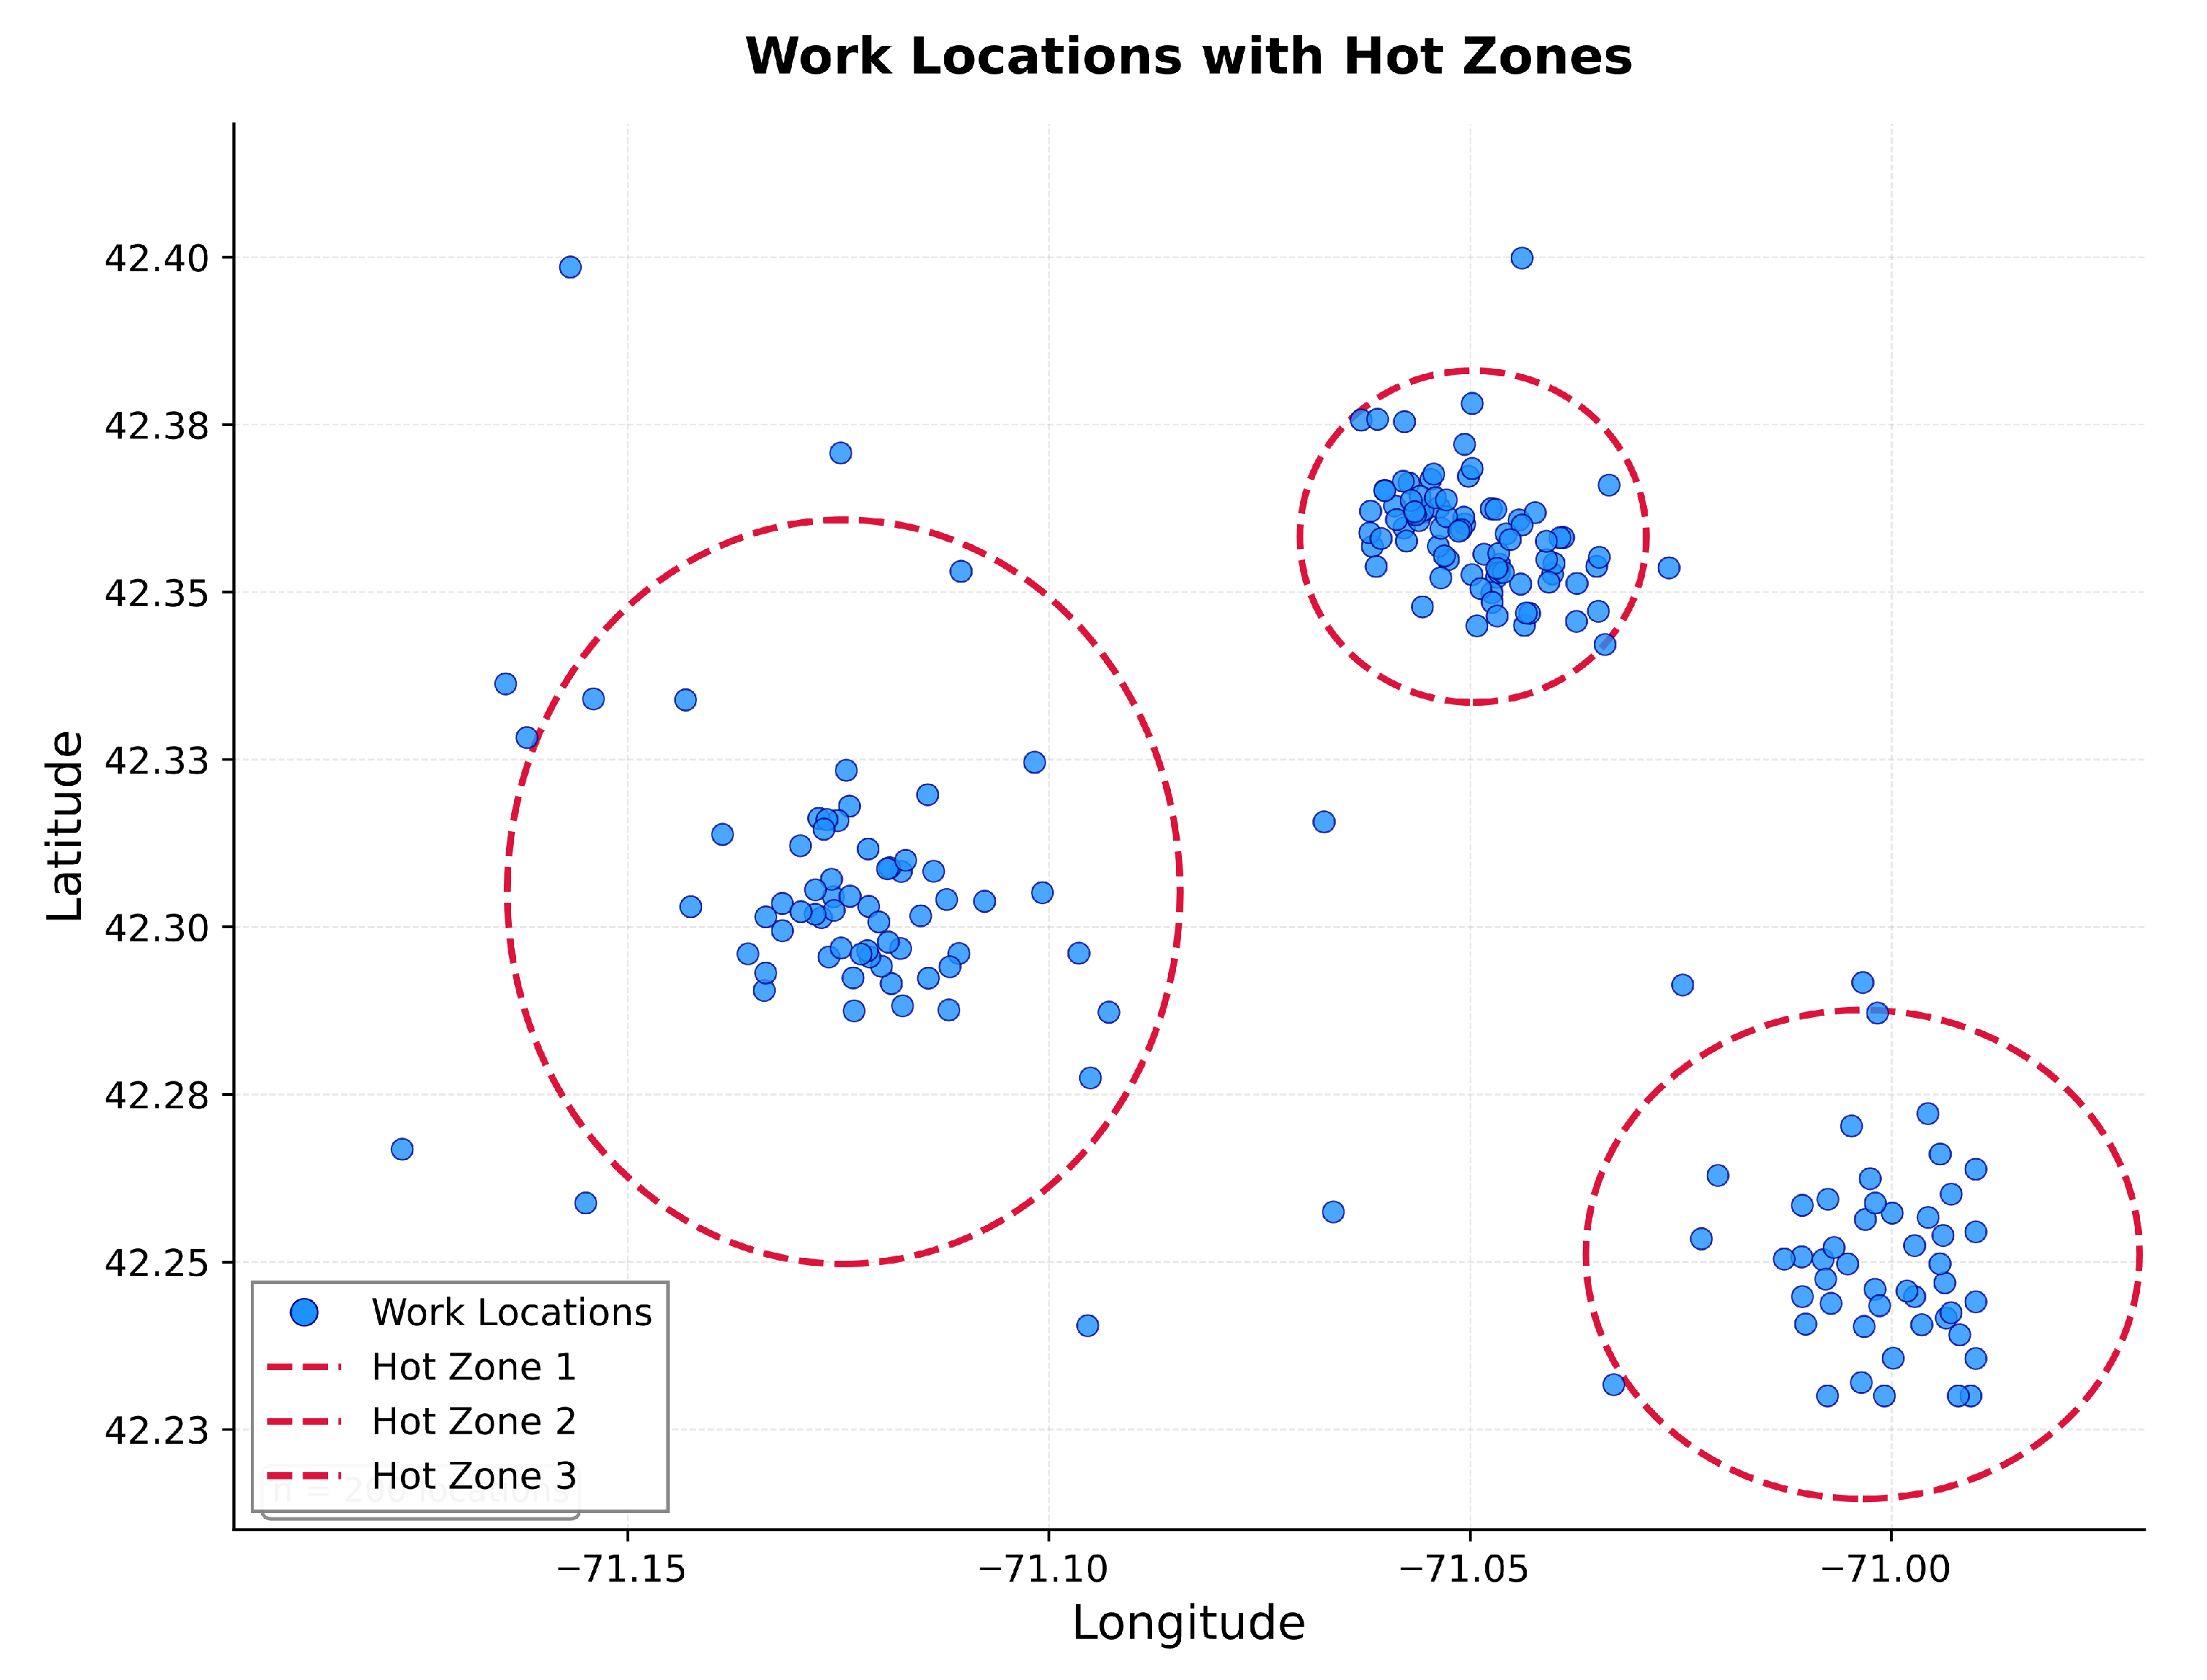
Home locations: Residential home location coordinates are sampled from a kernel density estimate fitted to synthetic population distributions. Locations are randomly jittered by 50 to 100 m to represent building-level variation. To create realistic residential–commercial spatial separation, home locations are explicitly separated from the three commercial work “hot zones” shown in Figure 3. Specifically, we enforce a minimum exclusion radius around each work zone center to prevent residential placement in areas that would realistically be dominated by office buildings, warehouses, and commercial infrastructure.
Work locations: Users are assumed to be full-time workers (approx. 71% of U.S. adults [28]). Workplaces are drawn from three commercial “hot zones” that approximate the spatial structure of three different districts, shown in Figure 3. Work start times are uniformly distributed across three distinct values: 7:00 a.m., 8:00 a.m., and 9:00 a.m. From the chosen start time, 9 h are then allocated before the end of the work time is reached.

3.3.2. Exercise Behavior

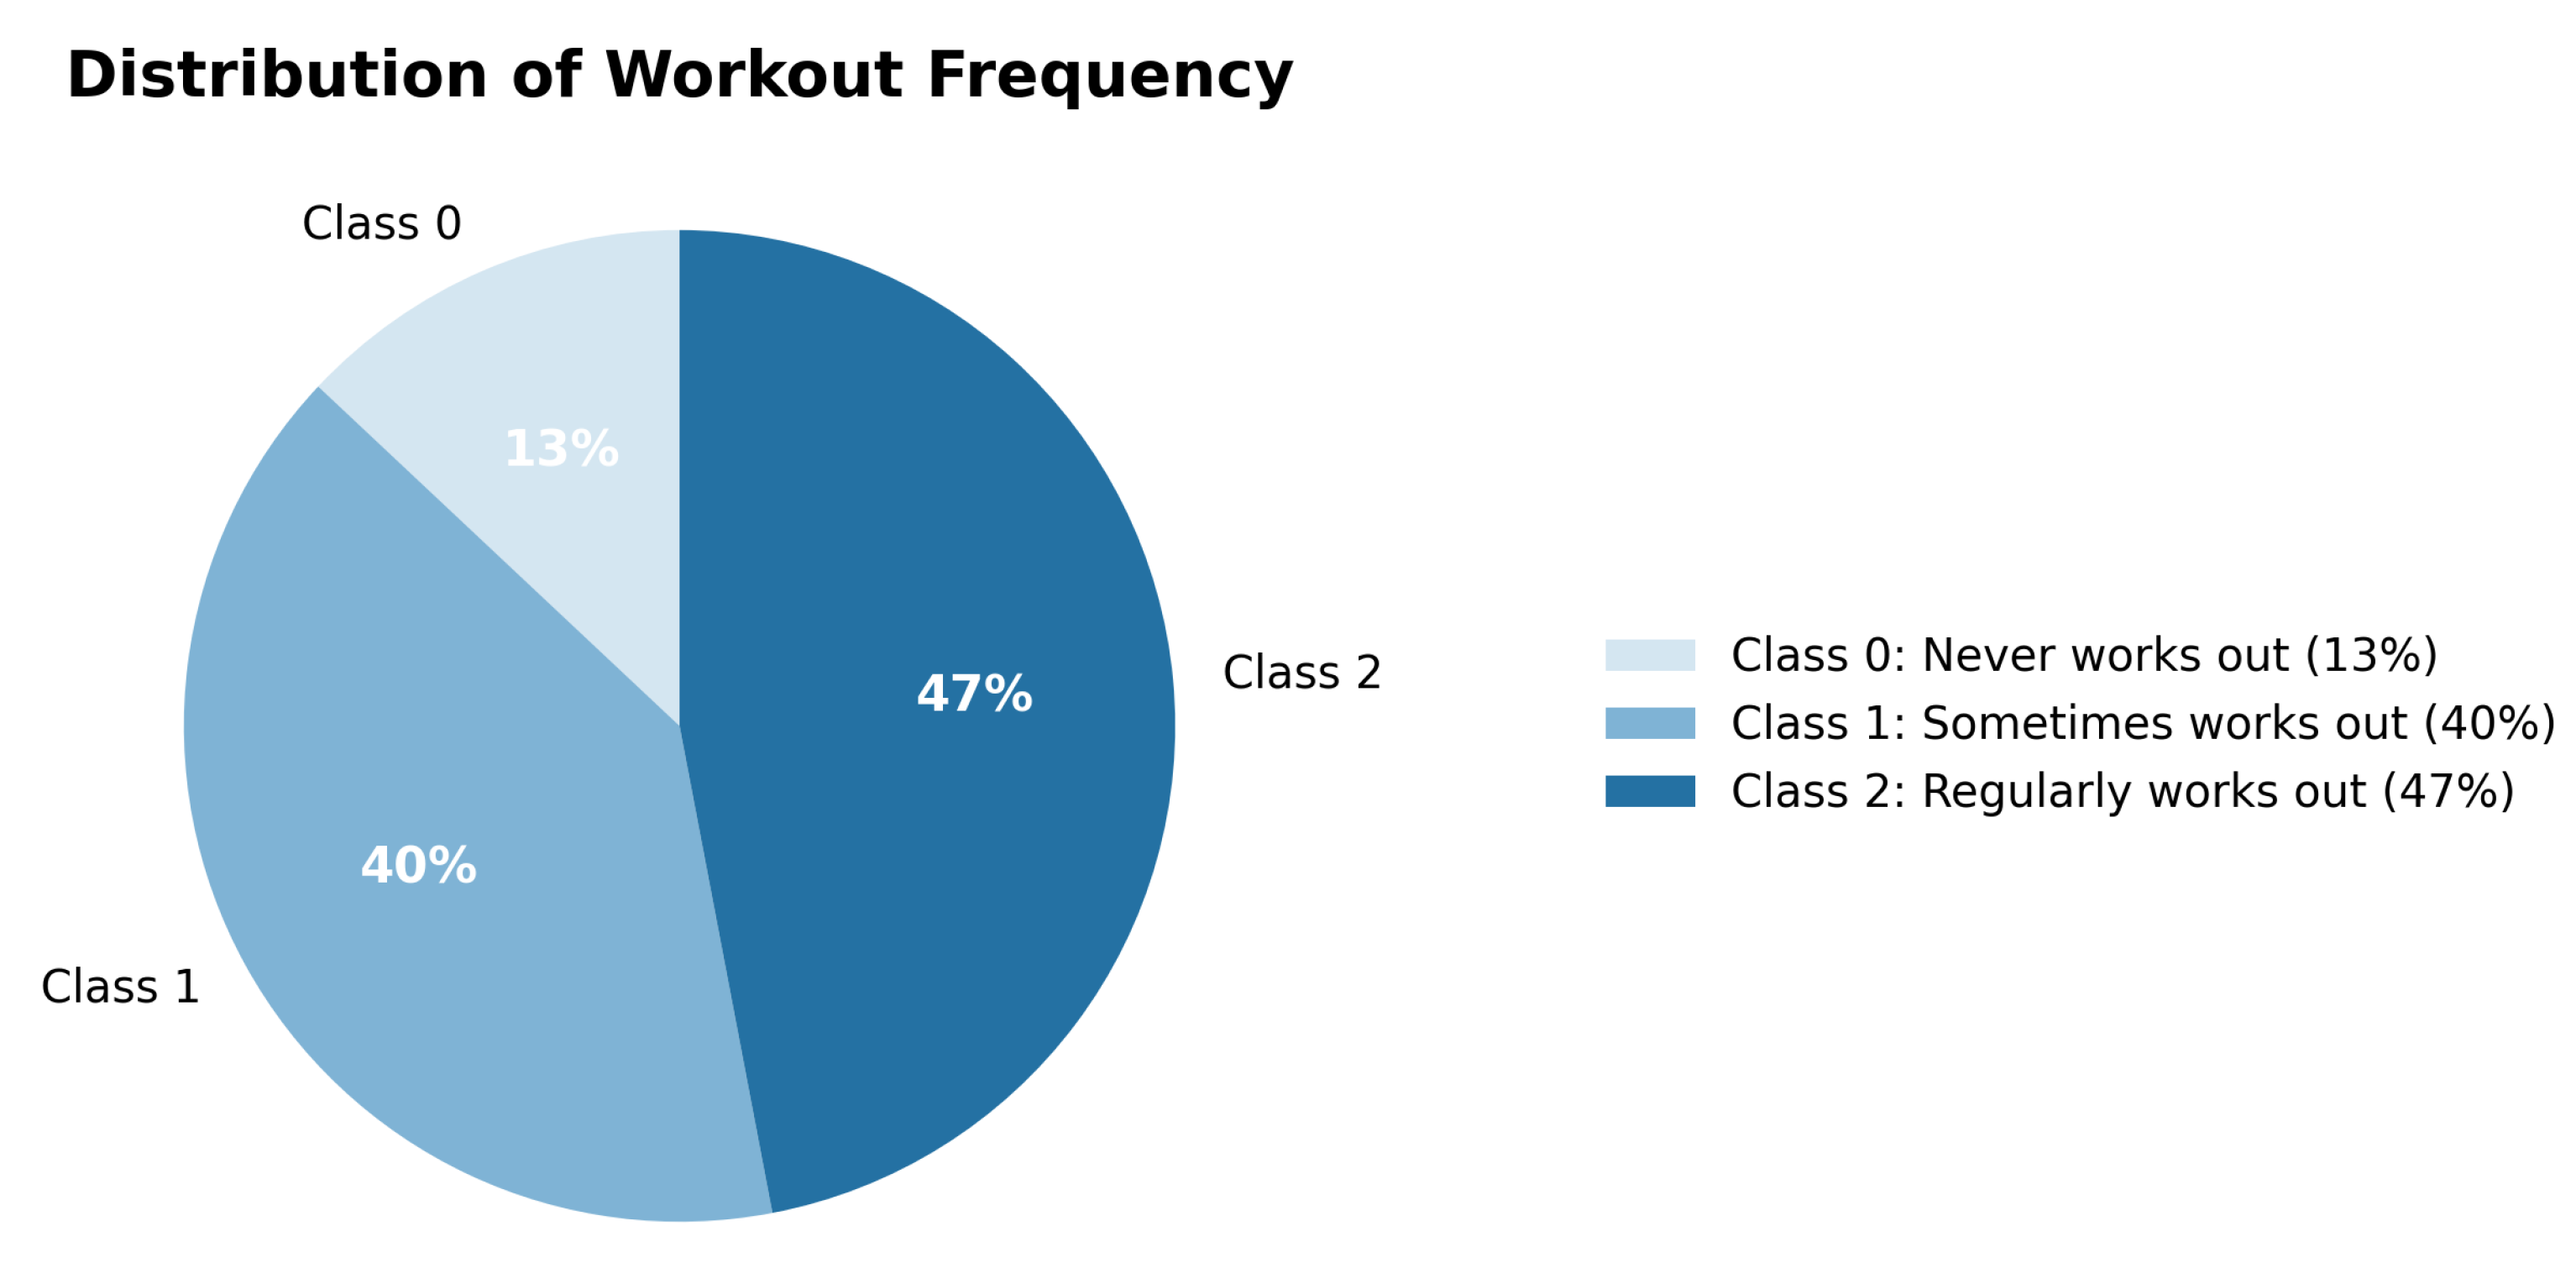
Weekly exercise behavior, such as workout frequency, follows national statistics [29]. In our framework, informed by the aforementioned statistics, we define exercise as belonging to one of three distinct classes. Class 0 (the “never” class) reflects individuals who have not exercised in the last 30 days. The “Occasional” class indicates individuals who do not meet recommended exercise levels and exercise fewer than two times a week. Finally, the “regular” class denotes simulated individuals who exercise more than twice a week. These classes of workout frequency are shown in Figure 4.
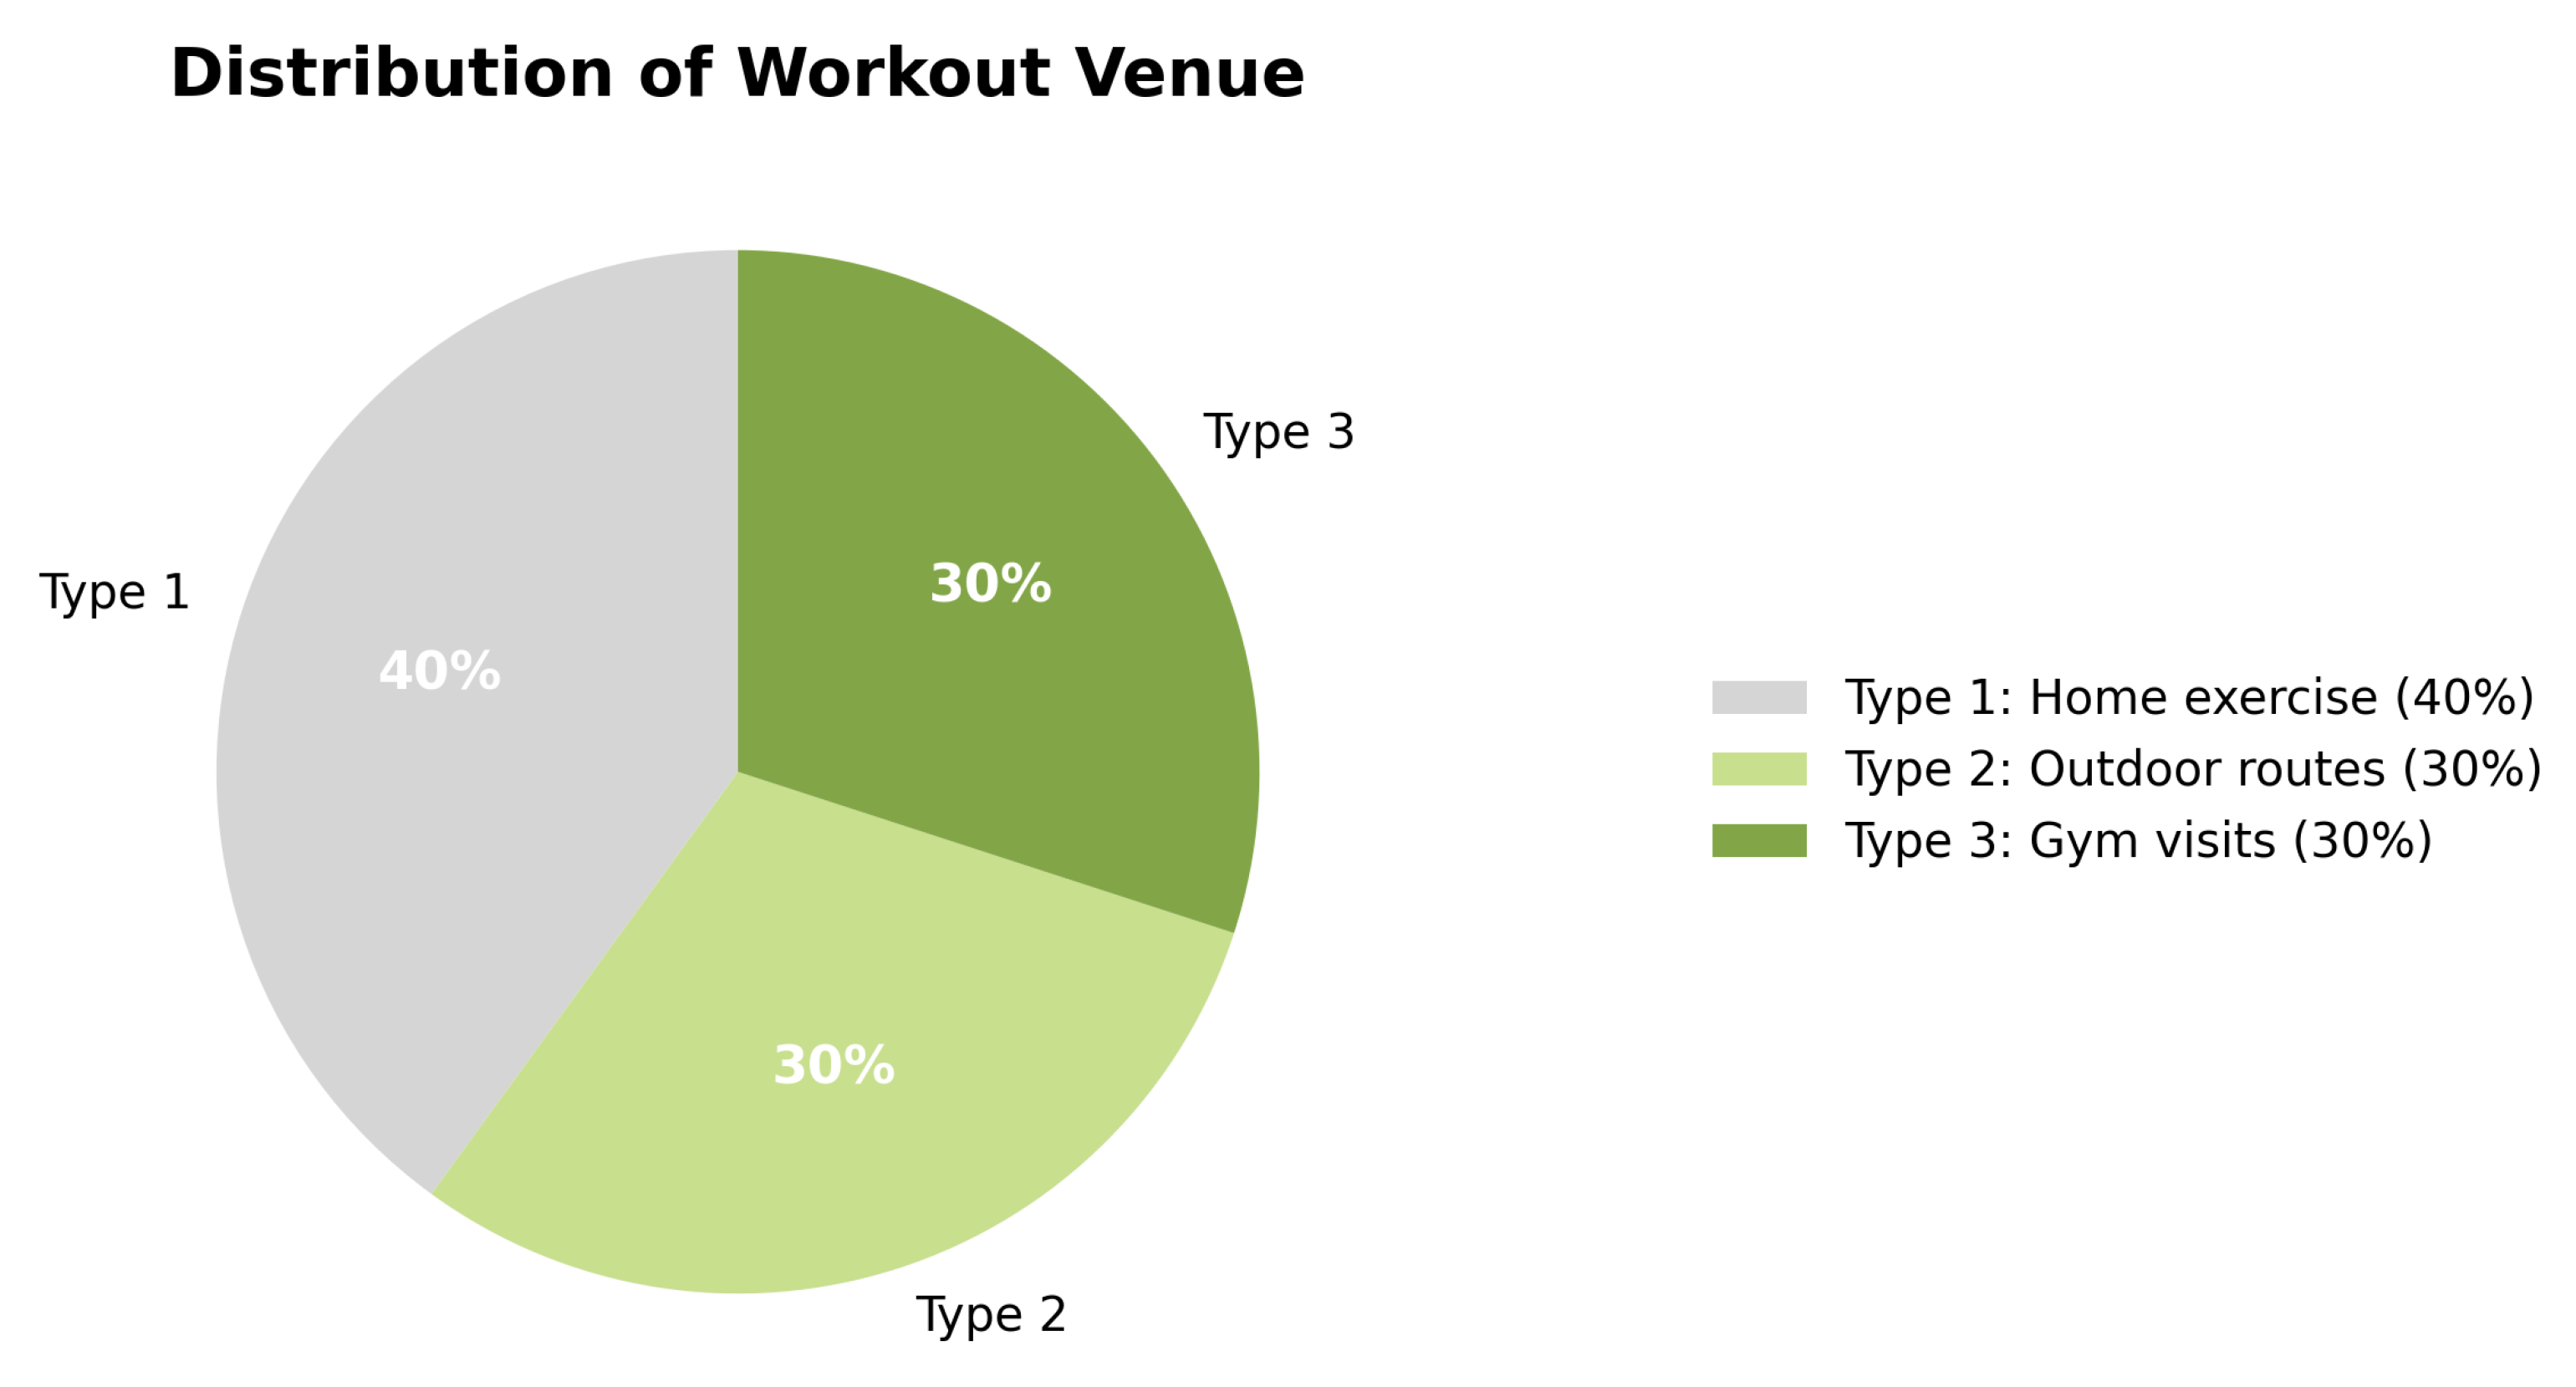
Additionally, each exercising user is assigned a preferred exercise venue as denoted by the following three categories, shown in Figure 5.
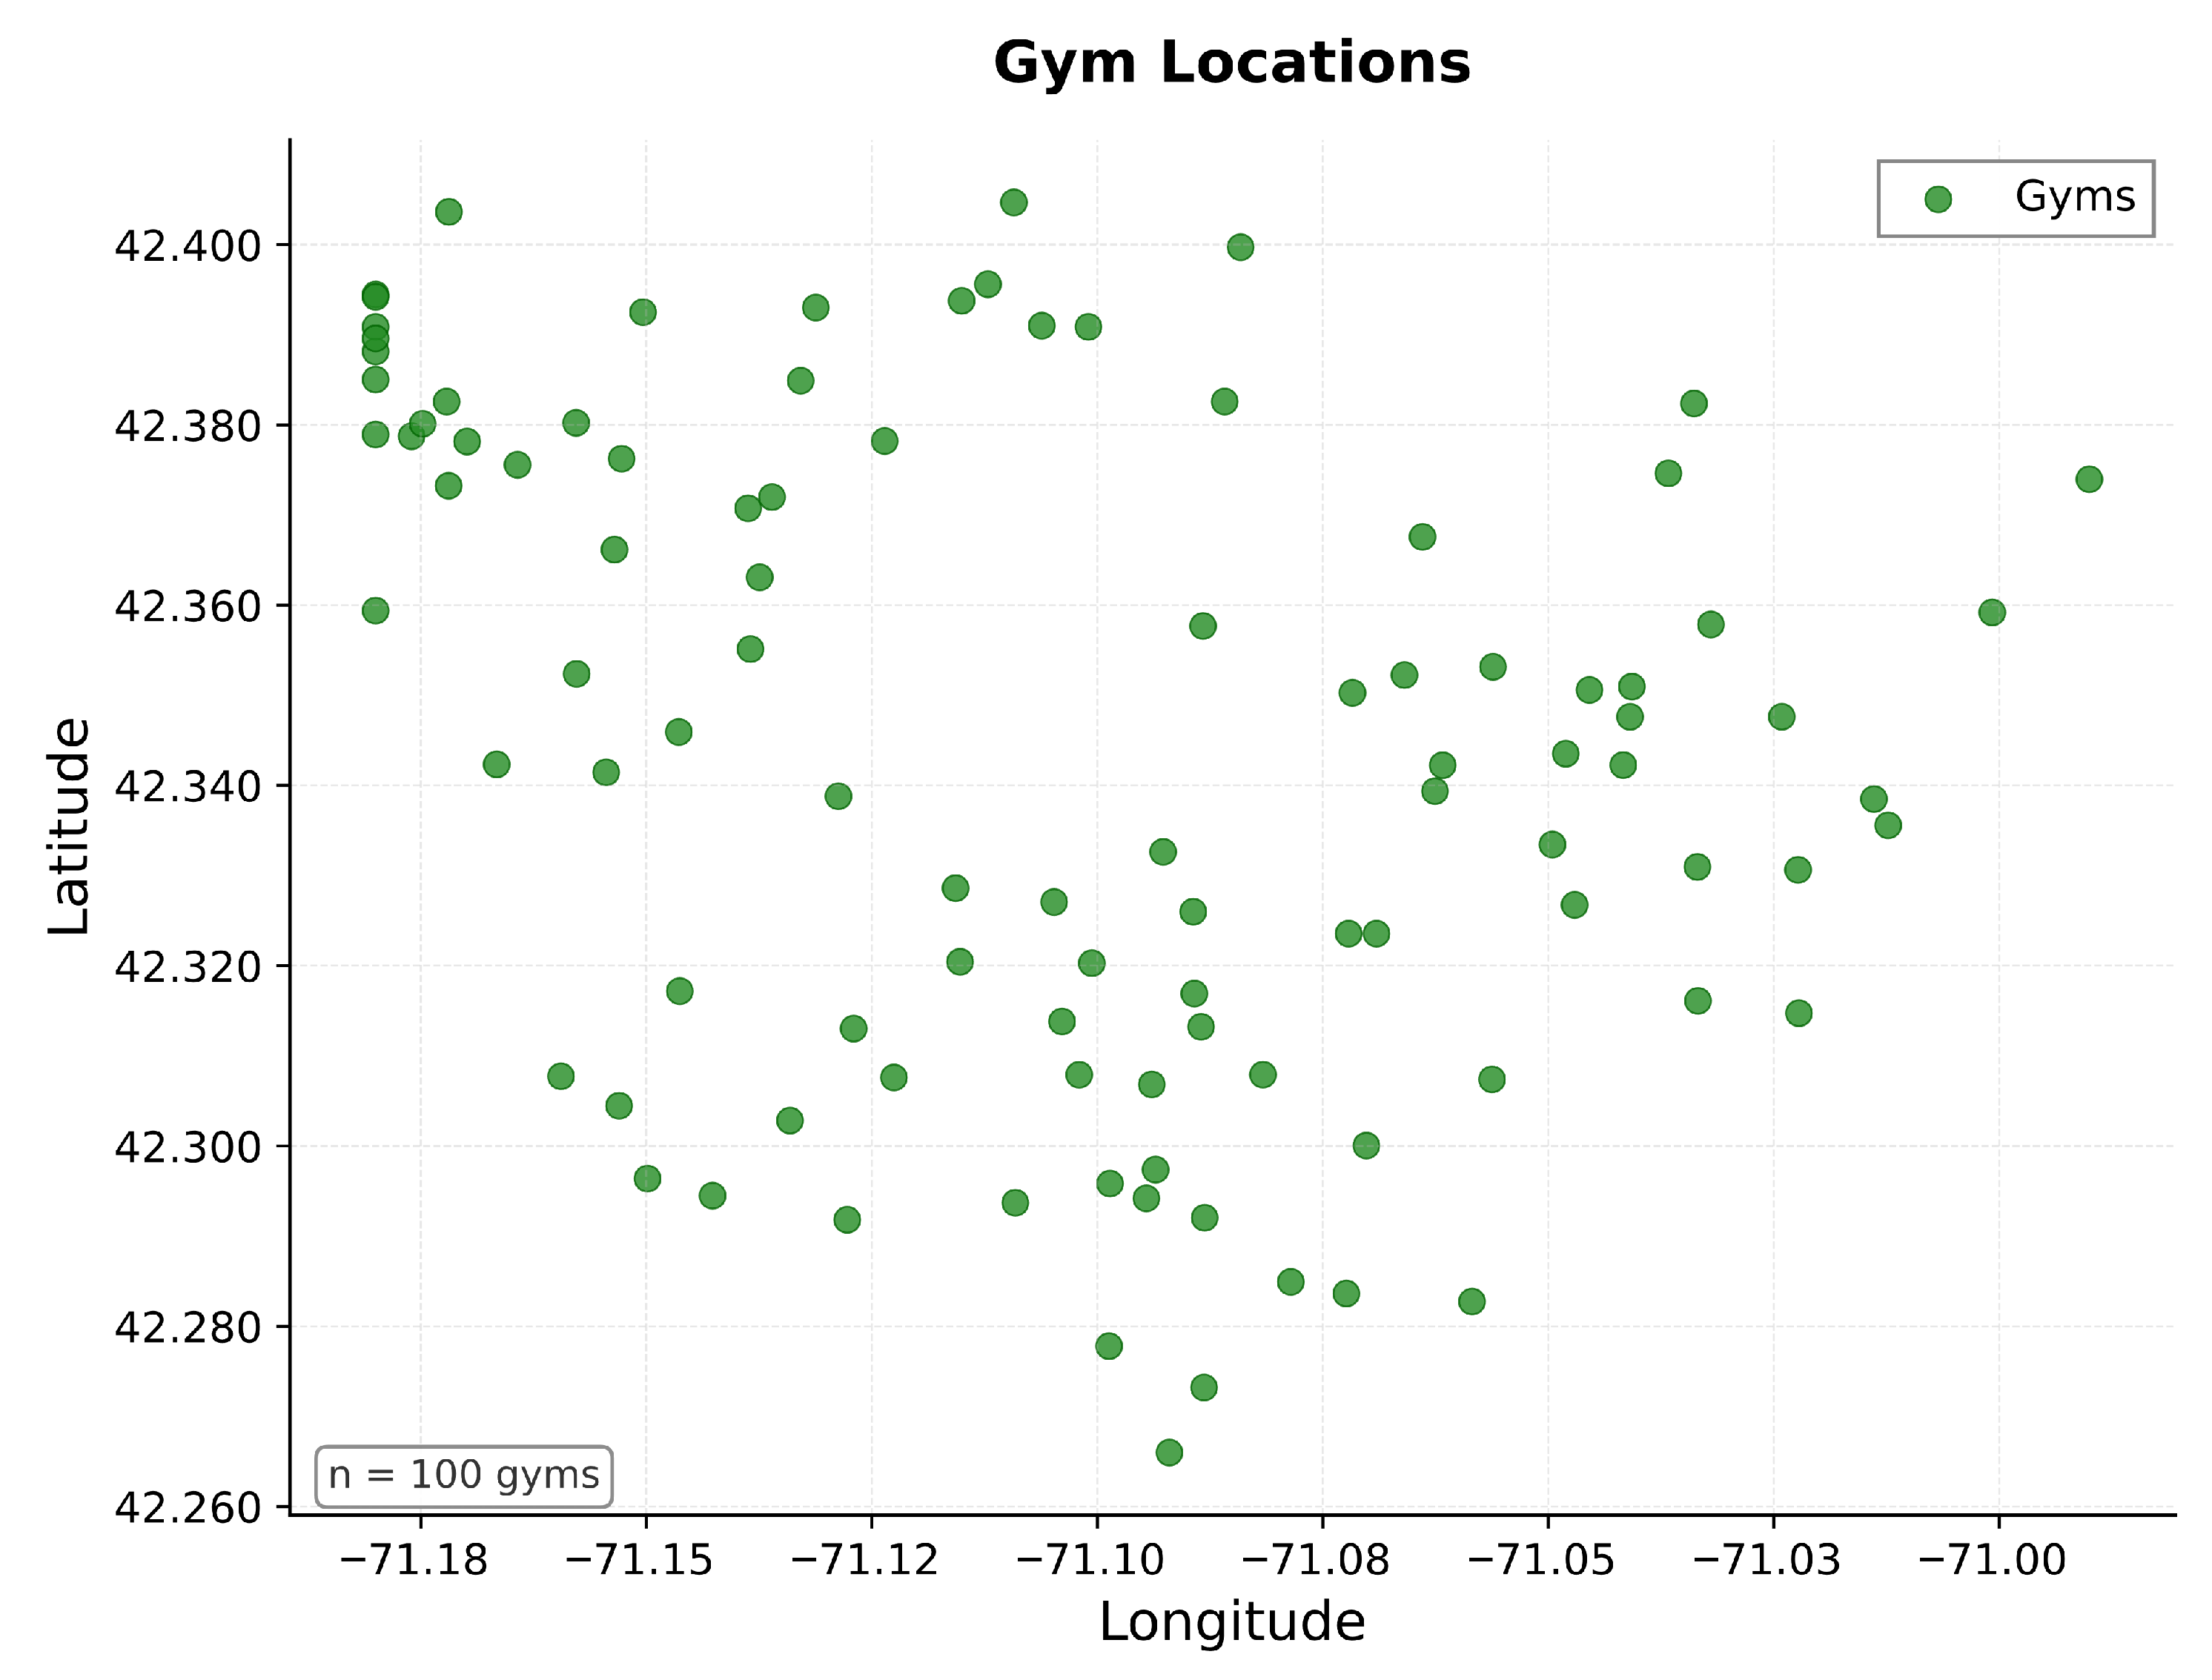
This distribution is based on information shown in [30]. Obviously, home exercise means that the user, on average, has a lower mobility footprint than users who regularly engage in outdoor activities or use the gym for their exercise routines. Exercise sessions are scheduled using probabilistic temporal windows (morning, lunch, evening, weekend), with regular exercisers exhibiting lower temporal variance. For users that had a gym venue for their workout, gym locations were generated as shown in Figure 6.

3.3.3. Dietary and Shopping Behavior

Each simulated individual within our framework is also modeled for varying dietary and shopping tendencies. These are represented broadly by the following two independent categorical attributes:
  • Grocery Frequency:
  • Rare (15%): convenience-driven, <1 grocery trip/week;
  • Mixed (50%): 2–3 grocery trips/week;
  • Frequent (35%): 4–6 grocery trips/week.
Here, it is assumed that people shop at grocery stores, convenience stores, and similar outlets, which require physical mobility on the part of the individual. Additionally, our framework also considers the shopping behavior itself, representing the type of items the individual shops for while at the grocery store. The current focus of the framework’s trait management is on health habits, and thus it simulates the healthiness of the grocery items that the individual shops for. This can be expanded to consider cost level, impulse buys, and other considerations. Currently, the framework excludes online grocery delivery orders. However, the framework provides significant flexibility to expand the modeled personality traits management to include this and other considerations.
  • Healthy Eating Level:
  • Unhealthy (20%): high snack/soda likelihood and ultra-processed foods;
  • Moderate (50%): nutritionally balanced convenience foods;
  • Healthy (30%): strong preference for produce/protein.
Although exercise and diet often correlate in real populations, we intentionally assign them independently to avoid overly deterministic patterns and to provide a conservative basis for privacy risk assessment. Furthermore, the framework considers these classes as guidelines. However, it is important to note that it does not strictly adhere to these classes when generating the simulated individuals’ behavior. Data generation is designed to intentionally soften these boundaries for a more realistic simulation of outliers.

3.4. Mobility Simulation

Users generate mobility traces through a sequence of daily “anchor states,” each representing a major activity or location block. The anchors capture the structure of typical weekday routines while allowing for behavioral heterogeneity.

3.4.1. Anchor State Model

The daily routine is modeled as a finite-state machine with the following anchors:
1.
Home (22:00–7:00);
2.
Morning commute;
3.
Work ((7:00–9:00)–(16:00–18:00));
4.
Lunch excursion;
5.
Evening commute;
6.
Exercise (if scheduled);
7.
Shopping (probabilistic).
Anchor transitions depend on user attributes, temporal priors, and schedule constraints. Stationary anchors generate location samples (referred to herein as “pings”) every 3 to 5 min with added noise ( σ = 50  m).

3.4.2. Cellular Tower Infrastructure

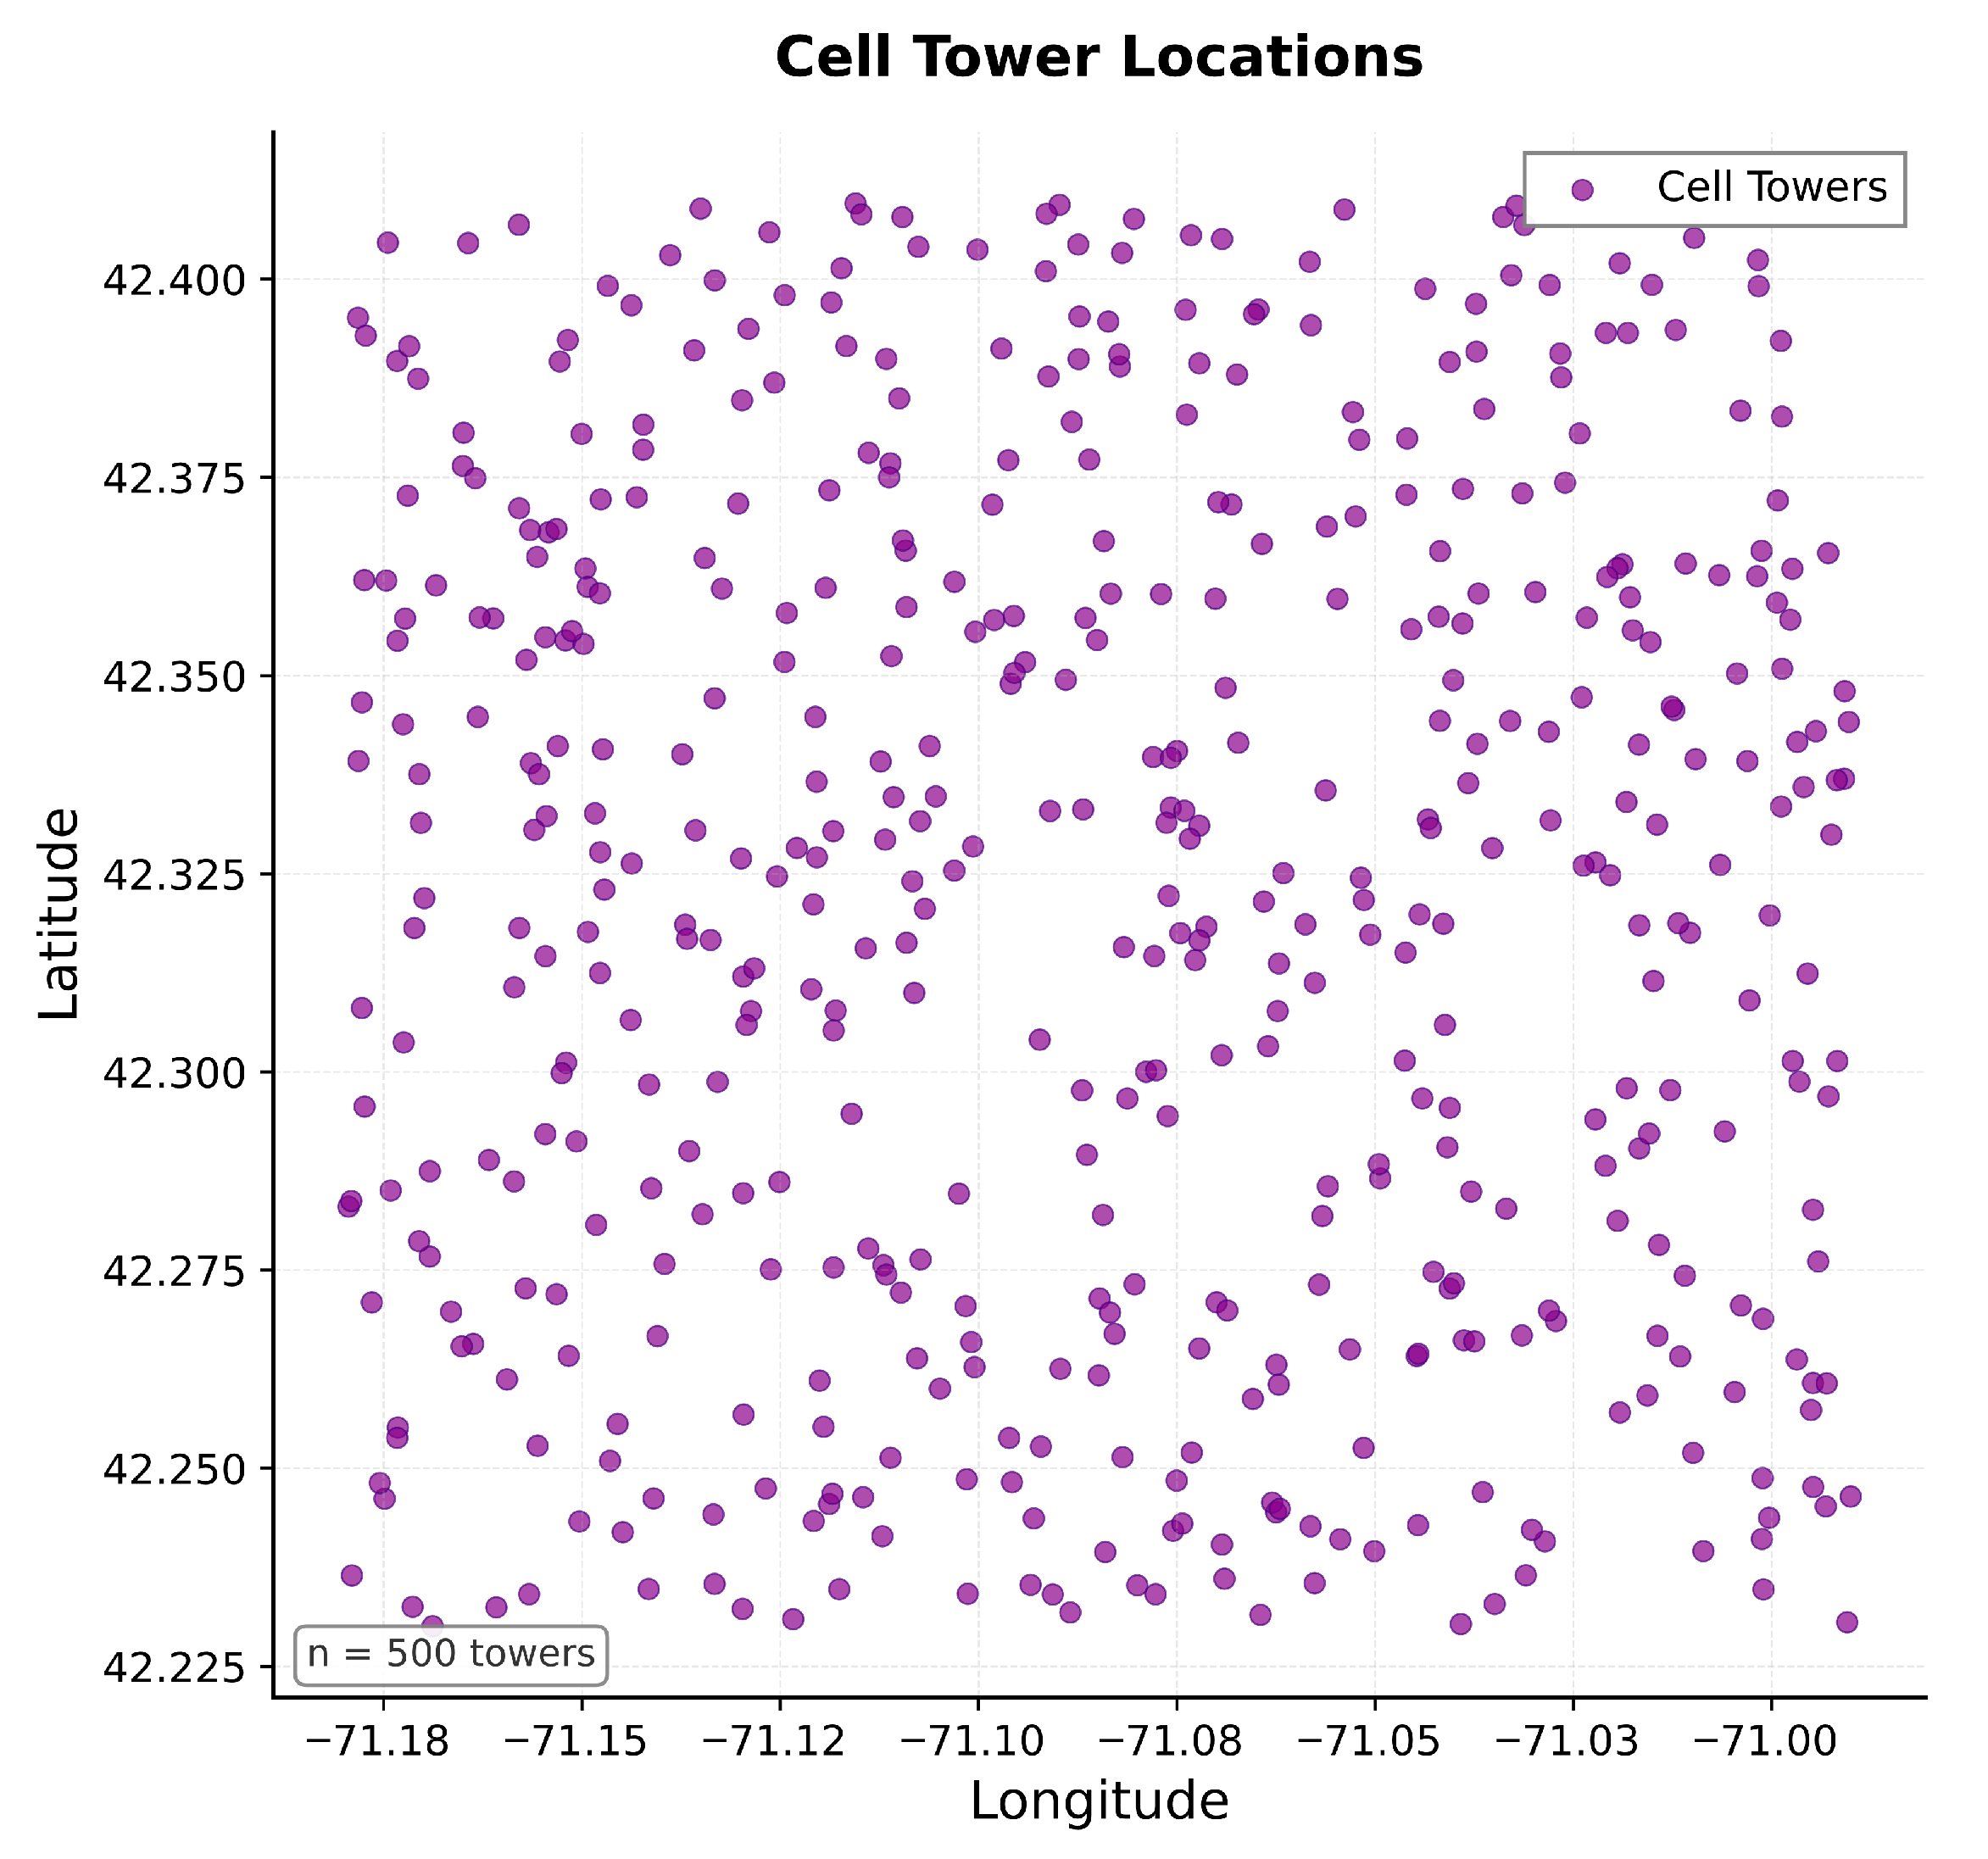
To simulate mobility traces, we generate 500 cellular towers distributed across the region (Figure 7). Each tower has a coverage radius of 300 to 800 m, with probabilistic selection among nearby towers to model network interference. On average, users connect to the nearest tower with 85% probability. Unlike other considerations discussed thus far, we consider this a mobile device trait rather than a personality trait. Movement is modeled using geodesic distance at generated ping intervals. As noted in [31], for applications focused on aggregate mobility patterns, tower-level location precision is often sufficient, eliminating the need for detailed road network data.

3.4.3. Transit Path Interpolation

Movement between anchors is modeled using interpolated geodesic paths. The distance between the start ( ϕ s , λ s ) and end ( ϕ e , λ e ) coordinates is computed using the Haversine formula:
a = sin 2 Δ ϕ 2 + cos ( ϕ s ) cos ( ϕ e ) sin 2 Δ λ 2 , d = 2 R arctan 2 ( a , 1 a )
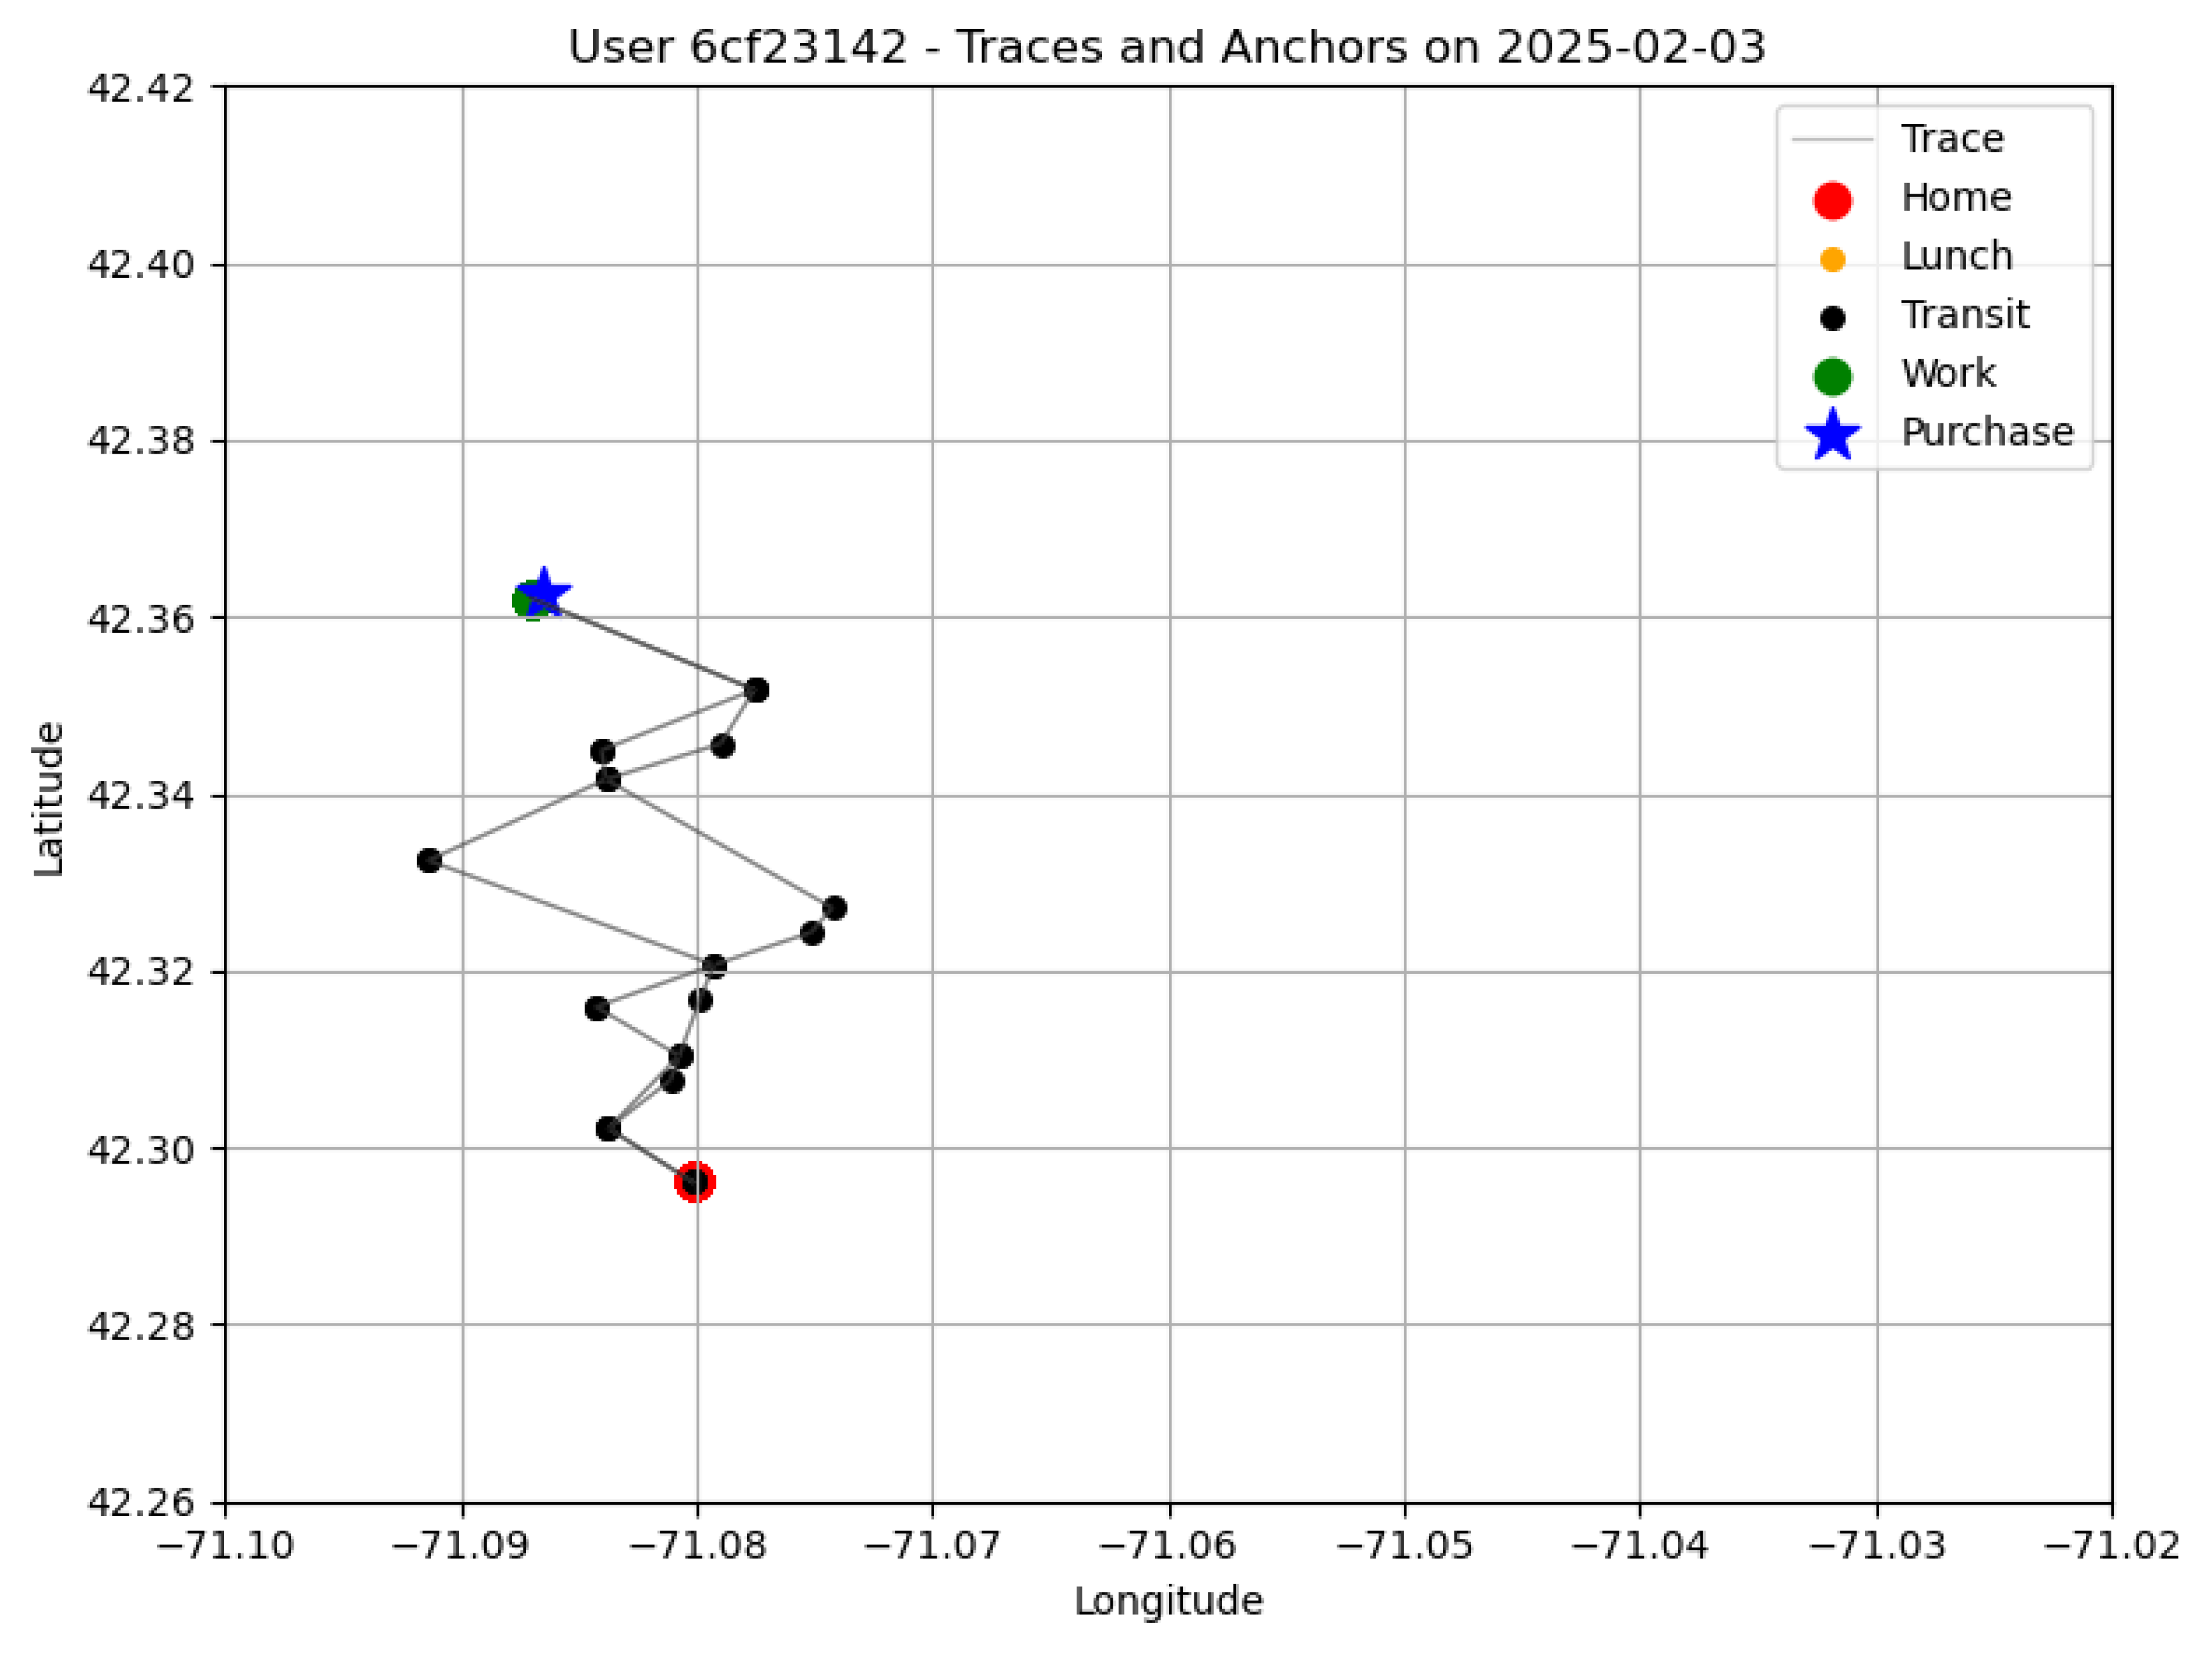
Travel time is sampled uniformly between 15 and 60 min, adjusted to ensure a maximum speed of 50 km/h for traffic within an urban area. Waypoints are generated at 3- to 5-min intervals with Gaussian jitter. The cell tower assignment for each waypoint uses a nearest-neighbor lookup. An example full-day trace is shown in Figure 8.

3.5. Transaction Simulation

3.5.1. Merchant Infrastructure

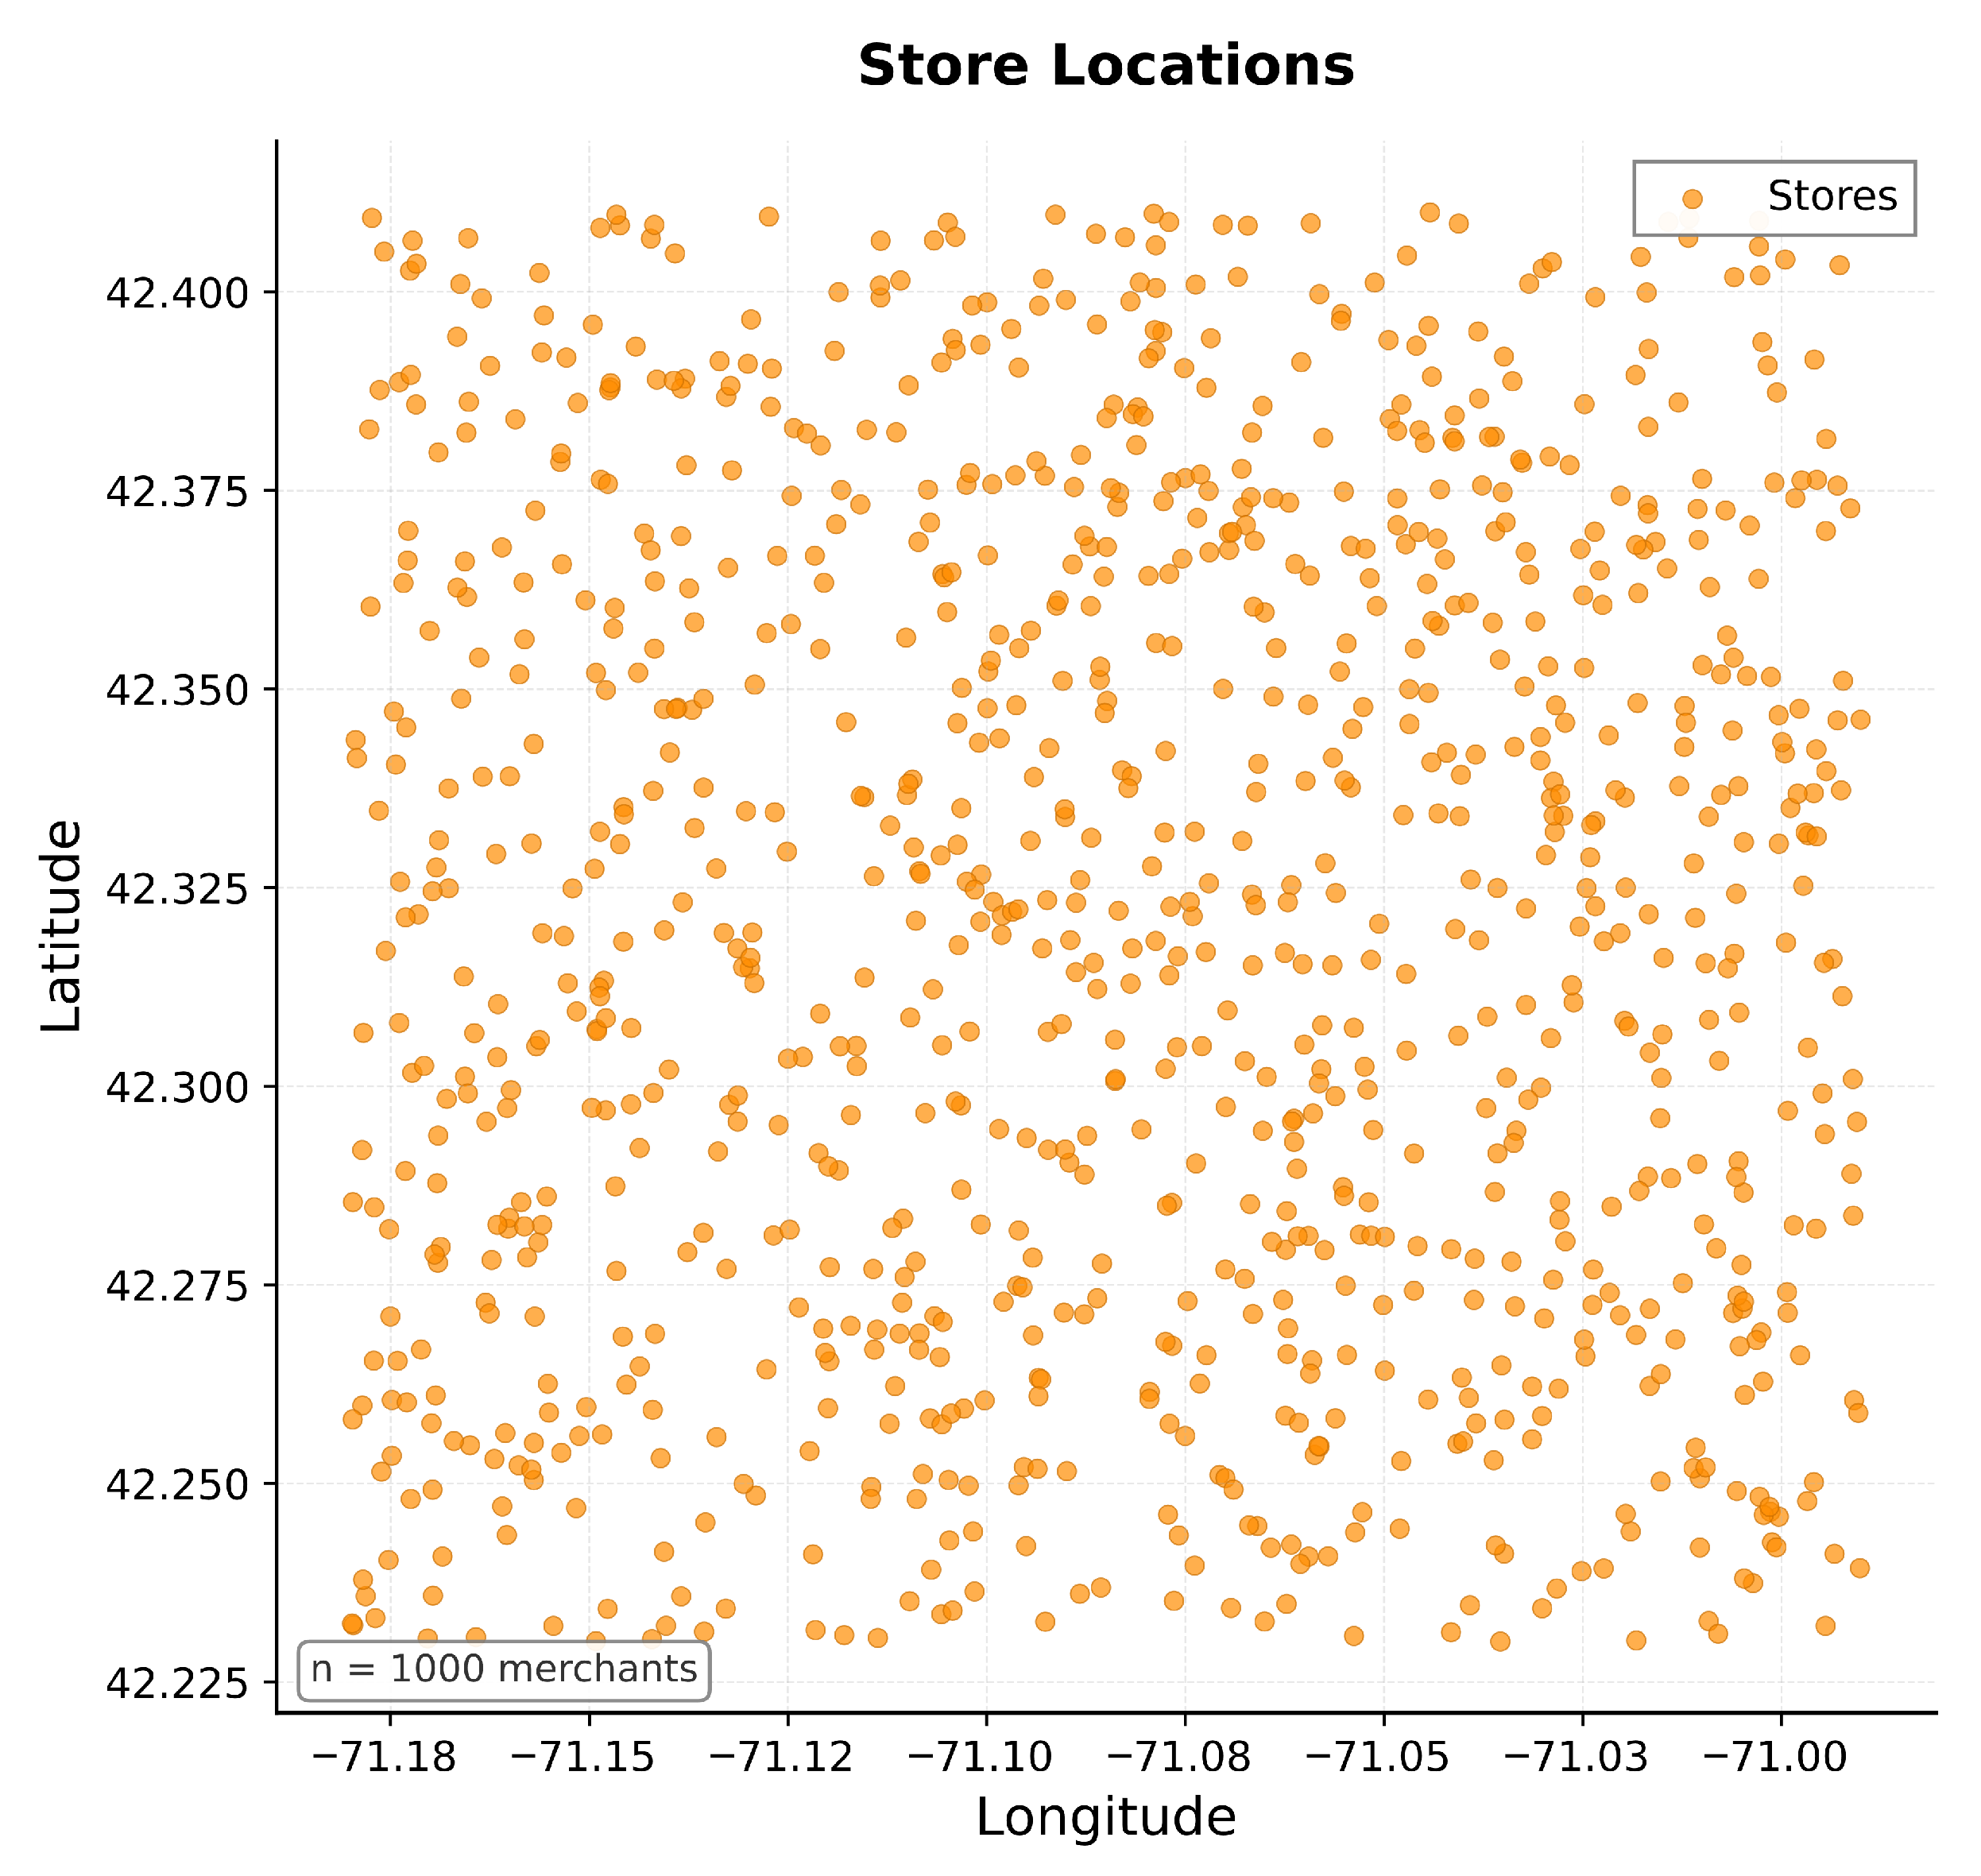
We generate 1200 merchant locations categorized using Merchant Category Codes (MCC): grocery (15%), restaurants (30%), fast food (25%), gas stations (10%), and general retail (20%). Merchant density reflects commercial clustering around work centers and residential areas. This is shown in Figure 9 below.

3.5.2. Purchase Frequency and Selection

Daily transaction opportunities follow a Poisson ( α = 1.6 ) distribution, consistent with U.S. consumer behavior [32]. For each opportunity, we consider the following properties when selecting which merchant an individual shops at for this opportunity:
1.
Spatial filtering: merchants are retrieved using a KD-tree search within a radius of 500 to 1000 m from the user’s location at the time of this opportunity.
2.
Temporal filtering: merchant classes are prioritized based on time of day (lunch 11:30–13:30, grocery evenings).
3.
Budget constraints: users receive monthly budgets drawn from the Gaussian distribution N ( 1500 , 400 ) , capping monthly spending.

3.5.3. Transaction Amounts

The specific expenses for each shopping trip are sampled from MCC-specific log-normal distributions, with medians calibrated to industry-reported average transaction values across merchant categories. Grocery purchases are parameterized with median values between $30 and $60, quick-service restaurant transactions at $6–$20, and full-service dining at $25–$80, consistent with 2025 payment processor statistics [33]. These distributions can be represented as follows:
log ( amount ) N ( μ MCC , σ MCC 2 )
where the parameters μ MCC and σ MCC are calibrated to the values shown in Table 2.

3.6. Nutrition Data Generation

For grocery purchases (MCC 5411), individual line items are generated from a catalog of 500 products spanning the categories of produce, protein, grains, dairy, snacks, and beverages.
1.
Basket size follows a truncated Poisson ( λ = 3.5 ) .
2.
Categories are sampled according to the user’s assigned healthy eating habit class.
3.
Items are drawn uniformly from within the categories.
4.
Nutritional filtering rejects implausible items, such as sugary beverages for healthy eaters, with 90% probability.
  • where f c denotes the fraction of purchased items in category c. An end to end algorithmic approach can be seen in Algorithm 1.
Algorithm 1. Anchor-based daily mobility simulation.
  • Require: User profile u with home location, work location, work start time, exercise class, shopping frequency
  • Ensure: Daily mobility trace T = { ( t i , lat i , lon i , tower i , anchor i ) }
1:
T
2:
t 00 : 00
                                        ▹ Anchor 1: Home (overnight)
3:
while t < u.work_start − commute_time do
4:
    Generate ping at u . home + N ( 0 , 50 m )
5:
    Assign tower via nearest-neighbor (85% probability)
6:
    Append ( t , loc , tower , HOME ) to T
7:
     t t + Uniform ( 3 , 5 ) min
8:
end while
                                        ▹ Anchor 2: Morning Commute
9:
commute_time ← Uniform(15,60) min, capped at 50 km/h
10:
Generate interpolated waypoints from u . home to u . work
11:
for all waypoint w at 3–5 min intervals do
12:
    Append (t,w,nearest_tower(w, TRANSIT ) to T
13:
end for
                                        ▹ Anchor 3: Work
14:
while t < u.work_start + 4 h do                          ▹ Morning work session
15:
    Generate ping at u . work + N ( 0 , 50 m )
16:
    Append ( t , loc , tower , WORK ) to T
17:
     t t + Uniform ( 3 , 5 ) min
18:
end while
                                    ▹ Anchor 4: Lunch Excursion (11:30–13:30 window)
19:
Select merchant via KD-tree within 500 m of u . work
20:
Generate transit and stationary pings for lunch
21:
Append pings with anchor LUNCH to T
                                        ▹ Anchor 3 (continued): Afternoon Work
22:
while t < u.work_end do
23:
    Generate ping at u . work + N ( 0 , 50 m )
24:
    Append ( t , loc , tower , WORK ) to T
25:
     t t + Uniform ( 3 , 5 ) min
26:
end while
                                        ▹ Anchor 5: Evening Commute
27:
Generate interpolated waypoints from u . work to u . home
                                        ▹ Anchor 6: Exercise (conditional)
28:
if  u.exercise_class > 0 and exercise scheduled today then
29:
    Select venue based on u.exercise_venue
30:
    Generate transit and activity pings with anchor EXERCISE
31:
end if
                                        ▹ Anchor 7: Shopping (probabilistic)
32:
if shopping triggered based on u.grocery_frequency then
33:
    Select merchant via KD-tree within 500–1000 m
34:
    Generate transit and stationary pings with anchor SHOPPING
35:
end if
                                        ▹ Anchor 1: Home (evening)
36:
while  t < 24 : 00   do
37:
    Generate ping at u . home + N ( 0 , 50 m )
38:
    Append ( t , loc , tower , HOME ) to T
39:
     t t + Uniform ( 3 , 5 ) min
40:
end while
41:
return  T

4. Implementation and Data Pipeline

4.1. Software Architecture

The framework is implemented in Python 3.11. The core components utilized by the framework include the following packages:
NumPy (https://numpy.org/, accessed on 4 February 2026) and Pandas (https://pandas.pydata.org/, accessed on 4 February 2026): were utilized in collecting all user traces, purchases, available cell towers, and workouts for each user. This package allowed for the saving of individual day/week simulations and compression for later examination and data sanitization.
Scikit-learn (https://scikit-learn.org/stable/, accessed on 4 February 2026): was utilized to determine KD-tree spatial indexing when generating grid-based movement patterns. This toolbox was also utilized to find grid points and to attribute a user’s cell tower ping to an exact cell tower location.
Geopy (https://github.com/geopy/geopy, accessed on 4 February 2026): was utilized for geodesic distance calculations based on a grid-based geodesic path.
Multiprocessing (https://docs.python.org/3/library/multiprocessing.html, accessed on 4 February 2026): allowed for parallel per-user simulation, by creating a schedule for each user based on their workplace, commute distance, diet, and workout inclination that would execute each day for each individual. Each process would take into account each individual’s schedule and then produce and output the appropriate traces for each day. Each week was then compiled for 10,000 users to enhance the granularity of checkpoints.
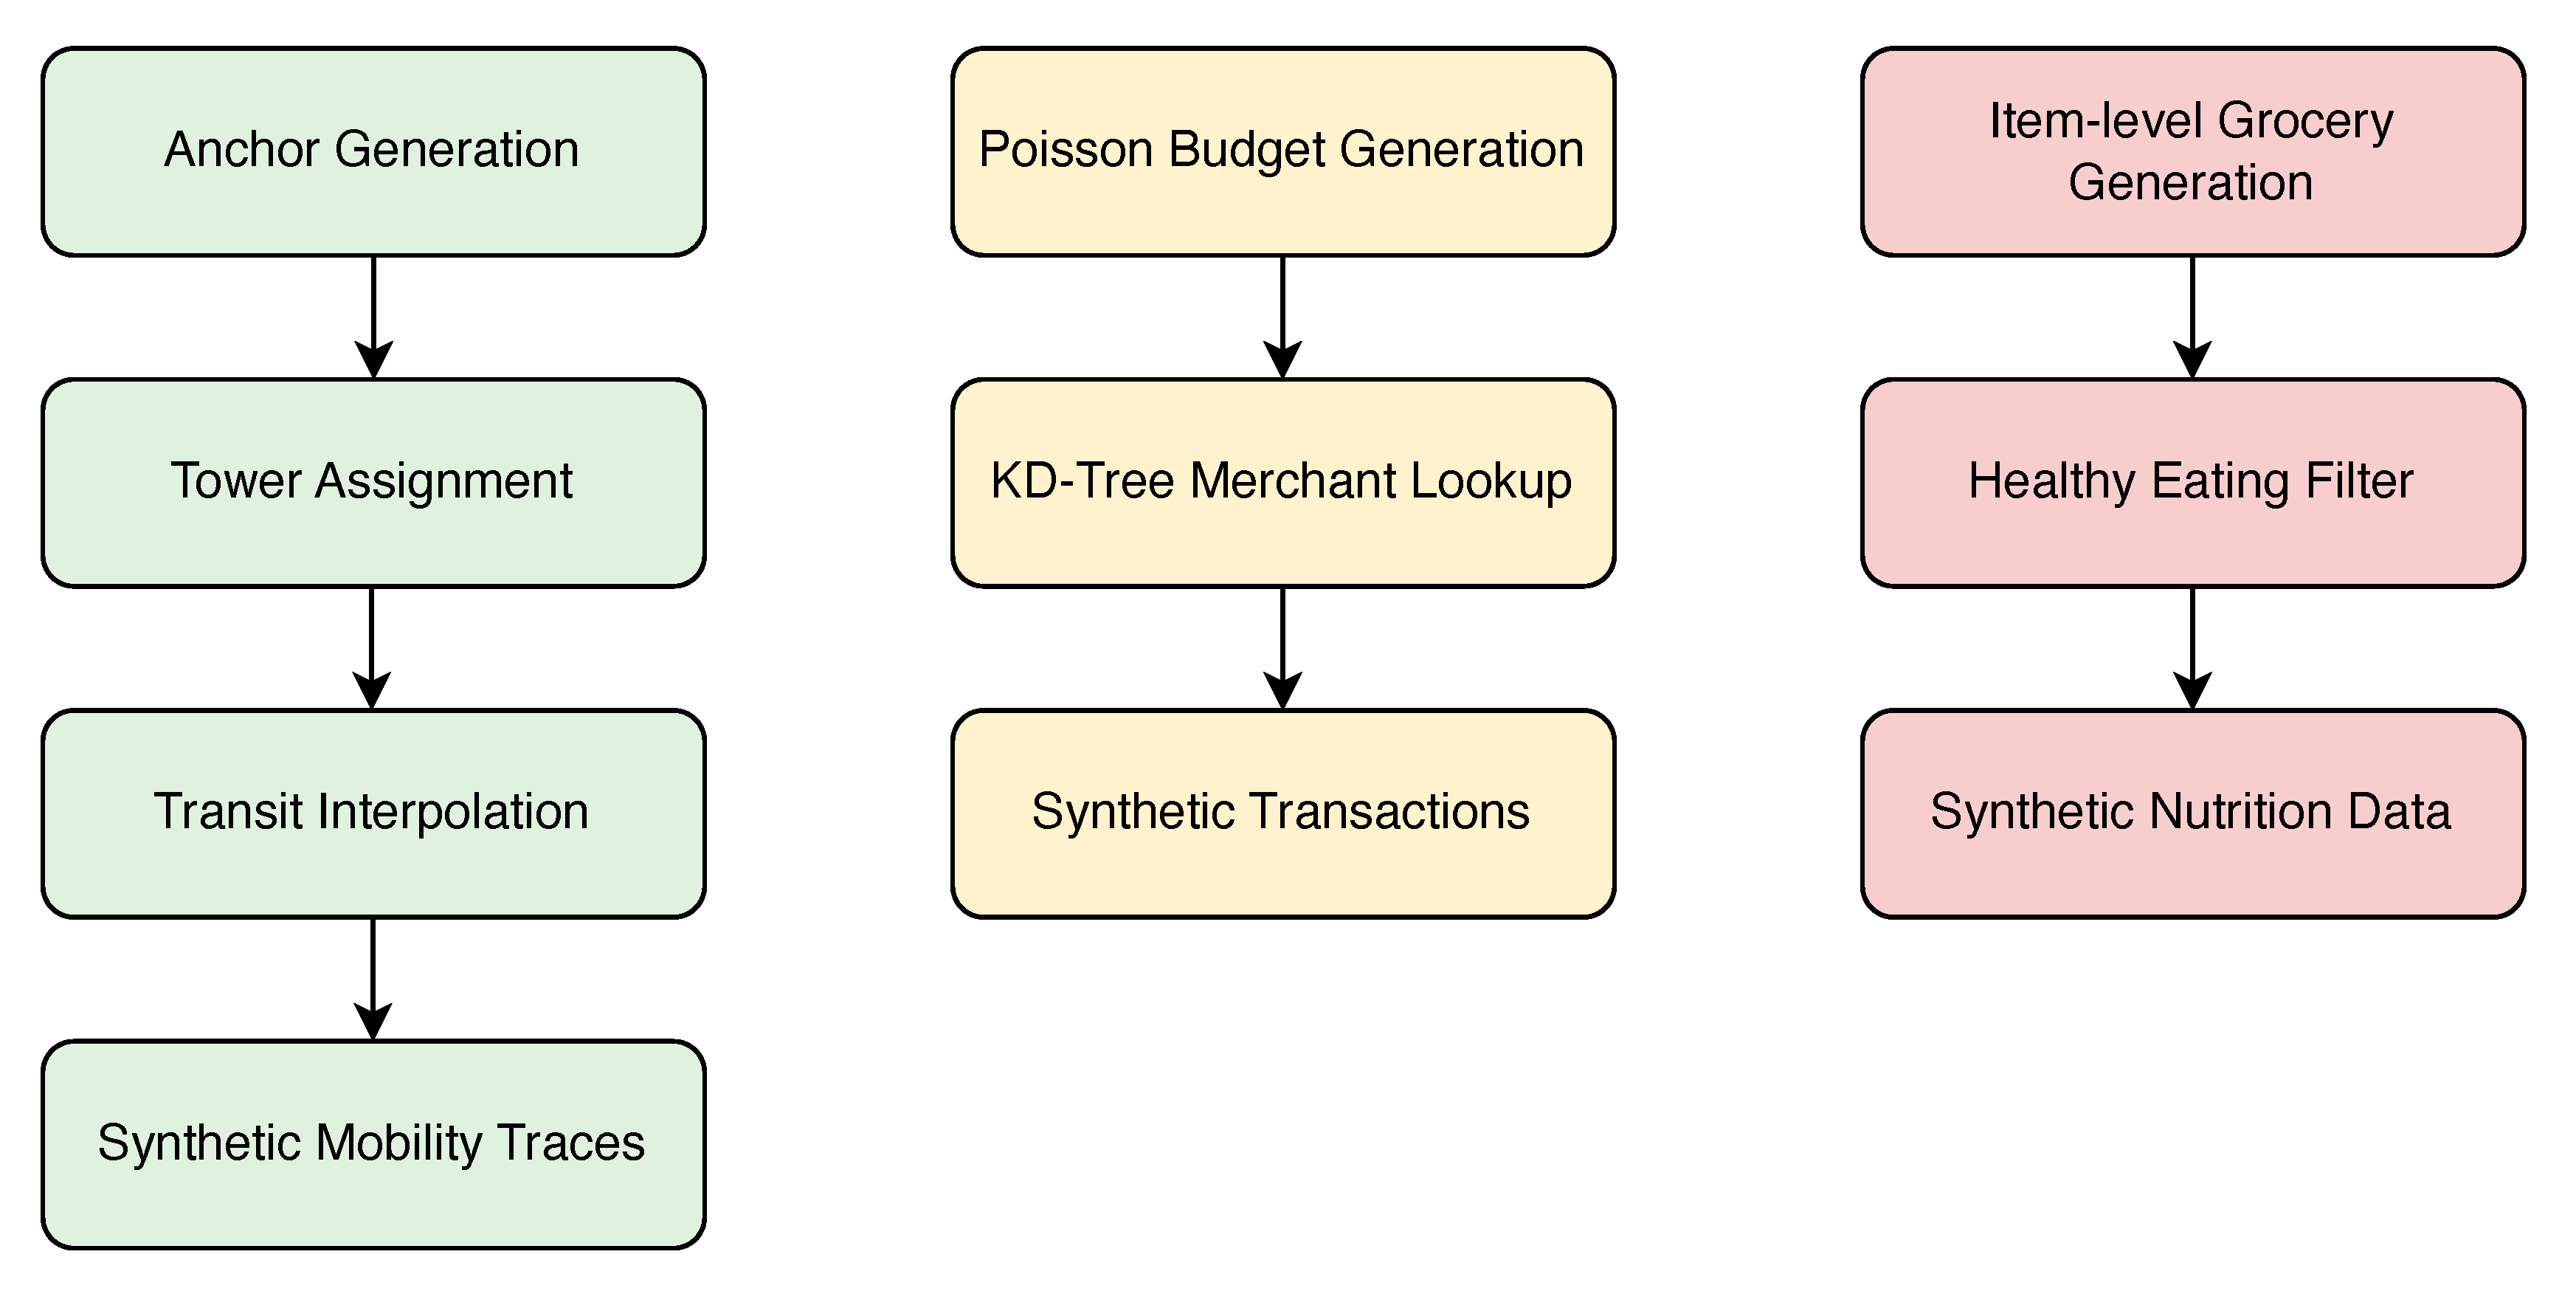
Figure 10 shows the data generation pipeline.

4.2. Data Schema and Export Formats

Generated data are exported into three relational tables:
Mobility (116M rows): contains the columns user_id, timestamp, lat/lon, tower_id, and anchor_type, where user_id is an individual’s unique identifier, timestamp is a UTC timestamp that tracks simulated wallclock time, tower_id denotes the cell tower a user pings to, lat/lon is the coordinate of the cell tower, and anchor_type is the user’s current action.
Transactions (5.4M rows): contains the columns user_id, timestamp, merchant_id, MCC, amount, location, and transaction_id; here, user_id and timestamp are analogous to the corresponding columns in the mobility table, merchant_id is the unique ID for the store within proximity to the user, MCC is mapped to the individual merchant_id, location is mapped to the closest cell tower to the merchant, and transaction_id is the unique ID given to a purchase.
Nutrition (1.88M rows): contains the columns transaction_id, item_name, category, calories, price; these represent the individual transaction’s shopping basket content that links transaction_id back to the Transactions table.
An overview of the distributions used to generate this data can be seen in Table 3.
Exports support CSV and Parquet backends. The CSV format was utilized for creating and storing sanitized data, while Parquet allows for compression and reduced storage size.

5. Dataset Characteristics and Validation

5.1. Aggregate Statistics

The final dataset contains:
  • 116,046,000 mobility pings (mean 345.75/user-day);
  • 5,376,000 transactions (1.6/user-day);
  • 1,881,600 nutrition entries (3.5 items/transaction).
Class distributions mirror assigned population fractions.

5.2. Distributional Validation

Synthetic distributions align with empirical benchmarks shown in Table 4:

5.3. Temporal Patterns

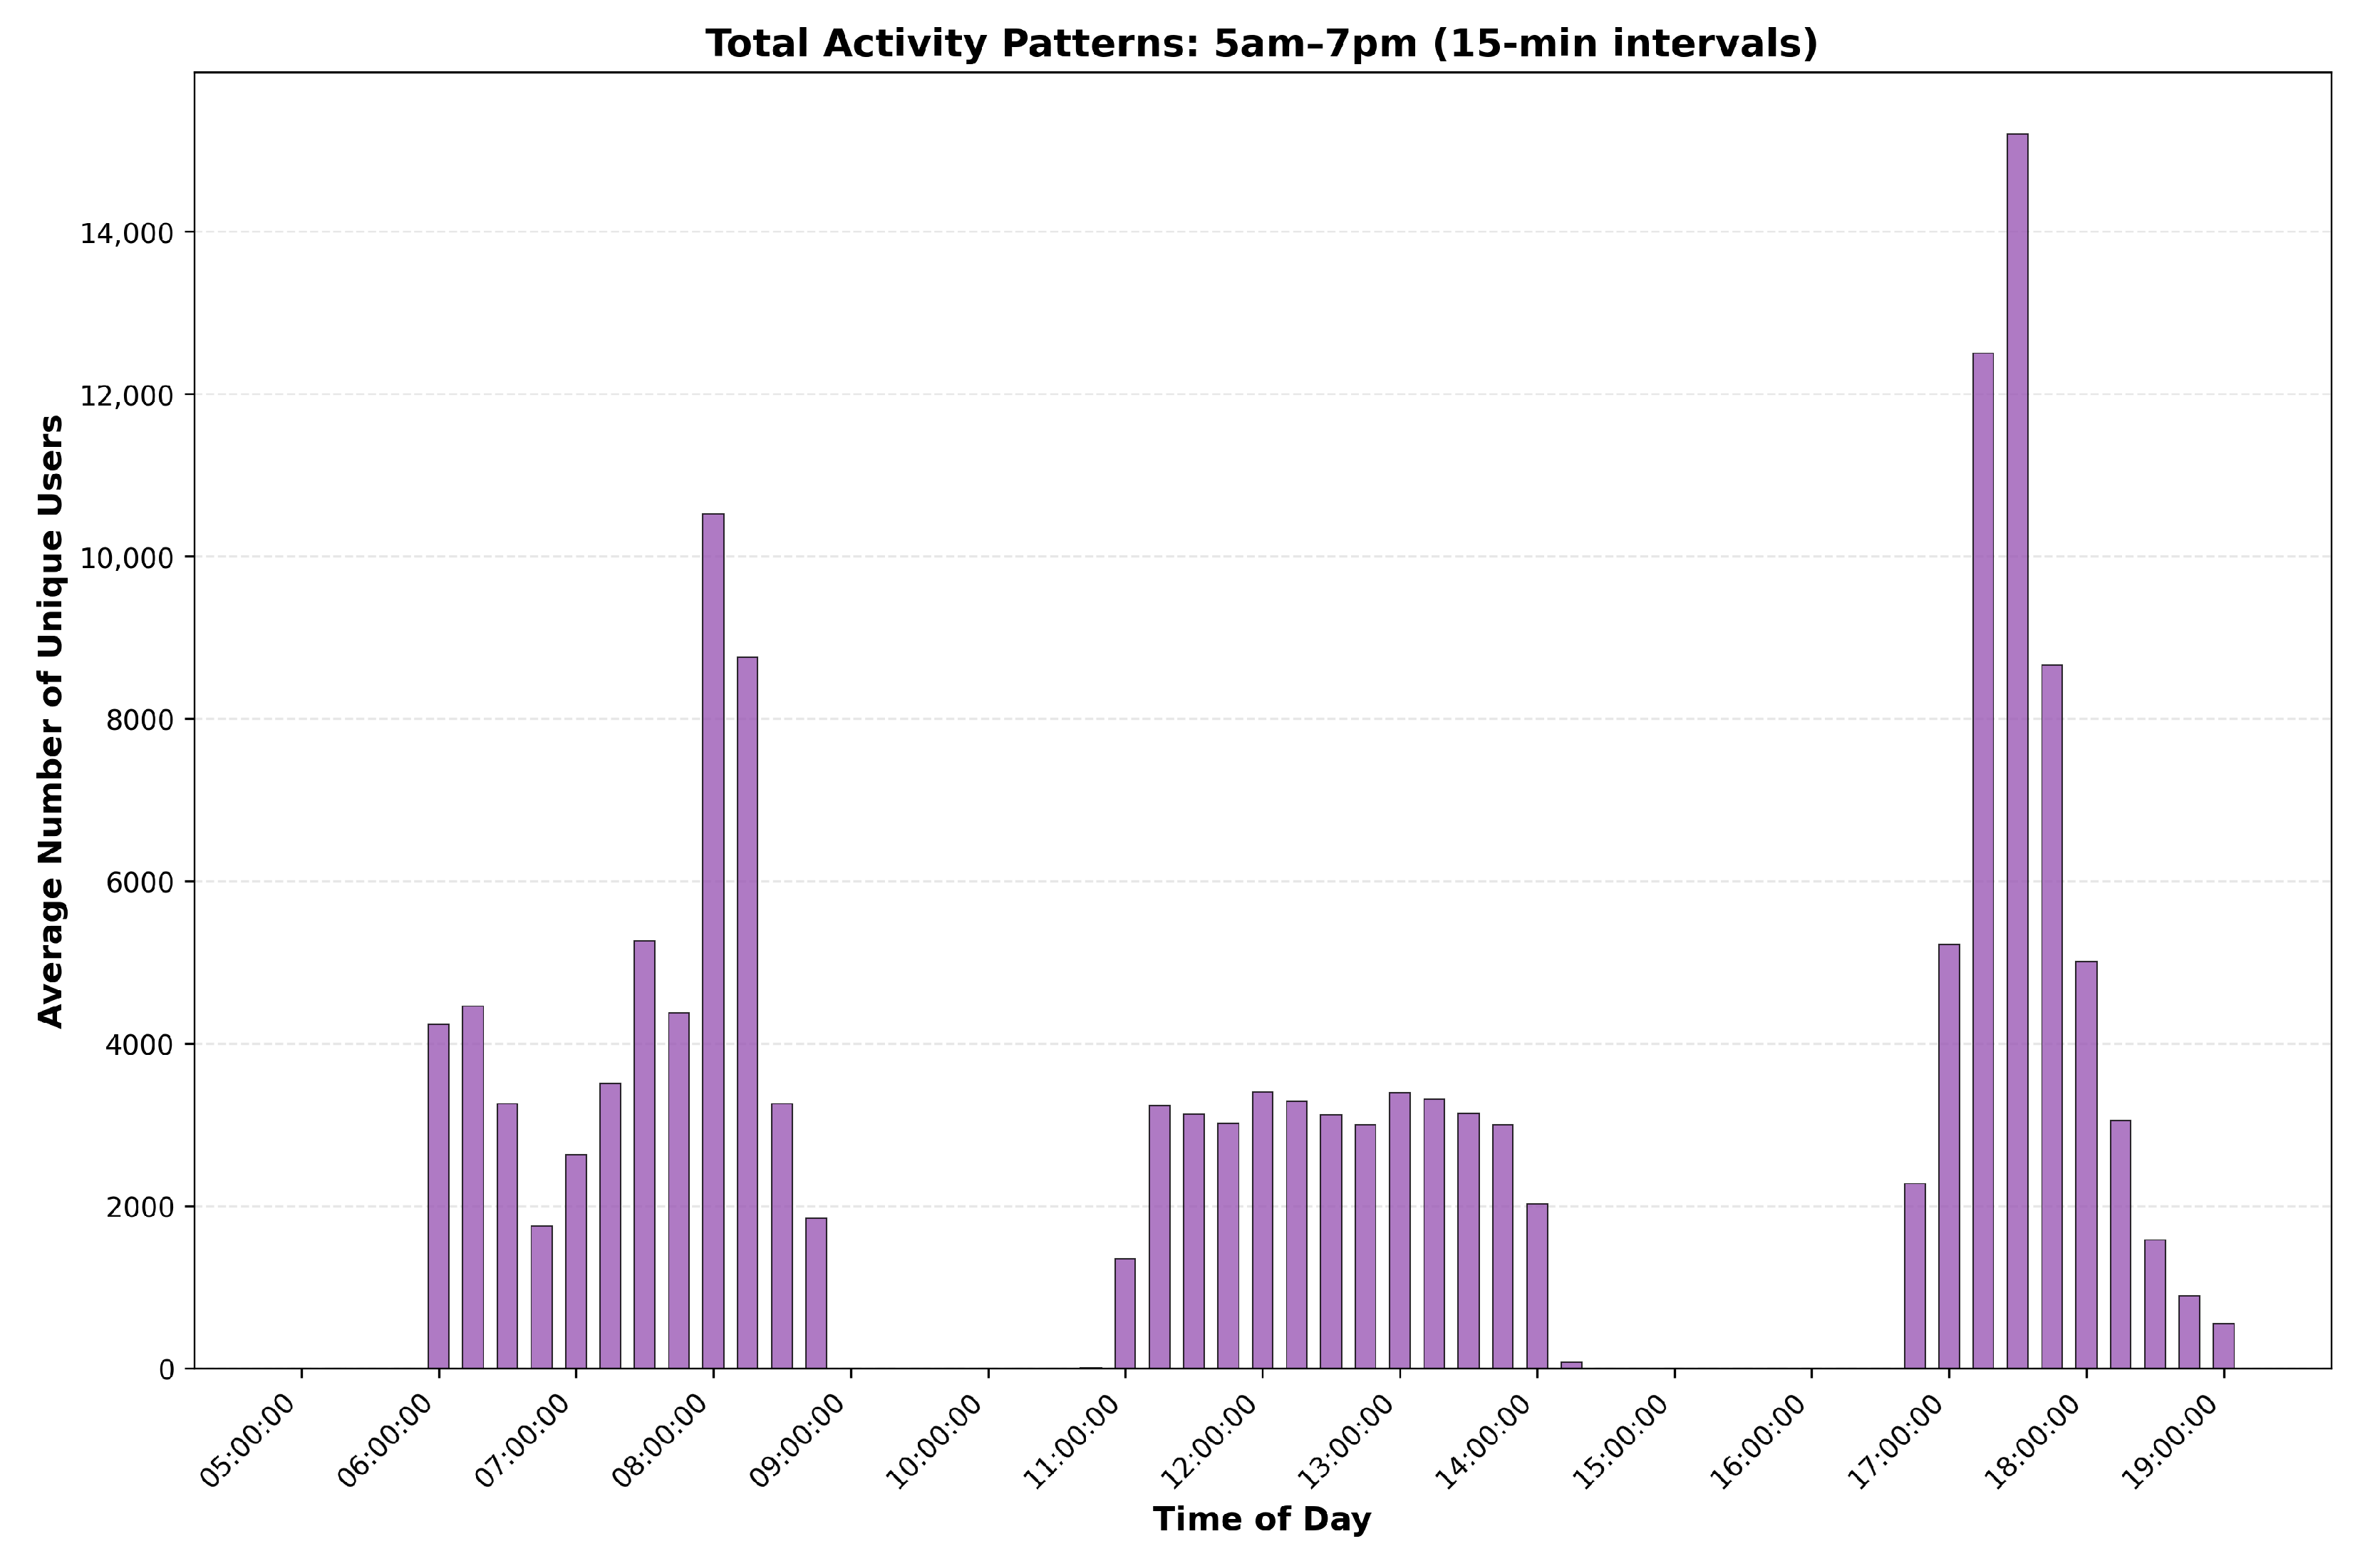
Hourly aggregate patterns exhibit a realistic structure that is consistent with empirical urban mobility studies [35,37]. The synthetic data reproduces characteristic temporal rhythms observed in real urban populations, including a morning commute peak from 7 to 9 AM, a lunch activity peak from 12 to 1 PM, and an evening return commute and shopping period from 5 to 8 PM (Figure 11).
Activity levels reach their minimum during the early morning hours from 1 to 5 AM, reflecting typical sleep patterns. These patterns align closely with observations from large-scale mobility studies, where two pronounced daily peaks at 8–9 AM and 6–7 PM correspond to work-related commuting behavior [37].

5.4. Spatial Clustering and Cross-Modal Correlations

Spatial validation shows that the synthetic data exhibits realistic geographic clustering patterns consistent with actual urban behavior. The majority of transactions (78%) occur within 1 km of the user’s current location, reflecting the tendency for individuals to conduct purchases near their immediate vicinity. This clustering is particularly pronounced during lunch periods, when 92% of purchases occur within 500 m of work. This emulates the tendency of employees patronizing nearby restaurants during their lunch breaks. Similarly, grocery shopping data reveals a strong spatial correlation with residential areas, with 65% of grocery purchases occurring within 2 km of home locations. This pattern aligns with consumer preferences for shopping at neighborhood supermarkets and local grocery stores rather than traveling long distances for routine food purchases.
Cross-modal correlations align with expectations, with the strongest correlation existing between exercise frequency and gym visits ( ρ = 0.82 ). This confirms that individuals who exercise regularly generate corresponding location traces at fitness facilities. Mobility entropy, measured as the diversity of locations visited, shows moderate positive correlation ( ρ = 0.58 ) with merchant category diversity, indicating that users who explore varied geographic areas also tend to shop across a wider range of merchant types. Conversely, grocery shopping frequency exhibits a negative correlation ( ρ = 0.44 ) with fast food usage, suggesting that individuals who frequently purchase groceries for home meal preparation rely less on quick-service restaurants. These cross-modal relationships validate that the framework captures realistic behavioral interdependencies across different aspects of daily life.

5.5. Preliminary Uniqueness Analysis

To demonstrate the dataset’s suitability for privacy risk research, we report preliminary uniqueness metrics following the methodology established by de Montjoye et al. [1,4].

5.5.1. Threat Model and Evaluation Scope

To contextualize the preliminary uniqueness analysis, we define the assumed adversary model and evaluation parameters. We consider an adversary with the following characteristics:
  • Adversary knowledge:
  • Access to one or more modalities: mobility, transactions, or grocery data.
  • Limited auxiliary knowledge of a target individual, such as approximate home location, workplace, or a small number of known spatio-temporal observations.
  • The attack objective is either:
  • To uniquely identify a target individual within the dataset.
  • To reduce the candidate set to a small number of plausible matches that could be further disambiguated with additional auxiliary information.
The analysis in this section establishes that the synthetic data exhibits uniqueness characteristics consistent with real-world behavioral datasets known to be vulnerable to re-identification. Full quantitative benchmarking against specific re-identification algorithms is left for future work.

5.5.2. Transaction Uniqueness

Transaction records exhibit high sparsity: the median user visits only 7–8 distinct merchants per week from 1200 possible locations. This mirrors the finding of [1] that combinations of a few merchant identifiers and coarse timestamps can lead to re-identification of the majority of users. The spatial clustering observed in Section 5.4, where 78% of transactions occur within 1 km of the user’s location and 65% of grocery purchases occur within 2 km of home, urther constrains the candidate set when merchant location is known.

5.5.3. Cross-Modal Linkage Potential

The correlations reported in Section 5.4 quantify cross-modal linkage potential:
  • Exercise frequency correlates strongly with gym visit mobility traces ( ρ = 0.82 ), enabling linkage between transaction records (gym membership payments) and mobility data.
  • Mobility entropy correlates with merchant category diversity ( ρ = 0.58 ), suggesting that users with geographically dispersed mobility also exhibit distinctive transaction patterns.
  • Grocery shopping frequency negatively correlates with fast food usage ( ρ = 0.44 ), creating dietary fingerprints that could link nutrition records to transaction histories.
The 92% rate of lunch purchases occurring within 500 m of work locations provides a direct linkage channel: an adversary with access to both mobility and transaction data could match users by correlating work anchor locations with lunchtime merchant visits. This preliminary study can be seen in Table 5.

5.5.4. Implications for Privacy Research

These preliminary observations confirm that the synthetic dataset exhibits the uniqueness characteristics necessary for meaningful privacy risk assessment. The combination of regular behavioral structure, sparse but distinctive transaction patterns, and explicit cross-modal correlations creates a controlled environment for evaluating:
  • Re-identification risk under varying temporal and spatial granularities (e.g., hour-level vs. minute-level timestamps, tower-level vs. coordinate-level locations).
  • Cross-modal linkage attacks that exploit correlations between mobility, transactions, and nutrition data.
  • The effectiveness of anonymization techniques and differential privacy mechanisms in mitigating these risks.
A comprehensive quantitative evaluation of uniqueness metrics and formal linkage experiments is deferred to future work, where we intend to benchmark specific re-identification algorithms against this dataset.

6. Discussion

6.1. Contributions and Novelty

This work advances the generation of synthetic IoT data and the associated analysis of privacy risks along several dimensions. First, we propose a multimodal framework that jointly synthesizes cellular mobility traces, payment transactions, and item-level nutrition data for a large simulated population of users. In contrast to prior efforts that focus on single modalities in isolation, our framework explicitly models cross-domain dependencies such as the coupling between commute patterns, shopping behavior, and dietary profiles. This enables the systematic study of privacy risks arising from multimodal data fusion rather than from any individual stream alone. This, in turn, is a key consideration for Smart City IoT applications, where data is collected from myriad sources, often without the user’s explicit knowledge, and an important trust relationship must be maintained between the user and the entity collecting all this data for safeguarding the population’s privacy rights by minimizing the risks of re-identification. Our framework for realistic multimodal data synthesis is a vital step towards the comprehensive study of these risks and potential mitigation strategies.
Second, we adopt a privacy-by-design perspective in which privacy-related design constraints are treated as an integral part of the synthesis process rather than as an afterthought. By explicitly documenting how the data is generated, and which behavioral features are preserved, we enable downstream users to perform their own analyses of uniqueness, linkage attacks, and re-identification, and to reason about how these quantities may change under different spatio-temporal resolutions or modality combinations. The structure of the generated data mirrors key properties of real-world behavioral traces that have been shown to enable re-identification in prior work [1,4]. As a result, the dataset can be used to explore how uniqueness and re-identification risk behave when modalities are combined or when temporal and spatial resolutions are varied, without requiring access to sensitive real-world records.
Third, we demonstrate that it is possible to achieve realistic validity at scale using relatively simple and interpretable generative mechanisms. The combination of anchor-based mobility routines, spatially aware merchant selection, and diet-informed shopping basket generation reproduces realistic temporal activity patterns, spatial clustering, and cross-modal correlations while maintaining a transparent structure that facilitates analysis and modification. This stands in contrast to opaque black-box generative models, which may offer higher fidelity but make it more difficult to reason about embedded biases and privacy risks.
Ultimately, the framework offers a comprehensive, privacy-auditable benchmark tailored specifically for IoT and behavioral analytics. The generated example synthetic dataset, currently comprising 116 million mobility records, 5.4 million transactions, and 1.9 million nutrition entries for 40,000 users, is designed to support the reproducible evaluation of anonymization algorithms, differential privacy mechanisms, and downstream machine learning models in a controlled environment. Because all generative assumptions are explicit, researchers can trace how modeling choices influence both utility and privacy and can extend or replace individual components as needed.

6.2. Limitations and Future Work

Despite its contributions, the proposed framework has several limitations that suggest directions for future research.

6.2.1. Modeling Simplifications

Several deliberate simplifications warrant discussion. The anchor-based mobility model enforces regular daily routines with fixed schedules, which reduces long-term behavioral variability compared to real populations. This regularity is intentional: it provides an interpretable, conservative baseline for privacy analysis since regular patterns should be easier to anonymize than erratic ones. If linkage succeeds here, it will likely succeed on messier real data. Similarly, the framework models movement via interpolated geodesic paths rather than road-network-constrained trajectories. At cellular tower granularity (300–800 m coverage radii), road-level deviations contribute limited additional signal [31], and geodesic interpolation maintains portability across geographic contexts without requiring region-specific infrastructure data.
Future work should relax these assumptions for applications requiring greater realism: incorporating stochastic schedule disruptions, multi-purpose trip chains, and road network constraints. Such extensions would improve real-world validity while necessarily increasing model complexity and computational requirements.

6.2.2. Population and Temporal Scope

The behavioral models are intentionally stylized. The anchor-based mobility model captures regular daily routines, such as commuting, lunch breaks, and evening activities; however, it does not represent more complex behaviors, including irregular work schedules, multi-day trips, special events, or long-term changes in routine. Future work could incorporate richer behavioral patterns, for example, by integrating stochastic process models with varying routine stability, or by learning higher-level mobility motifs from real data under formal privacy guarantees.
User profiles are temporally static over the 12-week simulation horizon. In practice, individual behavior evolves over time due to seasonal effects, life events, and changes in habits (e.g., increased gym visits after holidays or dietary changes following health interventions). Extending the framework to model longitudinal evolution of exercise habits, shopping frequency, and dietary preferences would improve realism and enable the study of privacy risks in longer-term datasets.
The current population focuses on full-time urban workers in a single metropolitan region. While this cohort is important and representative of many IoT deployments, it omits other groups such as students, retirees, shift workers, or rural residents whose mobility and transaction patterns may differ substantially. Incorporating additional demographic strata and geographic contexts would improve the generalizability of the findings and support broader use cases.

6.2.3. Correlation Structure and Privacy Guarantees

Although our design incorporates realistic cross-modal correlations, these are specified through hand-crafted rules and independent class assignments rather than learned from real data. In reality, relationships between exercise, diet, mobility, and spending may be more complex and heterogeneous than our model captures. A promising direction is to train generative models on real multimodal IoT datasets using techniques such as differential privacy to infer correlation structures while limiting leakage of individual-level information.
The framework currently focuses on measuring re-identification risk but does not enforce formal privacy guarantees, such as differential privacy, in and of itself. While the synthetic datasets are not derived from real individuals, the high uniqueness rates demonstrate that realistic synthetic data can still exhibit strong identifying structure. Future work should integrate differentially private mechanisms into the synthesis process and systematically compare privacy–utility trade-offs between non-private and private synthetic generation strategies within the same benchmarking environment.

6.3. Addressing Modeling Simplifications

The generative process deliberately incorporates several simplifying assumptions (e.g., consistent daily routines, simplified dietary classes, fixed work locations). While these choices help keep the model interpretable and scalable, they may not capture the full diversity and variability in real-world behavior. Future work should investigate how relaxing these assumptions—through more stochastic routines, richer dietary models, or time-varying profiles—affects both the realism of the synthetic data and its suitability for downstream analyses.

6.4. Ethical Considerations

Although the datasets produced by our framework are fully synthetic and contain no direct information about real individuals, their realism and high uniqueness raise important ethical considerations.
A first concern is dual use. Techniques for generating realistic, high-resolution behavioral traces can support beneficial applications, such as privacy research, robustness testing, and benchmarking. However, they could also be misused to simulate plausible individual trajectories for fraud, impersonation, or surveillance. To mitigate this risk, we advocate for responsible disclosure practices, clear documentation of modeling assumptions and limitations, and the use of synthetic datasets primarily in controlled research and development settings.
A second concern relates to consent and transparency in real-world IoT deployments. Prior work has highlighted that even heavily processed and seemingly anonymized behavioral traces may remain highly identifying, especially when multiple modalities are combined. This challenges common narratives that data can be safely shared once direct identifiers are removed, and suggests that users may not be fully informed about the true re-identification risks associated with IoT data collection and sharing, especially from public avenues such as Smart City applications, where most residents are often unaware of the nature and volume of data collected with the potential to reveal private aspects of their daily lives.
These considerations have implications for regulatory frameworks governing personal data. High re-identification rates reported in the literature for real-world behavioral datasets suggest that simple de-identification may not be sufficient to consider IoT datasets outside the scope of privacy regulations, such as the GDPR or CCPA, where, in reality, they are closely and intrinsically tied to real populations or behaviors. Regulators and practitioners may need to explicitly account for cross-modal linkage attacks and consider formal privacy guarantees when defining what constitutes anonymized or non-personal data in the context of IoT and behavioral analytics.
Overall, we view the proposed framework not as a solution to IoT privacy challenges, but as an analytical tool for understanding and quantifying them. By making multimodal synthetic data and associated privacy evaluations explicit and reproducible, we aim to support the design of more robust, privacy-preserving technologies, more realistic threat models, and more informed policy discussions regarding the responsible use of behavioral traces. It is our goal for this framework to serve as the basis for future studies into these risks, conducted by our team and the broader scientific community.

7. Conclusions

This paper presents a comprehensive framework for synthesizing heterogeneous, multimodal IoT datasets that span cellular mobility, payment transactions, and grocery purchases. Our probabilistic generation methods preserve realistic behavioral patterns and cross-domain correlations while enabling systematic assessment of privacy risks.
The key contributions of this work include:
  • The framework generates large-scale, multimodal IoT data with realistic spatio-temporal and behavioral patterns across mobility, transactions, and nutrition.
  • The joint modeling of multiple modalities captures cross-domain structure such as the coupling between commuting patterns, shopping behavior, and dietary profiles.
  • The resulting datasets are suitable for benchmarking IoT analytics algorithms and for future studies on anonymization, differential privacy, and probabilistic record linkage in a controlled synthetic environment.
While we report preliminary uniqueness indicators and identify plausible cross-modal linkage channels, formal re-identification experiments—benchmarking specific attack algorithms under varied adversarial assumptions—remain as planned future work. The framework generates privacy-auditable datasets (116M mobility records, 5.4M transactions, 1.9M nutrition entries) serving as benchmarks for evaluating anonymization techniques and machine learning models in IoT contexts.
Future work should extend the framework to incorporate: (1) temporal behavioral evolution, (2) demographic diversity beyond urban workers, (3) learned correlation structures from real data, and (4) integrated differential privacy mechanisms. Our methodology provides a foundation for responsible synthetic data generation in privacy-sensitive domains, including smart cities, digital health, and behavioral commerce. Once completed, we intend to publicly release the framework and the generated datasets.

Author Contributions

Investigation, M.B., M.H. and H.S.; writing—original draft preparation, M.B. and M.H.; writing—review and editing, M.B., M.H., H.S. and J.L.J.; supervision, H.S. and M.H.; project administration, H.S. and M.H. All authors have read and agreed to the published version of the manuscript.

Funding

This research was funded by the Advanced Telecommunications Engineering Lab (TEL) at the University of Nebraska–Lincoln under TEL’s Young Faculty Mentor Grant program.

Data Availability Statement

The data presented in this study are available on request from the corresponding author due to being part of an ongoing research effort.

Acknowledgments

During the preparation of this manuscript, the authors used Google’s Gemini 3 Pro Image for the sole purpose of generating the high-level illustration at the beginning of this paper. The authors have reviewed the result and confirmed its applicability. No GenAI was used for conducting this research or for the writing of this manuscript. Notice: This manuscript has been authored by UT-Battelle, LLC, under contract DE-AC05-00OR22725 with the US Department of Energy (DOE). The publisher, by accepting this article for publication, acknowledges that the US government retains a nonexclusive, paid-up, irrevocable, worldwide license to publish or reproduce the published form of this manuscript, or allow others to do so, for US government purposes. DOE will provide public access to these results of federally sponsored research in accordance with the DOE Public Access Plan (https://www.energy.gov/doe-public-access-plan, accessed on 4 February 2026).

Conflicts of Interest

The authors declare no conflicts of interest.

References

  1. De Montjoye, Y.A.; Radaelli, L.; Singh, V.K.; Pentland, A.S. Unique in the shopping mall: On the reidentifiability of credit card metadata. Science 2015, 347, 536–539. [Google Scholar] [CrossRef] [Scilit]
  2. Dwork, C.; McSherry, F.; Nissim, K.; Smith, A. Calibrating Noise to Sensitivity in Private Data Analysis. In Proceedings of the Theory of Cryptography Conference (TCC); Lecture Notes in Computer Science; Springer: Berlin/Heidelberg, Germany, 2006; Volume 3876, pp. 265–284. [Google Scholar]
  3. Dwork, C.; Roth, A. The Algorithmic Foundations of Differential Privacy; Now Publishers, Inc.: Hanover, MA, USA, 2014; Volume 9, pp. 211–407. [Google Scholar]
  4. De Montjoye, Y.A.; Hidalgo, C.A.; Verleysen, M.; Blondel, V.D. Unique in the crowd: The privacy bounds of human mobility. Sci. Rep. 2013, 3, 1376. [Google Scholar] [CrossRef] [Scilit]
  5. Schlackl, F.; Link, N.; Hoehle, H. Antecedents and consequences of data breaches: A systematic review. Inf. Manag. 2022, 59, 103638. [Google Scholar] [CrossRef] [Scilit]
  6. Reiter, J.P. Using CART to generate partially synthetic public use microdata. J. Off. Stat. Stockh. 2005, 21, 441. [Google Scholar]
  7. Stadler, T.; Oprisanu, B.; Troncoso, C. Synthetic data–anonymisation groundhog day. In Proceedings of the 31st USENIX Security Symposium (USENIX Security 22), Boston, MA, USA, 10–12 August 2022; pp. 1451–1468. [Google Scholar]
  8. Giomi, M.; Boenisch, F.; Wehmeyer, C.; Tasnádi, B. A unified framework for quantifying privacy risk in synthetic data. arXiv 2022, arXiv:2211.10459. [Google Scholar] [CrossRef] [Scilit]
  9. Xu, F.; Tu, Z.; Li, Y.; Zhang, P.; Fu, X.; Jin, D. Trajectory Recovery From Ash: User Privacy Is NOT Preserved in Aggregated Mobility Data. arXiv 2017, arXiv:1702.06270. [Google Scholar] [CrossRef] [Scilit]
  10. Preibusch, S.; Peetz, T.; Acar, G.; Berendt, B. Purchase Details Leaked to PayPal. In Proceedings of the Financial Cryptography and Data Security (FC 2015); Revised Selected Papers; Lecture Notes in Computer Science; Springer: Berlin/Heidelberg, Germany, 2015; Volume 8975, pp. 217–226. [Google Scholar]
  11. Yang, H.; Ping, A.; Wei, H.; Zhai, G. Unique in the metro system: The likelihood to re-identify a metro user with limited trajectory points. Phys. A Stat. Mech. Its Appl. 2023, 628, 129176. [Google Scholar] [CrossRef] [Scilit]
  12. Fan, X.; Qu, X.; Yang, H. Privacy Risk Assessment of Travel Trajectories in Metro AFC Data; Technical Report; SAE: Warrendale, PA, USA, 2025. [Google Scholar]
  13. Khaliq, A.A.; Anjum, A.; Ajmal, A.B.; Webber, J.L.; Mehbodniya, A.; Khan, S. A secure and privacy preserved parking recommender system using elliptic curve cryptography and local differential privacy. IEEE Access 2022, 10, 56410–56426. [Google Scholar] [CrossRef] [Scilit]
  14. Alqazzaz, A.; Alrashdi, I.; Aloufi, E.; Zohdy, M.; Ming, H. Secsps: A secure and privacy-preserving framework for smart parking systems. J. Inf. Secur. 2018, 9, 299–314. [Google Scholar] [CrossRef]
  15. Rubin, D.B. Discussion: Statistical disclosure limitation. J. Off. Stat. 1993, 9, 461–468. [Google Scholar]
  16. Goodfellow, I.J.; Pouget-Abadie, J.; Mirza, M.; Xu, B.; Warde-Farley, D.; Ozair, S.; Courville, A.; Bengio, Y. Generative adversarial nets. Adv. Neural Inf. Process. Syst. 2014, 2672–2680. [Google Scholar]
  17. Kingma, D.P.; Welling, M. Auto-encoding variational bayes. arXiv 2013, arXiv:1312.6114. [Google Scholar]
  18. Shokri, R.; Stronati, M.; Song, C.; Shmatikov, V. Membership inference attacks against machine learning models. In Proceedings of the 2017 IEEE Symposium on Security and Privacy (SP), San Jose, CA, USA, 22–24 May 2017; pp. 3–18. [Google Scholar]
  19. Fredrikson, M.; Jha, S.; Ristenpart, T. Model inversion attacks that exploit confidence information and basic countermeasures. In Proceedings of the 22nd ACM SIGSAC Conference on Computer and Communications Security, Denver, CO, USA, 12–16 October 2015; pp. 1322–1333. [Google Scholar]
  20. Abadi, M.; Chu, A.; Goodfellow, I.; McMahan, H.B.; Mironov, I.; Talwar, K.; Zhang, L. Deep learning with differential privacy. In Proceedings of the 2016 ACM SIGSAC Conference on Computer and Communications Security, Vienna, Austria, 24–28 October 2016; pp. 308–318. [Google Scholar]
  21. Kulkarni, V.; Tagasovska, N.; Vatter, T.; Garbinato, B. Generative Models for Simulating Mobility Trajectories. arXiv 2018, arXiv:1811.12801. [Google Scholar] [CrossRef] [Scilit]
  22. Altman, E. Synthesizing credit card transactions. In Proceedings of the Second ACM International Conference on AI in Finance, Virtual, 3–5 November 2021; pp. 1–9. [Google Scholar]
  23. Walonoski, J.; Kramer, M.; Nichols, J.; Quina, A.; Moesel, C.; Hall, D.; Duffett, C.; Dube, K.; Gallagher, T.; McLachlan, S. Synthea: An approach, method, and software mechanism for generating synthetic patients and the synthetic electronic health care record. J. Am. Med. Inform. Assoc. 2018, 25, 230–238. [Google Scholar] [CrossRef] [Scilit] [PubMed]
  24. Beaulieu-Jones, B.K.; Wu, Z.S.; Williams, C.; Lee, R.; Bhavnani, S.P.; Byrd, J.B.; Greene, C.S. Privacy-preserving generative deep neural networks support clinical data sharing. Circ. Cardiovasc. Qual. Outcomes 2019, 12, e005122. [Google Scholar] [CrossRef] [Scilit] [PubMed]
  25. Li, D.C.; Lin, L.S. Generating information for small data sets with a multi-modal distribution. Decis. Support Syst. 2014, 66, 71–81. [Google Scholar] [CrossRef] [Scilit]
  26. Li, C.L.; Chang, W.C.; Cheng, Y.; Yang, Y.; Póczos, B. Mmd gan: Towards deeper understanding of moment matching network. In Proceedings of the Advances in Neural Information Processing Systems, Long Beach, CA, USA, 4–9 December 2017; Volume 30. [Google Scholar]
  27. Angel, S.; Parent, J.; Civco, D.L.; Blei, A.; Potere, D. The dimensions of global urban expansion: Estimates and projections for all countries, 2000–2050. Prog. Plan. 2011, 75, 53–107. [Google Scholar] [CrossRef] [Scilit]
  28. U.S. Bureau of Labor Statistics. 70.1 Percent of Workers Were Full-Time, Year-Round in 2023. The Economics Daily, U.S. Bureau of Labor Statistics. 2025. Available online: https://www.bls.gov/opub/ted/2025/70-1-percent-of-workers-were-full-time-year-round-in-2023.htm (accessed on 14 July 2025).
  29. Centers for Disease Control and Prevention (CDC), National Center for Health Statistics. FastStats: Exercise or Physical Activity, Online. 2024. Available online: https://www.cdc.gov/nchs/fastats/exercise.htm (accessed on 10 December 2025).
  30. Rada, A.; Szabó, Á. The impact of the pandemic on the fitness sector–The general international situation and a Hungarian example. Soc. Econ. 2022, 44, 477–497. [Google Scholar] [CrossRef] [Scilit]
  31. Isaacman, S.; Becker, R.; Cáceres, R.; Martonosi, M.; Rowland, J.; Varshavsky, A.; Willinger, W. Human mobility modeling at metropolitan scales. In Proceedings of the 10th International Conference on Mobile Systems, Applications, and Services, Lake District, UK, 25–29 June 2012; pp. 239–252. [Google Scholar]
  32. Capital One Shopping Research. Number of Credit Card Transactions per Second, Day & Year. 2025. Available online: https://capitaloneshopping.com/research/number-of-credit-card-transactions/ (accessed on 17 July 2025).
  33. Clearly Payments. What is the Average Transaction Size in Payments by Sector in 2025? 2025. Available online: https://www.clearlypayments.com/blog/what-is-the-average-transaction-size-in-payments-by-sector-in-2025/ (accessed on 12 December 2025).
  34. Eagle, N.; Pentland, A. Reality mining: Sensing complex social systems. Pers. Ubiquitous Comput. 2006, 10, 255–268. [Google Scholar] [CrossRef] [Scilit]
  35. Gonzalez, M.C.; Hidalgo, C.A.; Barabasi, A.L. Understanding individual human mobility patterns. Nature 2008, 453, 779–782. [Google Scholar] [CrossRef] [Scilit]
  36. Chen, G.; Viana, A.C.; Fiore, M.; Sarraute, C. Complete trajectory reconstruction from sparse mobile phone data. EPJ Data Sci. 2019, 8, 30. [Google Scholar] [CrossRef] [Scilit]
  37. Zhang, P.; Liu, M.; Xu, J.; Zhu, Z.; Cao, R. Characterizing Temporal Patterns of Intra-Urban Human Mobility in Bike-Sharing through Trip Analysis: A Case Study of Shanghai, China. Appl. Sci. 2024, 14, 8583. [Google Scholar] [CrossRef] [Scilit]
Figure 1. High-level overview of smart city IoT and its privacy risks.
Electronics 15 00692 g001
Figure 2. System architecture for multimodal IoT data synthesis.
Electronics 15 00692 g002
Figure 3. Work location distribution across three commercial hot zones.
Electronics 15 00692 g003
Figure 4. Distribution of workout frequency classes.
Electronics 15 00692 g004
Figure 5. Distribution of workout venue types.
Electronics 15 00692 g005
Figure 6. Distribution of simulated gym locations across the simulated urban environment.
Electronics 15 00692 g006
Figure 7. Distribution of 500 cell tower locations across the 312 km2 study area.
Electronics 15 00692 g007
Figure 8. Example mobility trace for a single synthetic user over a 24 h period.
Electronics 15 00692 g008
Figure 9. Distribution of 1200 merchant locations across the study area.
Electronics 15 00692 g009
Figure 10. Data generation pipeline showing parallel synthesis of mobility, transaction, and nutrition streams.
Electronics 15 00692 g010
Figure 11. Mobility patterns across all users.
Electronics 15 00692 g011
Table 1. Comparison of proposed framework with existing synthetic data generation approaches.
ApproachDomain(s)Multimodal
Support
Cross-Domain
Consistency
Interpretable
Generation
IoT/Smart
City Focus
Traditional Statistical
Methods [15]
TabularNoN/AYesNo
GAN-based
Generators [16]
VariousNoN/ANoNo
VAE-based
Generators [17]
VariousNoN/ANoNo
Kulkarni et al. [21]Mobility tracesNoN/ANoPartial
Altman [22]Credit card transactionsNoN/ANoNo
Synthea [23]Electronic
health records
NoN/AYesNo
Beaulieu-Jones
et al. [24]
Clinical/EHRNoN/ANoNo
Li et al. [26]Small-scale multimodalYesLimitedNo
Proposed FrameworkMobility, transactions, nutritionYesYesYesYes
Table 2. Transaction amount distributions by merchant category.
CategoryMCC μ σ Median (USD)
Grocery54113.750.3542.52 (30–60)
Quick-Service58142.400.5511.02 (6–20)
Full-Service58123.800.4544.70 (25–80)
Table 3. Summary of framework hyperparameters and distribution settings.
ComponentParameterValue
Simulation Scope (Section 3.2)
Study area312 km2
Population size40,000 users
Time horizon12 weeks
User Profile Generation (Section 3.3)
Home location jitter50–100 m
Work start times7:00, 8:00, 9:00 a.m. (uniform)
Work duration9 h
Exercise Behavior (Section 3.3.2)
Class 0 (never exercise)13%
Class 1 (occasional)40%
Class 2 (regular)47%
Venue: Home40%
Venue: Outdoor30%
Venue: Gym30%
Dietary/Shopping Behavior (Section 3.3.3)
Rare grocery frequency15% (<1 trip/week)
Mixed grocery frequency50% (2–3 trips/week)
Frequent grocery frequency35% (4–6 trips/week)
Unhealthy eating20%
Moderate eating50%
Healthy eating30%
Mobility Simulation (Section 3.4)
Stationary ping interval3–5 min
Location noise σ = 50 m (Gaussian)
Number of cell towers500
Tower coverage radius300–800 m
Nearest tower selection probability85%
Transit travel time15–60 min (uniform)
Maximum transit speed50 km/h
Transit waypoint interval3–5 min
Transaction Simulation (Section 3.5)
Number of merchants1200
Merchant mix: Grocery15%
Merchant mix: Restaurants30%
Merchant mix: Fast food25%
Merchant mix: Gas stations10%
Merchant mix: General retail20%
Daily transaction ratePoisson ( α = 1.6 )
Merchant search radius (KD-tree)500–1000 m
Monthly budget N ( 1500 , 400 ) USD
Transaction Amounts (Table 1)
Grocery (MCC 5411) μ = 3.75 , σ = 0.35 (log-normal)
Quick-Service (MCC 5814) μ = 2.40 , σ = 0.55 (log-normal)
Full-Service (MCC 5812) μ = 3.80 , σ = 0.45 (log-normal)
Nutrition Generation (Section 3.6)
Product catalog size500 items
Basket sizeTruncated Poisson ( λ = 3.5 )
Nutritional filter rejection rate90%
Table 4. Validation of synthetic dataset against empirical benchmarks.
MetricAchieved ValueExpected ValueSource
Mobility entropy3.2 bits (mean)2–4 bitsMIT Reality Mining dataset [34]
Radius of gyration8.3 km (median)5–10 kmUrban mobility studies [35,36]
Transaction frequency1.6 per day1.4–1.8 per dayU.S. consumer payment data [32]
Spending distributionWithin 10% of MCC benchmarksIndustry averagesPayment processor statistics [33]
Table 5. Summary of preliminary uniqueness and linkage indicators.
IndicatorValuePrivacy Implication
Median of merchants visited per week7–8High transaction sparsity enables re-identification with few observations [1]
Transactions within 1 km of current location78%Spatial clustering constrains candidate set when location is known
Lunch purchases within 500 m of work92%Direct linkage channel between mobility (work anchor) and transactions
Grocery purchases within 2 km of home65%Home location inference from transaction patterns
Exercise frequency–gym visit correlation ρ = 0.82 Cross-modal linkage between transaction (membership) and mobility data
Mobility entropy–merchant diversity correlation ρ = 0.58 Behavioral fingerprinting across modalities
Grocery frequency–fast food correlation ρ = 0.44 Dietary fingerprints link nutrition to
transaction histories
Disclaimer/Publisher’s Note: The statements, opinions and data contained in all publications are solely those of the individual author(s) and contributor(s) and not of MDPI and/or the editor(s). MDPI and/or the editor(s) disclaim responsibility for any injury to people or property resulting from any ideas, methods, instructions or products referred to in the content.