Article

Effect of the Mass Transfer Biot Number on Moisture Desorption and Hygrothermal Stress in QFN Packages


College of Smart Materials and Future Energy, Fudan University, 2005 Songhu Road, Shanghai 200438, China
*
Author to whom correspondence should be addressed.
Electronics 2026, 15(17), 3835; https://doi.org/10.3390/electronics15173835
Submission received: 16 July 2026 / Revised: 19 August 2026 / Accepted: 25 August 2026 / Published: 26 August 2026

Abstract

Package-level hygrothermal simulations commonly represent drying at epoxy molding compound (EMC) surfaces using idealized boundary conditions, which may not fully capture the coupled effects of bulk moisture diffusion and surface evaporation during reflow soldering and thermal cycling. This study developed a diffusion- and evaporation-based hygrothermal mechanical model for quad-flat no-lead (QFN) packages by incorporating an evaporation boundary formulation with moisture transport parameters obtained from independent moisture absorption and desorption experiments. The mass transfer Biot number S was introduced to quantify the relative roles of bulk moisture diffusion and surface evaporation in package desorption. Comparative simulations demonstrated that S influenced surface moisture removal kinetics and moisture retention during thermal loading, resulting in variations in predicted hygrothermal stress evolution. The proposed approach provides an experimentally calibrated and physically representative treatment of desorption boundaries for reliability analysis of plastic encapsulated packages.

1. Introduction

Moisture absorption in plastic encapsulated devices induces coupled hygrothermal effects during reflow soldering and thermal cycling [1,2,3]. Moisture ingress into the epoxy molding compound (EMC) and along material interfaces produces hygroscopic swelling, interfacial degradation, and vapor-pressure-induced stresses. Together with thermal expansion mismatch, these effects promote warpage, delamination, and cracking in packages [4,5,6]. Accurate characterization of moisture transport and the resulting hygro-mechanical response is therefore essential for reliability designs and failure assessment of plastic encapsulated packages.
At the material scale, EMC desorption is not simply the reverse of absorption; it reflects the combined effects of bulk diffusion, sorption history, and finite surface evaporation. Experimental studies have shown that EMC absorption and desorption do not necessarily exhibit identical apparent kinetics, particularly at elevated temperatures, owing to material-dependent contributions from moisture state, non-Fickian transport, and residual moisture [7,8,9].
This asymmetry becomes particularly significant when moisture reaches exposed EMC surfaces. Thermogravimetric analyses and moisture-induced delamination studies reveal that moisture release is limited by finite evaporation rather than instantaneous removal [5,10]. The mass transfer Biot number S relates surface mass transfer resistance to bulk diffusion behavior, thereby distinguishing diffusion-dominated and evaporation-dominated desorption regimes [11]. Package-level reflow models, including direct moisture concentration formulations for moisture transport analysis [12], have enabled predictions of moisture redistribution during reflow. However, the desorption boundaries in these models are often simplified as idealized zero-concentration or instantaneous surface equilibrium conditions. A package-level approach that links experimentally characterized desorption kinetics to a finite surface-removal boundary is therefore needed.
To address this gap, this study developed a hygrothermal approach that couples moisture diffusion with finite surface evaporation in quad-flat no-lead (QFN) packages. A finite surface mass transfer boundary, calibrated using independent absorption and desorption experiments, was implemented in a COMSOL Multiphysics version 6.2 model to simulate moisture redistribution and stress evolution during moisture conditioning, reflow soldering, and subsequent thermal cycling. The coupled effects of bulk moisture diffusion and surface evaporation were characterized using the mass transfer Biot number S, enabling evaluation of their influence on package desorption behavior. The role of S-dependent desorption kinetics in governing moisture retention and hygrothermal stress development was investigated to establish a more physically realistic boundary treatment for reliability assessment of plastic packages.

2. Moisture Transport and Hygrothermal Coupling

2.1. Moisture Transport in EMC

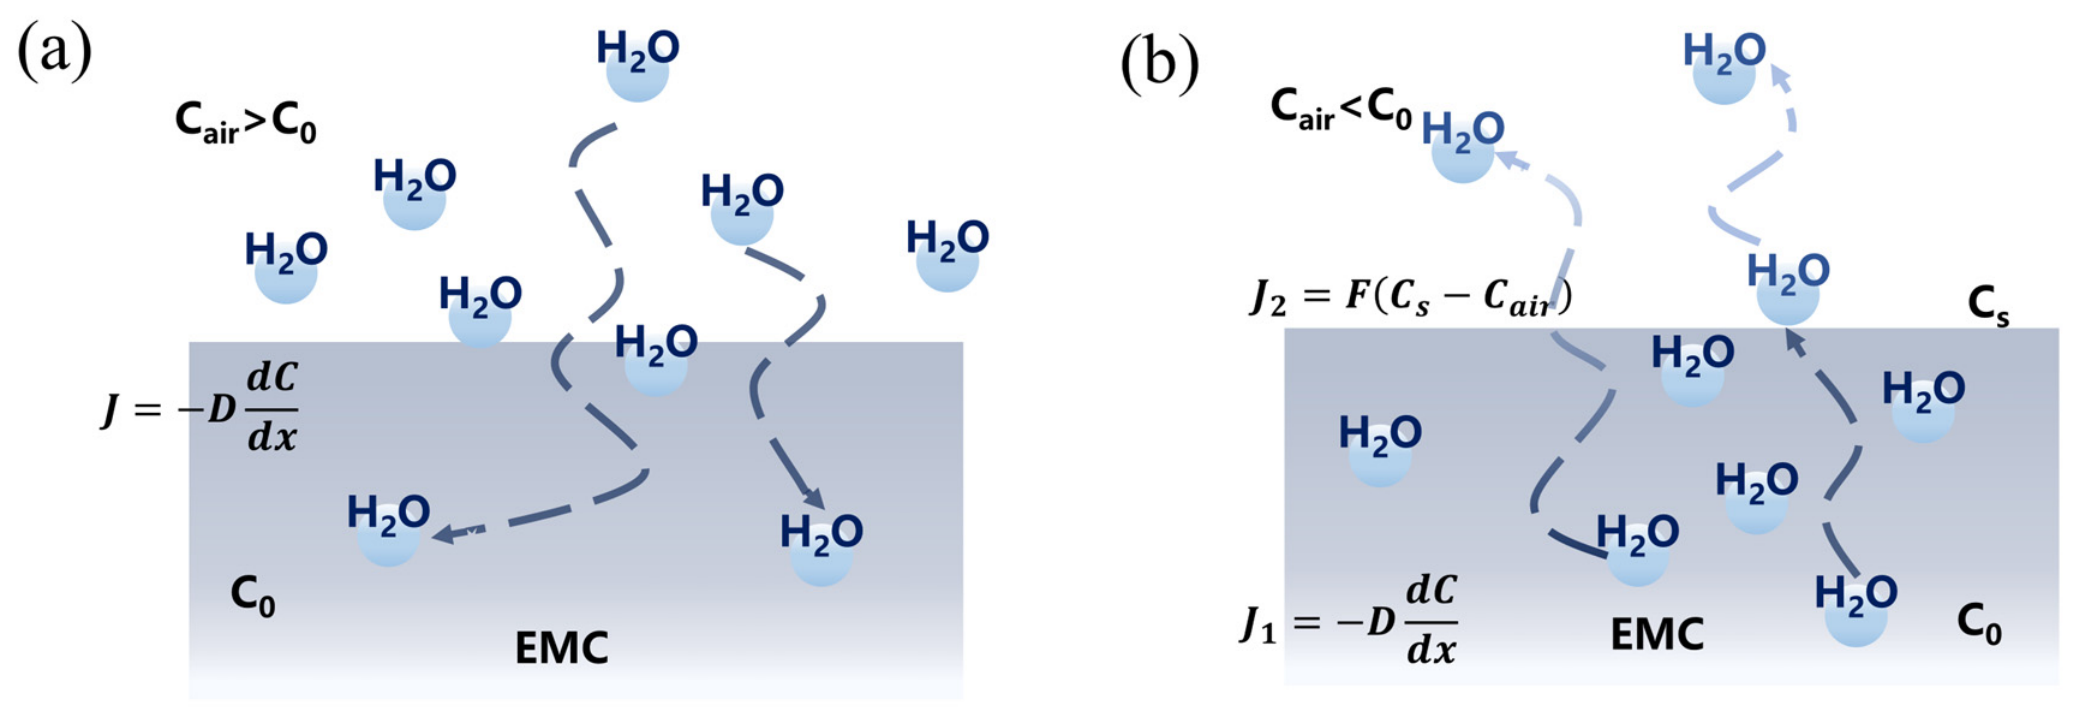
During moisture absorption, ambient moisture penetrates into the EMC through exposed surfaces under humid conditions, as shown in Figure 1a. The moisture transport within the EMC is driven by concentration gradients and follows Fickian diffusion behavior [7,13,14]. As absorption proceeds, the moisture concentration inside the EMC increases, while the driving concentration gradient and diffusion flux decrease gradually until moisture equilibrium is achieved.
Under elevated temperature desorption, moisture transport in EMC is governed by the coupled effects of bulk diffusion and surface evaporation, as illustrated in Figure 1b. Specifically, moisture diffuses from the EMC interior toward the exposed surface and subsequently evaporates into the surrounding environment [15,16]. Bulk moisture diffusion is driven by the concentration gradient and characterized by the diffusion coefficient D, whereas surface evaporation is described by the surface mass transfer coefficient F. Therefore, the desorption behavior is determined by the competition between bulk diffusion and surface evaporation.
Moisture in dense EMC exists predominantly as molecularly dissolved or hydrogen-bonded water rather than as bulk liquid water [9,17]; therefore, exceeding the normal boiling point does not imply bulk vaporization throughout the intact matrix. For the present comparison of S-dependent moisture redistribution, concentration-driven Fickian diffusion with a Robin evaporation boundary was adopted as an engineering approximation. The model does not resolve local phase change or vapor accumulation within nanoscale free volumes, pores, or interfacial defects because their geometry, volume fraction, and condensed-water content were not characterized. Consequently, vapor-pressure-induced mechanical loading is not included, and the model is not intended to predict popcorning, crack initiation, or delamination during reflow [12].
Under a one-dimensional approximation, the bulk moisture diffusion flux J1 can be expressed as follows:
J 1 = D C 0 C s L
where C0 and Cs denote the bulk and surface moisture concentrations, respectively, and L represents the specimen thickness.
At the exposed surface, moisture release to the surrounding environment is governed by a finite surface mass transfer boundary condition. The surface mass transfer coefficient F represents the moisture transfer capacity at the EMC surface and relates the evaporation flux to the concentration difference between the EMC surface and the ambient environment. The corresponding surface evaporation flux J2 can be expressed as follows:
J 2 = F C s C a i r
where Cair is the ambient moisture concentration. Under a quasi-steady surface mass balance assumption, moisture accumulation at the EMC surface is neglected. The bulk moisture diffusion flux and surface evaporation flux are therefore equal (J1 = J2 = J), from which the following relationship is obtained:
J = C 0 C a i r L / D + 1 / F
The quasi-steady approximation applies only to interfacial moisture storage and does not impose a constant surface concentration. During reflow, Cs evolves with the transient EMC concentration field, while D and F are updated with temperature; thus, finite surface resistance and near-surface moisture redistribution are retained. The interface is assumed to have negligible independent storage capacity, which requires the characteristic timescale of surface relaxation and moisture removal to be shorter than the thermal-ramp and bulk-diffusion timescales. A distinct adsorbed or condensed surface phase is not resolved in the present model. Within the series resistance framework for mass transfer [18,19,20], L/D and 1/F represent the bulk moisture diffusion resistance and surface evaporation resistance, respectively. The overall desorption flux is determined by the overall concentration difference divided by the total mass transfer resistance. The mass transfer Biot number S = FL/D quantifies the relative contributions of bulk moisture diffusion and surface evaporation, thereby characterizing the dominant transport mechanism during EMC desorption.

2.2. Analytical Solutions for Moisture Absorption and Desorption

Moisture absorption with a prescribed surface concentration and moisture desorption with finite surface mass transfer can both be described analytically. In the present framework, the absorption-derived D was adopted as the bulk diffusion coefficient of mobile moisture during desorption, while the absorption–desorption asymmetry was represented primarily by the Robin boundary condition. Specifically, F was calibrated from the desorption data with D held fixed. This treatment is a modeling assumption rather than a general assertion that the intrinsic bulk diffusivities during absorption and desorption are identical. Possible process-dependent changes in bulk moisture mobility were not resolved separately; therefore, the calibrated F and the absolute desorption predictions are conditional on the adopted D. The same formulation was applied to all models to provide a consistent basis for comparing the effects of different surface boundary conditions. These solutions provide the basis for determining the moisture transport parameters used in the finite element analysis (FEA) of package-level models.
Consider a homogeneous and isotropic EMC with a moisture concentration field C(x,t) and a constant diffusion coefficient D. Fickian diffusion combined with mass conservation leads to Fick’s second law. During moisture absorption testing, the initially dry specimen is subjected to a prescribed equilibrium surface concentration, corresponding to a Dirichlet boundary condition. For one-dimensional moisture diffusion in a flat specimen with thickness L, the governing equation and corresponding boundary conditions are given as follows:
C t = D 2 C x 2 , C | x = ± L / 2 = C s
The equations are solved to obtain the moisture concentration distribution [21,22]:
C ( x , t ) = C s 1 4 π n = 0 1 n 2 n + 1 exp 2 n + 1 2 π 2 D L 2 t cos 2 n + 1 π L x
where Cs denotes the surface moisture concentration of EMC. Under high-humidity absorption conditions, surface mass transfer resistance was neglected, and the exposed surface is assumed to rapidly reach equilibrium with the ambient environment, i.e., Cs = Cair. Integrating the concentration field over the specimen thickness gives the following:
M t M = 1 8 π 2 n = 0 1 n 2 n + 1 exp 2 n + 1 2 π 2 D L 2 t
Mt and M denote the moisture mass at time t and at equilibrium, respectively. In short time moisture absorption, Equation (6) can be reduced to the following [23,24]:
M t M = 4 L D t π
For long-time moisture absorption approaching equilibrium, Equation (6) can be approximated as follows:
M t M = 1 8 π 2 exp ( π 2 D t L 2 )
For moisture desorption, the exposed surface is described by a finite surface mass transfer boundary condition. Using the method of separation of variables, the concentration field and the partial differential governing equation can be expressed as follows:
C C air = X x T t 1 T d T d t = D X d 2 X d x 2 = λ 2 D
where λ is the separation constant. Solving the resulting ordinary differential equations with respect to x and t gives the following series solution:
C x , t C air = n = 1 B n cos λ n x exp λ n 2 D t
The coefficients Bn are determined by applying the surface mass transfer boundary conditions to Equation (10), yielding the following:
B n = C 0 C air 2 β n sin β n 1 + 1 2 β n sin 2 β n
where β = λL. The evaporation boundary effect is incorporated through the mass transfer Biot number S = FL/D, which characterizes the competition between bulk moisture diffusion and surface evaporation during desorption. The resulting concentration field is as follows:
C C 0 C air C 0 = 1 n = 1 2 S cos β n x L exp β n 2 D t L 2 β n 2 + S 2 + S cos β n S = β tan β
The eigenvalue equation S = βtanβ has infinitely many discrete roots {βn} in different intervals, corresponding to eigen-solutions of different orders [21]. The Biot number S represents the ratio of bulk moisture diffusion resistance L/D to surface evaporation resistance 1/F. When S = 1, the two resistances are comparable. For S > 1, the surface evaporation resistance is relatively small, and the desorption process is mainly limited by bulk moisture diffusion within the EMC. For S < 1, the surface evaporation resistance dominates, and moisture release at the exposed surface becomes the rate-limiting process.
Integrating the moisture concentration field over the EMC volume gives the normalized moisture mass:
M t M = n = 1 2 S 2 exp β n 2 D t L 2 β n 2 β n 2 + S 2 + S
Both bulk moisture diffusion and surface evaporation are temperature dependent. The diffusion coefficient D describes bulk transport, whereas the surface mass transfer coefficient F characterizes surface evaporation; both parameters are represented by Arrhenius relationships [25,26].
D = D 0 exp Δ E D R T
F = F 0 exp Δ E F R T
where D0 and F0 are pre-exponential factors, ΔED and ΔEF are the activation energies for diffusion and evaporation, respectively, and R is the gas constant.
Since S = FL/D, the mass transfer Biot number also exhibits Arrhenius-type temperature dependence and represents the temperature-dependent competition between bulk moisture diffusion and surface evaporation.

2.3. Hygrothermal Stress

The moisture-transport formulation was coupled with heat transfer and solid mechanics in a finite element analysis framework to evaluate the package-level hygrothermal response. Thermal expansion and hygroscopic swelling were introduced as eigenstrains through strain decomposition. In the present formulation, the EMC was treated as a dense continuum, and the interfaces were assumed to be initially intact; therefore, vapor-pressure loading arising from discrete internal pores or interfacial defects was not included. The total strain tensor ε i j tol is expressed as follows:
ε i j tol = ε i j e + ε th δ i j + ε mo δ i j
where ε i j e denotes the components of the elastic strain tensor, with i, j representing the tensor indices. εth = α[T(x,t) −Tref] is the thermal strain, εmo = β[C(x,t) − Cref] is the hygroscopic swelling strain, where α and β are the coefficients of thermal expansion (CTE) and moisture expansion (CME), respectively, and δij is the Kronecker delta. The stress tensor σij is then obtained from the elastic strain through the constitutive relation:
σ i j = E i j k l ε k l tol ε th + ε mo δ k l ,
where Eijkl is the fourth-order material stiffness tensor component. The moisture field C(x,t) was calculated from the diffusion–evaporation model using the calibrated coefficients D and F. The transient moisture and temperature fields were coupled into the mechanical field through εmo and εth, respectively. This formulation enables the nonuniform moisture distribution, transient thermal loading, and stress evolution to be treated consistently in the package-level hygrothermal mechanical analysis.

3. Materials and Methods

3.1. Experimental Methods

Gravimetric absorption and desorption experiments were conducted to identify the moisture transport parameters required for the diffusion and evaporation model. The absorption experiment was used to determine the moisture diffusion coefficient D, whereas the desorption tests were used to determine the surface mass transfer coefficient F. These independently identified parameters defined the mass transfer Biot number S and the finite desorption boundary used in the package-level simulations.
  • Moisture absorption experiment
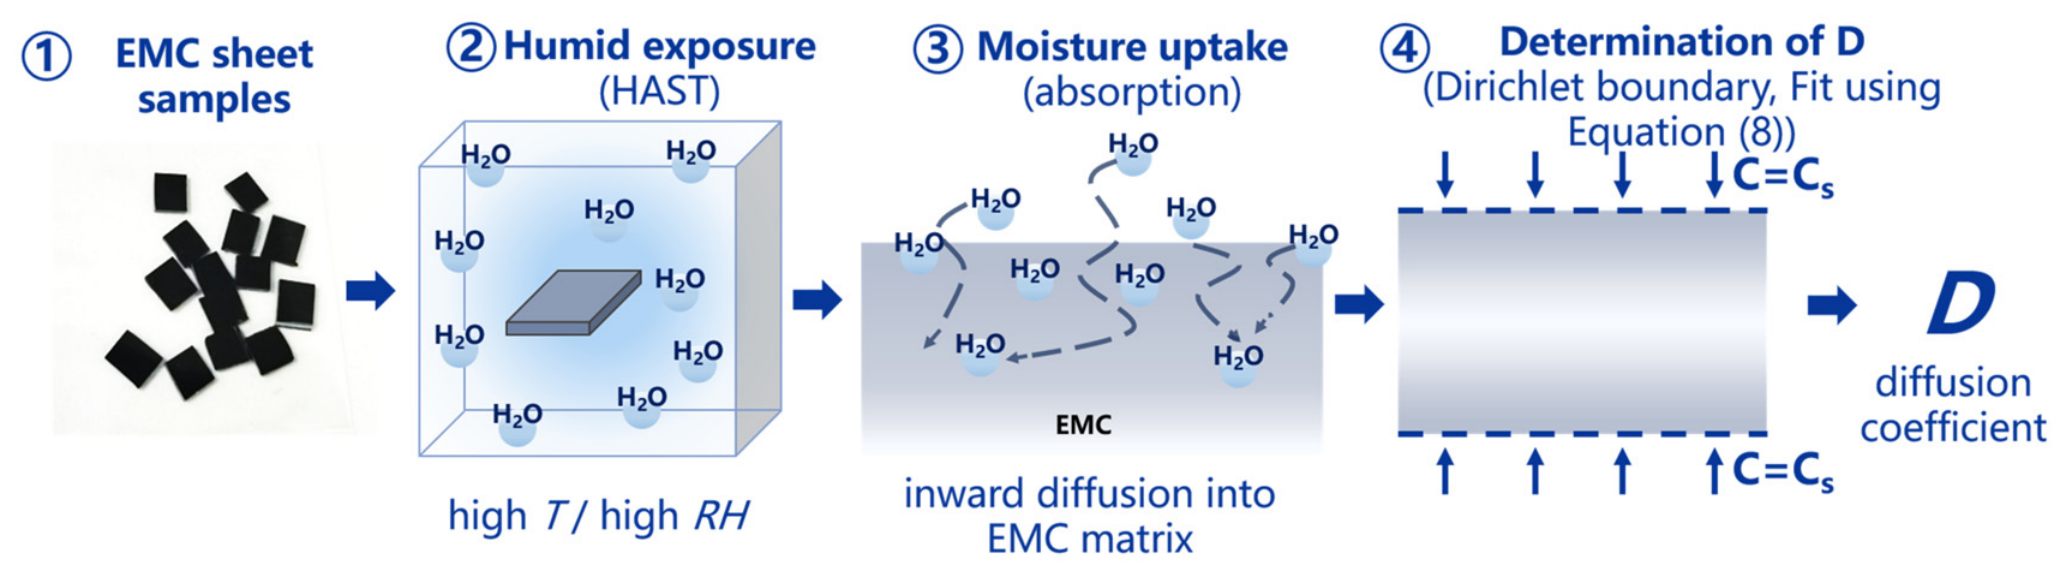
Strip EMC specimens with approximate dimensions of 15 × 10 × 1 mm were used for the absorption tests. Before conditioning, the specimens were dried at 100 °C for 48 h, and the dry mass was recorded as the reference mass. The specimens were divided into four groups and conditioned in a humidity test chamber (EHS-412M, ESPEC, Osaka, Japan) under different temperature and humidity conditions of 30 °C/60% RH, 60 °C/85% RH, 85 °C/85% RH, and 110 °C/85% RH, respectively. For each test condition, the absorption curve was normalized by its corresponding equilibrium moisture uptake, M. Within the adopted Fickian framework, the primary influence of relative humidity on moisture uptake was represented by the condition-specific M, while D was used to describe the normalized bulk-diffusion kinetics. This treatment is consistent with the commonly adopted engineering approximation that EMC diffusivity is predominantly temperature-dependent and provides a unified description for comparing the tested conditions. However, because temperature and relative humidity (RH) were not varied independently at a common temperature, the use of D should be regarded as a modeling assumption; the present dataset cannot exclude an additional dependence of D on relative humidity or moisture concentration. Specimen mass was measured every 12–24 h to obtain the transient mass gain response. At least five specimens were tested per condition. The diffusion coefficient D for each condition was determined by fitting the measured absorption curves to Equation (8), which was derived under the constant surface concentration boundary condition. The experimental procedure is shown in Figure 2.
  • Moisture desorption experiment
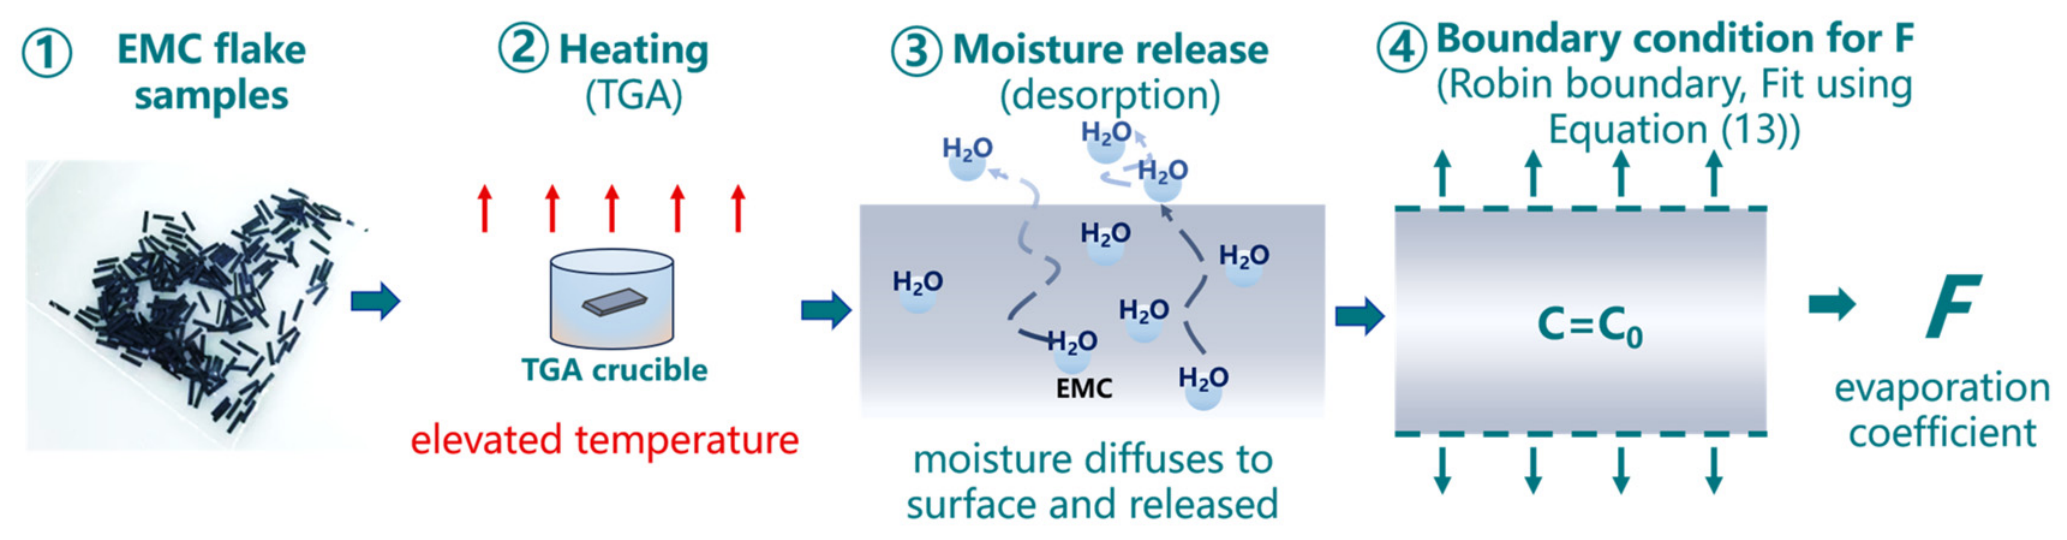
Thin EMC specimens with approximate dimensions of 5 × 1 × 0.3 mm were tested using a thermogravimetric analyzer (TGA, Q500, TA Instruments, New Castle, DE, USA). Prior to testing, the specimens were moisture conditioned and weighed to record their initial mass. Desorption measurements were performed under dry nitrogen at 50 °C, 100 °C, 150 °C, 200 °C, and 250 °C, with a holding time of approximately 5 h at each temperature. At least three valid specimens were tested at each desorption temperature. Data acquired during the initial thermal stabilization stage were excluded from parameter fitting. In Equation (13), F is introduced through S = FL/D as a fitting parameter and therefore has no separate explicit expression. Its value was determined by fitting the measured transient mass-loss curves using the first three terms of Equation (13). The experimental procedure is schematically illustrated in Figure 3.

3.2. Finite Element Modeling

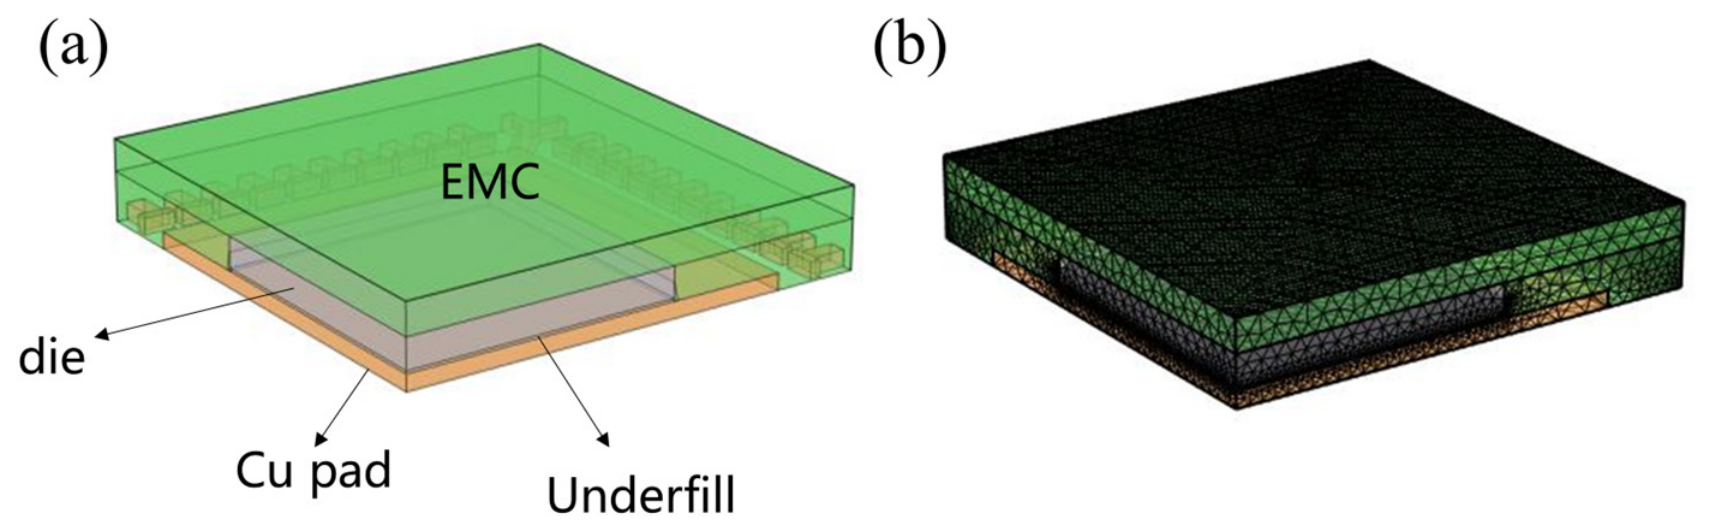
A package-level finite element model was established in COMSOL Multiphysics by coupling moisture transport, heat transfer, and solid mechanics. The model predicted the concurrent evolution of moisture concentration, temperature, and stress in the QFN package. Owing to structural symmetry, a quarter model was adopted, as shown in Figure 4a.
The comparative simulation settings are summarized in Table 1. All four models shared the same geometry, material properties, mesh, and loading history, differing only in their moisture boundary conditions and S values. Model A served as the thermomechanical baseline without moisture transport. Models B–D incorporated moisture diffusion and hygroscopic swelling. For the nonuniform EMC geometry, the characteristic length was defined as Lc = VEMC/Aexp, where VEMC is the EMC volume, and Aexp is the total area of the exposed top and sidewall surfaces on which the Robin boundary condition was applied. This global representative length was used only to evaluate S = (FLc)/D, while the complete three-dimensional geometry and local diffusion paths were retained in the finite element calculation. The same Lc was used in Model B and in defining the S = 1 boundary condition for Model C. Accordingly, S was used as a global representative parameter rather than a location-dependent quantity; the Robin boundary condition employed a uniform F(T) over all exposed top and sidewall surfaces, while the local moisture concentration and surface flux were resolved using the complete three-dimensional geometry.
Model B employed the experimentally calibrated finite surface mass transfer boundary condition, in which the parameter D and F define a temperature-dependent Biot number S, corresponding to 0 < S < . Model C adopted a fixed value of S = 1, representing a finite transfer reference case with comparable bulk diffusion and surface evaporation resistances. Model D imposed zero moisture concentration on exposed EMC surfaces, representing ideal instantaneous drying and the limiting case S.
The surface mass transfer coefficient F was identified from TGA desorption experiments conducted under dry nitrogen at the prescribed purge-flow condition and was therefore treated as an effective coefficient incorporating the gas-side transport characteristics of the experimental setup. In the package simulations, this coefficient was applied to all exposed EMC surfaces as an engineering approximation for a dry reflow atmosphere. Differences in gas composition and flow conditions between the TGA and the reflow environment were not independently calibrated. In the Robin boundary condition, Cair denotes the equivalent EMC moisture concentration in equilibrium with the far-field atmosphere; Cair ≈ 0 was assumed for the dry reflow condition. A lower effective F would reduce the predicted desorption rate and increase residual moisture, whereas a higher F would produce the opposite effect. This assumption introduces uncertainty into the absolute moisture-loss prediction but was applied consistently to all package models, preserving their relative comparison.
Boundary conditions were prescribed for the moisture, thermal, and mechanical fields. Exposed EMC surfaces followed the desorption condition assigned to each model in Table 1, while symmetry planes had zero normal moisture flux. The reflow and thermal cycling temperature profiles were applied as transient thermal loads. Mechanical symmetry constraints were imposed on the two cut planes of the quarter model, with additional constraints applied only to eliminate rigid body displacement.
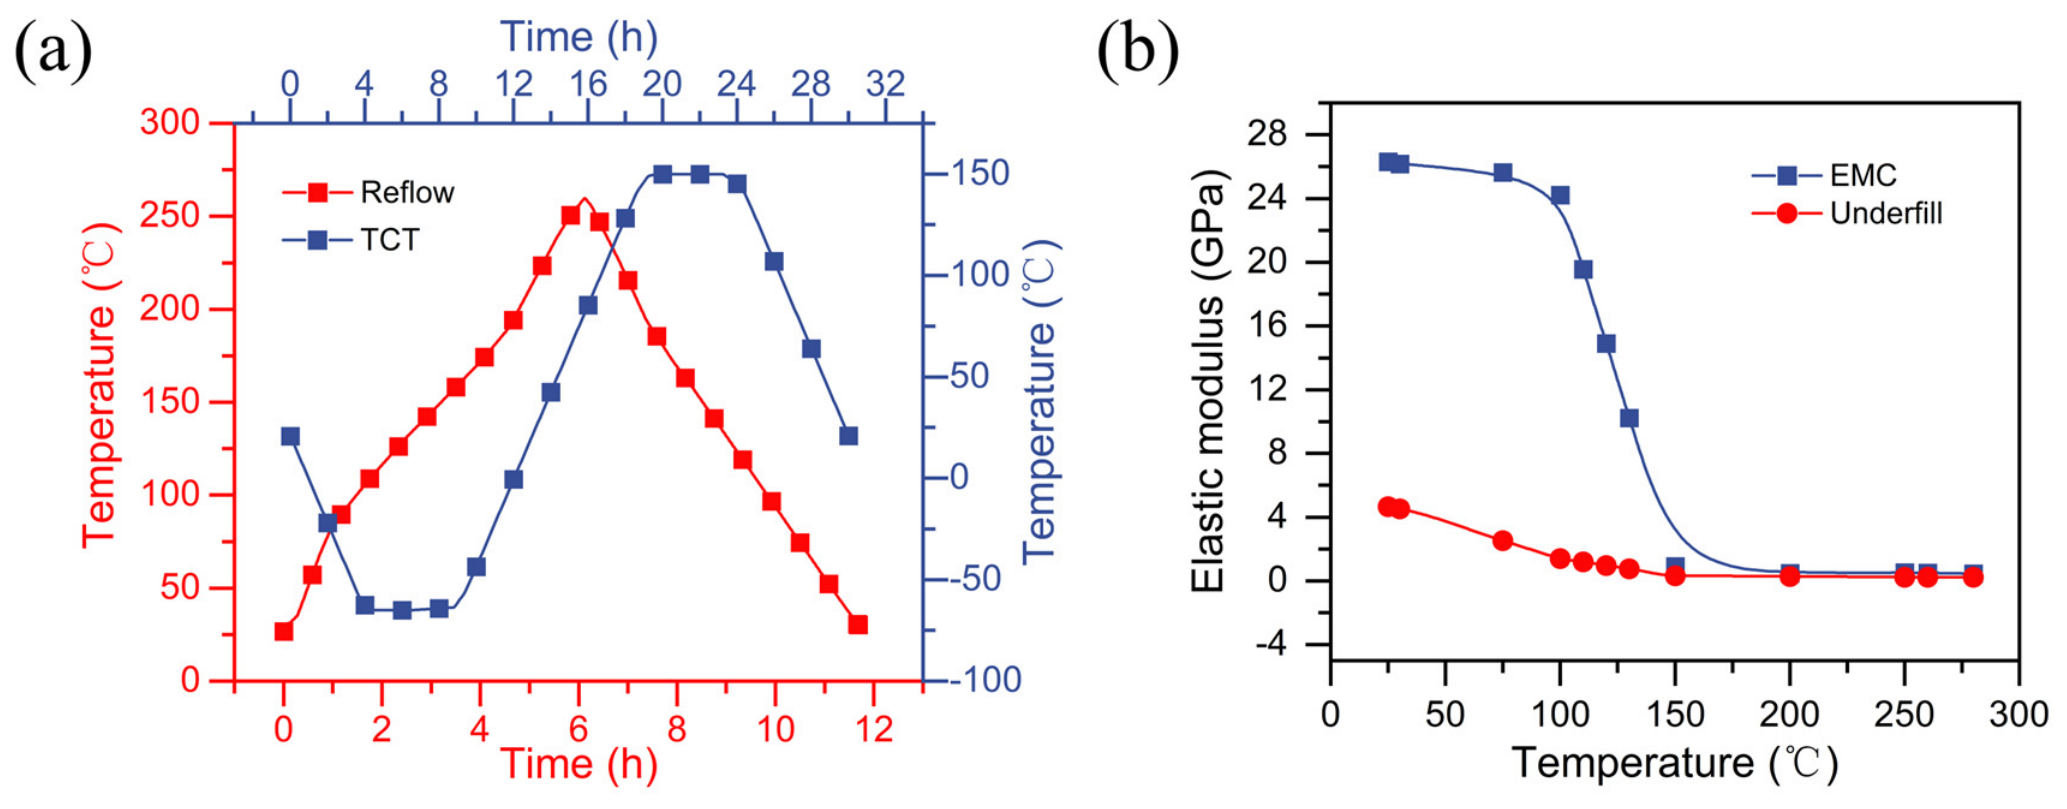
The loading history consisted of moisture conditioning at 85 °C/85% RH for 168 h, followed by three reflow cycles and three thermal cycles. The moisture distribution after conditioning was used as the initial state for subsequent desorption and stress analysis. The peak reflow temperature was approximately 250 °C, and the thermal cycling temperature range was from −65 °C to 150 °C, as shown in Figure 5a.
The model was discretized using a hybrid tetrahedral–hexahedral mesh containing approximately 1 × 10⁵ elements, as shown in Figure 4b. In the moisture-coupled models, EMC and underfill were treated as hygroscopic materials. The temperature-dependent moisture diffusion coefficient D of the underfill was defined using material-characterization data provided by the material supplier, with D0,UF = 7.35 × 10⁻¹⁰ m2/s and ΔED,UF = 14.39 kJ/mol. Because the underfill was fully enclosed within the package, no surface mass transfer boundary or coefficient F was assigned to it. The coefficients of moisture expansion of EMC and underfill were set to 1.5 × 10⁻⁴ m3/kg and 4.3 × 10⁻⁴ m3/kg, respectively [9]. The temperature-dependent elastic moduli were measured by dynamic mechanical analysis (DMA; Q800, TA Instruments, New Castle, DE, USA), and the coefficients of thermal expansion were tested by thermomechanical analysis (TMA; Q400, TA Instruments, New Castle, DE, USA). The measured temperature-dependent material properties were implemented in COMSOL as external functions, as shown in Figure 5b. The remaining material parameters are summarized in Table 2.

4. Results and Discussion

4.1. Moisture Transport Parameters

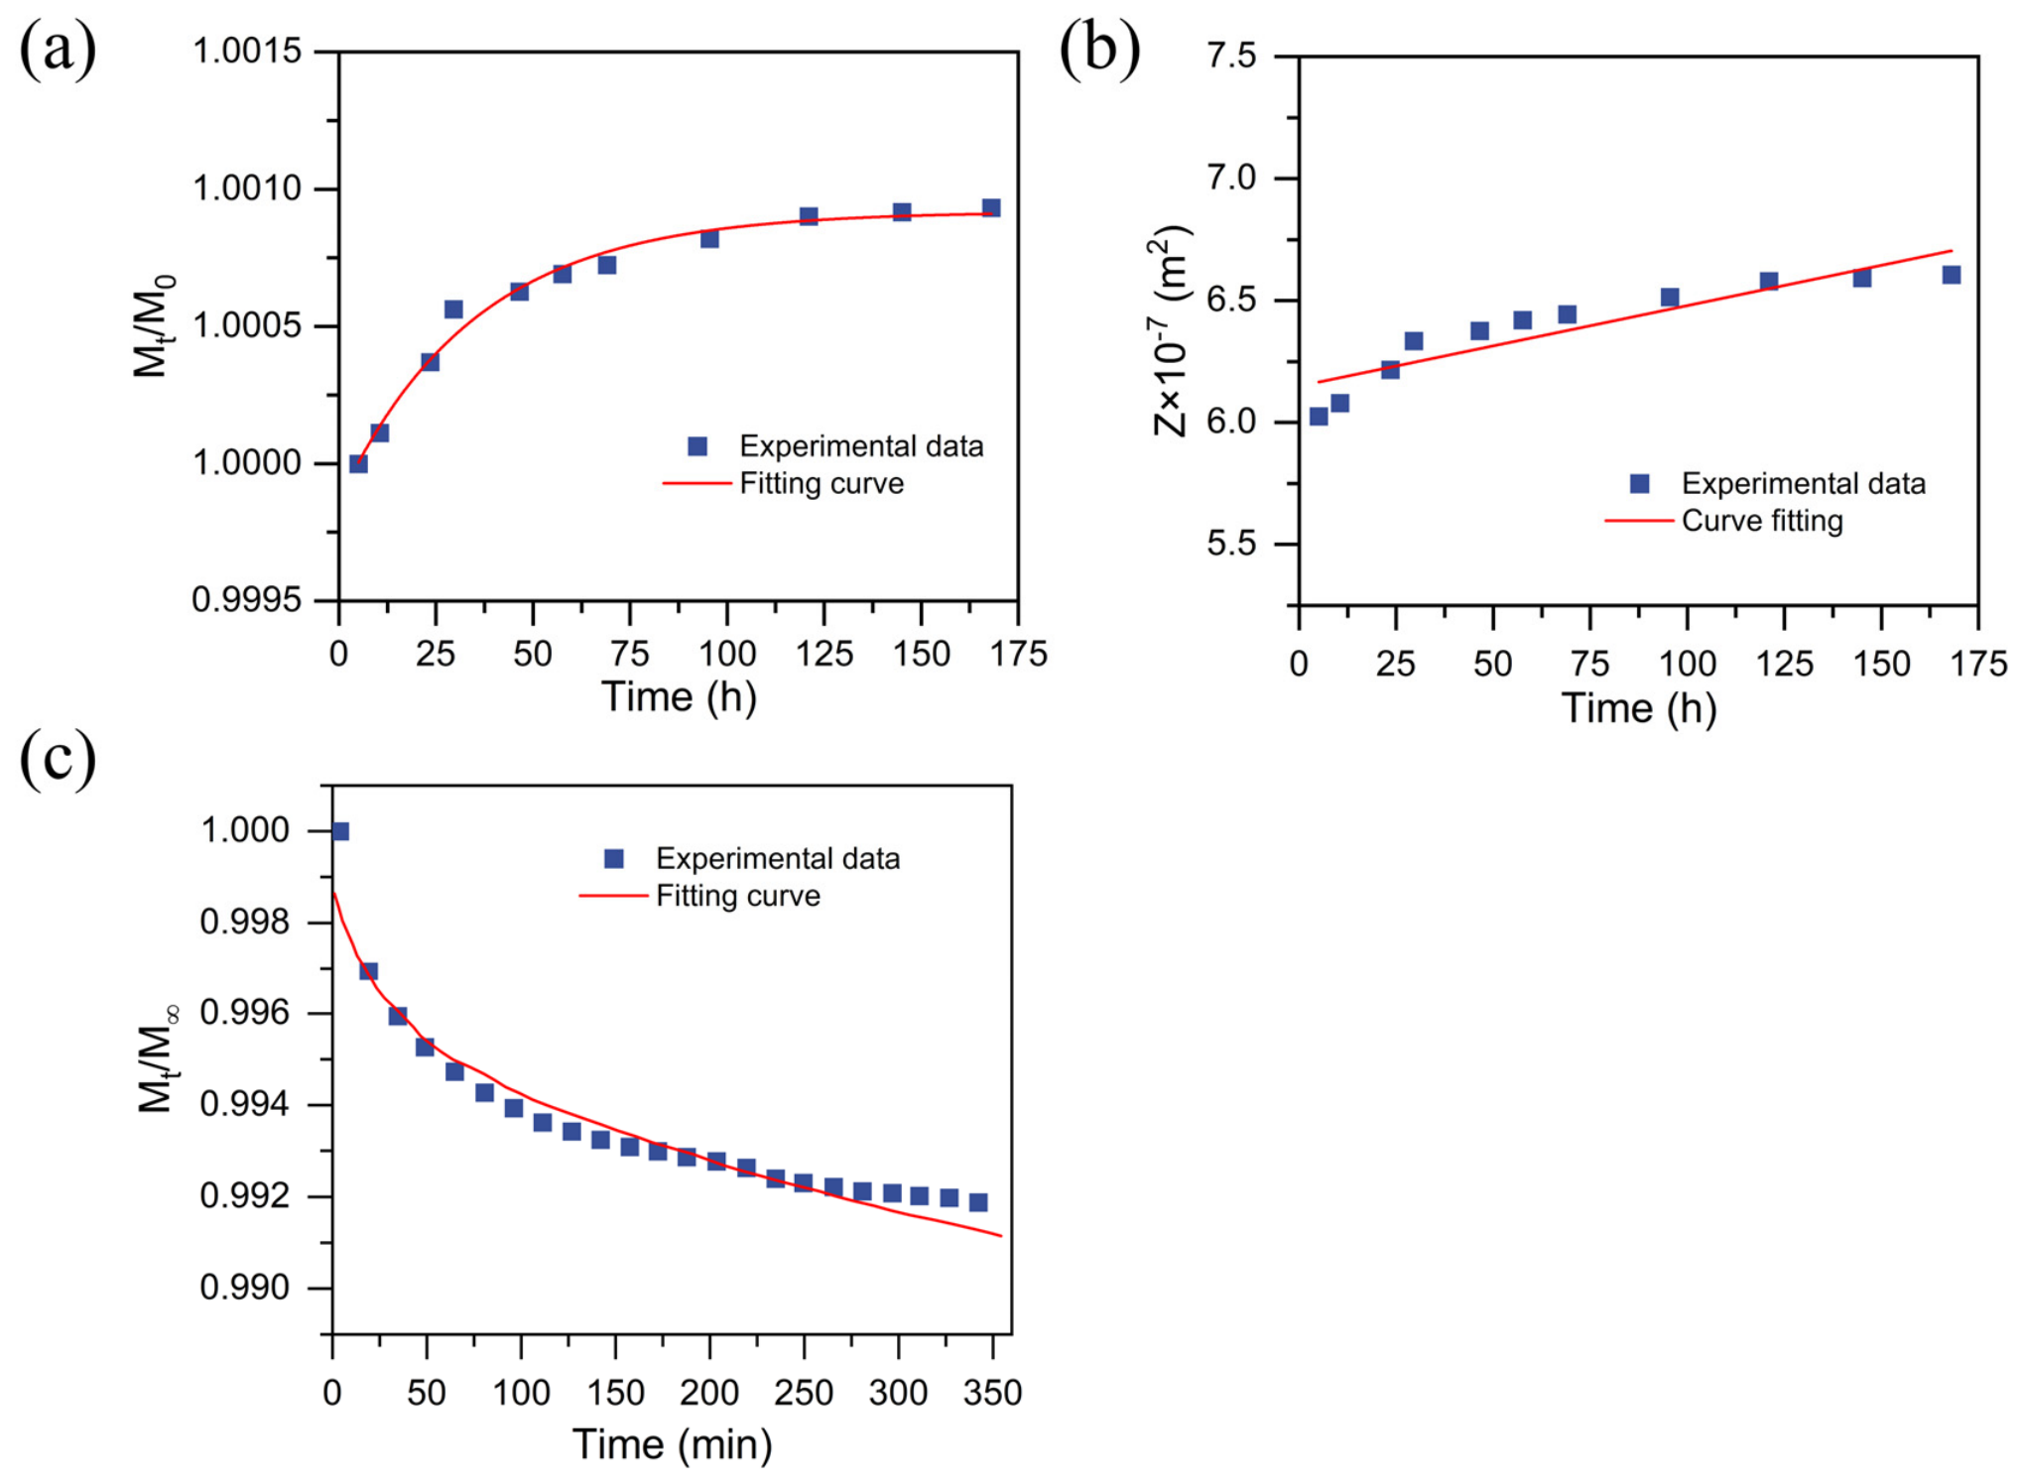
The absorption results were first used to identify the bulk moisture diffusion coefficient D. Figure 6a,b shows the moisture absorption curves obtained under different temperature and relative humidity conditions. The experimental data were linearized by algebraically rearranging the analytical absorption solution in Equation (8), and D was determined by linear regression from the slope of the resulting Z–t curve, where Z = L 2 ln 1 M t M π 2 8 / π 2 . The resulting diffusion coefficients are listed in Table 3.
The desorption results were then used to identify the surface mass transfer coefficient F. Figure 6c presents the high-temperature mass loss curves measured by TGA. The curves were fitted using the analytical desorption solution with a finite surface mass transfer boundary condition, and the resulting F values are summarized in Table 4.
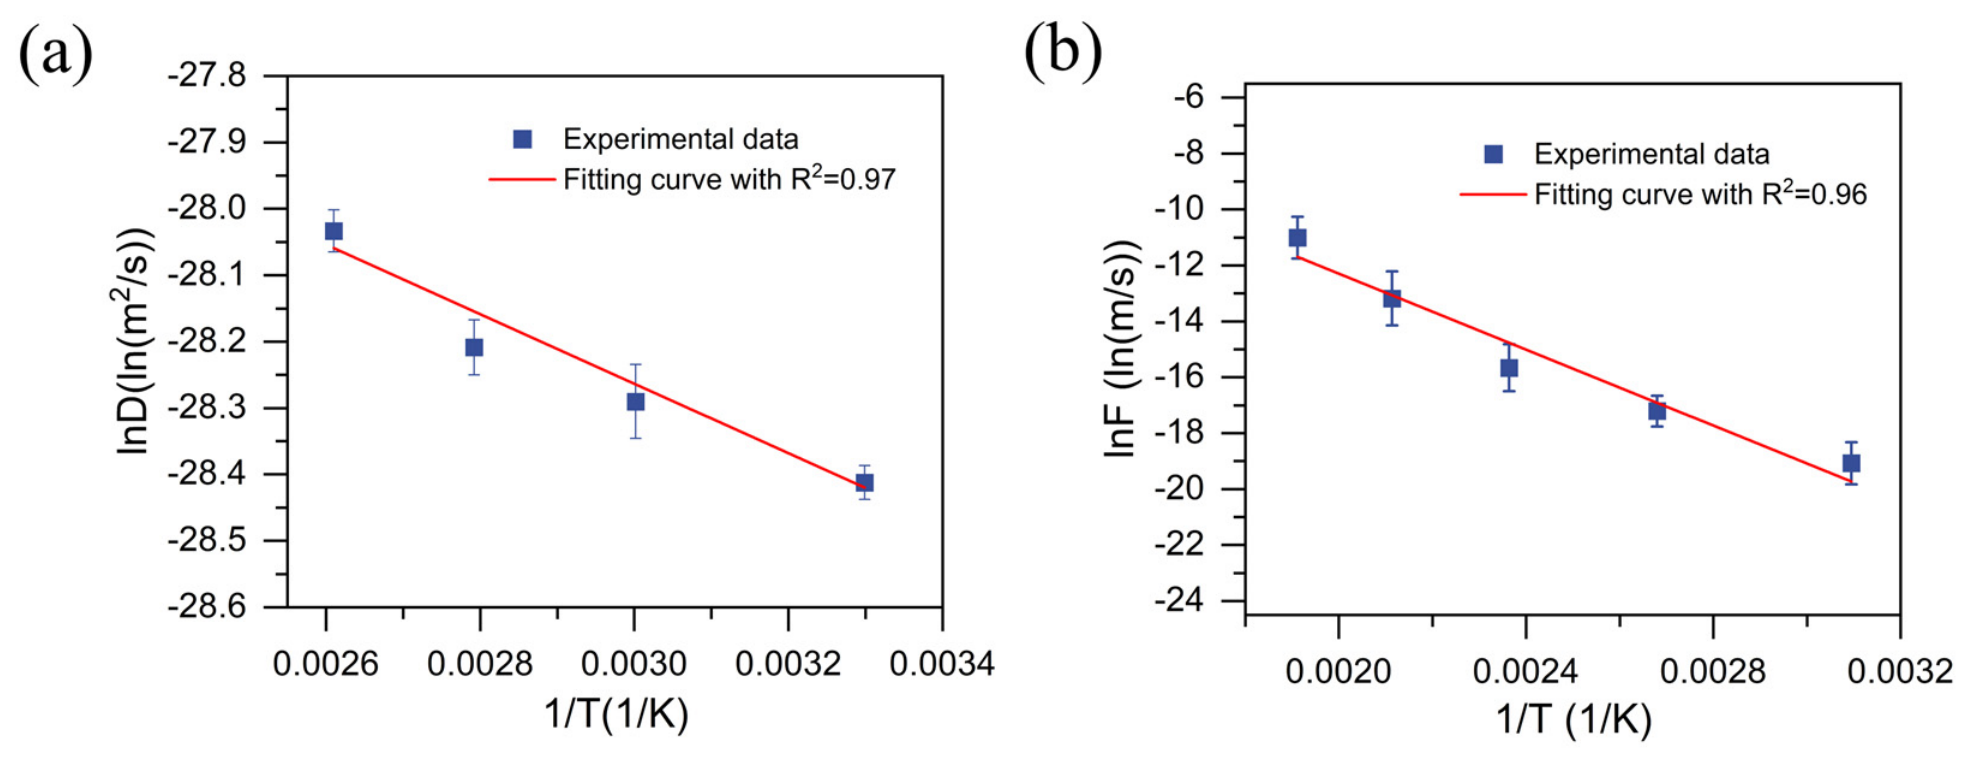
The temperature dependences of D and F were subsequently evaluated using the Arrhenius relations introduced above. As shown in Figure 7a,b, both parameters exhibited thermally activated behavior over the investigated temperature range. The fitted diffusion parameters are ΔED = 4.36 kJ/mol and D0 = 2.53 × 10⁻¹² m2/s. The apparent diffusion activation energy is affected by epoxy–water interactions, polymer relaxation, and filler/interphase transport, as well as experimental and fitting uncertainties [27,28,29]. The fitted value is used as a material-specific model parameter in this study and is not intended as a representative value for EMCs. Glass transition may affect moisture transport through changes in polymer mobility and near-surface moisture release. Because D was identified from absorption experiments over 30–110 °C, the fitted Arrhenius relation was extrapolated across the EMC glass transition temperature (Tg) of 126.57 °C to the reflow-temperature range. Previous high-temperature desorption measurements have shown that EMC diffusivity can retain Arrhenius-type behavior over temperatures extending into the reflow range, with relatively limited changes in the fitted parameters across Tg for some EMC materials [8,9]. The extrapolation was therefore adopted as a first-order engineering approximation and applied consistently to all moisture-coupled models, providing a common bulk-diffusion basis for comparing the effects of different surface boundary conditions. Because the extrapolated D(T) was not directly measured for the present EMC above 110 °C, uncertainty remains in the absolute high-temperature moisture predictions.
The fitted evaporation parameters are ΔEF = 55.54 kJ/mol and F0 = 2.78 m/s. Although the F measurements covered 50–250 °C, the available data did not show a sufficiently resolved transition to justify separate fits below and above Tg. Continuous Arrhenius relations were therefore retained for D(T) and F(T) as a consistent basis for the comparative simulations, while the mechanical effects of Tg were represented using the measured temperature-dependent modulus and CTE. The substantially larger activation energy associated with surface evaporation indicated that moisture removal at the exposed surface is considerably more temperature sensitive than bulk moisture diffusion within the EMC. Consequently, temperature continuously shifts the relative contributions of bulk diffusion and surface evaporation during desorption. This competition is quantified by the mass transfer Biot number S = FL/D, and the calibrated values of D and F therefore provide the experimental basis for defining package-level desorption boundary conditions.

4.2. Diffusion–Evaporation Boundary Effect on Moisture Desorption

Package-level desorption depends strongly on the moisture boundary imposed on exposed EMC surfaces. A commonly used zero surface concentration boundary represents the limiting case S, in which surface mass transfer resistance vanishes and moisture removal is controlled entirely by bulk moisture diffusion. This idealization may overestimate the desorption rate and alter the residual moisture distribution. Here, the mass transfer Biot number S was introduced to describe finite surface evaporation and to compare boundary-condition effects under identical reflow and thermal cycling histories.
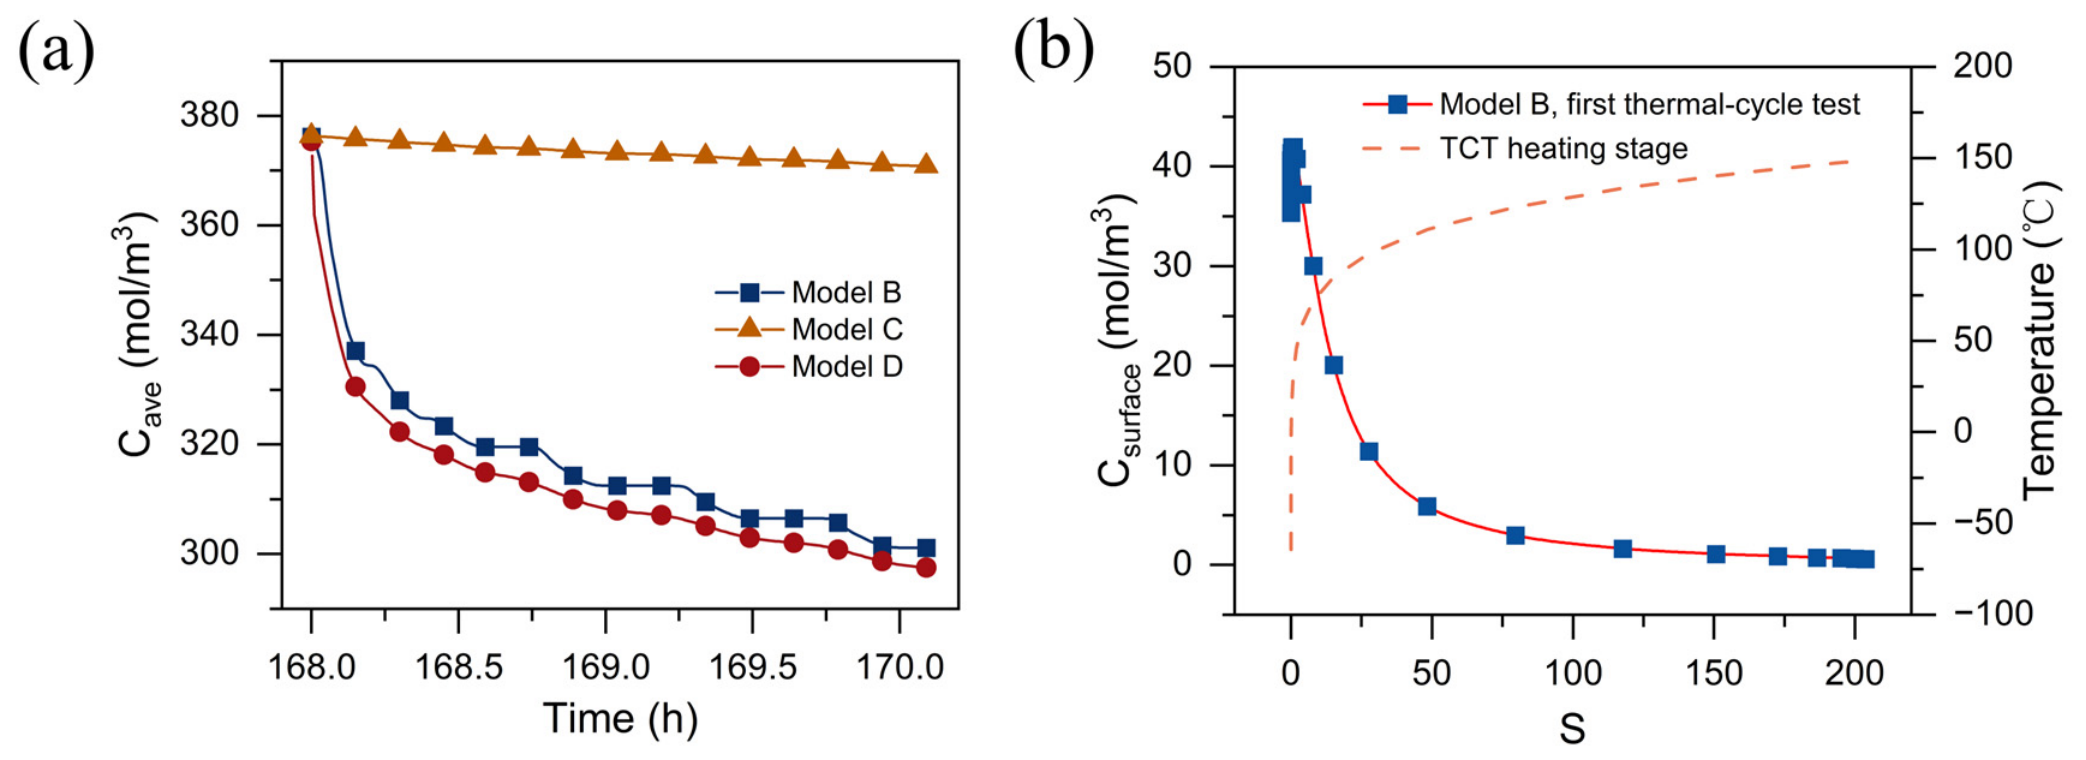
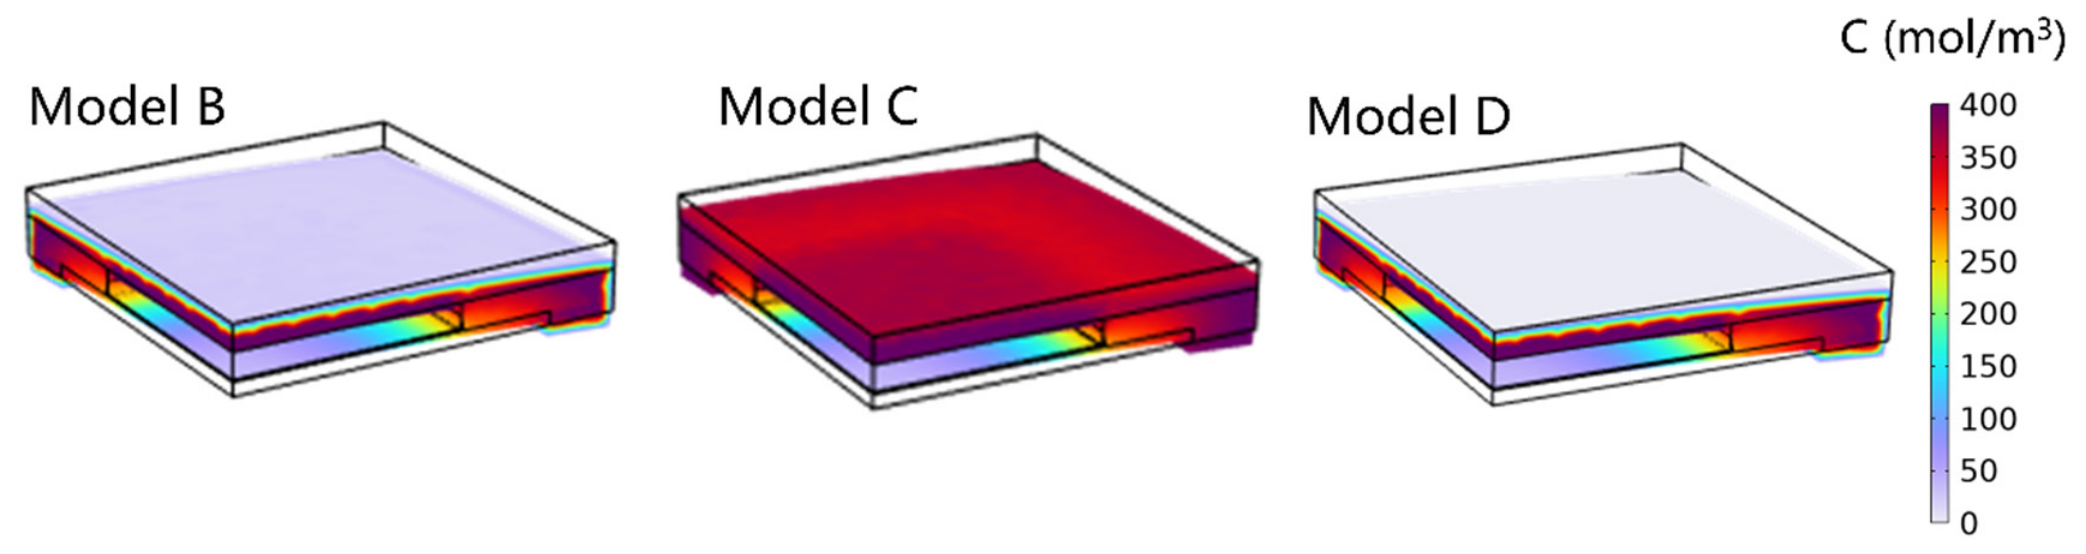
Figure 8a shows the package averaged moisture concentration during reflow and thermal cycling, and Figure 9 presents the corresponding moisture distributions. Since Models B–D shared the same geometry, material properties, and thermal histories, their differences arose from the desorption boundary treatment. Model D exhibited the fastest moisture decay because the zero-concentration boundary imposed instantaneous drying. Model C (S = 1) retained more moisture because the bulk diffusion and surface evaporation resistances are comparable. Model B, calibrated using the experimentally determined values of D and F, represented finite diffusion and evaporation without prescribing either reference limit. The separation among these curves confirms that surface evaporation resistance significantly influences package desorption behavior and the predicted package moisture state. Under repeated thermal cycling with the same dry boundaries, Models B–D would continue to lose moisture at boundary-dependent rates. Their moisture differences may continue to evolve during the early additional cycles and are not necessarily expected to decrease monotonically immediately after the third cycle. In the long-time limit, however, all three moisture fields asymptotically approach the dry state, and their absolute differences eventually diminish.
Figure 8b further illustrates the relationship between the EMC surface moisture concentration Csurface and S in Model B during heating in the first thermal cycle. Since D and F both vary with temperature, S combines their effects into a single boundary parameter. Over the complete temperature range from −65 °C to 250 °C, S(T) spans approximately 6.04 × 10⁻⁵ to 3.27 × 10³, reaching 203 at 150 °C. It therefore crosses S = 1 and extends from the surface mass transfer-controlled regime (S ≪ 1) to the bulk-diffusion-controlled regime (S ≫ 1). At the reflow peak, the finite S approaches the ideal zero-surface-concentration limit represented by S → ∞. Increasing S reduces the relative evaporation resistance and drives Csurface toward the ideal drying limit. At lower S, finite evaporation maintains a finite surface moisture concentration because moisture supplied by bulk diffusion cannot be removed instantaneously. Thus, S provides a continuous description of desorption boundary behavior ranging from finite surface transfer to instantaneous drying. Within the adopted concentration-independent model, preconditioning changes the initial moisture field but not S. Changes in the initial moisture level mainly affect the response magnitude, whereas changes in its spatial distribution may alter the relative boundary effect and stress ranking. Thus, the quantitative results are specific to the 85 °C/85% RH conditioning history, while the physical interpretation of S remains unchanged.

4.3. Hygrothermal Stress in QFN Packages

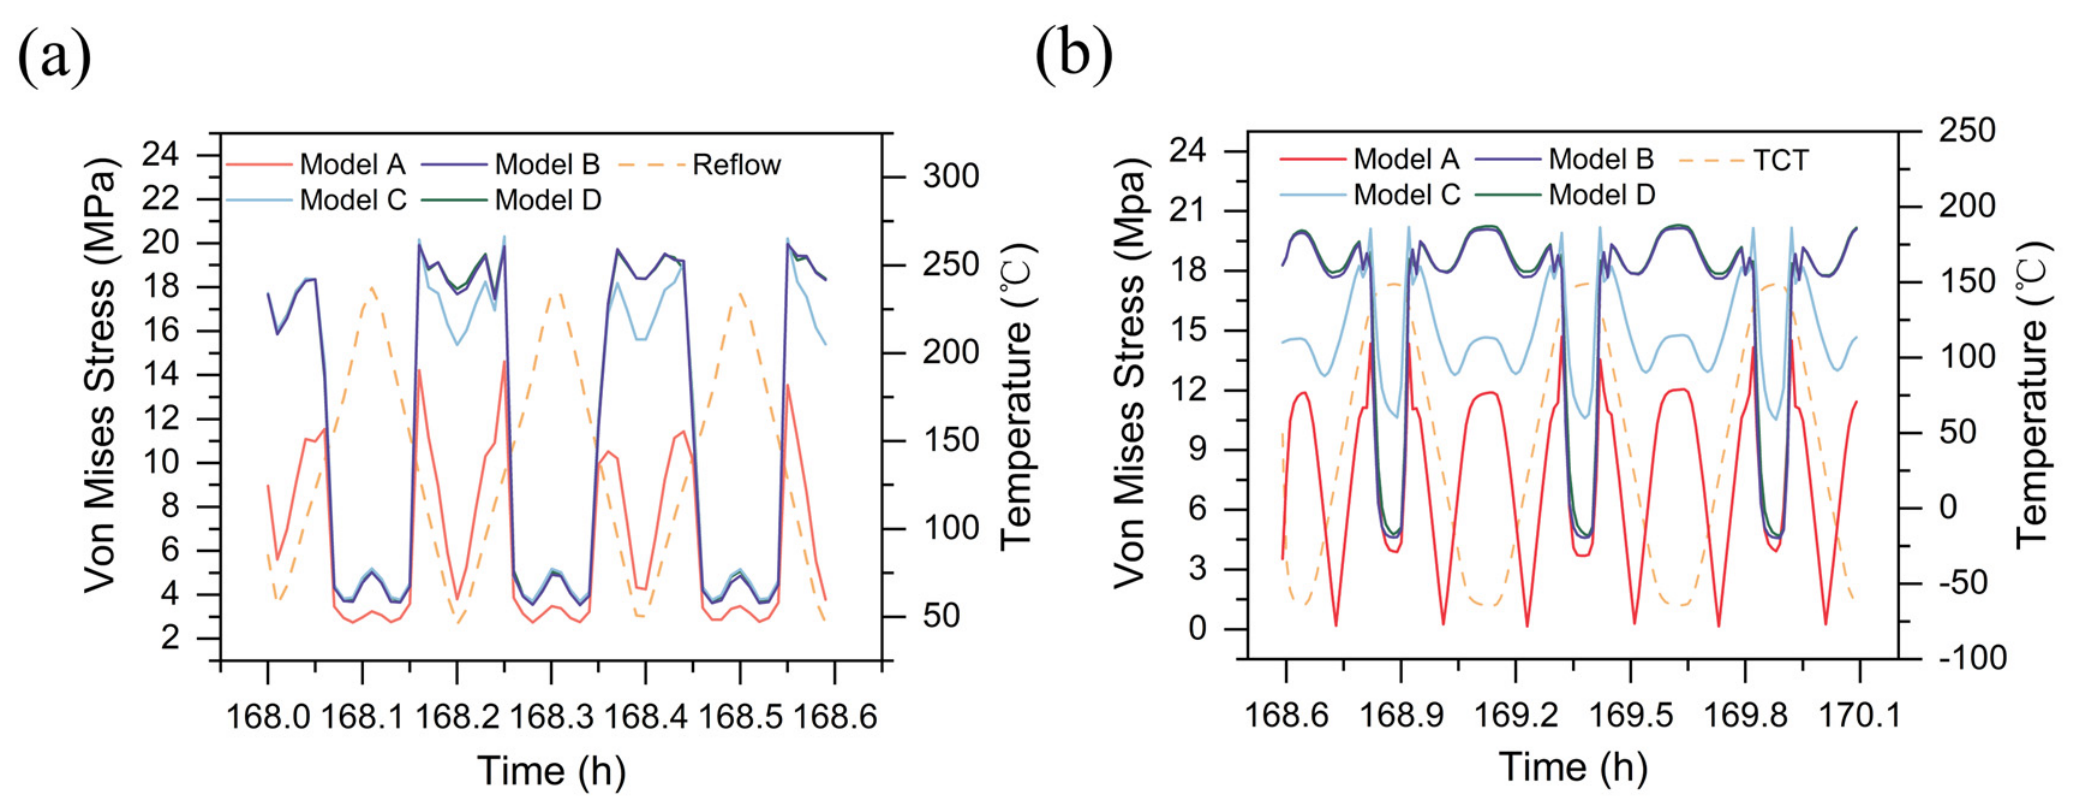
Moisture redistribution caused by the desorption boundary conditions influenced the mechanical response through hygrothermal strains. Figure 10 compares the EMC stress histories of Models A–D during reflow and thermal cycling. Model A provided the thermomechanical baseline, whereas Models B–D incorporated moisture transport and hygrothermal coupling under identical thermal loads. The higher stresses observed in Models B–D indicate that residual moisture contributed an additional mechanical load beyond the purely thermomechanical response.
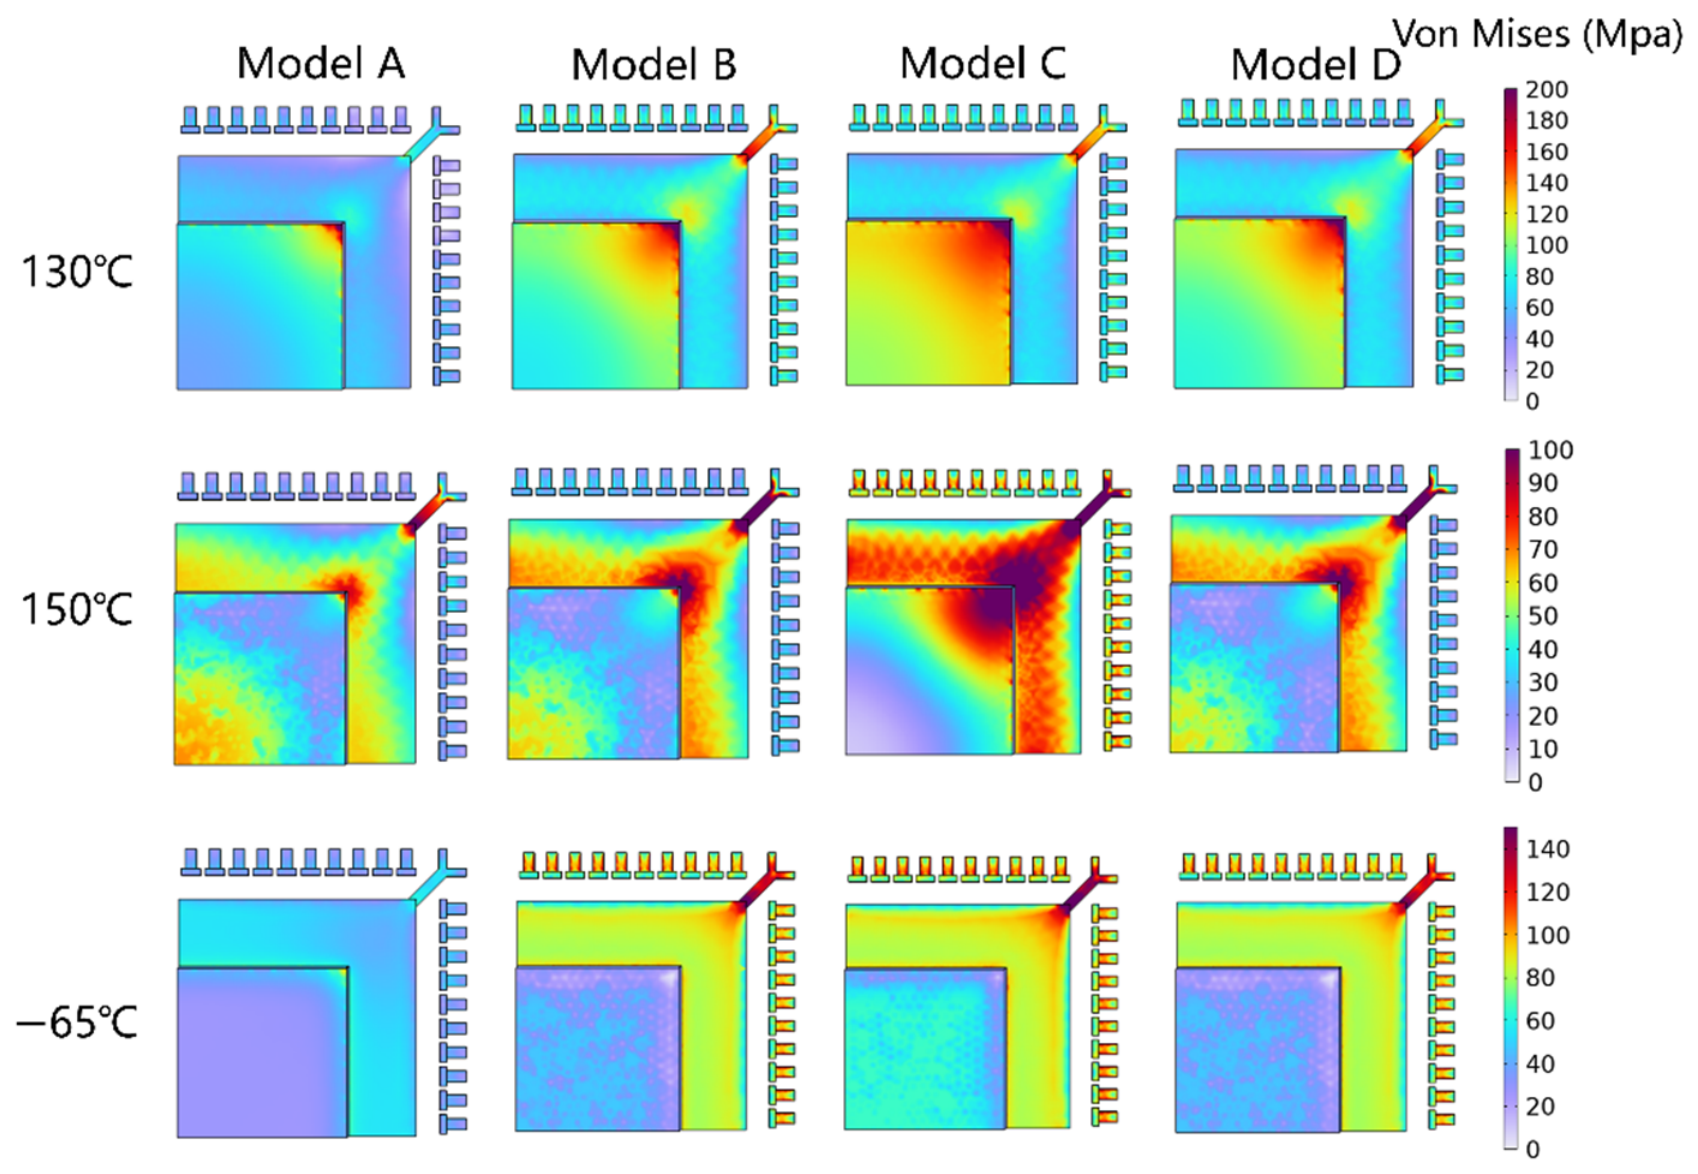
The residual moisture content followed the order C > B ≈ D > A; however, stress did not vary monotonically with moisture content because the interaction between thermal and hygroscopic strains changed with temperature. The corresponding stress distributions at representative temperatures are shown in Figure 11. At approximately 150 °C, hygroscopic swelling and thermal expansion acted in the same direction and jointly increased the net expansion strain, so the greater moisture retention in Model C produced higher EMC stress than in Models B and D. At approximately −65 °C, thermal contraction dominated, while hygroscopic swelling acted oppositely and partially relaxed the contraction-induced stress; the greater moisture retention in Model C produced a larger compensating hygroscopic strain and therefore the lowest stress. Near the glass transition region of EMC (approximately 130 °C), the rapid increase in CTE dominates the transient response, thereby reducing the stress differences among Models B–D, although Model C remains slightly higher because of its larger residual moisture content.
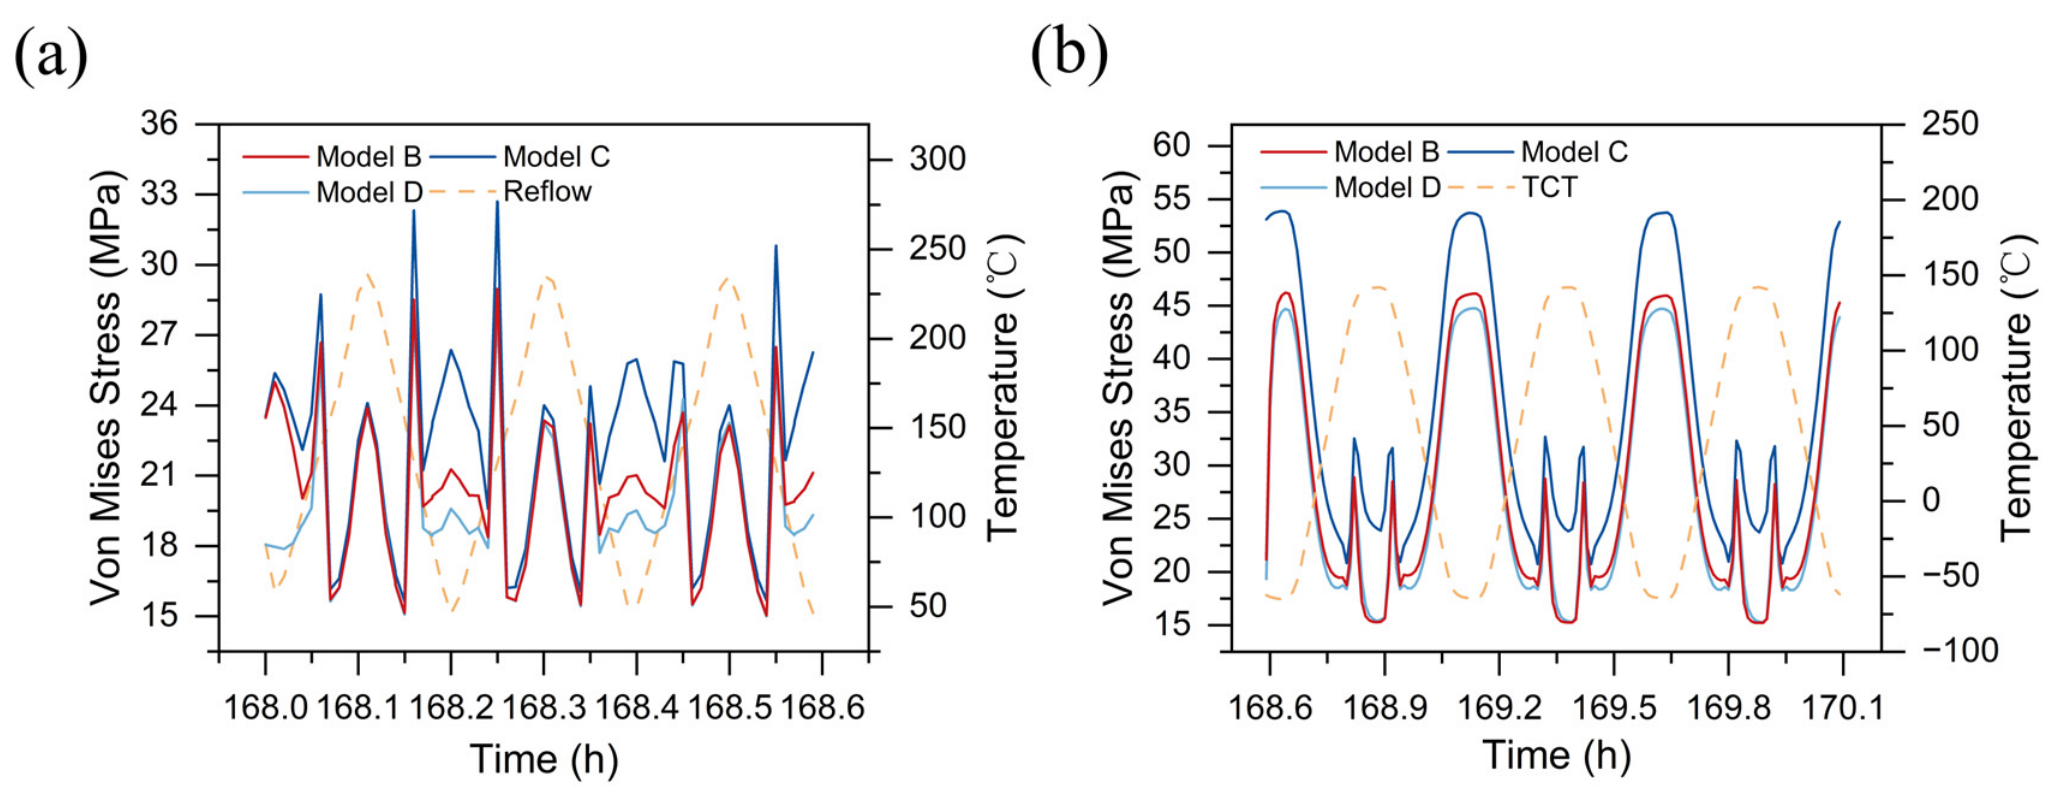
Figure 12 presents the stress evolution at the substrate Cu pad/EMC interface during reflow and thermal cycling. Unlike the bulk EMC stress, the interfacial stress consistently follows the order C > B > D at both high and low temperatures, reflecting the deformation incompatibility between EMC and Cu. Hygroscopic swelling occurred only in the EMC; greater residual moisture therefore increased the moisture-induced deformation mismatch and the local constraint stress. Consequently, the differences in interfacial stress among Models B–D are mainly associated with this moisture-dependent deformation mismatch, whereas the bulk EMC stress is more strongly influenced by the temperature-dependent interaction between thermal and hygroscopic strains. Model C produced the highest interfacial stress because of its greater moisture retention, whereas Model D showed the lowest response owing to excessive drying under the zero-concentration boundary condition. Model B, calibrated using the measured D and F values, preserved an experimentally grounded response between the fixed S = 1 reference and the ideal drying limit.
These results show that the desorption boundary links moisture redistribution to the mechanical response by controlling the residual moisture field and the resulting bulk and interfacial stresses. A zero-concentration boundary imposes instantaneous surface drying and can therefore bias both moisture and stress predictions. The experimentally calibrated boundary retains the finite coupling between bulk diffusion and surface evaporation and provides a physically representative basis for package-level hygrothermal stress prediction. As the moisture-induced contributions gradually vanish, the stress histories of Models B–D are expected to converge toward the periodic thermomechanical response represented by Model A. Because irreversible material behavior and damage accumulation are not included, the present model does not predict unbounded cycle-by-cycle stress accumulation.

5. Conclusions

This study introduced the mass transfer Biot number S to characterize the balance between bulk moisture diffusion and surface evaporation at exposed EMC surfaces during QFN package desorption. The moisture diffusion coefficient D and surface mass transfer coefficient F were independently determined from absorption and desorption experiments and then implemented in the coupled multiphysics model. The results demonstrated that S governs the residual moisture distribution by regulating the relative resistance of bulk diffusion and surface evaporation. The ideal zero-concentration boundary, corresponding to the limiting case of S → ∞, may overestimate moisture removal at exposed surfaces. The S = 1 case retains more residual moisture due to finite surface evaporation resistance. These boundary-dependent moisture states altered hygroscopic swelling and the resulting bulk and interfacial stresses during reflow and thermal cycling. The proposed S-based boundary condition therefore provides a measurable and physically realistic alternative to ideal drying assumptions for moisture-dependent stress prediction in plastic packages. The qualitative interpretation of S remains applicable to other package geometries when a package-specific characteristic length is used. Quantitative moisture and stress responses should be evaluated separately for each package architecture.

Author Contributions

L.M.: Investigation, Formal analysis, Software, Data curation, Writing—original draft preparation. J.W.: Conceptualization, Methodology, Supervision, Writing—review and editing. All authors have read and agreed to the published version of the manuscript.

Funding

This research was funded by the National Natural Science Foundation of China, grant number 61774044.

Data Availability Statement

The data presented in this study are available on request from the corresponding author due to ongoing research and institutional restrictions.

Acknowledgments

The iCOME Shared Instrument Platform at Fudan University is acknowledged for providing access to the experimental facilities.

Conflicts of Interest

The authors declare no conflicts of interest. The funders had no role in the design of this study; in the collection, analyses, or interpretation of data; in the writing of this manuscript; or in the decision to publish the results.

References

  1. Fu, S.-W.; Lee, C.C. A Corrosion Study of Ag-Al Intermetallic Compounds in Chlorinecontaining-Epoxy Molding Compounds. J. Mater. Sci.-Mater. Electron. 2017, 28, 15739–15747. [Google Scholar] [CrossRef] [Scilit]
  2. Sung, Y.-C.; Hu, C.-P.; Hwang, S.-J.; Shih, M.-H.; Liao, W.-H.; Zeng, Y.-J.; Tsai, C.-T. Hygrothermal Stress Analysis of Epoxy Molding Compound in Fan-out Panel-Level Package Based on Experimental Characterization and Structural Sensitivity. Polymers 2025, 17, 2034. [Google Scholar] [CrossRef] [Scilit]
  3. Tian, W.; Zhang, S.; Li, W.; Chen, Y.; Zhao, J.; Xin, F.; Qian, Y.; Li, W. Study on Cavitation, Warpage Deformation, and Moisture Diffusion of Sop-8 Devices during Molding Process. Micromachines 2023, 14, 2175. [Google Scholar] [CrossRef] [Scilit]
  4. Han, B.; Kim, D.-S. Moisture Ingress, Behavior, and Prediction Inside Semiconductor Packaging: A Review. J. Electron. Packag. 2017, 139, 010802. [Google Scholar] [CrossRef] [Scilit]
  5. Lam, D.C.C.; Chong, J.I.T.; Tong, P. The Role of Water in Delamination in Electronics Packages: Water Evaporation from Epoxy. IEEE Trans. Compon. Packag. Technol. 2002, 25, 708–713. [Google Scholar] [CrossRef]
  6. Yan, L.; Yao, J.; Dai, Y.; Zhang, S.; Bai, W.; Gao, K.; Yang, H.; Wang, Y. Study of Thermal Stress Fluctuations at the Die-Attach Solder Interface Using the Finite Element Method. Electronics 2021, 11, 62. [Google Scholar] [CrossRef] [Scilit]
  7. Placette, M.D.; Fan, X.; Zhao, J.-H.; Edwards, D. Dual Stage Modeling of Moisture Absorption and Desorption in Epoxy Mold Compounds. Microelectron. Reliab. 2012, 52, 1401–1408. [Google Scholar] [CrossRef] [Scilit]
  8. Fan, X.; Nagaraj, V. In-Situ Moisture Desorption Characterization of Epoxy Mold Compound. In Proceedings of the 2012 13th International Thermal, Mechanical and Multi-Physics Simulation and Experiments in Microelectronics and Microsystems, Cascais, Portugal, 16–18 April 2012; IEEE: Piscataway, NJ, USA, 2012; pp. 1/6–6/6. [Google Scholar]
  9. Jang, C.; Han, B.; Yoon, S. Comprehensive Moisture Diffusion Characteristics of Epoxy Molding Compounds over Solder Reflow Process Temperature. IEEE Trans. Compon. Packag. Technol. 2010, 33, 809–818. [Google Scholar] [CrossRef] [Scilit]
  10. Chong, I.T.; Lam, D.C.C.; Tong, P. Measurement of Water Evaporation Rate from Epoxy. In Proceedings of the International Symposium on Electronic Materials and Packaging; Kim, J.K., Teng, A., Lee, S.W.R., Eds.; Hong Kong University of Science and Technology: Hong Kong, China, 2000; pp. 440–443. [Google Scholar]
  11. Parti, M. Mass Transfer Biot Numbers. Period. Polytech. Mech. Eng. 1994, 38, 109–122. [Google Scholar]
  12. Xie, B.; Fan, X.J.; Shi, X.Q.; Ding, H. Direct Concentration Approach of Moisture Diffusion and Whole-Field Vapor Pressure Modeling for Reflow Process—Part I: Theory and Numerical Implementation. J. Electron. Packag. 2009, 131, 31010. [Google Scholar] [CrossRef] [Scilit]
  13. Shih, M.-K.; Lin, G.-S.; Yang, J. Effects of Thermal-Moisture Coupled Field on Delamination Behavior of Electronic Packaging. J. Electron. Packag. 2024, 146, 031002. [Google Scholar] [CrossRef] [Scilit]
  14. Fan, X.; Nagaraj, V. Finite Element Modeling of Anomalous Moisture Diffusion with Dual Stage Model. In Proceedings of the 2012 IEEE 62nd Electronic Components and Technology Conference (ECTC), San Diego, CA, USA, 9 May–1 June 2012; IEEE: Piscataway, NJ, USA, 2012; pp. 1190–1193. [Google Scholar]
  15. Shih, N.C.; Middleman, S. Post Extrusion Heat and Solvent Transfer from Polymeric Film. Polym. Eng. Sci. 1970, 10, 4–12. [Google Scholar] [CrossRef] [Scilit]
  16. Gracia-Medrano-Bravo, V.-A.; Scharfer, P.; Schabel, W. On the Drying Kinetics of Non-Spherical Particle-Filled Polymer Films: A Numerical Study. AIChE J. 2022, 68, e17398. [Google Scholar] [CrossRef] [Scilit]
  17. Zhou, J.; Lucas, J.P. Hygrothermal Effects of Epoxy Resin. Part I: The Nature of Water in Epoxy. Polymer 1999, 40, 5505–5512. [Google Scholar] [CrossRef] [Scilit]
  18. Basmadjian, D. Mass Transfer and Separation Processes: Principles and Applications, 2nd ed.; CRC Press: Boca Raton, FL, USA, 2007; ISBN 978-1-4200-5159-9. [Google Scholar]
  19. Yang, H.-C.; Yang, I.-H.; Lee, M.-W.; Chung, D.-Y.; Choi, J.-W. Gas-Surface Interfacial and Gas-Phase Resistances to Vaporizing Cesium Hydroxide and Chloride in Air. Vacuum 2016, 123, 86–90. [Google Scholar] [CrossRef] [Scilit]
  20. Saha, S.K.; Ranjan, H.; Emani, M.S.; Bharti, A.K. Electric Fields, Additives and Simultaneous Heat and Mass Transfer in Heat Transfer Enhancement, 1st ed.; SpringerBriefs in Thermal Engineering and Applied Science; Springer: Cham, Switzerland, 2020; ISBN 978-3-030-20773-1. [Google Scholar]
  21. Crank, J. The Mathematics of Diffusion, 2nd ed.; Oxford University Press: Oxford, UK, 2011; ISBN 978-0-19-853411-2. [Google Scholar]
  22. Shirangi, M.H.; Michel, B. Mechanism of Moisture Diffusion, Hygroscopic Swelling, and Adhesion Degradation in Epoxy Molding Compounds. In Moisture Sensitivity of Plastic Packages of IC Devices; Fan, X.J., Suhir, E., Eds.; Springer: Boston, MA, USA, 2010; pp. 29–69. ISBN 978-1-4419-5718-4. [Google Scholar]
  23. Wong, E.H.; Koh, S.W.; Lee, K.H.; Rajoo, R. Advanced Moisture Diffusion Modeling & Characterisation for Electronic Packaging. In Proceedings of the 52nd Electronic Components and Technology Conference (ECTC), San Diego, CA, USA, 28–31 May 2002; IEEE: Piscataway, NJ, USA, 2002; pp. 1297–1303. [Google Scholar]
  24. Chen, X.; Zhao, S.F.; Zhai, L. Moisture Absorption and Diffusion Characterization of Molding Compound. J. Electron. Packag. 2005, 127, 460–465. [Google Scholar] [CrossRef] [Scilit]
  25. Gillet, C.; Tamssaouet, F.; Hassoune-Rhabbour, B.; Tchalla, T.; Nassiet, V. Parameters Influencing Moisture Diffusion in Epoxy-Based Materials during Hygrothermal Ageing—A Review by Statistical Analysis. Polymers 2022, 14, 2832. [Google Scholar] [CrossRef] [Scilit]
  26. Heide-Jørgensen, S.; Ibsen, C.H.; Budzik, M.K. Temperature Dependence of Moisture Diffusion in Woven Epoxy-Glass Composites: A Theoretical and Experimental Study. Mater. Today Commun. 2021, 29, 102844. [Google Scholar] [CrossRef] [Scilit]
  27. Chang, S.-H.; Kim, H.-S. Investigation of Hygroscopic Properties in Electronic Packages Using Molecular Dynamics Simulation. Polymer 2011, 52, 3437–3442. [Google Scholar] [CrossRef] [Scilit]
  28. Soles, C.L.; Yee, A.F. A Discussion of the Molecular Mechanisms of Moisture Transport in Epoxy Resins. J. Polym. Sci. Part B Polym. Phys. 2000, 38, 792–802. [Google Scholar] [CrossRef] [Scilit]
  29. Herrmann, A.; Erich, S.J.F.; van der Ven, L.G.J.; Huinink, H.P.; van Driel, W.D.; van Soestbergen, M.; Mavinkurve, A.; De Buyl, F.; Fischer, H.R.; Mol, J.M.C.; et al. Interphase Effect on the Effective Moisture Diffusion in Epoxy-SiO2 Composites. Microelectron. Reliab. 2022, 134, 114550. [Google Scholar] [CrossRef] [Scilit]
Figure 1. Schematic of moisture transport in epoxy molding compound (EMC) during (a) absorption and (b) desorption.
Electronics 15 03835 g001
Figure 2. Schematic of the EMC moisture absorption experiment by highly accelerated stress test (HAST)for identifying the diffusion coefficient D.
Electronics 15 03835 g002
Figure 3. Schematic of the EMC moisture desorption experiment using thermogravimetric analysis (TGA) with a finite evaporation boundary for identifying the evaporation coefficient F.
Electronics 15 03835 g003
Figure 4. Finite-element model: (a) package geometry; (b) computational mesh.
Electronics 15 03835 g004
Figure 5. (a) Reflow and thermal-cycling test (TCT) temperature profiles; (b) elastic moduli of EMC and underfill as functions of temperature.
Electronics 15 03835 g005
Figure 6. Experimental data and model fitting for moisture transport parameters: (a) moisture absorption, (b) Z-t fitting for diffusion coefficient D, and (c) moisture desorption for surface mass transfer coefficient F.
Electronics 15 03835 g006
Figure 7. Arrhenius plots for the: (a) diffusion coefficient D and (b) evaporation coefficient F.
Electronics 15 03835 g007
Figure 8. (a) Package-averaged moisture concentration during reflow and thermal cycling after 168 h of moisture conditioning; (b) EMC surface moisture concentration as a function of S during heating in the first thermal cycle.
Electronics 15 03835 g008
Figure 9. Moisture concentration distributions in Models B–D after thermal cycling.
Electronics 15 03835 g009
Figure 10. Package-averaged EMC stress histories for Models A–D during (a) reflow and (b) thermal cycling.
Electronics 15 03835 g010
Figure 11. Internal stress distributions of the quad-flat no-lead (QFN) package for models A–D at representative temperatures during the final thermal cycle.
Electronics 15 03835 g011
Figure 12. Stress evolution at the substrate Cu pad/EMC interface during (a) reflow and (b) thermal cycling.
Electronics 15 03835 g012
Table 1. Comparative model settings.
ModelImplementationS Condition
APure thermal baseline-
BFinite-rate evaporation with experimental F, D > S > 0
CFinite transfer boundary with balanced resistancesS = 1
DZero surface-concentration drying boundaryS
Table 2. The material properties used in finite element analysis (FEA).
Elastic Modulus (GPa)Poisson’s RatioCoefficient of Thermal Expansion, CTE (ppm/K)Density (kg/m3)Glass Transition Temperature, Tg (°C)
Si1610.262.62330-
Cu pad1100.3516.48930-
UnderfillFigure 5b0.3Below Tg68297023
Above Tg165
EMCFigure 5b0.3Below Tg82010126.57
Above Tg37
Table 3. Moisture diffusion coefficients at the test temperatures.
Temperature (°C)D (m2/s)
304.58 × 10⁻¹³
605.17 × 10⁻¹³
855.61 × 10⁻¹³
1106.69 × 10−13
Table 4. Surface mass transfer coefficients at the test temperatures.
Temperature (°C)F (m/s)
505.19 × 10⁻⁹
1003.36 × 10−8
1501.59 × 10−7
2001.89 × 10−6
2501.66 × 10−5
Disclaimer/Publisher’s Note: The statements, opinions and data contained in all publications are solely those of the individual author(s) and contributor(s) and not of MDPI and/or the editor(s). MDPI and/or the editor(s) disclaim responsibility for any injury to people or property resulting from any ideas, methods, instructions or products referred to in the content.