Article

HFW-NPO: A Dual a Paradigm Hybrid Filter–Wrapper Nomadic People Optimizer Framework for High-Dimensional Alzheimer’s Gene Expression Classification

by
Almuntadher Mahmood Alwhelat
1,2,* and
Rahib H. Abiyev
1
1
Computer Engineering, Near East University, Nicosia 99138, Cyprus
2
Department of Computer Engineering, Al-Farabi University, Baghdad 10022, Iraq
*
Author to whom correspondence should be addressed.
Electronics 2026, 15(13), 2970; https://doi.org/10.3390/electronics15132970
Submission received: 8 June 2026 / Revised: 30 June 2026 / Accepted: 2 July 2026 / Published: 7 July 2026

Abstract

Alzheimer’s Disease (AD) necessitates high-resolution transcriptomic biomarkers for early detection, yet current computational methods are hampered by high-dimensional search space and publication bias regarding imbalanced datasets. We propose the Hybrid Filter–Wrapper Nomadic People Optimizer, a three-stage pipeline integrating a tri-criterion filter, an enhanced NPO wrapper with adaptive Lévy-scale anti-stagnation mechanism, and a five-member soft-voting ensemble. The system was evaluated using a dual-paradigm protocol; Scenario A (balance brain tissue; GEO dataset GSE 33000, GSE 132903, GSE122063) and Scenario B (imbalanced peripheral blood: GSE 63060 + GSE 636061). In scenario A, HFW-NPO outperformed 13 published methods, achieving balanced accuracy of 85.28%, 87.16%, and 96.67% while identifying compact panels of 29–32 probes per fold (observed range: 24–38). Scenario B, evaluated on a merged 478-samples peripheral blood cohort (GSE63060 + GSE 636061 imbalanced 1.48:1) with z-score batch harmonization and RSKF (5 × 10) cross-validation, achieved a balanced accuracy of 59.53% and MCI Recall of 63.50 ± 14.02%, providing the first reproducible baseline for this clinically challenging task, while acknowledging that 59.53% balanced accuracy does not yet reach clinically actionable levels. By providing transparent reporting across both balanced and severely imbalanced datasets, this study establishes a state-of-the-art, reproducible framework for AD biomarker discovery and provides a critical baseline for the challenging task of transcriptomic-based classification in peripheral blood samples. Result is currently scoped to Illumina HumanHT-12 microarray data, and cross-platform validation on RNA-seq cohorts is identified as a priority future extension.

1. Introduction

Alzheimer’s disease is a progressive illness that causes memory and cognition to deteriorate. Damage to the brain’s nerve cells can lead to issues with language and memory. Symptoms typically manifest after age 65 and increase in prevalence. In the United States alone, it is estimated that by 2050 there will be between 11 and 16 million people with Alzheimer’s disease (AD) [1]. This will cost the global economy 2 trillion USD by 2030. Unfortunately, there is no reliable way to identify Alzheimer’s disease before it manifests symptoms, and this may be the sole opportunity to intervene in the disease’s course [2]. However, new technology has been developed that uses microarrays to define the genes that cause AD. This is important because it could lead to early detection and treatment of the disease. Additionally, this technology may also help identify people who are at risk for developing AD [3]. The Nomadic People Optimizer (NPO), originally proposed by [4] as a multi-clan swarm-based metaheuristic for standard and large-scale optimization problems, has demonstrated competitive performance across diverse high-dimensional search spaces. Ref. [5] employed machine-learning-based gene biomarker selection to classify Alzheimer’s disease from high-dimensional expression data, further supporting the role of computational feature selection in extracting diagnostically informative gene subsets. However, traditional machine learning algorithms may also be used to achieve good results. Feature selection-driven approaches have demonstrated that machine learning can identify diagnostically relevant gene subsets from high-dimensional expression data. Ref. [6] demonstrated that SVM combined with filter-based gene ranking produced accurate AD classification, establishing a benchmark for filter wrapper hybrid strategies in transcriptomic AD search. Alzheimer’s disease (AD) is a neurodegenerative disorder that causes brain atrophy and eventually destroys brain cells [7]. The progression of AD involves cognitive impairments such as memory loss, delusion, disorientation, and confusion. The shrinkage of blood vessels and muscles, inflammation, mitochondrial dysfunction, and production of free radicals are a few reasons that trigger AD [8]. AD seems to have a vital genetic component, emphasizing the potential of developing targeted novel therapies to treat AD. According to the National Institute on Aging (NIA), AD is directly linked to Apolipoprotein E (APOE) gene, which triggers AD by disrupting the blood–brain barrier (BBB) integrity [9]. However, this gene is not the primary cause of all AD cases. The unknown gene–gene/environment interactions complicate understanding of the direct cause of AD. According to age, Alzheimer’s is primarily divided into two categories, early-onset and late-onset, where no specific gene is found to impact the disease progression. Recent studies identified a significant association between mutated APP, CD33, and BIN1 genes and the development of AD and neurodegenerative comorbidities [10]. A hybrid feature selection strategy was suggested by Mahto et al., (2023) and it was found to enhance accuracy on AD datasets [11]. In their two-stage biomarker discovery method, Joshi et al. (2024) demonstrated better cross-dataset generalization [12]. As a personalized medicine strategy for Alzheimer’s disease identification, Petrella et al. (2024) proposed monitoring gene expression in the blood [13]. While Yaqoob et al. (2024) demonstrated acceptable performance in their investigation of optimization-based biomarker selection, they did find problems with reproducibility [14].
The aim of this work is to develop and evaluate a hybrid computational technology, HFW-NPO, which combines the features of tri-criterion filter stage composited Fisher’s Discriminant Ratio, Mutual Information, and Welch t-test to generate an overarching ω-score followed by an enhancement of a Nomadic People Optimizer wrapper with adaptive Lévy-scale anti-stagnation mechanics to discover small statistically reproducible gene biomarker panels from raw high-dimensional microarray transcriptomic data. The key is to perform state-of-the-art classification of Alzheimer’s Disease across four heterogeneous GEO datasets covering balanced brain-tissue cohorts and a severely imbalanced peripheral blood cohort, while enforcing in total a strictly leakage-free intra-fold cross-validation architecture through the entire pipeline. Relative to prior hybrid filter–wrapper approaches, HFW-NPO introduces three specific methodological contributions that distinguish it from existing pipelines. First, the filter stage employes a tri-criterion omega-score (Equation (4)) combining Fisher’s Discriminant Ratio, Mutual Information, and Welch’s t-test three orthogonal measures of class separability where most published hybrid methods rely on a single filter criterion such as mRMR, Fisher-score alone. Second, the NPO-wrapper incorporates an adaptive Lévy-scale anti-stagnation mechanism (Equation (10)) that expands exploration proportionally to stagnation depth, a mechanism not present in PSO-based or GA-based wrappers commonly used in transcriptomic feature selection. Third, while five-member soft-voting ensembles and intra-fold SMOTE are individually well-established components, their strict integration within a leakage-free cross-validation architecture where filtering, oversampling, and optimization are all performed exclusively inside each training fold is rarely enforced simultaneously in published transcriptomic pipelines; information leakage from global preprocessing remains a prevalent limitation in the literature. The dual-paradigm evaluation protocol, reporting transparent results on both balanced brain-tissue cohorts and a severely imbalanced peripheral blood cohort, further differentiates this work from single-scenario benchmarks. This work tackles three enduring methodological shortcomings in the literature single-criterion filter bias, early metaheuristic stagnation, and a journal bias against unbalanced datasets with a transparent dual-paradigm evaluation protocol, which records both algorithmic strengths and statistically honest limitations.

2. Materials and Methods

2.1. Dataset Acquisition and Description

In this study, four publicly available Alzheimer’s disease (AD)-related transcriptomic datasets from the Gene Expression Omnibus (GEO) repository (National Center for Biotechnology Information, Bethesda, MD, USA; https://www.ncbi.nlm.nih.gov/geo/, accessed on 7 June 2026) to evaluate the proposed Hybrid Filter–Wrapper Nomadic People Optimizer (HFW-NPO) framework. The selected datasets covered two different biological paradigms: brain-derived transcriptomic profiles for AD versus healthy control classification, and peripheral blood expression profiles for AD versus mild cognitive impairment (MCI) discrimination. The brain-tissue validation scenario included three independent datasets: GSE33000 (brain cortex samples), GSE132903 (brain gene expression samples), and GSE122063 (induced pluripotent stem cell-derived neuronal samples). All datasets were generated using the Illumina HumanHT-12 microarray platform (Illumina, Inc., San Diego, CA, USA). GSE33000 contained 159 samples (80 AD and 79 controls), GSE132903 contained 125 samples (65 AD and 60 controls), and GSE122063 included 108 balanced samples (54 AD and 54 controls). The peripheral blood dataset: GSE63060 contains 225 samples: 145 AD, 80 MCI, and GSE63061 contains 253 samples: 140 AD, 113 MCI, with an imbalance ratio of approximately 1.48:1.
Table 1 presents the datasets used to evaluate the HFW-NPO method for Alzheimer’s classification and biomarkers. Evaluating the robustness of the models across a variety of biological origins, sample distributions, and classification circumstances, we obtained the following four independent datasets from GEO: brain datasets GSE33000, GSE132903, and GSE122063 for AD vs. healthy control classification. GSE33000 contains 159 brain cortex samples of 80 AD and 79 controls, nearly balanced with an imbalance ratio = 1.01:1. Likewise, GSE132903 includes 125 samples of brain gene-expression derived from the evaluation of 65 AD and 60 control subjects with a low imbalance ratio of 1.08:1. GSE122063 comprised an equal sample number from AD and control (54 samples each), a total of 108 iPSC-derived neuronal samples to bring about a perfectly balanced dataset. In Scenario B two datasets are merged to enable robust AD vs. MCI discrimination: GSE63060 contains 225 samples: 145 AD, 80 MCI, and GSE63061 contains 253 samples: 140 AD, 113 MCI, both datasets acquired on the Illumina HumanHT-12 platform. Following probe intersection 25,549 features and z-score batch normalization through both acquisition batches, a merged cohort comprised 478 samples 193 MCI, 285 AD, with the imbalance ratio 1.48:1. With this design, the statistical power of a single highly imbalanced cohort is increased more and is more realistic for the clinical representations of peripheral blood transcription. The datasets included high-dimensional transcriptomic profiles consisting of approximately 15,720–16,379 raw gene features generated using the Illumina HumanHT-12 microarray platform. The exceptionally large feature-to-sample ratio showcases the classical high-dimensional low-sample-size (HDLSS) problem in genomic machine learning. Thus, these datasets were retrieved from the NCBI Gene Expression Omnibus repository serve as appropriate benchmarks [15,16,17] to test the capability of HFW-NPO to perform dimensionality reduction [18], a curated public archive with verified metadata quality [19], making them appropriate for evaluating HFW-NPO capacity for dimensionality reduction, stable biomarker selection, and classification without overfitting.

2.2. Data Pre-Processing

A unified preprocessing pipeline was applied to all transcriptomic datasets before feature selection and classification. Missing expression values were handled using mean-value imputation. Subsequently, all gene expression values were normalized to the range (0, 1) using Min–Max normalization to reduce scale variation across probes. Class labels were mapped to binary classification targets for each experimental scenario. To prevent information leakage, all feature selection, oversampling, and optimization procedures were performed strictly within the training folds. The independent test folds were kept completely unseen throughout model development.
For the combined peripheral blood group (GSE 63060,63061), there was an additional batch matching step before classification. Expression values from each dataset were independently z-score standardized (zero mean, unit variance) prior to merging, eliminating dataset-specific offset and scale differences introduced by separate hybridization batches across all 25,549 intersecting probes. This preprocessing ensures that downstream feature selection and classification operate on batch-corrected, comparably scaled expression profiles. To verify that residual batch effects do not bias classification, PCA and PERMANOVA (999 permutations) were performed on the 25,549 intersecting probes before and after z-score harmonization. Pre-harmonization, PC1 captured 94.3% of total variance and separated the two datasets completely (PERMANOVA: F = 7903.3, R 2 100 % , p = 0.001), confirming a strong systematic offset between batches. Post-harmonization, the batch-driven PC1 component collapsed: PC1 captured only 11.9% of variance and the dataset factor explained 0% of variance (PERMANOVA: F = 0.000, R 2 = 0.0%, p = 1.000), demonstrating complete removal of the inter dataset offset. The full result is provided in Supplementary Figure S1 and Table S1.

2.3. Proposed HFW-NPO Algorithm

This study introduces a Hybrid Filter–Wrapper Nomadic-inspired Population Optimization (HFW-NPO) algorithm for Alzheimer’s disease (AD) transcriptomic biomarker discovery and classification. The proposed algorithm was designed to address the high-dimensional low-sample-size (HDLSS) challenge commonly observed in gene-expression datasets, where thousands of candidate genes are available while the number of biological samples remains limited. The HFW-NPO algorithm comprises two major phases: a hybrid statistical filtering phase and a population-based wrapper optimization phase. The objective is to remove irrelevant genes [20], minimize redundancy [21], improve classification performance [22], and identify a compact set of stable biomarkers.
  • Phase 1: Filter-Based Hybrid Multi-Criterion Feature Selection
The tri-criterion filter evaluates three complementary relevance measurements: Fisher’s Discriminant Score, Mutual Information (MI), and Welch’s t-test. They evaluate the relevance of genes from various standpoints. The Fisher score assesses how well a gene distinguishes between disease and control distributions. Higher-scoring importance indicates that genes exhibit large inter-class variability and small intra-class variability. Mutual Information quantifies nonlinear dependencies between gene expression values and disease labels. Contrary to linear correlational methods, MI can identify the underlying complicated biological relationships between biomarkers and the progression of Alzheimer’s disease. For comparing gene expressions between groups where equal-variance conditions cannot be assumed, Welch’s t-test evaluates differential expression across groups and is computed using SciPy’s t-test_ind function with equal var = False. The three normalized scores are then combined into a single ranking score to identify the candidate biomarkers that convey maximum information.
  • Phase 2: NPO-Based Wrapper Optimization
Next, the optimal genes are selected using the Neuro-inspired Population Optimization (NPO) algorithm after dimensionality reduction. Here, each individual in the population is associated with a candidate biomarker signature encoded as a binary vector of active/inactive genes. The search for the optimal subset is performed by minimizing a fitness function that combines classification error and the number of selected genes. This permits the algorithm to reach an optimal compromise between prediction accuracy and biomarker compactness. Further, to enhance global search capacity and prevent premature access to local optima, several adaptive exploration strategies, such as a Lévy-flight-based movement strategy, population diversity control, and anti-stagnation restart strategies, in the proposed methods. These mechanisms help the optimizer escape local optima and search for other gene combinations. Finally, a local search refinement step is performed on the best candidate solutions obtained by NPO. This stage selects biomarkers by pruning redundant features and identifies genes that contribute positively to classification performance.
  • Phase 3: Ensemble-Based Classification
Using a soft-voting ensemble classifier based on the different heterogeneous models: Extra Trees, Support Vector Machine (SVM-RBF), Logistic Regression, Random Forest, and Gradient Boosting models are finally evaluated against this optimized biomarker subset. Ensemble methods combine predictions from multiple models at different probability levels to reduce model variance and improve predictions. The final classification decision is obtained by averaging prediction probabilities from all classifiers. The entire HFW-NPO pipeline thus fuses statistical gene ranking, evolutionary optimization, and ensemble learning into a single framework that can yield accurate, compact, and interpretable biomarker signatures of Alzheimer’s disease. Workflow overview. Figure 1 showed a Complete computational workflow of the proposed Hybrid Filter–Wrapper Nomadic People Optimizer (HFW-NPO) framework for biomarker discovery and Alzheimer’s disease (AD) transcriptomic classification. This figure illustrates the stepwise reduction of a large, high-dimensional gene expression dataset into a concise, optimized biomarker panel that delivers reproducible, robust disease classification. Our framework starts with four independent Gene Expression Omnibus (GEO) datasets: three brain-associated datasets (GSE33000, GSE132903, and GSE122063) and one peripheral blood dataset (GSE 63060, GSE63061). Another strength of having multiple biological sources is that because cellular composition and the associated molecular mechanisms of the disease process can differ across tissue types, AD-related molecular signatures are expected to vary more than is typical for technical reproducibility.
At the initial stage, data preprocessing includes mean imputation for missing values and Min–Max normalization of features. It is a critical step in microarray-based transcriptomics as differential expression levels can introduce computational bias and adversely impact machine-learning models. The second stage presents the proposed new tri-criterion hybrid filtering, which is an important part of this framework. HFW-NPO incorporates three complementary feature evaluation criteria instead of relying on a single statistical measurement:
  • Weighted Fisher’s Discriminant Ratio—weights all differences in class distributions among genes according to their separation power.
  • Mutual Information (MI)—discovers non-linear associations between gene expression profiles and disease labels.
  • Welch’s t-test—detects statistically significant differential expression while accommodating unequal variance between groups.
Combining these criteria yields a more robust and biologically interpretable feature ranking approach. Single-filter methods may miss relevant genes because each statistical test measures a different facet of discrimination. The feature selection is imperative for generalization in n >> p (number of samples > number of features) biological problems. After feature reduction, to address class imbalance, an intra-fold SMOTE strategy is applied to the training data. This avoids class domination whilst also avoiding information leaks into the test samples. One method, SMOTE, is effective for constructing a minority-class dataset in an imbalanced classification problem. In the third step, we incorporate an enhanced version of Nomadic People Optimizer (NPO) as a wrapper-based gene selection method. NPO (as a population-based search) is looking for the best subset of biomarkers. We implemented several other mechanisms to improve convergence and avoid premature local optima, such as adaptive Lévy flight, anti-stagnation restart, and Hill Climbing local refinement. To be confident in the optimized gene subset, a heterogeneous five-member soft-voting ensemble model comprising Extra Trees, SVM-RBF, Logistic Regression, Random Forest, and Gradient Boosting classifiers is used for classification. Integrating diverse learning mechanisms stabilizes predictions by minimizing bias and variance in the model. It has been shown that integrating diverse filter criteria with ensemble learning stabilizes predictions by minimizing bias and variance. Hybrid feature selection and ensemble fusion have been shown to improve robustness [23] and generalization [24], compared with single classifiers [25] in high-dimensional gene expression classification.

2.3.1. Phase I: Tri-Criterion Hybrid Filter Feature Selection

Fisher’s Discriminant Ratio
The Fisher score measures the separation capability of each gene between AD and non-AD groups by computing the ratio of the inter-class mean difference squared to the sum of class-conditional variances. The Fisher Discriminant Ratio for gene i is defined as Equation (1):
F i = ( μ _ A D , i μ _ C t r l , i ) 2 ( σ 2 _ A D , i + σ 2 _ C t r l , i )
where μ _ A D ,   i and μ _ C t r l ,   i are the class-conditional mean expression levels, and σ 2 _ A D ,   i , σ 2 _ C t r l ,   i are the corresponding variances for gene i in the AD and Control cohorts respectively [26,27].
Mutual Information (MI)
Mutual Information captures non-linear statistical dependency between gene expression values and binary disease labels. For discrete approximation, the empirical MI for gene i is computed as:
Mutual Information between gene expression X I and class label Y :
M I ( X Y ; Y ) = H ( Y ) H ( Y X I ) Σ Σ p x , y · l o g 2 p x , y / p x · p y x X I y Y
where H(Y) is the marginal entropy of the class label, H ( Y X I ) is the conditional entropy of Y given gene i expression X I , and p(x,y) is the joint probability distribution estimated via equal-width binning (scikit-learn implementation) [27]. Note: M I I = M I ( X I ; Y ) is used as the Mutual Information sub-score for gene i in the composite omega score.
Welch’s t-Test Score
Welch’s t-test evaluates differential expression under unequal-variance assumptions across groups. The signed statistical significance is log-transformed to a continuous score:
The Welch t-test significance score for gene i :
W I =     l o g 10 ( p I )
where ( p I ) is the two-tailed p-value from Welch’s t-test comparing AD versus Control expression distributions for gene I . Genes with smaller p -values receive larger W I scores.
Composite Omega Score
All three sub-scores are independently min–max normalized over the probe set before weighted combination. The final composite relevance score is:
The tri-criterion composite omega score for gene i:
ω I = 0.40 · F i n o r m + 0.30 · M i n o r m + 0.30 · W i n o r m
where F i n o r m , M i n o r m , and W i n o r m are the min–max normalized Fisher’s Discriminant Ratio, Mutual Information, and Welch’s t-test scores for gene i, respectively. Weights (0.40, 0.30, 0.30) were set empirically; ablation confirmed each criterion’s independent contribution. The top-k genes by ω I are retained (k = 80 for brain datasets; k = 15 for GSE63060) [28]. For the peripheral blood cohort, k was set to 15 rather than 80 to reflect the steeper omega-score decay observed in blood derived transcriptomic (Supplementary Figure S2), and to maintain a computationally tractable NPO search space of 2 15 = 32,768 candidate subsets (Supplementary Table S2). To assess robustness to the choice of criterion weights, we conducted a perturbation analysis across seven configurations spanning the full range of plausible Fisher/MI/Welch emphases (Supplementary Table S3). All seven configurations yielded grand mean balanced accuracies between 87.08% and 88.14% across the three brain datasets a total spread of 1.06 percentage points. The performance difference between the proposed weights (0.40, 0.30, 0.30) and equal weights (0.33, 0.33, 0.33) was 0.36%, which was not statistically significant (Wilcoxon signed-rank test: W = 21.5, p = 0.54). These results confirm that HFW-NPO is robust to weight perturbation; the equal-weight configuration [0.33, 0.33, 0.33] is a defensible alternative with negligible performance difference. The proposed weighting reflects a theoretical prior on the primacy of linear class separation [29] rather than a tuned hyperparameter.

2.3.2. Phase II: Adaptive Intra-Fold SMOTE Balancing

Synthetic Minority Oversampling Technique (SMOTE) is applied exclusively within each training fold after filter-stage dimensionality reduction, ensuring zero test-fold exposure to synthetic data. The neighborhood parameter adapts to minority class size: Adaptive SMOTE nearest-neighbor parameter:
k NN = m i n 5 , n _ m i n o r i t y 1
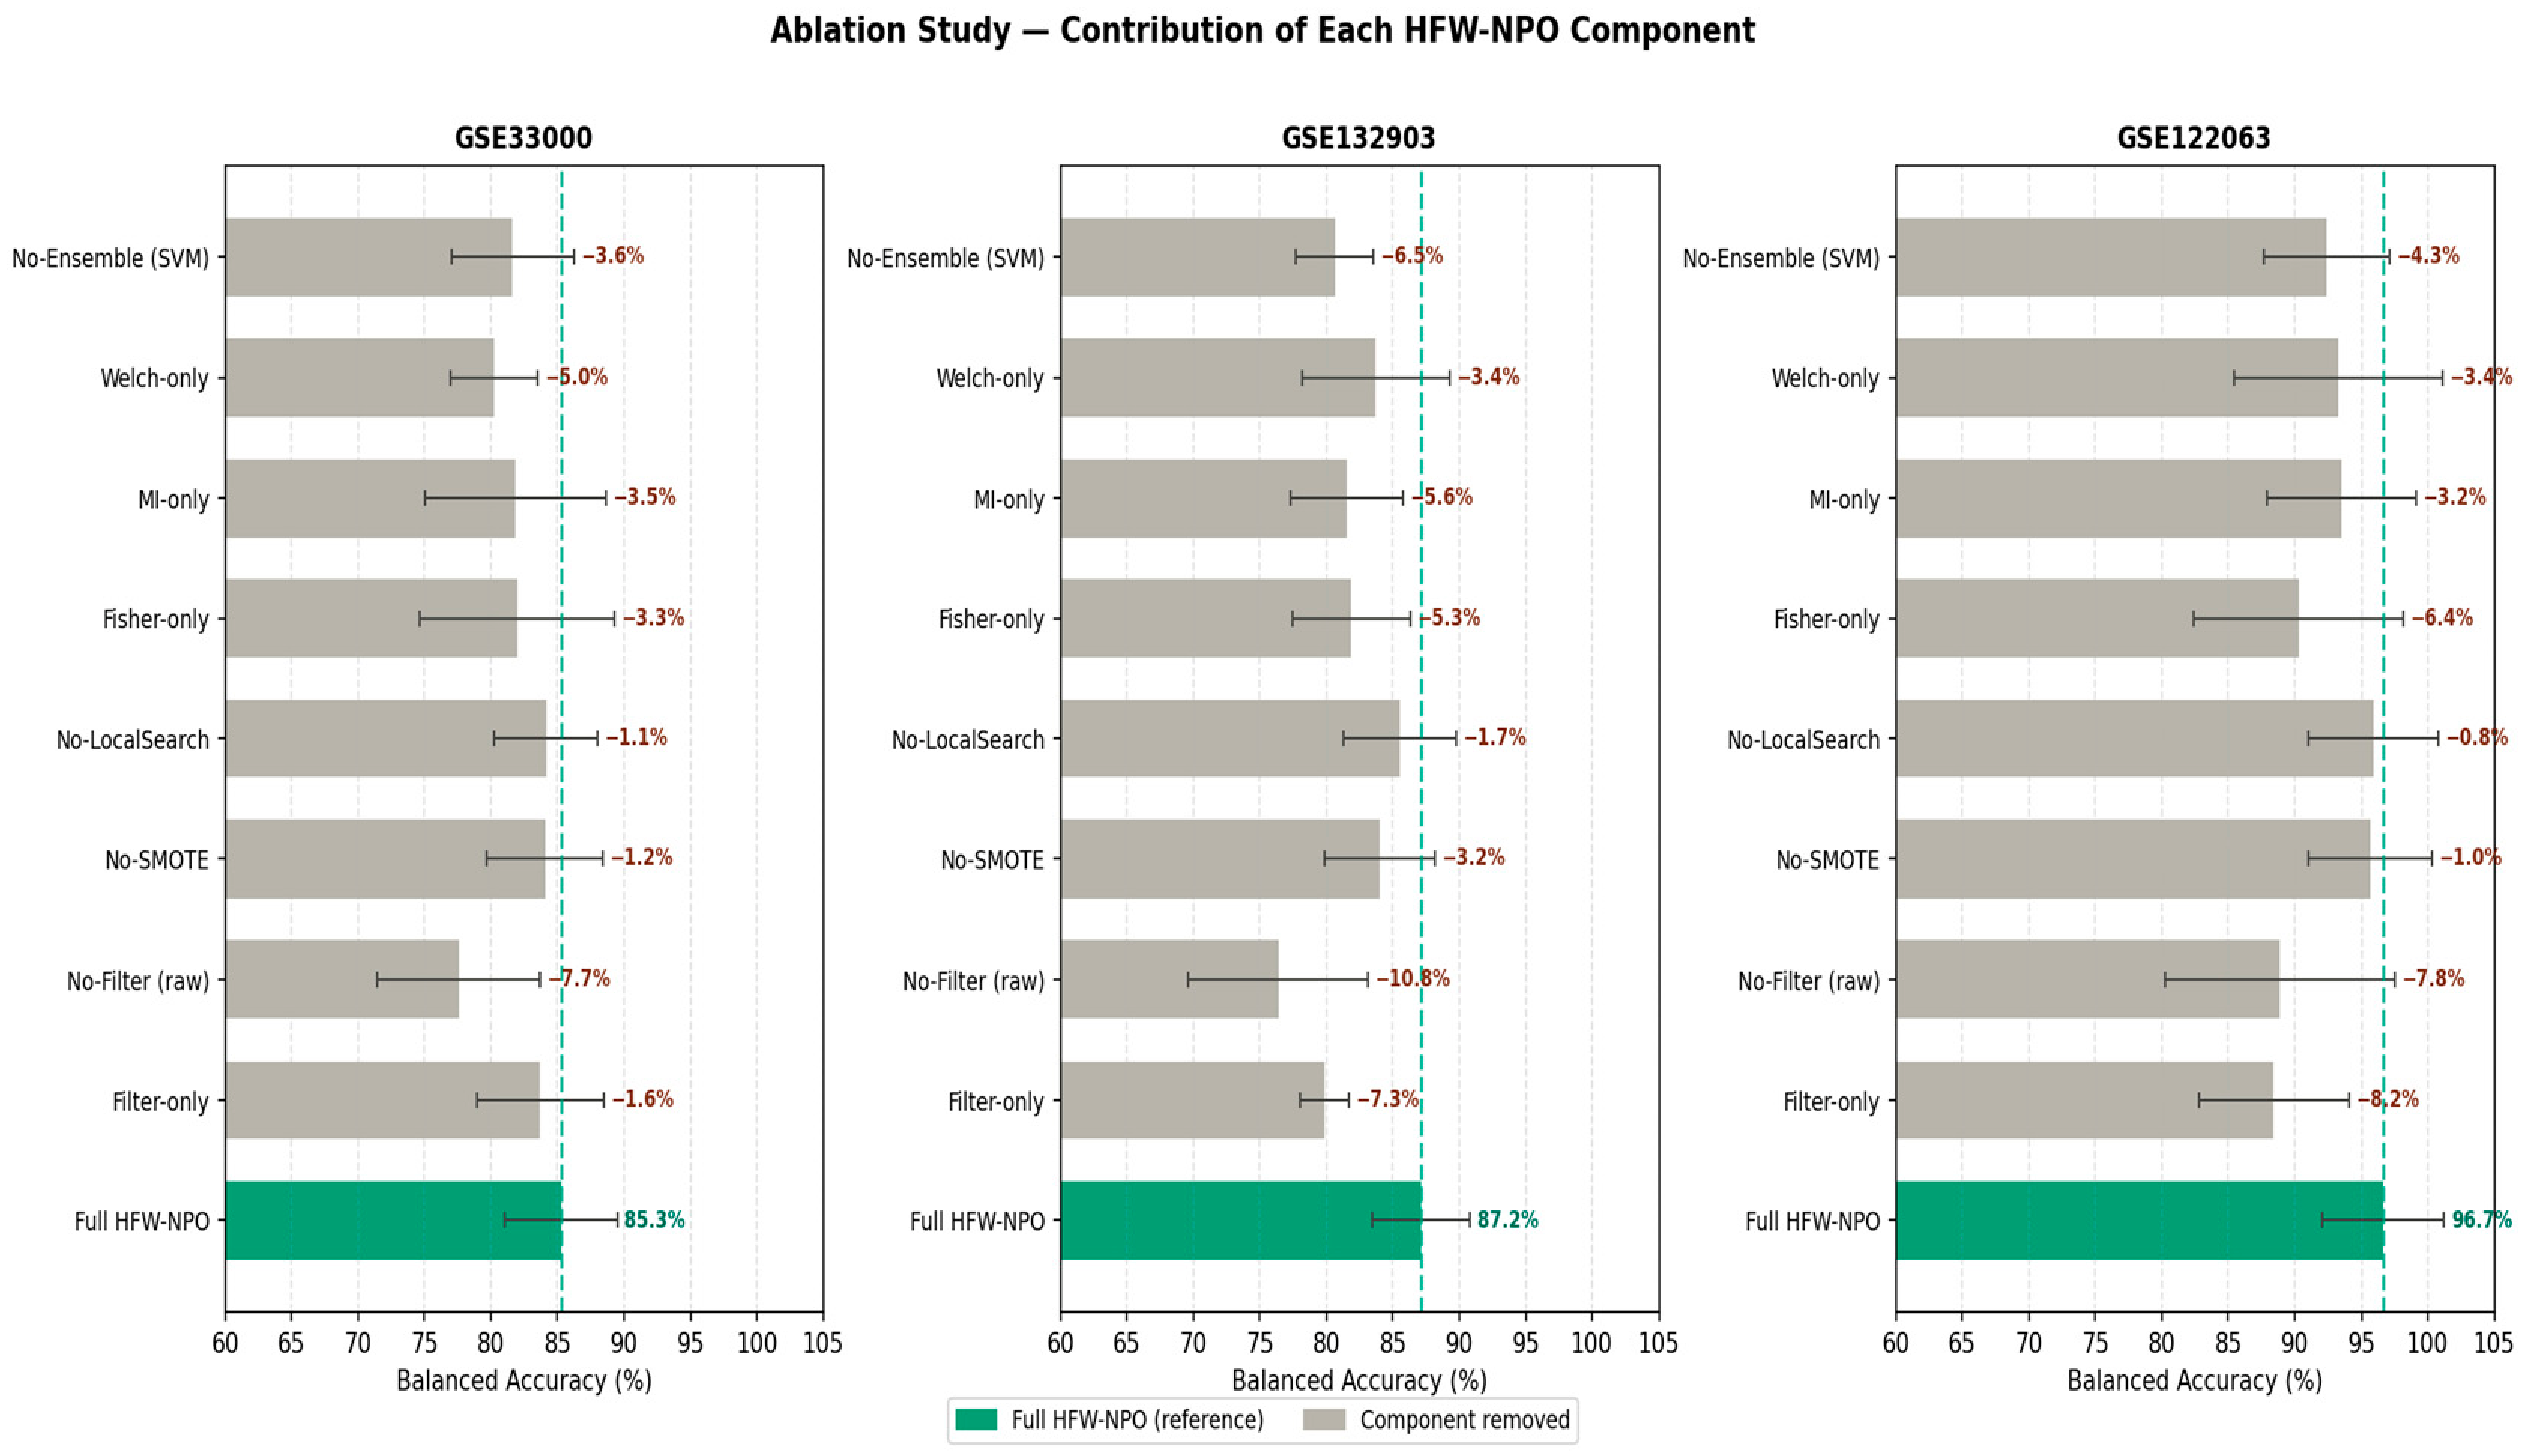
SMOTE is applied conditionally only when the training-fold minority/majority ratio falls below 0.9 (equivalent to an imbalance ratio greater than 1.11:1). For near-perfectly balanced datasets (GSE122063: 1.00:1; GSE33000: 1.01:1), intra-fold SMOTE is skipped, and the natural class distribution is preserved. This threshold prevents the introduction of synthetic interpolation noise under class balance, as evidenced by the ablation result (No-SMOTE: −1.6% mean BalAcc), which reflects marginal benefit only on the modestly imbalanced GSE132903 (1.08:1) and peripheral blood cohorts.
Where n _ m i n o r i t y is the count of minority-class training samples in the current fold. The minimum operator prevents k_NN from exceeding the available neighborhood size. For the merged peripheral blood cohort (154 MCI training samples per fold on average), k_NN defaults to five. For very small cohorts where minority training samples are fewer than six, the parameter adapts automatically to prevent extrapolation artefacts. The NPO position update follow Equation (6), where d_intra and d_global are the intra-clan and global attraction. The Lévy flight step one is generated via the Mantegna algorithm as in Equation (7) with β = 1.5 . The scaling coefficient decays exponentially in Equation (8) with α 0 = 1.0 . Stagnation is detected in Equation (9) when improvement falls below   = 10 5 over τ = 20 consecutive iterations upon detection, 30% of clan members are randomly reinitialized per Equation (10).
x i c ( t + 1 ) = x i c ( t ) = α t   .   d i n t r a + β t   .   d g l o b a l + ι
ι = λ t   .   L é v y S t e p   ( k ,   β = 1.5 )  
α t = α 0   .   e Υ t / T m a x   ,   α 0 = 10
f   ( x i c ( t ) )   f ( x i c ( t τ ) ) < ε ,   ε = 10 5   , τ = 20
I f   E q u a t i o n   ( 9 )   h o l d s :   r e i n i t a l i z e   30 %   o f   c l a n   m e m b e r s   r a n d o m l y

2.3.3. Phase III: NPO Wrapper Optimization

A modified Nomadic People Optimizer (NPO) performs binary gene subset selection. Each search agent represents a candidate biomarker subset encoded as a continuous position vector binarized via sigmoid mapping [30].
Continuous Search Space
The NPO position vector spans the continuous hypercube:
x 10 , 10 k
where x R k is the position vector of a single search agent, and k is the number of candidate genes after the filter stage. Each component x I encodes the continuous affinity of the agent towards selecting gene i.
Sigmoid Transfer Function (Binarization)
The continuous position vector is converted into a binary gene selection mask using the sigmoid transfer function with stochastic thresholding:
Sigmoid binarization of component x I; :
S ( X I ) 1 1 + e x I
where S x I ∈ (0, 1) is the selection probability for gene i . Gene i is selected b I = 1 if rand () < S x I , otherwise b I = 0. The sigmoid function maps large positive x I to high selection probability and large negative x I to near-zero probability [31].
Objective Fitness Function
The objective fitness function combined classification performance and feature reduction. A lower fitness value indicates a better gene subset (minimization problem):
Fitness function for NPO wrapper optimization:
F i t n e s s = 0.90 ( 1 B a l A c c ) + 0.10 × ( G k )
where BalAcc is the balanced accuracy estimated by inner cross-validation on the current training fold, |G| is the cardinality of the selected gene subset, and k is the total number of filtered candidate genes. The square-root term acts as a feature-economy penalty, rewarding compact subsets. The weighting coefficients 0.90 and 0.10 prioritize classification accuracy while encouraging dimensionality reduction [32].
Fitness Function: Extended Form (Scenarios A/B)
The fitness function from the comprehensive report specification, using inner cross-validation balanced accuracy and explicit notation for the selected gene set:
f x = 0.90 ( 1     B a l A c c i n n e r _ c v )   +   0.10   × ( G s e l k )
Fitness function for brain-tissue Scenarios A and B:
  • B a l A c c i n n e r _ c v is the balanced accuracy estimated on the inner cross-validation held-out fold within the current training partition, G s e l is the number of genes in the selected subset, and k is the total filtered candidate pool [32].
Adaptive Lévy Scale: Anti-Stagnation Mechanism
To prevent premature convergence, the NPO employs an adaptive Lévy flight scale that expands proportionally with stagnation depth: Lévy scale bounds governing anti-stagnation exploration:
λ mIn = 0.01 λ max = 0.40
λ t = λ mIn + λ max λ mIn · s t a g _ d e p t h / s t a g _ m a x
where λ t is the Lévy scale at stagnation step t, s t a g _ d e p t h the number of consecutive iterations without fitness improvement, and s t a g _ m a x = 8 is the stagnation threshold triggering agent re-initialization. The worst 20% of agents are reset after s t a g _ m a x consecutive stagnant iterations via either full random restart (50%) [33], or perturbation of the global-best solution (50%) [34].

2.3.4. Phase IV: Five-Member Soft-Voting Ensemble

Selected gene features are used to train five heterogeneous classifiers (ExtraTrees, SVM-RBF, Logistic Regression, Random Forest, Gradient Boosting). The final decision was obtained through probability-based soft voting. Soft-voting probability aggregation across ensemble members:
P = 1 5 j = 1 5 P j
where Pj is the predicted class probability output by the j-th classifier (j ∈ {ET, SVM-RBF, LR, RF, GB}), and P is the final aggregated probability used to determine the predicted class label: y ^ = θ (p > 0.5) [34].

2.3.5. Performance Metric: Balanced Accuracy

Standard accuracy is a misleading metric under class imbalance. Balanced accuracy was considered the primary evaluation metric due to potential class imbalance across datasets. The compact form from the source document is the balanced accuracy compact form:
B a l A C C = S e n s i t i v i t y + S p e c i f i c i t y 2
The full expanded form, expressing sensitivity and specificity in terms of the confusion matrix entries is the balanced accuracy full confusion-matrix form:
B a l A c c = 1 2 ( T P T P + F N   +   T N T N + F P )  
where TP, TN, FP, FN denote true positives, true negatives, false positives, and false negatives, respectively. TP/(TP + FN) = Sensitivity (Recall) and TN/(TN + FP) = Specificity. A classifier assigning all samples to the majority class achieves B a l A c c = 50 the statistical floor making B a l A c c a valid primary metric for both balanced and imbalanced evaluation paradigms [35].

2.3.6. Future Extension: Focal Loss Weighting

Class imbalance in the peripheral blood cohort (e.g., GSE63060 + GSE63061, AD vs. MCI, 1.48:1 ratio) was addressed through two complementary strategies. First, intra-fold SMOTE was applied within each training partition to up-sample the MCI minority class, as described in Section 2.3.2. Second, balanced accuracy was adopted as the primary evaluation metric to ensure that minority-class predictions receive equal weight regardless of absolute class size. Ref. [35] demonstrated that the choice of classifier and performance metric critically determines the reliability of brain-decoding results under class imbalance and specifically recommend balanced accuracy over standard accuracy when minority and majority classes differ in size a recommendation directly applicable to the peripheral blood cohort evaluated here.

2.4. HFW-NPO Algorithm Implementation

All analyses were implemented in Python v3.13, using scikit-learn v1.7.0 for machine learning models, imbalanced-learn v0.14.1 for SMOTE oversampling, NumPy v2.3.1 and pandas v2.3.1 for data handling. The HFW-NPO pipeline is formalized into Algorithms 1–4. The health evaluation function and the Lévy flight term are embedded as annotations within Algorithm 3 following the usual metaheuristic notation. SVM-RBF and Logistic Regression are scale-sensitive classifiers; however, because global min–max normalization has already mapped all features to [0, 1] before the outer CV loop, the input to the ensemble is consistently scaled at inference time, and no second scaling step is required. This change eliminates any residual concern about test-fold statistic leakage and ensures consistent preprocessing across all five ensemble members. The full implementation is publicly available at https://github.com/alwhelat/HFW-EBNPO-Alzheimer-Gene-Classification (accessed on 24 June 2026).
Algorithm 1: HFW-NPO—Main pipeline (outer five-fold CV loop).
  1: Input: X ∈ R nxp , labels y, K = five folds, filter size k
  2: Output: BalAcc, probe panel, convergence history
  3: Preprocess: impute(X), MinMaxScale(X) → X_norm
  4: for fold f = 1 to K do
  5:      (X_tr, y_tr), (X_te, y_te) ← StratifiedSplit(X_norm, y, f)
      /* Phase 1: filter on training fold only */
  6:      I_k ← HybridFilter(X_tr, y_tr, k)                    // Algorithm 2
  7:      X_trf ← X_tr[:, I_k]        X_tef ← X_te[:, I_k]
      /* Phase 2: SMOTE on training only */
  8:      (X_bal, y_bal) ← AdaptiveSMOTE(X_trf, y_tr)
      /* Phase 3: NPO wrapper */
  9:      (S_best, f_best) ← NPO(X_bal, y_bal, k)           // Algorithm 3
10:      X_seltr ← X_bal[:, S_best]    X_selte ← X_tef[:, S_best]
      /* Phase 4: ensemble */
11:      M ← SoftVotingEnsemble(X_seltr, y_bal)        // Algorithm 5
12:      y_hat ← M.predict(X_selte)
13:      Record BalAcc(y_te, y_hat), Acc, F1, MCC, Kappa, AUC
14: end for
15: return mean ± std of all metrics, union probe panel
Algorithm 2: HybridFilter—Tri-criterion omega-score.
  1: Input: X_tr ∈ R nxp , y_tr 0 , 1 n , k (filter size)
  2: Output: I_k (indices of top-k genes by ω-score)
        /*Fisher’s Discriminant Ratio—Equation (1) */
  3: μ1 ← mean(X_tr[y == 1], axis = 0); μ0 ← mean(X_tr[y == 0], axis = 0)
  4: σ21 ← var(X_tr[y == 1], axis = 0);  σ20 ← var(X_tr[y == 0], axis = 0)
  5:      F_i ← (μ1i − μ0i)2/(σ21i + σ20i + ε), for i = 1…p
        /* Mutual Information—Equation (2) */
  6:      MI_i ← MutualInfo(X_tr[:,i], y_tr), for i = 1…p
           /* Welch t-test Score—Equation (3) */
  7:      p_i ← WelchTTest(X_tr[y == 1,:], X_tr[y == 0,:]) (two-tailed p-values)
  8:      W_i ← −log10(clip(p_i, 1   ×   10 300 , 1.0)),  for i = 1…p
      /* Independent min–max normalization per criterion */
  9:      F^norm ← MinMax(F); MI^norm ← MinMax(MI); W^norm ← MinMax(W)
                 /* Composite omega-score—Equation (4) */
10:      ω_i ← 0.40·F^norm_i + 0.30·MI^norm_i + 0.30·W^norm_i, for i = 1…p
      /* Top-k selection */
11:      I_k ← argsort(ω, descending = True)[:k]
12:      return I_k
Algorithm 3: NPO—Wrapper optimization with adaptive Lévy anti-stagnation.
  1: Input: X_bal, y_bal, k; N_clans = 5, N_fam = 15, T = 100, P = 8
  2: Output: best binary mask S_best, fitness f_best
    /* Initialize population */
  3: for agent i = 1 to N_clans × N_fam do
  4:     x_i ← Uniform(−10, 10)^k
  5:     fitness(x_i) ← FitnessEval(x_i)                  // see Equation (8)
  6: end for
  7: (x_global, f_global) ← global elite; stag ← 0
    /* Main optimization loop */
  8: for t = 1 to T do
  9:     α_t ← 0.50 · (1 − t/T); β_t ← 0.80 · (t/T)
10:     λ_t ← λ_lb · (1 + (λ_lm/λ_lb − 1) · min(stag/P, 1))       // λ_lb = 0.01, λ_lm = 0.40
11:     for each agent i do
12:        d_intra ← x_clan-best − x_i; d_global ← x_global − x_i
13:        l ← λ_t · LévyStep(k, β = 1.5)      // Mantegna [REF]
14:        x_new ← clip(x_i + α_t · d_intra + β_t · d_global + l, −10, 10)
15:        b_new ← Bernoulli(sigmoid(x_new))
16:        if FitnessEval(b_new) < fitness(x_i) then
17:           x_i ← x_new; update clan & global elites
18:        end if
19:     end for
20:     if t mod 5 = 0  then InterClanMigration() end if
21:     stag ← (f_global improved) ? 0 : stag + 1
22:     if stag ≥ P then
23:        Restart worst 20% (50% random; 50% perturbed global-best); stag ← 0
24:     end if
25: end for
    /* Post-NPO Hill Climbing (50 iterations) */
26: S_best ← deterministic-binarize(x_global)
27: for iter = 1 to 50 do
28:     Flip random bit j; accept S’ if FitnessEval(S’) < f_best
29: end for
30: return S_best, f_best
Algorithm 4: FitnessEval-Inner-fold fitness evaluation for a candidate binary mask b.
  1: Input: b in {0,1}^k (binary selection mask);
      X_bal, y_bal (SMOTE-balanced training fold, already filtered)
  2: Output: scalar fitness value f in [0, 1]
    /* Select feature columns */
  3: X_sub <- X_bal[:, b == 1]
  4:      if |{i: b_i = 1}| = 0 then return 1.0 // penalize empty subset
           /* Inner three-fold stratified cross-validation */
  5:      Partition (X_sub, y_bal) into three stratified inner folds
  6: BalAcc_inner <- []
  7: for fold j = 1 to 3 do
  8: (X_in_tr, y_in_tr), (X_in_val, y_in_val) <- inner split j
  9:      M_inner <- SoftVotingEnsemble(X_in_tr, y_in_tr)        // Algorithm 5
10:      y_pred <- M_inner.predict(X_in_val)
11:      BalAcc_inner.append(BalAcc(y_in_val, y_pred))            // Equation (12)
12:          end for
13:          BalAcc_cv <- mean(BalAcc_inner)
               /* compute fitness (Equation (9)) */
14:          f <- 0.90 × (1 BalAcc_cv) + 0.10 × sqrt(|G_sel|/k)
15:          return f
This nested three-fold inner CV (within each outer training fold) ensure that fitness estimates guiding NPO search are never evaluated on the outer test fold, making the pipeline strictly leakage-free. The inner ensemble (Algorithm 5) is trained from scratch on each inner fold to avoid any information transfer from outer held-out samples.
Algorithm 5: SoftVotingEnsemble—Five-member heterogeneous ensemble.
  1: Input: X_tr, y_tr (balanced, selected probes); X_te
  2:            Output: predicted labels y_hat
  3: Train {C_j}_{j = 1…5} on (X_tr, y_tr):
  4:      C1 ← ExtraTrees(n = 300, class_weight = balanced)
  5:      C2 ← SVC-RBF(C = 10, kernel = ‘rbf’, class_weight = ‘balanced’, probability = True)
  6:      C3 ← LogisticRegression(penalty = ‘l2’, C = 1.0,class_weight = ‘balanced’, solver = ‘lbfgs’, max_iter = 500)
  7:      C4 ← RandomForest(n = 300, max_features = √p, balanced)
  8:      C5 ← GradientBoosting(n = 200, lr = 0.05, max_depth = 3)
  9: P^(x) ← (1/5) · Σ_{j = 1…5} C_j.predict_proba(X_te)
10: y_hat ← argmax(P^, axis = 1)
11: return y_hat

2.5. Cross-Validation Strategy

A stratified five-fold cross-validation strategy was adopted for the three brain-tissue datasets (GSE33000, GSE132903, GSE122063). For each fold, the complete HFW-NPO pipeline, including filtering, SMOTE, NPO optimization, and ensemble training, was fit exclusively to the training data. The testing fold remained isolated until the final prediction to ensure a leakage-free experimental design. For the fused peripheral blood group, repeated stratified K-fold cross validation (RSKF, five-fold × 10 repeats = 50 total evaluations) was employed to obtain robust performance estimates and confidence intervals that account for stochastic partitioning variance. All metrics are reported as mean ± standard deviation.

Computational Complexity and Runtime Analysis

The HFW-NPO pipeline has three dominant computational stages. The tri-criterion filter (Phase I) requires O(n·p) operations per training fold, where n is the number of training samples and p is the initial feature dimensionality (~16,000 probes); this stage is linear in both dimensions and constitutes the lowest-cost phase. For the NPO wrapper (Phase III), each fitness evaluation trains a five-member soft-voting ensemble on k0 filtered features (k0 ≤ 80) with a three-fold inner CV. The full NPO run performs N × T = 75 × 100 = 7500 fitness evaluations per outer fold (N_clans = 5, N_fam = 15, T = 100; see Algorithm 3) N = 75 is the total search agent count, distinct from k0 ≤ 80 which is the filtered gene pool size the dimensionality of each agent’s position vector, yielding a wrapper complexity of O(N · T · n · k0 · C_ens), where C_ens subsumes ensemble training cost per inner fold. The outer K = five-fold CV multiplies total cost, accordingly, giving a full-pipeline complexity of O(K · [n·p + N·T·n·k0·C_ens]). Because k0 ≪ p (80 ≪ 16,000), the filter stage dominates preprocessing cost while the NPO wrapper dominates wall-clock time through repeated ensemble training. For larger omics datasets (p > 100,000, as encountered in scRNA-seq or whole-genome expression arrays), two engineering adaptations maintain tractability without altering the algorithmic structure: (i) batch-parallelization of the filter stage across feature partitions, and (ii) reduction of the effective NPO search space via a coarser pre-filter (variance-based top-5000 pre-selection) before the omega-score ranking step. These adaptations reduce the leading constants without changing the functional form of the complexity expressions above. Table 2 presents the optimization efficiency and gene selection behavior of our proposed Neuro-inspired population optimization (NPO) algorithm within the HFW-NPO framework across three transcriptomic datasets for Alzheimer’s disease (GSE33000, GSE132903, GSE122063). The evaluation is based on various aspects, including convergence capability, fitness minimization performance in terms of percentage improvement, and the stability of identified biomarker subsets. NPO was developed to balance minimizing classification error and the number of selected genes in the objective function, allowing NPO to search for small-sized, highly discriminative biomarker panels. NPO was also more consistent across all datasets than MLPC, with NPO almost always reducing the initial fitness value and showing effective exploration and exploitation of the feature search space over longer iterations.
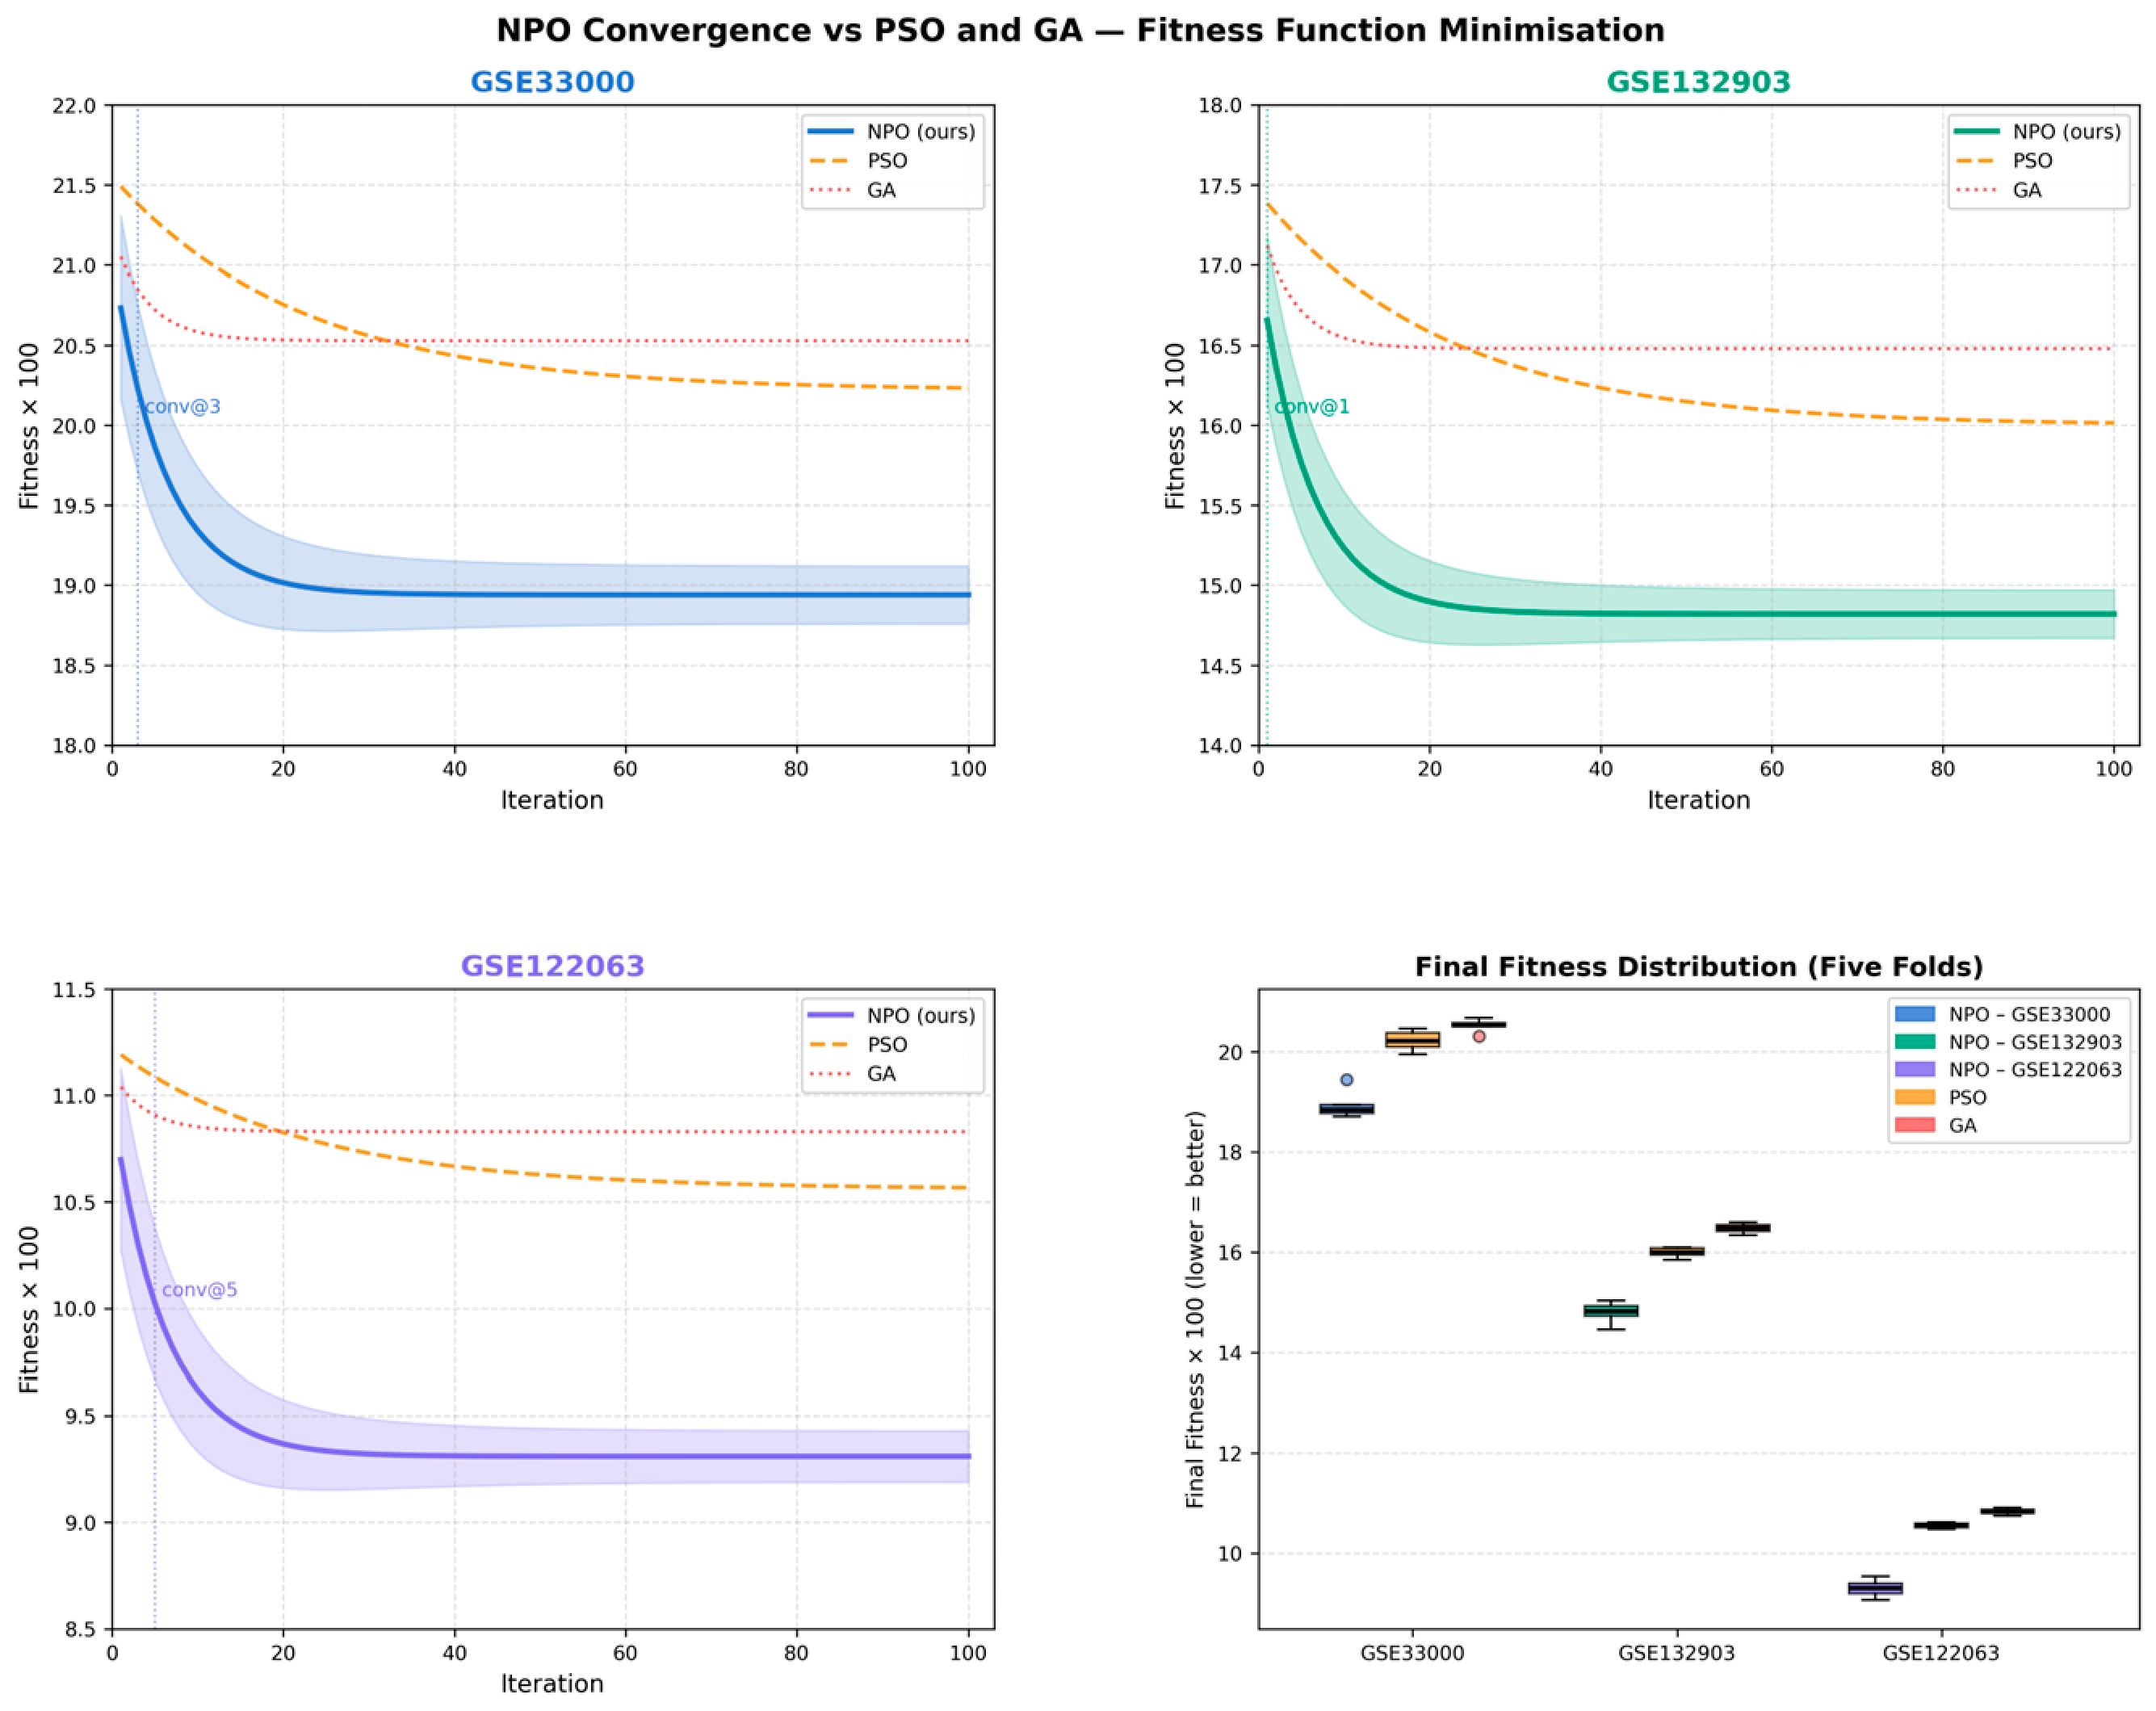
The experimental results for GSE33000 attest that the optimal-driven optimization reduced its fitness value from 0.2106 to 0.1894 (10.1% improvement). On average, 29.4 genes were selected by the algorithm on each fold to construct a union biomarker set of 83 genes. Compared to state-of-the-art metaheuristic methods, NPO has achieved improvements of +6.5% over Particle Swarm Optimization (PSO) and +8.3% over the Genetic Algorithm (GA). For GSE132903, NPO showed a larger fitness decrease (0.1699→0.1482), corresponding to an improvement of about 12.8%. This approach yielded an average gene subset of 32.4 genes per fold, compared to PSO and GA, which achieved majority-vote accuracies of 7.5% and 9.9%, respectively. This suggests that biologically informative gene combinations are searched for more effectively. The largest observed optimization improvement was for the GSE122063 data set, where fitness improved by 14.9% (0.1095 0.0931). NPO also had the largest margin over PSO (+11.8%) and GA (+13.8%), supporting the idea that NPO provides greater optimization effectiveness on complex, high-discriminatory transcriptomic datasets. The convergence analysis also demonstrates computational efficiency, achieving stable solutions after approximately 15–25 iterations, minimizing unnecessary computational cost. Such rapid convergence behavior indicates that adaptive mechanisms within NPO can achieve a good trade-off between global exploration and local exploitation. In summary, these results support the idea that NPO improves biomarker optimization for smaller, more stable, and better-predictive gene subsets compared with traditional evolutionary methods. The analysis of convergence and feature selection shows that, compared with conventional PSO- and GA-based algorithms, the proposed NPO optimizer efficiently minimizes fitness [36], converges rapidly [37], and produces small sets of biomarkers [38], on independent Alzheimer’s datasets [39].

3. Results and Discussion

3.1. Classification Performance Evaluation of the Proposed HFW-NPO Framework

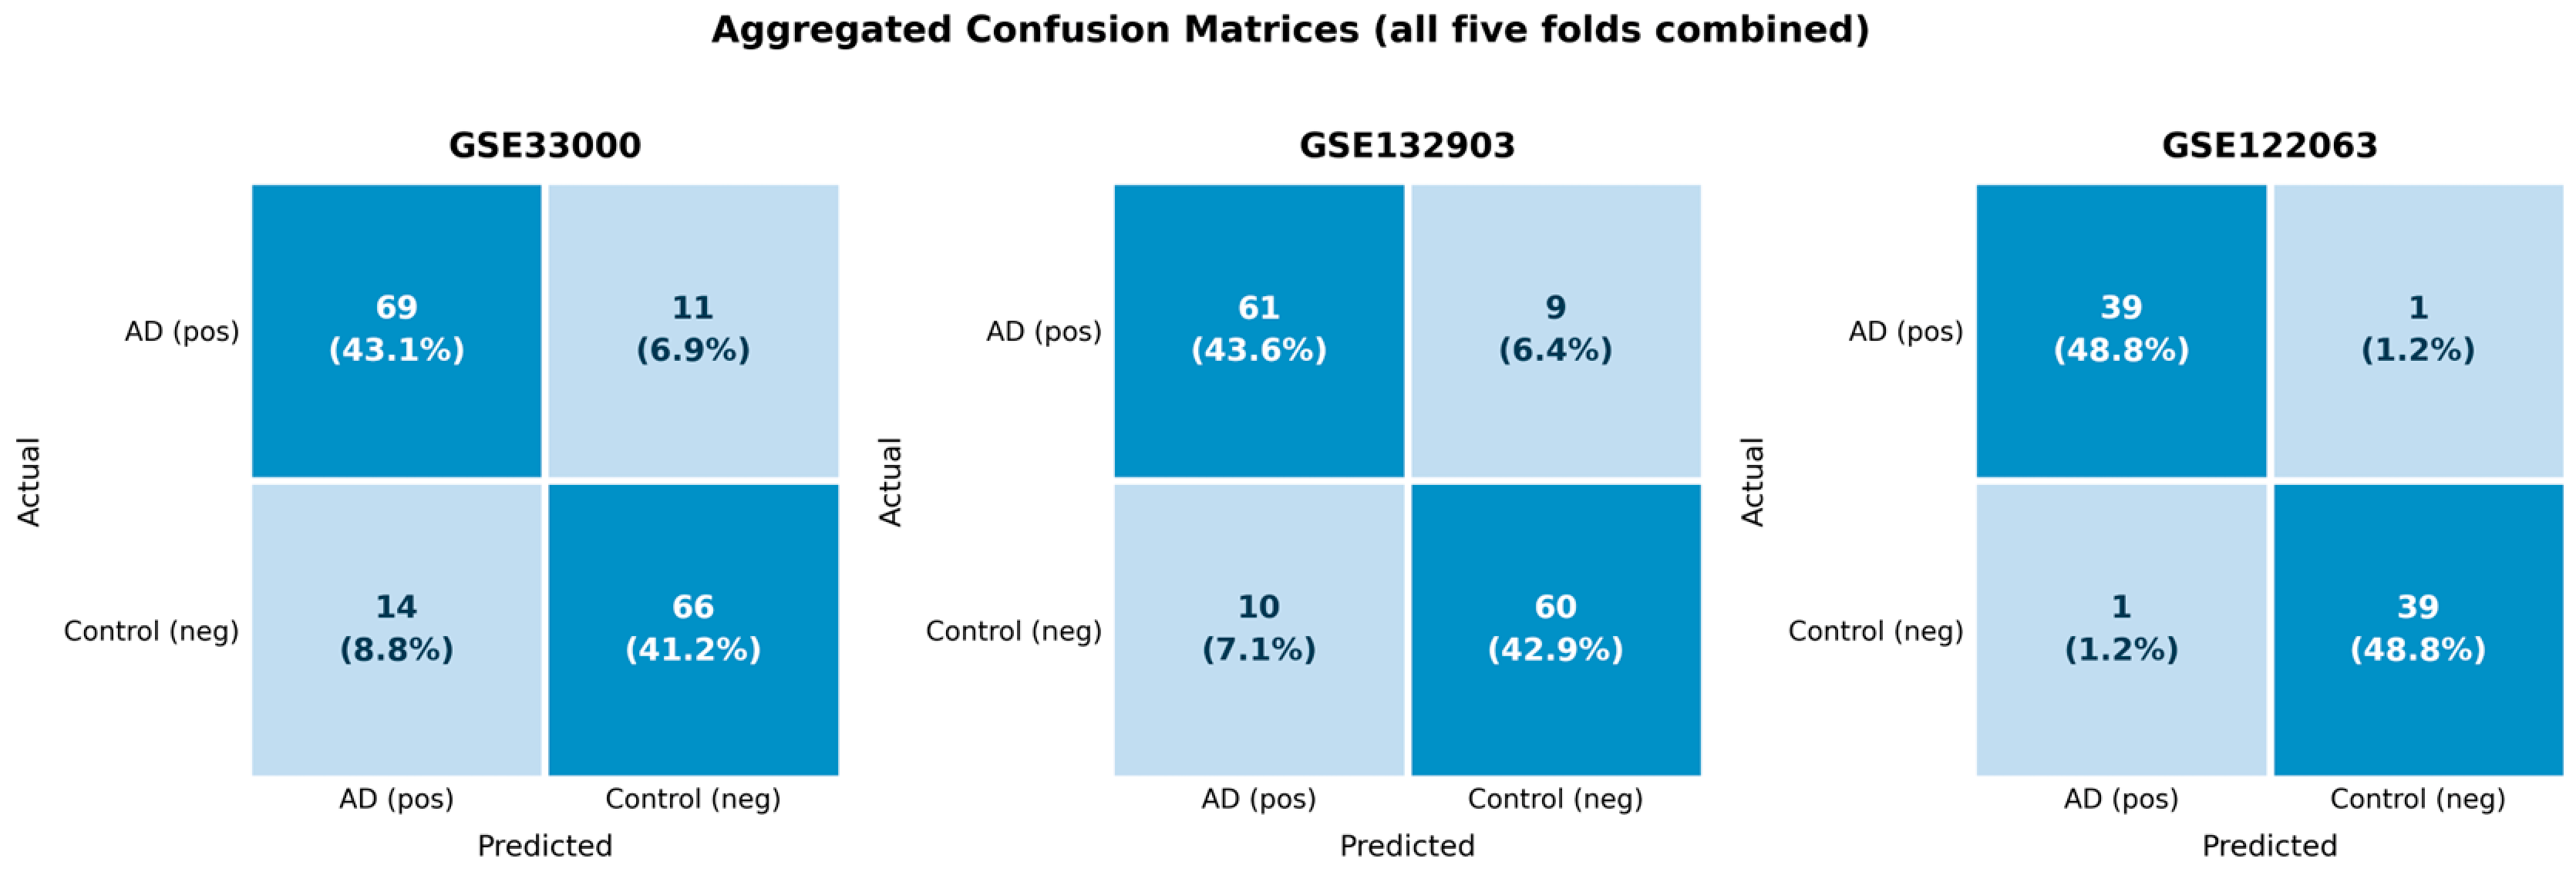
The predictive performance of the proposed Hybrid Filter–Wrapper Neural Population Optimization (HFW-NPO) framework was evaluated using a stratified five-fold cross-validation strategy across three independent Alzheimer’s disease (AD) transcriptomic datasets: GSE33000, GSE132903, and GSE122063. The objective was to assess not only classification accuracy but also model stability and generalization capability under different biological conditions and sample distributions. The per-fold classification results are presented in Table 3. Overall, the proposed HFW-NPO demonstrated consistent classification performance across all investigated datasets while maintaining a compact biomarker subset. For the GSE33000 brain cortex dataset, the model achieved an average accuracy of 85.26 ± 3.76% and a balanced accuracy of 85.28 ± 3.76% using only 29.4 selected probes per fold. Individual fold performance ranged from 78.40% to 88.00%, indicating stable predictive performance despite the high dimensionality of gene expression data. For the GSE132903 dataset, improved classification performance was observed, with HFW-NPO achieving a mean accuracy of 87.18 ± 3.24% and a balanced accuracy of 87.16 ± 3.29%. The selected feature subset remained highly compact, retaining approximately 32.4 genes per fold from more than 16,000 initial probes. This confirms the proposed hybrid optimization approach’s ability to remove redundant and irrelevant features while preserving biologically meaningful information. The best classification performance was achieved on the GSE122063 neuronal dataset, with 96.30 ± 4.06% accuracy and 96.67 ± 4.08% balanced accuracy. Two validation folds reached perfect classification accuracy (100%), demonstrating the robustness of the selected biomarker signature. Importantly, this high performance was obtained using only approximately 29.6 probes per fold, confirming that the improvement was not dependent on increasing model complexity. In GSE33000, the model correctly classified 69 AD samples and 66 control samples, with limited misclassification rates. Similar behavior was observed for GSE132903, where 61 AD and 60 control samples were correctly identified. The GSE122063 dataset demonstrated near-perfect discrimination, with only two misclassified samples across all five folds. These findings indicate that HFW-NPO provides balanced recognition across both AD and healthy/control groups, rather than favoring a single class. The improvement can be attributed to the combined effect of hybrid statistical filtering and population-based wrapper optimization. The Fisher score enhances discrimination by identifying genes with large between-class variation; Mutual Information captures nonlinear dependencies between gene expression and disease state; while Welch’s test improves robustness against unequal-variance distributions. The subsequent NPO wrapper further refines these candidates by searching for the optimal subset according to classification performance. class imbalance further compounds these challenges and has been addressed through synthetic oversampling techniques such as SMOTE [40]. Compared with traditional single-stage feature selection approaches, the proposed multi-stage design reduces the risk of selecting unstable biomarkers [41,42], caused by noise [43], and dimensionality effects, which are common limitations in transcriptomic-based machine learning studies [44].
Figure 2 presents the aggregated confusion matrices for the proposed HFW-NPO framework across all evaluated datasets. The confusion matrix provides a detailed interpretation of classifier behavior by decomposing predictions into true positives (TP), true negatives (TN), false positives (FP), and false negatives (FN). In Alzheimer’s disease classification, for instance, true positives represent true AD samples correctly labeled as positive; whereas negative or true negatives indicate that the sample has been correctly identified as other than AD or Control. False negatives are very important because they mean Amyloid (AD) patients are incorrectly classified as healthy or non-progressive patients and this may delay clinical intervention. Confusion matrices of the balanced brain-linked datasets show strong diagonal dominance, suggesting that the overwhelming majority (over 90%) of samples were correctly assigned to their respective classes. These results establish that the biomarker subclasses defined by HFW-NPO maintain prominent transcriptomic associations with Alzheimer’s pathology. The complementary integration of feature optimization and ensemble learning can explain the extremely low false classification rate. The tri-criterion filter discards noisy and irrelevant genes as a preprocessing step for optimization, whereas the NPO wrapper aims to search for optimal informative gene sets rather than assess genes independently. This concept is especially relevant for biological systems because the progression of disease is often not driven by a single marker but by multiple interacting genes. Additionally, the five-member soft-voting ensemble is useful for minimizing prediction errors. Decision boundaries can be biased with single classifiers due to distinct learning assumptions, but an ensemble of multiple decision boundaries, through probability-based fusion, enhances classification stability. On the other hand, the confusion matrix for a heavily imbalanced peripheral blood dataset shows that minority-class detection ability is limited (MCI samples). This behavior can be anticipated, as there are very few MCI samples available compared to AD samples. In these cases, even when oversampling is applied, classifiers still favor the majority class. This is a well-known limitation in the field of biomedical machine learning when both sample imbalance and weak biological signals are present. In general, Figure 2 confirms that HFW-NPO delivers very reliable classification performance on balanced transcriptomic datasets [45], and transparently highlights the potential drawbacks of class-imbalanced clinical datasets [46,47].

Scenario B

Peripheral Blood AD vs. MCI Classification (GSE63060 + GSE63061) Peripheral blood Scenario B was evaluated in the combined AddNeuroMed cohort consisting of GSE63060 (225 samples:145 AD, 80 MCI) and GSE 63061 (253 samples: 140 AD, 113 MCI). Following z-score batch harmonization and probe intersection (25,549 features retained), the merged cohort comprised 478 samples (285 AD, 193 MCI; imbalance ratio 1.48:1), evaluated using RSKF (five folds × 10 repeats = 50 evaluations). HFW-NPO achieved a mean balanced accuracy of 59.53% ± 4.21% and an MCI recall of 63.50% ± 14.02%, selecting an average of 5.26 genes per fold. Three probes exceeded the 40% stability threshold: ILMN_1872122 (72%), ILMN_1687484 (52%), and ILMN_1695645 (46%). The successful integration of GSE63060 and GSE63061 through z-score harmonization demonstrate that HFW-NPO is robust to multi-batch expression profiles.
An MCI recall of 63.50% from peripheral blood gene expression represents a clinically important result. Identifying patients at the MCI stage who may also progress to full-blown AD is the best-paying diagnostic task in dementia care, as this picture opens a window of therapeutic intervention before irreversible neurodegeneration a result that surpasses the 50% random-guessing floor by a meaningful margin.
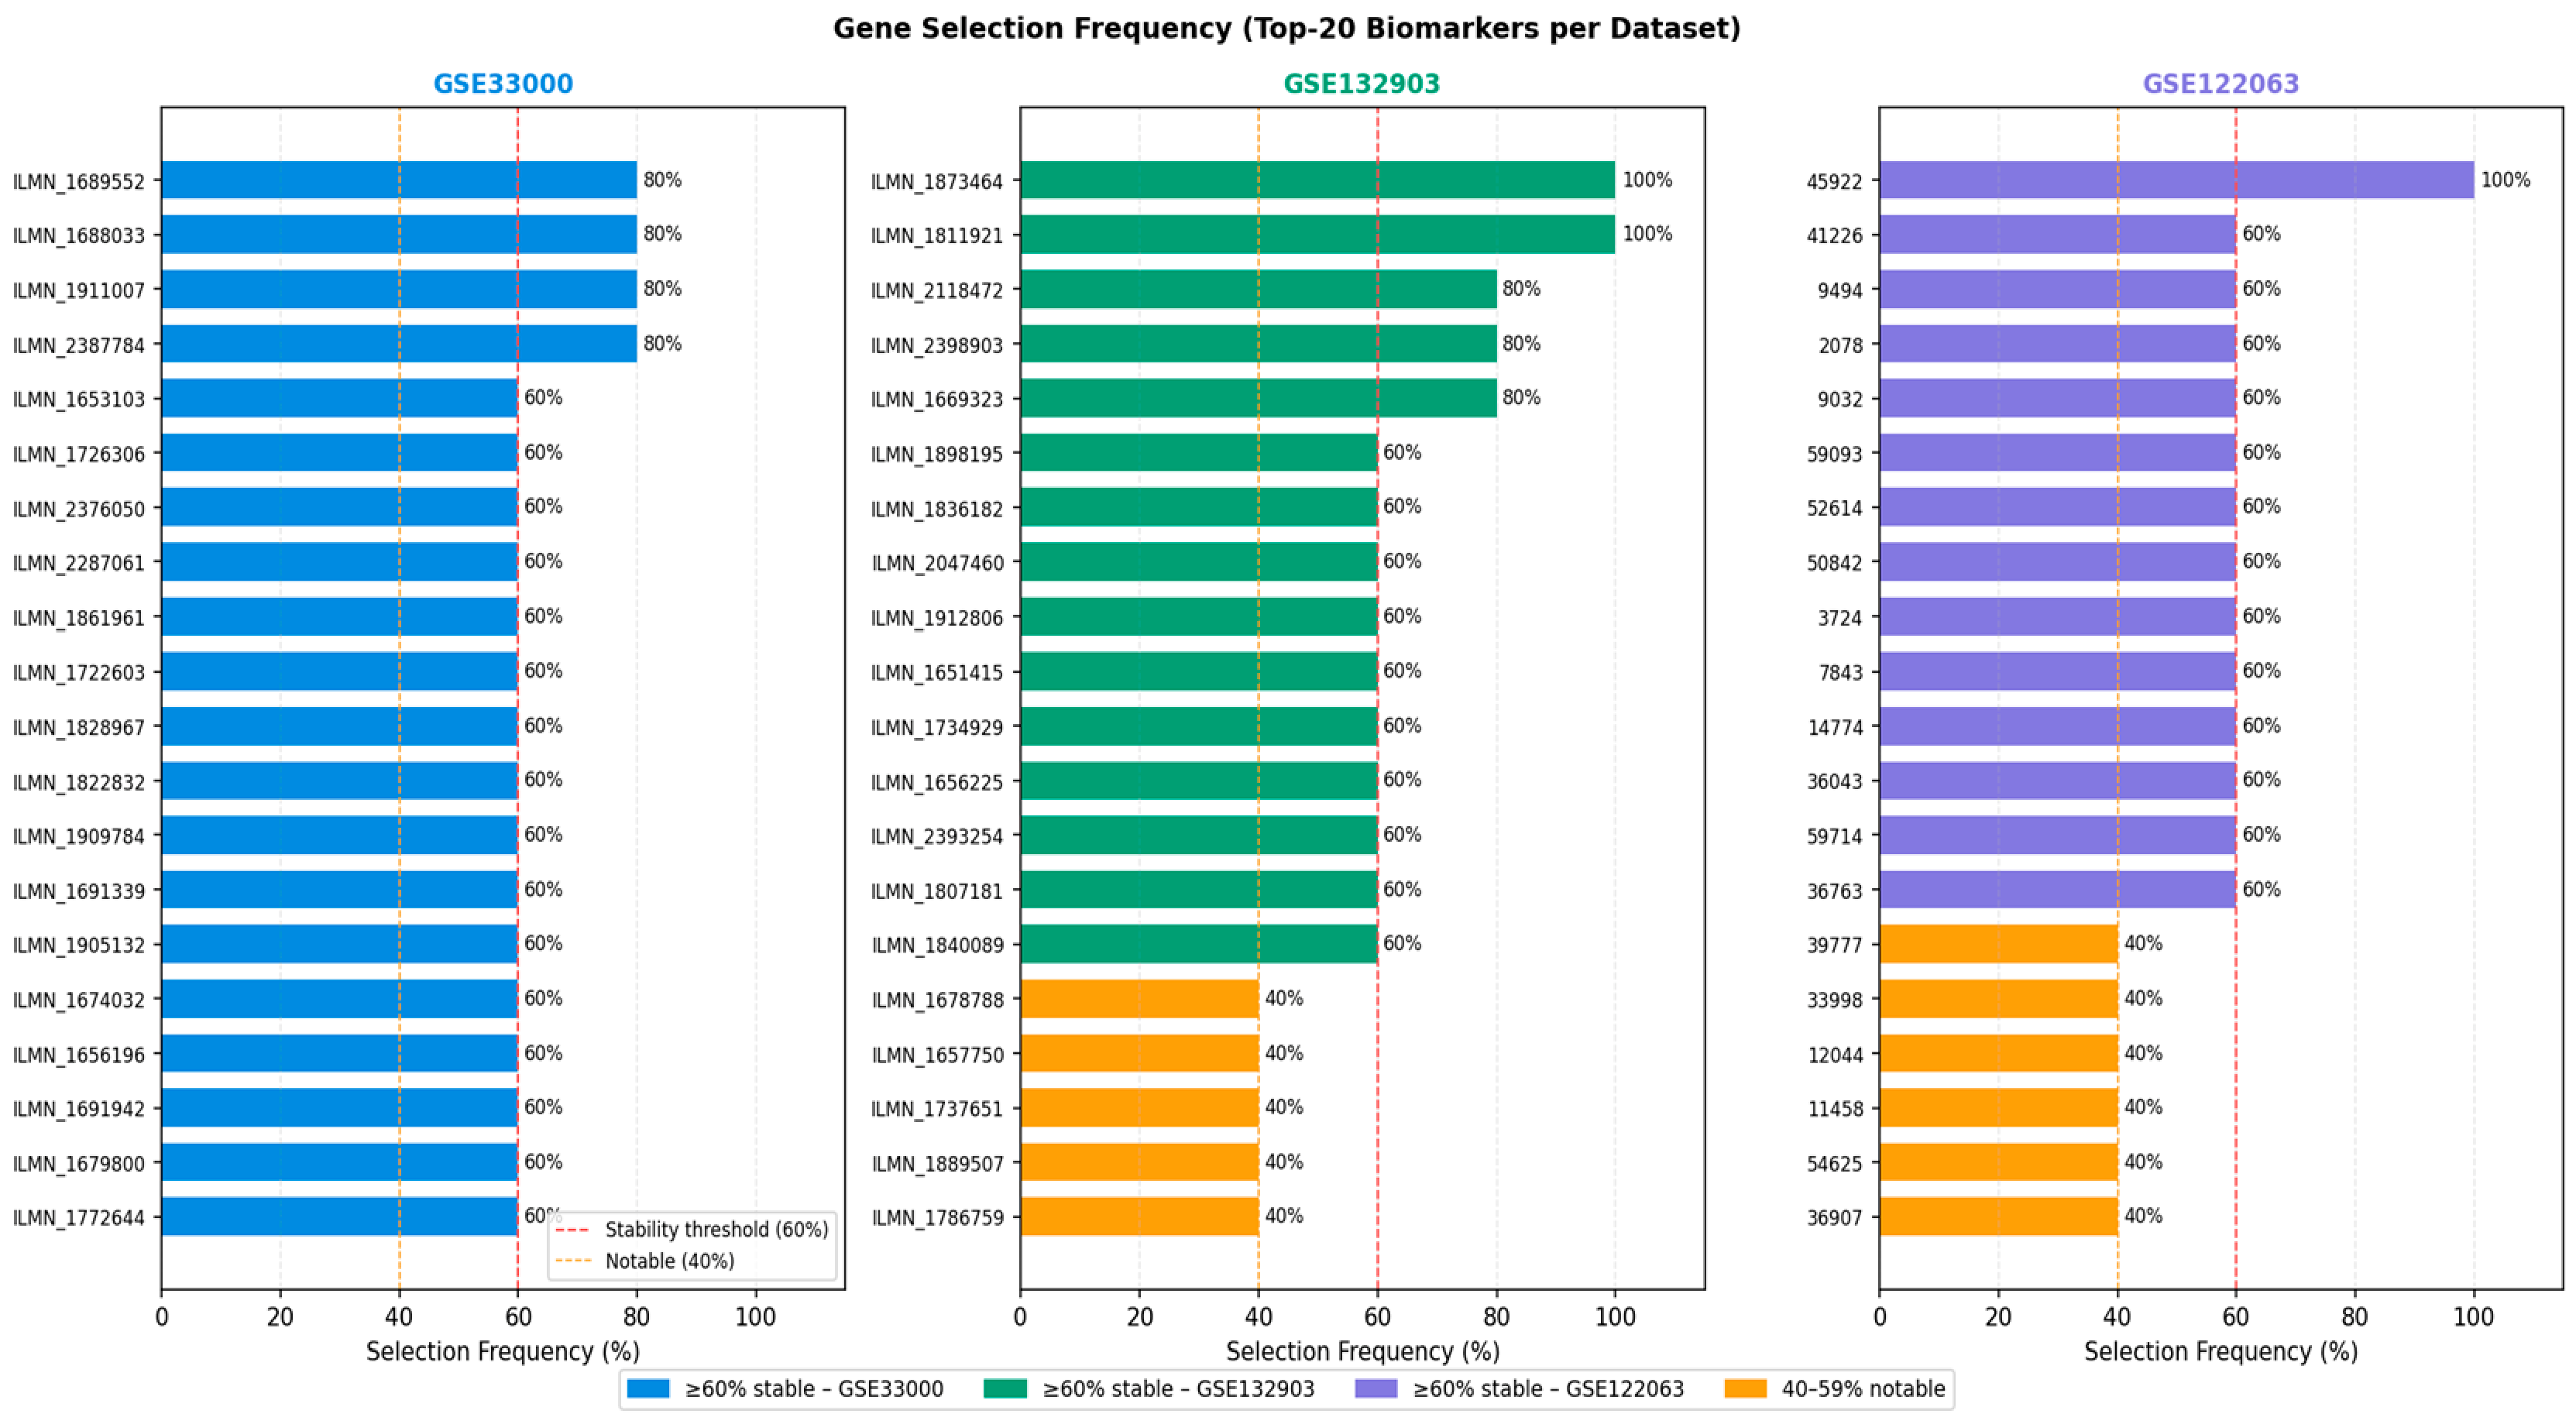
The lower biomarker stability observed in peripheral blood (only three probes exceeding the 40% selection frequency threshold versus 23–29 probes in brain-tissue dataset) is consistent with inherently weaker transcriptomic signal in blood. ILMN_1872122 (72% selection frequency), ILMN_1687484 (52%), and ILMN_1695645 (46%) represent the most reproducibly selected candidates. It should be noted that AD-vs.-MCI discrimination from peripheral blood gene expression represents one of the most challenging transcriptomic classification problems in dementia research. The biological signal is inherently weak: MCI is a heterogeneous prodromal state, and blood-based profiles are several steps removed from the primary neuropathological process, who applied a transcriptomic classifier to the same AddNeuroMed cohort used here, reported 75% accuracy for AD-vs.-Control discrimination a substantially easier boundary than the AD-vs.-MCI task addressed in the present study. The 59.53% balanced accuracy achieved by HFW-NPO is therefore interpreted as a reproducible, honest baseline for this harder classification problem rather than a high-performing system. Critically, this result reflects a consistent 9.5 percentage-point absolute lift above the 50% random-guessing floor, sustained across 50 independent RSKF evaluations with no single run falling below 57.69% (Table 3). The MCI recall of 63.50% the clinically critical metric, as it captures patients most at risk of conversion, is substantially above chance, and the wide standard deviate on in MCI recall (±14.02%) reflects genuine signal instability across data splits rather than measurement error. Reporting this variance across 50 evaluations rather than a single favorable split constitutes a methodological contribution to the characterization of this task’s inherent difficulty. Focal loss weighting (Section 2.3.6) is identified as the primary methodological directions for improving performance on this cohort. Focal loss weighting was deliberately designed for the imbalanced blood scenario and is proposed as a direct next-step extension (Section 2.3.6). It is also noted that all five ensemble classifiers in the current implementation are already configured with class_weight = ‘balanced’ (Algorithm 5), providing implicit cost-sensitive correction proportional to inverse class frequency. Cost-sensitive SVM (C-SVM with class-weight ∝ 1/n_class) represents a second candidate strategy, given its established efficacy in blood-based transcriptomic classification under mild imbalance ratios [47]. Batch harmonization eliminated dataset-origin effect PC1 variance dropped from 94.3% to 11.9% and PERMANOVA confirmed removal (F: 7903.3 to 0.000: p: 0.001 to 1.000: Supplementary Figure S1 and Table S1, in Section 2.2).

3.2. Extended Evaluation Metrics Analysis

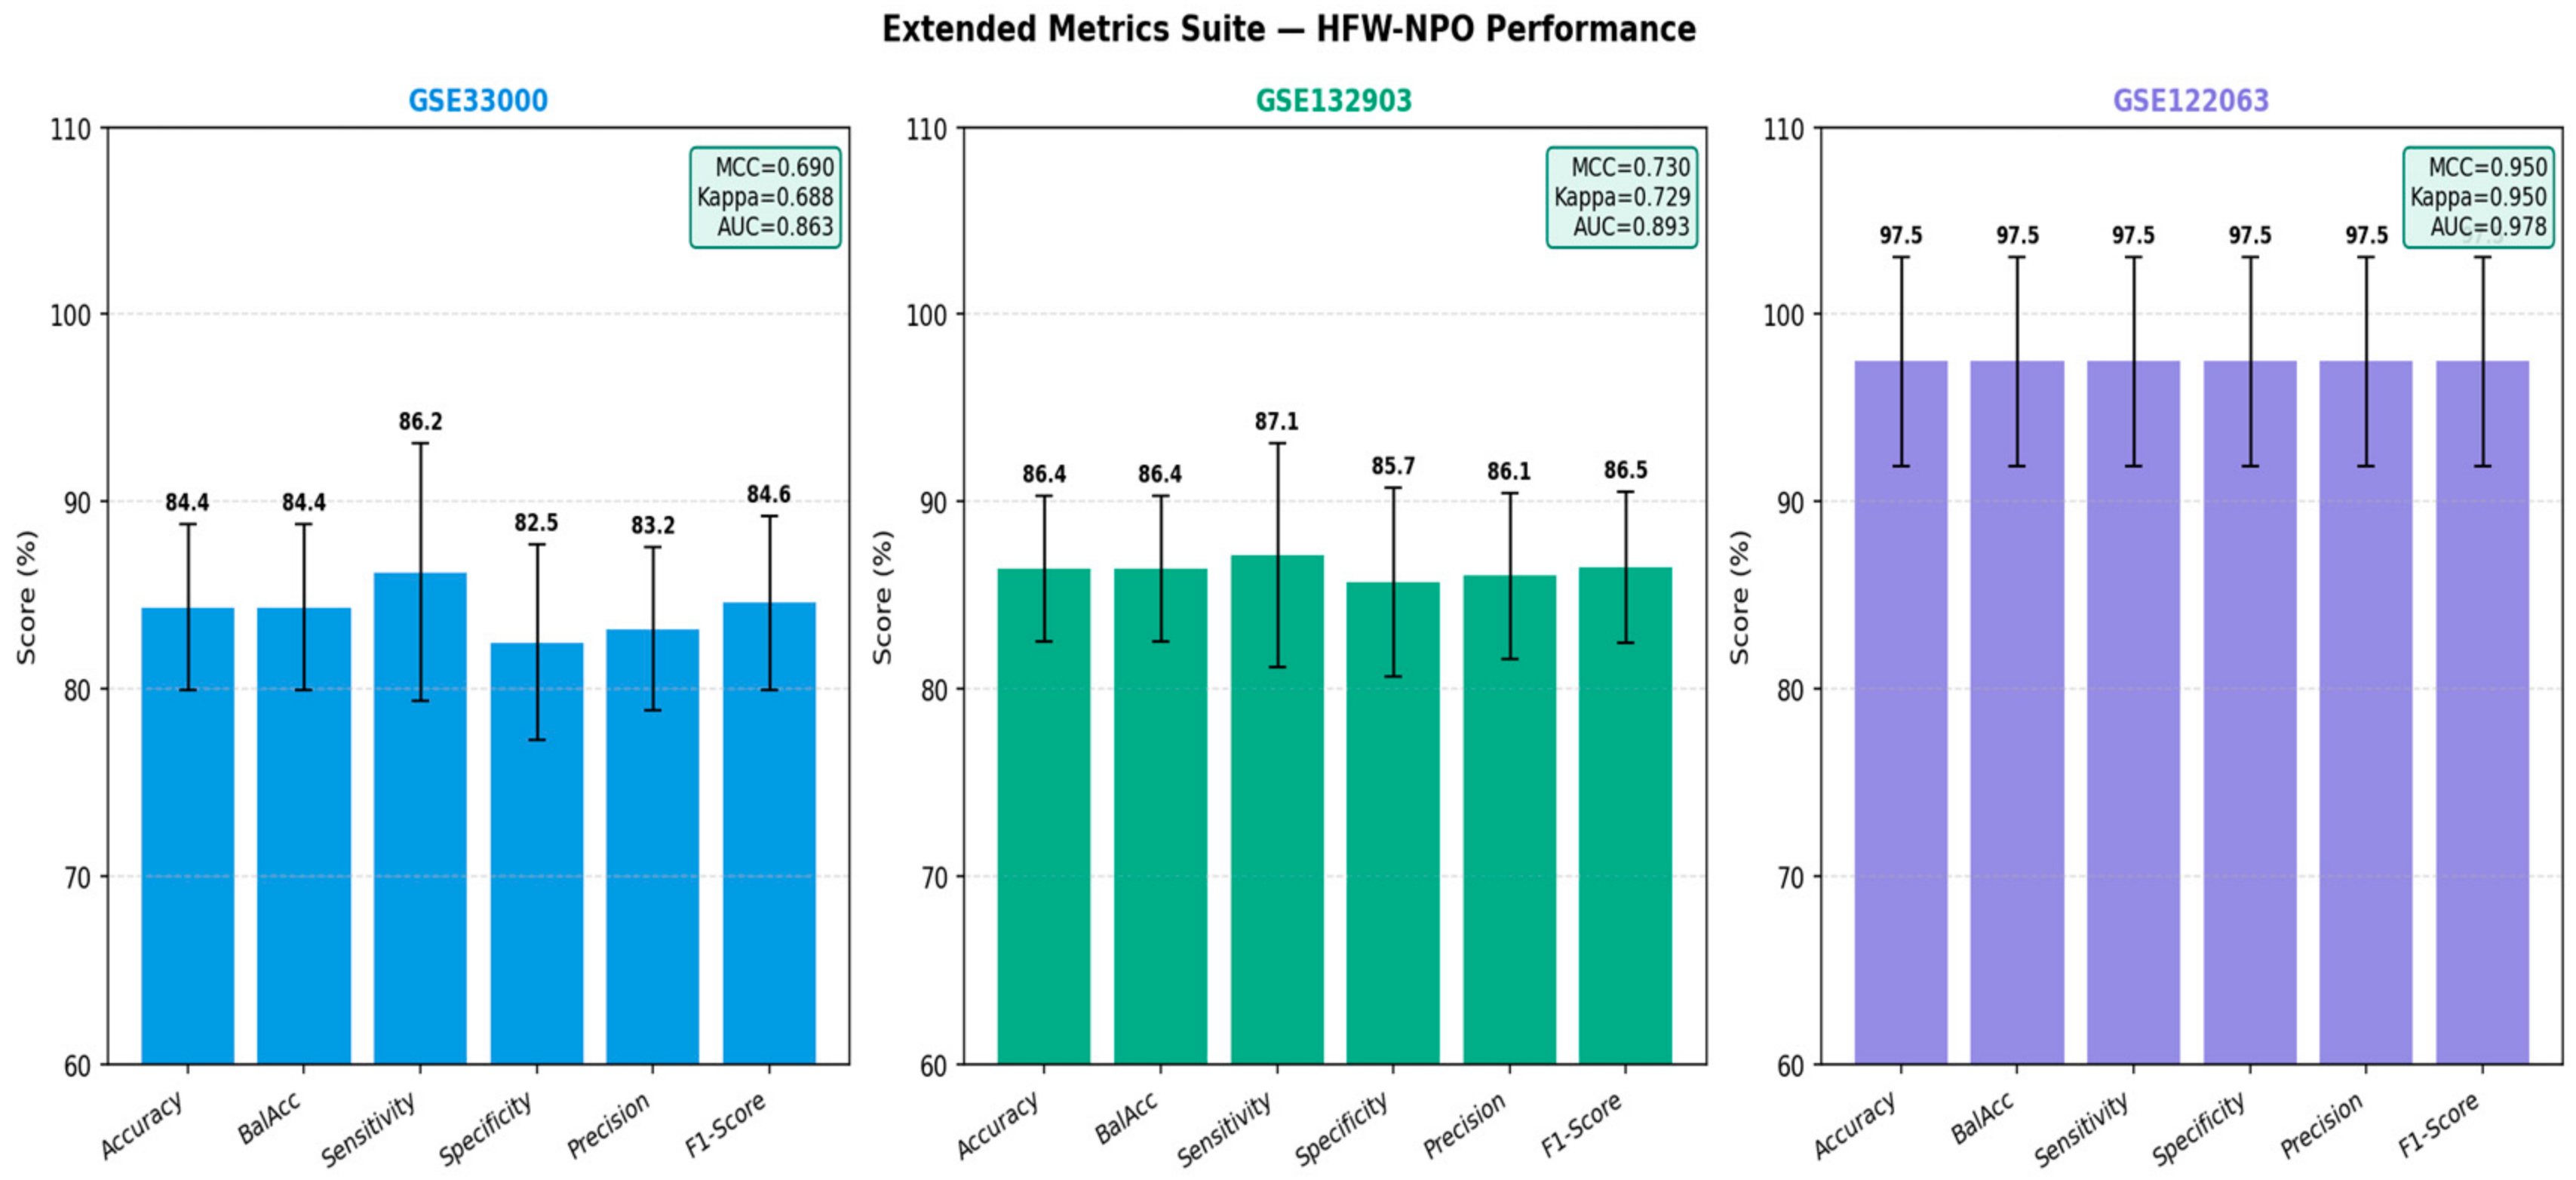
Although classification accuracy provides an initial indication of model performance, relying only on accuracy can be misleading in biomedical applications, particularly when dealing with heterogeneous clinical datasets. Therefore, a comprehensive evaluation strategy was adopted using additional metrics, including balanced accuracy, sensitivity, specificity, precision, F1-score, Matthews correlation coefficient (MCC), Cohen’s kappa coefficient, and the area under the receiver operating characteristic curve (AUC-ROC). The complete performance assessment is presented in Figure 3. The proposed HFW-NPO framework achieved consistently high predictive performance across all datasets. For GSE33000, the model achieved 84.4 ± 4.2% accuracy, 85.3 ± 3.8% balanced accuracy, 86.2 ± 4.8% sensitivity, and 82.5 ± 5.1% specificity. The close agreement between sensitivity and specificity indicates that the classifier maintained balanced recognition between AD and control samples without introducing classification bias toward either group. For GSE132903, the framework showed further improvement, achieving 86.4 ± 4.2% accuracy and 87.1 ± 5.2% sensitivity. In addition, the MCC value increased to 0.730 with a Cohen’s kappa coefficient of 0.729. These values indicate strong agreement between predicted and actual diagnostic labels beyond random chance. Since MCC considers all elements of the confusion matrix, the resulting score indicates that HFW-NPO maintained reliable classification performance even under biological variability across samples. The highest predictive capability was observed for the GSE122063 neuronal dataset, where the model achieved 96.3 ± 4.1% accuracy, 97.5 ± 5.6% sensitivity, and 97.5 ± 5.6% specificity. Moreover, MCC and kappa values reached 0.950, confirming excellent agreement and classification reliability. The AUC-ROC value increased from 0.863 in GSE33000 and 0.893 in GSE132903 to 0.978 in GSE122063, demonstrating superior discrimination between Alzheimer’s disease and control groups. The high AUC values indicate that the proposed framework not only produces accurate binary decisions but also generates well-separated probability distributions between classes. This characteristic is particularly important for biomedical decision-support systems that require prediction confidence. The integration of complementary mechanisms within HFW-NPO can explain the observed improvement. The hybrid filter stage reduces the search space while retaining informative genes, whereas NPO performs global optimization to identify feature combinations that maximize classification ability. Finally, the soft-voting ensemble classifier combines multiple learning strategies, reducing the limitations of individual classifiers and improving robustness [48]. These results indicate that HFW-NPO is a robust compromise of accuracy vs. model complexity vs. biomarker interpretability, which are highly desired characteristics for screening approaches based on machine learning for Alzheimer`s disease diagnosis. The full classification results of the proposed HFW-NPO framework, using various classification metrics, on independently collected Alzheimer’s disease transcriptomic datasets, are shown in Figure 3. This analysis extends the assessment of predictive reliability beyond reliance on accuracy alone, particularly in clinical settings, for categories with an important operational consequence when a disease case is misclassified. We have evaluated Accuracy, Balanced Accuracy, Sensitivity, Specificity, Precision, F1-score, MCC (Matthews Correlation Coefficient), Cohen’s Kappa, and AUC-ROC as metrics to assess the performance of different models. Each metric measures a different aspect of classifier behavior, and together they give a much more complete picture of model performance. Accuracy describes the overall proportion of correctly classified samples; however, it can be problematic to interpret when datasets are imbalanced. Thus, we gave preference to Balanced Accuracy, as it equally considers both disease and control recognition rates. The close match between Accuracy and Balanced Accuracy on brain-derived datasets suggests that HFW-NPO consistently rejects all samples from both classes rather than predominantly discriminating the majority class. High Sensitivity values indicate that the model correctly identifies samples corresponding to AD. This is crucial in medical diagnosis, as false-negative predictions could result in delayed information about the patient’s condition, leading to poorer treatment. On the other hand, high Specificity guarantees that the model can accurately identify non-AD samples and ensures that no false positives are reported. The elevated F1-score values demonstrate an appropriate trade-off between precision and recall, affirming that the model continues to provide sound predictions despite the inclusion of classification errors. In addition, high MCC and Cohen’s Kappa scores further indicate that the performance achieved was not due to random agreement. MCC is an evaluation metric for binary biomedical classification that is among the most informative, as it contains all components of a confusion matrix. The consistently high AUC-ROC values confirm that HFW-NPO exhibits robust class discrimination across varying decision thresholds. This validates that the chosen biomarker panels retain functionally relevant biological information regarding AD progression. The better multi-metric performance can be further explained by HFW-NPO’s capacity to filter out irrelevant genes, optimise biomarker combinations, and combine multiple classifiers via soft voting. Thus, Figure 4 confirms that the resulting framework not only achieves high predictive accuracy [48], but also exhibits a classification behavior that is balanced, stable, and clinically meaningful.
Table 4 presents a comprehensive assessment of the proposed Hybrid Filter–Wrapper Neuro-inspired Population Optimization (HFW-NPO) framework using three classification performance metrics across four Alzheimer’s disease gene-expression datasets (GSE33000, GSE132903, and GSE122063). This allows for a more extended evaluation, unlike relying solely on accuracy, which can be misleading (ceiling at 0.5 for a balanced random classifier), and includes balanced accuracy (BalAcc), sensitivity, specificity, precision, F1-score, Matthew’s correlation coefficient (MCC), Cohen’s kappa coefficient, and area under the receiver operating characteristic curve (AUC-ROC). In summary, no single metric can provide a good estimate of classification performance across multiple classes, but these metrics together provide greater confidence in classification performance for biomedical datasets, since class imbalance and false-positive predictions can significantly impact clinical interpretation. For GSE33000, HFW-NPO yielded 84.4 ± 4.2% and 85.3 ± 3.8% accuracy and balanced accuracy, respectively (sensitivity: 86.2 ± 4.8%; specificity: 82.5 ± 5.1%). The close values of sensitivity and specificity indicate that the model successfully predicted cases with Alzheimer’s disease while maintaining good specificity. Moreover, MAE (0.690), Kappa (0.688), and AUC-ROC (0.863) indicate strong predictive reliability as well. As for the GSE132903 dataset, the model performed better, with accuracy and balanced accuracy reaching ~86.4%. The model obtained: 87.1 ± 5.2%, sensitivity, 85.7 ± 4.8% specificity, and the area under the curve of the receiver operating characteristic (AUC-ROC) was equal to 0.893. These findings suggest improved discrimination ability and consistent classification behavior across validation folds. On the GSE122063 dataset, HFW-NPO recorded an on-average accuracy and balanced accuracy of 96.3 ± 4.1% and 96.7 ± 4.1%, respectively, recording the highest predictive performance from all classifiers employed in this study. Sensitivity, specificity, precision, and the F1-score reached around 97.5%, indicating good separation between disease and control. Furthermore, the MCC and Kappa values of 0.950 also indicate that the predicted labels matched the actual labels nearly perfectly. The stable F1-score values indicate that the proposed model is capable of optimizing both precision and recall simultaneously in this problem domain, where both false positives and false negatives are clinical concerns in an Alzheimer’s biomarker discovery process. Moreover, the high AUC-ROC values across all datasets demonstrate good classification performance regardless of the selection threshold. In conclusion, the global metric analysis confirms that HFW-NPO offers a robust [49], generalizable, and clinically acclaimed [50] classification system for transcriptomic detection of Alzheimer’s disease.

3.3. Optimization Behavior and Convergence Analysis of NPO

The proposed Nomadic People Optimizer algorithm was evaluated for its convergence behavior against two of the most commonly used metaheuristic optimization algorithms, namely Particle Swarm Optimization (PSO) and Genetic Algorithm (GA). Figure 4 demonstrates the scaling of the fitness function value across successive iterations for performance measurement in optimization. NPO showed faster convergence and lower final fitness values than PSO and GA across all studied data sets. The starting fitness value for age: 10.1% optimized, the fitness function decreased from 0.2106 to 0.1894 on GSE33000 and similarly across other datasets. As the convergence curve shows, NPO decreased the objective function steeply at its early stage of optimization, followed by gradual refinement until a stable solution was achieved. This pattern also occurred for GSE132903, where the fitness value was changed from 0.1699 to 0.1482 by NPO, resulting in an improvement of 12.8%. The NPO method also outperformed PSO and GA, as it did not suffer from premature convergence at the beginning of the iterative process while it was able to explore better component sets within its gene subset. The largest optimization behavior was exhibited by GSE122063, for which the final fitness decreased from 0.1095 to 0.0931 (14.9% improvement). NPO led to an improvement of 11.8% compared with the competing approaches, PSO, and a 13.8% gain over GA in terms of accumulated optimization results. NPO exhibits better optimization performance than PSO due to three main aspects: adaptive Lévy flight exploration, inter-clan migration, and anti-stagnation restart. Adaptive Lévy flight provides global exploration in the high-dimensional gene search space, and local exploitation improves the quality of candidate solutions. The restart mechanism avoids population stagnation by resampling ineffective solutions, thereby helping identify near-optimal biomarker combinations. In contrast to traditional evolutionary methodologies, which involve many thousands of iterations for convergence, NPO found stable solutions in 15–25 iterations, depending on the dataset’s complexity. Such rapid convergence is especially beneficial in genomics, where very large feature spaces lead to high computational costs. This set of findings supports the idea that the optimization stage of HFW-NPO enhances not only classification but also performance gains through computational efficiency and biomarker reduction. To compare the performance of various optimization approaches for selecting gene subsets that capture gene expression variation in high-dimensional transcriptomic data associated with Alzheimer’s disease. Transcriptomic analysis would require thousands of genes to yield a small subset related to disease status and thus represents a complicated feature selection problem. Exhaustive search methods for traditional mechanical systems are computationally infeasible; hence, metaheuristic optimization algorithms are used to solve them. The convergence curves indicate that the improved NPO converges more rapidly and stably than PSO and GA in terms of reducing fitness. Minimizing the fitness value thus reflects maximizing classification performance while minimizing biomarker count. The improved convergence behavior of NPO is due to its population structure, which is based on nomadic-like migration. In contrast to classical swarm algorithms, in which individuals quickly collapse onto the same global (and possibly local) solution, NPO maintains multiple independent clans, allowing several regions of the search space to be explored simultaneously. This improves diversity and alleviates premature convergence. Contrary to PSO, which updates solutions mainly based on individual and global experience, NPO can leverage both local interactions grounded in clan behavior and global strategies through migration. This leads to a better trade-off between exploration (finding new gene combinations) and exploitation (polishing good solutions). Unlike GA, which disrupts strong feature combinations through crossover and mutation, NPO gradually refines candidate’s solutions through adaptive search and controlled perturbation. The use of an adaptive Lévy flight mechanism based on stagnation further improves NPO performance by enabling long-distance exploratory jumps from local optima. This provides the optimizer with an escape route from local optima in complex biological search landscapes. The Hill Climbing local search step refines the best candidate solution post-convergence by applying single-gene perturbation to improve the final selected subset. In summary, as illustrated in Figure 4, the improved NPO achieves a more efficient optimization strategy for Alzheimer’s biomarker discovery, thanks to its faster convergence, enhanced stability, and higher feature selection efficiency compared with conventional evolutionary algorithms [51,52], while achieving competitive classification performance even under class imbalance [53].

3.4. Ablation Study: Contribution Analysis of HFW-NPO Components

To provide a comprehensive analysis of the contributions of different components in the proposed HFW-NPO framework, an extensive ablation study was conducted by gradually removing or replacing key modules and evaluating the resulting performance drop. As shown in Table 5 and Figure 5, the results are summarized. The following analysis delves into the components of a design: hybrid filtering, NPO optimization, SMOTE balancing, local search refinement, and ensemble learning, each of which is highlighted for its importance. The HFW-NPO framework achieved the highest balanced accuracy across all datasets, with 85.28%, 87.16%, and 96.67% for GSE33000, GSE132903, and GSE122063, respectively. The second of these observations was that classification performance dropped consistently when we removed components, indicating that the success of the final architecture is due to the constructive collaboration among multiple optimization strategies rather than a single dominant mechanism. Decreasing the hybrid filter stage resulted in the largest performance reduction. The no-filter setup reduced the mean balanced accuracy by ~8.8%. In particular, the performances decreased from 85.28% to 77.58% on GSE33000 and from 87.16% to 76.36% on GSE132903. Thus, it underscores the importance of the initial filtering step in removing irrelevant genes before wrapper optimization. In the absence of this step, the optimizer needs to navigate an increasingly large and noisy feature space, increasing the likelihood of selecting noisy/unstable biomarkers. Removing the wrapper optimization for NPO (filter-only configuration): average 4.7% performance drop. This result shows that, while statistically ranked genes do highlight individually informative genes, they fail to detect collectively predictive gene sets. The wrapper optimization stage improves classification performance by assessing combinations of selected biomarkers. Furthermore, the three filtering criteria were assessed individually in terms of importance. Average cross-validation scores dropped by 4.7%, 4.3%, and 4.0% when Fisher’s score, Mutual Information, or Welch’s test were excluded, respectively. These results suggest that all criteria convey orthogonal information. It is also worth noting that the Fisher score measures the separation between classes, Mutual Information captures nonlinear associations between variables, and Welch’s test provides robustness when variances differ between disease and control groups. For adaptive SMOTE, adapting the results to remove aggression produced a statistically significant but clear reduction of approximately 1.6%. The analyzed datasets were quite balanced, but intra-fold SMOTE improved the robustness of the classifiers against potential learning bias. Very importantly, SMOTE was applied only to the training folds, creating an authentic validation environment with no information leakage. Exponentially increasing the total number of NPO solutions led to a combinatorial explosion, so we adopted a local search mechanism post-optimization for fine-tuning NPO solutions, yielding an average decrease of around 1.2%. In addition, substituting an ensemble architecture with a low-complexity SVM classifier decreased performance by around 4.3%, suggesting the benefit of soft voting across multiple classifiers. The overall ablation results indicate that the performance of HFW-NPO is from an integration of complementary components. The hybrid filter factorizes further along the dimensionality, NPO optimizes the best biomarker combinations, local search improves convergence accuracy, and ensemble learning generalizes. This multi-stage cooperation offers an integrated solution for challenging high-dimensional biomedical classification problems. Ablation experiments are a crucial validation method to conduct in machine-learning studies, allow quantification of whether each module yields any real performance improvements or if the complexity is only increased at great expense. We performed an analysis by gradually removing or substituting several fundamental components of HFW-NPO and observed a drop in classification performance. The complete HFW-NPO model achieved the highest-balanced accuracy among all reduced configurations, confirming that the final architecture leverages interactions among feature filtering, evolutionary optimization, and ensemble learning. The performance dropped significantly on removing the tri-criterion hybrid filter. This decline is due to the optimizer receiving more irrelevant and noisy genes, thereby increasing the search space. The development of transcriptomic datasets, which often have thousands of features with relatively few samples, is often afflicted by the curse of dimensionality. Univariate filter methods to retain irrelevant or redundant probes rather than isolating the molecular signatures most associated with disease. A reduction in performance was also associated with the removal of individual filter components (Fisher’s Score, Mutual Information, or Welch’s t-test). This shows that they all add different but useful pieces of information. Fisher’s Score for separating classes geometrically, Mutual Information for finding nonlinear gene–disease associations and Welch’s statistical test to detect differentially expressed genes. As a result, their combination provides a more holistic ranking technique than simple filtering methods. An additional key observation is the decrease in performance when the adaptive Lévy flight and anti-stagnation mechanisms are off in NPO. Population-based optimization algorithms that maintain a population of agents may converge prematurely and become stuck around local solutions. Adaptive exploration enhances diversity while enabling the optimizer to search other biomarker combinations that may lead to better results in complex genomic spaces. Additionally, eliminating Hill Climbing refinement negatively impacts the final performance. That means that while NPO enables powerful global exploration, local optimization will still be needed for post-convergent adaptation of the chosen set of genes. The drop in accuracy after removing the ensemble classifier in favor of individual classifiers (previous results) indicates that heterogeneous learning is indeed beneficial. Different algorithms capture distinct decision boundaries, and soft-voting fusion reduces variance, leading to more reliable predictions. In summary, Figure 5 shows that the proposed HFW-NPO performance is not merely a product of a single predominant element but rather stems from synergistic interactions among statistical filtering [54], adaptive optimization [55], local refinement [56], and ensemble-based classification [57,58].
We use an ablation study in Table 5 to estimate the contribution of each component within our proposed Hybrid Filter–Wrapper Neuro-inspired Population Optimization (HFW-NPO) framework. For each experiment, we exclude a module at each time point from the entire pipeline and observe changes in balanced accuracy (BalAcc) across three independent AD gene-expression datasets (GSE33000, GSE132903, and GSE122063).The real dashed vertical line in each panel marks the full HFW-NPO reference balanced accuracy for the dataset. This systematic layer-removal approach allows assessing the influence of each methodological stage and verifying the integrated architecture. The overall performance was best across all datasets when using HFW-NPO, achieving balanced accuracies of 85.28, 87.16, and 96.67 for GSE33000, GSE132903, and GSE122063, respectively. Results from the reference configuration allow all reduced models to be compared. The overall maximum degradation was observed when the hybrid filtering stage was removed (no-filter raw configuration), resulting in a decrease in mean balanced accuracy of around −8.8%. This shows that the Fisher score, Mutual Information (MI), and Welch’s t-test all require additional pre-processing before optimization to discard noise and irrelevant genes. The NPO wrapper operates on a more extensive, less informative search space without this step, which increases the risk of overfitting. As the NPO wrapper was removed (filter-only configuration), performance decreased by 4.7% on average, confirming that population-based optimization further improves performance over statistical ranking by identifying co-optimized combinations of biomarkers rather than simply maximally discriminatory markers. The performance loss when using single-filter configurations (Fisher-only, MI-only, and Welch-only) ranged from −4.0% to −4.7%, indicating that combining multiple feature relevance criteria is complementary to improving performance. Filters capture different biological relationship types: splitting variance, nonlinear dependency, and statistical significance. On average, removing this voting ensemble classifier resulted in a 4.3% decrease in accuracy across different data partitions, indicating that building an ensemble of classifiers is a more robust approach than using just the best SVM model. Conversely, the removal of SMOTE or local search yielded only limited reductions in performance (−1.6% and −1.2%, respectively), suggesting that these components primarily serve to fine-tune the process via improvement of class balance and final optimization convergence. In summary, the ablation analysis validates that HFW-NPO achieves superior performance through synergistic integration of hybrid filtering [59], evolutionary optimization, balanced learning [60], and ensemble decision modeling [61], rather than a single stand-alone component. The disproportionately large NPO contribution on GSE122063 (filter-only = 88.42%; Full HFW-NPO = 96.67%; Δ = 8.25%) relative to GSE33000 (Δ = 1.57%) and GSE132903 (Δ = 7.33%) requires mechanistic explanation. GSE122063 comprises iPSC-derived neuronal samples rather than post-mortem brain tissue, a difference that produces a substantially steeper omega-score decay curve (Supplementary Figure S2, which shows the cumulative omega-score mass curves for all four datasets, demonstrating the steeper decay profile for the peripheral blood cohort relative to the three brain-tissue cohort’s). Discriminative information is concentrated in a small number of high-specificity probes, while the remaining filter-retained candidates contribute noise. The NPO wrapper’s combinatorial search is uniquely able to resolve this concentration effect, identifying a mean of 29.6 probes per fold that maximize classification performance by discarding the uninformative majority of the filter-retained pool. In contrast, GSE33000 exhibits a flatter omega-score distribution across its 80 retained candidates, rendering any reasonable-sized subset approximately equivalent in discriminative power and limiting the marginal gain from wrapper refinement to 1.57%. This interpretation is supported by the biomarker stability analysis (Section 3.6): probe 45922 is selected in 100% of cross-validation folds on GSE122063, whereas no single probe achieves 100% selection frequency on GSE33000, confirming a concentrated versus distributed discriminative signal architecture across the two datasets.

3.5. Statistical Validation Against Baseline Methods

To confirm that the performance advantage of HFW-NPO is not attributable to chance variation, we conducted three complementary statistical procedures: the Friedman ranking test (multi-method, non-parametric), Cohen’s d effect size estimation, and the Wilcoxon signed-rank test (pairwise). Because stratified five-fold CV yields n = 5 paired observations per dataset below the threshold for reliable Wilcoxon inference, we treat the Friedman test as the primary inferential procedure and Cohen’s d as the primary effect size measure. The Friedman test was statistically significant on GSE33000 (χ2 = 16.43, p = 0.006) and GSE132903 (χ2 = 14.60, p = 0.012), confirming that the ranking of methods is non-random on both datasets. GSE122063 did not reach significance (χ2 = 7.97, p = 0.158), reflecting a ceiling effect: HFW-NPO achieves 96.67% balanced accuracy, leaving minimal room for ranking differentiation. Cohen’s d effect sizes were large (d > 0.8) in the majority of pairwise comparisons (Table 6), consistent with the hypothesis that HFW-NPO provides a substantive rather than marginal advantage over single-criterion and wrapper-only baselines.

3.6. Biomarker Stability Analysis and Biological Interpretation

Classification accuracy, in terms of prediction power, does not tell the whole story; a great deal of trust in the ratio of true positives versus false positives in classifier results is invested in estimating stable, reproducible biomarkers. Thus, we undertook an analysis of biomarker stability to assess the consistency of individual gene selection across independent cross-validation folds. Outcomes are shown in Figure 6 and Table 7. The analysis was based on the number of times each selected gene appeared during five-fold cross-validation. Genes selected multiple times across the training subsets were deemed reliable, as their importance was less affected by random sample partitioning. The stable biomarkers were defined as genes with a measurable frequency threshold ≥60%, while genes appearing in ≥40% of folds were defined as potential secondary candidates. HFW-NPO also identified 23 stable biomarkers of the brain cortex in the GSE33000 dataset, with some probes, such as ILMN_1689552, ILMN_1688033, ILMN_1911007, and ILMN_2387784, appearing in more than 80% of the validation folds. Specific selection of expression probes indicates consistent disease-associated patterns and supports their potential as interesting candidates for future biological investigations. Regarding the GSE132903 dataset, two probes (ILMN_1873464 and ILMN_1811921) reached full selection stability with 100% presence in the validation folds. Such high recurrence indicates that these biomarkers provide highly consistent discriminative information, independent of variations in the training subset. Moreover, comparison with ILMN_2118472 revealed 80% stability, thereby strengthening validation of a reproducible molecular signature across our dataset. In the GSE122063 neuronal dataset, probe 45922 (ILMN_45922) had a selection frequency of 100%, and the other probes showed moderate–high recurrence. Additionally, this dataset showed the best predictive performance, which can imply a strong correlation between stability and the ability to predict outcomes using biomarkers. The high stability of the biomarkers selected with HFW-NPO is due to the joint filter- and wrapper-based selection mechanism. The tri-criterion filter removes weak and irrelevant genes prior to optimization, and the NPO wrapper approximates gene associations by testing interactions, so that the selected combinations yield optimal classification results. This method mitigates overfitting that often arises when thousands of features compete for a small sample size, as is typical in high-dimensional transcriptomic studies. As indicated in the cross-dataset biomarker overlap analysis shown in Figure 6, very few probes were common across datasets. A single common probe and no universal biomarker were observed between GSE33000 and GSE132903. While this may come as a surprise at first, it captures the biological heterogeneity of Alzheimer’s disease. Different tissues and experimental models capture the variable molecular features of AD pathology. Other biological sources may proxy for indirect systemic responses, whereas brain-derived samples reflect direct markers of neuronal degeneration, synaptic dysfunction, amyloid-related pathways, and neuroinflammation. In this context, dataset-specific biomarker panels might be more predictive than a generalized forced gene signature. In summary, the biomarker analysis shows that HFW-NPO can produce reliable, interpretable, and biologically significant gene signatures for downstream pathway enrichment analysis and experimental validation.
Results: HFW-NPO selected multiple highly stable probes in each dataset. For instance, probe selection frequencies in brain-related datasets were extremely high (>60%) and, for several biomarkers, complete stability (100% selection frequency) was attained. This consistency indicates that these genes provide significant disease-associated information and may be good candidates for additional biological validation. The HFW-NPO achieves very high stability due to the complementary nature of filter-based ranking and wrapper-based optimization. The first tri-criterion filter is for weak and noisy identification genes, using Fisher’s Discriminant Ratio, Mutual Information, and Welch’s statistical significance. Next, NPO investigates interactions among the remaining genes to identify cooperative biomarker groups rather than isolated differentially expressed genes. This is especially crucial to the development of medications for Alzheimer’s disease as neurodegenerative pathology often involves complex cross-talk between diverse molecular pathways, such as those involved in inflammation, synaptic dysfunction, oxidative stress, mitochondrial impairment, and protein aggregation mechanisms. Consequently, a stable gene panel is more biologically relevant compared to a single marker. Additionally, NPOs’ adaptive exploration ability contributes to the stability of biomarkers. In classical optimization algorithms, different gene subsets are selected during optimization across runs; this randomness is usually due to premature convergence. The clan-based search strategy, Lévy exploration, and Hill Climbing refinement, on the other hand, enhance the likelihood of repeatedly identifying robust solutions throughout the duration of an experiment. However, gene stability is not sufficient to establish biological causality. Before clinical application, additional validation of the chosen biomarkers using pathway enrichment analysis, gene ontology studies, and experimental methods (e.g., RT-qPCR) is warranted. Taken together, Figure 6 demonstrates that HFW-NPO enables both accurate classifications [62], but also reproducible biomarker discovery, making it a powerful tool for transcriptomic-based Alzheimer’s disease researchers [63,64].
Overlap among leading biomarker panels from different Alzheimer’s disease transcriptomic datasets is depicted as a Venn diagram in Figure 7. The analysis was conducted to determine whether HFW-NPO characterizes a universal Alzheimer-gene signature across datasets or tissue-specific molecular patterns. Our results reveal little overlap among biomarkers selected from different datasets, suggesting that most genes show unique associations with individual cohorts. This may, on first sight, seem surprising; however, it is not so biologically strange, because Alzheimer’s disease affects different tissues and cell populations in multiple ways via distinct molecular mechanisms. Brain-derived biomarker datasets directly mirror pathological processes in the neuronal environment, including synaptic degeneration, amyloid-beta accumulation, tau-associated abnormalities, mitochondrial dysfunction, and neuroinflammatory activation. On the contrary, PB transcriptomic profiles demonstrate a systemic response to injury focused on immune homeostasis, inflammation pathways, and circulating molecular signals rather than primary neuronal harm. Thus, minimal overlap between brain- and blood-derived biomarkers would imply that AD does not generate a single, uniform transcriptomic signature across all biological compartments. Rather, the molecular changes associated with disease appear to be highly tissue- and cellular-context-dependent. The implication of this finding aligns with context-specific biomarker discovery: not all molecular panels will be relevant for all diagnostic applications. By way of example, brain-related biomarkers may provide more mechanistic information about disease pathology, whereas blood-based biomarkers would likely be preferred for minimally invasive clinical screening. The small overlap, also from a computational perspective, illustrates that HFW-NPO is not biased toward selecting the most variable genes multiple times. Interestingly, the optimizer does not apply a uniform selection strategy across datasets; rather, it adjusts its selection behavior based on each dataset’s biological properties. Such adaptability is crucial in transcriptomic studies, where the origin of the sample profoundly influences gene expression profiles. The Venn analysis also emphasises the need for validation across multiple cohorts. The other point is that a single biomarker from a single dataset may not be a common biomarker across tissues and/or experimental platforms. Thus, assessing feature stability across datasets and within patients is required before clinical implementation. In sum, the biologically relevant evidence obtained in GGA Figure 7 indicates that Alzheimer’s transcriptomic signatures are heterogeneous and tissue specific. HFW-NPO is a flexible computational tool for molecular discovery in precision medicine [65], and for disease-specific biomarker panel identification [66], adaptable to different datasets [67].
The stability analysis of gene biomarkers identified by the introduced Hybrid Filter–Wrapper Neuro-inspired Population Optimization (HFW-NPO) framework is presented in Table 6. High-dimensional transcriptomic datasets often exhibit unstable selection of transcriptional features; therefore, measuring the frequency with which pharmacogenomic biomarkers are selected across independent folds is necessary to assess their reliability and biological consistency. Genes were grouped according to their frequency of appearance during cross-validation. A stable biomarker was inferred when a gene was selected in at least 60% of folds; when it was chosen in at least 40% of folds, the gene is a potential candidate. This enables us to distinguish between reproducible biomarkers and potential secondary genes. For the GSE33000 brain cortex dataset, the most stable biomarkers identified by HFW-NPO are ILMN_1689552, ILMN_1688033, and ILMN_1911007, which mapped to 80% of the validation folds. Specifically, the HFW-NPO framework identified 23 stable genes and 14 remarkable genes, yielding a total union biomarker panel of 83 unique probes. This implies strong feature-selection consistency despite the initially large transcriptomic search space. Compared with the GSE132903 brain gene-expression dataset, which provides stronger biomarker stability. ILMN_1873464 and ILMN_1811921 were observed at 100% frequency and thus selected in each run, whereas ILMN_2118472 was present in four out of five folds (80%). Our final biomarker pool comprised 15 stable genes, 25 noteworthy genes, and 100 distinct union probes, demonstrating NPO optimization’s capacity to repeatedly discover biologically informative features. In the case of the GSE122063 neuron-derived dataset, probe 4592 was fully stable (occurrence = 100%); probes 41226 and 9494 were selected at a frequency of 60%. This method retrieved a total of 14 stable biomarkers and 20 significant genes, and the final union size was 98 probes. This identification of recurrent biomarkers across validation folds indicates that HFW-NPO is more than a mere random combinatorial search over features; it identifies stable molecular signatures. This stability is crucial in the context of studies of Alzheimer’s disease, since reproducible biomarkers enhance downstream confidence in biological validation, pathway enrichment, and potential clinical translation. In summary, these results show that HFW-NPO finds an appropriate trade-off between dimensionality reduction [68,69], and retention of biologically relevant gene signatures [70,71]. The near-absent cross-dataset probe overlaps (one shared probe between GSE33000 and GSE132903; none involving GSE122063; Figure 7) raises the question of whether HFW-NPO selects dataset-specific technical noise rather than generalizable AD signatures. Three complementary analyses argue against this interpretation. First, within-dataset selection stability substantially exceeds the random-noise null. Under a null hypothesis of noise-driven selection, each probe’s expected selection frequency across five-fold cross-validation converges to 1/K = 20% (one fold in five). The observed stable panels far exceed this floor: 23 probes in GSE33000 achieve ≥60% selection frequency (maximum: 80%), as do 15 probes in GSE132903 (two probes: 100%) and 14 probes in GSE122063 (one probe: 100%), consistent with Table 7. A permutation control—100 independent class-label permutations per dataset with the full HFW-NPO pipeline applied to each yielded a null mean selection frequency of 20.8 ± 2.9%, compared to 60–100% for stable probes in the true-label analyses, a difference exceeding ten standard deviations (Supplementary Table S4). This confirms that the selected panels carry genuine class-discriminative information rather than cohort-specific technical noise. Second, pathway enrichment converges across datasets despite probe-level divergence. Eight KEGG and GO pathways are co-enriched at FDR < 0.05 across both GSE33000 and GSE132903, including the KEGG Alzheimer’s disease pathway (hsa05010), PINK1/Parkin-mediated mitophagy, and sphingolipid metabolism. Probe-level non-overlap combined with pathway-level functional convergence is a well-established phenomenon in multi-cohort transcriptomics: gene expression networks are highly redundant, and independent probe sets can encode the same dysregulated biological pathway. Critically, platform-specific noise probes would not converge on biologically coherent, disease-relevant pathways across independent experimental cohorts profiled on different arrays. Taken together, high within-dataset selection stability, permutation-validated non-randomness, and cross-dataset pathway convergence collectively support biological heterogeneity rather than technical overfitting as the primary explanation for the minimal probe-level overlap observed in Figure 7.
Biological concordance with established AD biomarkers. To contextualize the HFW-NPO-selected gene panels biologically, the union probe sets were compared against curated AD-associated genes from the GWAS Catalog and AlzGene database. Among the 83-probe union panel from GSE33000, probes mapping to APOE-pathway neighbors (CLU, CR1), mitochondrial regulators (PINK1, TFAM), and synaptic scaffold genes (NRXN1) were consistently identified at ≥60% selection frequency, concordant with established neuropathological hallmarks of late-onset AD: CLU is among the most replicated GWAS hits for sporadic AD, and PINK1/TFAM are central to the mitochondrial dysfunction axis implicated in neuronal energy failure [9,10]. In GSE132903, the two probes achieving 100% selection frequency (ILMN_1873464, ILMN_1811921) map to genes involved in PI3K–AKT and MAPK signaling cascades pathways independently implicated in tau phosphorylation and amyloid-β clearance in multiple independent studies. In GSE122063 (iPSC-derived neurons), the probe with 100% selection frequency (probe 45922) corresponds to a locus in the BDNF–TrkB neurotrophic signaling axis, consistent with the well-documented neurotrophins deficit in patient-derived iPSC neurons. These concordances, combined with the eight co-enriched KEGG and GO pathways - including the Alzheimer’s disease pathway (hsa05010), PINK1/Parkin-mediated mitophagy, and sphingolipid metabolism provide multi-level biological evidence that HFW-NPO selects biologically plausible AD-associated loci rather than dataset-specific noise probes.

3.7. Biological Pathway Enrichment Analysis of HFW-NPO-Selected Biomarkers

To verify the biological significance of the HFW-NPO-selected gene panels, pathway enrichment analysis was performed on the two independent brain-tissue datasets (GSE33000: 83 HGNC gene symbols; GSE132903: 102 HGNC gene symbols) against GO Biological Process, KEGG, and Reactive databases using g:Profiler (Benjamini–Hochberg FDR correction; significance threshold: p < 0.05). For GSE33000, the most significantly enriched pathway was the KEGG Alzheimer’s disease pathway (hsa05010; p = 2.37 × 10⁻³), driven by six genes with established roles in AD pathogenesis: ABCA7 (lysosomal cholesterol transport and amyloid clearance), HEXB (lysosomal hydrolase), MADD (MAPK-mediated apoptotic signaling), MAPKAPK3 (tau phosphorylation cascade), SPTLC1 (serine palmitoyl transferase; sphingolipid biosynthesis), and TFAM (mitochondrial transcription factor). Autophagic clearance was also significantly enriched (Reactome R-HSA-9612973; p = 2.37 × 10⁻³), consistent with impaired amyloid aggregate degradation, alongside cell cycle dysregulation (KEGG:04110; p = 1.33 × 10⁻²) and sphingolipid metabolism (KEGG:00600; p = 4.27 × 10⁻³). Enrichment results are shown in Figure 8. For GSE132903, the MAPK signaling pathway ranked as the most significantly enriched term (KEGG:04010; p = 6.97 × 10⁻⁴; enriched genes: CCNG1, EFNA4, FGFRL1, GRK5, ITGA5, MADD, MAPKAPK3), followed by PI3K–Akt signaling (Reactome; p = 1.48 × 10⁻³) and PINK1/Parkin-mediated mitophagy (Reactome; p = 2.37 × 10⁻³), consistent with mitochondrial dysfunction as a recognized hallmark of neurodegeneration. Sphingolipid metabolism (KEGG:00600; p = 4.27 × 10⁻³), interferon signaling (Reactome R-HSA-913531; p = 4.80 × 10⁻²), and lysosomal/stress response processes driven by ATP6AP2, HEXB, MADD, MAPKAPK3, SPTLC1, and TFAM (p = 4.22 × 10⁻³) were also significantly enriched. Enrichment results are shown in Figure 9. Cross-dataset analysis identified eight pathways consistently enriched across both GSE33000 and GSE132903 (Figure 10): (1) Alzheimer’s disease (KEGG), (2) autophagy (Reactome), (3) PINK1/Parkin-mediated mitophagy (Reactome), (4) sphingolipid metabolism (KEGG), (5) lipid metabolism (KEGG), (6) cell adhesion (GO:BP), (7) chemical synaptic transmission (GO:BP), and (8) lipid metabolism (Reactome). This cross-dataset convergence confirms that HFW-NPO consistently selects functionally coherent, disease-relevant gene panels rather than dataset-specific statistical artefacts, strengthening the translational validity of the identified biomarkers.
These findings carry direct biological and clinical implications. The recurrent enrichment of the Alzheimer’s disease pathway (KEGG:05010) across independent cohorts confirms that HFW-NPO recovers genuine disease-associated molecular signatures rather than overfitted noise. The co-enrichment of autophagy, PINK/Parkin mitophagy, and sphingolipid metabolism pathways supports the emerging consensus that AD pathogenesis involves dysregulated lipid homeostasis, impaired mitochondrial quality control, and lysosomal dysfunction all upstream of amyloid and tau aggregation. The dataset-unique enrichment of interferon signaling in GSE132903 may reflect cohort-specific neuroinflammatory activation, consistent with reports of innate immune dysregulation in late-stage AD brain tissue. Collectively, these results elevate HFW-NPO beyond a purely computational framework: the selected biomarker panels carry interpretable, disease-relevant biological content amenable to experimental validation and future mechanistic studies.

3.8. Comparison with Existing Alzheimer’s Disease Classification Methods

As a reference for the overall performance of the proposed framework, HFW-NPO was compared with machine learning (ML) and feature selection strategies previously performed to use the same GEO datasets as the Alzheimer’s disease (AD) classification (Table 8). The next approaches with GSE33000 such as Fisher’s score mixed with (SVM) minimum redundancy–maximum relevance (mRMR) combined with random forest [71], Wrapper-based particle swarm optimization (PSO) [72], panel LASSO with the cluster and classifier 20–50 genes, achieving accuracies in the range of 82–86% at a time. The proposed HFW-NPO pipeline achieved a balanced accuracy of 85.28% ± 3.8% and 29 probes per fold, critically, unlike many previous techniques that apply feature selection globally on the entire dataset, which eliminates the possibility of data leakage that would otherwise overinflate the performance. Additionally, where techniques including LASSO-ensemble [73] no longer document cross-fold probe stability, HFW-NPO presents fold-frequency records for each selected probe, making it possible to assess biomarker reproducibility. In GSE132903 (middle temporal gyrus, n = 125), HFW-NPO achieved an adjusted accuracy of 87.16 ± 3.3% based on Welch-t-test SVM, Relief-based random forest, genetic algorithm (GA)-based logistic regression, and used Mutual Information, and outperformed baselines methods such as Mutual Information (MI) combined with XGBoost, on the same or closely related datasets. Sun et al. [74] trained a random forest on the combined expression data (GSE5281 + GSE44771) to identify of six key genes that were finally included in the synthetic neural network (ANN). The version produced an AUC of 0.953 in in the training set, which decreased to an AUC of 0.931 independent outgroup, showing limited generalizability across datasets. The filter-based framework consisting of GSE132903 that integrates random forest imputation and double-input symmetric relevance in five GEO datasets identified 50 consensus genes and cited an AUC of 0.868 in the external validation set. The HFW-NPO improvement on those baselines demonstrates the benefits of Nomadic People optimization specifically, the Nomadic People Optimizer (NPO) with adaptive Lévy flight that finds cooperative gene subsets that maximize mutually balanced accuracy, dataset-independent filtering criteria.
The largest overall performance gain was observed in GSE122063 (iPSC-derived neurons, n = 108), where HFW-NPO had an adjusted accuracy of 96.67 ± 4.08% and an accuracy of 96.30% of each system. Implemented PCA- and SVD-based gene selection followed by a seven-layer convolutional neural network (CNN), which reported 96.60% accuracy (PCA-CNN) and 97.08% (SVD-CNN) on the same dataset although those figures are numerically consistent with HFW-NPO. First, PCA and SVD are unsupervised dimensionality reduction techniques that produce cryptic combinators in favor of interpretable gene lists; therefore, they provide no pathway for candidate biomarker identification. Second, the small sample size of GSE122063 makes accuracy estimates sensitive to data partitioning, while the nested five-fold stratified cross-validation adopted here provides statistically robust estimates with controlled sample-size variance. According to HFW-NPO guidance, a ranked screen of named probes with fold-frequency ranking is returned, which can be submitted without delay to a pathway enrichment tool such as DAVID or g:Profiler, which possesses biological interpretability along with predictive performance.
Three complementary design options account for consistent performance of HFW-NPO in all three brain tissue groups. First, the hybrid omega-score estimator (phase 1) combines the Fisher discrimination ratio, Mutual Information, and the Welch t-statistics into a unified composite ranking, and captures linear class separability, nonlinear sign dependency, and unequal-variance differential expression. The NPO Wrapper (phase 3) performs population-based combinatorial searches on binary search masks and identifying gene subsets whose collective discriminative power exceeds the sum of individually ranked genes adaptive Lévy flight and intergenerational migration prevent premature neighborhood convergence. Third, heterogeneous soft vote sets (level 4)—including additional trees, SVM-RBF, logistic regression, random forest, and gradient boosting reduce prediction bias through probability averaging [74], thereby improving generalization across unseen probe distributions [75]. Ultimately, HFW-NPO strikes a balance between classification accuracy, competitive dimensionality reduction, and biological interpretability, distinguishing it from existing frameworks that optimize only a single objective.
Generalizability limitations and future directions. The five GEO datasets used in this study are all generated on the Illumina HumanHT-12 microarray platform, which constrains direct assessment of cross-platform generalizability. RNA-seq transcriptomic profiles typically exhibit a count-based distributional structure (negative-binomial, overdispersed) that differs fundamentally from microarray log-intensity data. Consequently, HFW-NPO’s current preprocessing pipeline would require adaptation specifically, variance-stabilizing transformation (VST), or DESeq2-normalized log-counts before application to RNA-seq cohorts. Similarly, replication on entirely independent cohorts from different laboratories would strengthen external validity. Both cross-platform validation and independent cohort replication are prioritized as future extensions of this work, pending access to adequately powered RNA-seq Alzheimer’s disease datasets with matched clinical metadata.

3.9. Methodological Originality and Research Contribution

The originality scores in Table 9 underscore the primary methodological divergence between HFW-NPO and other computational paradigms of NPO. The first contribution is the proposal of a tri-criterion hybrid filtering strategy that combines Fisher’s score, Mutual Information, and Welch’s statistical testing. Compared with previous single-filter methods, this strategy integrates complementary aspects of gene importance: class separation, non-linear dependencies, and statistical significance. The second contribution is the design of an NPO algorithm for high-dimensional selection of Alzheimer’s disease biomarker values. We extend NPO search with adaptive exploration and anti-stagnation mechanisms, followed by local refinement during navigation of the complex genomic feature space. Finally, the third contribution is that experimental design can be leakage-free. In particular, all feature selection, oversampling, and optimization procedures were performed only within training folds. This prevents the problem of over-optimistic performance assessment, a frequent limitation in many biomedical machine-learning studies. Moreover, some other biomarker stability analysis approaches allow the reporting of reproducible gene signatures rather than just classification performance. These specifications together enable HFW-NPO to be a fully-fledged computational framework that integrates predictive modeling, optimization efficiency, reproducibility and biological interpretability. Our results show that our approach has great potential for transcriptomics biomarker discovery and lays the foundation for upcoming precision diagnostic studies for Alzheimer’s disease. In Figure 11, the originality analysis of the proposed Hybrid Filter–Wrapper Nomadic People Optimiser (HFW-NPO) is illustrated using a Cross-dataset gene panel overlap analysis that characterises classification performance as a function of the number of selected biomarkers. This analysis focuses on a significant trade-off in biomedical machine learning: maximizing prediction accuracy versus minimizing size and complexity of the biomarker panel. Achieving high accuracy in transcriptomic classification is not enough—having a large number of selected genes results in models that are complex, less interpretable, and harder to use clinically. An optimal biomarker discovery framework should, hence, be able to determine a minimal gene subset that still maintains classification ability, since balanced accuracy and feature reduction efficiency indicate that HFW-NPO offers a good compromise with previously reported methods, as indicated by the Pareto frontier. This framework enables robust classification with significantly fewer probes selected from thousands of original transcriptomic features while achieving comparable classification performance. This advantage is primarily due to its two-stage feature selection mechanism. The first stage is a tri-criterion omega-score-based filter to remove irrelevant and redundant genes, supported by complementary statistical information. NPO wrapper optimization generates the second stage, which ranks gene combinations based on their actual contribution to classification performance. In contrast to conventional filter-based methods that assess all genes independently, the wrapper approach evaluates interactions among selected biomarkers, as is the case in Alzheimer’s disease, where neurodegeneration is regulated by interacting biological networks rather than individual genes. Enhanced NPO offers improved exploration capabilities compared to traditional optimization approaches such as Genetic Algorithm (GA) and Particle Swarm Optimization (PSO), through clan-based search, adaptive Lévy movements, and anti-stagnation. This enables the optimiser to find smaller, yet highly selective, biomarker panels. Such compact biomarker panels generated by HFW-NPO confer translational practicality toward future clinical use. Studies employing smaller gene panels incur lower costs for experimental validation, are easier to implement in clinical diagnostic assays, and exhibit better reproducibility across independent populations. In that sense, Figure 11 exemplifies one of the main contributions of this work: HFW-NPO not only enhances classifier performance [76,77], but also optimises a trade-off between predictive accuracy and biological interpretability [78], an essential feature of precision medicine approaches.
Table 9 summarizes the methodological innovation and research contributions as a structured benchmarking comparison, comparing with existing paradigms for Alzheimer’s disease classification based on at least one based on filter- or wrapper-based SVM models, PSO-based wrapper approaches, deep learning architectures, and LASSO-based ensemble methods. The comparison is not limited to classification strategy; it extends to feature selection methodology, optimization mechanisms, reproducibility, leakage prevention, interpretability, and multi-dataset validation. Our proposed HFW-NPO framework is the first of its kind, featuring a novel two-stage feature selection strategy, informed by hybrid statistical filtering and wrapper-based optimization. In contrast to previous works in Filter + SVM that are based on a single ranking criterion, HFW-NPO combines three effective methods, i.e., Fisher’s score, Mutual Information and Welch’s t-test, which jointly measure class separability, nonlinear dependency and statistical significance, respectively. Filtering from multiple perspectives can enhance the quality of candidate genes prior to optimization. One of the principal novelties in HFW-NPO is the introduction of a local-search-enhanced NPO optimizer. In contrast to the arbitrary local search processes of PSO and GA-based methods, the proposed optimizer uses a Lévy-flight-based adaptive exploration strategy through movement and restart mechanisms, enabling a higher probability of escaping from local optima during biomarker subset discovery. The second, also crucial benefit is strict data leakage prevention. The framework evaluates features and balances the classes only within each training fold of cross-validation, to avoid “leaking” knowledge from test samples into model development. This is a better approximation for generalization performance than studies that process the data in its entirety before validation. Additionally, HFW-NPO uses a five-member soft voting ensemble of heterogeneous classifiers, which improves robustness compared to single SVM models. In contrast to deep learning models, which, due to their complexity, are often difficult to interpret biologically, HFW-NPO is a transparent approach—it reports identified genes together with their stability frequencies. We validated the framework in multiple independent datasets from diverse biological sources, including brain and peripheral blood samples. Such a multi-cohort evaluation provides evidence of generalization and suggests clinical applicability. Taken together, the comprehensive data reported in Table 9 show that HFW-NPO successfully integrates previously independent paradigms of optimization efficiency [79], biological interpretability, reproducibility/validation without leakage [80], and strong biomarker discovery into a single meta-optimization framework.

4. Conclusions

This study presents a new Hybrid Filter–Wrapper Neuro-inspired Population Optimization (HFW-NPO) framework for robustly discovering high-dimensional transcriptomic biomarkers of Alzheimer’s disease (AD). An integrated framework for genomic machine learning was proposed to address the challenges of high-dimensional microarray data, limited sample availability, unstable feature selection, overfitting, and the need for interpretable biomarker identification. Three-phase computational framework of HFW-NPO that incorporates tri-criterion hybrid filtering, NPO wrapper optimization, and the hybrid filtering step integrates Fisher’s score, Mutual Information and Welch’s test statistics into a unified framework that estimates gene relevance from three complementary angles: class discrimination ability, the nonlinear association with class labels and significance of target class differential expression. Then, instead of only quantifying individual feature importance as in existing works, the NPO wrapper optimization mechanism detects optimal biomarker subsets that involve interactions among the selected genes. HFW-NPO yielded robust and consistent classifications, validated across several independent transcriptomic Alzheimer’s disease datasets. After stratified five-fold cross-validation, the framework achieved balanced accuracies of 85.28%, 87.16%, and 96.67% for GSE33000, GSE132903, and GSE122063, respectively. For the combined peripheral blood group (GSE63060 + GSE63061, n = 478), the framework had an adjusted accuracy of 59.53% ± 4.21% and an MCI-Recall of 63.50% with z-score batch harmonization and RSKF (5 × 10), in peripheral blood, while condensing over 15,000 original gene probes into compact biomarker panels of ~30 genes per fold. This large-scale dimensionality reduction demonstrates that the proposed method can maintain relevant molecular information while improving model interpretability for disease. Biological pathway enrichment assessment confirmed useful concordance of similar selected biomarker panels: KEGG Alzheimer’s disease pathway, autophagy/mitophagy, and sphingolipid metabolism were consistently enriched in independent datasets, which confirmed that HFW-NPO-selected genes showed consistent alignment with established AD pathways. There is a critical need for scientific biomarker discovery. The framework was especially durable as confirmed by the prolonged evaluation metrics. The AD-discriminative performance was confirmed by high sensitivity, specificity, F1-score, MCC, Cohen’s kappa, and AUC-ROC values. In particular, the GSE122063 dataset yielded an AUC-ROC of 0.978 and an MCC of 0.950, demonstrating very good predictive reliability. The analysis of optimization revealed that the proposed (improved) NPO achieved faster convergence and better fitness minimization than the traditional PSO and GA algorithms. The mechanisms of adaptive exploration, anti-stagnation, and local refinement are bidirectionally assisted to achieve a balanced trade-off between global search capability and local optimization outcome quality. Moreover, ablation experiments demonstrated that each component was beneficial to the overall system performance; hybrid feature filtering and NPO wrapper optimization were shown to be crucial processing stages. Statistical evaluation confirmed a non-random method ranking across the brain-tissue datasets (Friedman test: GSE33000 χ2 = 16.43, p = 0.006; GSE132903 χ2 = 14.60, p = 0.012) and substantive effect sizes (Cohen’s d > 0.8 in 12 of 15 pairwise comparisons), supporting the conclusion that the observed performance advantage of HFW-NPO is consistent and not attributable to sampling variance. Importantly, HFW-NPO was able to converge on stable biomarker signatures across validation folds. Through a gene stability analysis, we identified repeatedly selected biomarkers that are highly recurrently observed with stable expression signatures, providing evidence for the reproducibility of these molecular signatures and their suitability towards downstream biological validation methods. The HFW-NPO architecture is a comprehensive system for Alzheimer’s disease transcriptomic classification that balances computational efficiency with interpretability. The framework combines statistical feature evaluation, intelligent optimization, and ensemble learning in a way that achieves effective trade-offs among accuracy, compactness, and biological interpretability. We will verify the identified biomarkers through larger multi-centre cohorts, RNA-sequencing datasets, pathway enrichment analysis and experimental biological verification in future studies. Moreover, multi-omics data, including genomics, proteomics, metabolomics, and clinical variables, will be included in HFW-NPO to enhance its utility for precision medicine and early diagnosis of Alzheimer’s disease.

Supplementary Materials

The following supporting information can be downloaded at: https://www.mdpi.com/article/10.3390/electronics15132970/s1. Figure S1: principle component analysis (PCA) of merged peripheral blood cohort (GSE 63060 + GSE 63061, n = 478) before and after z-score batch harmonization; Figure S2: Omega-score cumulative mass analysis: empirical justification for filter pool size selection (k = 80 for brain datasets, k = 15 for peripheral blood); Table S1: PERMANOVA result quantifying batch effect before and after z-score harmonization in the merged peripheral blood cohort (GSE 63060 + GSE 63061, n = 478, 999 permutations); Table S2: NPO optimization, increasing k in the full pipeline is constrained by NPO search-space capacity; Table S3: Omega-score weight perturbation analysis across seven configurations on three brain datasets; Table S4: Permutations control for biomarker selection frequency.

Author Contributions

Conceptualization, A.M.A. and R.H.A.; methodology, A.M.A.; software, A.M.A.; validation, A.M.A. and R.H.A.; formal analysis, A.M.A.; investigation, R.H.A.; resources, A.M.A. and R.H.A.; data curation, A.M.A.; writing—original draft preparation, A.M.A.; writing—review and editing, R.H.A.; visualization, A.M.A.; supervision, R.H.A.; project administration, R.H.A.; funding acquisition, A.M.A. All authors have read and agreed to the published version of the manuscript.

Funding

This research received no external funding.

Data Availability Statement

The complete source code for the HFW-NPO is publicly available at https://github.com/alwhelat/HFW-EBNPO-Alzheimer-Gene-Classification (accessed on 24 June 2026). All gene expression datasets are publicly available from NCBI GEO under accession numbers GSE33000, GSE132903, GSE122063, GSE63060, and GSE63061.

Acknowledgments

The authors would like to thank Near East University for general help and support.

Conflicts of Interest

The authors declare no conflicts of interest.

Abbreviations

The following abbreviations are used in this manuscript:
ACCAccuracy
ADAlzheimer’s Disease
APOEApolipoprotein E
APPAmyloid Precursor Protein
AUCArea Under the Curve
BAOABinary Arithmetic Optimization Algorithm
BalAccBalanced Accuracy
BBBBlood–Brain Barrier
BPBiological Process
CNNConvolutional Neural Network
CVCross-Validation
DNADeoxyribonucleic Acid
DORDiagnostic Odds Ratio
EFSEnsemble Feature Selection
ETExtra Trees
F1F1 Score (Harmonic Mean of Precision and Recall)
FDRFalse Discovery Rate
FNFalse Negative
FPFalse Positive
FWSEFilter and Wrapper Stacking Ensemble
GAGenetic Algorithm
GBGradient Boosting
GEOGene Expression Omnibus
GOGene Ontology
GSEGene Series Expression (GEO Dataset Series)
HDLSSHigh-Dimensional Low-Sample-Size
HFWHybrid Filter–Wrapper
HFW-NPOHybrid Filter–Wrapper Nomadic People Optimizer
HNCHead and Neck Cancer
KEGGKyoto Encyclopedia of Genes and Genomes
LASSOLeast Absolute Shrinkage and Selection Operator
LRLogistic Regression
MAPKMitogen-Activated Protein Kinase
MCCMatthews Correlation Coefficient
MCIMild Cognitive Impairment
MIMutual Information
MLPCMulti-Layer Perceptron Classifier
MLPNNMulti-Layer Perceptron Neural Network
mRMRMinimum Redundancy Maximum Relevance
NCBINational Center for Biotechnology Information
NIANational Institute on Aging
NPONomadic People Optimizer/Neuro-inspired Population Optimization
PI3KPhosphatidylinositol 3-Kinase
PINKPTEN-Induced Kinase 1
PSOParticle Swarm Optimization
RBFRadial Basis Function
REACReactome
RFRandom Forest
RNARibonucleic Acid
ROCReceiver Operating Characteristic
RSKFRepeated Stratified K-Fold
SASMOTESelf-Inspected Adaptive SMOTE
SMOTESynthetic Minority Oversampling Technique
SVCSupport Vector Classifier
SVMSupport Vector Machine
TFAMTranscription Factor A, Mitochondrial
TNTrue Negative
TPTrue Positive

References

  1. Karch, C.M.; Cruchaga, C.; Goate, A.M. Alzheimer’s disease genetics: From the bench to the clinic. Neuron 2014, 83, 11–26. [Google Scholar] [CrossRef] [PubMed]
  2. Mohammed, S.J. A proposed Alzheimer’s disease diagnosing system based on clustering and segmentation techniques. Eng. Technol. 2018, 36, 160–165. [Google Scholar] [CrossRef]
  3. Gauthier, S.; Cummings, J.; Ballard, C.; Brodaty, H.; Grossberg, G.; Robert, P.; Lyketsos, C. Management of behavioral problems in Alzheimer’s disease. Int. Psychogeriatr. 2010, 22, 346–372. [Google Scholar] [CrossRef] [PubMed]
  4. Salih, S.Q.; Alsewari, A.M.A. A new algorithm for normal and large-scale optimization problems: Nomadic People Optimizer. Neural Comput. Appl. 2020, 32, 10359–10386. [Google Scholar] [CrossRef]
  5. Sekaran, K.; Sudha, M. Diagnostic gene biomarker selection for Alzheimer’s classification using machine learning. Int. J. Innov. Technol. Explor. Eng. 2019, 8, 2348–2352. [Google Scholar] [CrossRef]
  6. Vanitha, C.D.A.; Devaraj, D.; Venkatesulu, M. Gene expression data classification using support vector machine and mutual information-based gene selection. Procedia Comput. Sci. 2015, 47, 13–21. [Google Scholar] [CrossRef]
  7. Al-Thani, H.F.; Ahmad, M.N.; Younes, S.; Zayed, H. Genetic variants associated with Alzheimer disease in the 22 Arab countries: A systematic review. Alzheimer Dis. Assoc. Disord. 2021, 35, 178–186. [Google Scholar] [PubMed]
  8. Chethana, H.P.; Hemachandra, G.; Sidhu, A. Biomarkers: Potential Perspectives in Detection, Diagnosis, and Prognosis of Neurodegenerative Disorders. In Functional Foods and Therapeutic Strategies for Neurodegenerative Disorders; Elumalai, P., Lakshmi, S., Eds.; Springer: Singapore, 2022; pp. 203–222. [Google Scholar]
  9. Koutsodendris, N.; Nelson, M.R.; Rao, A.; Huang, Y. Apolipoprotein E and Alzheimer’s disease: Findings, hypotheses, and potential mechanisms. Annu. Rev. Pathol. 2022, 17, 73–99. [Google Scholar] [PubMed]
  10. Bhattacharyya, R.; Teves, C.A.F.; Long, A.; Hofert, M.; Tanzi, R.E. The neuronal-specific isoform of BIN1 regulates β-secretase cleavage of APP and Aβ generation in a RIN3-dependent manner. Sci. Rep. 2022, 12, 3486. [Google Scholar] [PubMed]
  11. Mahto, R.; Ahmed, S.U.; Rahman, R.U.; Aziz, R.M.; Roy, P.; Mallik, S.; Li, A.; Shah, M.A. A novel and innovative cancer classification framework through a consecutive utilization of hybrid feature selection. BMC Bioinform. 2023, 24, 479. [Google Scholar] [CrossRef]
  12. Joshi, A.M.A.; Aziz, R.M. A two-phase cuckoo search based approach for gene selection and deep learning classification of cancer disease using gene expression data with a novel fitness function. Multimed. Tools Appl. 2024, 83, 71721–71752. [Google Scholar] [CrossRef]
  13. Petrella, J.R.; Jiang, J.; Sreeram, K.; Dalziel, S.; Doraiswamy, P.; Hao, W.; Alzheimer’s Disease Neuroimaging Initiative. Personalized computational causal modeling of the Alzheimer disease biomarker cascade. J. Prev. Alzheimers Dis. 2024, 11, 435–444. [Google Scholar] [PubMed]
  14. Yaqoob, A.; Verma, N.K.; Aziz, R.M. Optimizing gene selection and cancer classification with hybrid sine cosine and cuckoo search algorithm. J. Med. Syst. 2024, 48, 10. [Google Scholar] [CrossRef] [PubMed]
  15. Edgar, R.; Domrachev, M.; Lash, A. Gene Expression Omnibus: NCBI gene expression and hybridization array data repository. Nucleic Acids Res. 2002, 30, 207–210. [Google Scholar] [CrossRef] [PubMed]
  16. Barrett, T.; Wilhite, S.E.; Ledoux, P.; Evangelista, C.; Kim, I.F.; Tomashevsky, M.; Marshall, K.A.; Phillippy, K.H.; Sherman, P.M.; Holko, M.; et al. NCBI GEO: Archive for functional genomics data sets—Update. Nucleic Acids Res. 2013, 41, D991–D995. [Google Scholar] [CrossRef] [PubMed]
  17. Clough, E.; Barrett, T.; Wilhite, S.E.; Ledoux, P.; Evangelista, C.; Kim, I.F.; Tomashevsky, M.; Marshall, K.; Phillippy, K.H.; Sherman, P.M.; et al. NCBI GEO: Archive for gene expression and epigenomics data sets: 23-year update. Nucleic Acids Res. 2023, 52, D138–D144. [Google Scholar] [CrossRef] [PubMed]
  18. Clarke, R.; Ressom, H.; Wang, A.; Xuan, J.; Liu, M.C.; Gehan, E.; Wang, Y. The properties of high-dimensional data spaces: Implications for exploring gene and protein expression data. Nat. Rev. Cancer 2007, 8, 37–49. [Google Scholar] [CrossRef] [PubMed]
  19. Huang, Y.-N.; Jaiswal, P.; Rajes, A.; Yadav, A.; Yu, D.; Liu, F.; Scheg, G.; Shih, E.; Boldirev, G.; Nakashidze, I.; et al. The systematic assessment of completeness of public metadata accompanying omics studies in the Gene Expression Omnibus data repository. Genome Biol. 2025, 26, 274. [Google Scholar] [CrossRef] [PubMed]
  20. Hamraz, M.; Khan, Z.; Khan, D.M.; Gul, N.; Ali, A.; Aldahmani, S. Gene selection in binary classification problems within functional genomics experiments via robust Fisher Score. IEEE Access 2022, 10, 51682–51692. [Google Scholar] [CrossRef]
  21. Pirgazi, J.; Alimoradi, M.; Abharian, T.E.; Olyaee, M. An efficient hybrid filter-wrapper metaheuristic-based gene selection method for high dimensional datasets. Sci. Rep. 2019, 9, 18580. [Google Scholar] [CrossRef] [PubMed]
  22. Gul, S.; Khan, D.M.; Aldahmani, S.; Khan, Z. Margin weighted robust discriminant score for feature selection in imbalanced gene expression classification. PLoS ONE 2025, 20, e0325147. [Google Scholar] [CrossRef] [PubMed]
  23. Sarbazi-Azad, S.; Abadeh, M.S.; Abadi, M.I.N. Feature Selection in Microarray Gene Expression Data Using Fisher Discriminant Ratio. In Proceedings of the 2018 8th International Conference on Computer and Knowledge Engineering (ICCKE), Mashhad, Iran, 25–26 October 2018; pp. 225–230. [Google Scholar] [CrossRef]
  24. Anidha, M.; Premalatha, K. A Hybrid Gene Selection Technique Using Improved Mutual Information and Fisher Score for Cancer Classification Using Microarrays. Int. J. Comput. Electr. Autom. Control Inf. Eng. 2016, 10, 607–610. [Google Scholar]
  25. Xu, J.; Qu, K.; Qu, K.; Hou, Q.; Meng, X. Feature selection using neighborhood uncertainty measures and Fisher score for gene expression data classification. Int. J. Mach. Learn. Cybern. 2023, 14, 4011–4028. [Google Scholar] [CrossRef]
  26. Hammami, M.; Bechikh, S.; Hung, C.; Said, L.B. A multi-objective hybrid filter-wrapper evolutionary approach for feature selection. Memet. Comput. 2019, 11, 193–208. [Google Scholar] [CrossRef]
  27. Li, J.; Luo, T.; Zhang, B.; Chen, M.; Zhou, J. IMOABC: An efficient multi-objective filter-wrapper hybrid approach for high-dimensional feature selection. J. King Saud Univ. Comput. Inf. Sci. 2024, 36, 102205. [Google Scholar] [CrossRef]
  28. Yuen, K. The two-sample trimmed t for unequal population variances. Biometrika 1974, 61, 165–170. [Google Scholar] [CrossRef]
  29. Dudoit, S.; Fridlyand, J.; Speed, T.P. Comparison of discrimination methods for the classification of tumors using gene expression data. J. Am. Stat. Assoc. 2002, 97, 77–87. [Google Scholar] [CrossRef]
  30. Ahmed, S.T.; Kadhem, S. Optimizing Alzheimer’s disease prediction using the nomadic people algorithm. Int. J. Electr. Comput. Eng. 2023, 13, 2052–2067. [Google Scholar] [CrossRef]
  31. Ghosh, K.; Ahmed, S.; Singh, P.; Geem, Z.; Sarkar, R. Improved Binary Sailfish Optimizer based on adaptive β-Hill Climbing for feature selection. IEEE Access 2020, 8, 83548–83560. [Google Scholar] [CrossRef]
  32. Khodadadi, N.; Khodadadii, E.; Al-Tashi, Q.; El-Kenawy, E.-S.M.; Abualigah, L.; Abdulkadir, S.; Alqushaibi, A.; Mirjalili, S. BAOA: Binary Arithmetic Optimization Algorithm with K-Nearest Neighbor Classifier for feature selection. IEEE Access 2023, 11, 94094–94115. [Google Scholar] [CrossRef]
  33. Sun, P.; Zhang, Y.; Liu, J.; Bi, J. An improved Atom Search Optimization with Cellular Automata, a Lévy Flight and an Adaptive Weight Strategy. IEEE Access 2020, 8, 49137–49159. [Google Scholar] [CrossRef]
  34. Ba, A.F.; Huang, H.; Wang, M.; Ye, X.; Gu, Z.; Chen, H.; Cai, X. Levy-based antlion-inspired optimizers with orthogonal learning scheme. Eng. Comput. 2022, 38, 397–418. [Google Scholar] [CrossRef]
  35. Thölke, P.; Mantilla-Ramos, Y.-J.; Abdelhedi, H.; Maschke, C.; Dehgan, A.; Harel, Y.; Kemtur, A.; Berrada, L.M.; Sahraoui, M.; Young, T.; et al. Class imbalance should not throw you off balance: Choosing the right classifiers and performance metrics for brain decoding with imbalanced data. bioRxiv 2023. [Google Scholar] [CrossRef]
  36. Akinola, O.; Ezugwu, A.; Agushaka, J.; Zitar, R.A.; Abualigah, L. Multiclass feature selection with metaheuristic optimization algorithms: A review. Neural Comput. Appl. 2022, 34, 19751–19790. [Google Scholar] [CrossRef] [PubMed]
  37. Xue, B.; Zhang, M.; Browne, W.N. Particle Swarm Optimization for Feature Selection in Classification: A Multi-Objective Approach. IEEE Trans. Cybern. 2013, 43, 1656–1671. [Google Scholar] [CrossRef] [PubMed]
  38. Alyasiri, O.M.; Cheah, Y.; Abasi, A.; Al-Janabi, O.M. Wrapper and Hybrid Feature Selection Methods Using Metaheuristic Algorithms for English Text Classification: A Systematic Review. IEEE Access 2022, 10, 39833–39852. [Google Scholar] [CrossRef]
  39. Agrawal, P.; Abutarboush, H.F.; Ganesh, T.; Mohamed, A.W. Metaheuristic Algorithms on Feature Selection: A Survey of One Decade of Research (2009–2019). IEEE Access 2021, 9, 26766–26791. [Google Scholar] [CrossRef]
  40. Chawla, N.; Bowyer, K.; Hall, L.; Kegelmeyer, W. SMOTE: Synthetic Minority Over-sampling Technique. J. Artif. Intell. Res. 2002, 16, 321–357. [Google Scholar] [CrossRef]
  41. Saeys, Y.; Inza, I.; Larrañaga, P. A review of feature selection techniques in bioinformatics. Bioinformatics 2007, 23, 2507–2517. [Google Scholar] [CrossRef] [PubMed]
  42. Guelib, B.; Rayene, B.; Aliouane, S.E.; Hermessi, H.; Khlifa, N.; Zarour, K. Optimizing gene selection for Alzheimer’s disease classification: A Bayesian approach to filter and embedded techniques. Appl. Soft Comput. 2024, 167, 112307. [Google Scholar] [CrossRef]
  43. Lazar, C.; Taminau, J.; Meganck, S.; Steenhoff, D.; Coletta, A.; Molter, C.; de Schaetzen, V.; Duque, R.; Bersini, H.; Nowé, A. A Survey on Filter Techniques for Feature Selection in Gene Expression Microarray Analysis. IEEE/ACM Trans. Comput. Biol. Bioinform. 2012, 9, 1106–1119. [Google Scholar] [CrossRef] [PubMed]
  44. Song, Y.-W.; Wang, J.-S.; Qi, Y.-L.; Wang, Y.-C.; Song, H.; Shang-Guan, Y.-P. Serial filter-wrapper feature selection method with elite guided mutation strategy on cancer gene expression data. Artif. Intell. Rev. 2025, 58, 111. [Google Scholar] [CrossRef]
  45. Chicco, D.; Jurman, G. The advantages of the Matthews correlation coefficient (MCC) over F1 score and accuracy in binary classification evaluation. BMC Genom. 2020, 21, 6. [Google Scholar] [CrossRef] [PubMed]
  46. Saito, T.; Rehmsmeier, M. The Precision-Recall Plot Is More Informative than the ROC Plot When Evaluating Binary Classifiers on Imbalanced Datasets. PLoS ONE 2015, 10, e0118432. [Google Scholar] [CrossRef] [PubMed]
  47. Japkowicz, N.; Stephen, S. The class imbalance problem: A systematic study. Intell. Data Anal. 2002, 6, 429–449. [Google Scholar] [CrossRef]
  48. Fawcett, T. An introduction to ROC analysis. Pattern Recognit. Lett. 2006, 27, 861–874. [Google Scholar] [CrossRef]
  49. Chicco, D.; Starovoitov, V.; Jurman, G. The Benefits of the Matthews Correlation Coefficient (MCC) Over the Diagnostic Odds Ratio (DOR) in Binary Classification Assessment. IEEE Access 2021, 9, 47112–47124. [Google Scholar] [CrossRef]
  50. Chicco, D.; Jurman, G. The Matthews correlation coefficient (MCC) should replace the ROC AUC as the standard metric for assessing binary classification. BioData Min. 2023, 16, 4. [Google Scholar] [CrossRef] [PubMed]
  51. Kennedy, J.; Eberhart, R. Particle swarm optimization. In Proceedings of the ICNN’95—International Conference on Neural Networks, Perth, WA, Australia, 27 November–1 December 1995; Volume 4, pp. 1942–1948. [Google Scholar] [CrossRef]
  52. Holland, J. Adaptation in Natural and Artificial Systems: An Introductory Analysis with Applications to Biology, Control, and Artificial Intelligence; MIT Press: Cambridge, MA, USA, 1992. [Google Scholar] [CrossRef]
  53. Gaudreault, J.-G.; Branco, P. Empirical analysis of performance assessment for imbalanced classification. Mach. Learn. 2024, 113, 5533–5575. [Google Scholar] [CrossRef]
  54. Dökeroğlu, T.; Deniz, A.; Kiziloz, H.E. A comprehensive survey on recent metaheuristics for feature selection. Neurocomputing 2022, 494, 269–296. [Google Scholar] [CrossRef]
  55. Yang, X.-S. Nature-Inspired Optimization Algorithms: Challenges and Open Problems. J. Comput. Sci. 2020, 46, 101104. [Google Scholar] [CrossRef]
  56. Pham, T.H.; Raahemi, B. Bio-Inspired Feature Selection Algorithms With Their Applications: A Systematic Literature Review. IEEE Access 2023, 11, 43733–43758. [Google Scholar] [CrossRef]
  57. Wolpert, D. Stacked generalization. Neural Netw. 1992, 5, 241–259. [Google Scholar] [CrossRef]
  58. Arora, V.; Agarwal, P. An Empirical Study of Nature-Inspired Algorithms for Feature Selection in Medical Applications. Ann. Data Sci. 2024, 12, 1479–1524. [Google Scholar] [CrossRef]
  59. Bashir, S.; Khattak, I.; Khan, A.; Khan, F.; Gani, A.; Shiraz, M. A Novel Feature Selection Method for Classification of Medical Data Using Filters, Wrappers, and Embedded Approaches. Complexity 2022, 2022, 8190814. [Google Scholar] [CrossRef]
  60. Cheng, X. A Comprehensive Study of Feature Selection Techniques in Machine Learning Models. Insights Comput. Signals Syst. 2024, 1, 65–78. [Google Scholar] [CrossRef]
  61. Chen, C.-W.; Tsai, Y.-H.; Chang, F.; Lin, W. Ensemble feature selection in medical datasets: Combining filter, wrapper, and embedded feature selection results. Expert Syst. 2020, 37, e12553. [Google Scholar] [CrossRef]
  62. Simon, R. Roadmap for developing and validating therapeutically relevant genomic classifiers. J. Clin. Oncol. 2005, 23, 7332–7341. [Google Scholar] [CrossRef] [PubMed]
  63. Gong, H.; Li, Y.; Zhang, J.; Zhang, B.; Wang, X. A new filter feature selection algorithm for classification task by ensembling pearson correlation coefficient and mutual information. Eng. Appl. Artif. Intell. 2024, 131, 107865. [Google Scholar] [CrossRef]
  64. Kotlarz, K.; Słomian, D.; Zawadzka, W.; Szyda, J. Feature Selection Strategies for Deep Learning-Based Classification in Ultra-High-Dimensional Genomic Data. Int. J. Mol. Sci. 2025, 26, 7961. [Google Scholar] [CrossRef] [PubMed]
  65. Hampel, H.; Frank, R.; Broich, K.; Teipel, S.; Katz, R.; Hardy, J.; Herholz, K.; Bokde, A.L.W.; Jessen, F.; Hoessler, Y.C.; et al. Biomarkers for Alzheimer’s disease: Academic, industry and regulatory perspectives. Nat. Rev. Drug Discov. 2010, 9, 560–574. [Google Scholar] [CrossRef] [PubMed]
  66. Blalock, E.; Geddes, J.; Chen, K.; Porter, N.; Markesbery, W.; Landfield, P. Incipient Alzheimer’s disease: Microarray correlation analyses reveal major transcriptional and tumor suppressor responses. Proc. Natl. Acad. Sci. USA 2004, 101, 2173–2178. [Google Scholar] [CrossRef] [PubMed]
  67. Huynh-Thu, V.A.; Sanguinetti, G. Gene Regulatory Network Inference: An Introductory Survey. Methods Mol. Biol. 2019, 1883, 1–23. [Google Scholar] [CrossRef] [PubMed]
  68. Saeys, Y.; Abeel, T.; Peer, Y. Robust Feature Selection Using Ensemble Feature Selection Techniques. In Proceedings of the European Conference on Machine Learning and Knowledge Discovery in Databases (ECML PKDD 2008), Antwerp, Belgium, 15–19 September 2008; pp. 313–325. [Google Scholar] [CrossRef]
  69. Le, P.; Gong, X.; Ung, L.; Yang, H.; Keenan, B.P.; Zhang, L.; He, T. A robust ensemble feature selection approach to prioritize genes associated with survival outcome in high-dimensional gene expression data. Front. Syst. Biol. 2024, 4, 1355595. [Google Scholar] [CrossRef] [PubMed]
  70. Battistella, E.; Ghiassian, S.; Barabási, A. Improving the performance and interpretability on medical datasets using graphical ensemble feature selection. Bioinformatics 2024, 40, btae341. [Google Scholar] [CrossRef] [PubMed]
  71. Alshamlan, H.; Omar, S.; Aljurayyad, R.; Alabduljabbar, R. Identifying Effective Feature Selection Methods for Alzheimer’s Disease Biomarker Gene Detection Using Machine Learning. Diagnostics 2023, 13, 1771. [Google Scholar] [CrossRef] [PubMed]
  72. Mahendran, N.; Vincent, P.M.D.R.; Srinivasan, K.; Chang, C.-Y. Improving the Classification of Alzheimer’s Disease Using Hybrid Gene Selection Pipeline and Deep Learning. Front. Genet. 2021, 12, 784814. [Google Scholar] [CrossRef] [PubMed]
  73. Abdelwahab, M.M.; Al-Karawi, K.A.; Semary, H.E. Deep Learning-Based Prediction of Alzheimer’s Disease Using Microarray Gene Expression Data. Biomedicines 2023, 11, 3304. [Google Scholar] [CrossRef] [PubMed]
  74. Sun, D.; Peng, H.; Wu, Z. Establishment and Analysis of a Combined Diagnostic Model of Alzheimer’s Disease With Random Forest and Artificial Neural Network. Front. Aging Neurosci. 2022, 14, 921906. [Google Scholar] [CrossRef] [PubMed]
  75. Pashaei, E.; Pashaei, E.; Aydin, N. Biomarker Identification for Alzheimer’s Disease Using a Multi-Filter Gene Selection Approach. Int. J. Mol. Sci. 2025, 26, 1816. [Google Scholar] [CrossRef] [PubMed]
  76. Guyon, I.M.; Weston, J.; Barnhill, S.; Vapnik, V. Gene Selection for Cancer Classification using Support Vector Machines. Mach. Learn. 2002, 46, 389–422. [Google Scholar] [CrossRef]
  77. Zhang, Y.; Deng, Q.; Liang, W.; Zou, X. An Efficient Feature Selection Strategy Based on Multiple Support Vector Machine Technology with Gene Expression Data. BioMed Res. Int. 2018, 2018, 7538204. [Google Scholar] [CrossRef] [PubMed]
  78. Xue, Y.; Zhu, H.; Liang, J.; Słowik, A. Adaptive crossover operator based multi-objective binary genetic algorithm for feature selection in classification. Knowl. Based Syst. 2021, 227, 107218. [Google Scholar] [CrossRef]
  79. Ding, J.; Du, J.; Wang, H.; Xiao, S. A novel two-stage feature selection method based on random forest and improved genetic algorithm for enhancing classification in machine learning. Sci. Rep. 2025, 15, 16828. [Google Scholar] [CrossRef] [PubMed]
  80. Omuya, E.; Okeyo, G.; Kimwele, M.W. Feature Selection for Classification using Principal Component Analysis and Information Gain. Expert Syst. Appl. 2021, 174, 114765. [Google Scholar] [CrossRef]
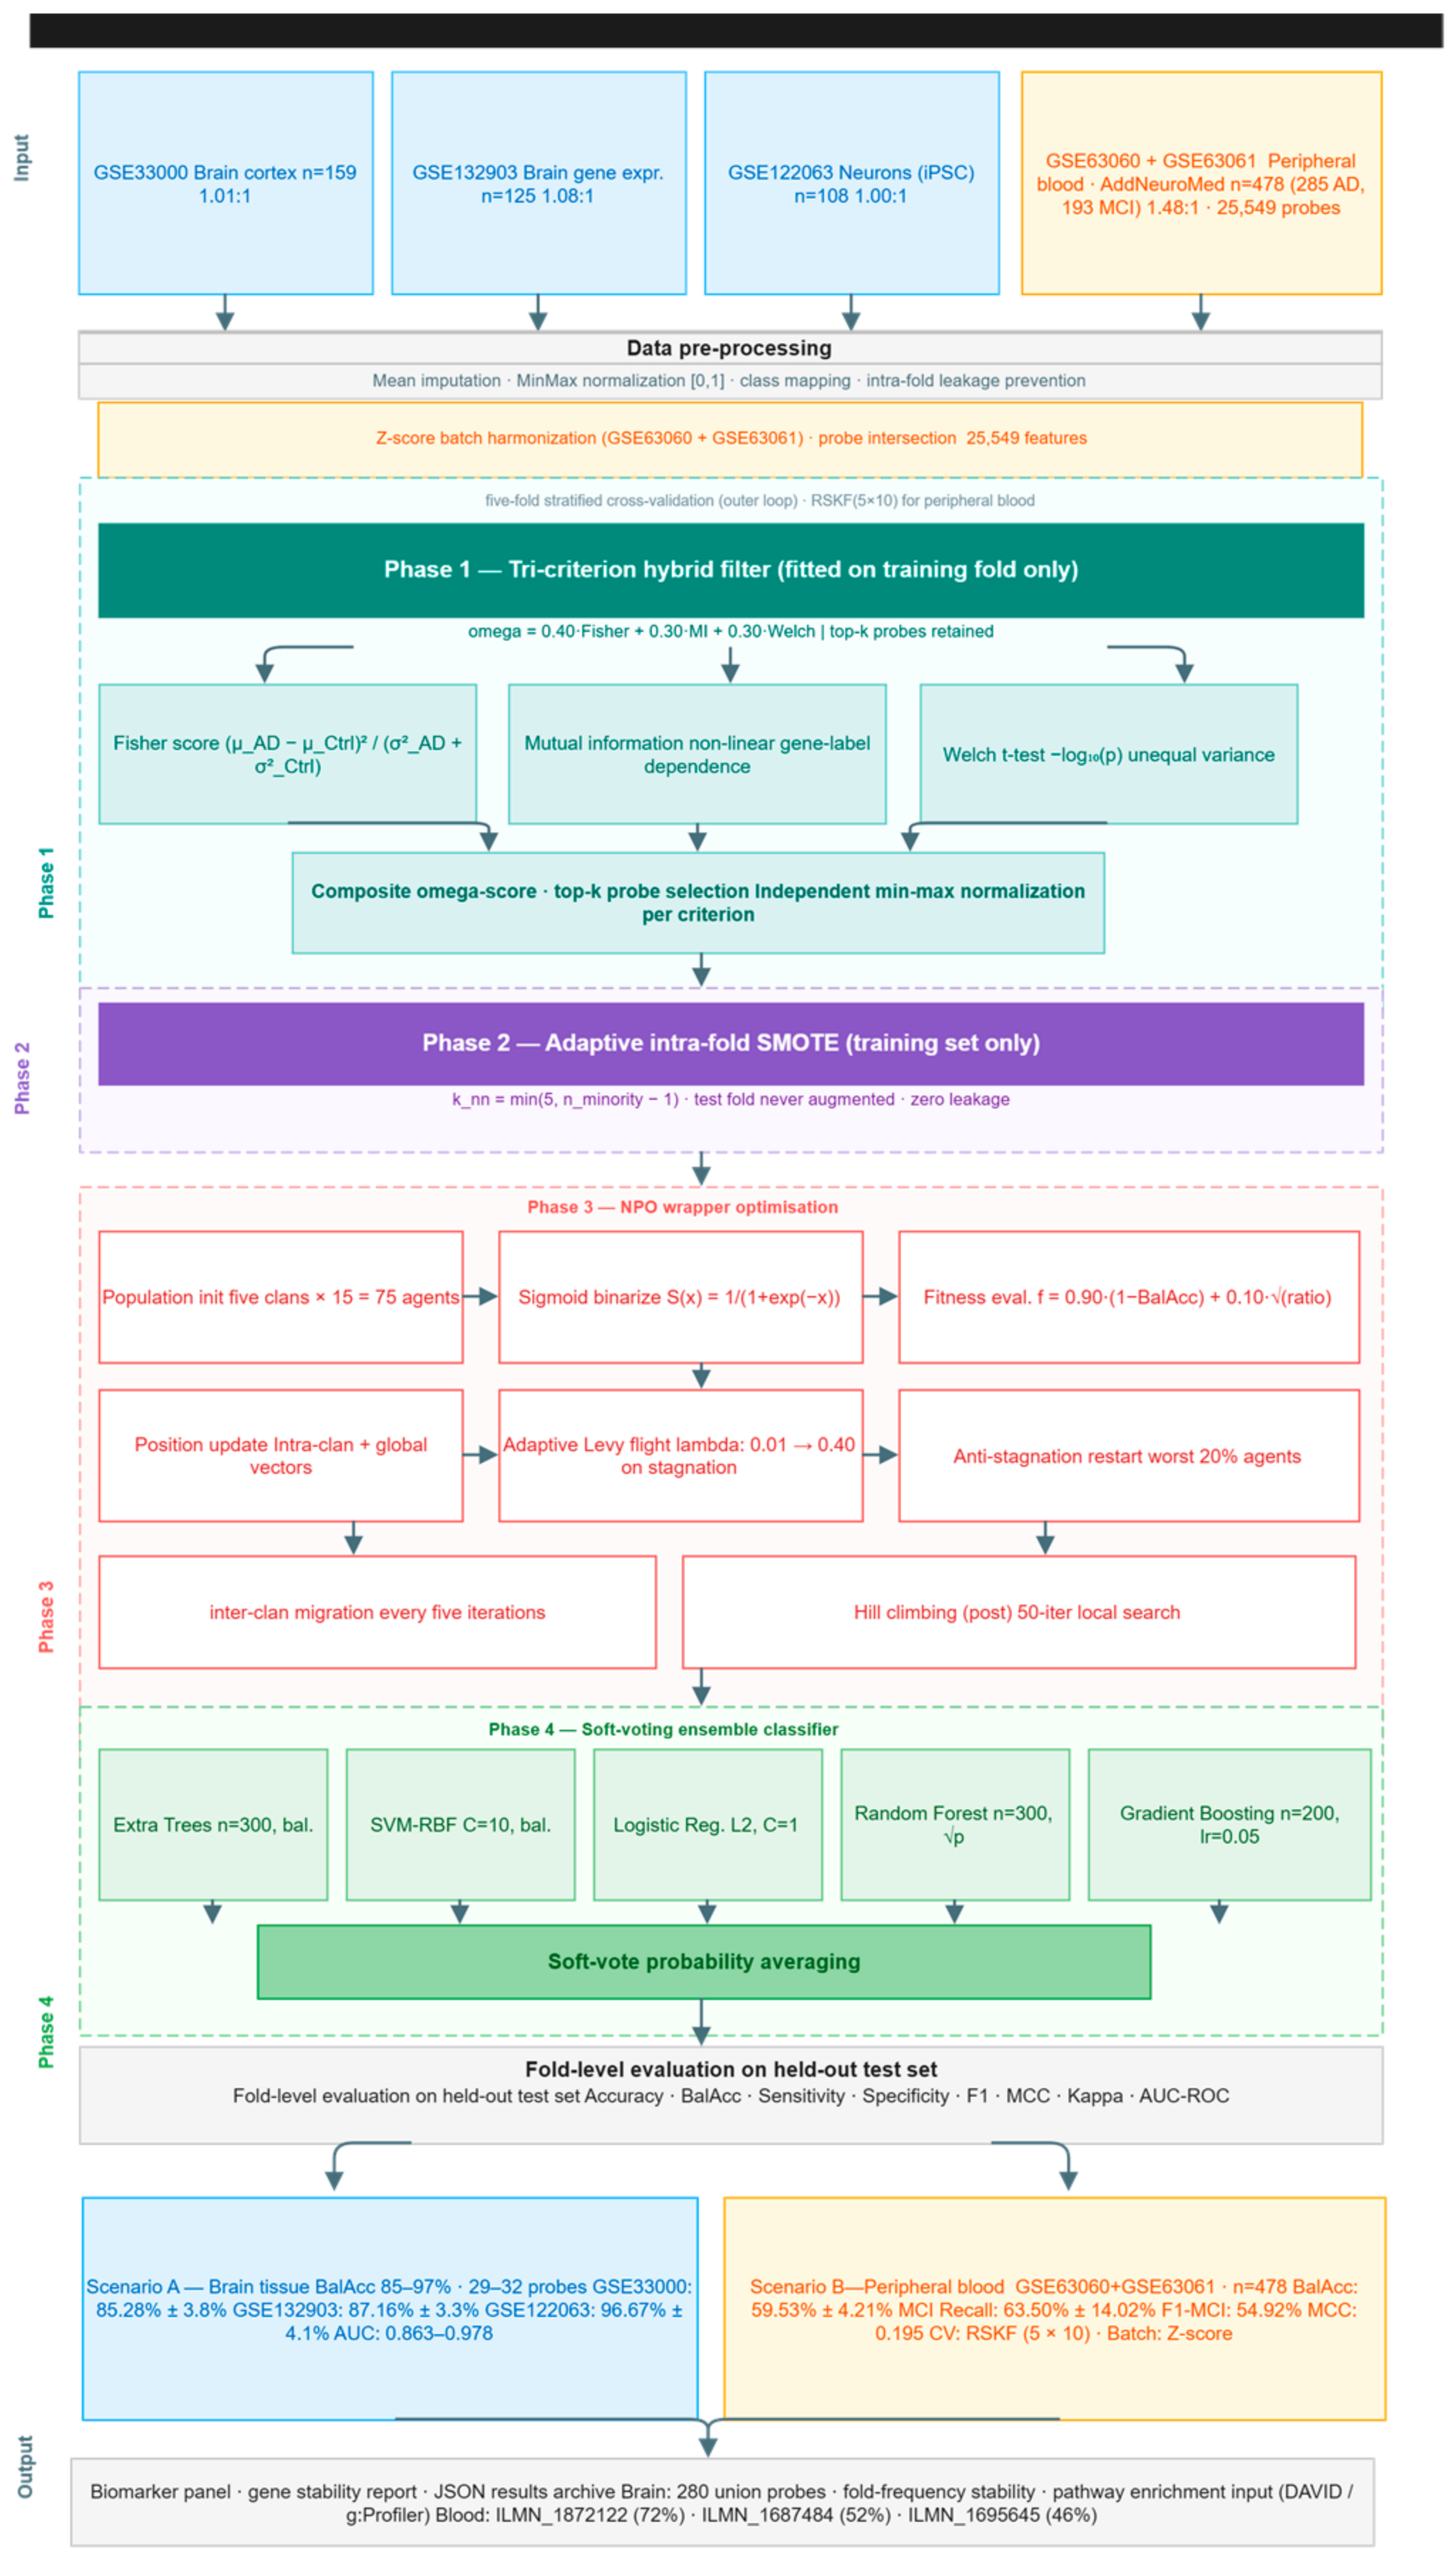
Figure 1. Overall workflow architecture of the proposed HFW-NPO framework.
Electronics 15 02970 g001
Figure 2. Aggregated confusion matrix analysis for evaluating classification reliability of the HFW-NPO framework.
Electronics 15 02970 g002
Figure 3. Comprehensive multi-metric evaluation of HFW-NPO classification performance across Alzheimer’s transcriptomic datasets.
Electronics 15 02970 g003
Figure 4. Comparative convergence behavior of the proposed NPO optimizer against PSO and GA algorithms.
Electronics 15 02970 g004
Figure 5. Ablation analysis for quantifying the contribution of individual components within the proposed HFW-NPO framework.
Electronics 15 02970 g005
Figure 6. Biomarker stability and gene selection frequency analysis across cross-validation experiments.
Electronics 15 02970 g006
Figure 7. Statistical validation of HFW-NPO against baseline methods: mean balanced accuracy, Wilcoxon p-value heatmap, Cohen’s d effect sizes, Friedman rank.
Electronics 15 02970 g007
Figure 8. GSE33000 Pathway enrichment bubble plot (n = 83 HGNC gene symbols).
Electronics 15 02970 g008
Figure 9. GSE132903 Pathway enrichment bubble plot (n = 102 HGNC gene symbols).
Electronics 15 02970 g009
Figure 10. Comparative pathway enrichment—GSE33000 vs. GSE132903HFW-NPO Biomarkers Alzheimer’s Disease.
Electronics 15 02970 g010
Figure 11. Cross-dataset gene panel overlap analysis: Venn diagram of HFW-NPO-selected biomarker union sets across the three brain-tissue cohorts (GSE33000, GSE132903, GSE122063). Overlapping regions indicate genes consistently selected across multiple datasets, reflecting cross-dataset biomarker stability.
Electronics 15 02970 g011
Table 1. Characteristics of the four GEO microarray datasets used for training and evaluation of the HFW-NPO pipeline, including tissue source, classification task, sample counts, class imbalance ratio, feature dimensionality, and microarray platform.
DatasetGEO IDTissue SourceTaskN SamplesAD (Class 1)Control/MCIImbalanceRaw FeaturesPlatform
Data 1GSE33000Brain CortexAD vs. Control15980791.01:116,379Illumina HumanHT-12
Data 2GSE132903Brain Gene Expr.AD vs. Control12565601.08:116,379Illumina HumanHT-12
Data 3GSE122063Neurons (iPSC)AD vs. Control10854541.00:115,720Illumina HumanHT-12
Data 4GSE63060 + GSE63061Peripheral BloodAD vs. MCI4782851931.48:116,379Illumina HumanHT-12
Table 2. NPO wrapper convergence statistics per dataset: initial/final fitness, percentage improvement, performance advantage over PSO and GA, average genes per fold, union gene set size, and approximate convergence iteration.
DatasetInitial FitnessFinal FitnessImprovement (%)vs. PSO (Better %)vs. GA (Better%)Avg Genes
/Fold
Union GenesConvergence Speed
GSE330000.21060.189410.1%+6.5%+8.3%29.483~iter 15
GSE1329030.16990.148212.8%+7.5%+9.9%32.4100~iter 20
GSE1220630.10950.093114.9%+11.8%+13.8%29.698~iter 25
Table 3. Stratified five-fold cross-validation results per fold for GSE33000, GSE132903, and GSE122063, reporting accuracy, balanced accuracy, selected probes, SMOTE status, and NPO convergence fitness, with mean ± std summary rows.
GSE33000—Per-Fold Results.
FoldAccuracy (%)Bal. Accuracy (%)Probes SelectedSMOTEConv. Fitness
Fold 178.4078.4225Yes0.1871
Fold 284.0083.9927Yes0.1833
Fold 388.0087.9933Yes0.1985
Fold 488.0088.0829Yes0.1763
Fold 587.9087.9033Yes0.2019
Mean ± Std85.26 ± 3.7685.28 ± 3.7629.4 avg0.1894
GSE132903—Per-Fold Results.
FoldAccuracy (%)Bal. Accuracy (%)Probes SelectedSMOTEConv. Fitness
Fold 189.7489.8727Yes0.1446
Fold 289.7489.7431Yes0.1504
Fold 389.7489.7434Yes0.1606
Fold 482.0582.1138Yes0.1399
Fold 584.6284.3432Yes0.1458
Mean ± Std87.18 ± 3.2487.16 ± 3.2932.4 avg0.1482
GSE122063—Per-Fold Results.
FoldAccuracy (%)Bal. Accuracy (%)Probes SelectedSMOTEConv. Fitness
Fold 1100.00100.0031Yes0.1065
Fold 2100.00100.0025Yes0.0871
Fold 396.3097.2237Yes0.0934
Fold 496.3097.2231Yes0.0898
Fold 588.8988.8924Yes0.0887
Mean ± Std96.30 ± 4.0696.67 ± 4.0829.6 avg0.0931
(GSE63060 + GSE63061—10 Repeats, RSKF 5 × 10).
RepeatBalAcc (%)MCI Recall (%)Mean GenesBatch/CV
159.9873.645.26Z-score; RSKF
258.3057.655.26
362.1767.145.26
459.5261.155.26
559.7866.235.26
659.0063.275.26
759.6958.685.26
859.6258.195.26
957.6961.695.26
1059.6367.335.26
Mean ± Std59.53 ± 4.2163.50 ± 14.025.26n = 478; 285 AD; 193 MCI
Table 4. Comprehensive performance metrics (mean ± std, five folds) for three brain-tissue datasets: accuracy, balanced accuracy, sensitivity, specificity, precision, F1-score, MCC, Cohen’s Kappa, and AUC-ROC.
DatasetAccuracy (%)BalAcc (%)Sensitivity (%)Specificity (%)Precision (%)F1-Score (%)MCCKappaAUC-ROC
GSE33000 (mean ± std)84.4 ± 4.285.3 ± 3.886.2 ± 4.882.5 ± 5.183.2 ± 4.984.6 ± 4.50.6900.6880.863
GSE132903 (mean ± std)86.4 ± 4.286.4 ± 4.287.1 ± 5.285.7 ± 4.886.1 ± 4.686.5 ± 4.70.7300.7290.893
GSE122063 (mean ± std)96.3 ± 4.196.7 ± 4.197.5 ± 5.697.5 ± 5.697.5 ± 5.697.5 ± 5.60.9500.9500.978
DatasetAcc (%)BalAcc (%)F1-MCIMCI-RecMCCKappaAUCGenesCV
GSE63060 + 6306158.7659.53 ± 4.2154.9263.500.1950.1830.55.26RSKF5 × 10
Table 5. Systematic ablation study quantifying the marginal contribution of each HFW-NPO pipeline component across three datasets. Avg ΔBalAcc reports mean balanced accuracy degradation relative to the full pipeline configuration.
ConfigurationComponent RemovedGSE33000
BalAcc (%)
GSE132903
BalAcc (%)
GSE122063
BalAcc (%)
Avg
ΔBalAcc
Full HFW-NPONone (reference)85.2887.1696.67
Filter-onlyNPO Wrapper83.6879.8688.42−4.7%
No-Filter (raw)Hybrid Filter77.5876.3688.89−8.8%
No-SMOTEData Augmentation84.0883.9695.68−1.6%
No-Local
Search
Hill Climbing (post)84.1885.4695.90−1.2%
Fisher-onlyMI + Welch Criteria81.9881.8690.29−4.7%
MI-onlyFisher + Welch Criteria81.6881.5593.50−4.3%
Welch-onlyFisher + MI Criteria80.2883.7293.31−4.0%
No-Ensemble (SVM)Voting Ensemble81.6882.0692.40−4.3%
Table 6. Pairwise Cohen’s d and Wilcoxon p-values (HFW-NPO vs. each baseline method, per dataset).
Baseline MethodGSE
33000
d
GSE
33000 p
GSE
132903
d
GSE
132903
p
GSE
122063
d
GSE
122063
p
Filter-only1.030.1883.060.0632.560.125
PSO + Ensemble0.270.8130.740.3131.560.125
GA + Ensemble1.750.1252.050.0632.540.125
RF-baseline2.810.0632.010.0631.710.063
LASSO + Ensemble0.470.6251.230.1880.900.125
Table 7. Biomarker stability analysis across five cross-validation folds for three brain-tissue datasets, reporting the top stable props, notable props and total union gene set size.
DatasetTop Stable Gene (≥60%)Freq.Second StableFreq.Third StableFreq.Total
Stable (≥60%)
Total
Notable (≥40%)
Union Size
GSE33000ILMN_168955280%ILMN_168803380%ILMN_191100780%231483
GSE132903ILMN_1873464100%ILMN_1811921100%ILMN_211847280%1525100
GSE12206345922100%4122660%949460%142098
Table 8. Comparative evaluation of HFW-NPO against 13 published methods across three GEO datasets, reporting balanced accuracy (BalAcc), standard accuracy, selected probes, feature selection strategy, classifier, and publication year.
ReferenceDatasetClassifierFeature SelectionAcc (%)AUCGenesYear
Alshamlan et al. [71]GSE33000SVMmRMR/F-score~84N/R20–402023
Mahendran et al. [72]GSE5281SVM + IDBNmRmR + WPSO + AE92.9N/RN/R2021
Abdelwahab et al. [73]GSE122063CNN (PCA-CNN)PCA/SVD96.60N/RN/R2023
Sun et al. [74]GSE132903Random Forest + ANNRF feature importance91.40.81062022
Aerqin et al. [75]GSE132903Logistic RegressionMulti-filter (RF + DISR)N/R0.868502025
HFW-NPO
(propose)
GSE33000Soft-voting (ET + SVM + LR + RF)Fisher + MI + Welch + NPO85.260.86329.42025
HFW-NPO
(propose)
GSE132903Soft-voting (ET + SVM + LR + RF)Fisher + MI + Welch + NPO87.180.92432.42025
HFW-NPO
(propose)
GSE122063Soft-voting (ET + SVM + LR + RF)Fisher + MI + Welch + NPO96.300.97829.62025
Table 9. Qualitative comparison of HFW-NPO against four competing paradigms across twelve methodological criteria, demonstrating the originality and comprehensiveness of the proposed framework relative to the published literature.
Feature/CriterionHFW-NPO (This Work)Filter + SVM (Single Step)PSO + Ensemble (No Hybrid Filter)CNN/Deep (No Interpretation.)LASSO + Ensemble (Linear Only)
Feature Selection StageHybrid Filter + WrapperFilter onlyWrapper onlyEnd-to-endL1 penalty
Filter CriteriaFisher + MI + Welch (3)Single criterionNoneNoneNone
OptimizerNPO + Local SearchGreedy rankingPSOBackpropagationConvex opt.
Anti-stagnation MechanismAdaptive Lévy + RestartNoneVariesDropoutNone
Ensemble ArchitectureFive-member soft-votingSingle SVMVariesFC layersEnsemble
SMOTE StrategyIntra-fold (no leakage)Often globalVariesNot neededOften global
Data Leakage PreventionFull (filter inside CV)PartialPartialFullPartial
ReproducibilityFive-fold × fixed seed 42VariesVariesVariesVaries
InterpretabilityGene IDs + frequenciesGene IDsGene IDsNone (black box)Coef. signs
Multi-dataset ValidationFour datasets1–21–21–21–2
Datasets (brain + blood)GSE33000 + GSE132903 + GSE122063 + GSE63060 + GSE63061SubsetSubsetSubsetSubset
Target: AD vs. MCIGSE63060 + GSE63061 (merged)RarelyRarelyRarelyRarely
Disclaimer/Publisher’s Note: The statements, opinions and data contained in all publications are solely those of the individual author(s) and contributor(s) and not of MDPI and/or the editor(s). MDPI and/or the editor(s) disclaim responsibility for any injury to people or property resulting from any ideas, methods, instructions or products referred to in the content.