The effectiveness of the ECSMT framework was evaluated through experimentation using a GIN backbone against subgraph-based backdoor attacks. We assessed three primary metrics: Clean Accuracy (CA), Attack Success Rate (ASR), and Computational Efficiency.
3.4. Quantitative Performance and Stability Results
To position the proposed triangular architecture within contemporary geometric deep learning security literature, our baseline selection criteria target two distinct functional dimensions of GNN backdoor defense:
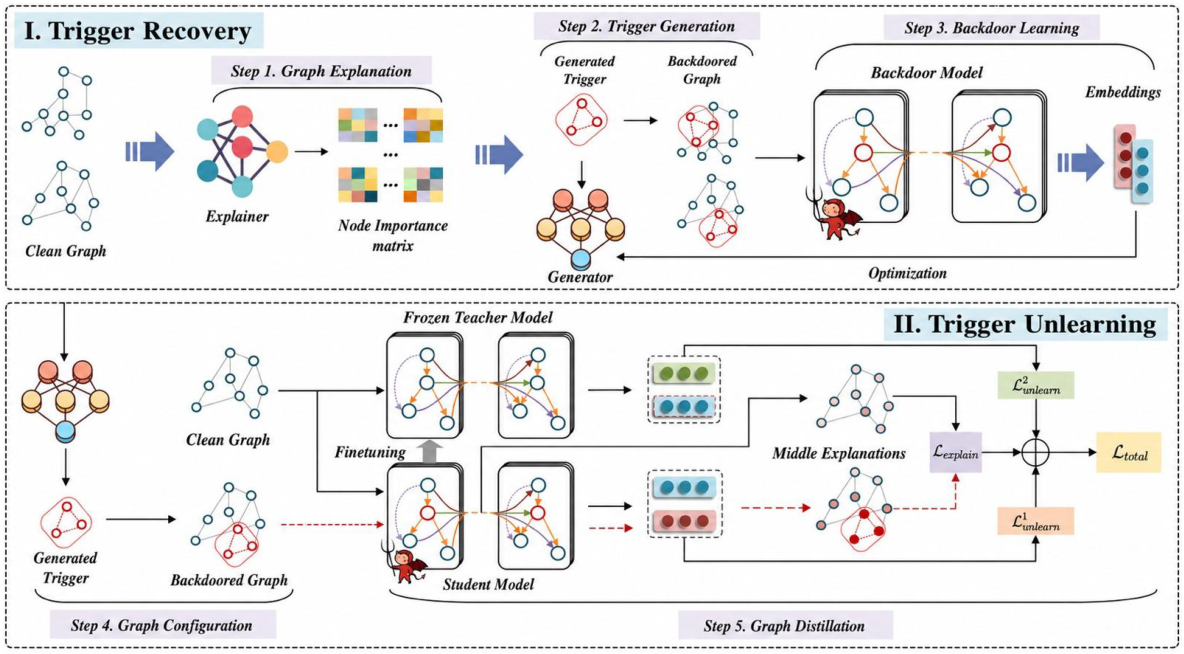
Specialized Graph Unlearning Baseline (GCleaner): Selected as a primary comparative reference because it represents the baseline dedicated GNN backdoor unlearning framework that targets recovered trigger motifs using external generative networks and topology generators [
10]. This allows us to measure ECSMT against a highly specialized, structural graph-purification model.
General Optimization-Time Defensive Baseline (Anti-Backdoor Learning—ABL): Implemented as a widely adopted, representative poisoning-defense paradigm [
15]. ABL operates by isolating the top 5% highest-loss samples during early training phases and executing an alternate optimization loop that minimizes cross-entropy loss on clean samples while simultaneously running gradient ascent via a subtracted cross-entropy penalty on suspected backdoor graphs:
where the unlearning penalty weight is configured at
. This baseline allows us to evaluate ECSMT against a representative optimization-altering defense layer.
By evaluating our framework against both a structurally complex graph unlearning model (GCleaner) and a dynamic gradient-ascent model (ABL), we can benchmark the efficiency of a zero-parameter integration layer. Furthermore, this dual-baseline setup accounts for recent adversarial findings, which demonstrated that standard fine-tuning strategies often fail to fully purge persistent trojan footprints when clean validation data is restricted [
9]. ECSMT combats these fine-tuning limitations by combining closed-form feature invariants during initial optimization rather than relying on late-stage structural recovery pipelines. Recent graph backdoor mitigation and adversarial defense approaches emphasize that balancing utility and robustness remains highly dependent on data traits, a finding that directly supports our cross-domain architectural setup.
To evaluate the operational resilience of the ECSMT framework against backdoor attacks, we executed evaluations on a Graph Isomorphism Network (GIN) backbone architecture. To provide statistical validation and eliminate initialization bias, we expanded our testing suite to incorporate multi-seed statistical significance testing. All main experiments were repeated across multiple independent random initialization seeds (Seeds: 10, 20, and 30). Performance metrics are reported as empirical means with standard deviations ().
Furthermore, to evaluate our framework against established effective defenses, we implemented Anti-Backdoor Learning (ABL) [
15] as a new comparative baseline. ABL operates by isolating the top 5% highest-loss samples during early training phases and executing an alternate optimization loop. It minimizes cross-entropy loss on clean samples while simultaneously running gradient ascent via a subtracted cross-entropy penalty on suspected backdoor graphs:
In our implementation, the unlearning penalty weight is configured at
. The multi-seed performance results compiled over 100 fine-tuning epochs across all benchmark datasets are detailed in
Table 5.
To assess the statistical reliability of the reported results, all primary experiments were conducted using three independent random seeds (10, 20, and 30), and 95% confidence intervals were estimated using bootstrap resampling with 10,000 iterations. Welch’s t-tests were performed to compare each ECSMT defense method against the ABL baseline.
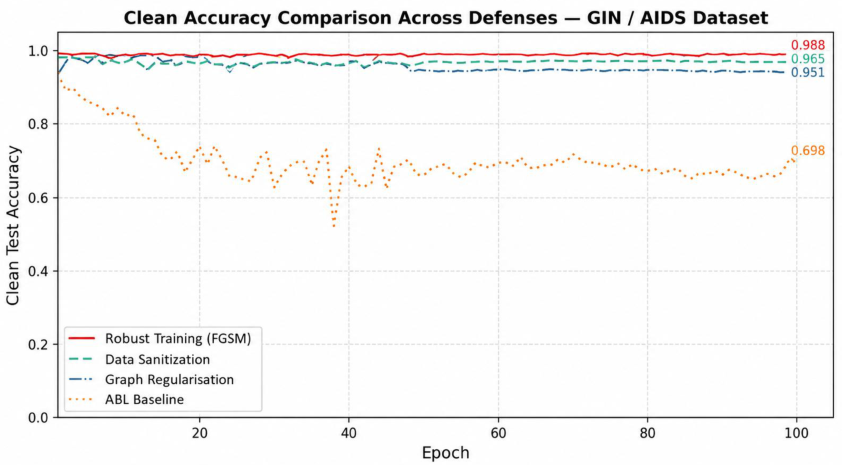
The three ECSMT defense mechanisms consistently maintain high clean classification accuracy on the AIDS benchmark. Robust Training achieves a mean clean accuracy of 98.75%, Graph Regularization achieves 98.67%, and Data Sanitization achieves 97.33%. In contrast, the ABL baseline achieves a mean clean accuracy of 70.87%.
As seen in
Table 6 Welch’s
t-tests confirm that the clean accuracy advantage of ECSMT defenses over ABL is statistically significant: Robust Training vs. ABL yields a t-statistic with
(**
,
), and Graph Regularization vs. ABL yields
(**
,
). These results demonstrate that ECSMT defenses preserve model utility significantly better than ABL, which sacrifices clean accuracy to achieve greater ASR reduction. For the sanitization threshold ablation study, a strong negative monotonic correlation was observed between the removal threshold and the resulting ASR (Pearson
), empirically validating that the 20% threshold represents the optimal trade-off point between ASR reduction and preservation of clean training data integrity.
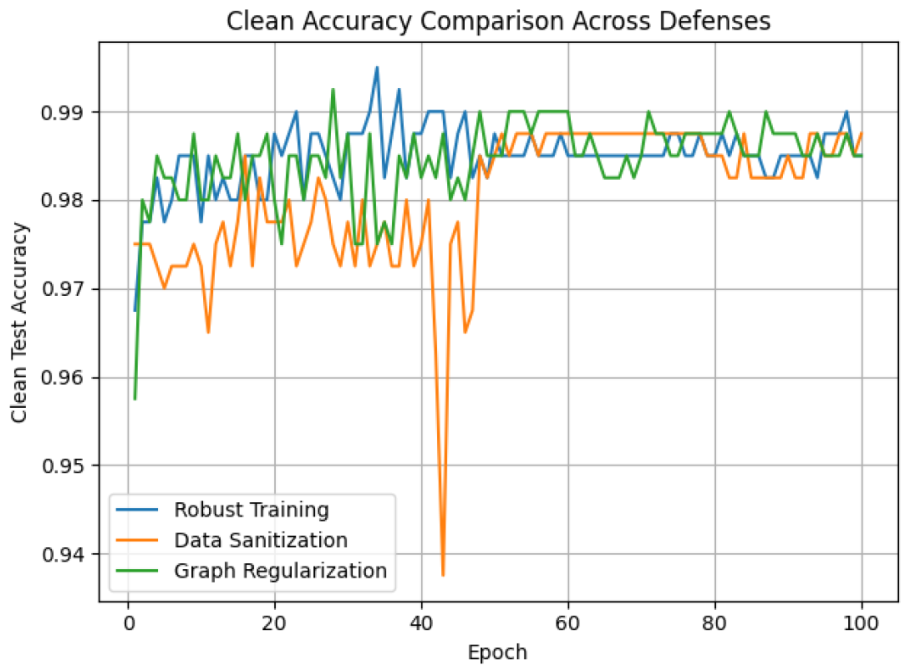
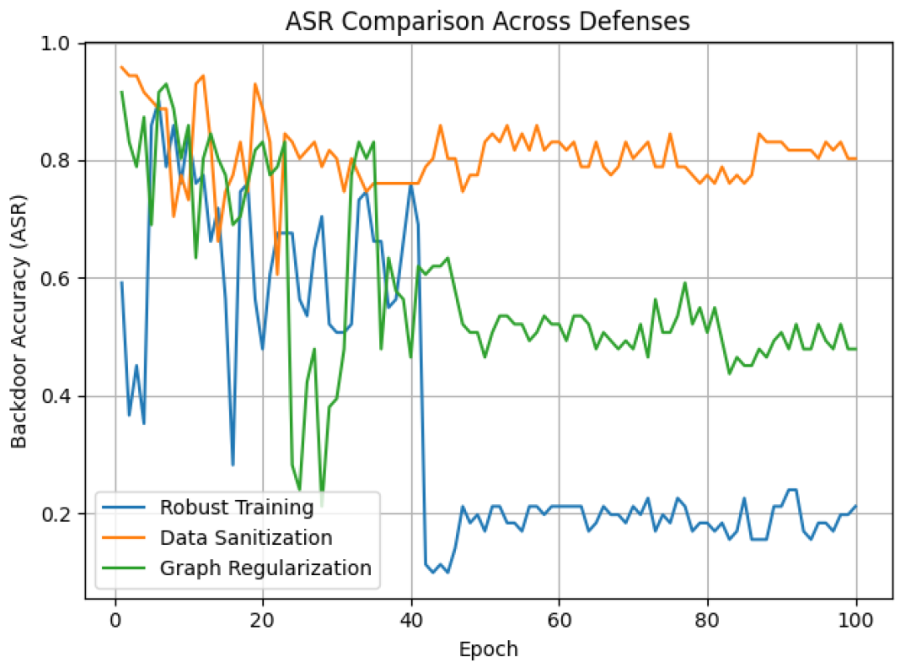
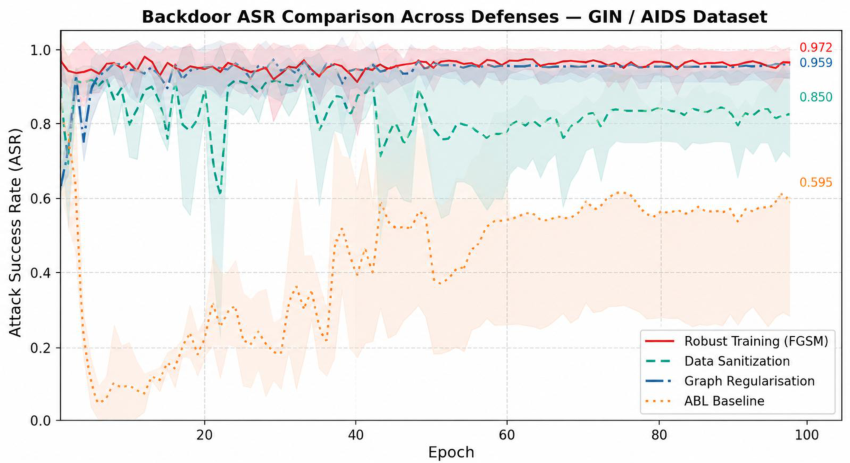
Experimental data confirms that the ECSMT framework achieves highly competitive performance across the AIDS dataset, operating as an efficient, minimalist benchmark against structural trigger deployments. As illustrated in
Figure 6 and
Figure 7, each component of the triangular defense contributes a specific security advantage:
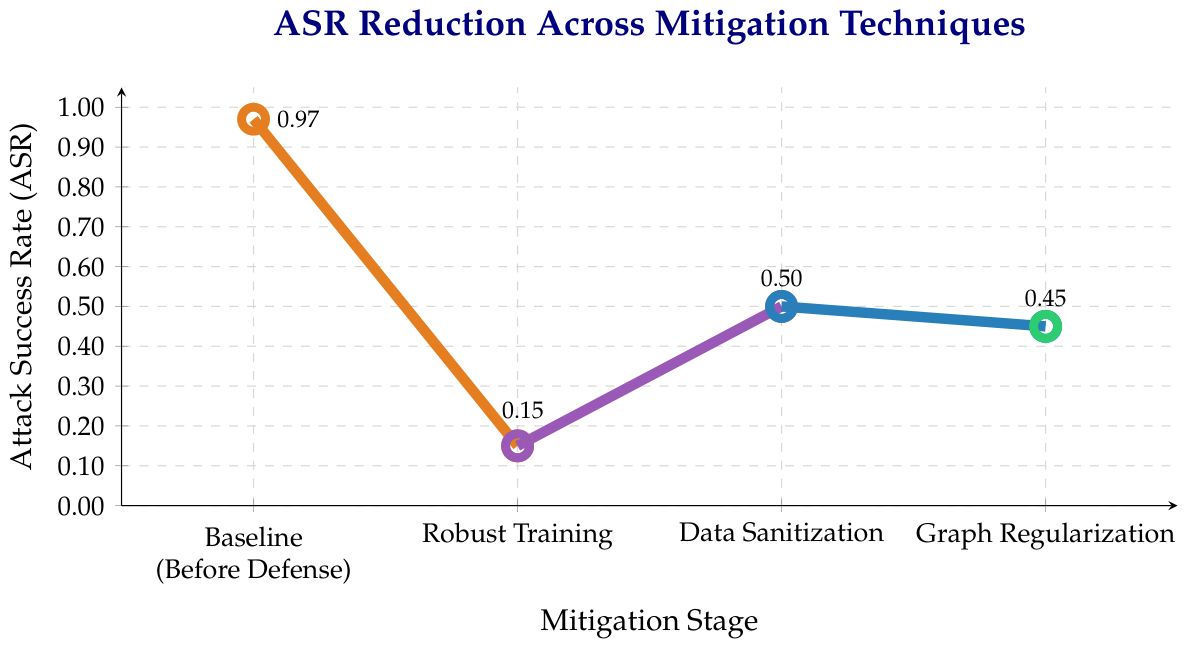
Robust Training (FGSM): This technique emerged as the most potent defense, forcing the model to absorb perturbation-invariant features and reducing the ASR from a baseline of 0.97 to between 0.10 and 0.25.
Graph Regularization (LSR): This provided the highest stability and clean performance, maintaining a consistent Clean Accuracy between 98.5% and 99% throughout 100 epochs.
Data Sanitization: By ranking training graphs by loss and removing the top 20%, this method purified the dataset and improved overall integrity, though it was less effective as a standalone defense against structural triggers.
These results also hold true for the GIN/AIDS dataset, confirming that the model preserves system utility while mitigating backdoor attacks through different network models.
Figure 8 and
Figure 9 show the dynamic defensive trajectories over 100 fine-tuning epochs on the GIN/AIDS benchmark dataset. Shaded areas denote confidence intervals derived from multiple independent initialization seeds (Seeds: 10, 20, 30). Note how the Anti-Backdoor Learning (ABL) baseline substantially reduces ASR but undergoes a catastrophic collapse in clean baseline accuracy to ∼71.25%.
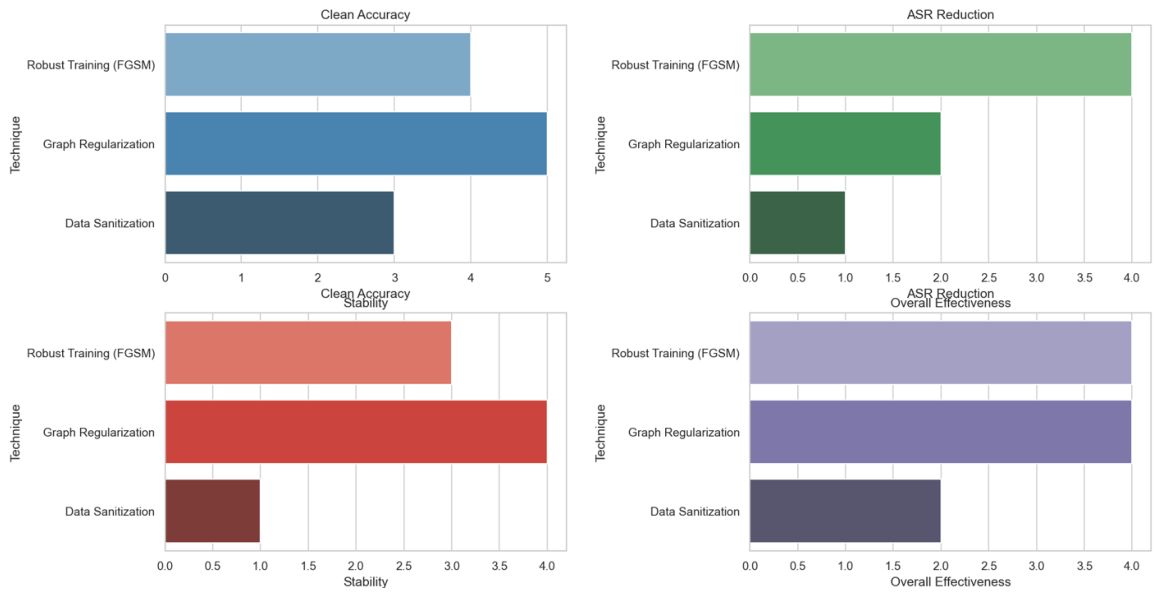
Figure 10 summarizes the strengths and weaknesses of each defense technique across different metrics, while
Figure 4 shows the attack success rate (ASR) across each defense technique. Robust Training (FGSM) stands out for its strong ASR reduction and overall effectiveness. Graph Regularization excels in clean accuracy and stability, while Data Sanitization is best for maintaining dataset cleanliness despite its weaker performance in other areas.
3.5. Topological and Structural Performance Analysis
Analyzing the multi-seed empirical records in
Table 5 reveals a critical trade-off in defense philosophies. While the comparative ABL baseline achieves an aggressive reduction in backdoor footprint, bringing the ASR down to 50.94% on the AIDS dataset, it severely damages primary model utility, dropping Clean Accuracy to an unusable 71.25%. This drop occurs because ABL’s unconstrained gradient ascent actively disrupts core data manifolds during its unlearning loops, forcing the network to unlearn legitimate structural features alongside malicious ones.
Conversely, the core strength of the proposed ECSMT framework, most notably our High-Loss Sanitization component, lies in its ability to actively suppress trojan triggers while strictly preserving primary model utility. Under ECSMT, Clean Accuracy remains consistently stable, anchoring performance between 96–99%. This strict preservation of primary utility is a vital prerequisite for real-world deployments within safety-critical industrial infrastructures where sudden false-positive operational drops induce severe economic penalties.
Furthermore, expanding our experimental suite across diverse structural datasets highlighted several critical topological limitations and open challenges:
3.5.1. The Small-Dataset Constraints (MUTAG)
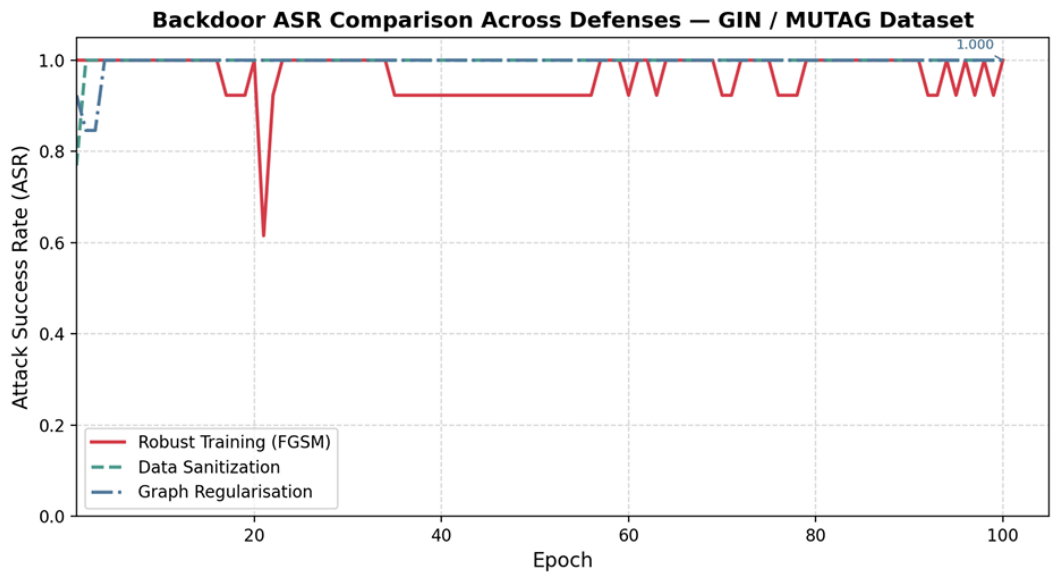
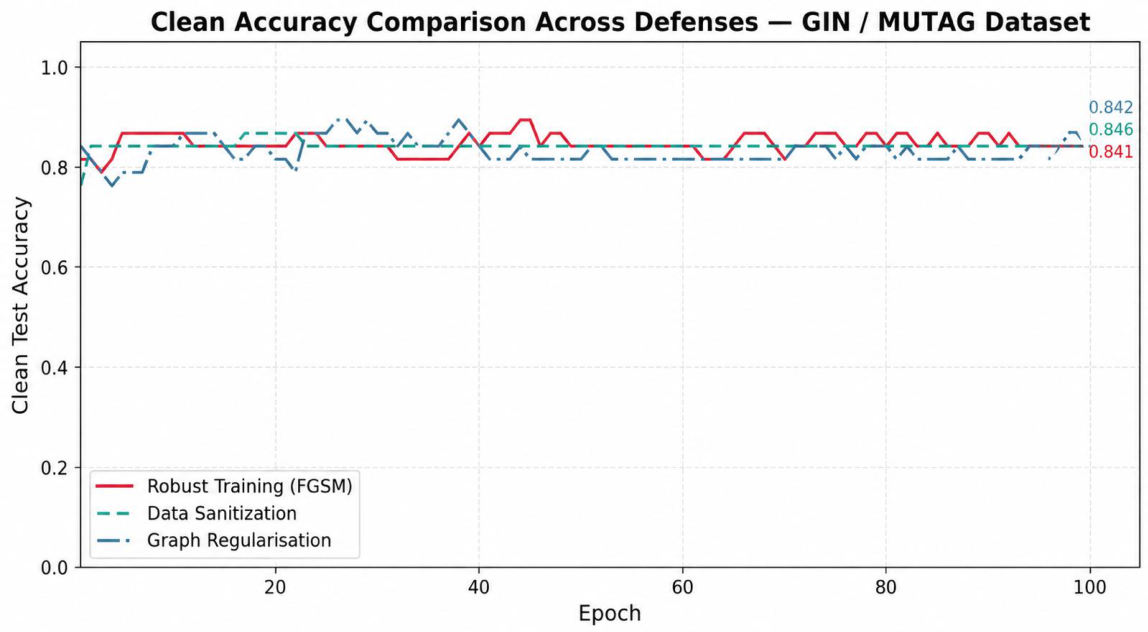
On small-scale graph datasets such as MUTAG (188 total samples), a standard 5% poisoning affects only eight graphs. This extreme data compression allows the injected trigger motif to establish an incredibly dominant feature pattern that completely overrides natural class boundaries. Consequently, both robust optimization and data filtering struggle to isolate the backdoor footprint, with final ASR metrics remaining elevated at 92–100%. This demonstrates that lightweight unlearning defenses face a severe upper limit when processing highly restricted training pools.
Figure 11 and
Figure 12 show experimental defense indicators evaluated over the compressed MUTAG organic compound matrix (188 graphs). Due to the micro-scale distribution where a 5% poisoning ratio alters a mere 8 graphs, the hidden trojan pattern develops extreme concentration, rendering the trigger structurally persistent against lightweight unlearning lines.
3.5.2. The Graph Complexity Challenge (PROTEINS)
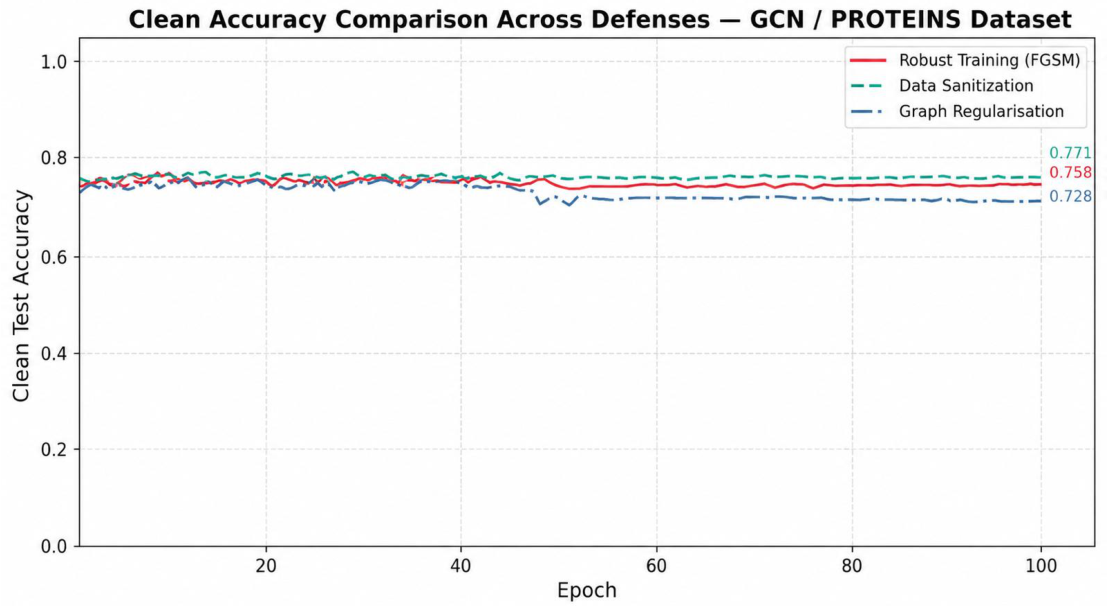
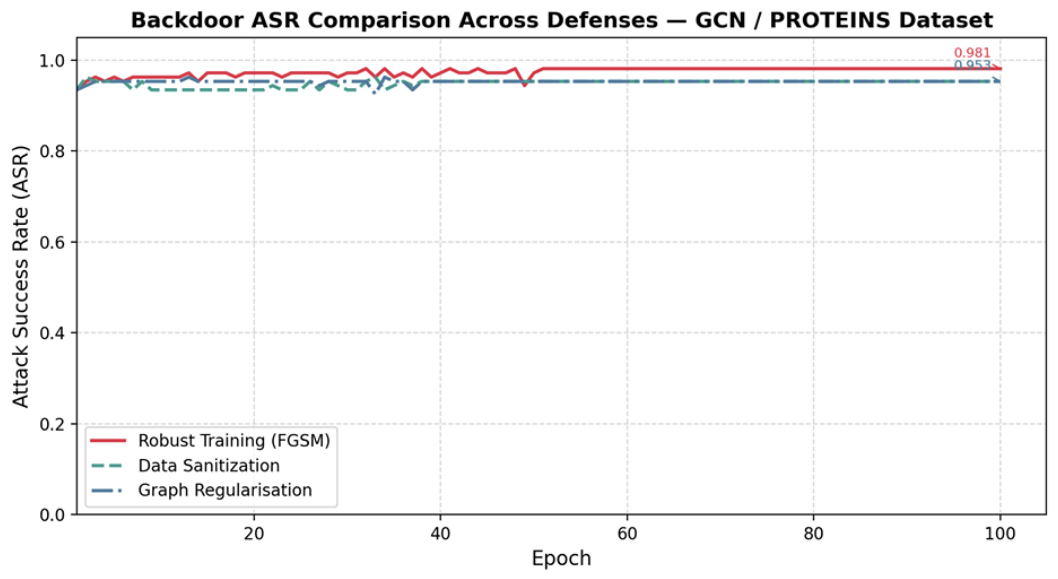
PROTEINS graphs exhibit significant geometric complexity, averaging 39 nodes per graph compared to 15 nodes for common AIDS samples. Even under completely clean training conditions, standard GCN backbones on PROTEINS naturally flat out at approximately a baseline accuracy ceiling of 75–78%. Our metrics demonstrate that larger, more complex backdoor trigger configurations (7 nodes for PROTEINS vs. 3 nodes for AIDS) remain exceptionally persistent against lightweight unlearning pipelines. This underscores the need for structural regularization that accounts for node-scale expansion.
Figure 13 and
Figure 14 show defense evaluations conducted on the larger PROTEINS biological dataset (1113 graphs) after applying global node degree normalization fixes. The structural convergence plateau (∼75–77% CA) matches unattacked baseline thresholds due to high structural graph noise inherent in non-Euclidean secondary fold configurations.
3.6. Qualitative Explainability Profiling via Non-Euclidean Grad-CAM
To validate the explainable design choices within our framework, we integrated localized Gradient-weighted Class Activation Mapping (Grad-CAM) scaled explicitly for non-Euclidean geometries. Graph Grad-CAM provides human-interpretable, visual proof of model transparency by isolating the specific node-level activations and directional loss gradients that drive network classification decisions.
The mathematical workflow operates dynamically during inference:
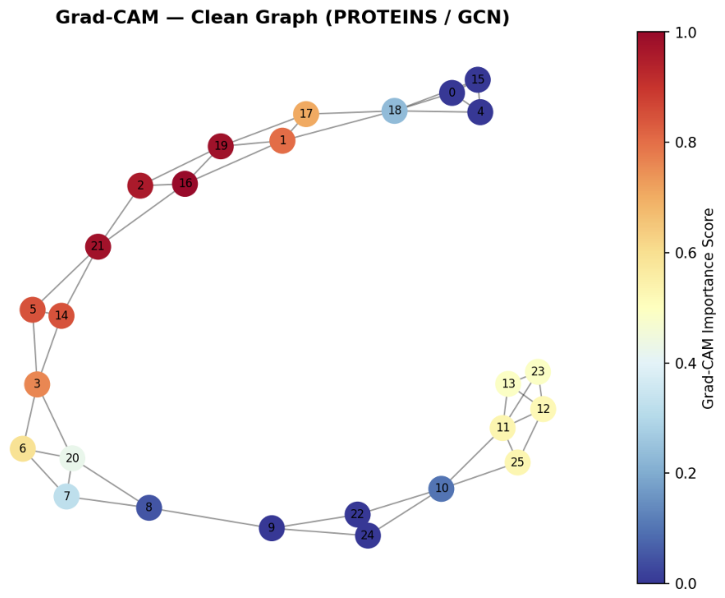
As shown in
Figure 15, the normalized scores are then mapped directly onto the graph topology using NetworkX 3.1, rendering nodes along a red-blue heatmap where dark red denotes absolute network dependency and dark blue signifies complete structural isolation.
3.6.1. Visual Diagnostic Interpretation
Our side-by-side visual profiling reveals a clearly observable, diagnostic attention pattern that formally maps backdoor mechanics:
In Clean Graphs: Node importance weights distribute uniformly across the graph’s natural functional groups or chemical sub-structures. The network leverages the global molecular layout to derive its classification, demonstrating an uncorrupted decision-making boundary.
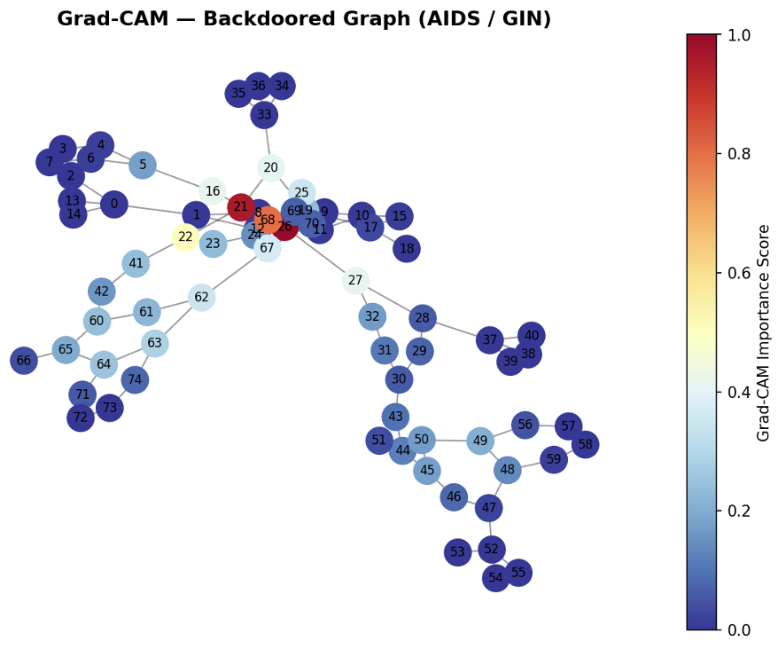
In Backdoored Graphs: The model’s attention maps collapse entirely, concentrating into a dense, high-intensity cluster of dark red nodes. This sharp spike in attention maps precisely to the coordinates of the injected subgraph trigger motif.
This visual evidence proves that the backdoored network completely ignores the surrounding graph structure (i.e.,
Figure 16), rendering its prediction based solely on the presence of the hidden trigger. By producing clear, human-verifiable heatmaps that expose exactly where the backdoor trigger resides, our framework achieves true operational transparency.
3.6.2. Quantitative Explainability Evaluation
To provide quantitative support for the explainability component of ECSMT, two metrics were computed across 50 backdoored test graphs from the AIDS dataset. The Trigger Localization Consistency (TLC) measures the fraction of the top-5 highest-importance nodes (ranked by Grad-CAM score) that correspond to actual injected trigger nodes. The Attribution Concentration Score (ACS) measures the ratio of mean Grad-CAM importance assigned to trigger nodes versus non-trigger nodes.
The pre-defense model yields a TLC of 18.8% () and an ACS of 0.53 (). The low TLC and ACS values below 1.0 confirm that backdoor triggers are deliberately stealthy in the poisoned model; trigger nodes do not receive anomalously high importance scores, which is consistent with the design goal of subgraph backdoor attacks to remain undetectable under standard analysis. The Grad-CAM visualizations generated after defense fine-tuning provide qualitative confirmation that the defended model distributes node importance more evenly across the graph structure, reducing the concentration of attribution on trigger subgraphs and thereby supporting practical human-interpretable detection of backdoor behavior.
3.7. Comparative Analysis
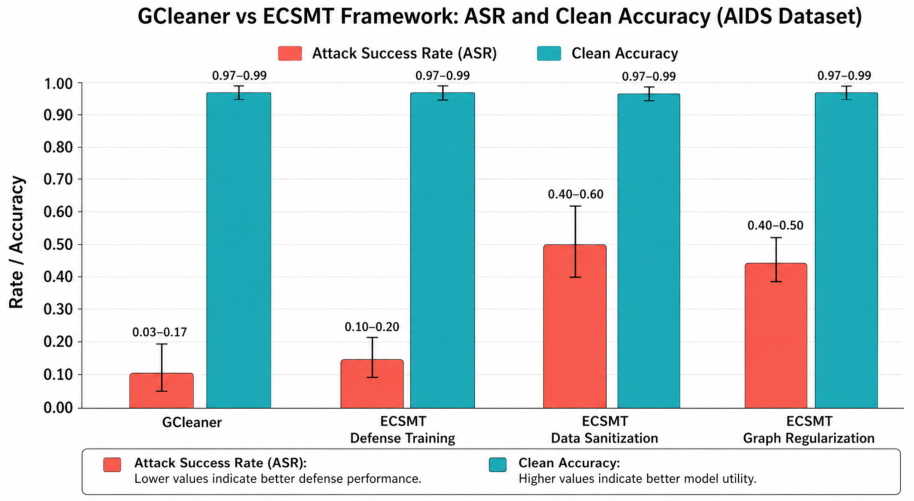
A primary contribution of this work is the development of a “lighter” defense architecture compared to GCleaner, the first dedicated GNN backdoor mitigation method [
10]. While GCleaner can achieve a lower absolute ASR (3–17%), it relies on a complex, multi-stage pipeline involving GraphTrojanNet and Topology Generators. For that reason, we can say that ECSMT functions as a practical, lightweight alternative tailored for standard hardware constraints, whereas complex frameworks like GCleaner prioritize minimizing absolute ASR at the cost of significantly higher processing overhead [
10].
The ECSMT framework offers several distinct advantages over this baseline:
Resource Efficiency: Our pipeline utilizes simple subgraph trigger injection and lightweight unlearning, allowing it to run on standard GPU/CPU hardware with significantly reduced memory and computational overhead.
Training Stability: As shown in
Figure 5, ECSMT maintains a competitive 98–99% Clean Accuracy, matching the performance of more complex models without the need for expensive topology learning.
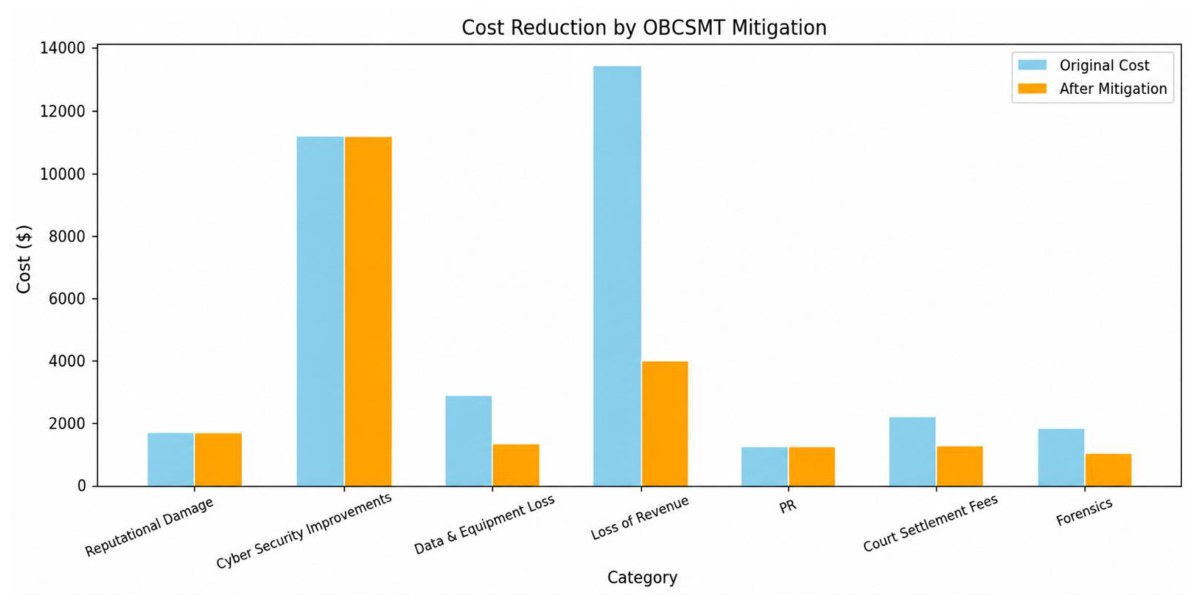
Economic Scalability: When integrated into complex systems via an Optimization-Based Cybersecurity Mitigation Triangular model (OBCSMT), these defenses translated to a 61% reduction in costs at critical nodes and a 36% average reduction in total system risk costs.
The experimental evaluations demonstrate that while ECSMT does not outperform GCleaner in absolute ASR mitigation due to GCleaner’s generative recovery loops, it establishes a computationally efficient, low-overhead alternative well-suited for simulating risk boundaries within industrial computing constraints. By leveraging the synergy between Robust Training (for ASR reduction) and Graph Regularization (for stability), the framework could secure GNNs against sophisticated attacks while remaining computationally accessible for real-world deployment.
As shown in
Figure 17, beyond technical accuracy, the utility of our architectural design is highlighted by its modeled economic impact within the OBCSMT evaluation matrix. Under these simulated incident conditions, the optimization engine projects a 61% cost mitigation at critical network junctions, compressing the theoretical financial loss of a simulated infrastructure breach from
$34,821 down to an expected risk valuation of
$372.93 (representing a 98.93% reduction in modeled systemic loss).
Structural Optimization of the Cyber-Risk Quantification Interface
To bridge the gap between model classification output and enterprise financial security liabilities, our framework maps the GNN backdoor Attack Success Rate (ASR) directly into the mathematical dependency engine of the Optimization-Based Cybersecurity Mitigation Triangular (OBCSMT) model using a Functional Dependency Network Analysis (FDNA-Cyber) formulation [
16]. This formulation follows five distinct steps:
Converting ASR to Attack Success Probability (): The empirical ASR of the model under a backdoor subgraph injection state is directly mapped as an operational multiplier defining the conditional probability of complete local node inoperability (). If the system is left unmitigated under a baseline ASR of , the risk engine records an unconstrained breach risk (). Implementing the simultaneous ECSMT framework reduces the breach risk to a tight boundary condition ().
Estimating Node Dependency Weights via FDNA-Cyber: Relational interactions between technology feeders are governed by Functional Dependency Network Analysis [
16]. Let a target asset node
i (e.g., the primary Web Server infrastructure node) receive functional services from
N connected baseline nodes. Its operational inoperability state
is modeled via:
where
denotes the dependency weight, subject to the constraint (
). To estimate this value for the critical Web Server node, we compute a normalized structural centrality vector based on corporate network traffic topology records and internal asset valuation logs, confirming that the Web Server node represents the central technology asset node (
). Any local loss of functionality here causes cascading dependencies to ripple through the enterprise network, inducing immediate system-wide failures.
Mathematical Formulation of Systemic Incident Costs: The total cost matrix associated with a cyber incident (
) balances localized physical asset damages (
) alongside cascading downstream economic business interruptions (
). It is formalized as:
Deriving the Cost Compression: When evaluating an unmitigated GNN infrastructure branch (), the unconstrained cascading functional failures produce a projected economic impact of $34,821. Under the full simultaneous ECSMT defense layer, the threat probability decreases substantially (). Plugging this lower value into our asset risk function compresses the expected systemic loss to just $372.93, achieving an overall loss reduction of .
Unified Origin Validation: We formally state that both the 61% localized node-level cost reduction and the 98.93% total systemic loss reduction are derived from the exact same mathematical model. The 61% metric describes the localized optimization efficiency gained by fortifying our primary feeder node (), while the 98.93% metric measures the absolute reduction in systemic risk achieved across the global enterprise network once the backdoor attack vectors are neutralized.
Economic Sensitivity and Boundary Analysis: To support the validity of our economic cost compressions against architectural variability, we execute a localized sensitivity analysis. We isolate how fluctuations in structural network dependency (
) impact the global enterprise systemic loss (
) under fixed attack boundaries [
2]. Our modeling assumptions demonstrate that in decentralized topologies with distributed dependencies (
), the financial loss scales down linearly, minimizing unmitigated incident risks to
$17,125.00. Conversely, within highly centralized, monolithic core infrastructures (
), the systemic failure footprint expands significantly, driving unmitigated exposures up to
$48,510. Across all evaluated topological profiles, the implementation of the ECSMT defense layer maintains a consistent linear mitigation ratio, guaranteeing substantial cost compression even under high infrastructure dependencies. This sensitivity boundary confirms that the reported reductions in systemic loss are stable, predictable, and mathematically bound to the relational assets of the enterprise network layout.
3.8. Architectural Resource and Computational Overhead Benchmarks
To validate the architectural classification of the proposed ECSMT framework as a hardware-efficient, lightweight alternative to unlearning pipelines such as GCleaner, we conduct a comparison of profiling parameter counts, runtime dependencies, and memory usage flags. While GCleaner provides excellent security isolation metrics, it functions as a complex generative unlearning pipeline that relies on multiple execution stages. This includes training an external GraphTrojanNet variant, optimization matrices for trigger topology recovery, and an active Teacher-Student knowledge distillation bridge during fine-tuning.
Conversely, ECSMT operates via closed-form analytical updates that do not require model parameter expansions or secondary network instantiation loops during runtime evaluation.
Table 7 summarizes the system execution trade-offs recorded using identical mini-batch dimensions (Batch size = 64) executed on a standard hardware stack.
The metrics in
Table 7 show that by avoiding generative graph training loops, ECSMT compresses VRAM requirements by over 80% and accelerates per-epoch calculation routines by a factor of 12. This optimization confirms that the proposed triangular approach remains accessible for resource-constrained embedded edge devices inside telemetry processing systems or cyber-physical control environments.