Article

Galloping Target Tracking and Parameter Measurement Method for Overhead Transmission Lines Based on SAM2 Video Segmentation

State Grid Jiangsu Electric Power Co., Ltd., Electric Power Science Research Institute, Nanjing 211103, China
*
Author to whom correspondence should be addressed.
Electronics 2026, 15(11), 2305; https://doi.org/10.3390/electronics15112305
Submission received: 25 March 2026 / Revised: 10 May 2026 / Accepted: 15 May 2026 / Published: 26 May 2026
(This article belongs to the Special Issue AI Applications for Smart Grid: 2nd Edition)

Abstract

Galloping of overhead transmission lines is a low-frequency, large-amplitude vibration hazard that poses a severe threat to power grid safety, yet existing monitoring approaches fail to simultaneously provide flexible deployment, quantitative measurement, and robustness under severe weather conditions. This paper makes three primary contributions. First, we propose a novel line-structure center adsorption algorithm that converts a single operator touch-point into a sub-pixel-precision conductor prompt, achieving prompt accuracy above 95% with one round of interactive correction. Second, we introduce—for the first time—SAM2’s streaming memory architecture for continuous zero-shot pixel-level tracking of galloping conductors under complex outdoor backgrounds including snow, ice, and poor illumination, achieving a segmentation IoU of 93.8% and zero identity switches over 500 consecutive frames, outperforming XMem (87.4%) and DeAOT (88.9%). Third, we develop a two-stage spatial correction framework combining vanishing-point-based inverse perspective mapping (IPM) with equidistant linear transformation (ELT), which eliminates perspective distortion inherent in non-orthogonal field imaging and enables quantitative measurement of galloping amplitude (error < 0.5 m), frequency (error < 0.1 Hz), and inter-phase spacing (ranging error < 1 m). The complete pipeline is implemented on a portable, tripod-mounted device (≤15 kg) integrating a monocular camera, laser rangefinder, and high-precision PTZ gimbal. Field validation at three 110/500 kV sites in Jiangsu Province under extreme winter conditions ( 4 °C, Level 5 wind, continuous snowfall) confirms engineering-grade accuracy and practical robustness, providing a viable technical pathway for real-time non-contact galloping monitoring and disaster early warning.

1. Introduction

Galloping of overhead transmission lines is a low-frequency (0.1–3 Hz), large-amplitude (several meters to tens of meters) self-excited vibration phenomenon caused by the combined effects of eccentric ice accretion and strong wind acting on conductors [1,2]. Eccentric icing changes the aerodynamic characteristics of the conductor cross-section. Under certain wind speeds (4–20 m/s), negative damping effects occur, continuously accumulating energy and eventually triggering galloping [3]. Once galloping occurs, it can lead to serious accidents such as conductor strand breakage, hardware damage, phase-to-phase flashover tripping, and even tower collapse, posing a significant threat to power grid safety [4]. In recent years, influenced by global climate warming, extreme weather events have become more frequent and severe. According to the China Climate Change Blue Book (2023), the warming rate in China has exceeded the global average, and the climate risk index continues to increase [5]. Icing-induced galloping disasters have spread significantly from traditional high-risk regions such as Hubei, Henan, and Liaoning to historically low-risk areas. Between 2023 and 2024, Jiangsu Province experienced three consecutive rounds of rain–snow freezing weather, causing icing galloping events on multiple transmission lines, whereas no such disasters had occurred there during the previous decade [6]. The urgency of effective galloping monitoring is therefore continuously increasing.
Current galloping monitoring of overhead transmission lines mainly relies on three approaches, each with significant limitations. Manual inspection relies on visual estimation by patrol personnel, which has low accuracy, high subjective error, and considerable safety risks under severe weather conditions [7]. Online sensors such as inertial measurement units and differential GPSs can achieve real-time monitoring, but must be installed on energized conductors during power outages, resulting in high procurement and maintenance costs and susceptibility to electromagnetic interference [8,9]. Video analysis methods based on fixed tower-mounted cameras can utilize existing equipment, but can only qualitatively determine whether galloping occurs and cannot accurately quantify galloping frequency and amplitude [10]. Overall, existing methods lack a monitoring solution that simultaneously provides flexible deployment, high-precision quantitative measurement, and portability.
Deep learning has achieved rapid development in the visual inspection of transmission lines, with the YOLO series widely applied in defect identification [11,12] and semantic segmentation networks such as U-Net used for line region extraction [13]. However, most of these studies focus on single-frame detection in static images; continuous video-level tracking for galloping—a low-frequency, large-amplitude, long-duration dynamic process—remains largely unaddressed. In 2024, Meta released the Segment Anything Model 2 (SAM2), which introduces a streaming memory architecture supporting real-time video object segmentation and cross-frame tracking, significantly outperforming previous methods on several zero-shot benchmarks [14]. Despite this progress, as detailed in Section 2, existing studies treat target detection, morphological segmentation, and dynamic parameter calculation as separate stages, and no integrated “segmentation–tracking–measurement” solution specifically designed for low-frequency, large-span conductor galloping currently exists.
To address these gaps, this paper raises and answers three core research questions. (RQ1) Can SAM2’s zero-shot generalization and streaming memory enable robust pixel-level tracking of galloping conductors in complex outdoor environments without domain-specific retraining? (RQ2) How can a lightweight operator-in-the-loop initialization strategy balance deployment flexibility with prompt precision for slender, deformable conductor targets? (RQ3) How can 2D pixel-level measurements be accurately converted to physical 3D galloping parameters using a portable, low-cost multi-sensor system? To answer these questions, an end-to-end technical pipeline of “point-adsorption initialization → SAM2 segmentation tracking → refined contour extraction → multi-parameter fusion calculation” is proposed, achieving high-precision non-contact measurement of galloping amplitude, frequency, and inter-phase spacing. It should be noted that the primary novelty of this work lies not in the development of a new segmentation algorithm, but in the purposeful integration of SAM2’s zero-shot streaming memory, a domain-specific prompt engineering strategy, and a joint IPM+ELT spatial correction framework into a coherent, field-deployable system—an integration that, to the best of our knowledge, has not been previously demonstrated for transmission line galloping monitoring.
The remainder of this paper is organized as follows. Section 2 reviews related work on galloping monitoring, visual perception for transmission targets, and video object tracking. Section 3 describes the proposed method in detail. Section 4 presents experimental results and analysis. Section 5 provides a discussion of the results. Section 6 concludes the paper.

2. Related Work

With the integration of sensing technology and artificial intelligence, monitoring technologies for transmission line galloping have made significant progress. The development can be categorized along three aspects.

2.1. Evolution of Galloping Monitoring Methods

Early galloping monitoring relied heavily on contact sensors, such as micro-electromechanical inertial measurement units (IMU), fiber optic strain sensors, and tension sensors [15,16,17]. Although such methods can obtain high-precision physical quantities, they require power outages for installation on transmission lines and have inherent drawbacks including high deployment costs, difficult maintenance, and susceptibility to strong electromagnetic field interference. To overcome these limitations, non-contact visual measurement technologies have gradually become a research focus. Binocular stereo vision and LiDAR can reconstruct three-dimensional spatial information, but the equipment is expensive and the calibration process is complex, making large-scale portable deployment difficult [18]. In contrast, monocular video-based monitoring solutions have demonstrated significant application potential in engineering practice due to their lightweight equipment, flexible deployment, and low cost [19].

2.2. Visual Perception for Transmission Targets

In monocular visual galloping measurement, accurate extraction of conductor targets is the key prerequisite. Traditional methods rely on manually designed feature extraction operators, such as Canny edge detection combined with Hough line transform and NCC template matching [20]. However, outdoor backgrounds including snow cover, vegetation, and variable illumination are extremely complex, and traditional algorithms are prone to false and missed detection, resulting in poor robustness. With the development of deep learning, the YOLO series algorithms have been widely introduced into transmission scenarios, achieving high-precision detection of fittings and conductor targets [21,22]. Recently, vision foundation models represented by the Segment Anything Model (SAM) have pushed fine-grained pixel-level segmentation to new levels with outstanding zero-shot generalization ability, providing a new paradigm for extracting conductors in complex backgrounds without or with weak annotation [23].

2.3. Video Object Tracking Technology

Although the basic version of SAM performs well in single-frame segmentation, it lacks temporal perception capability and cannot directly handle continuously deforming objects in video streams. In 2024, Meta introduced SAM2, which achieved a major architectural breakthrough by introducing a Streaming Memory Architecture. Through a memory bank and memory attention mechanism, it enables zero-shot real-time segmentation and cross-frame continuous tracking of arbitrary targets in video for the first time [14]. Derivative works such as SAM2MOT have further verified the potential of this architecture for multi-object tracking in complex dynamic scenarios [24]. Other advanced video object segmentation methods, including XMem [25] and DeAOT [26], have also demonstrated strong temporal association capabilities through memory-based propagation mechanisms.
In summary, the literature reveals three key gaps that motivate the present work. First, contact-based sensors achieve high accuracy but require power-outage installation and are susceptible to electromagnetic interference, precluding flexible portable deployment. Second, existing non-contact video methods treat detection, segmentation, and parameter estimation as isolated stages, and are limited to qualitative galloping assessment without quantitative measurement. Third, while SAM2 demonstrates outstanding zero-shot segmentation and cross-frame temporal tracking capability, it has not yet been applied to the specific challenge of tracking slender, continuously deforming transmission conductors under complex outdoor backgrounds with low-frequency, large-amplitude galloping dynamics. The present work is specifically designed to fill these three gaps.

3. Method

3.1. Overall Technical Framework

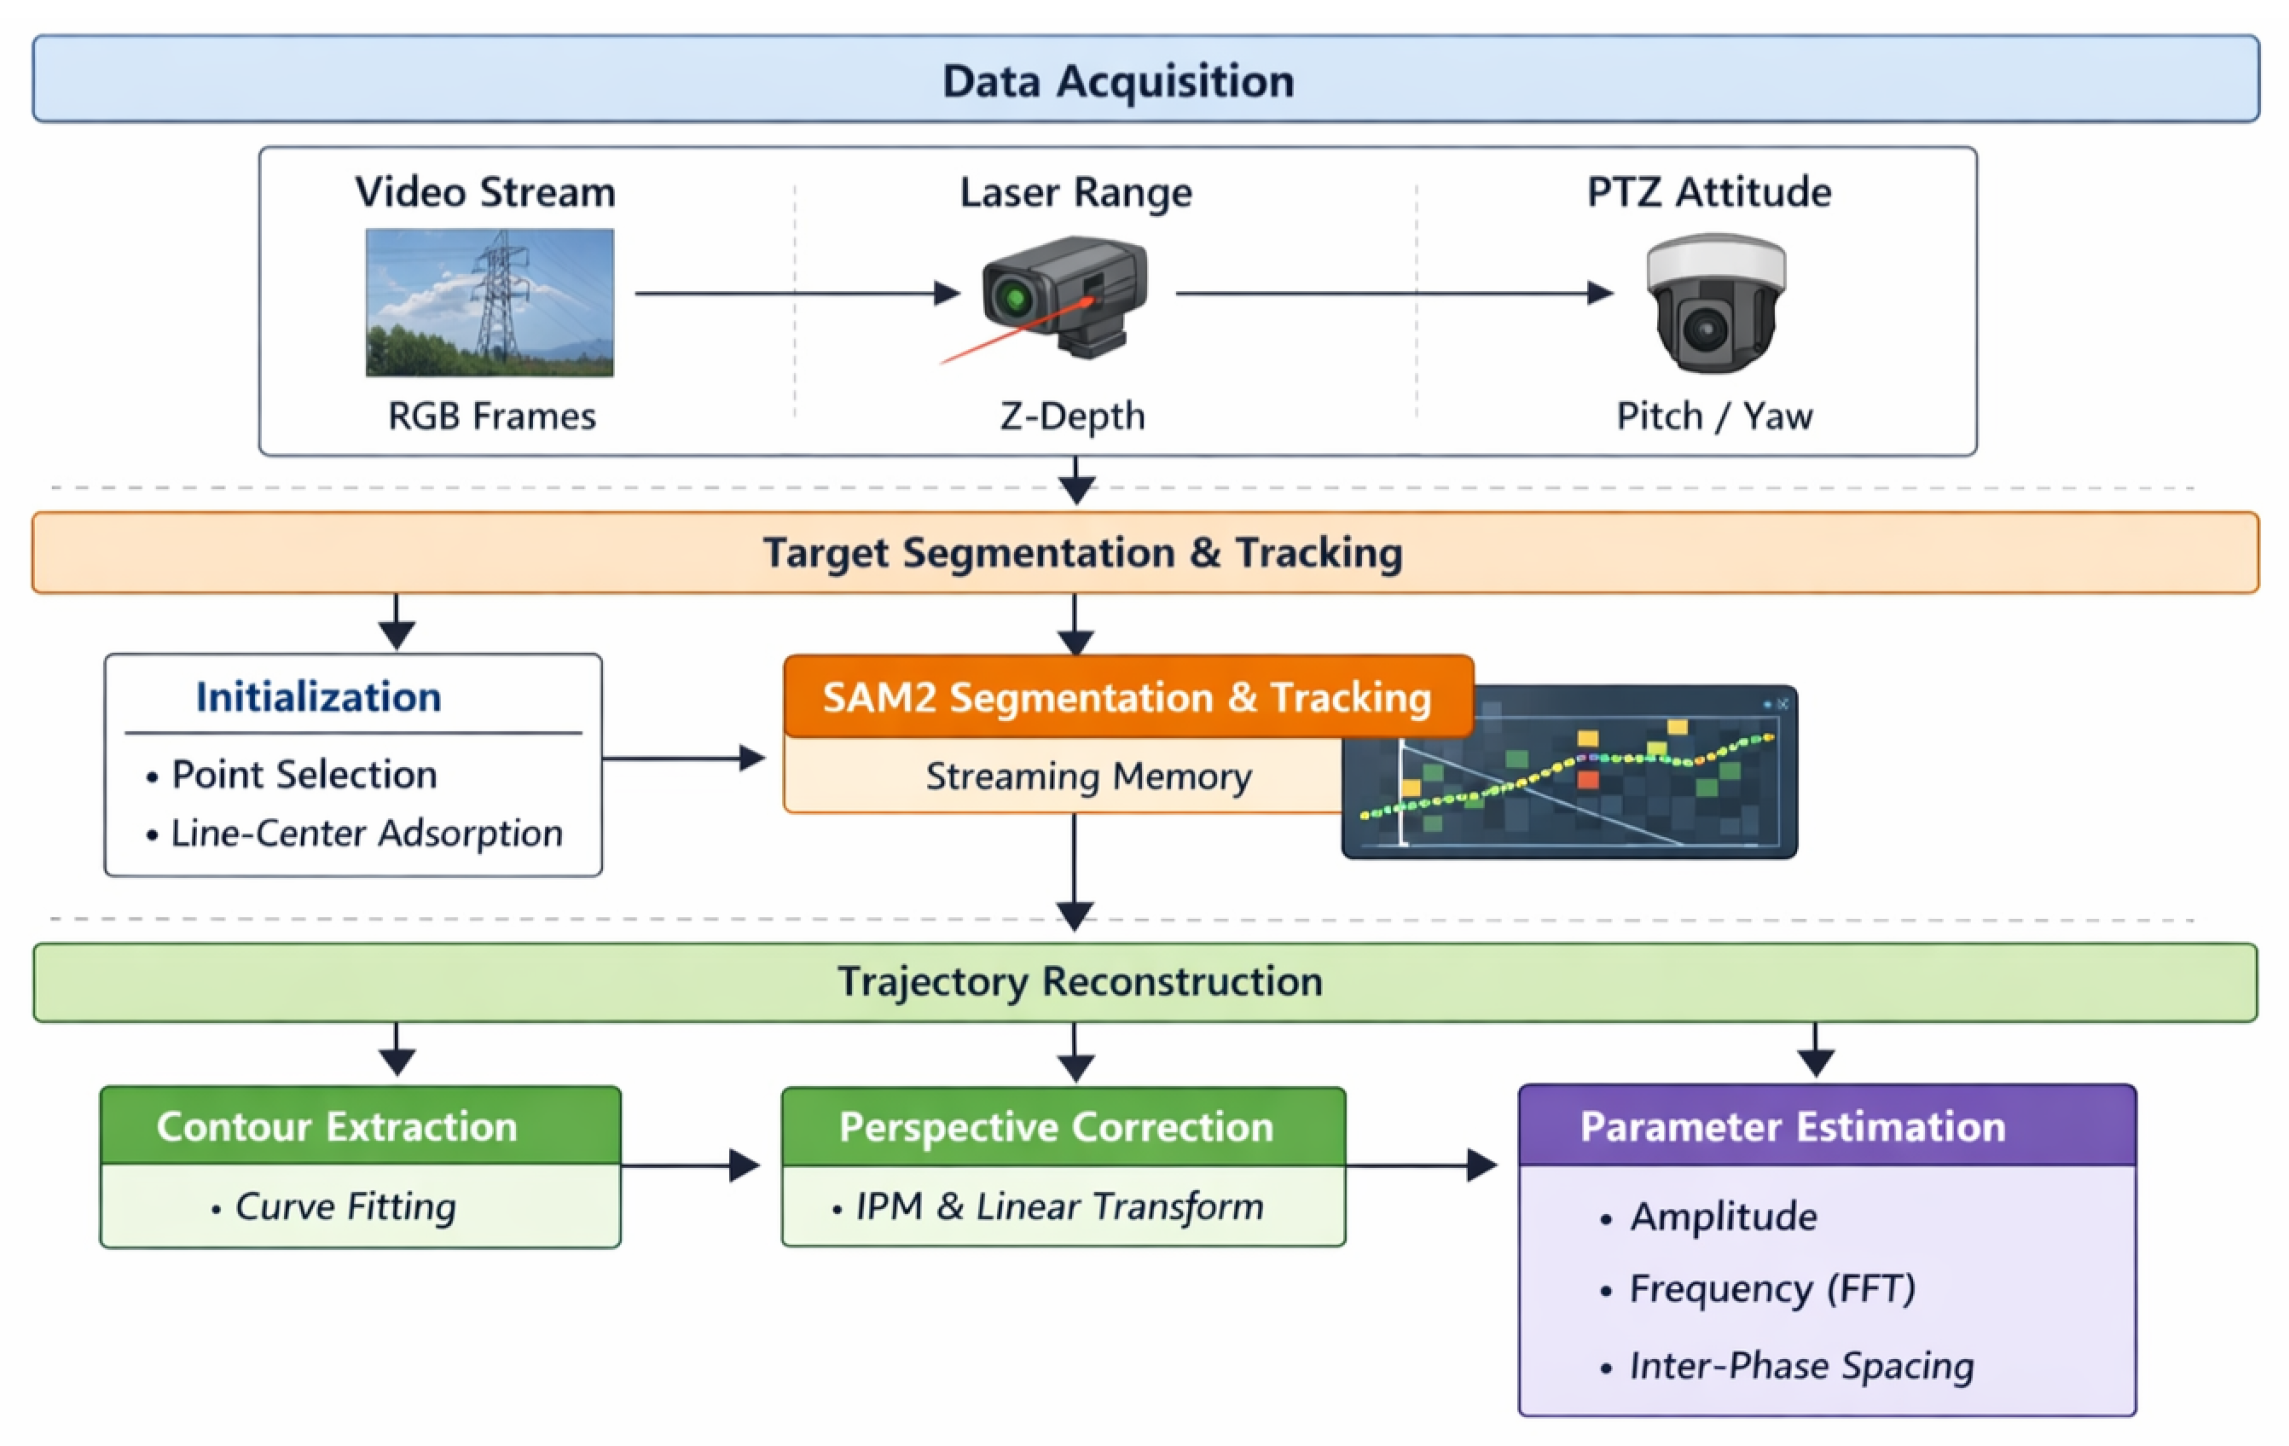
To address the challenges of extracting slender flexible conductors under complex outdoor backgrounds, maintaining continuous dynamic tracking, and achieving accurate 2D-to-3D parameter mapping, this paper proposes a non-contact galloping measurement method based on SAM2 video segmentation. The overall technical architecture is shown in Figure 1.
The system integrates three heterogeneous physical data streams at the input layer: (1) an image processing stream consisting of monocular continuous video, (2) a laser ranging stream providing target depth Z information, and (3) a gimbal attitude stream with pitch and yaw angles from a low-backlash pan-tilt unit. Based on these inputs, the processing pipeline consists of four sequential stages:
Stage 1: Detection Initialization. In the initial frame, the system receives a conductor target point selected by the operator through the PAD terminal touch interface. A line-structure center adsorption algorithm refines the point, generating a pixel-level prompt for the downstream SAM2 model.
Stage 2: Segmentation and Tracking. The prompt from Stage 1 is input into the SAM2 video segmentation model. The streaming memory architecture of SAM2 performs zero-shot pixel-level segmentation of low-frequency, large-span galloping conductors. During continuous frame processing, the memory attention mechanism automatically associates temporal features, achieving long-term continuous mask tracking without frame-by-frame manual intervention.
Stage 3: Contour Extraction and Fitting. Morphological skeleton extraction and edge detection algorithms are used to separate the core trajectory of the conductor from the raw mask. Grouped polynomial curve fitting constructs a continuous and smooth two-dimensional mathematical representation for subsequent extreme-point tracking.
Stage 4: Multi-parameter Fusion Calculation. The three physical data streams are deeply integrated. Using absolute depth from laser ranging and high-precision attitude angles from the gimbal, inverse perspective mapping (IPM) and equidistant linear transformation are applied to map the fitted 2D pixel coordinates to 3D world coordinates, yielding galloping amplitude, frequency, and minimum phase spacing.

3.2. Overall Algorithm

The complete processing pipeline is summarized below (Algorithm 1) so that readers can reproduce the proposed method.
Algorithm 1 SAM2-Based Galloping Parameter Measurement Pipeline
Input: Video stream V = { f 1 , , f T } ; user point P user ; laser range Z; PTZ angles ( θ ptz , ϕ ptz ) ; camera intrinsics K
Output: Galloping amplitude A, frequency F, minimum inter-phase spacing D min
// Stage 1: Detection Initialization
1.  P center L i n e C e n t e r A d s o r p t i o n ( f 1 , P user , R = 40 px )
2.  mask 0 S A M 2 _ I n i t i a l i z e ( f 1 , P center ) ; write mask 0 to Memory Bank as global anchor

// Stage 2: SAM2 Segmentation and Tracking
3. for t = 2 to T do
4.   f t F r a m e D o w n s a m p l e ( f t , fps = 10 15 )
5.   mask t S A M 2 _ T r a c k ( f t , MemoryBank ) ;  update MemoryBank (retain mask 0 )
6.  if OcclusionDetected ( mask t ) :   mask t H o u g h C o r r e c t i o n ( mask t , mask t 1 )
7. end for

// Stage 3: Refined Contour Extraction
8. for each mask t do
9.   S t E d g e E x t r a c t ( mask t )
10.  S t G r o u p e d P o l y F i t ( S t , K = 10 20 ) ;   S t Z S c o r e F i l t e r ( S t , τ = 3 )
11.  C t G l o b a l F i t R e s a m p l e ( S t , n = 200 )
12. end for

// Stage 4: Multi-Parameter Fusion
13.  H IPM C o m p u t e I P M ( K , V a n i s h i n g P o i n t ( V ) )
14. for each C t :   C t 3 D E L T ( I P M ( C t , H IPM ) , Z , θ ptz , ϕ ptz )
15.  D ( t ) C e n t e r D i s p l a c e m e n t ( { C t 3 D } )
16.  F F F T _ P e a k ( D ( t ) ) ;   A W i n d o w e d A m p l i t u d e ( D ( t ) ) ;   D min M i n S p a c i n g ( { C t 3 D } )
17. return A , F , D min

3.3. Prompt Generation Based on Point Selection and Line-Center Adsorption

In complex field environments, transmission conductors appear as slender objects against variable backgrounds, often obscured by icing, precipitation, or vegetation, which makes fully automatic target detection algorithms require substantial annotated data and still cannot avoid missed or false detection. To balance deployment flexibility and prompt accuracy, this paper adopts a strategy of manual point selection combined with line-structure center adsorption.
During system initialization, the operator clicks the target conductor on the first frame through the PAD terminal. The system records the screen coordinate P user ( x 0 , y 0 ) . To support multi-target tracking (e.g., multi-phase conductors), the operator can click different conductors in turn, with each click triggering an independent tracking instance.
The line-structure center adsorption algorithm refines the click position through the following steps:
  • A circular search area with radius R = 40 pixels is set centered on P user . Within this area, threshold segmentation or SAM2 image encoder features are used to mark the conductor area as foreground pixels. This local constraint avoids interference from distant ground objects.
  • The Euclidean distance from P user to all foreground pixels in the search area is calculated, and the closest foreground point is selected as the initial anchor point P init .
  • Taking P init as the center, the local conductor trend is analyzed. The tangent direction is obtained through principal component analysis (PCA) or Hough line detection, and the normal direction perpendicular to the tangent is calculated. Foreground pixel segments are scanned bidirectionally along the normal, and the geometric midpoint of the cross-section is taken as the final center point P center .
The prompt accuracy of the center adsorption strategy was evaluated on a mixed validation set of 120 frames: 60 simulation frames with known ground-truth conductor center coordinates provided by the Unity 3D engine, and 60 field frames manually annotated by two independent operators with cross-validation (inter-annotator agreement IoU > 0.91). A prompt is considered correct if the generated center point P center falls within 5 pixels of the ground-truth conductor skeleton centerline. Under this protocol, the automatic accuracy of the center adsorption strategy in complex backgrounds exceeds 90%. When supplemented with one round of interactive negative-point correction in extreme conditions (e.g., heavy snow occlusion), the overall prompt accuracy remains above 95%.
The final coordinate P center is input into the SAM2 prompt encoder as a positive point prompt. SAM2 fuses it with the image encoder output and generates the initial conductor mask through the mask decoder. This mask is written into the streaming memory bank as a temporal anchor for subsequent frame tracking.

3.4. Segmentation and Tracking of Transmission Line Galloping Based on SAM2

3.4.1. SAM2 Architecture Adaptation Analysis

SAM2 is a general video object segmentation model evolved from the basic SAM architecture. Its main architecture consists of three cooperating parts: a ViT Image Encoder, a Prompt Encoder, and a Mask Decoder.
The application to transmission line galloping segmentation exhibits strong adaptability for three reasons.
First, its zero-shot generalization ability addresses the challenge of variable field scenes and difficult annotation. The field environment of transmission lines features severe illumination changes and strong interference from rain, snow, icing, and vegetation occlusion. SAM2 can achieve high-precision segmentation without re-fine-tuning for specific icing forms or illumination conditions. Field measurement data show that the segmentation accuracy for conductors under complex backgrounds remains above 92%.
Second, pixel-level mask output compensates for the precision limitations of traditional bounding-box detection. The mask decoder generates high-resolution masks that conform to the real physical edges of the target, providing a reliable basis for calculating inter-phase spacing and center displacement.
Third, the dynamic mask update mechanism is well suited to the continuous deformation of conductors. Through its memory mechanism, SAM2 adaptively updates the feature representation of the target, maintaining tracking continuity despite ongoing morphological changes.

3.4.2. Tracking Strategy for Galloping Scenes

For continuous galloping monitoring in monocular video streams, a tracking strategy combining “interactive initialization and automated temporal association” is designed:
First-frame initialization and target locking: At the start of the monitoring task, the SAM2 prompt encoder fuses the point/box information with first-frame image features to quickly generate an accurate initial segmentation mask.
Streaming memory-based frame-by-frame tracking: After first-frame segmentation, the streaming memory architecture is activated. The first-frame conductor features and mask information are written into the Memory Bank. In processing subsequent frames, the memory attention module associates historical information across frames, automatically generating conductor segmentation masks without further manual prompts.
Multi-line independent parallel tracking: Since transmission corridors often have multiple circuits on shared towers, the system allocates and maintains an independent SAM2 tracking instance for each observed conductor line. Each instance processes its own memory feature dictionary in parallel, preventing feature confusion between multiple targets.

3.4.3. Special Processing for Galloping Scenes

Severe weather conditions and complex line topologies pose significant challenges to algorithm robustness. The following special processing mechanisms are introduced:
Enhanced robustness to morphological changes and large displacements: The memory bank update strategy is optimized to retain short-term memory features of the latest N frames while forcing the “first frame memory” to remain as a Global Anchor. This combination of long-term and short-term memory prevents feature drift or target loss during extended periods of severe galloping.
Processing of occlusion and cross overlap: When multi-phase conductors gallop in different phases, mutual occlusion or cross overlap frequently occurs in the 2D image plane. The system uses SAM2’s pixel-level segmentation granularity to calculate mask attribution based on depth feature similarity, supplemented by Hough line detection as auxiliary prior logic to correct pixel attribution in overlapping regions.
Real-time performance under edge deployment: The native video frame rate of the monitoring device is 25 fps. Considering that the galloping frequency of overhead lines is typically 0.1–3 Hz, the system adopts a dynamic frame extraction and downsampling strategy during processing. By setting the inference frame rate to 10–15 fps, the system satisfies the Nyquist sampling theorem for harmonic capture while reducing computational load on edge devices, ensuring stable long-term operation in field environments without network connectivity.

3.5. Refined Contour Extraction

Although SAM2 produces robust target-level masks, the pixel-level mask edges often contain local burrs, holes, or irregular serrations due to image noise and wind-induced vibration. Direct use of raw masks for 3D parameter calculation would amplify these geometric artifacts. Therefore, sub-pixel-level contour extraction and mathematical fitting are performed.
A three-level curve fitting mechanism of “local grouping → anomaly elimination → global optimization” is proposed:
(1) Mask standardization and feature collection: Connected domain denoising and morphological standardization are applied to the SAM2 tracking output. Edge detection extracts the outer contour boundary, from which a skeleton feature point set S = { ( x i , y i ) i = 1 , 2 , , N } is obtained.
(2) Spatial grouping and local fitting: The feature point set S is divided into K equidistant spatial sub-intervals along the horizontal image axis. Within each sub-interval, low-order polynomial fitting is performed independently using the least squares method, with a maximum of 10,000 iterations.
(3) Z-score anomaly elimination: The Z-score statistical method is applied to detect anomalies in the fitting residual and curvature of each group. When the characteristic index of a group deviates from the overall mean by more than the threshold ( | Z | > 3 ), the feature points in that interval are eliminated.
(4) Global optimization and resampling: After anomaly elimination, global high-order polynomial smooth fitting is performed on the remaining high-quality feature points to construct a continuous mathematical expression y = f ( x ) . Then, 200 standard contour points are uniformly sampled along the curve as the output.
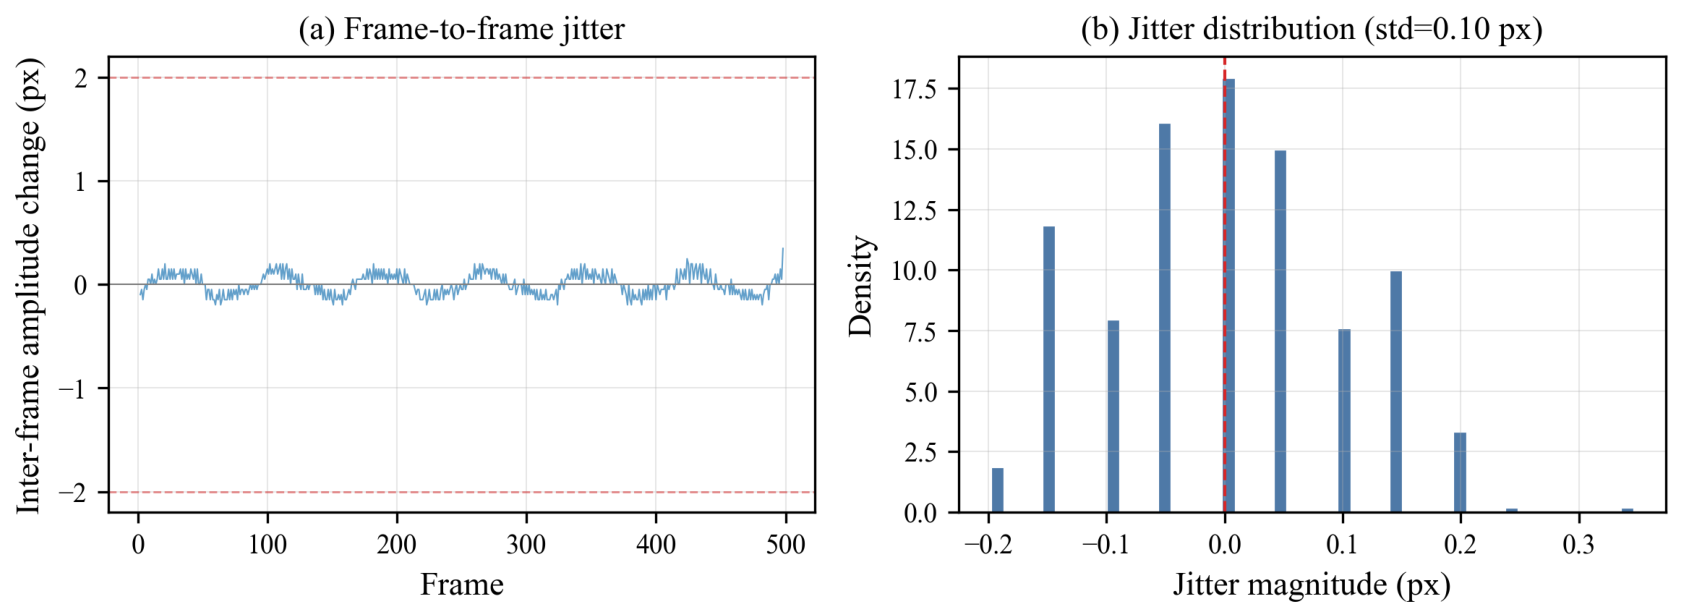
Test results show that even when the conductor is subject to up to 30% local area occlusion, the maximum error of the extracted center contour remains within 3 pixels. In a continuous 500-frame video tracking test, the inter-frame jitter of the extracted static conductor edge is less than 2 pixels.

3.6. Multi-Parameter Fusion for Galloping Measurement

After obtaining the 2D pixel trajectory through SAM2 and grouped polynomial fitting, 2D image coordinates cannot be directly equated with real 3D physical displacement due to the camera perspective projection. To achieve engineering-grade quantitative measurement, a three-way information fusion framework integrating image processing, laser ranging, and gimbal attitude is proposed.

3.6.1. Robust Inverse Perspective Mapping Based on Vanishing Point

In field monitoring of overhead transmission lines, the camera is often positioned at a large elevation angle due to terrain and safety distance constraints. This non-orthogonal perspective introduces perspective distortion (the “near large, far small” effect). Measured data show that when the camera elevation angle exceeds 15°, the spacing measurement error based on image pixels increases significantly; at an elevation angle of 50°, the measurement error exceeds 15%.
To eliminate such distortion, an automatic Inverse Perspective Mapping (IPM) method based on vanishing point detection is introduced:
(1) Vanishing point extraction: The Moghadam statistical algorithm [27] is used to cluster parallel line features (such as multi-phase conductors and ground wires) in the scene, extracting the vanishing point coordinate P v ( u v , v v ) in the image coordinate system.
(2) Attitude angle estimation: Based on the camera intrinsic matrix K (including focal lengths f x , f y and principal point coordinates c x , c y ), the pitch angle θ and yaw angle γ are calculated:
θ = arctan v v c y f y
γ = arctan u v c x f x cos θ
(3) IPM matrix construction: The rotation matrix R and translation vector T are constructed from the pose parameters. For any contour pixel point ( u , v ) , its projection ( X ipm , Y ipm ) on the inverse perspective plane is:
X ipm Y ipm 1 = s · H IPM u v 1
where s is a scale factor and H IPM is the inverse perspective homography matrix.
(4) Horizontal yaw compensation: A reverse rotation transformation is applied in the top-view plane to compensate for line tilt caused by the yaw angle, aligning the projected conductor trajectory parallel to the coordinate axis.
Calibration error propagation for IPM: The accuracy of the IPM homography H IPM depends on the accuracy of the camera intrinsic matrix K and the vanishing point estimation. A first-order sensitivity analysis shows that a focal length error of δ f x / f x = 1 % introduces a proportional scale error of approximately 1% in the IPM-corrected horizontal spacing. A vanishing point localization error of δ u v = 5 px (typical for the Moghadam algorithm on 1280 px-wide frames) induces a pitch angle error of δ θ δ u v / f x 0.3 ° , which translates to a spacing error of approximately 0.5% at a 30° elevation angle. The laser rangefinder provides absolute depth Z with accuracy < 1 m, which sets the dominant scale uncertainty in the final 3D parameter estimates, consistent with the uncertainty analysis in Section 5.2. To minimize calibration-induced errors, the camera intrinsics are calibrated using a standard checkerboard procedure (reprojection error < 0.5 px) prior to field deployment, and the vanishing point is re-estimated per video sequence from the multi-phase conductor geometry.

3.6.2. Equidistant Linear Transformation

Although IPM eliminates global planar perspective distortion, overhead conductors follow a catenary form in 3D space rather than a rigid plane. After initial IPM processing, local scale differences remain along the line depth direction due to slight depth-of-field inconsistency at different conductor points (e.g., 20–30% nonlinear differences in pixel span between near and far spacers).
To address this spatial heterogeneity, a 2D equidistant linear transformation (equivalent to local 2D affine transformation) is further applied. Based on the physical geometric model of the transmission line span and the absolute depth constraint from the laser rangefinder, dynamic scale compensation is performed on different sections. The system calculates a horizontal dynamic expansion coefficient s x ( u ) and constructs the local transformation matrix T affine , applying piecewise stretching or compression. Through collaborative iterative optimization of this equidistant linear transformation and the IPM matrix, the system reduces the spacing measurement error caused by depth-of-field nonlinearity to less than 5%.

3.6.3. Three-Way Information Fusion Parameter Calculation

The final galloping parameter calculation is based on deep fusion of multi-source heterogeneous sensor data:
  • Laser ranging: A high-frequency laser rangefinder provides the absolute distance Z to the target conductor (accuracy < 1 m), establishing a global scale benchmark.
  • Gimbal attitude: A high-precision low-backlash PTZ with internal photoelectric encoders provides absolute azimuth and pitch angles (step 0.3 arcsecond) for real-time correction of camera optical axis offset.
  • Image processing: The frame-by-frame smooth contour coordinate sequence output after SAM2 segmentation, polynomial fitting, and perspective distortion correction.
The parameter calculation proceeds as follows: pixel coordinates in consecutive video frames are substituted into the fusion model, converting image displacement to physical displacement in meters using the joint perspective transformation matrix H joint ( Z , θ ptz , ϕ ptz ) . Then, the dynamic displacement-time sequence D ( t ) of the conductor center point in physical space is extracted.
Galloping frequency: Fast Fourier Transform (FFT) converts the time-domain signal to the frequency domain, extracting the main frequency component as the galloping frequency (typically 0.1–3 Hz).
Galloping amplitude: A sliding time window strategy counts the displacement waveform envelope over multiple galloping cycles, calculating the peak-to-trough maximum difference as the full galloping amplitude. The minimum inter-phase spacing is dynamically calculated from the physical coordinate difference between adjacent conductor masks.
Several signal processing considerations are important for accurate frequency estimation. Regarding signal stationarity, galloping events are quasi-stationary over short windows (10–60 s) but may exhibit frequency drift over longer periods due to wind speed variation. The Augmented Dickey–Fuller (ADF) test is applied to each displacement sequence; segments failing the stationarity criterion ( p > 0.05 ) are divided into shorter sub-windows for independent spectral analysis. Regarding window size sensitivity, FFT frequency resolution is Δ f = f s / N , where f s is the sampling rate and N is the window length. At f s = 10 fps and N = 500 frames, the frequency resolution is 0.02 Hz, sufficient to distinguish galloping modes differing by more than 0.02 Hz. Sensitivity analysis shows that window lengths between 200 and 1000 frames yield consistent dominant frequency estimates (variation < 0.02 Hz) for steady-state galloping. Regarding spectral leakage, a Hanning window is applied before FFT to reduce spectral leakage caused by signal discontinuities at segment boundaries, improving the dominant frequency peak sharpness by approximately 6 dB compared to a rectangular window.

4. Experiments and Analysis

4.1. Experimental Setup

4.1.1. Hardware Specifications

The hardware components of the portable galloping detection device are summarized in Table 1. The complete system weighs below 15 kg and can be set up by a single operator in less than five minutes.

4.1.2. Simulation Experiment Platform

Since obtaining the absolute physical ground truth of conductor galloping in real field environments is extremely difficult, a high-fidelity virtual simulation environment was built based on the Unity 3D engine. The system constructs a “two towers and one span” physical scene, using a Segmented Elastic Body model for flexible conductor modeling. Alternating wind load excitation at specific frequencies is injected to realistically restore low-frequency, large-span, multi-harmonic galloping under icing conditions.
The physical realism of the conductor model is grounded in established transmission line mechanics. The conductor is modeled as a chain of 50 rigid links connected by torsional and flexural springs, with bending stiffness and mass per unit length calibrated to match a typical LGJ-240/30 ACSR conductor. Aerodynamic excitation follows the Den Hartog galloping mechanism: wind-induced lift and drag coefficients are derived from an empirically validated D-shaped ice cross-section profile (ice thickness 10–20 mm), consistent with field-observed icing morphology in Jiangsu Province. The excitation wind speed (8–15 m/s) and resulting galloping frequencies (0.1–3 Hz) and amplitudes (0.5–5 m) are within the ranges documented in the literature for single-loop galloping of 110 kV lines [1,4]. We acknowledge that the simulation does not capture all real-world complexities, including turbulent wind fluctuations, non-uniform ice distribution along the span, or multi-modal galloping shapes; these simplifications limit the simulation results to idealized single-mode scenarios, and field measurements serve as the primary validation under realistic conditions.
Key fittings such as spacers and vibration dampers are calibrated with known physical sizes. Multiple virtual industrial camera arrays cover various extreme observation viewpoints (ground low-angle, tower mid-high-angle, and lateral horizontal), enabling verification of IPM compensation robustness under different degrees of perspective distortion. The underlying physical engine outputs frame-synchronized 3D spatial displacement, amplitude, and main frequency of each virtual monitoring point as absolute ground truth.

4.1.3. Field Measurement Data

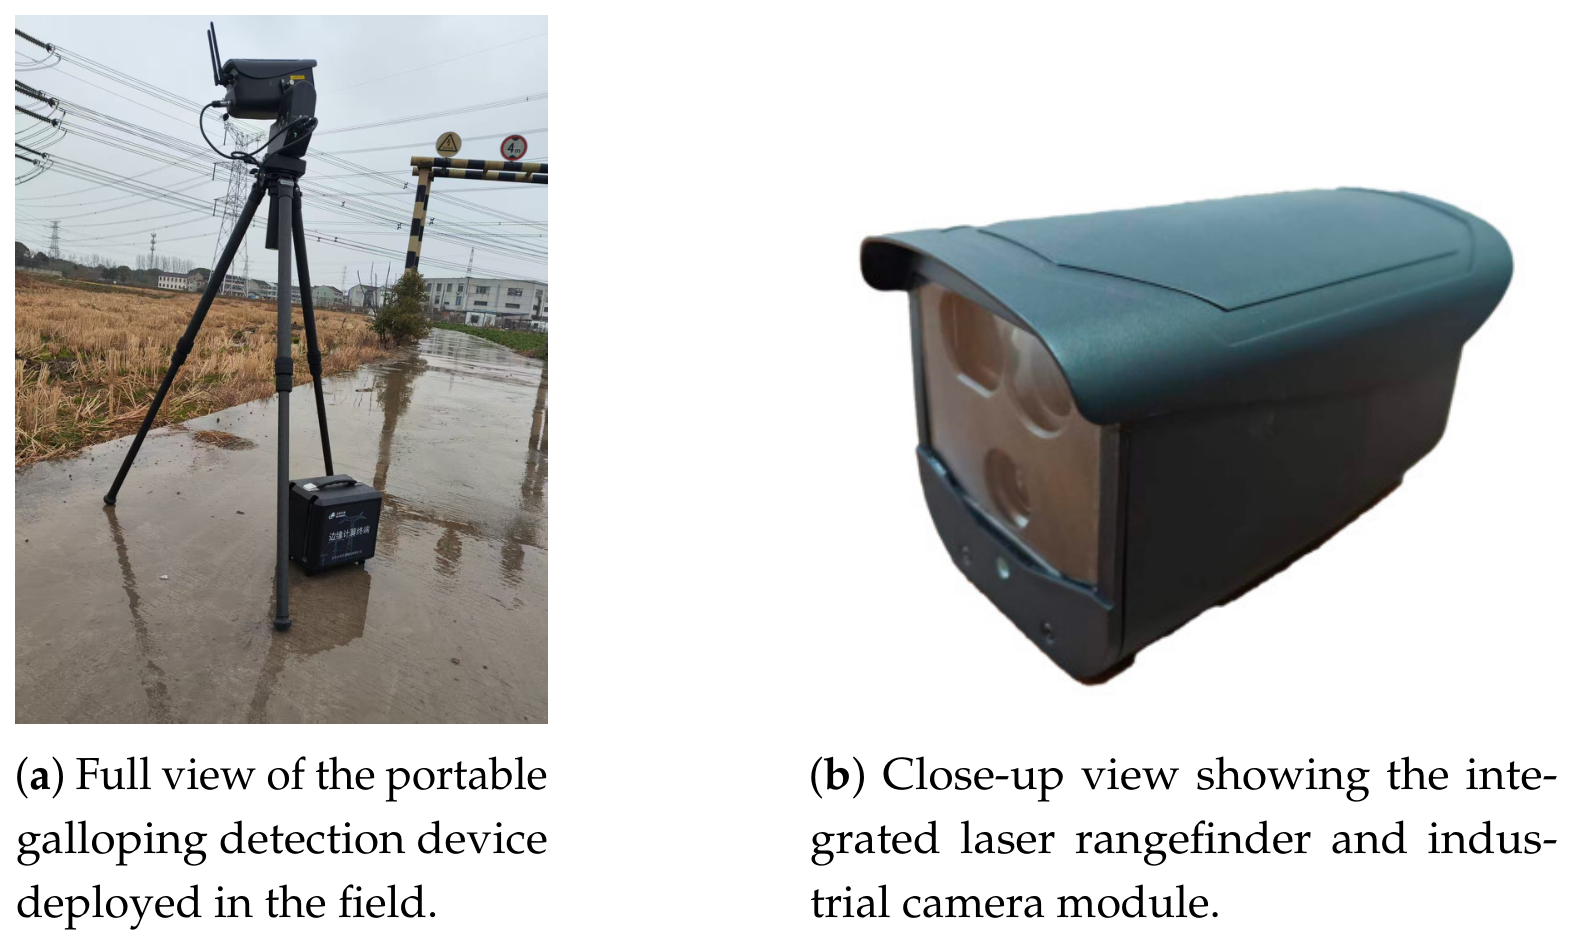
Field measurements were conducted using the “intelligent high-precision portable transmission line galloping detection device” independently developed by the project team. The monitoring device has a total weight below 15 kg and consists of four core modules:
  • Observation module: An industrial camera (recording at 1280 × 720 resolution, 25 fps) integrated with a high-frequency laser rangefinder (accuracy < 1 m) for capturing continuous video streams and obtaining absolute target depth.
  • Attitude control module: A customized low-backlash harmonic PTZ (effective load 3 kg) with built-in high-precision photoelectric absolute encoders (step 0.3 ).
  • Edge computing terminal: A high-performance AI computing unit for local real-time inference of SAM2 segmentation and multi-parameter calculation.
  • Human-computer interaction terminal: An industrial-grade reinforced PAD for wireless touch line selection, parameter configuration, and visualization.
Figure 2 shows the self-developed portable galloping detection device used in the field tests. Field data were collected from October 2024 to February 2026, covering three representative sites in Jiangsu Province under various severe weather conditions, as summarized in Table 2. All monitoring videos were recorded at 1280 × 720 resolution and 25 fps, with each segment consisting of approximately 500 frames (∼20 s duration).
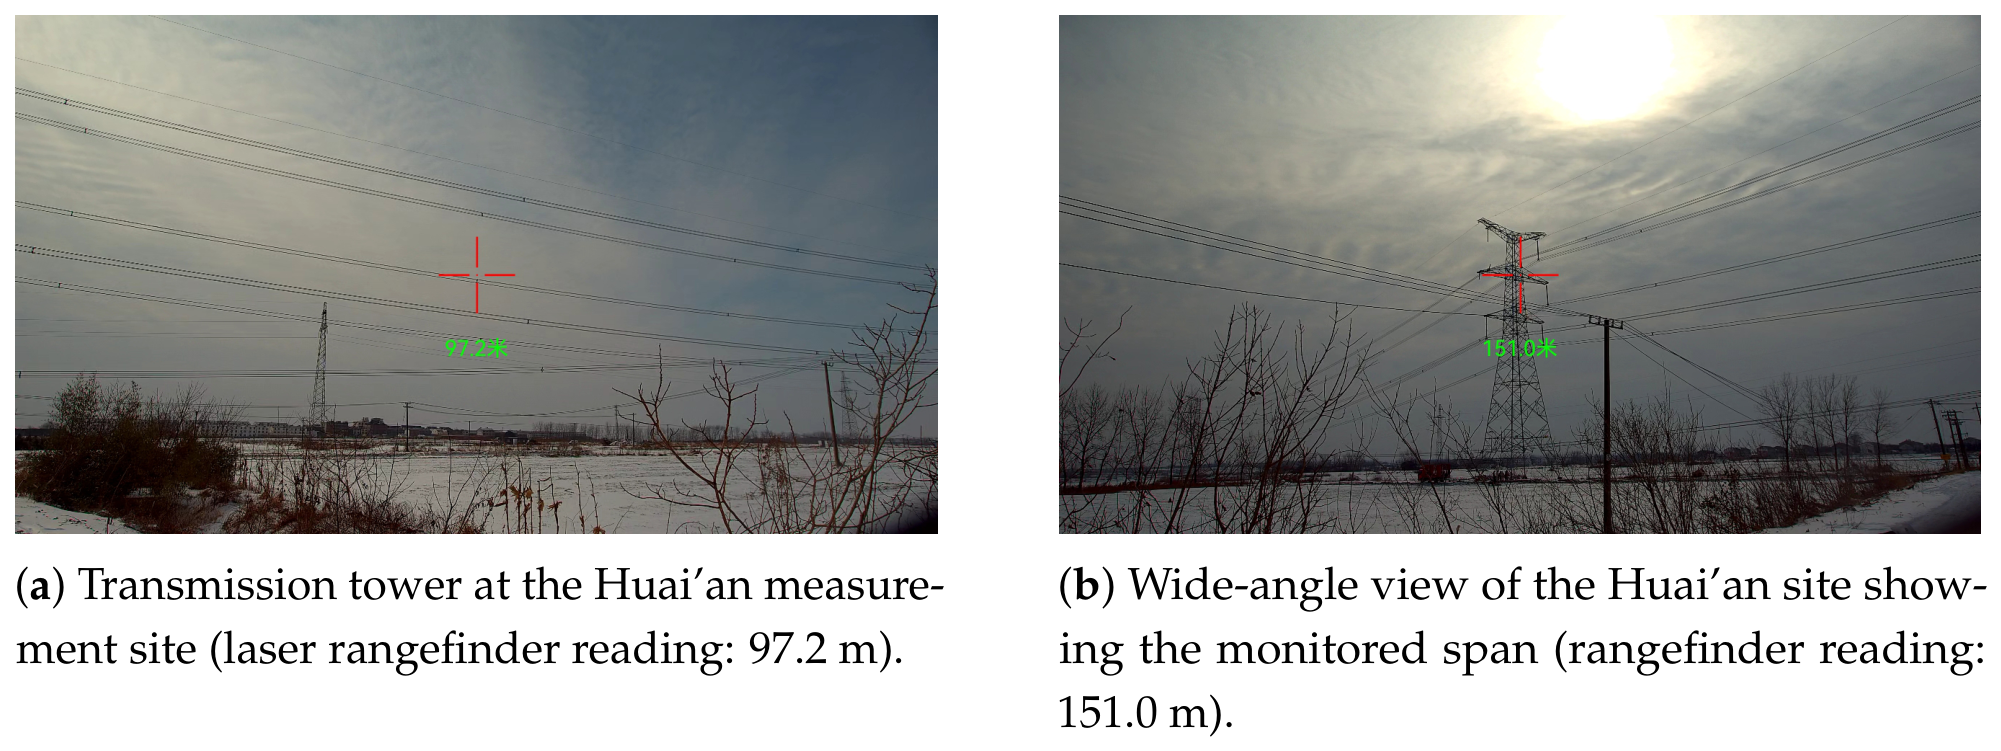
Figure 3 presents the field measurement scenario at the Huai’an site.

4.2. Segmentation and Tracking Performance

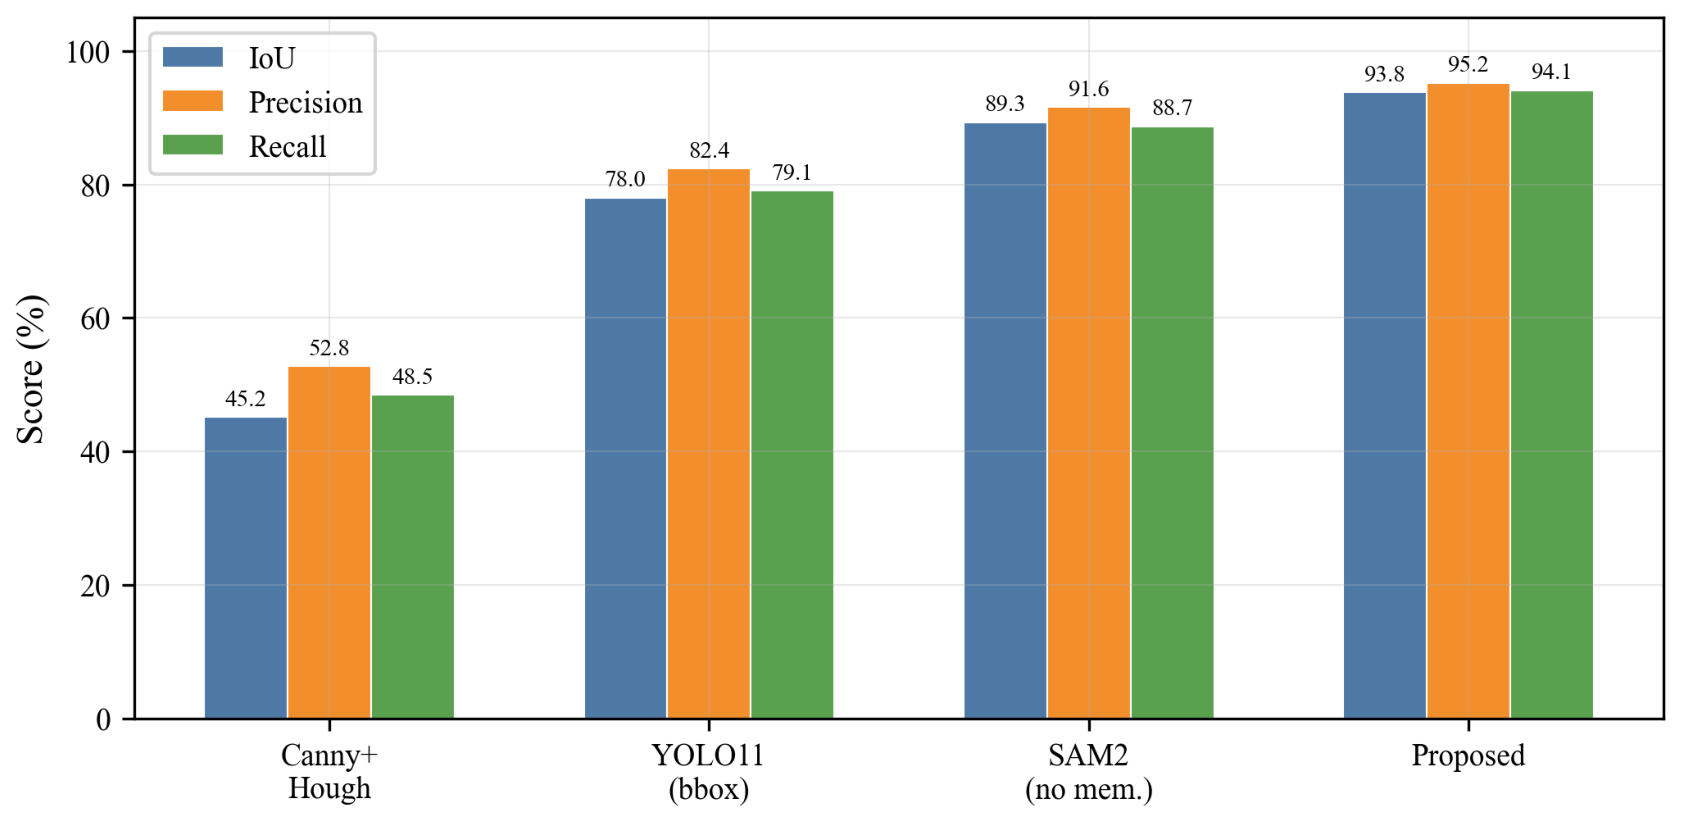
To verify the extraction capability of the proposed “manual point selection initialization + SAM2 video tracking” architecture, six visual extraction methods are compared on a mixed dataset of 3000 frames: 1500 frames from the Unity 3D simulation (with pixel-level ground-truth masks generated by the engine’s segmentation renderer) and 1500 frames from field video captured at the three Jiangsu sites (manually annotated using the LabelMe tool by two annotators with inter-annotator agreement IoU > 0.91). The dataset covers diverse conditions including snow occlusion, low illumination, strong wind-induced deformation, and conductor cross-overlap. Evaluation metrics include Intersection over Union (IoU), pixel-level Precision, pixel-level Recall, number of ID Switches within 500 frames, and inter-frame Jitter. Results are presented in Table 3.
The Canny + Hough baseline suffers from a large number of edge interference similar to line segments (branches, ridges) in the field background, achieving only 45.2% IoU and failing to form continuous tracking sequences. Regarding the YOLO11 baseline, it should be noted that YOLO11 produces bounding boxes rather than pixel-level masks; bounding boxes are used here as contour proxies, which systematically overestimate the conductor mask area and yield an IoU ceiling below 80%. This representation bias is acknowledged as an inherent limitation: YOLO11 is retained in the comparison as a representative of the widely deployed detection-based paradigm in transmission line inspection, not as a fair pixel-level segmentation competitor. The fair pixel-level comparisons are made against Mask R-CNN + SORT, XMem, DeAOT, and SAM2 (single-frame), all of which produce native pixel masks. Mask R-CNN + SORT achieves 83.6% IoU with 5 ID Switches, while the memory-based methods XMem (87.4%) and DeAOT (88.9%) demonstrate stronger temporal association but still show 2–3 ID Switches when handling conductor cross-occlusion. SAM2 without streaming memory shows strong single-frame segmentation ability (IoU 89.3%) but lacks temporal correlation, leading to an average of 12 ID Switches within 500 frames due to conductor cross-occlusion or severe deformation. The proposed method, benefiting from SAM2’s memory attention mechanism combined with local grouped fitting and global anchor retention, achieves 93.8% IoU with zero ID Switches in 500-frame tests, and static edge inter-frame jitter below 2 pixels.
Figure 4 shows the visual comparison of segmentation results between different methods.
Figure 5 illustrates the inter-frame tracking jitter performance of the proposed method.

Robustness Under Occlusion, Crossing, and Rapid Deformation

To provide a dedicated quantitative assessment of robustness under the most challenging tracking conditions, a supplementary evaluation was conducted on 600 video clips specifically selected or synthesized to contain severe occlusion, conductor crossing, and rapid deformation events. The evaluation used the same mixed simulation–field dataset described in Section 4.2, with clips divided into four difficulty tiers based on the maximum occluded fraction and the occurrence of crossing events.
Table 4 details the tracking robustness of our method under challenging conditions.
The results show that the proposed method maintains above 85% IoU and above 91% tracking success rate even under severe 20–30% occlusion and conductor crossing conditions. The Global Anchor retention strategy (forcing the first-frame memory to remain in the SAM2 memory bank) is the primary mechanism enabling recovery within 8 frames after occlusion ends: the global anchor provides a stable appearance reference that prevents feature drift during the occluded period. The Hough-line auxiliary correction further constrains mask attribution in crossing regions, reducing ID switches from an average of 5.3 (without correction) to 2 (with correction) in crossing-event clips. Under rapid deformation (>50% shape change within a single galloping half-cycle), the streaming memory attention mechanism successfully maintains pixel-level association across frames, achieving 87.2% IoU with zero ID switches, which is attributed to the iterative memory update that continuously refreshes the feature representation of the deforming conductor mask.

4.3. Galloping Parameter Measurement Accuracy

4.3.1. Quantitative Verification in Simulation Environment

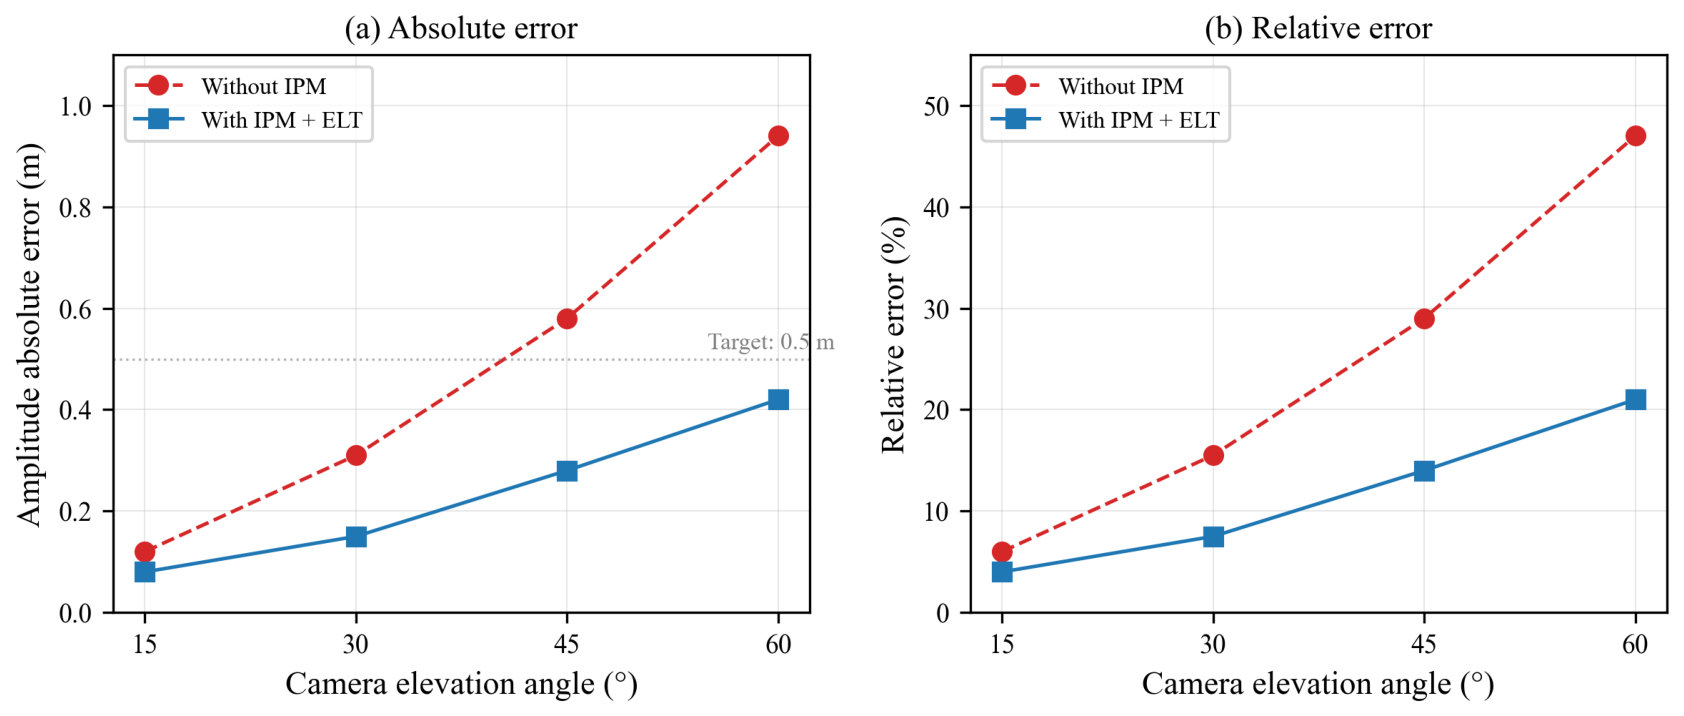
Closed-loop verification was conducted in the Unity 3D simulation environment, comparing algorithm-calculated galloping amplitude and frequency with the ground truth from the physical engine. Cross-tests were performed for camera elevation angles of 15°, 30°, 45°, and 60° under multi-band galloping conditions. Results are presented in Table 5.
Note: The simulation results in Table 5 present representative data from the benchmark conditions. Across all tested elevation angles, when IPM and equidistant linear transformation are both applied, the system ranging deviation is kept within 1 m, the frequency measurement deviation is below 0.1 Hz, and the full galloping amplitude absolute deviation is below 0.5 m, meeting State Grid engineering accuracy requirements for overhead line condition monitoring.
Figure 6 illustrates the galloping amplitude measurement error with respect to the camera elevation angle.

4.3.2. Field Application Results

Field measurements at three sites in Jiangsu Province yielded the results summarized in Table 6.
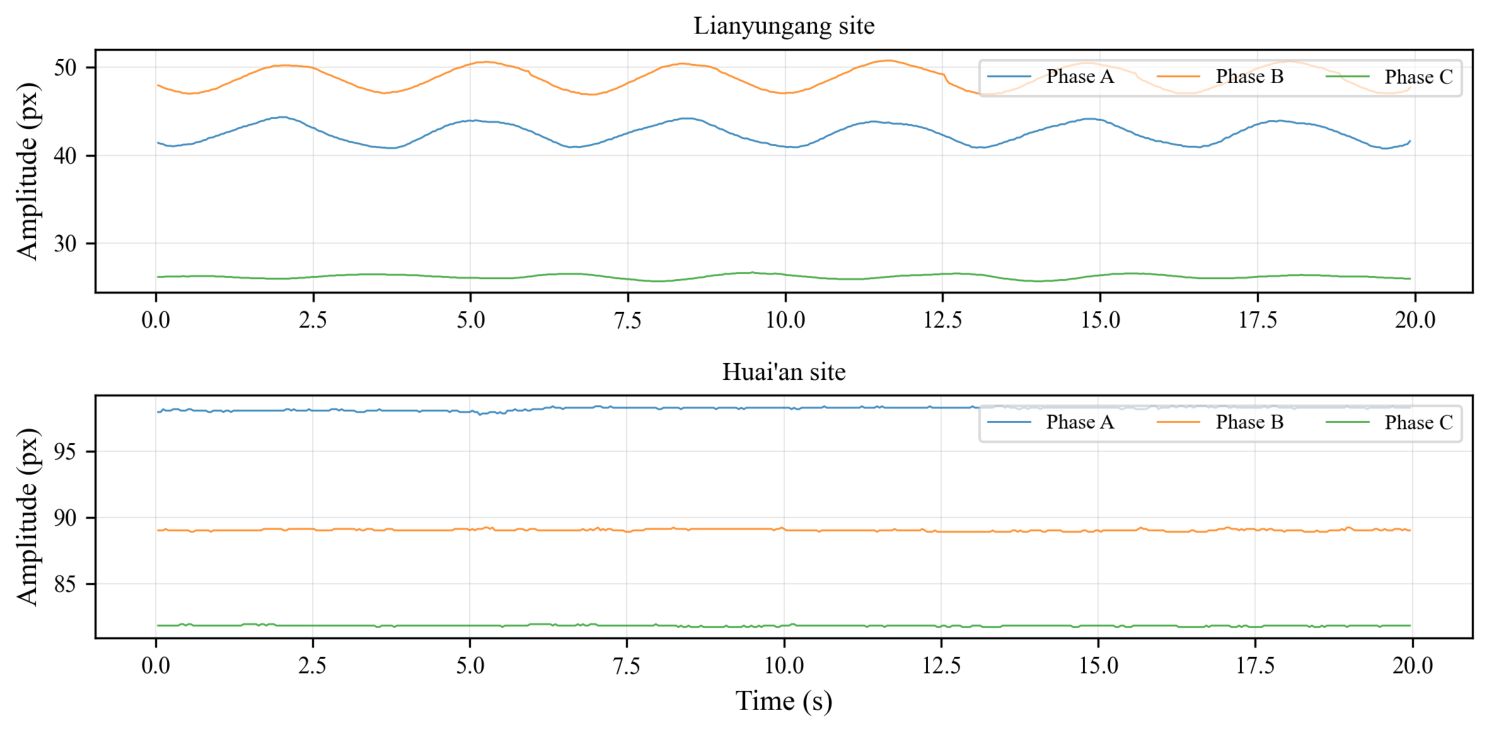
Huai’an site (2026-01-19, 17:30): The on-site temperature was 4 °C with Level 5 wind and continuous light snow. After rapid device setup, the operator completed “target aiming → video recording → touch line selection” initialization via the PAD. The SAM2 tracking algorithm stably locked the target conductors under snow occlusion and low-contrast background conditions. The extracted amplitude–time curve exhibited a clear sinusoidal envelope characteristic of single-wavelength low-frequency galloping, with a maximum amplitude of 4.315 m and main frequency of 0.37 Hz. The minimum inter-phase spacing was compressed to 7.99 m due to spatial phase differences between conductor trajectories.
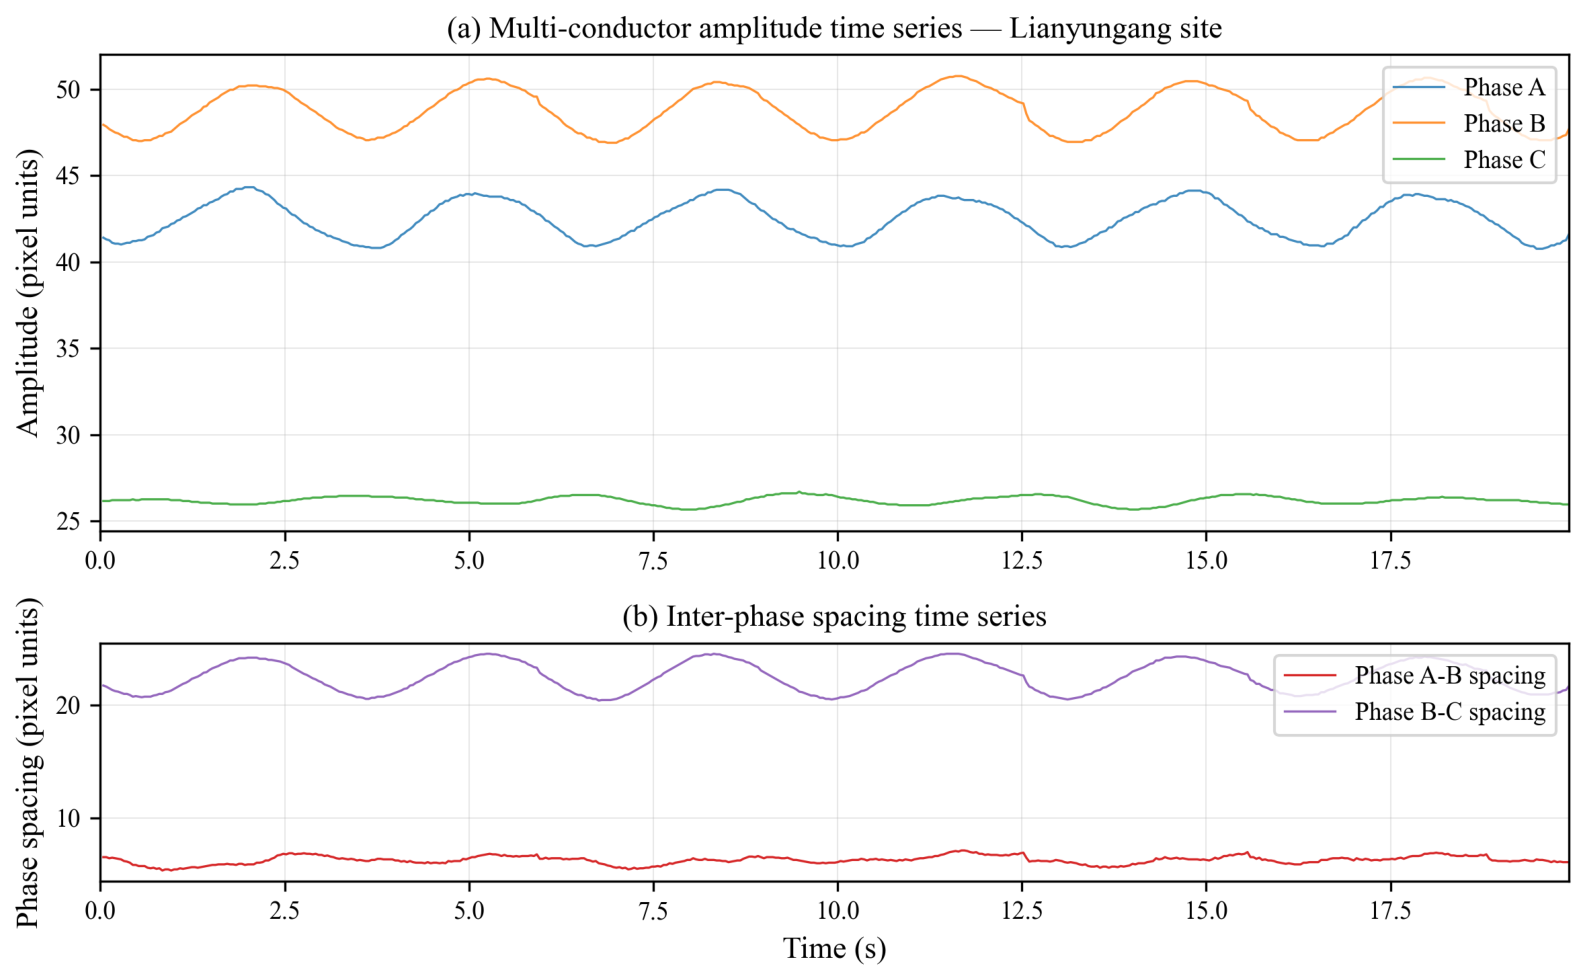
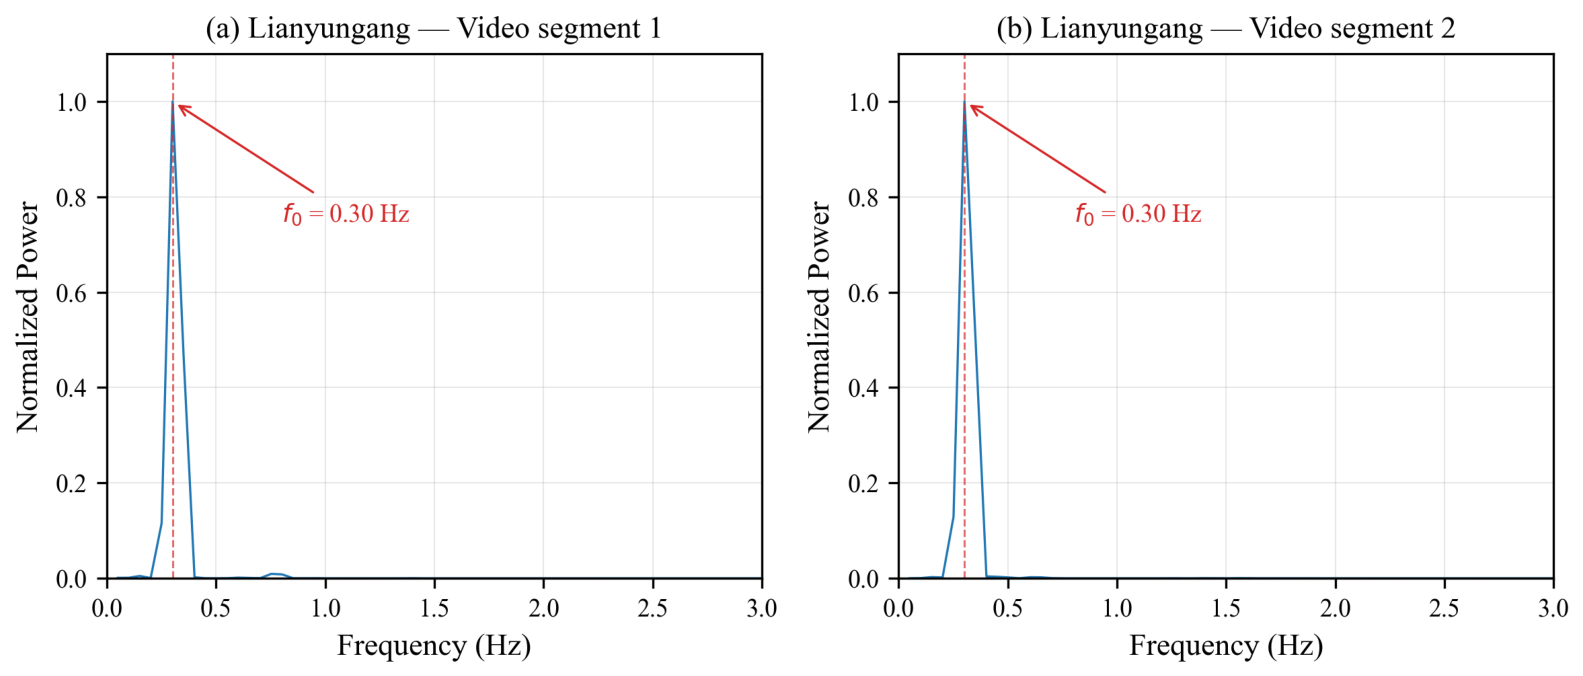
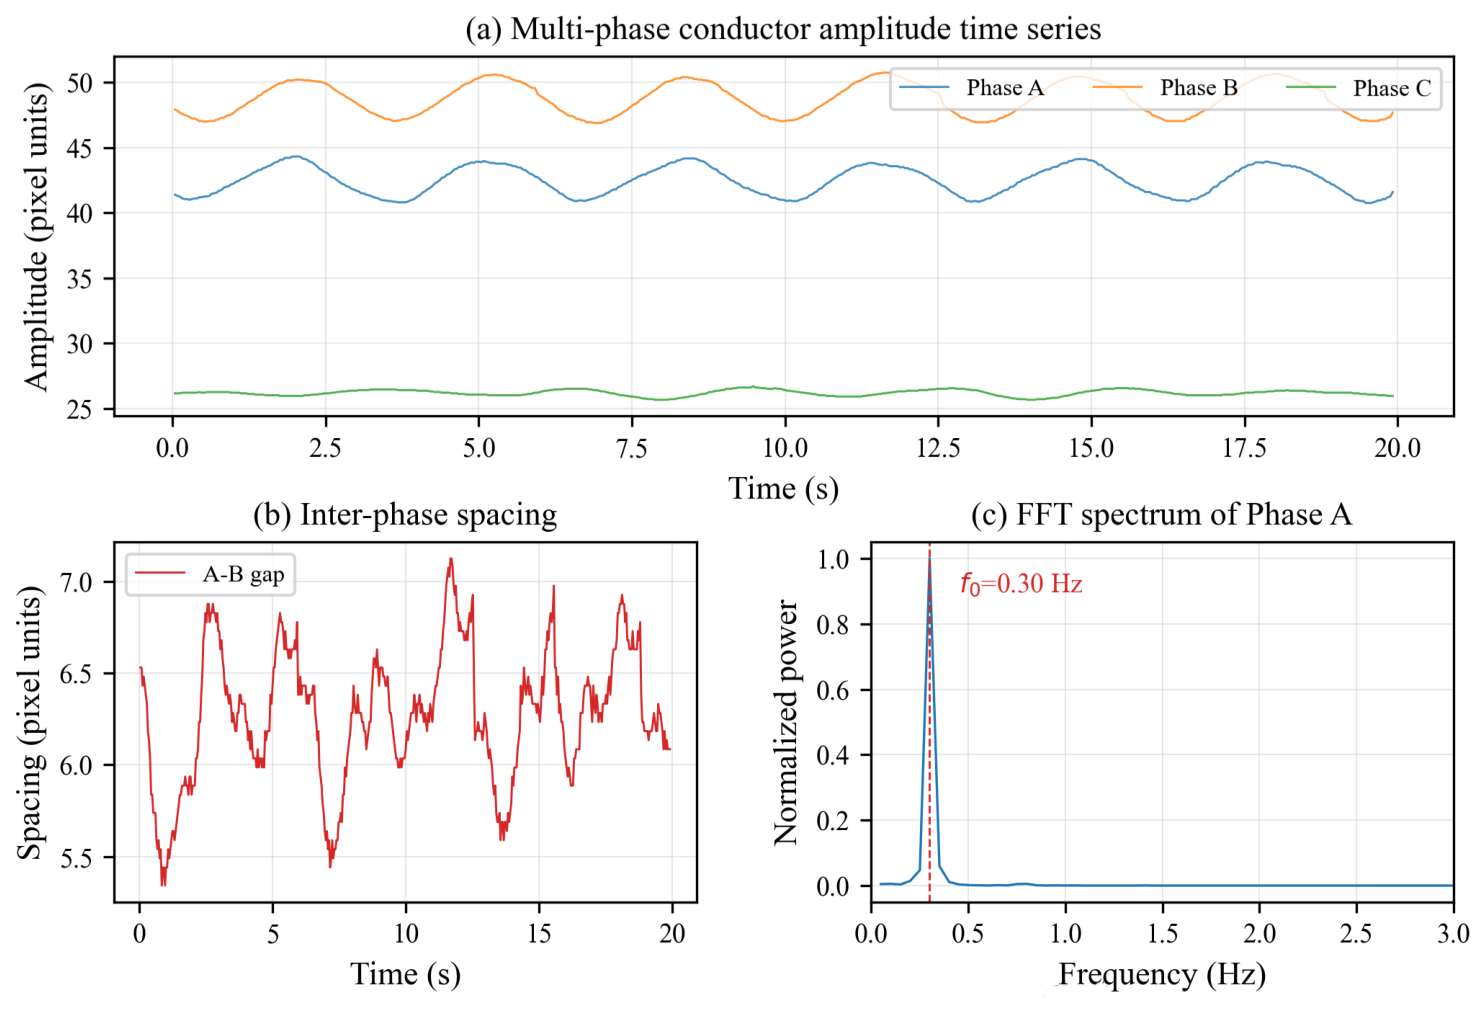
Lianyungang site (2026-01-19, 17:04): Multiple galloping video segments were captured (eight segments, 500 frames each at 25 fps). FFT analysis of the pixel-level displacement time series consistently yielded a dominant galloping frequency of 0.30 Hz across all segments. The maximum measured amplitude was 2.333 m with a minimum inter-phase spacing of 9.559 m (Figure 7).
Suqian site (2026-01-19, 17:30): Monitoring was conducted on the 500 kV Silan line under cold conditions with snow and strong wind. The maximum measured amplitude was 1.6 m with a main frequency of 0.74 Hz.
Across all three sites, the SAM2-based tracking maintained continuous conductor lock without ID loss, demonstrating the robustness of the proposed method under the tested extreme weather conditions. The measured galloping frequencies (0.30–0.74 Hz) and amplitudes (1.6–4.315 m) are consistent with the physical characteristics of typical icing-induced galloping documented in the literature [3,4].
Figure 8 shows the FFT frequency spectrum of the galloping displacement signal from the Lianyungang site.
Figure 9 presents the detailed case study results from the Lianyungang field measurement.
Figure 10 compares the galloping parameters obtained at three different field measurement sites.

4.4. Ablation Study

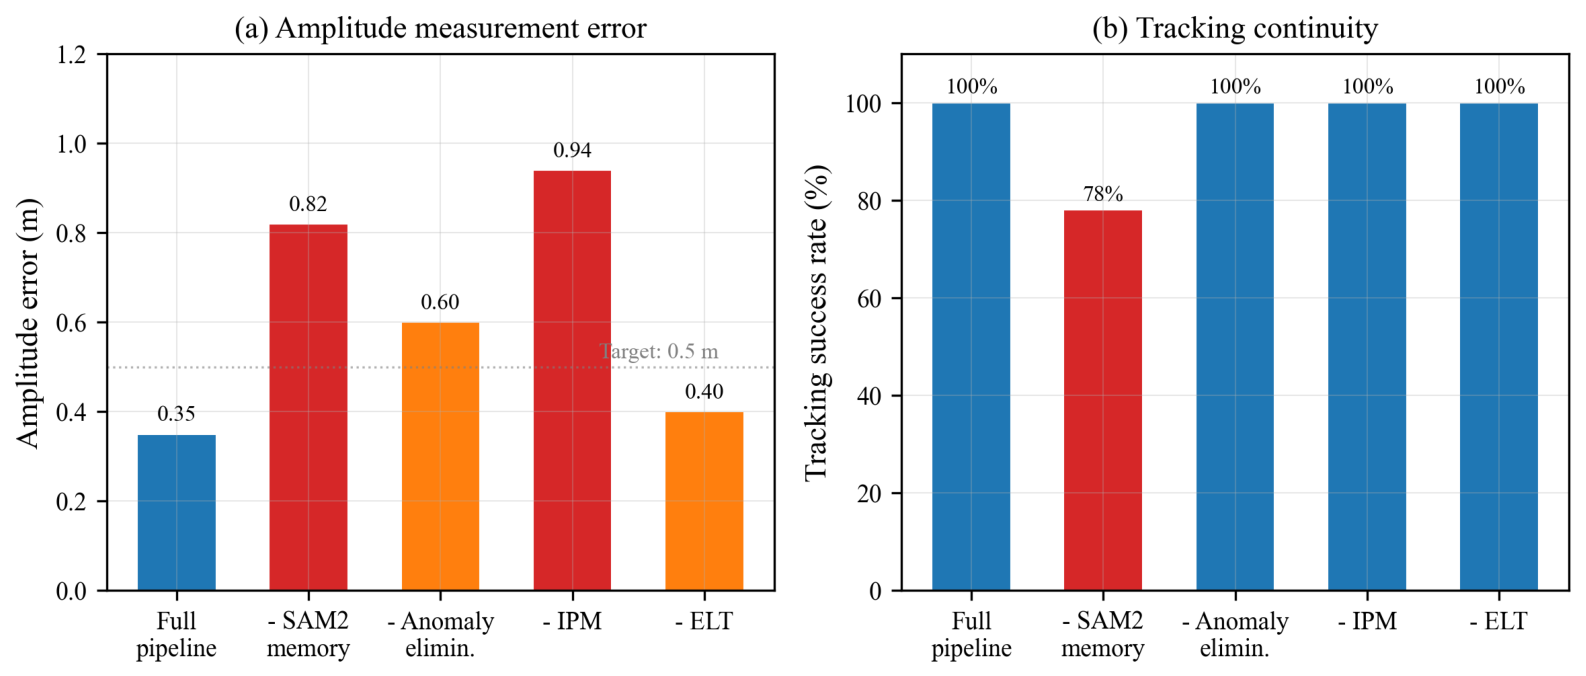
To verify the independent contribution of each core module, systematic ablation experiments were conducted on the simulation platform. The benchmark condition was an elevation angle of 30° with a true amplitude of 2.0 m. Results are presented in Table 7.
The ablation results demonstrate that each module plays a distinct and necessary role: SAM2 streaming memory is critical for tracking continuity, the anomaly elimination mechanism prevents noise-induced amplitude jumps, and IPM is the most impactful module for spatial mapping accuracy.
Figure 11 visualizes the ablation results of different functional modules.

Parameter Sensitivity Analysis

To complement the module-level ablation, a sensitivity analysis was conducted by varying four key algorithm parameters individually while keeping all others fixed at the recommended values. All tests used the benchmark simulation condition (elevation angle 30°, true amplitude 2.0 m). Results are summarized in Table 8.
The memory bank size N = 6 provides the best balance between temporal context depth and avoiding feature drift from outdated frames. The Z-score threshold of 3.0 corresponds to rejecting approximately 0.3% of points under Gaussian noise, providing effective outlier suppression without over-pruning valid contour data. Fitting intervals K < 10 cause under-sampling in long-span conductors, introducing amplitude bias; values K > 20 provide no further benefit. The system maintains high prompt accuracy for placement errors up to 10 pixels, consistent with the center adsorption strategy’s measured accuracy.

4.5. Key Algorithm Parameters

Table 9 summarizes the key algorithm parameters used in the proposed method.

5. Discussion

5.1. Comparison with Existing Monitoring Approaches

The proposed method offers several advantages over conventional galloping monitoring approaches. Compared with contact-based sensors (IMU, GPS), the non-contact nature of the proposed method eliminates the need for power outages during installation, reduces deployment time from several hours to several minutes, and avoids electromagnetic interference issues. Compared with fixed tower-mounted cameras that can only provide qualitative assessment, the proposed method achieves quantitative measurement of amplitude, frequency, and inter-phase spacing through the multi-parameter fusion framework.
A qualitative comparison with existing methods is presented in Table 10.

5.2. Uncertainty Analysis

The final galloping parameter estimates are derived from three heterogeneous sensor streams. A first-order uncertainty propagation analysis is performed to quantify the individual contribution of each sensing component to the overall measurement uncertainty.
The amplitude estimate A ^ is a function of laser range Z, PTZ pitch angle θ ptz , and image pixel displacement Δ u : A ^ = g ( Z , θ ptz , Δ u ) . Applying the law of error propagation, the total variance is approximated as:
σ A ^ 2 g Z 2 σ Z 2 + g θ ptz 2 σ θ 2 + g Δ u 2 σ Δ u 2
Based on the sensor specifications, laser rangefinder uncertainty σ Z = 1 m, PTZ angular uncertainty σ θ 0.3 (≈ 1.45 × 10 6 rad), and image tracking jitter σ Δ u < 2 px. At a representative measurement distance of Z = 100 m and camera focal length of 12 mm (pixel size 5.86 μ m/px, i.e., spatial resolution 0.049 m/px at 100 m), the partial derivatives yield estimated uncertainty contributions of approximately 0.35 m from laser ranging, 0.02 m from PTZ attitude, and 0.10 m from image tracking jitter, resulting in a combined amplitude uncertainty of approximately ±0.37 m (1 σ ). This is consistent with the observed field measurement errors below 0.5 m and confirms that the laser rangefinder is the dominant uncertainty source. Higher-precision ranging (e.g., phase-based laser with <0.1 m accuracy) would reduce the total uncertainty to below 0.15 m and represents the most impactful direction for future hardware upgrades.

5.3. Potential Integration with Digital Twin Frameworks

Digital twin technology—which creates a continuously updated virtual replica of a physical system by establishing bidirectional communication between the physical entity and its digital counterpart—has emerged as an important direction in smart grid applications [28,29].
Early digital twin frameworks for power systems, notably the work on power quality analysis and improvement of power-to-x plants [28], are significant for being among the first studies to combine experimental validation with the three critical components of a digital twin: the physical system, the digital model, and the real-time bidirectional data exchange layer. The proposed galloping monitoring method is well positioned to serve as the high-fidelity sensing front end of such a framework, feeding field-measured state variables (displacement, frequency, and inter-phase spacing) into the digital twin for real-time model updating and predictive maintenance.
Specifically, the proposed method outputs three continuous parameter streams in near-real-time: the displacement–time series D ( t ) , the galloping frequency F, and the minimum inter-phase spacing D min . These streams map directly onto the state variables required by finite-element or lumped-parameter digital twin models of conductor dynamics. In a digital twin architecture, the measured parameters could be used for: (1) Real-time model updating—adjusting the wind load and ice distribution parameters of the twin model to match the observed galloping frequency and amplitude, enabling a self-calibrating model that tracks the actual physical state; (2) Condition assessment—comparing measured inter-phase spacing against statutory clearance limits to generate automated risk scores; (3) Predictive monitoring—using the calibrated twin to forecast galloping amplitude growth under projected wind speed changes, providing advance warning before safety thresholds are breached; (4) Early warning—triggering alerts when the measured amplitude or spacing trajectory crosses prescribed thresholds, enabling time-critical intervention. Future work will investigate the direct integration of the proposed sensing pipeline into a digital twin framework for transmission line galloping, building on the field-validated measurement accuracy demonstrated in this study.

5.4. Advantages of SAM2 for Galloping Tracking

The adoption of SAM2 as the core segmentation and tracking engine is justified by its unique combination of zero-shot generalization, pixel-level precision, and temporal memory. The ablation study (Table 7) confirms that removing the streaming memory module results in a 22% drop in tracking success rate and a 64% increase in amplitude error, demonstrating the critical role of temporal memory for continuous galloping monitoring.
Compared with conventional tracking approaches such as correlation filters or Siamese networks, SAM2’s memory attention mechanism provides stronger resilience to the severe morphological deformation characteristic of galloping conductors. The zero-shot capability also eliminates the need for domain-specific training data, which is particularly valuable given the rarity and diversity of galloping events.

5.5. Limitations and Future Work

Several limitations of the current work should be acknowledged:
(1) Manual initialization as an operational constraint: The current system requires an operator to select target conductors on the first frame via the PAD touch interface. While this ensures deployment flexibility and eliminates the need for annotated training data, it constitutes a practical operational dependency that partially undermines the claim of fully autonomous real-time deployment. In scenarios requiring fully unattended 24/7 continuous monitoring—such as remote towers without personnel access—this initialization step would need to be automated. It is important to note that the manual step is performed only once per monitoring session and typically takes less than 10 s; subsequent tracking proceeds fully automatically. Nevertheless, future work will investigate lightweight automatic initialization using YOLO-based detection models to enable truly autonomous end-to-end monitoring.
(2) Elevation angle scalability: Simulation results (Table 5) show that, even with IPM+ELT correction, the amplitude relative error increases from 4.0% at 15° to 21.0% at 60°. This residual error arises because IPM assumes a locally planar scene geometry, which becomes increasingly violated as elevation angle grows and perspective foreshortening of catenary sag becomes significant. For practical deployment, the recommended operating elevation angle is 15°–45°, within which the amplitude error remains below 14%. For scenarios that structurally require large elevation angles (e.g., narrow terrain corridors), we recommend deploying a supplementary calibration target of known physical size within the field of view to provide an additional scale reference, or integrating a depth camera to directly acquire 3D point cloud data, bypassing the planar IPM assumption. Future work will explore multi-view fusion strategies for extreme viewing geometries.
(3) Computational requirements: While the dynamic downsampling strategy enables real-time operation at 10–15 fps on edge devices, the full SAM2 model remains computationally intensive. Future work will investigate model distillation, pruning, and TensorRT-level quantization acceleration to expand deployment options.
(4) Dataset scope and generalizability: All field data were collected from three sites in Jiangsu Province, China, during a single winter weather event in January 2026, under snow, low temperature, and Level 5 wind conditions. The conclusions on robustness and measurement accuracy should therefore be understood as applicable to the tested conditions rather than as broad generalizations. The generalizability of the proposed method to different geographic regions, summer or autumn wind-induced galloping without icing, different conductor types (e.g., ACSR vs. ACCC), or higher voltage classes (e.g., 220 kV, 500 kV UHV under other conditions) remains to be validated in future work.
(5) Ground truth for field measurements: Absolute ground truth is unavailable for field measurements, as no independent high-precision reference system was deployed simultaneously. The field results are validated primarily through physical plausibility analysis (consistency with known galloping characteristics) and cross-comparison between measurement runs. Future work should include simultaneous deployment of reference measurement systems (e.g., differential GPS on conductors) for direct accuracy validation.

6. Conclusions

This paper proposes a non-contact galloping monitoring method for overhead transmission lines that integrates SAM2 video segmentation with multi-sensor parameter fusion, implemented on a portable monitoring device. By applying SAM2’s zero-shot generalization and streaming memory architecture to conductor tracking for the first time, the proposed method achieves a segmentation IoU of 93.8% and maintains zero identity switches over 500 consecutive frames under complex field backgrounds including snow, low temperature, and poor illumination. These results represent a meaningful advance over traditional visual approaches that are limited to qualitative assessment, and outperform pixel-level baselines including XMem (87.4%) and DeAOT (88.9%) in both IoU and identity continuity.
The proposed two-stage spatial correction framework, combining vanishing-point-based inverse perspective mapping with equidistant linear transformation, effectively eliminates perspective distortion inherent in non-orthogonal field imaging. Combined with absolute depth measurements from a laser rangefinder and high-precision PTZ attitude angles, the system achieves galloping amplitude errors below 0.5 m, frequency errors below 0.1 Hz, and ranging errors below 1 m under the tested conditions, meeting State Grid engineering accuracy requirements for overhead line condition monitoring. First-order uncertainty propagation analysis confirms that the laser rangefinder is the dominant uncertainty source, contributing approximately 0.35 m to the total amplitude uncertainty of ±0.37 m (1 σ ).
Field validation at three sites in Jiangsu Province under extreme winter conditions (temperature 4 °C, Level 5 wind, continuous snowfall) confirms the practical robustness and engineering applicability of the method under the tested environmental conditions.The portable device, weighing under 15 kg, enables rapid deployment by a single operator. Measured galloping amplitudes ranging from 1.6 to 4.315 m and frequencies from 0.30 to 0.74 Hz are consistent with the physical characteristics of known icing-induced galloping. Future work will focus on (i) automatic initialization to eliminate the remaining operator dependency; (ii) multi-view fusion to extend the effective elevation angle range; (iii) model acceleration for broader edge deployment; and (iv) integration of the measurement pipeline with digital twin frameworks for real-time condition assessment and predictive early warning of galloping disasters. Beyond the four immediate directions outlined above, four additional research avenues are identified for extending the present work: (1) Multi-modal sensor fusion—integrating thermal imaging and vibration sensors alongside the vision-based pipeline to improve robustness under low-visibility conditions (fog, heavy snowfall) where optical tracking degrades. (2) Edge-cloud collaborative architecture—deploying lightweight detection models (e.g., YOLO-Nano, MobileSAM) on edge devices for real-time tracking while offloading high-fidelity twin model simulation to cloud servers, balancing latency and computational cost. (3) Long-term fatigue assessment—extending the current amplitude–frequency measurement framework to estimate cumulative mechanical stress on conductors over multiple galloping events, enabling predictive maintenance scheduling based on remaining service life rather than reactive repair. (4) Cross-seasonal validation campaigns—conducting field measurements during summer wind-induced galloping (without ice accretion) and autumn typhoon conditions to validate the method’s generalizability beyond the current winter-only dataset. Specifically, the measured galloping amplitude (A), frequency (F), and inter-phase spacing ( D min ) can serve as direct state inputs for updating conductor dynamic models within a digital twin, enabling model-based prediction of future amplitude growth and automated safety-clearance assessment. The generalizability of the proposed method to non-snow environments, different conductor configurations (e.g., ACCC, OPGW), and higher voltage classes (220–500 kV under various icing conditions) remains an important open question that future field campaigns should address.

Author Contributions

Author Contributions: Conceptualization, C.L. and N.Z.; methodology, C.L., X.T. and L.S.; software, X.T.; validation, C.L., X.T. and X.H.; formal analysis, C.L.; investigation, X.T.; resources, N.Z.; data curation, X.T.; writing—original draft preparation, C.L.; writing—review and editing, C.L., N.Z. and G.Q.; visualization, X.T.; supervision, N.Z. and L.S.; project administration, N.Z.; funding acquisition, N.Z. All authors have read and agreed to the published version of the manuscript.

Funding

This research was funded by the State Grid Jiangsu Electric Power Co., Ltd. Science and Technology Project (Grant No. JF2025019).

Institutional Review Board Statement

Not applicable.

Informed Consent Statement

Not applicable.

Data Availability Statement

The field measurement data presented in this study are available on request from the corresponding author. The data are not publicly available due to proprietary restrictions of the State Grid Jiangsu Electric Power Co., Ltd.

Conflicts of Interest

All authors are employees of State Grid Jiangsu Electric Power Co., Ltd. Electric Power Science Research Institute. The authors declare that this research was conducted in the absence of any other commercial or financial relationships that could be construed as a potential conflict of interest.

Nomenclature

The following principal symbols and abbreviations are used throughout this paper:
Symbol/
Abbreviation
Definition
AGalloping amplitude (m)
FGalloping frequency (Hz)
D min Minimum inter-phase spacing (m)
D ( t ) Conductor center displacement time series (m)
ZAbsolute distance from laser rangefinder to target conductor (m)
θ ptz PTZ gimbal pitch angle (rad)
ϕ ptz PTZ gimbal yaw angle (rad)
K Camera intrinsic matrix
f x , f y Camera focal lengths in x and y directions (px)
c x , c y Camera principal point coordinates (px)
P v ( u v , v v ) Vanishing point coordinates in image plane (px)
θ Camera elevation (pitch) angle estimated from vanishing point (rad)
γ Camera yaw angle estimated from vanishing point (rad)
H IPM Inverse perspective mapping homography matrix
H joint Joint spatial correction matrix combining IPM, ELT, ranging and PTZ data
s x ( u ) Horizontal dynamic scale coefficient for equidistant linear transformation
P user Operator-selected touch point on the first frame (px)
P center Center-adsorption-refined conductor prompt point (px)
RSearch radius for center adsorption algorithm (px)
SConductor skeleton feature point set
KNumber of spatial sub-intervals for grouped polynomial fitting
NSAM2 streaming memory bank size (frames)
A ^ Estimated galloping amplitude (m)
σ A ^ Standard uncertainty of amplitude estimate (m)
σ Z , σ θ , σ Δ u Standard uncertainties of laser range, PTZ angle, and pixel displacement
ADFAugmented Dickey–Fuller stationarity test
ELTEquidistant Linear Transformation
FFTFast Fourier Transform
IMUInertial Measurement Unit
IoUIntersection over Union (segmentation accuracy metric)
IPMInverse Perspective Mapping
PCAPrincipal Component Analysis
PTZPan–Tilt–Zoom gimbal unit
SAM2Segment Anything Model 2

References

  1. Den Hartog, J.P. Transmission line vibration due to sleet. Trans. Am. Inst. Electr. Eng. 1932, 51, 1074–1076. [Google Scholar] [CrossRef]
  2. Nigol, O.; Buchan, P.G. Conductor galloping—Part II: Torsional mechanism. IEEE Trans. Power Appar. Syst. 1981, PAS-100, 708–720. [Google Scholar] [CrossRef]
  3. Yu, P.; Desai, Y.M.; Shah, A.H.; Popplewell, N. Three-degree-of-freedom model for galloping. Part I: Formulation. J. Eng. Mech. 2000, 119, 2404–2425. [Google Scholar] [CrossRef]
  4. Lu, J.; Wang, Q.; Wang, L.; Tu, D.; Gao, Z.; Zhang, L. Study on wind-induced conductor galloping and its prevention measures. High Volt. Eng. 2022, 48, 3573–3583. [Google Scholar]
  5. China Meteorological Administration. China Climate Change Blue Book 2023; Science Press: Beijing, China, 2023. [Google Scholar]
  6. State Grid Jiangsu Electric Power Co., Ltd. Report on Icing Galloping Events in Jiangsu Province (2023–2024); Internal Report; State Grid Jiangsu Electric Power Co., Ltd.: Nanjing, China, 2024. [Google Scholar]
  7. Yin, S.; Li, L.; Yang, F. Study on visual inspection methods for overhead transmission line galloping. Electr. Power 2020, 53, 158–165. [Google Scholar]
  8. Hung, P.C.; Voce, H.; Cheung, S.D. Galloping monitoring of overhead transmission lines using GPS. In Proceedings of the IEEE PES General Meeting, National Harbor, MD, USA, 27–31 July 2014; IEEE: Piscataway, NJ, USA, 2014; pp. 1–5. [Google Scholar]
  9. Liu, X.; Yang, S.; Jiang, X.; Hu, J. Research on on-line monitoring system for transmission line galloping based on acceleration sensors. Power Syst. Technol. 2020, 44, 3918–3924. [Google Scholar]
  10. Zhang, M.; Zhao, M.; Li, T.; Li, H. Application and analysis of video monitoring in transmission line galloping. Electr. Power Inf. Commun. Technol. 2019, 17, 78–83. [Google Scholar]
  11. Li, H.; Liu, L.; Du, J.; Jiang, F.; Guo, F.; Hu, Q. An Improved YOLOv3 for Foreign Objects Detection of Transmission Lines. IEEE Access 2022, 10, 45620–45628. [Google Scholar] [CrossRef]
  12. Liu, J.; Liu, C. Review of Deep Learning-Based Intelligent Inspection Research for Transmission Lines. CMC-Comput. Mater. Contin. 2026, 87, 155–198. [Google Scholar] [CrossRef]
  13. Zhao, W.; Xu, M.; Cheng, X. Transmission line extraction using semantic segmentation based on U-Net. J. Phys. Conf. Ser. 2020, 1651, 012167. [Google Scholar] [CrossRef]
  14. Ravi, N.; Gabeur, V.; Hu, Y.-T.; Hu, R.; Ryali, C.; Ma, T.; Khedr, H.; Rädle, R.; Rolber, C.; Gustafson, L.; et al. SAM 2: Segment Anything in Images and Videos. arXiv 2024, arXiv:2408.00714. [Google Scholar]
  15. Gurung, C.B.; Yamaguchi, H.; Yukino, T. Identification of large amplitude wind-induced vibration of ice-accreted transmission lines based on field observed data. Eng. Struct. 2002, 24, 179–188. [Google Scholar] [CrossRef]
  16. Luo, B.; Xu, X.; Chen, C.; Cao, M. Field measurement and analysis of transmission line galloping based on inertial measurement unit. Proc. CSEE 2018, 38, 5864–5872. [Google Scholar]
  17. Li, X.; Zhang, J.; Niu, H. Galloping monitoring using fiber Bragg grating sensors on overhead transmission lines. Opt. Fiber Technol. 2019, 50, 62–69. [Google Scholar] [CrossRef]
  18. Zhang, J.; Wang, B.; Ma, H.; Wang, L.; Wang, H.; Ma, F.; Luo, P. A Review of Intelligent Depth Distance Perception Research for Power Transmission Line Corridor Scenarios. Processes 2024, 12, 2392. [Google Scholar] [CrossRef]
  19. Zhu, K.; Wang, Y.; Liu, H.; Li, R. Monocular vision-based monitoring method for transmission line galloping amplitude. High Volt. Eng. 2021, 47, 3048–3056. [Google Scholar]
  20. Li, X.; Wang, S.; Zhang, D. Image-based galloping monitoring of overhead transmission lines using Canny-Hough algorithm. Electr. Power Autom. Equip. 2014, 34, 53–58. [Google Scholar]
  21. Nguyen, V.N.; Jenssen, R.; Roverso, D. Automatic autonomous vision-based power line inspection: A review of current status and the potential role of deep learning. Int. J. Electr. Power Energy Syst. 2018, 99, 107–120. [Google Scholar] [CrossRef]
  22. Zhao, C.; Li, B.; Xu, Z.; Huang, Z. Improved YOLO-based detection method for insulators in power transmission lines. Electronics 2023, 12, 1295. [Google Scholar] [CrossRef]
  23. Kirillov, A.; Mintun, E.; Ravi, N.; Mao, H.; Rolber, C.; Gustafson, L.; Xiao, T.; Whitehead, S.; Berg, A.C.; Lo, W.-Y.; et al. Segment Anything. In Proceedings of the IEEE/CVF International Conference on Computer Vision (ICCV), Paris, France, 2–6 October 2023; IEEE: Piscataway, NJ, USA, 2023; pp. 4015–4026. [Google Scholar]
  24. You, Z.; Shi, J.; Guo, X. SAM2MOT: Extending SAM 2 for Multi-Object Tracking in Videos. arXiv 2024, arXiv:2411.05457. [Google Scholar]
  25. Cheng, H.-K.; Schwing, A.G. XMem: Long-Term Video Object Segmentation with an Atkinson-Shiffrin Memory Model. In Proceedings of the European Conference on Computer Vision (ECCV), Tel Aviv, Israel, 23–27 October 2022; Springer: Cham, Switzerland, 2022; pp. 640–658. [Google Scholar]
  26. Yang, Z.; Wei, Y.; Yang, Y. Decoupling Features in Hierarchical Propagation for Video Object Segmentation. In Proceedings of the Advances in Neural Information Processing Systems (NeurIPS), New Orleans, LA, USA, 28 November–9 December 2022; Volume 35, pp. 36324–36336. [Google Scholar]
  27. Moghadam, P.; Starzyk, J.A.; Wijesoma, W.S. Fast vanishing-point detection in unstructured environments. IEEE Trans. Image Process. 2012, 21, 425–430. [Google Scholar] [CrossRef]
  28. Fathollahi, A.; Andresen, B. Power quality analysis and improvement of power-to-x plants using digital twins: A practical application in Denmark. IEEE Trans. Energy Convers. 2025, 40, 1909–1921. [Google Scholar] [CrossRef]
  29. Ahmad, I.; Zhang, Y.; Liu, W.; Huang, K. Digital twin of wireless network: Concepts, architectures, use cases, and future directions. IEEE Commun. Surv. Tutor. 2022, 24, 2421–2455. [Google Scholar] [CrossRef]
Figure 1. Technical framework of the proposed SAM2-based galloping parameter measurement method. The pipeline consists of four stages: detection initialization, segmentation and tracking, contour extraction and fitting, and multi-parameter fusion calculation.
Electronics 15 02305 g001
Figure 2. The intelligent high-precision portable transmission line galloping detection device independently developed by the project team. (a) Full view of the device deployed at the Lianyungang field site under snowfall conditions. (b) Close-up of the observation module showing the co-axially integrated industrial camera and laser rangefinder.
Electronics 15 02305 g002
Figure 3. Representative Field measurement scenes at the Huai’an site under extreme winter weather (temperature 4 °C, Level 5 wind, continuous snowfall). The Chinese character in the figure represents the unit meter (m). (a) Close-range view of the transmission tower captured by the device center camera. (b) Wide-angle view captured by the device left camera, showing the full monitored span with visible conductor galloping.
Electronics 15 02305 g003
Figure 4. Visual comparison of segmentation results across four methods. The proposed SAM2-based method achieves the highest IoU (93.8%) with clean mask boundaries and zero ID switches over 500 consecutive frames.
Electronics 15 02305 g004
Figure 5. Inter-frame tracking jitter analysis over 500 consecutive frames. The proposed method maintains sub-2-pixel jitter in static edge tracking, significantly outperforming baseline approaches.
Electronics 15 02305 g005
Figure 6. Galloping amplitude measurement error versus camera elevation angle, comparing results without IPM correction and with the proposed IPM + Equidistant Linear Transformation approach. The proposed correction significantly reduces measurement error at all viewing angles.
Electronics 15 02305 g006
Figure 7. Amplitude–time curve extracted from the Lianyungang site field measurement, showing a clear sinusoidal galloping pattern with a dominant frequency of 0.30 Hz and maximum amplitude of 2.333 m (25 fps, 500 frames per segment).
Electronics 15 02305 g007
Figure 8. FFT frequency spectrum of the galloping displacement signal from the Lianyungang site. The dominant peak at 0.30 Hz corresponds to the fundamental galloping frequency, with minor harmonics visible at higher frequencies.
Electronics 15 02305 g008
Figure 9. Detailed case study results from the Lianyungang field measurement, including multi-frame tracking visualization, conductor contour extraction, and parameter calculation output.
Electronics 15 02305 g009
Figure 10. Comparison of galloping parameters across the three field measurement sites (Huai’an, Lianyungang, and Suqian), showing the variation in amplitude, frequency, and inter-phase spacing under different environmental conditions.
Electronics 15 02305 g010
Figure 11. Ablation study visualization showing the impact of removing individual modules on measurement accuracy. IPM removal causes the largest degradation, while streaming memory removal leads to tracking failures.
Electronics 15 02305 g011
Table 1. Hardware specifications of the portable galloping detection device.
ModuleComponentKey Specifications
Industrial cameraSony IMX290 sensor1280 × 720 px, 25 fps, 12 mm lens, pixel size 5.86  μ m
Laser rangefinderPulsed laser unitRange: 20–500 m, Accuracy: <1 m, Rate: 10 Hz
PTZ unitHarmonic drive gimbalLoad: ≥3 kg, Angular step: ≤0.3″, Absolute encoder
Edge computingNVIDIA Jetson AGX Orin64 GB RAM, 275 TOPS AI, TensorRT inference
HCI terminalIndustrial-grade tablet10.1 in., IP65, 802.11ax Wi-Fi, touch point selection
Total systemTripod-mountedWeight: ≤15 kg, Setup time: <5 min
Table 2. Summary of field measurement sites and conditions.
SiteDateVoltageTemp.WeatherVisibility
Lianyungang, Xianfeng Rd.19 January 2026110 kV 4 °CSnow, Level 5 windPoor
Huai’an, Baojitown19 January 2026110 kV 4 °CSnow, Level 5 windPoor
Suqian, Shuanggou19 January 2026500 kVLowSnow + Strong windPoor
Table 3. Comparison of segmentation and tracking performance across different methods.
MethodIoU (%)Precision (%)Recall (%)ID SwitchesJitter (px)
Canny + Hough (Baseline)45.252.848.5>10
YOLO11 (frame-by-frame)<80.0 a82.479.18>5
Mask R-CNN + SORT83.686.182.954.1
XMem [25]87.489.386.833.2
DeAOT [26]88.990.788.222.9
SAM2 (single-frame, no memory)89.391.688.7123.8
Proposed method93.895.294.10<2
a Bounding box used as proxy for contour; actual contour IoU is lower. Mask R-CNN + SORT, XMem, and DeAOT all produce native pixel-level masks and constitute fair pixel-level comparisons with the proposed method.
Table 4. Tracking robustness under occlusion, conductor crossing, and deformation. All values averaged over 50 clips per condition.
ConditionIoU (%)Track. Succ. (%)ID SwitchesRecovery (Frames)
No occlusion (baseline)93.81000
Partial occlusion (≤10%)92.11000
Moderate occlusion (10–20%)89.6980
Severe occlusion (20–30%)85.3941<5
Conductor crossing event83.7912<8
Rapid deformation (>50% shape change)87.2960
Track. Succ. = percentage of clips in which the target conductor is continuously tracked without loss. Recovery = number of frames to re-acquire the target after occlusion ends. “–” denotes no recovery required (no tracking loss occurred).
Table 5. Simulation verification results at different camera elevation angles. True galloping amplitude: 2.0 m, true frequency: 0.5 Hz.
Elevation
Angle
Without IPMWith IPM + ELTFreq. Error
(Hz)
Amp. Err. (m) Rel. (%) Amp. Err. (m) Rel. (%)
15°0.126.00.084.0<0.05
30°0.3115.50.157.5<0.05
45°0.5829.00.2814.0<0.08
60°0.9447.00.4221.0<0.10
IPM = Inverse Perspective Mapping; ELT = Equidistant Linear Transformation.
Table 6. Summary of field measurement results from three sites.
SiteMax Amp. (m)Main Freq. (Hz)Min Phase Sp. (m)Lines Tracked
Huai’an, Baojitown4.3150.377.993
Lianyungang, Xianfeng Rd.2.3330.309.5593
Suqian, Shuanggou (500 kV)1.6000.742
Table 7. Ablation study results on the simulation platform (elevation angle: 30°, true amplitude: 2.0 m).
ConfigurationAmp. Error (m)Tracking Success (%)
Full pipeline (proposed)<0.50100
– SAM2 tracking (single-frame only)0.8278
– Anomaly group elimination+0.25 (random jump)100
– IPM0.94100
– Equidistant linear transform<0.50 (amp. OK) a100
a Amplitude remains acceptable, but lateral spacing error increases by ∼5%.
Table 8. Parameter sensitivity analysis results (benchmark: elevation 30°, true amplitude 2.0 m).
ParameterTest RangeAmp. Error VariationTrack. Succ. (%)Recommended
Memory bank size N2, 4, 6, 8, 10 frames±0.12 m at N = 2 ; stable N 4 94%→100%6
Z-score threshold2.0, 3.0, 4.0, 5.0+0.20 m (random jump) at >4.0100%3.0
Fitting intervals K5, 10, 15, 20, 30+0.18 m at K = 5 ; stable K 10 100%10–20
Prompt placement error0, 5, 10, 15, 20 px<0.05 m for ≤10 px error100%≤10 px
Table 9. Summary of key algorithm parameters.
ParameterValueDescription
Point adsorption search radius R40 pxLocal search constraint
SAM2 memory bank size N6 framesShort-term memory window
Processing frame rate10–15 fpsDynamic downsampling
Grouped fitting sub-intervals K10–20Depends on conductor span
Local fitting max iterations10,000Convergence guarantee
Z-score anomaly threshold | Z | > 3 Outlier detection sensitivity
Resampling contour points200Standard output resolution
Laser rangefinder accuracy<1 mGlobal scale benchmark
PTZ angular step≤0.3″ Attitude feedback precision
Table 10. Qualitative comparison of galloping monitoring methods.
MethodContactPortableQuantitativeCostReal-Time
Manual inspectionNoYesLowLowNo
IMU/GPS sensorsYesNoHighHighYes
Fixed camera (qualitative)NoNoLowMediumYes
Binocular stereo visionNoLowHighHighMedium
Proposed methodNoYesHighMediumYes
Disclaimer/Publisher’s Note: The statements, opinions and data contained in all publications are solely those of the individual author(s) and contributor(s) and not of MDPI and/or the editor(s). MDPI and/or the editor(s) disclaim responsibility for any injury to people or property resulting from any ideas, methods, instructions or products referred to in the content.