Article

Assessing the Impact of HVDC Interconnections on Transmission Networks with High Renewable Penetration: The Sicilian Case of the TUN-ITA and Tyrrhenian Link


1
Terna S.p.A., 00156 Rome, Italy
2
Department of Engineering, University of Palermo, 90128 Palermo, Italy
*
Author to whom correspondence should be addressed.
Electronics 2026, 15(10), 2121; https://doi.org/10.3390/electronics15102121
Submission received: 17 April 2026 / Revised: 9 May 2026 / Accepted: 12 May 2026 / Published: 15 May 2026
(This article belongs to the Special Issue Application of Microgrids in Power System)

Abstract

This paper investigates the impact of renewable energy source (RES) integration on the Sicilian transmission network, considering the commissioning of new Mediterranean interconnections, namely the TUN-ITA and the Tyrrhenian Link. The expansion of transmission infrastructures and the increasing penetration of RES require an assessment of the Sicilian power system’s capability to accommodate high levels of power injection. This study was carried out in collaboration with the Italian transmission system operator Terna S.p.A. and the University of Palermo. It aims to evaluate the evolution of transmission line loading under future RES integration scenarios consistent with grid connection requests submitted to Terna and with national energy policy targets. The proposed methodology integrates micro-zonal assessments of wind and solar potential, estimation of capacity factors, development of RES capacity expansion scenarios, and steady-state power flow simulations. The simulations were performed using WinCreso® software version 7.69 for three time horizons: 2028, 2029, and 2035. The results show the most congested transmission lines and the network areas most exposed to congestion. The analysis provides operational insights for prioritizing grid reinforcement measures and proposes a replicable methodological framework for other transmission system operators facing similar RES integration challenges.

1. Introduction

The European Union has set ambitious targets to tackle climate change, reduce reliance on fossil fuels, and speed up the deployment of renewable energy sources. The European Green Deal [1] aims to achieve climate neutrality by 2050 and to reduce greenhouse gas emissions by 55% by 2030 compared with 1990 levels. In line with these targets, Italy has adopted the Integrated National Energy and Climate Plan (PNIEC) [2], which aims to cover more than 63% of national electricity demand through renewable energy sources by 2030. Table 1 summarizes the national RES capacity targets to be achieved by 2030 [2].
Although renewable energy sources are now widely deployed, integrating them into power systems poses several operational challenges [3]. These include the variability and limited predictability of RES generation, which complicate dispatch operations and increase the risk of overgeneration and network congestion during periods of high production [4]. In this context, Terna S.p.A., the Italian Transmission System Operator (TSO), plays a pivotal role in facilitating the transition to a more complex electricity system. Through its 2025 Development Plan (PDS) [5], the company has scheduled investments totaling over EUR 23 billion to strengthen transmission infrastructure, with the aim of ensuring system security, adequacy, efficiency, and flexibility. Within this framework, Sicily is expected to become a key energy hub for both the national and European power systems owing to its strategic geographical location and significant renewable potential (wind and solar) [6]. The Tyrrhenian Link [7] is the most significant infrastructure project in Terna’s 2025 Development Plan. The project consists of two High Voltage Direct Current (HVDC) branches (East and West), each with a capacity of 1000 MW. The total length is approximately 970 km, mostly consisting of submarine cables, connecting Sicily with Campania and Sardinia. This interconnection will increase transfer capacity between market zones, support the integration of renewable energy sources and improve cross-zonal power exchanges [8]. Additional cross-border interconnections are also planned, including the Italy–Tunisia interconnection, also known as the TUN-ITA link [9]. This strategic project is based on HVDC technology and will connect the Italian and Tunisian power systems through a submarine cable link. It is expected to strengthen energy cooperation between Europe and North Africa while supporting the integration of renewable energy sources and improving overall system security [10]. Figure 1a illustrates the Sicilian high- and extra-high-voltage transmission network configuration as of 2024, whereas Figure 1b depicts the projected network configuration for 2030. The latter includes the two HVDC interconnections between Sicily, Campania, and Sardinia (Tyrrhenian Link, East and West branches), as well as the interconnection between Sicily and Tunisia, which are scheduled to be commissioned by Terna in the coming years. The red, green, and purple lines represent the 380 kV lines, the 220 kV lines, and the HVDC interconnections, respectively.
The new transmission infrastructure is based on HVDC technology [12]. It is widely used for long-distance power transmission because it reduces transmission losses, allows better control of power flows, and enables the interconnection of asynchronous power systems [13]. Recent studies have also highlighted the increasing role of advanced power conversion and control technologies in supporting renewable energy integration and improving the operational flexibility of power systems [14].
Comprehensive analyses are required to evaluate the future operational and structural impacts of transmission networks, identify critical areas, and support the planning of priority reinforcement measures. Many international studies have addressed these challenges in recent years. Reference [15] suggests using a high-resolution methodology to assess wind and photovoltaic potential of the smaller Sicilian islands on a microzonal scale. This approach integrates meteorological and satellite data with land use constraints and local regulatory frameworks. It provides a rigorous and replicable framework for the spatial assessment of renewable resources. In [16], the authors emphasize the importance of spatial disaggregation through microzonal subdivision. Their study shows that a higher geographical resolution, obtained by clustering European regions into homogeneous wind and solar potential zones, allows a more accurate assessment of renewable generation potential and transmission network congestion. This improved resolution enables more effective transmission network planning. In [17], a microzonal approach is proposed that employs empirical orthogonal function (EOF) analysis and Max-p regionalization to identify areas characterized by similar temporal wind and solar resource profiles. It enables a more accurate representation of renewable energy potential. In [18], photovoltaic generation potential was evaluated by integrating official climate datasets with Capacity Factor (CF) analysis, in line with long-term emission scenarios. However, forward-looking scenarios were not implemented in power flow simulation environments. Reference [19] presents a methodology for assessing the maximum RES hosting capacity of the Italian 150 kV sub-transmission network, with particular focus on areas with a high concentration of connection requests in Southern Italy and Sicily. The analysis is based on power flow simulations under N-1 contingency conditions and considering the most critical operating scenarios for 2030, characterized by maximum RES generation and minimum demand. The study in [20] introduces a pan-European modeling framework to quantify curtailment associated with high levels of wind and photovoltaic generation under the European “Large-Scale RES” 2050 scenario (derived from the ENTSO-E TYNDP and e-Highway 2050 frameworks). The results show that transmission congestion, particularly between Northern and Central Europe, is the main limiting factor for large-scale RES integration. Reference [21], analyzes the evolution of the Sicilian power system over the 2030–2040 horizon under scenarios characterized by significant RES expansion. Dynamic simulations performed in NEPLAN are used to evaluate the strategic role of the planned HVDC interconnections (Tyrrhenian Link and TUN-ITA). It also evaluates the contribution of their advanced control functionalities, including grid-forming capability and synthetic inertia, to frequency stability and overall system robustness. Reference [11] presents a study that develops short-term RES capacity expansion scenarios based on actual connection requests submitted to the local TSO for new wind and photovoltaic plants connected to the high-voltage (HV) network. Power flow simulations, performed using dedicated software tools, are used to assess the impact of increased renewable generation on short-term transmission network operation. However, the proposed scenarios do not consider national RES development targets and do not assess medium-term system evolution, including the commissioning of new interconnections. In [22], power flow analyses are performed in NEPLAN using a short-term transmission network model that includes planned interconnections. The study evaluates the effects of high-RES integration under the Fit-for-55 scenarios. However, these scenarios do not consider current HV connection requests. In addition, the analysis focuses only on extreme operating conditions (maximum generation, peak demand, and maximum imports) to test system security and robustness, without examining representative or average operating conditions.
The proposed methodology in this study takes a multidisciplinary approach, integrating climate resource assessment and renewable generation potential analysis with the development of future RES capacity expansion scenarios and power flow simulations.
The main contribution of this work is the proposed methodology for estimating monthly capacity factors at the micro-zonal scale under conditions of limited data availability. The study also develops RES capacity expansion scenarios based on both actual connection requests submitted to the TSO and national energy targets. In addition, the transmission grid loading is analyzed under intermediate operating conditions, which are more representative of normal system operation than the extreme scenarios commonly considered in the literature.
The results of the developed scenarios are implemented within dedicated simulation software to perform steady-state power flow analyses under both normal (N) and N-1 contingency conditions.
These analyses identify the transmission lines and network areas most exposed to potential overloading. The proposed approach provides an objective and replicable decision-support tool for transmission planning and network reinforcement in systems with increasing renewable penetration. The methodology is applied to a medium-term case study (2028–2035) of the Sicilian transmission network, considering the commissioning of the TUN-ITA and Tyrrhenian Link HVDC interconnections.
The remainder of the paper is organized as follows. Section 2 details the proposed methodology, including renewable resource assessment, generation potential estimation, and medium-term scenario development. Section 3 describes the Sicilian transmission network case study. Section 4 presents and discusses the results of the steady-state power flow analysis under normal and contingency conditions.
Finally, Section 5 summarizes the main findings and outlines solutions for future developments.

2. Methodology

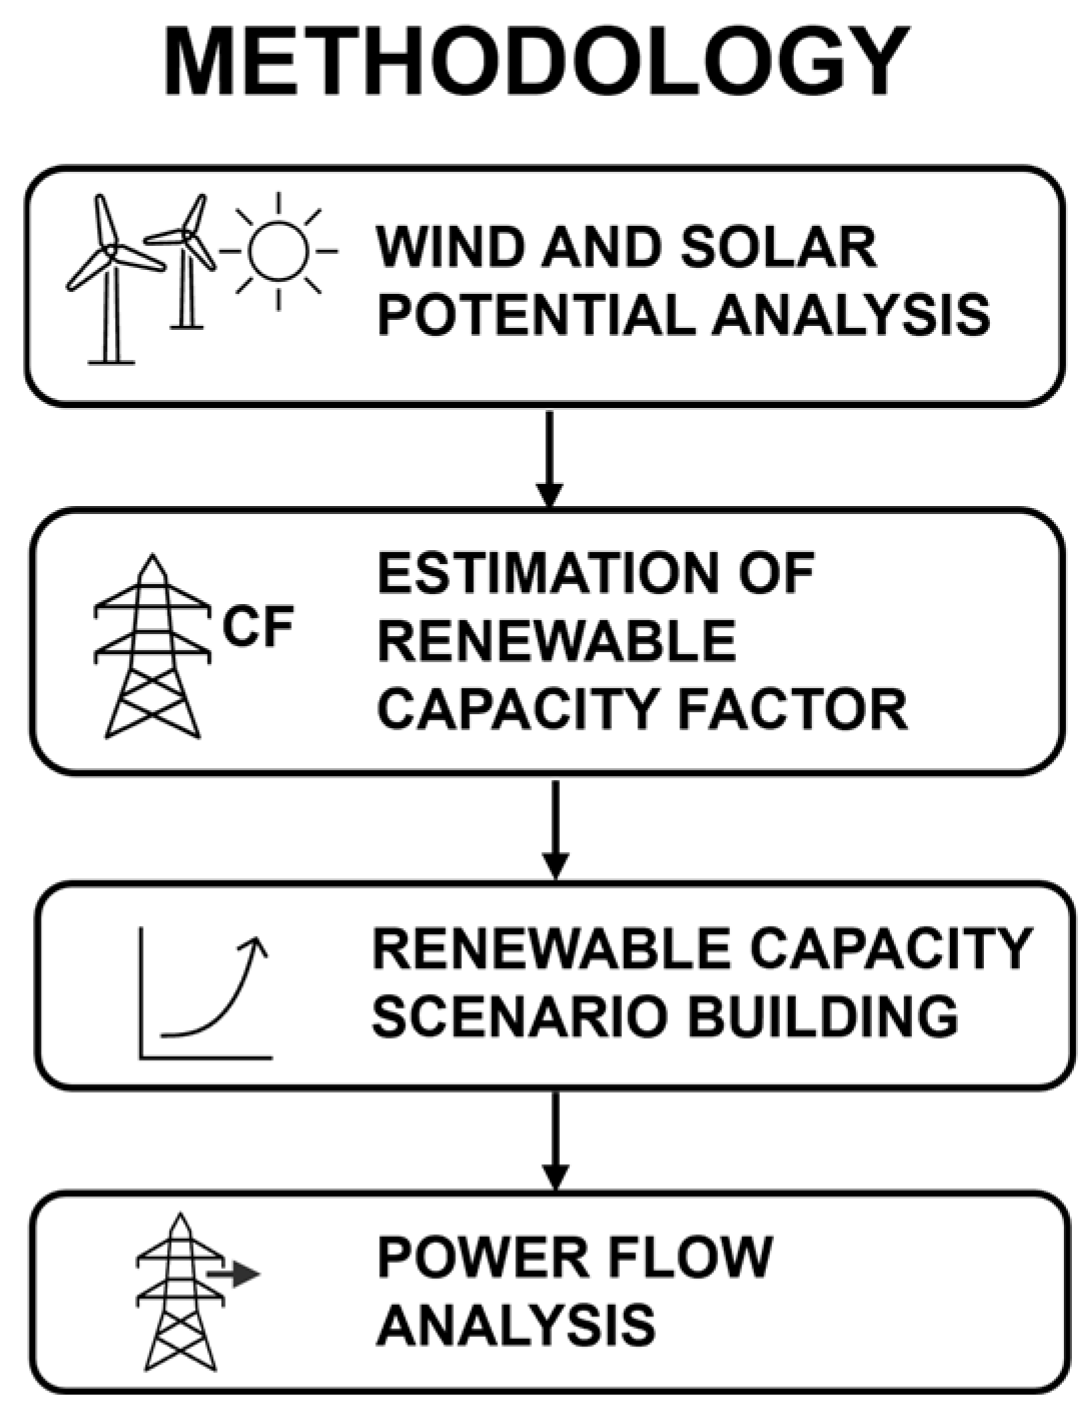
This section describes the methodology adopted to evaluate the impacts on the transmission network, considering both the development of new transmission infrastructure and the projected RES capacity expansion scenarios. Particular attention is given to transmission line loading conditions. The methodological framework is structured into four main phases: (i) assessment of wind and solar resource potential in the study areas; (ii) estimation of the CF of renewable plants connected to the HV network; (iii) development of RES capacity expansion scenarios; and (iv) steady-state power flow analysis of the transmission network to identify the lines and network areas potentially subject to higher loading levels under future operating conditions. Figure 2 provides a schematic overview of the main stages of the proposed methodology.

2.1. Assessment of Wind and Solar Resource Potential

To perform a detailed assessment of renewable resource potential, plant productivity, and RES capacity projections within the study area, a spatial discretization approach based on the subdivision of the territory into geographical microzones was adopted. The study area was partitioned into geographical microzones by dividing the overall latitude and longitude ranges into uniform intervals. The intersection of these intervals generated a regular grid of well-defined spatial cells.
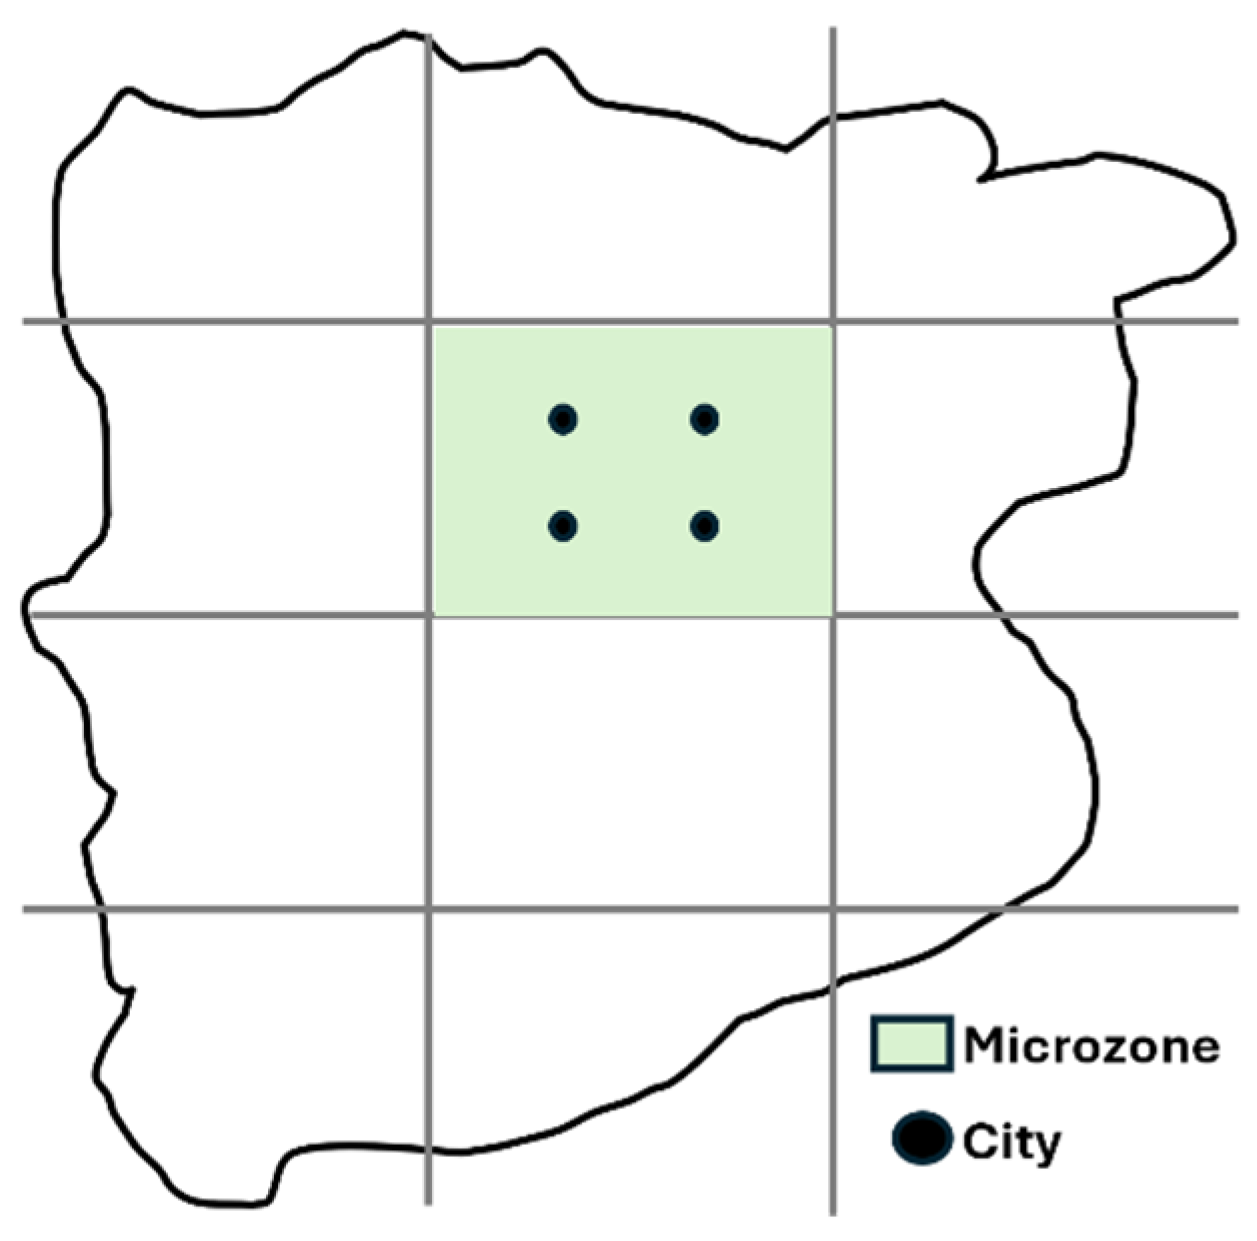
The adopted spatial resolution was selected as a trade-off between accurately representing the main spatial variability of wind and solar resources and limiting the computational burden of the subsequent capacity factor estimation and forecasting scenario generation processes. In addition, the grid discretization was designed to represent the areas realistically suitable for wind and photovoltaic plant deployment, while avoiding an unnecessary level of detail in morphologically unsuitable or technically infeasible microzones for RES installations. Only those microzones deemed suitable for renewable energy exploitation, considering both technological feasibility and economic viability, were retained for further analysis. For each microzone, several cities were selected and evenly distributed across the territory to ensure a representative sample of the microzone’s climatic conditions. Figure 3 illustrates an example of the spatial discretization into regular microzones and the selection of representative sampling points within a microzone.
A one-year period was adopted for the analysis, as it captures climatic conditions over a longer time span. For each selected location, hourly time series data were obtained for wind speed at 10 m above ground level and global horizontal irradiance (GHI) for a Typical Meteorological Year (TMY). The TMY dataset [23] for each location is generated by selecting the most statistically representative monthly data from a long-term database of hourly observations (e.g., from the last 20 years). This process creates a synthetic year that reflects the site’s typical climatic conditions. The meteorological data were retrieved from the Photovoltaic Geographical Information System (PVGIS-ERA5) platform [24], developed by the Joint Research Centre (JRC) of the European Commission, which provides hourly meteorological variables at an international scale. In particular, the solar radiation data are derived from the CM SAF (Satellite Application Facility on Climate Monitoring) [25], based on satellite observations with a spatial resolution of approximately 4 km. The hourly wind speed data at 10 m above ground level were primarily sourced from ground-based meteorological stations available through the Integrated Surface Database (ISD), which is maintained by the National Oceanic and Atmospheric Administration (NOAA) [26]. Where necessary, these datasets were complemented with measurements from the German Meteorological Service (DWD—Deutscher Wetterdienst) [27]. Given the strong seasonal variability of climatic conditions, a monthly based analysis was adopted to characterize the average behavior of wind and solar resource potential. The mean hourly values of the relevant meteorological variables, namely wind speed and global horizontal irradiance, were computed for each month and for all representative locations within each microzone. The average hourly wind speed and solar irradiance were calculated for each selected location by considering all hourly observations within the corresponding month. Then, the resulting monthly averages for each location were spatially aggregated to obtain a representative value for the entire microzone. The average wind speed in the i-th microzone during the m-th month was therefore calculated as follows:
V ¯ i , m = 1 C i c C i 1 H c , m h H c , m V h , c , m
where V i , m denotes the average wind speed in the i-th microzone during the m-th month; C i represents the set of representative locations within the i-th microzone, with C i indicating the number of locations in the set; H c , m denotes the set of hourly observations in the m-th month for the c-th location, with H c , m corresponding to the total number of hours in that month; and V h , c , m is the wind speed recorded at hour h for location c during month m. An analogous formulation was adopted to estimate the average monthly solar irradiance in each microzone by replacing the wind speed variable with the corresponding solar radiation term. This procedure yielded 12 monthly average values (one for each month), representative of the climatic conditions of each microzone throughout the year. To identify microzones exhibiting similar wind and solar resource profiles across two distinct territories, the Euclidean distance (ED) metric [28] was employed. This metric quantifies the difference between the respective monthly average values by considering the entire annual profile:
E D m , n = i = 1 12 ( x ¯ m , i ( 1 ) x ¯ n , i 2 ) 2
where E D m , n denotes the Euclidean distance between the average monthly climatic profile of microzone m in the first territory and that of microzone n in the second territory, computed over the 12 months of the year. The term x m , i 1 represents the average climatic variable (i.e., average wind speed or solar irradiance) for the i-th month in the m-th microzone of the first territory, while x n , i 2 represents the corresponding average climatic variable for the i-th month in the n-th microzone of the second territory. The summation index i ranges over the 12 months of the year (from January to December). The subscript m identifies the specific microzone in the first territory, whereas the subscript n identifies the microzone in the second territory with which microzone m is being compared. The Euclidean distance formulation is applied to all possible combinations to compare each microzone in the first territory with every microzone in the second territory. The microzone in the second territory with the minimum E D m , n value is identified as exhibiting the highest climatic similarity to the reference microzone in the first territory. This procedure allows for a quantitative assessment of climatic similarity between microzones as well as the identification of pairs of microzones across distinct territories that have comparable annual climatic profiles.
In this study, no formal sensitivity analysis was performed to evaluate the impact of spatial resolution on capacity factor estimation. However, the adopted discretization scheme is considered adequate to capture the main climatic differences among the analyzed microzones and to provide representative estimates of the monthly average capacity factor values, consistent with the objectives of the study.
Nevertheless, a multi-resolution analysis aimed at systematically quantifying the effect of grid size on capacity factor estimation could represent a valuable extension of the proposed methodology in future work.

2.2. Estimation of the Capacity Factor of RES Plants

After analyzing the climate characteristics of the microzones within the study areas, the CF of the renewable production units was estimated. The CF of wind and photovoltaic plants was evaluated to estimate the expected energy production and the corresponding power injection into the transmission network as a function of installed capacity. This estimation was required as input data for the power flow simulation software. In its general formulation, the CF is defined as the ratio between the actual electrical energy delivered to the grid by the plants located in the j-th geographical area over a given time interval τ and the theoretical energy that would be generated if the plants operated continuously at nominal capacity throughout the same period [29].
C F j , τ = E i n j , j , τ P n o m , j × N h , τ [ - ]
E i n j , j , τ N h , τ = P n o m , j × C F j , τ [ MW ]
P i n j , j = P n o m , j × C F j , τ [ MW ]
where C F j , τ denotes the CF in the j-th area evaluated over the time interval τ ; E i n j , j , τ represents the actual electrical energy injected into the grid by the plants located in the j-th area during period τ ; P n o m , j is the total nominal (installed) capacity of the plants in the j-th area; and N h , τ denotes the total number of hours in period τ ; P i n j , j denotes the active power injected into the grid by the generating plants located in the j -th considered area. The CF is a widely used performance indicator that measures the utilization level of generation assets, considering resource availability and plant operational characteristics. It can be evaluated over different time horizons (annual, monthly, weekly, or daily) and at different spatial scales, ranging from national or regional aggregates to individual generating units.
In this study, the CF of wind and photovoltaic plants was evaluated monthly for all microzones within the study area. Accordingly, the following formulation was adopted:
C F i , m = E i n j , i , m P n o m , i   ×   N h , m [ - ]
where C F i , m denotes the CF evaluated in the i-th microzone over the monthly time interval; E i n j , i , m represents the actual electrical energy injected into the grid by the plants located in the i-th microzone during month m; P n o m , i is the total nominal (installed) capacity of the plants within the same microzone; and N h , m denotes the total number of hours in month m. This formulation was applied iteratively to all defined microzones (according to the approach described in Section 2.1) and for each month of the year. Depending on data availability in each territory the CF was estimated using two different methodologies. In territories where sufficient historical data were available, the CF was directly computed using its analytical definition. In territories lacking the necessary data, an analogy-based approach was adopted. This approach assumes that micro-zones with similar wind and solar resource potential produce comparable energy yields, due to the strong correlation between CF values and the corresponding meteorological variables. The procedure for each month consists of identifying the microzone in the first territory (for which the CF is known) that is climatically most similar to a given microzone in the second territory (for which the CF is unknown) based on wind speed or solar irradiance. Then, the CF of the identified reference microzone is assigned to the corresponding microzone in the second territory after applying an appropriate correction coefficient to account for residual climatic differences between the two areas.
The correction coefficient was derived from a proportional relationship between the CF and the corresponding climatic variables, based on the observed strong correlation between these quantities. The proportionality expression used to estimate the wind CF in microzones where the necessary data for direct computation through the analytical formulation were unavailable is reported below:
C F i , j 1   w i n d C F m , n 2 , w i n d = v ¯ i , j ( 1 ) v ¯ m , n ( 2 )
C F m , n 2   w i n d = v ¯ m , n ( 2 ) v ¯ i , j ( 1 ) × C F i , j 1   w i n d
k C F , i , j w i n d = v ¯ m , n ( 2 ) v ¯ i , j ( 1 )
where C F m , n 2   w i n d denotes the wind CF evaluated in month m for microzone n in Territory 2 (with unknown CF); C F i , j 1   w i n d is the wind CF evaluated in month i for microzone j of Territory 1 (with known CF), identified as the climatically most similar to the microzone under consideration in Territory 2 (with unknown CF); v ¯ m , n 2 is the average wind speed in month m for microzone n of Territory 2 (with unknown CF); v ¯ i , j 1 is the average wind speed in month i for microzone j of Territory 1 (with known CF), identified as the climatically most similar to the microzone under consideration in Territory 2 (with unknown CF); k C F , i , j w i n d is the correction coefficient applied to the CF of month i in microzone j of Territory 1 (with known CF) in order to estimate the wind CF for month m in microzone n of Territory 2. A similar expression was used to estimate the solar CF by replacing the monthly average wind speed with the monthly average solar irradiance. To identify the pairs of microzones with the highest climatic similarity, the absolute difference between the average monthly climatic variable (i.e., average monthly wind speed or average monthly solar irradiance) was calculated. This difference was evaluated between each microzone in Territory 2 (where the CF is unknown) and the corresponding microzone in Territory 1 (where the CF is known), evaluated for the same month, according to the following expressions:
D n , j , m w i n d = | v ¯ n , m 2 v ¯ j , m ( 1 ) |
D n , j , m s o l a r = | I ¯ n , m 2 I ¯ j , m ( 1 ) |
where D n , j , m w i n d is the absolute difference between the average monthly wind speed in the n-th microzone of Territory 2 in month m and that in the j-th microzone of Territory 1 in the same month; v ¯ n , m 2 is the average wind speed in the n-th microzone of Territory 2 in month m; v ¯ j , m 1 is the average wind speed in the j-th microzone of Territory 1 in month m; D n , j , m s o l a r is the absolute difference between the average monthly solar irradiance in the n-th microzone of Territory 2 in month m and that in the j-th microzone of Territory 1 in the same month; I ¯ n , m 2 is the average solar irradiance in the n-th microzone of Territory 2 in month m; and I ¯ j , m 1 is the average solar irradiance in the j-th microzone of Territory 1 in month m. For each microzone n of Territory 2 and for each month m, the absolute deviation was computed with respect to all microzones j of Territory 1. In other words, for each pair (n, m), the expression was evaluated for all microzones j in Territory 1. The j-th microzone of Territory 1, which corresponds to the minimum value of the absolute deviation D n , j , m was identified as the most climatically similar to microzone n of Territory 2 in terms of wind and solar resources in the considered month.
This procedure was repeated for each month of the year to identify the pairs of microzones with the highest climatic similarity between the two territories on a monthly basis.

2.3. Development of Forecast Scenarios for RES Capacity

Once the CF estimates for renewable generation units in the study areas were obtained, future RES capacity scenarios were developed. To assess the potential impacts on the transmission network under plausible scenarios starting from the year when the new electrical interconnections are expected to become operational, the RES capacity connected to the HV network and the capacity connected to the medium- and low-voltage (MV–LV) networks were estimated separately.
A separate estimation of the capacity connected exclusively to the MV–LV network was required because the simulation software used for power flow analysis requires as input the power injected into the HV network only. The generation connected to the MV–LV network was represented in the model as a reduction in the aggregated HV load. The forecast scenarios were developed through a microzonal analysis of current connection requests extracted from the databases managed by the local TSO for the HV network and integrated with the RES capacity targets established by national regulations. To estimate the future capacity connected to the HV network, the time required for the commissioning of the plants was analyzed based on their current authorization and development status. This analysis defined a plausible annual commissioning rate according to the procedural progress of the projects. The estimation of future capacity connected to the MV–LV network required addressing the lack of publicly available data on connection requests managed by distribution system operators. Therefore, for each scenario, the MV–LV share was determined by difference, subtracting the projected HV capacity from the overall RES capacity targets defined by national legislation across the three voltage levels, as expressed in the following equation:
C M V + L V , s ( R E S ) = C t o t , s ( R E S ) C H V , s ( R E S )
where C M V + L V , s R E S denotes the estimated RES capacity to be connected to the MV–LV networks in scenario s; C t o t , s R E S represents the total RES capacity target defined by national regulations across the three voltage levels in scenario s; and C H V , s R E S is the projected RES capacity to be connected to the HV network in the same scenario, based on the analyses performed.

2.4. Power Flow Analysis of the Transmission Network

Once the forecast scenarios for future RES capacity had been defined, power flow analyses were carried out on the transmission network. The simulations were performed using advanced software specifically designed for HV grid modeling, considering both normal operating conditions (N) and single-contingency conditions (N-1). The grid model, developed by the local TSO, includes both renewable generation units expected to become operational in the short term and major interconnections currently under construction that will be commissioned within the study horizon. The simulation platform already incorporated the detailed topological representation and technical parameters of the transmission network. The required input data for each analyzed scenario consisted of the expected active power injection from each modeled wind and photovoltaic generation unit (GU), the HV network load demand, and the scheduled power exchanges through the planned interconnections. The selection of the scenarios was based on the CF analysis of renewable generation, identifying the months characterized by the highest wind and solar energy yield. First, the total power injection at the microzone level was determined to estimate the average active power injected into the grid by each wind and photovoltaic generation unit (GU) in the analyzed scenarios. This was computed by applying the average monthly microzone CF (as described in Section 2.2) to the corresponding wind or solar installed capacity projected for each microzone in a given year (according to the methodology outlined in Section 2.3). Under this approach, an intermediate renewable generation level was implicitly assumed. Since the exact grid connection nodes of the future plants cannot be predicted with certainty, the total power injection estimated for each microzone, and energy source was uniformly allocated among the generation units belonging to the same microzone. This allocation was performed by dividing the total microzone level power injection by the number of generation units already represented in the software model within that microzone:
P u ( f ) = P t o t , m ( f ) N G U , m ( f ) with   f { wind ,   solar }
where P u f denotes the active power injection assigned to each generation unit belonging to source (f); P t o t , m f represents the total power injection in microzone m from source (f); and N G U , m f is the number of generation units of source (f) modeled in the software within microzone m. To define the HV grid load for each future scenario, the Dynamic Security Assessment (DSA) of the local TSO provided a representative intermediate weekday load profile for the analyzed months in a reference year. These values were then reduced by an amount equal to the additional RES generation connected to the MV–LV network in the considered territory for the given year, relative to the reference load year:
L H V , s t = L H V , r e f t P M V + L V , s R E S t   P M V + L V , r e f R E S ( t )
where L H V , s ( t ) denotes the load demand on the HV network in future scenario s at time t; L H V , r e f ( t ) represents the intermediate HV load demand at time t corresponding to a weekday in the reference year; P M V + L V , s R E S is the RES power injection into the MV–LV network in scenario s; and P M V + L V , r e f R E S is the RES power injection into the MV–LV network in the reference year. The power exchanges through the new interconnections were defined based on plausible operating conditions representative of ordinary system operation. Additional assumptions were made regarding the dispatch of conventional generation units, the activation of shunt reactors at selected substations, and the operation of pumped-storage hydropower units in pumping mode. These assumptions were derived from scenarios characterized by significant RES penetration.

2.5. Results Analysis

The final stage of the methodology concerns the analysis of the results obtained from the power flow simulations, to evaluate the loading conditions of the transmission lines under the different RES capacity development forecast scenarios. This analysis identified the most critical areas of the transmission network and defined priority infrastructure interventions. The adopted approach included post-processing of the simulation outputs, the definition of specific performance indicators, and the development of graphical representations to facilitate data interpretation. The simulation software generated results that were exported and filtered to include only the transmission lines under investigation. For each analyzed scenario, the nominal bus voltages, the current values on the lines, and the line loading (LL) level were extracted. The software provides the loading index for each i-th transmission line. It is expressed as a percentage ratio between the actual line current I i and the nominal current rating I i , n o m . This parameter quantifies the degree of line utilization and allows the most heavily loaded sections of the network to be identified:
L L i = I i I i , n o m
The analysis considered only transmission lines operating under high loading conditions and close to congestion. Specifically, the lines were classified into two categories according to their loading level: highly loaded lines (85% ≤ LL < 100%) and overloaded lines (LL ≥ 100%). These thresholds do not correspond to the operational criteria adopted by Terna, which are defined individually for each transmission line based on its technical characteristics and operating conditions. In this study, the thresholds were used as analytical indicators for planning purposes to identify the lines with the highest loading levels.
The thermal limits of transmission lines are not determined solely by the nominal voltage level (380 kV, 220 kV, and 150 kV). They also depend on the technical characteristics of each line, including conductor type and cross-section, line configuration, number of circuits, and environmental conditions such as ambient temperature, wind conditions, and solar radiation. These parameters may vary seasonally according to the criteria defined in the CEI 11-60 standard [30]. In this study, the line loading is expressed in normalized form with respect to the rated current assigned to each network element in the adopted model. Therefore, thermal limits and possible seasonal derating effects are implicitly included in the adopted loading values. Under real operating conditions and during contingencies, loading levels above the nominal limit (up to 120%) may be temporarily tolerated for short periods, provided that appropriate corrective actions are implemented to restore the system within safety margins, in accordance with the TSO operational and dispatching procedures.
The results were then aggregated by microzone and voltage level (400 kV, 220 kV, and 150 kV). This enabled a systematic comparison of line loading across the different scenarios. The scenario comparison was performed for each transmission line and for each voltage level, considering only those lines exhibiting an LL greater than 85% in at least one scenario. To facilitate interpretation, the results were presented using line charts. In these charts, the color of each profile reflects the loading level of the corresponding line, while the legend reports the line name and its associated microzone. This representation allows a visual assessment of the temporal evolution of line loading following the increase in renewable generation and the commissioning of the new HVDC interconnections planned in the coming years. At the same time, it enables the identification of microzones characterized by a higher number of overloaded lines at a given voltage level. This methodological framework provides a quantitative and reproducible assessment of the medium-term impacts on the loading conditions of transmission lines within the network.

3. Case Study: Application to the Sicilian Power System

The methodology described in Section 2 is applied to the Sicilian electricity transmission network. This case study was selected due to the strategic role of Sicily within both the national and European power systems. This role is due to its high renewable energy potential and its geographical position, which requires a detailed assessment of the expected future impacts on the network. The analysis focuses on evaluating the loading conditions of the transmission lines composing the Sicilian grid under future scenarios over the time horizon 2028–2035. This period is characterized by the progressive integration of RES and the commissioning of the new strategic HVDC interconnections included in Terna’s Development Plan. These include the Tyrrhenian Link, connecting Sicily with Campania and Sardinia, and the TUN-ITA interconnection, linking western Sicily with northern Tunisia. Terna S.p.A provided the network model used for the simulations, which represents the Sicilian HV transmission network (380 kV, 220 kV, and 150 kV). This model is based on a reference configuration updated to July 2025 and includes the aforementioned HVDC interconnection. The Tunisian power system was not modeled in detail; instead, it was represented by an equivalent generator–load model connected to the TUN-ITA Link. This allowed for the simulation of cross-border power exchanges with Sicily without unnecessarily increasing the model’s complexity. The first three phases of the methodology (renewable potential assessment, estimation of the CF of renewable plants, and construction of RES capacity scenarios), applied to both Sicily and Tunisia, were aimed at defining the input data required for the simulations, namely renewable power injections and adjusted load profiles. The analysis aimed to evaluate how the combined effect of renewable generation growth and the additional power flows introduced by the HVDC interconnections impacts the loading conditions of the transmission lines. This analysis allows the most critical sections of the grid to be identified.

3.1. Micro-Zonal Approach and Renewable Potential in Sicily and Tunisia

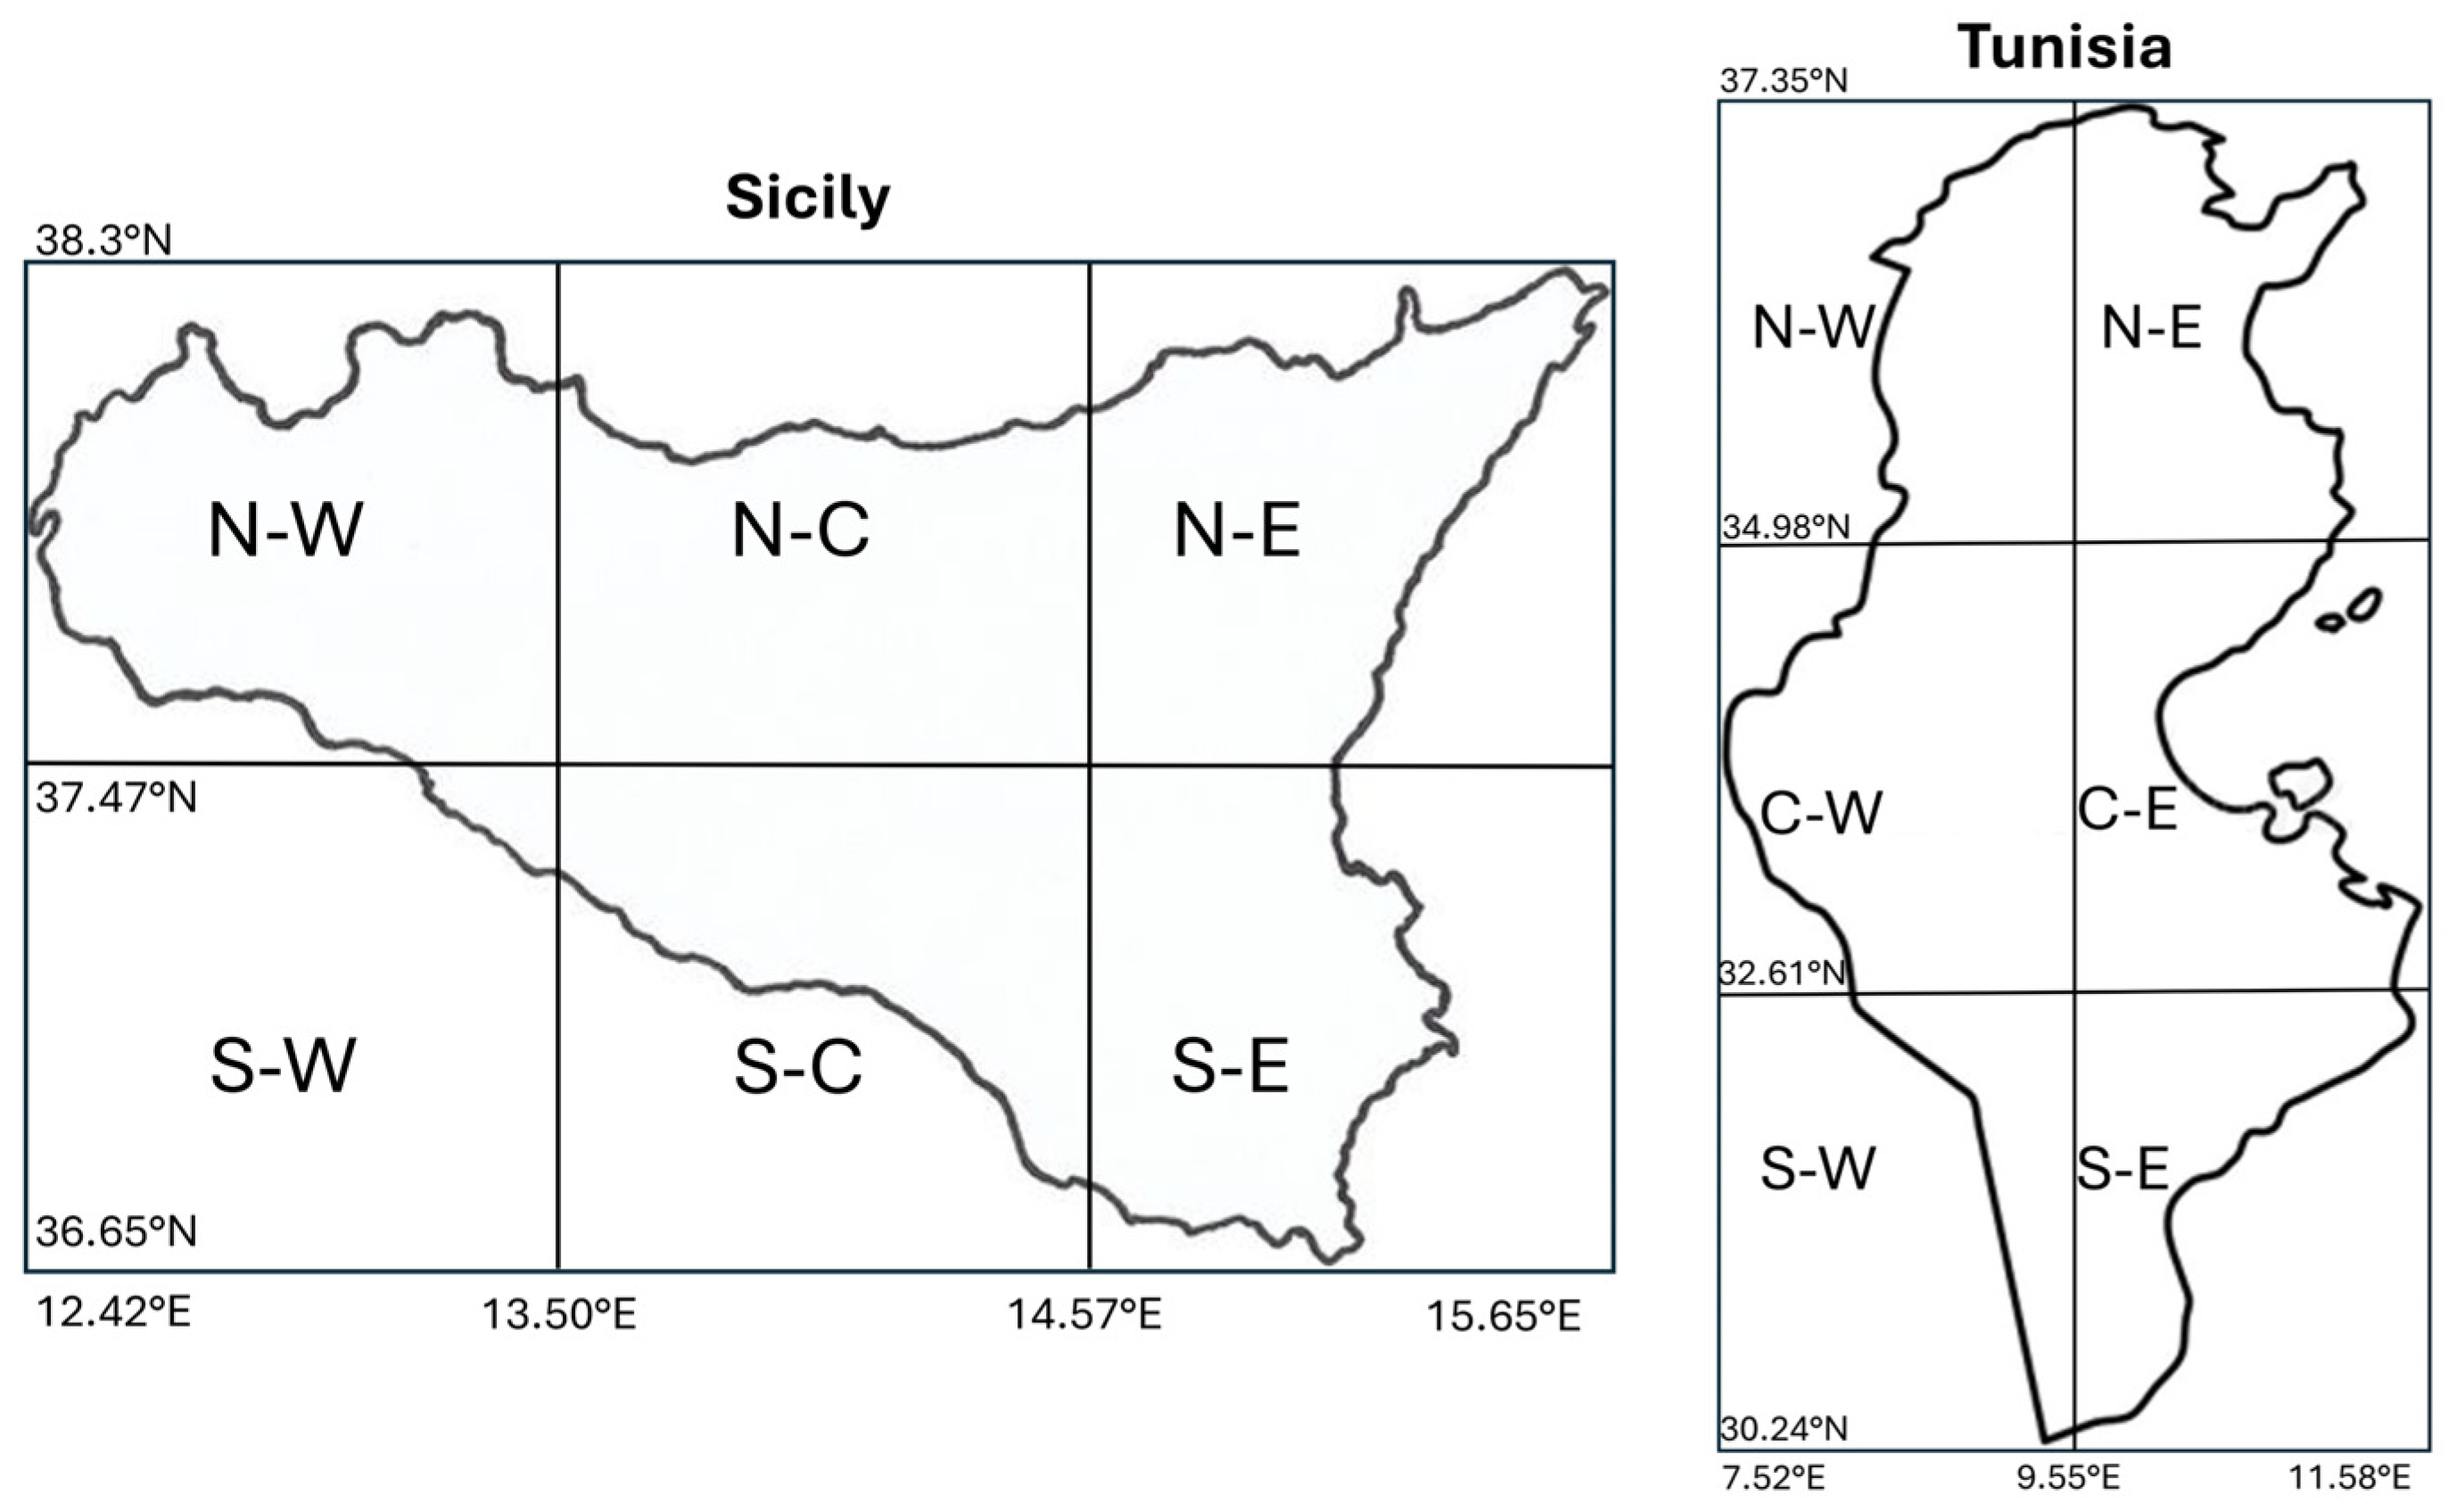
The input data required for the power flow simulations, namely renewable power injections and load demand, were derived from the first three phases of the methodology. In this study, these phases involved analyzing two strategic regions: Sicily and Tunisia. The methodology was applied by first dividing both territories into well-defined geographical microzones, according to the approach described in Section 2.1. For Tunisia, the latitude and longitude ranges were divided into three and two intervals, respectively, resulting in a grid of six microzones (North-West, North-East, Central-West, Central-East, South-West, and South-East). Similarly, Sicily was subdivided into six microzones (North-West, North-Central, North-East, South-West, South-Central, and South-East), with the subdivision of latitude and longitude ranges adapted to account for the different geographical extent of the territory. Figure 4 illustrates the microzonal subdivision of Sicily and Tunisia.
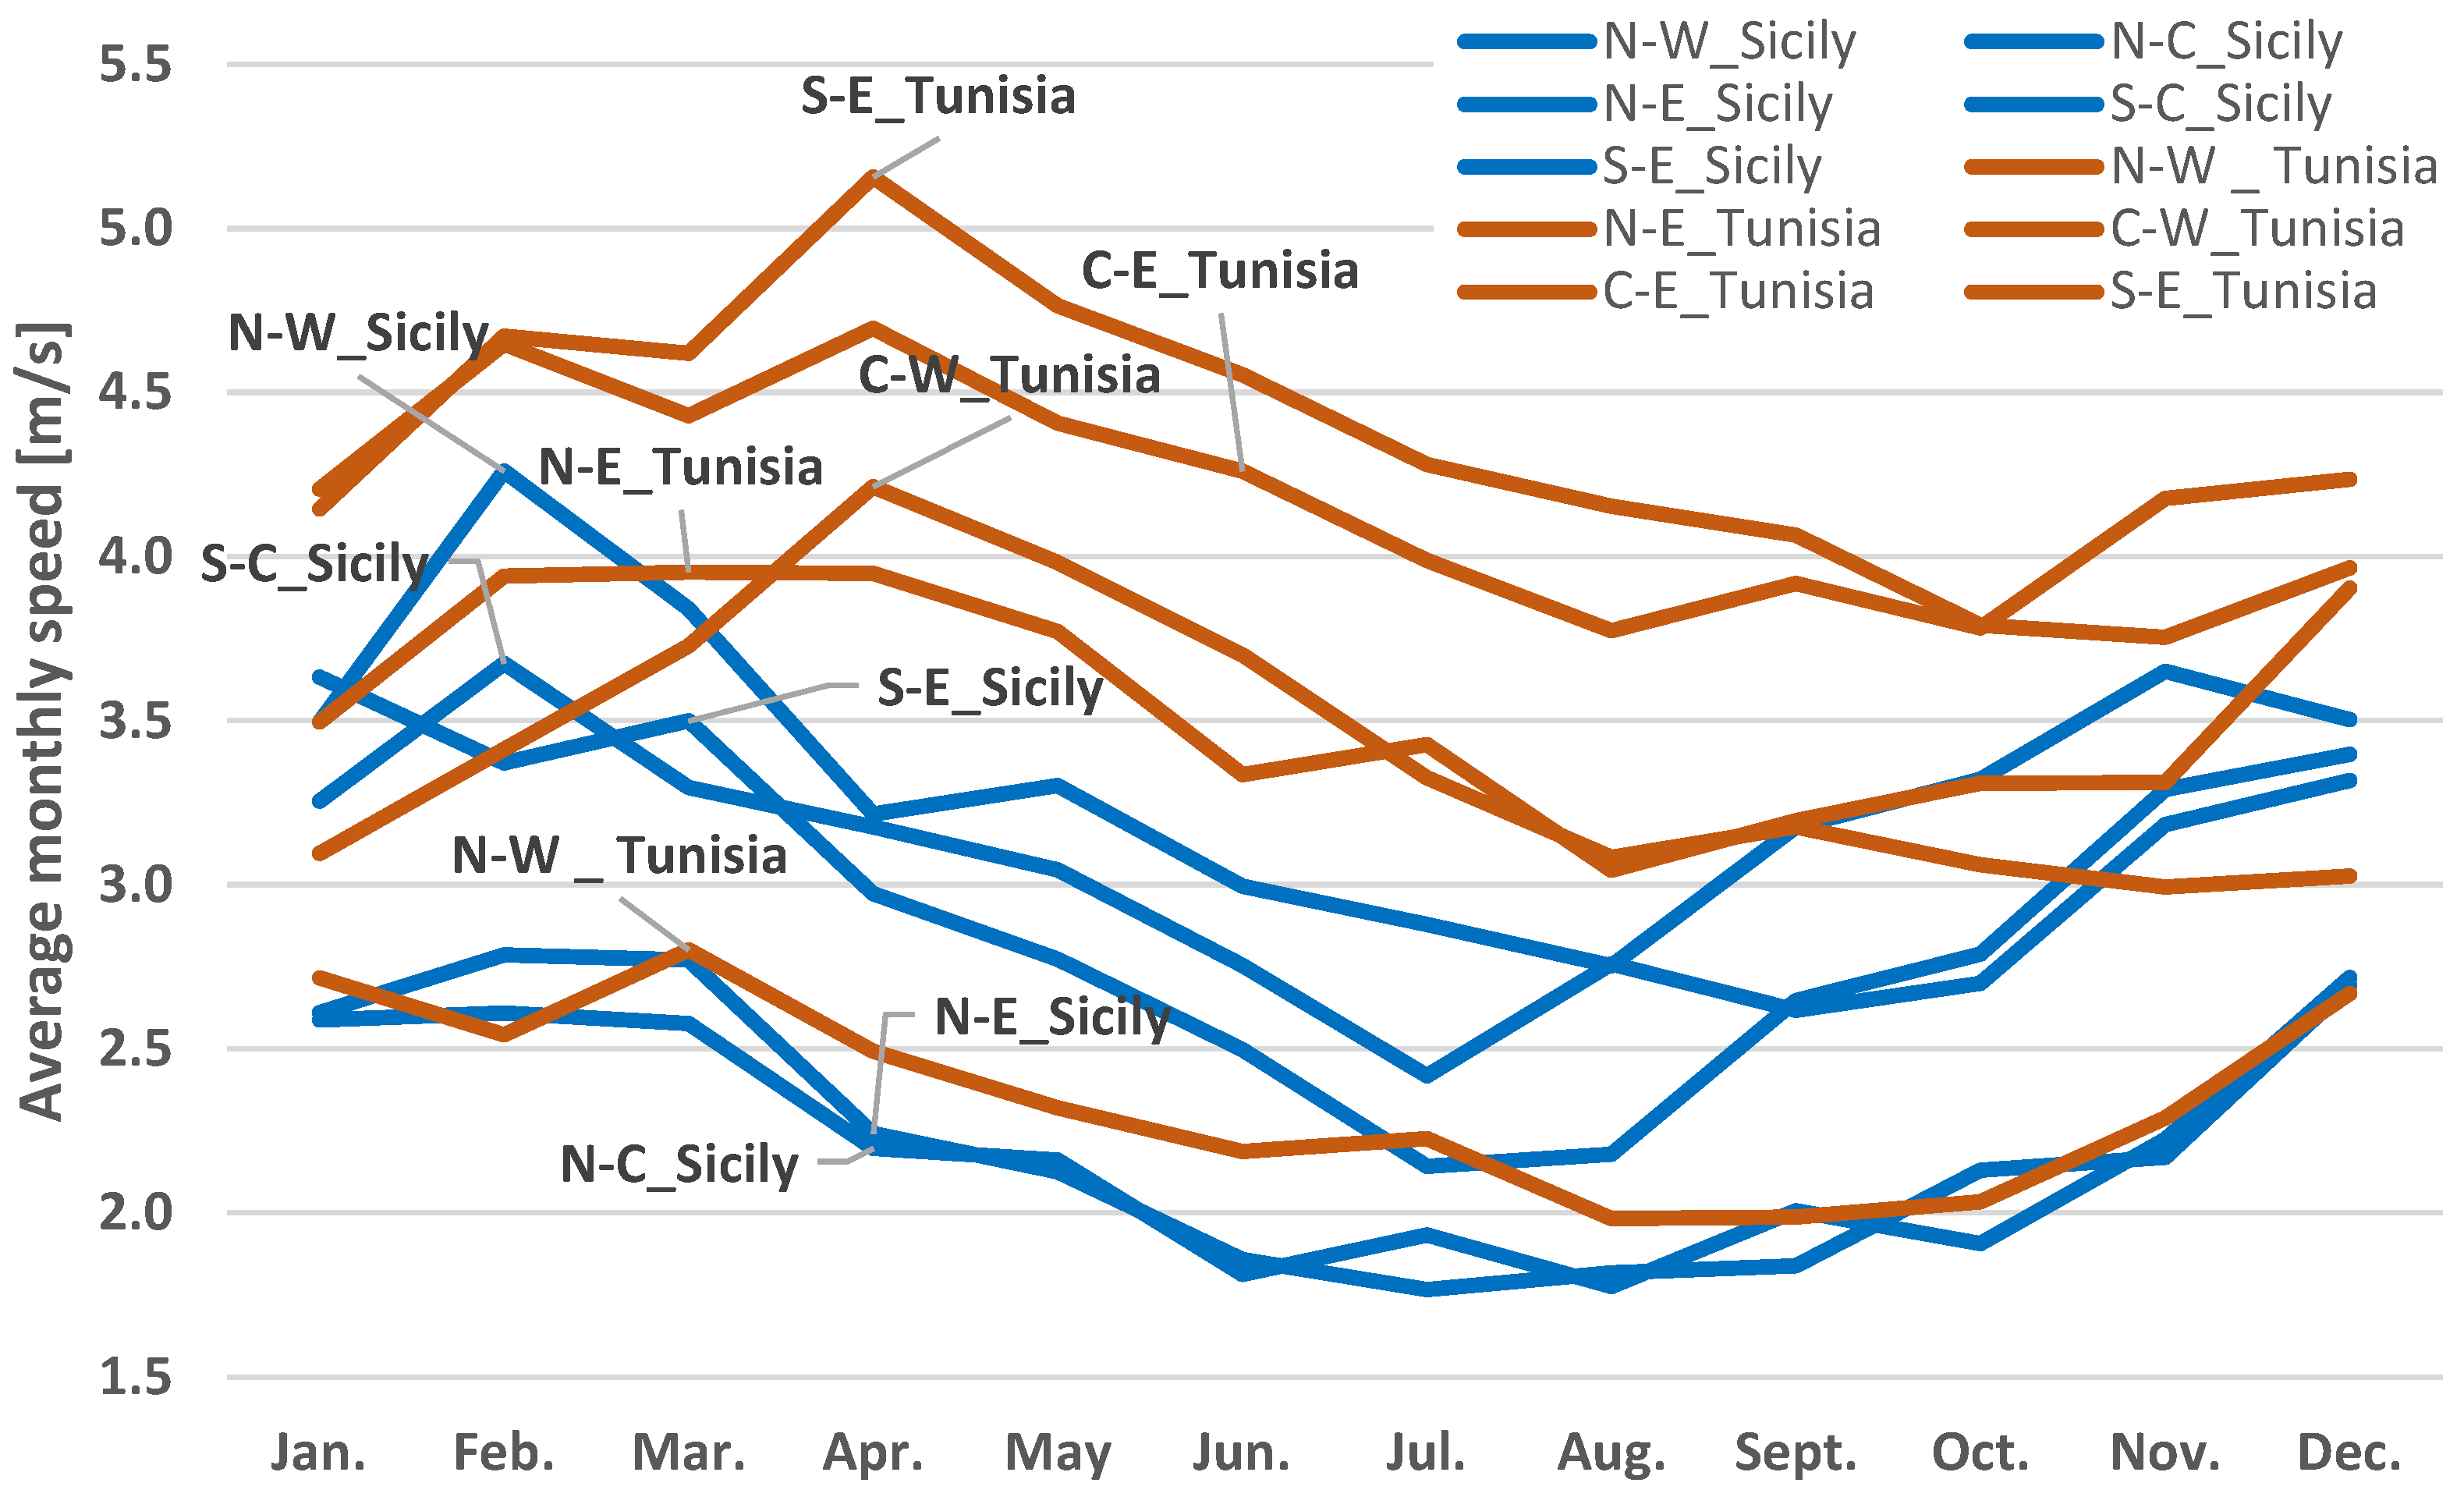
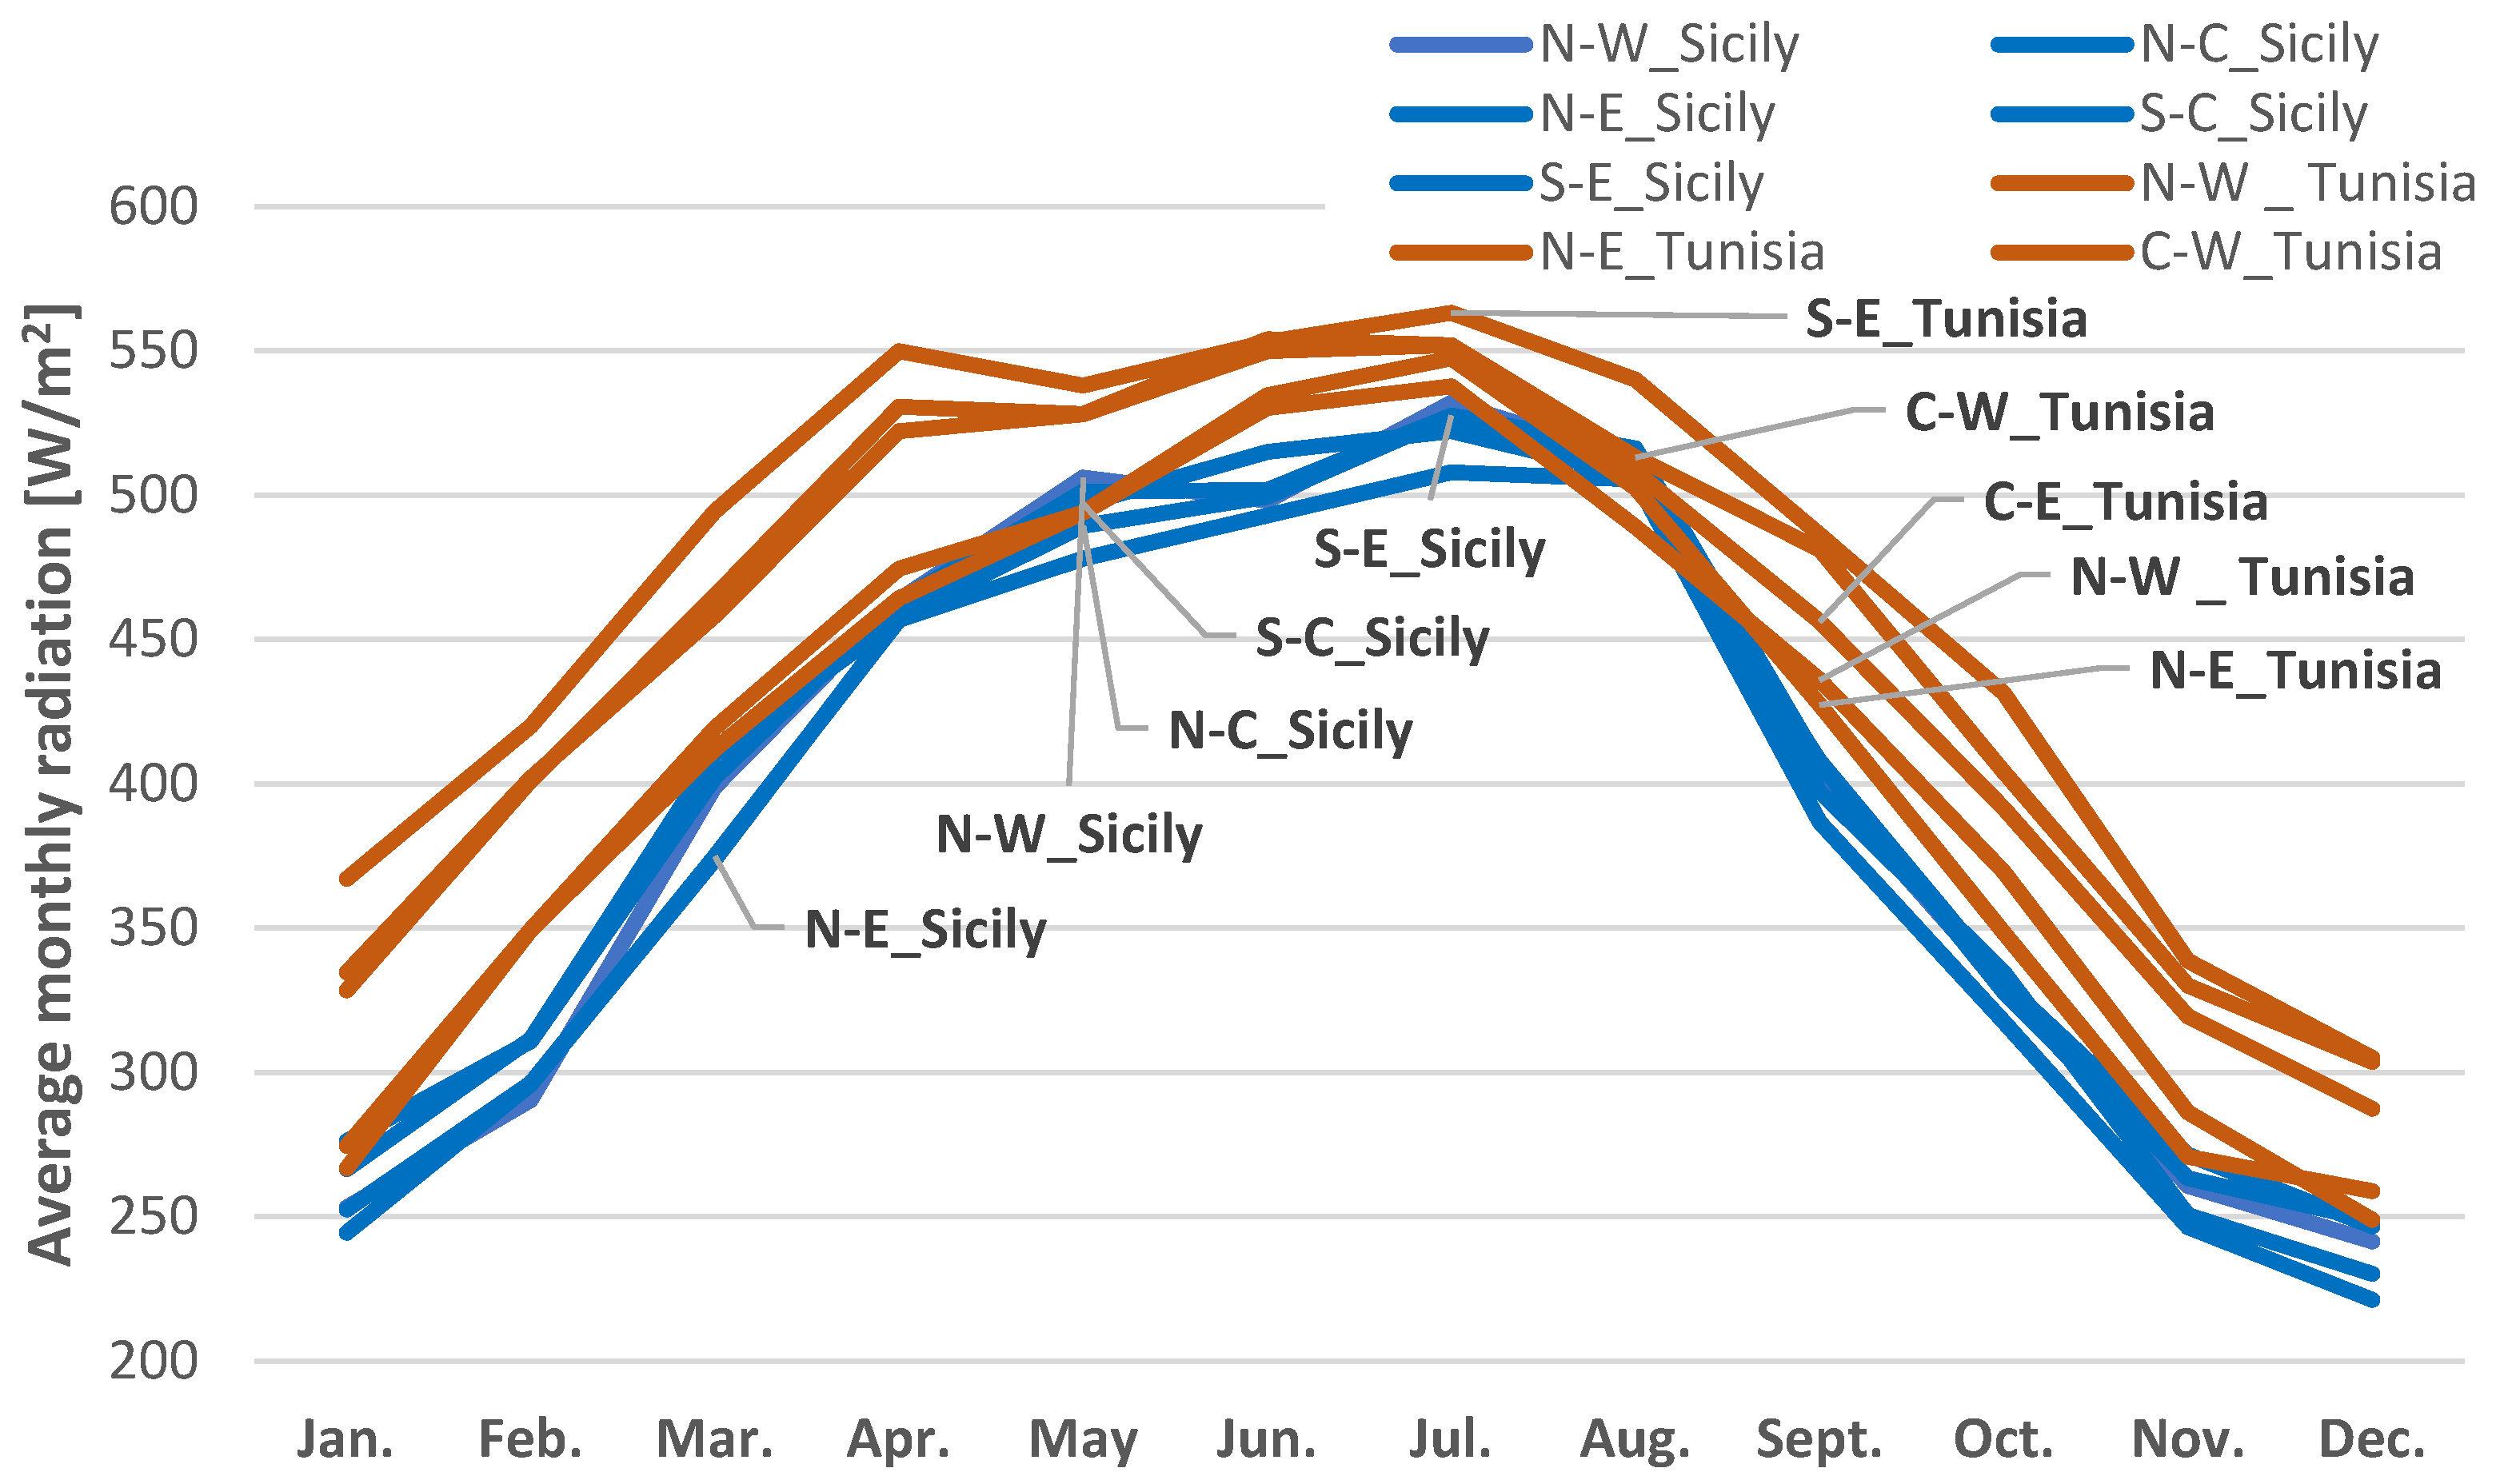
Among the six identified microzones, only five were considered for each territory. Specifically, southwestern Sicily corresponds to a marine area, while southwestern Tunisia is predominantly desert and located far from major urban centers. These factors make both areas unsuitable for renewable energy development from both technological and economic perspectives. As a result, the renewable potential assessment was conducted over the ten selected microzones across the two territories (Sicily and Tunisia). To characterize the average monthly climatic conditions, a representative sample of nine cities was selected within each microzone, ensuring an adequate spatial distribution across the territory. For each location, hourly data on wind speed at 10 m above ground level and global horizontal solar irradiance were obtained for a TMY, derived from a 20-year observation period. As described in Section 2.1, the monthly average climatic variables (wind speed and solar irradiance) were computed from the hourly time series, resulting in twelve monthly average values for wind speed (Figure 5) and twelve monthly average values for solar irradiance (Figure 6) for each of the ten analyzed microzones.
These results made it possible to characterize the wind and solar potential of each microzone in Sicily and Tunisia. They also allowed to compare the two territories using the Euclidean distance Formula (2). This approach identified, for each microzone in Tunisia, the corresponding microzone in Sicily that is most climatically similar in terms of annual wind speed and solar irradiance profiles. The results show that, in terms of wind potential, the North-Central, North-East, and South-East microzones of Sicily have profiles most similar to those of North-West Tunisia. In contrast, the North-West and South-Central microzones of Sicily are more like North-East Tunisia. The solar potential analysis shows that all Sicilian microzones have climatic profiles similar to those of North-East Tunisia. Table 2 summarizes the correspondences between the Sicilian and Tunisian microzones that are most similar in terms of wind and solar potential. For each pair, it reports the corresponding minimum Euclidean distance value.
To obtain representative indicators of the monthly productivity of renewable energy plants, the average monthly CFs were calculated at the microzone level for wind and solar plants in Sicily and Tunisia. For Sicily, the CFs were calculated using the analytical expression in Equation (6).This was made possible by the availability of actual operational data from the Terna Bilan portal for the year 2024, including monthly energy injected into the grid, the nominal power of each generation unit, and the exact location of the plants. Table 3 and Table 4 report the average monthly CF values calculated for each microzone and for the entire Sicilian region. The values highlighted in italics indicate the periods of highest productivity, characterized by CF values exceeding 20%. It should be noted that the solar CF (Table 4) was determined only for the North-West and South-East microzones because the photovoltaic plants connected to the HV grid in 2024 were concentrated only in these areas.
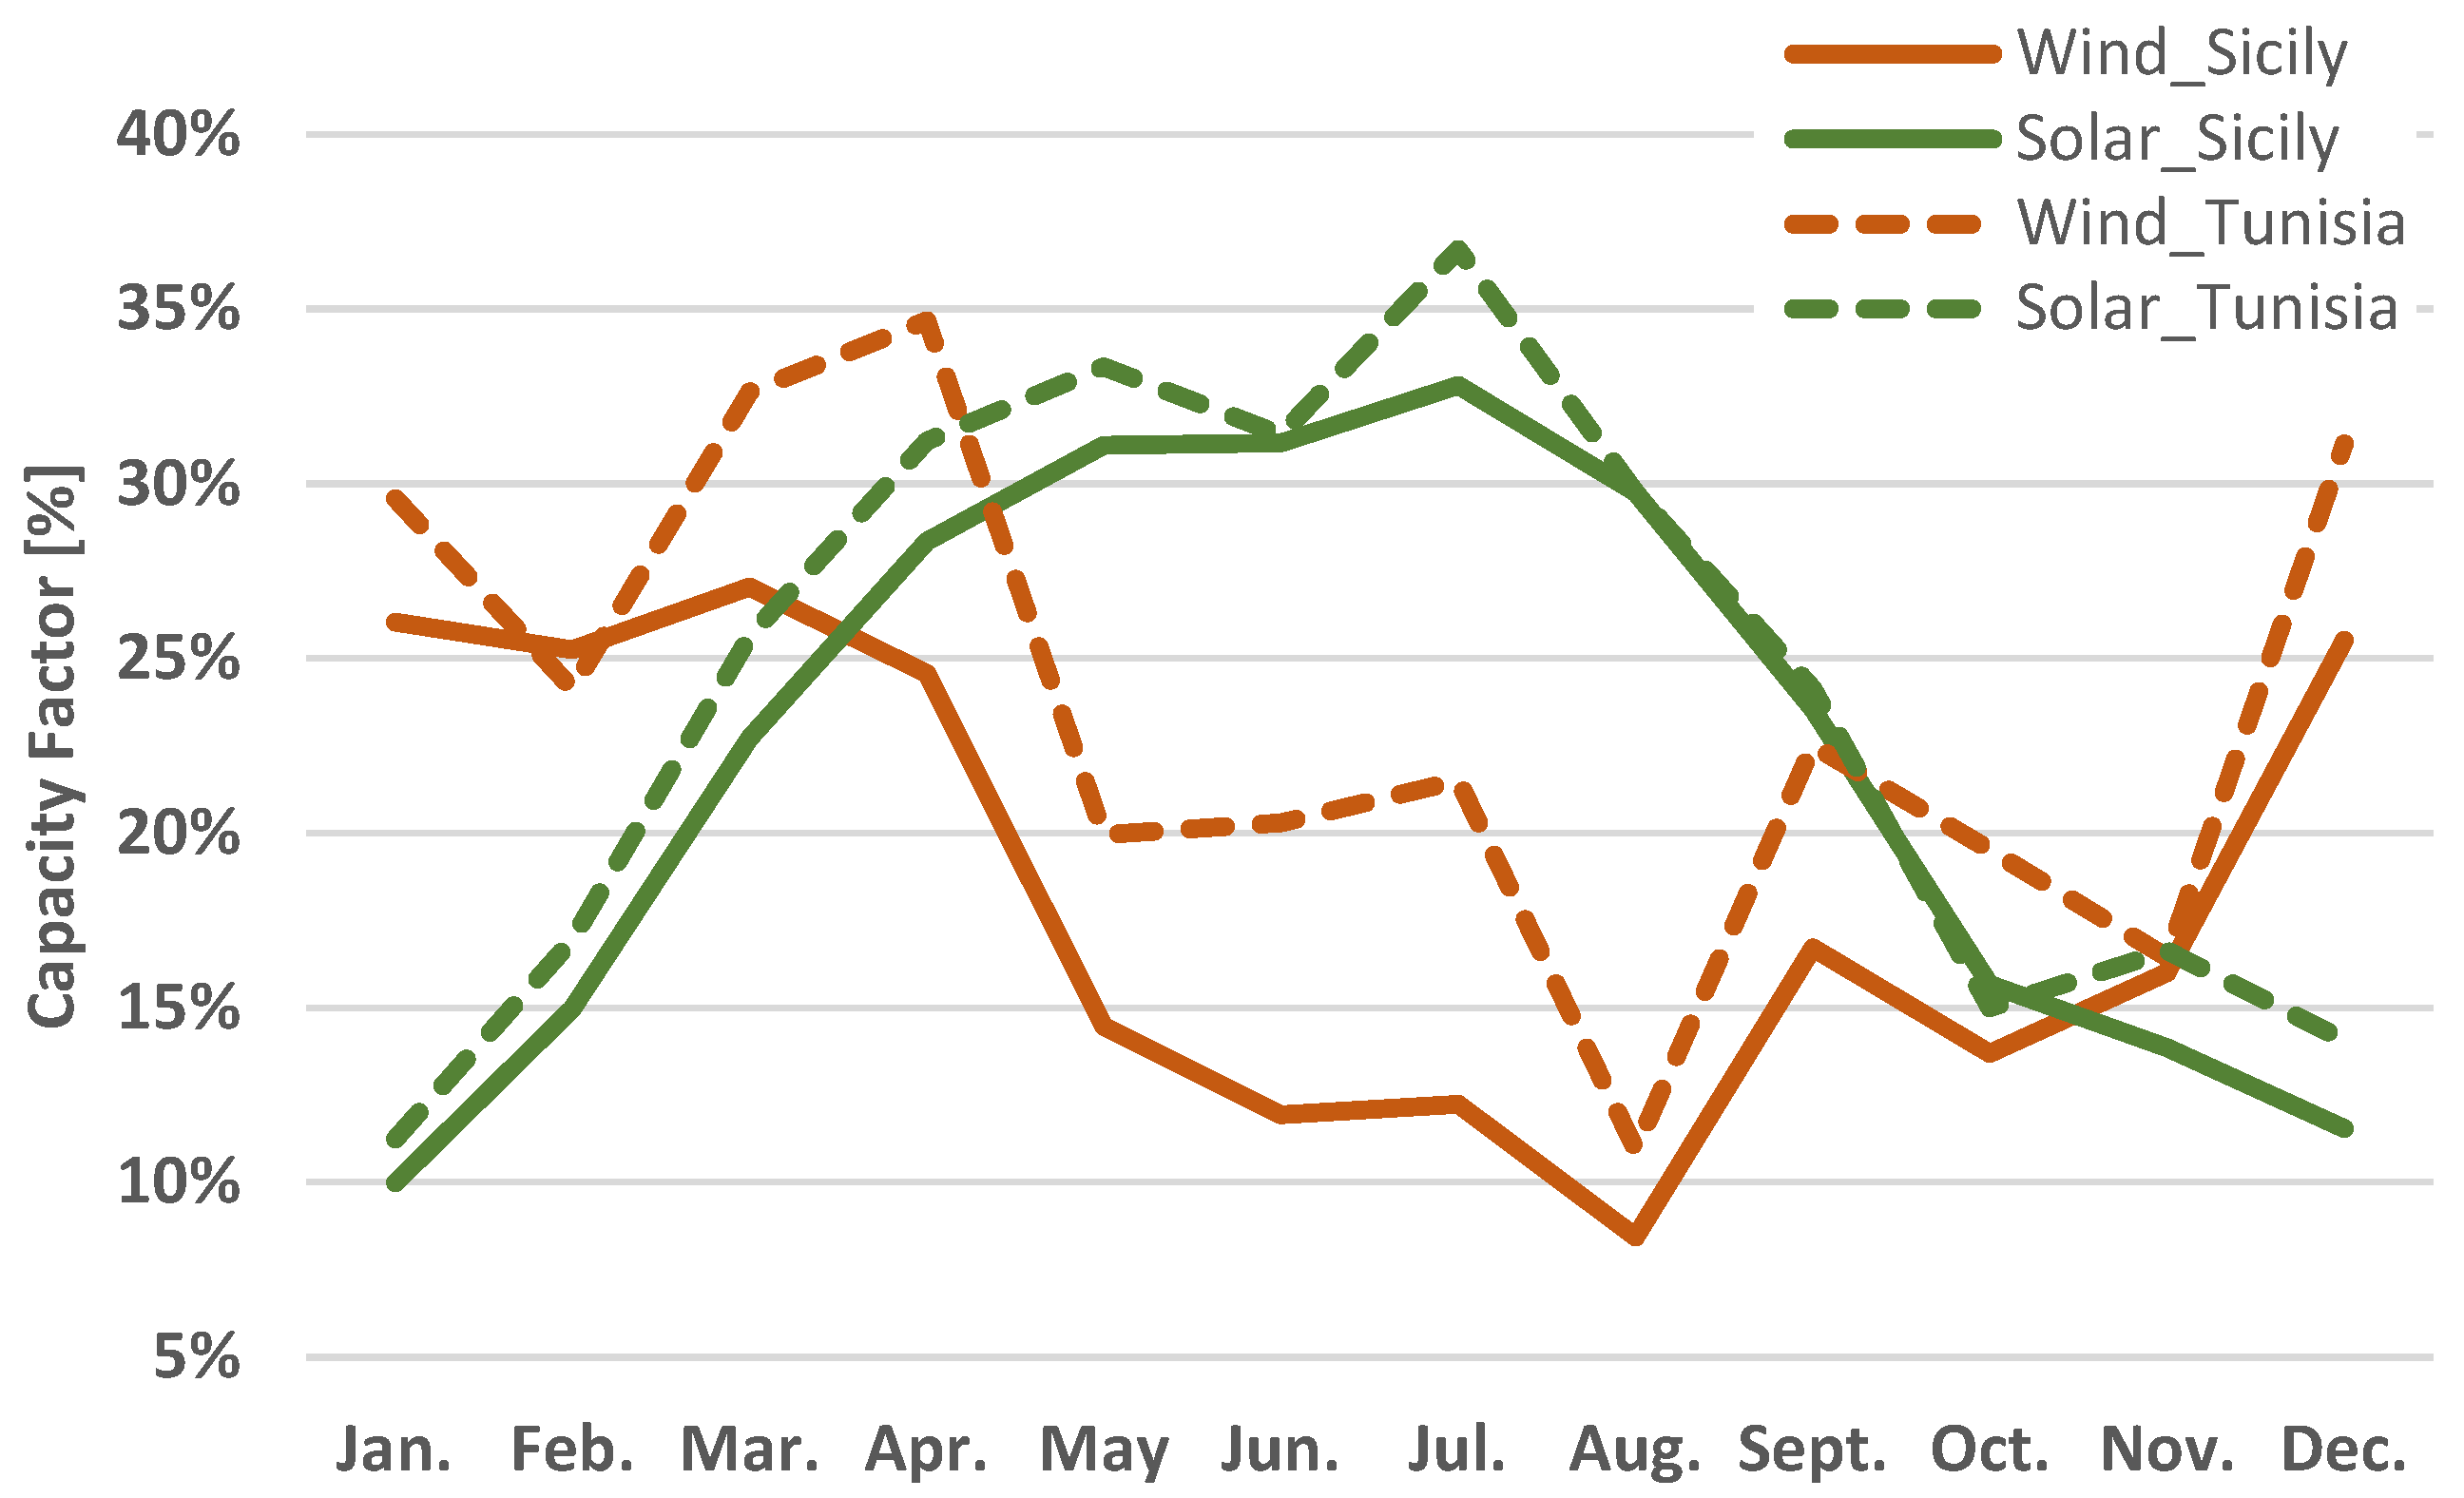
In Tunisia, since the local TSO does not provide the data required for a direct calculation, the analogy-based method described in Section 2 was adopted. For the application of this method, the average monthly values of the climatic variables were essential to determine the correction coefficients (Equation (9)) used to estimate the CF in the Tunisian microzones. In the case of Tunisia, detailed public data on the historical generation of renewable energy plants were not available. Therefore, the estimated capacity factors were validated indirectly through comparison with available scientific studies and institutional reports. The literature reports annual capacity factors ranging from 19% to 26% for photovoltaic plants and from 21% to 35% for wind farms [31]. The annual values obtained in this study, calculated as the average of the estimated monthly values, are consistent with these ranges. Figure 7 presents a comparison of the annual profiles of the average monthly wind and solar CF for the entire territories of Sicily and Tunisia. These values were obtained by calculating the arithmetic mean of the CFs of the individual microzones within each territory.
Table 5 reports the monthly combined CF values for both Sicily and Tunisia, calculated for each month as the sum of the wind and solar CFs. The values highlighted in italics indicate the maximum values recorded over the annual cycle for each territory. These peak combined productivity values (maximum combined CF) were used as the reference criterion for selecting the months to be simulated in the power flow scenarios.

3.2. RES Capacity Forecasts for Sicily to 2040

Once the plant productivity had been estimated, future RES capacity deployment scenarios in Sicily were developed up to 2040. These scenarios consider the HV grid connection requests recorded in Terna’s E-connection portal as of 31 March 2025, as well as the overall RES capacity targets for Sicily across the three voltage levels defined by the PNIEC. For the construction of scenarios up to 2030, reference was made to the Ministerial Decree of 21 June 2024 [32], which established the additional RES capacity targets to be achieved by 2030 compared with the values recorded in 2020. For 2035 and 2040 projections, the GA-IT scenarios reported in Terna’s 2024 Scenario Description Document [33] were considered, in line with the PNIEC targets.
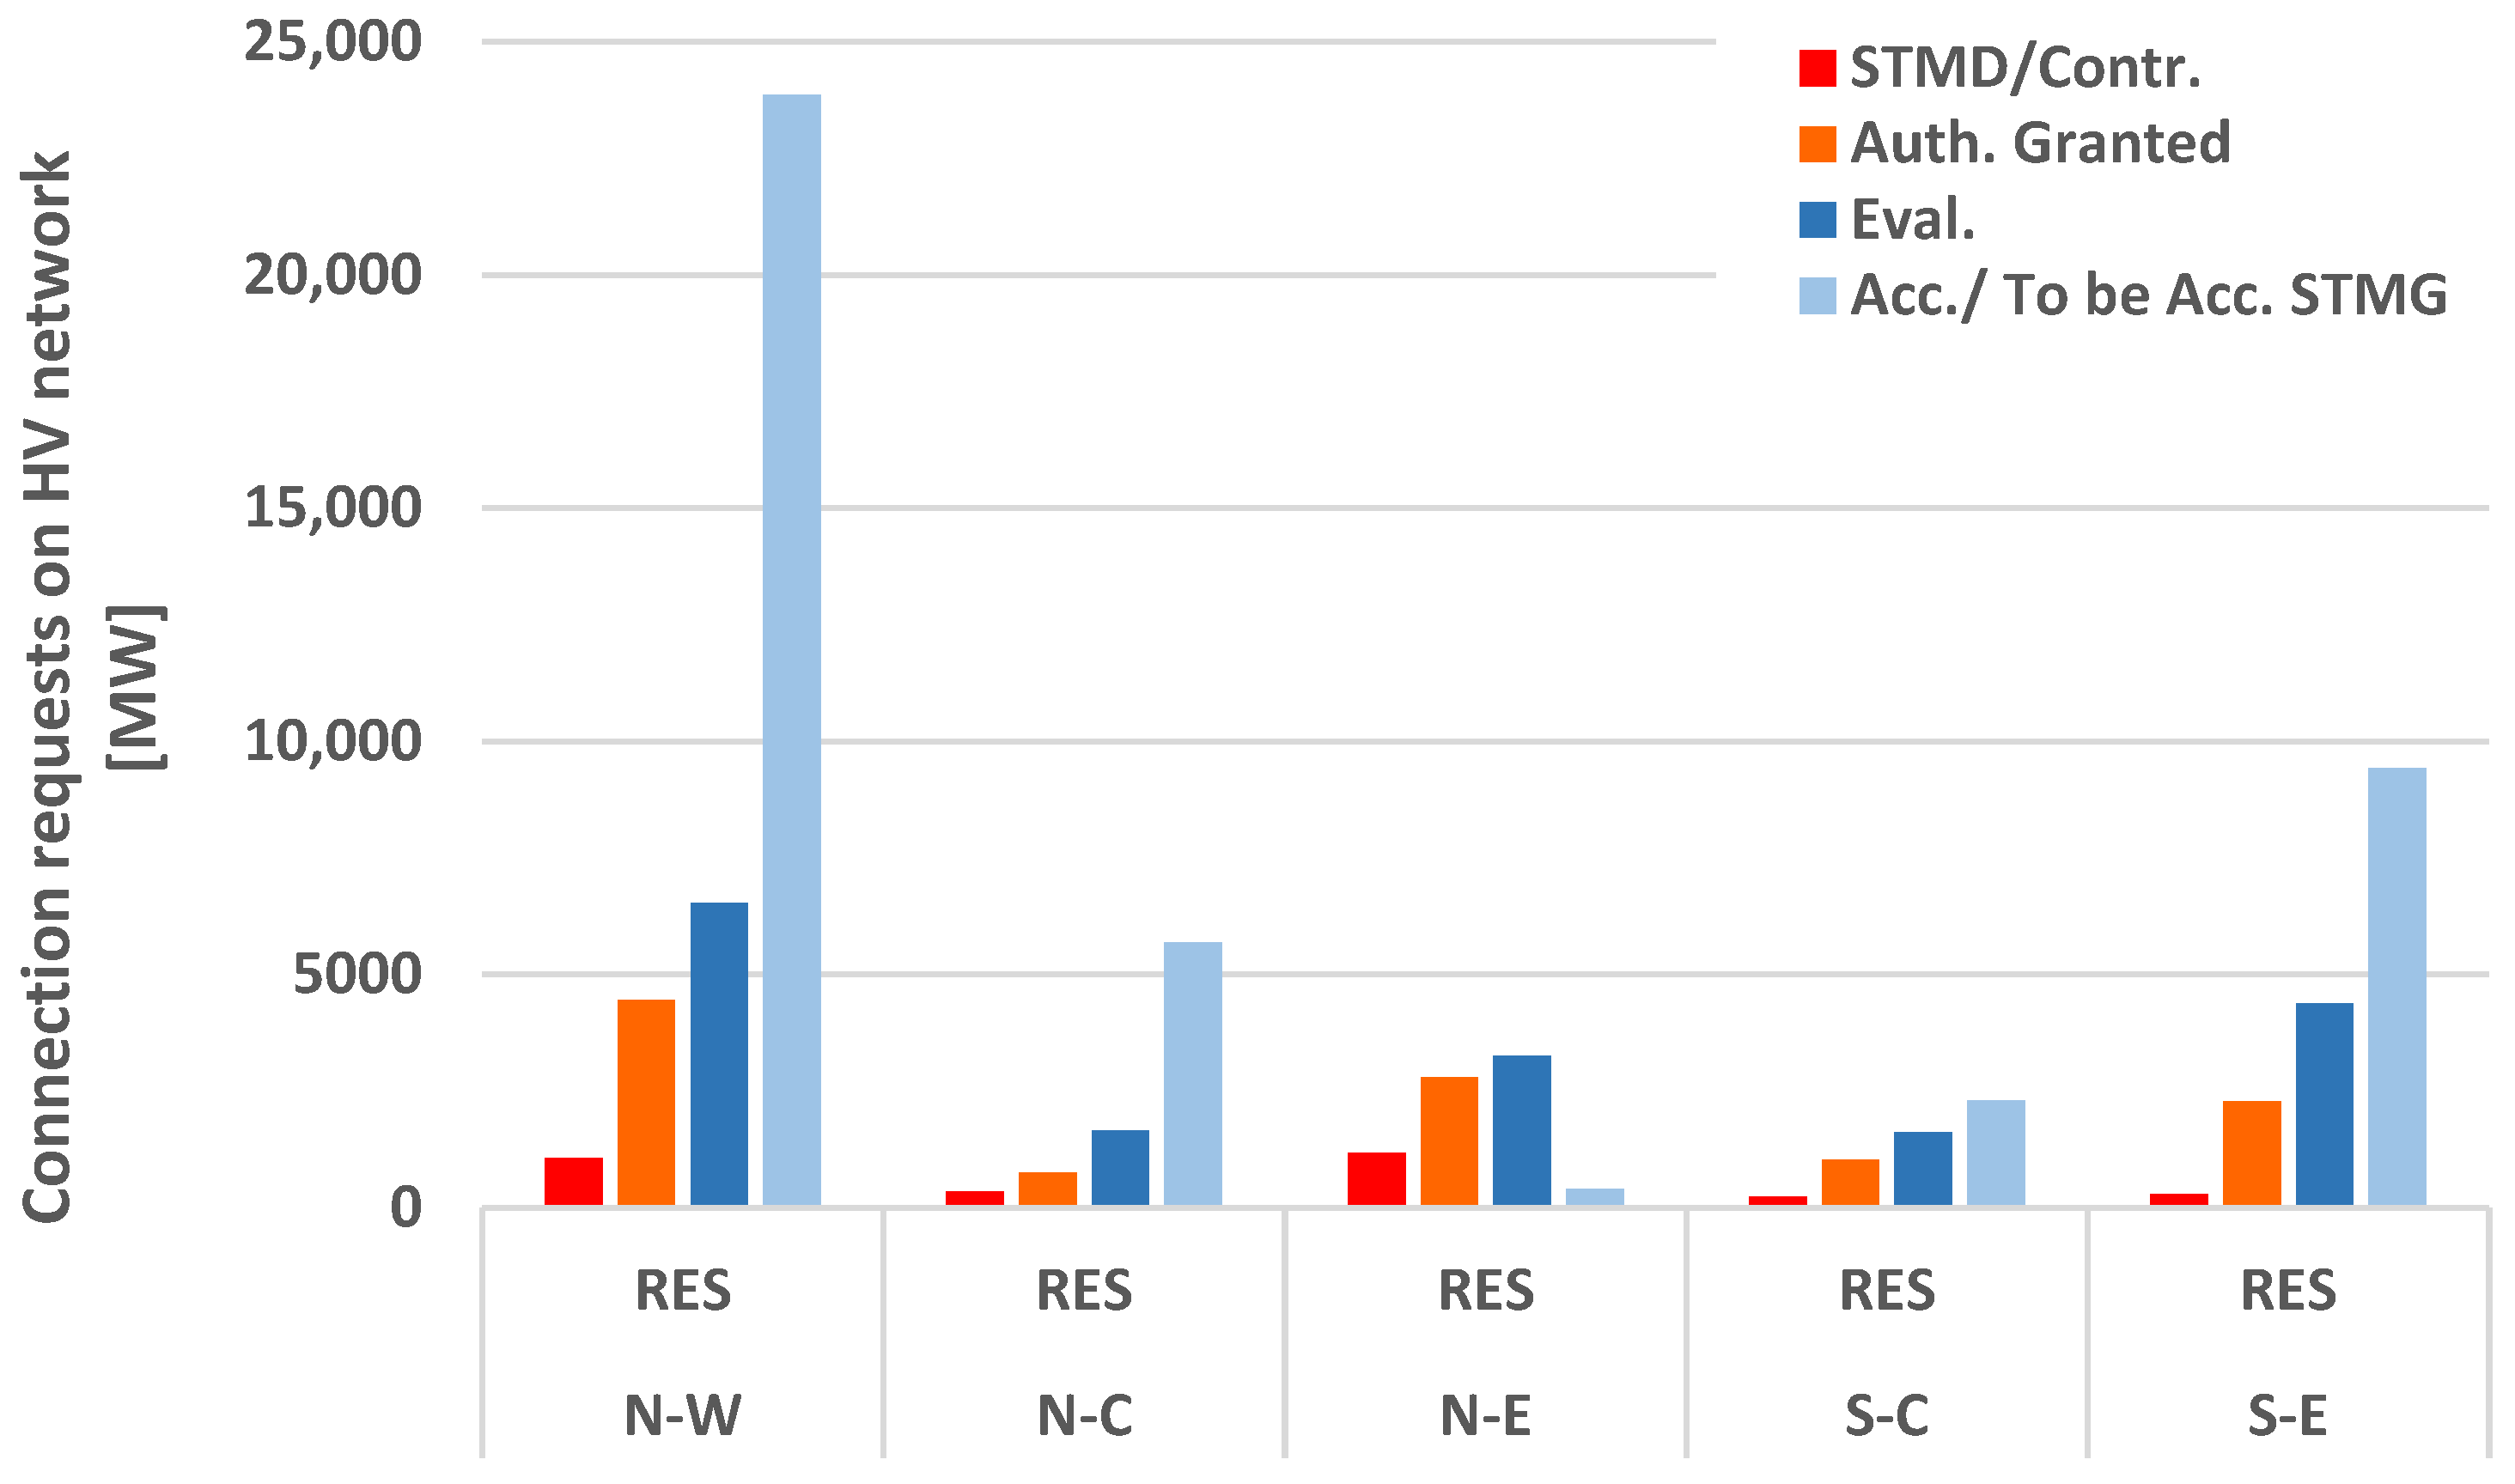
The analysis of HV grid connection requests at the microzone level, together with the assessment of the expected commissioning timelines of the plants based on the project status (STMD/contracts, authorization granted, projects under evaluation, and STMG accepted or pending acceptance), allowed plausible scenarios for RES capacity integration into the HV network to be defined for the coming years. Figure 8 shows the connection requests recorded by Terna as of 31 March 2025, aggregated by microzone and classified according to the authorization process status.
The graph highlights a high concentration of connection requests in the north-west and south-east areas, with the former characterized by a more advanced authorization status. Although the north-east has recorded a lower overall volume of requests, it is expected to experience the actual commissioning of new plants in the short term, together with the north-west, as most authorization procedures have already reached advanced stages. This increase in installed capacity will directly affect the analysis of transmission line loading in these areas. Table 6 summarizes the expected commissioning timelines associated with each application status (Detailed Minimum Technical Solution (STMD)/Contracts, Authorization Granted, Under Evaluation, and General minimum technical solution (STMG) Accepted or Pending Acceptance).
To estimate the evolution of installed capacity on the HV grid over the considered time horizon (2028–2035), plausible project completion rates were defined based on the current authorization status, considering both project attrition and completion probability. The assumptions adopted for the three simulated years are summarized below.
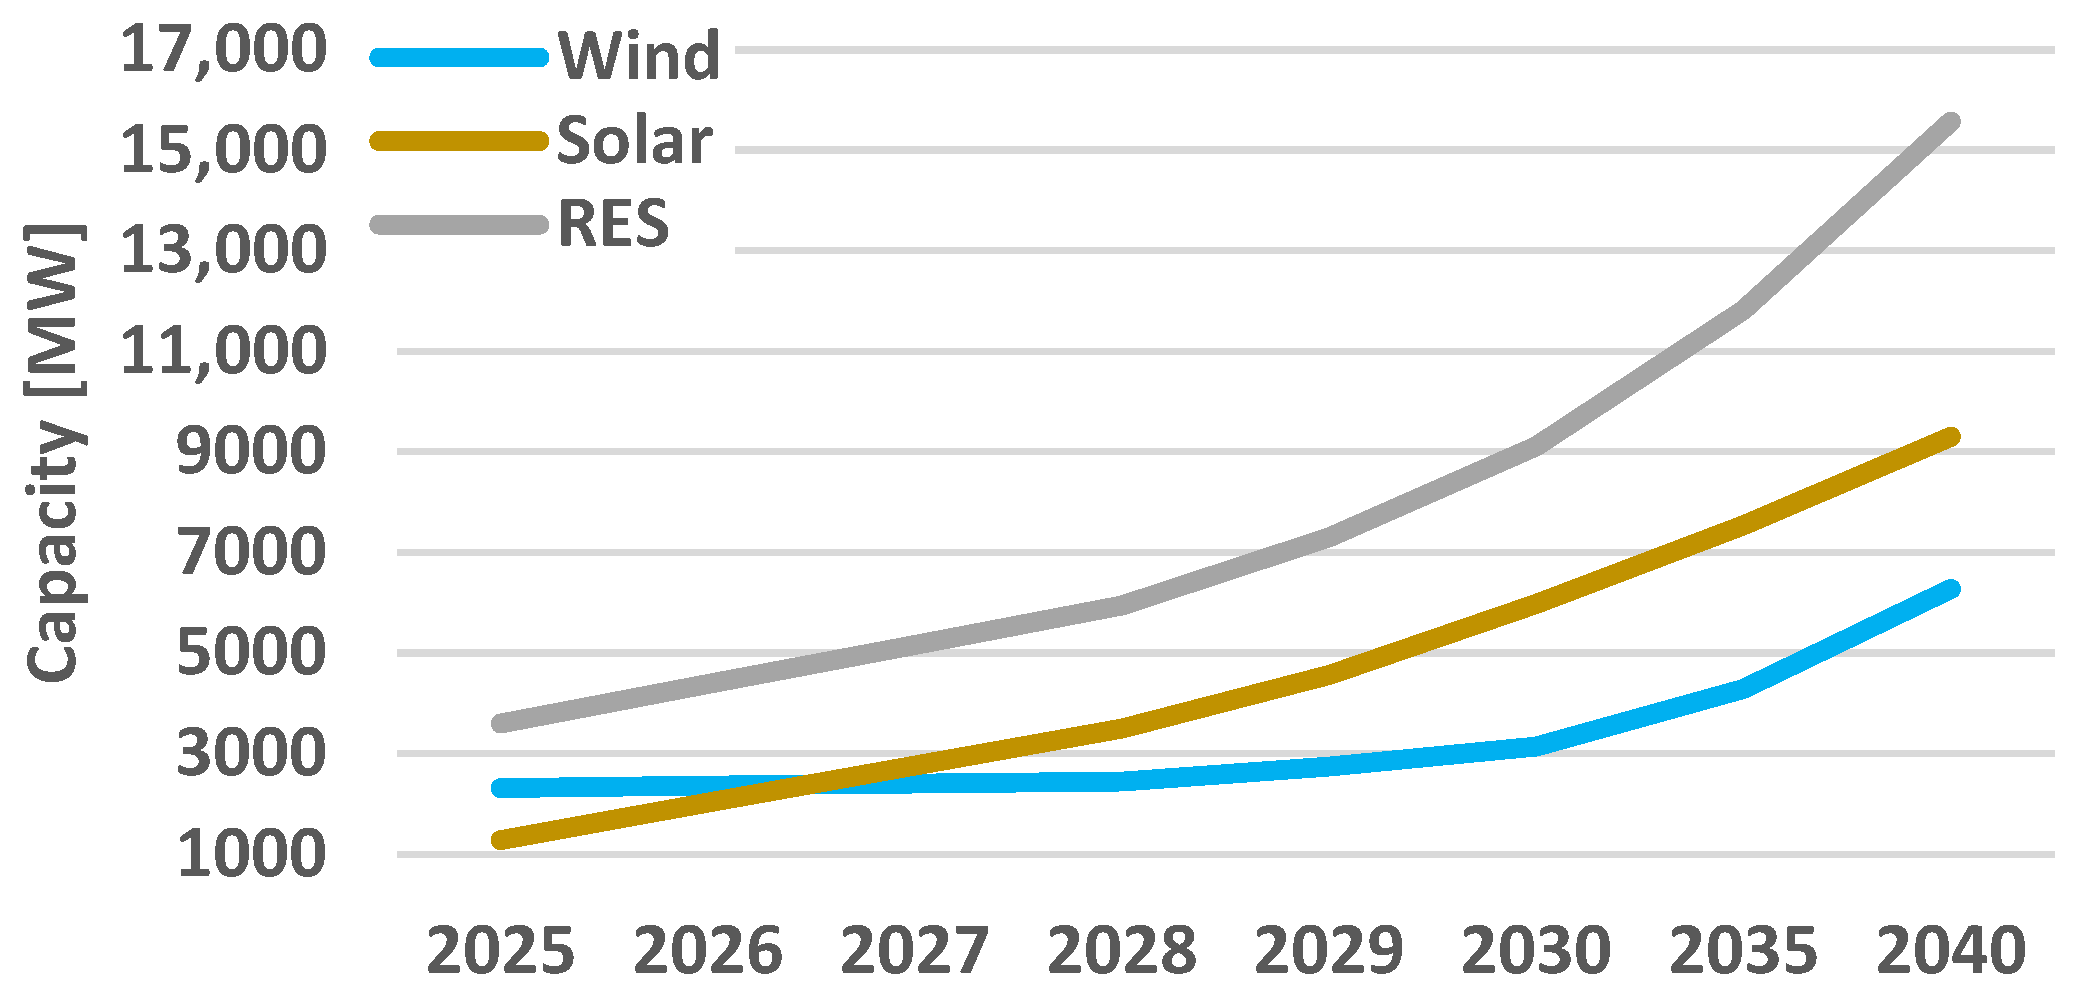
In the 2028 scenario, it was assumed that 100% of the plants with STMD/Contract status would become operational. This assumption is justified by their advanced procedural status and the typical commissioning timeframe of 24–36 months. In the 2029 scenario, the installed capacity includes 100% of the plants with STMD/Contract status and an additional 12% of those with Authorization Granted status, which are highly likely to become operational. The long-term 2035 scenario assumes the full commissioning of plants with a high probability of completion, together with a portion of projects with a lower likelihood of implementation. Specifically, it was assumed that 100% of the STMD/Contract plants will become operational, along with 35% of those with Authorization Granted status (assuming a 65% project attrition rate), and 11% of projects currently under evaluation (with accepted STMG). Figure 9 illustrates the projected evolution of RES capacity connected to the HV grid based on the defined assumptions. The results indicate that the total installed capacity is expected to reach approximately 6 GW by 2028, increase to 7.3 GW by 2029, and reach 11.8 GW by the 2035 forecast horizon.
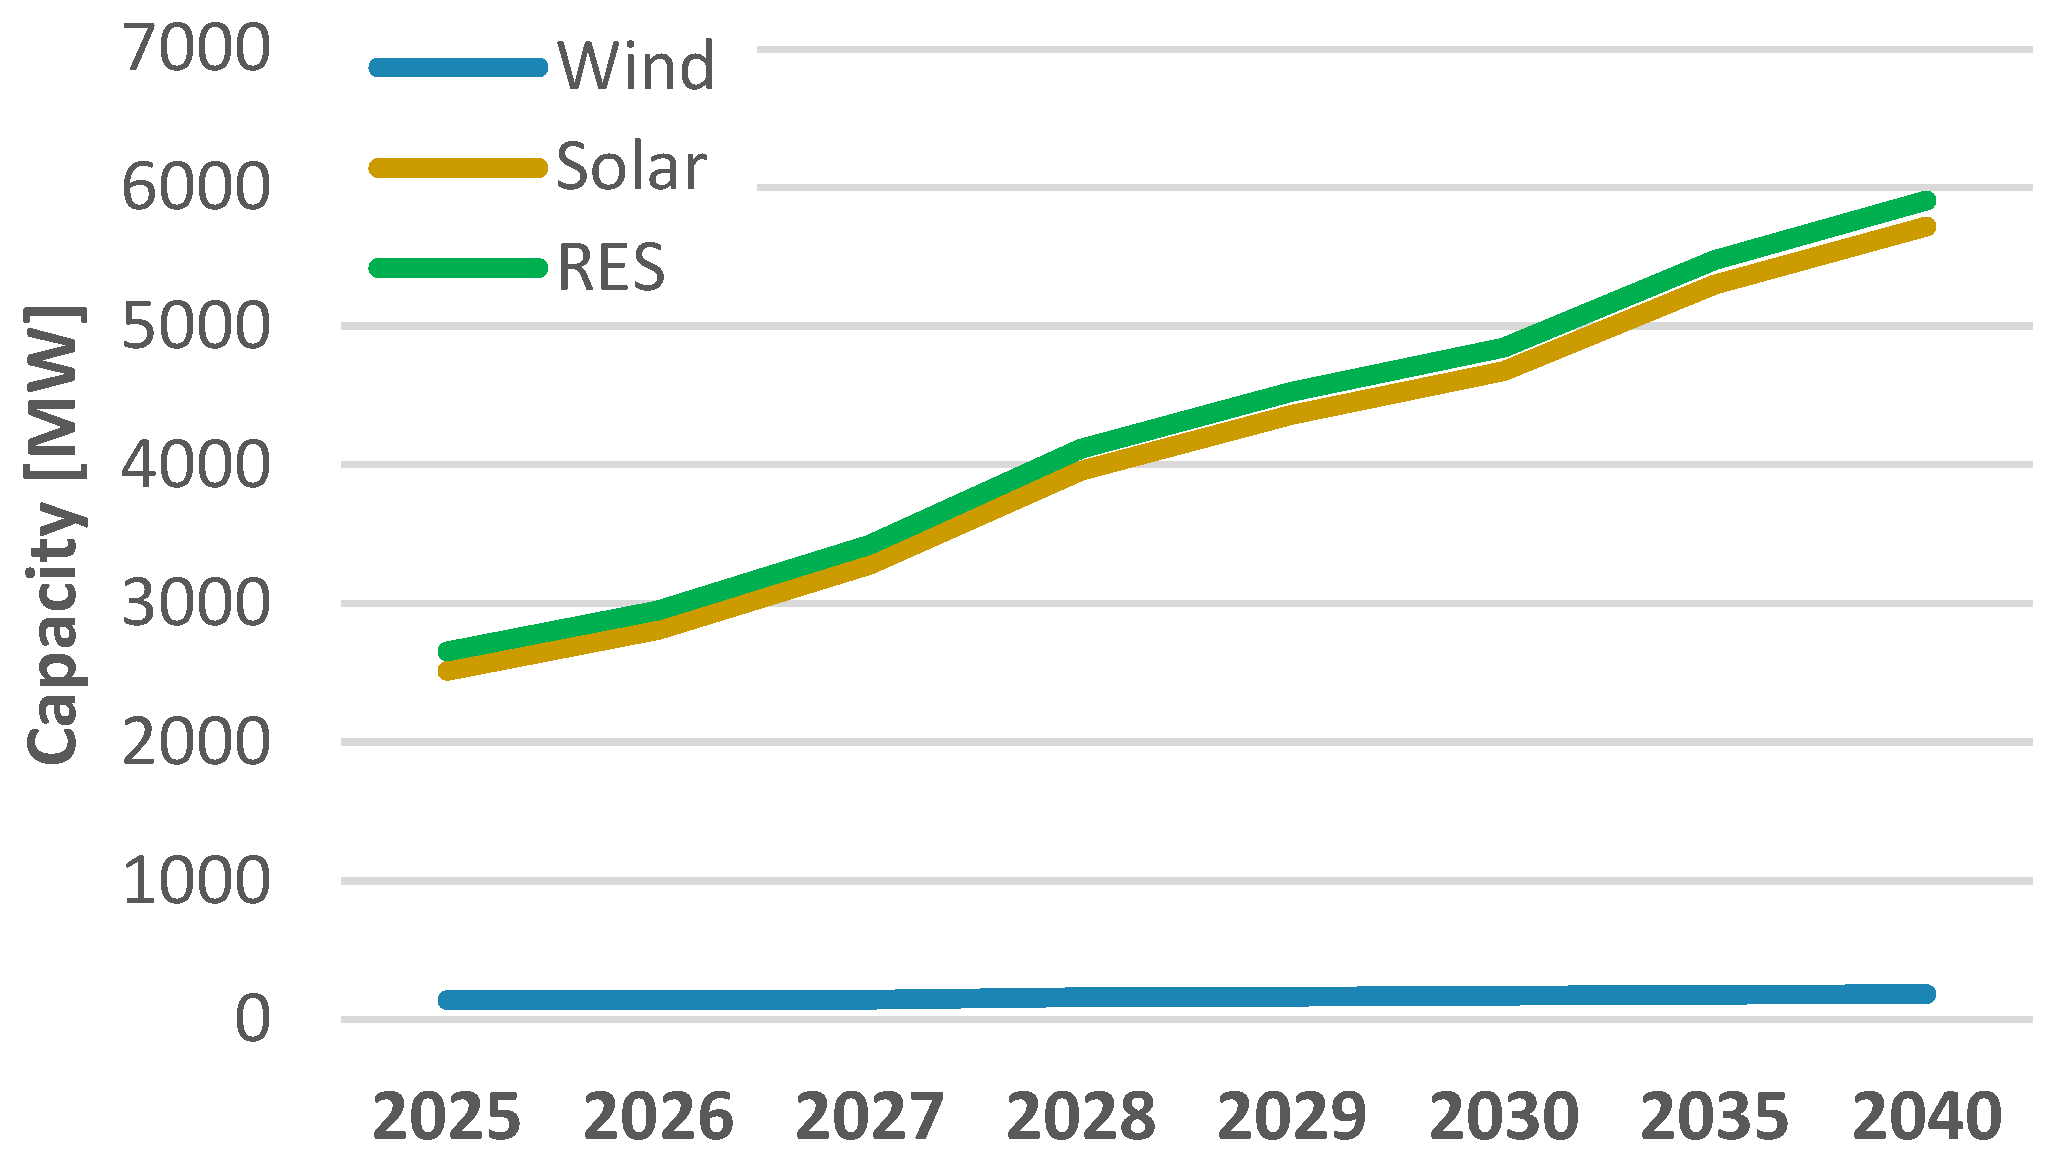
Figure 10 illustrates the projected evolution of RES capacity connected to the MV–LV networks up to 2040. This capacity, estimated by subtracting the expected HV share for each year from the PNIEC targets, amounts to approximately 4 GW by 2028, increases to 4.5 GW by 2029, and reaches 5.5 GW by 2035.
Based on these assumptions, the total installed RES capacity across the three voltage levels (HV, MV, and LV) is expected to reach 10 GW in 2028, 11.8 GW in 2029, and 17.3 GW by 2035. To improve the spatial resolution of the forecast, the expected HV capacity for the entire region was proportionally allocated to individual microzones based on the recorded connection requests in each area, assuming the same project completion rates associated with each authorization status as those used for the regional estimates. This allocation was enabled by the availability of detailed information on the authorization status of connection requests at the microzonal level. This approach allows the expected power injections to be geographically localized in the areas where plant installation is effectively planned. Table 7 presents the forecast RES capacity in each microzone, disaggregated by generation source.
The micro-zonal distribution of the projected capacity shows a significant increase in installed capacity, mainly concentrated in the North-West, North-East, and South-East regions of Sicily. In all considered scenarios, solar capacity clearly exceeds wind capacity.
Given the long-term horizon of the analyzed scenarios, the proposed RES trajectories should be interpreted as plausible and conservative scenarios rather than deterministic forecasts. The adopted approach is based on conservative implementation rates differentiated according to the procedural maturity of the projects.
The RES capacities resulting from the developed scenarios remain consistent with the growth path defined by national energy policies. In addition, a comparison with the official data reported in the GSE statistical reports [34] for the 2020–2024 period shows that the growth of installed RES capacity in Sicily, relative to the 2020 baseline, has remained broadly consistent with the incremental targets defined by the Ministerial Decree of 21 June 2024 [32]. This agreement between the observed historical trends and the assumed development trajectories supports the plausibility of the assumptions adopted in the forecast scenarios.

3.3. Power Flow Analysis: Scenarios, Inputs, and Operational Assumptions

Once the forecast scenarios for future RES capacity had been defined, power flow analyses were carried out on the Sicilian transmission network. Steady-state simulations were performed using WinCreso® version 7.69, a software tool developed by CESI in collaboration with Terna and compliant with the ENTSO-E Common Grid Model Exchange Standard (CGMES) requirements.
The network model for Sicily, provided by Terna S.p.A., represents the transmission network configuration expected for July 2025 under normal operating conditions. The model includes RES plants expected to be commissioned in the short term, as well as two major HVDC interconnections currently under construction, scheduled for completion by 2028: the TUN-ITA interconnection and the eastern branch of the Tyrrhenian Link. Two representative days in April and July were selected for simulation among the possible operating conditions,. This choice was based on the CF analysis, which showed that April corresponds to the month with the highest combined wind and solar generation in both Sicily and Tunisia (Table 5), while July is characterized by the highest solar generation in both regions (Table 4). These representative months were simulated for the years 2028, 2029, and 2035. The input data required by the software for each analyzed scenario included not only the network topology and technical parameters, but also the power injected by each wind and solar generation unit, the load of the Sicilian HV transmission network, and the power exchanged through the TUN-ITA interconnection and the Tyrrhenian Link. The power injected by renewable plants was estimated by multiplying the expected installed wind and solar capacity in each microzone by the corresponding monthly zonal CF, as defined in Equation (6). Since the exact connection nodes of future plants cannot be predicted with certainty, the total power injected within each microzone was equally distributed among the generation units modeled in the software, according to Equation (13). The TUN-ITA interconnection was assumed to operate in import mode, transferring 600 MW to Sicily, while the Tyrrhenian Link was assumed to export 450 MW from Sicily to Campania. The objective of the simulations was to represent normal operating conditions realistically. Therefore, the reference loads for the analyzed months were defined using intermediate demand levels representative of typical weekdays in April (1840 MW) and July (2165 MW) of the reference year 2025. These levels are based on data provided by Terna’s Central-Southern Dynamic Security Assessment.
To define the load in future scenarios, these reference values were reduced by the expected RES power injected into the MV–LV networks. This value was calculated by applying the corresponding monthly CF (wind or solar) to the forecast MV–LV installed capacity for each considered year. As a result, the HV network load progressively decreases over time due to the increasing contribution of distributed renewable generation. Table 8 summarizes the load values assumed for each analyzed scenario.
Based on these assumptions, steady-state power flow analyses were carried out using WinCreso® version 7.69 under both normal operating conditions (N) and contingency conditions (N-1). The simulations were performed to identify the grid sections most prone to overload under the considered scenarios and network configuration. For this reason, no corrective actions for congestion mitigation were implemented, such as generation redispatch or adjustment of HVDC interconnector setpoints. This methodological choice enables a conservative assessment of the intrinsic robustness of the grid.
The only control actions considered involved the modulation of two shunt reactors located in the northwestern area for voltage regulation purposes. However, voltage control analysis is outside the scope of this study.

4. Results

This section presents the results of steady-state power flow simulations performed under normal operating conditions (N) and N-1 security conditions for the RES capacity forecast scenarios over the period 2028–2035. The results identify the transmission lines and microzones of the Sicilian network that are expected to experience the highest loading levels due to the projected increase in RES capacity and the commissioning of new HVDC interconnections.

4.1. Results Under Normal Operating Conditions (N Configuration)

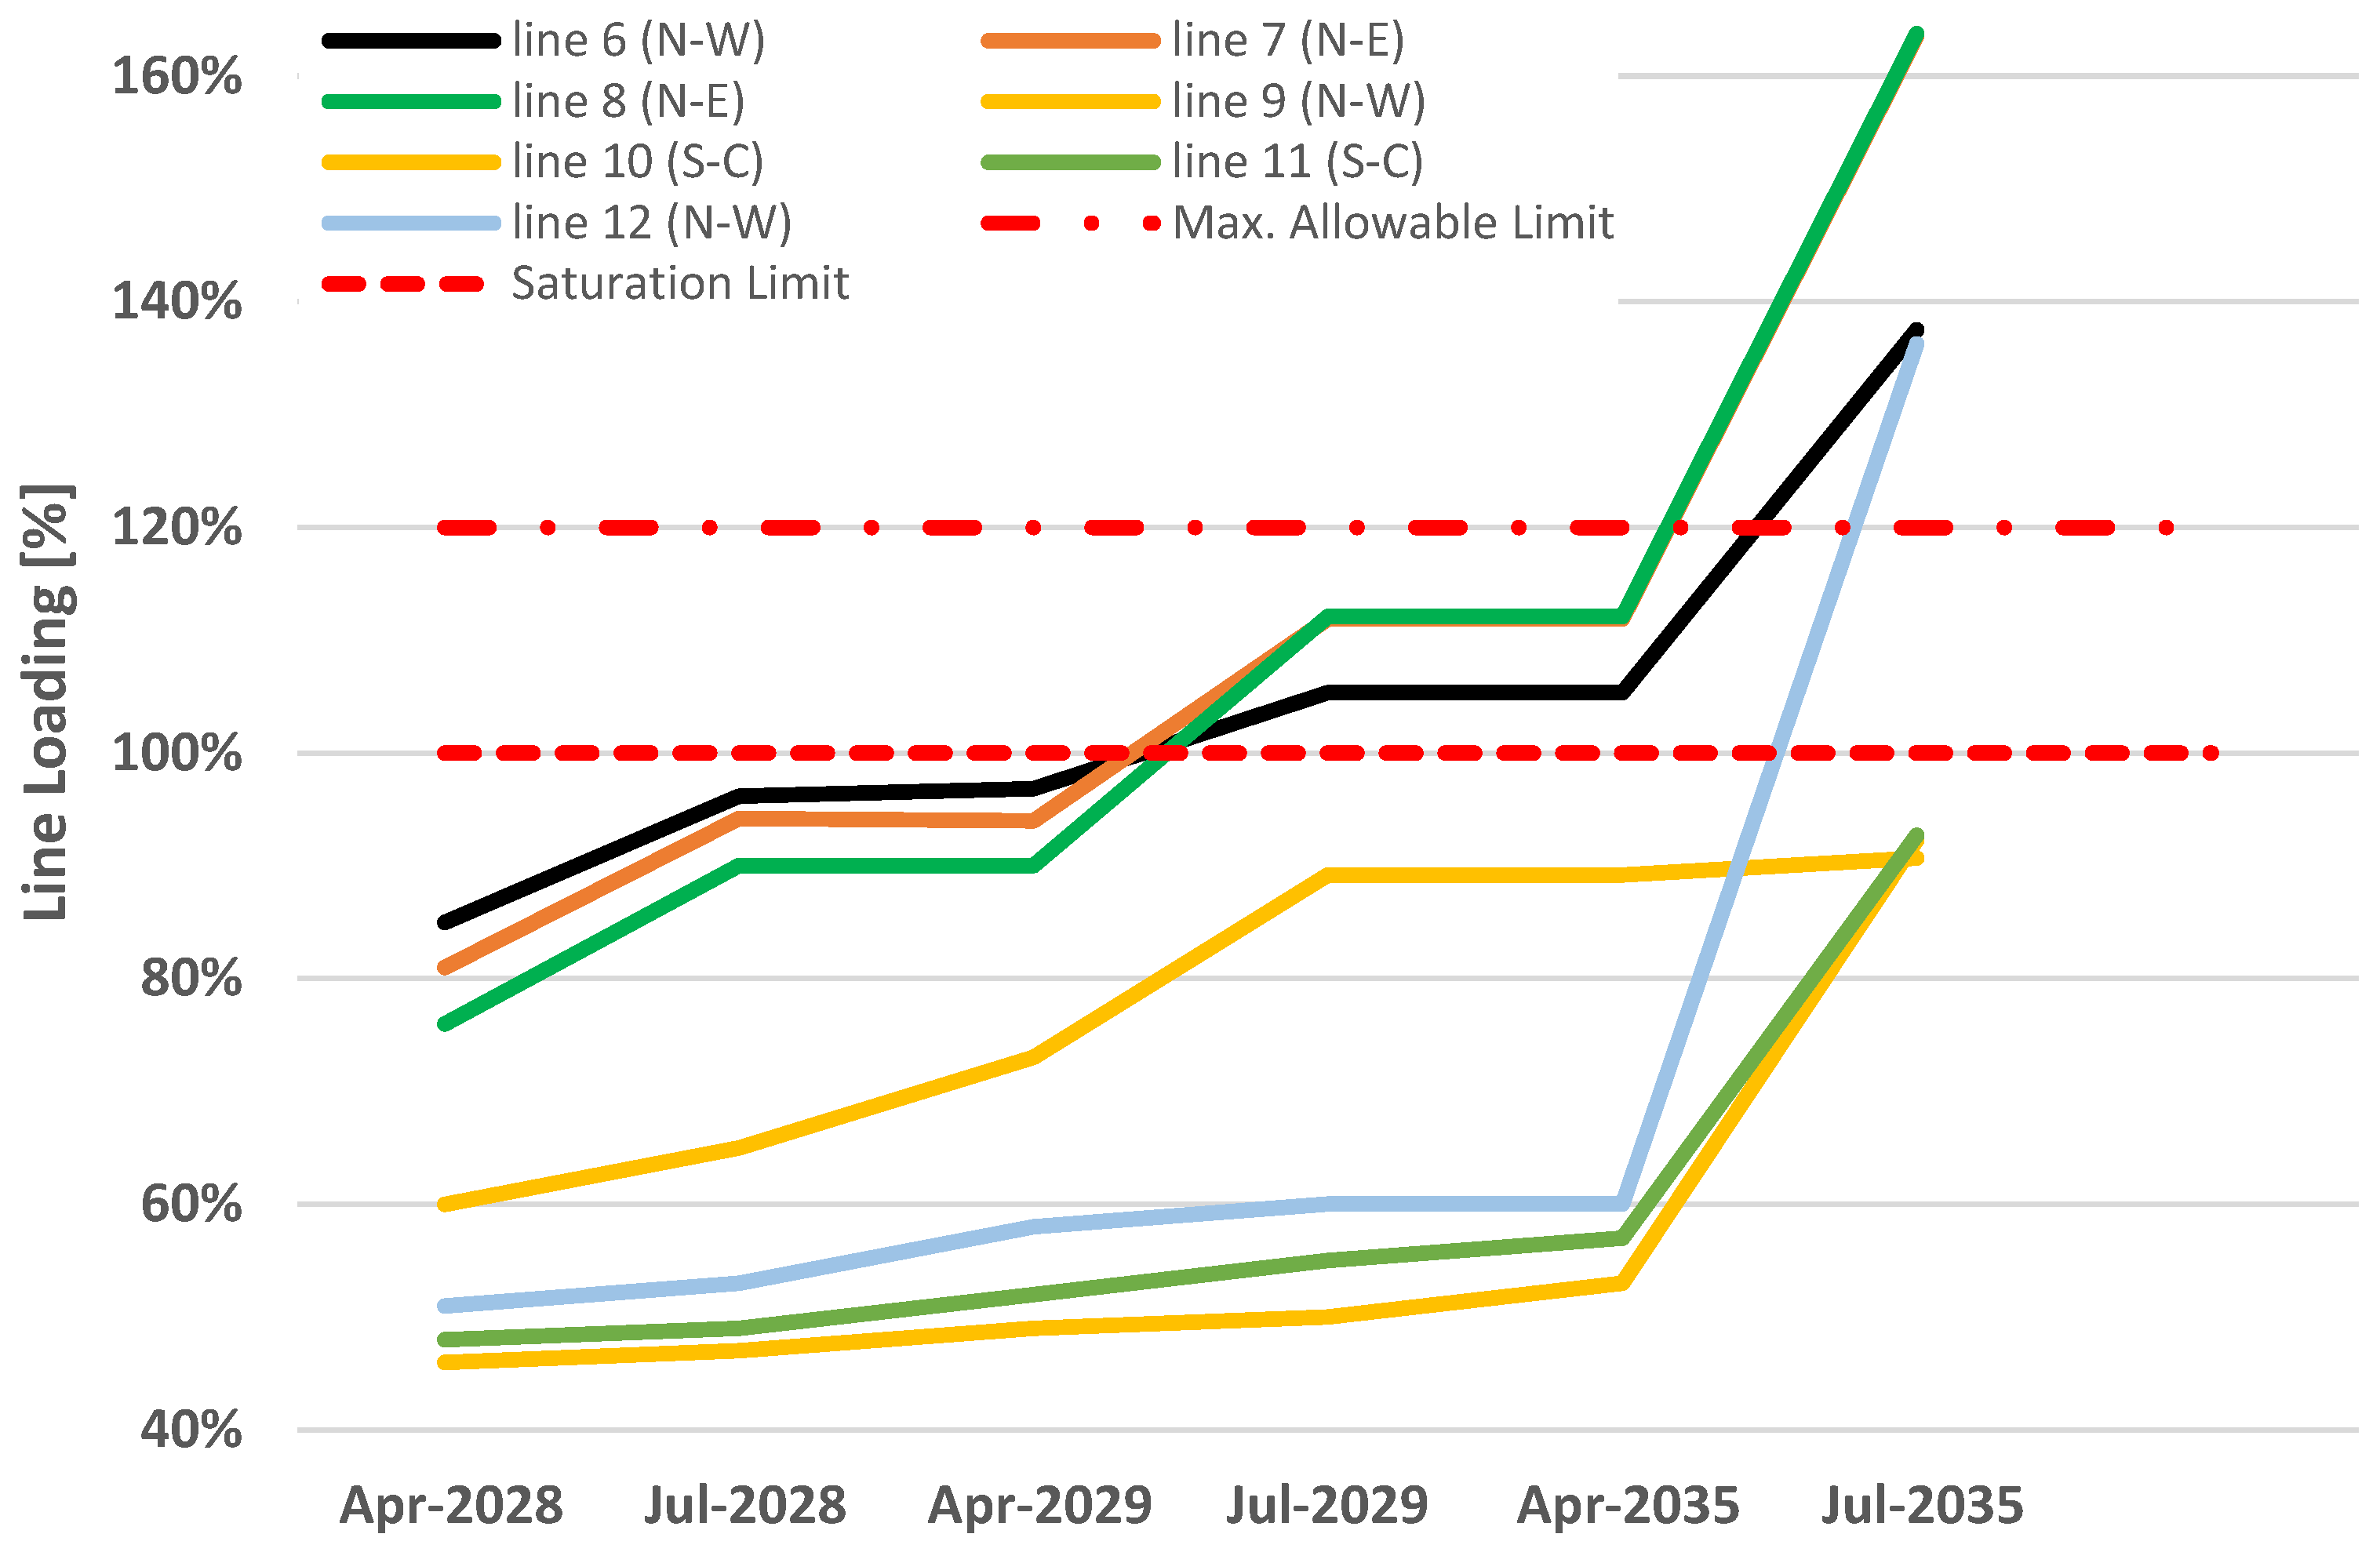
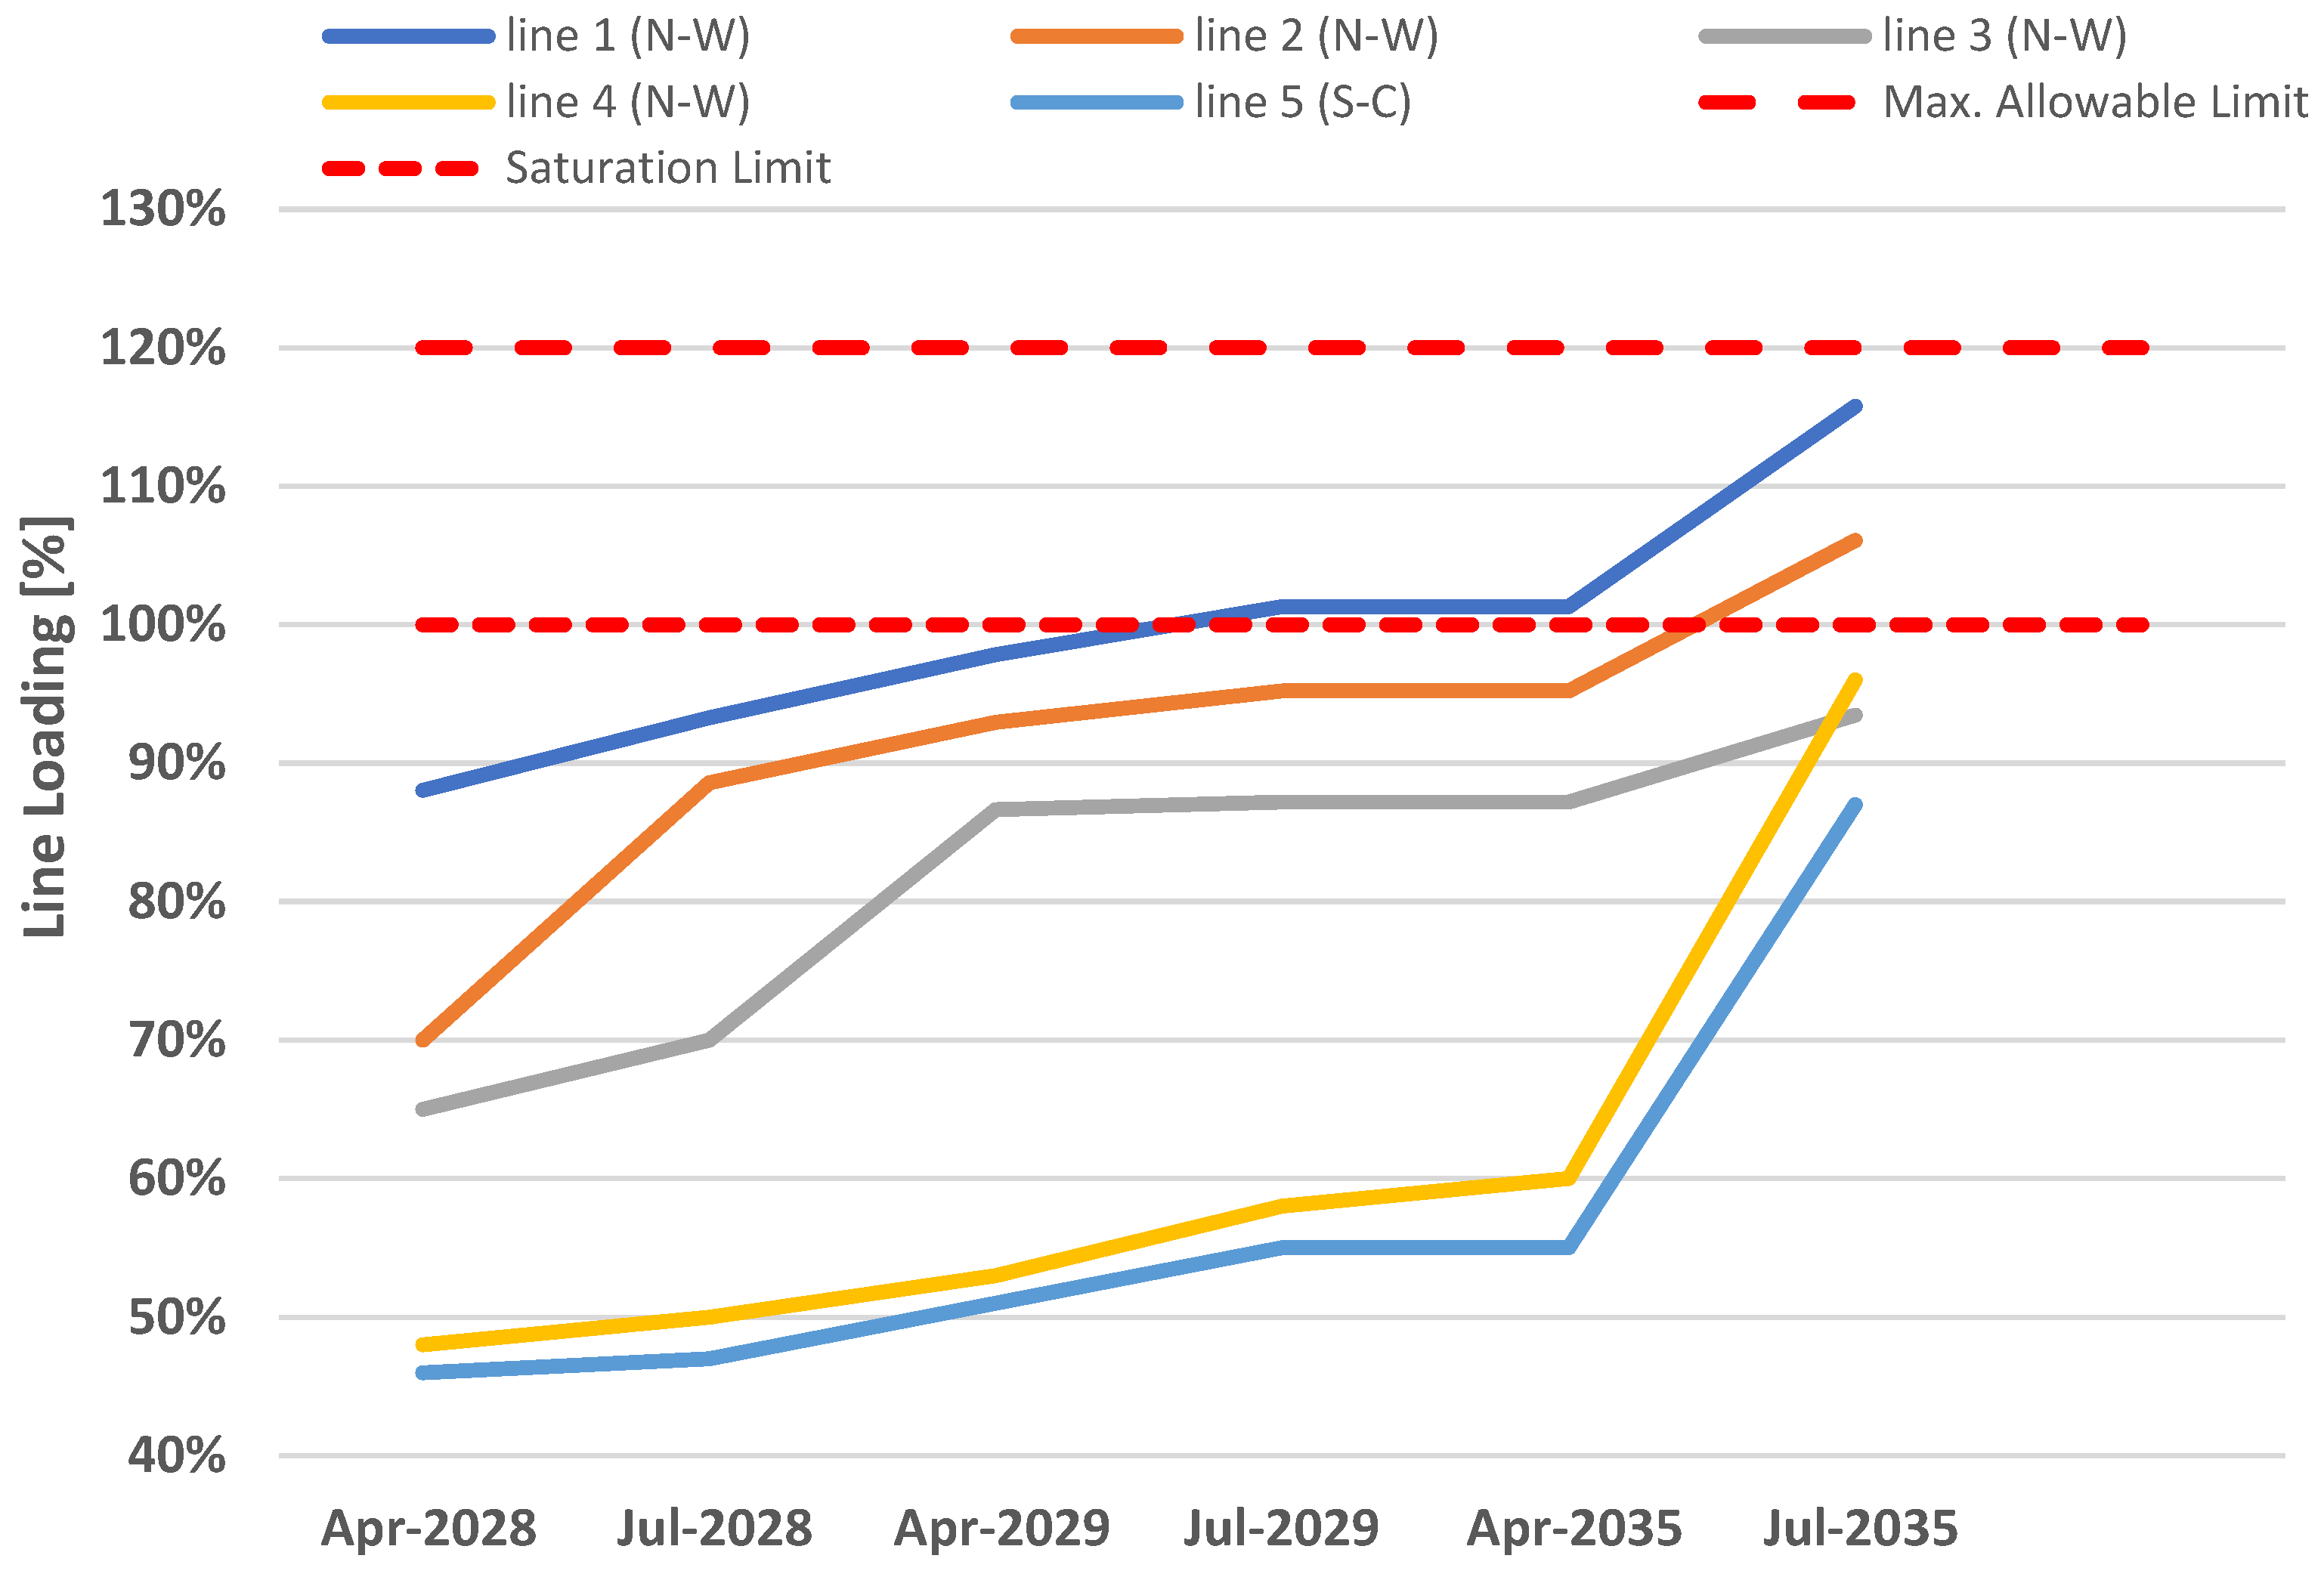
Figure 11 and Figure 12 illustrate the temporal evolution of the line loading indices for the 220 kV and 150 kV transmission lines, respectively, under normal operating conditions (N) across the analyzed scenarios. The legend also indicates the geographical areas to which each line belongs: N-W (North-West) and S-C (South-Central). Figure 11 and Figure 12 show that July is the month with the most critical operating conditions for both the 220 kV and 150 kV networks under normal conditions. This behavior is mainly due to the higher contribution of solar generation, which reaches its peak production during this period, resulting in higher line loading levels compared to the April scenario for the same installed capacity.
The results indicate that the 220 kV network operates within secure limits until April 2029, with line loading levels remaining below the thermal capacity limit (densely dashed red line). The first critical conditions emerge in the July 2029 and April 2035 scenarios, where Line 1, located in the North-West microzone, slightly exceeds its nominal capacity, reaching a loading level of 101%. In the July 2035 scenario, two lines experience overload conditions: Line 1, reaching a loading level of 116%, and Line 2, reaching 106%. Although these values exceed the nominal capacity limit, they remain below the maximum allowable threshold of 120%.
The 150 kV network does not show critical conditions up to the April 2029 scenario. From July 2029, both the number of overloaded lines and the magnitude of the loading indices become higher than those observed in the 220 kV network. This behavior is mainly due to the higher concentration of new RES plants expected to be connected to the 150 kV network, which has a wider geographical coverage across Sicily. In the July 2029 and April 2035 scenarios, critical conditions affect three transmission lines: Line 6 in the North-West microzone, with a loading level of 105%, and Lines 7 and 8 in the North-East microzone, reaching loading levels of 112%, while still remaining below the maximum allowable limit of 120%. The July 2035 scenario represents the most critical condition, with four transmission lines experiencing overloads exceeding the maximum allowable limit of 120%. In particular, the loading levels of the previously mentioned lines further increase, and an additional overload is observed on Line 12, located in the North-West microzone.

4.2. Results Under N-1 Contingency Conditions

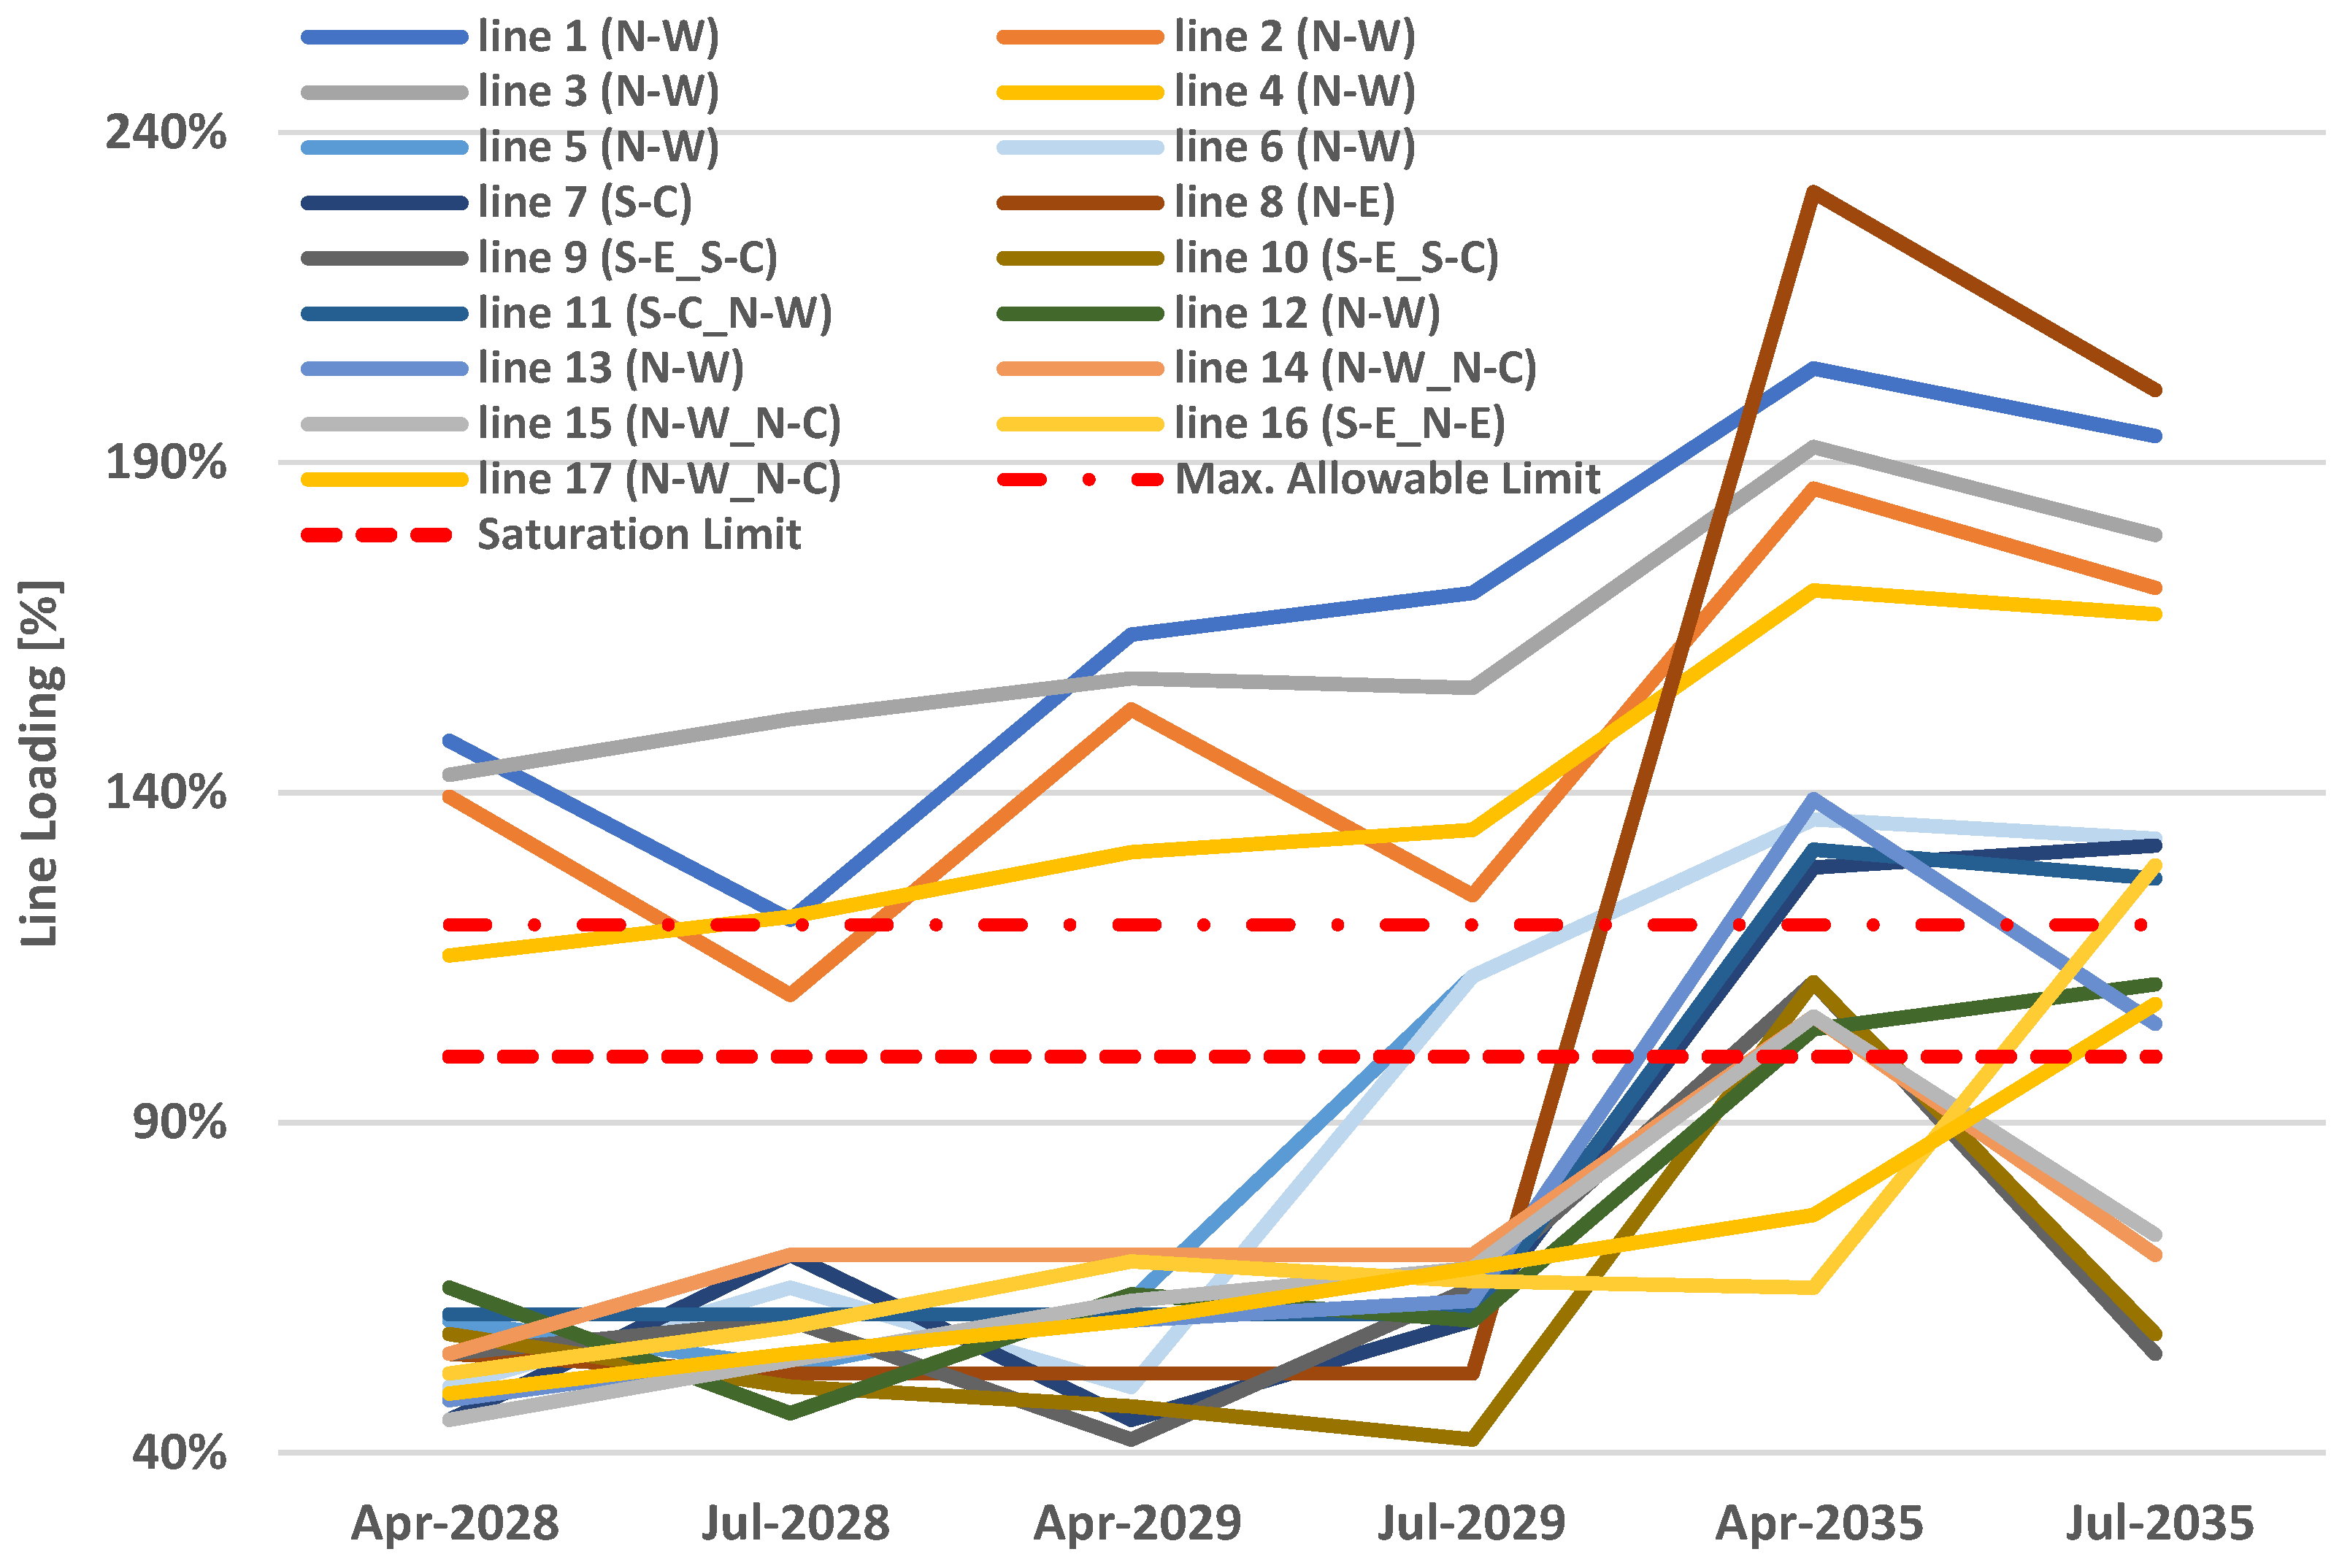
Figure 13 illustrates the temporal evolution of the loading indices of the 220 kV and 400 kV transmission lines up to 2035, following the most severe N-1 contingency identified for each scenario. All the lines shown operate at 220 kV, except Line 8, which operates at 400 kV. Furthermore, the N-1 analysis indicates that no overload conditions occur in the 150 kV network. The legend specifies the geographical areas associated with each line: N-W (North-West), N-E (North-East), S-E (South-East), and S-C (South-Central).
Under normal operating conditions (N), the most severe overloads occur in July for each analyzed year. This is mainly due to the predominance of installed solar capacity over wind capacity and the higher solar productivity during this period. Conversely, under N-1 contingency conditions, the severity of network loading does not depend only on the total generation level. It is also strongly influenced by the connection location of generation units and the redistribution of power flows following the contingency event. For this reason, April represents the most critical operating condition under N-1 security criteria for each analyzed year.
The results highlight significant critical conditions throughout the entire time horizon, with operating limits already exceeded in the April 2028 scenario. In this scenario, Lines 1, 2, 3, and 4 located in the northwestern area show substantial overloads. Specifically, Lines 1 (148%), 2 (139%), and 3 (143%) significantly exceed the maximum allowable limit of 120% (indicated in the graph by the widely dashed red line), while Line 4 reaches an LL of 119%, remaining slightly below this threshold.
From the July 2029 scenario, the loading levels of the four previously mentioned lines increase progressively. Additional overloads also appear on Lines 5 and 6 in the North-West area, with a LL of 112%. Although their loading levels initially remain below the maximum allowable limit (120%), they show an increasing trend in subsequent scenarios.
The April 2035 scenario represents the most critical condition, with the number of overloaded lines increasing to 15. Among these, ten lines (including Lines 1, 2, 3, 4, 5, 6, 7, 8, 11, and 13) exceed the 120% threshold, with the 400 kV Line 8 exhibiting the highest LL value (231%). The remaining five lines (9, 10, 12, 14, and 15) operate above the saturation limit (100%) but remain below the maximum allowable limit. In the July 2035 scenario, the severity of overloads slightly decreases compared with April, although several lines continue to operate significantly above the safety threshold.
The analysis indicates that the North-West microzone will be the most vulnerable part of the network in the short term (2028–2029). The other microzones (South-Central, South-East, North-East, and North-Central) will only show significant saturation in the 2035 scenario, which will affect a smaller number of overloaded lines.
The measured overload values represent stress-test scenarios intended to identify the most vulnerable sections of the grid and support the definition of preventive mitigation measures, rather than realistically sustainable operating conditions.
Under real operating conditions, these situations would be mitigated through the action of protection systems, generation redispatch, and corrective operational measures, such as operating specific transmission lines in radial configuration.
Therefore, the critical sections identified by the analysis represent priority areas for targeted interventions, including the reconductoring of existing lines, the adoption of Dynamic Thermal Rating (DTR) systems, the integration of storage systems, and the construction of new transmission infrastructure.
The simulations were performed using the software adopted by Terna for the analysis and operation of the national power system, based on a real configuration of the Sicilian grid that includes the transmission network topology and the main technical operating parameters. Although this study is not intended to compare different simulation tools, the main critical issues identified by the simulations, such as the progressive increase in congestion in northwestern Sicily, are consistent with both the geographic distribution of RES connection requests and the critical issues of the Sicilian HV grid identified in the Sicilian Region Environmental Energy Plan [35]. They are also consistent with the reinforcement measures included in Terna’s Development Plans [36], such as the Tyrrhenian Link and the 380 kV Caracoli–Ciminna line. Nevertheless, future work based on comparisons with alternative models or simulation tools could provide additional validation and further strengthen the robustness of the analyzed scenarios.

5. Conclusions

The study analyzed the future impacts on the Sicilian transmission grid resulting from the progressive integration of RES and the commissioning of new HVDC interconnections. Particular attention is given to the Italy–Tunisia (TUN-ITA) interconnection and the eastern branch of the Tyrrhenian Link, considering plausible RES capacity scenarios up to 2035. The adopted approach integrates microzonal analyses of wind and solar potential in Sicily and Tunisia, the estimation of monthly CF at the microzonal level, and the development of RES capacity scenarios based on actual connection requests and national regulatory targets. This framework enables the definition of realistic scenarios consistent with the expected medium-term evolution of the electricity system. The renewable potential analysis highlighted a strong similarity between the annual profiles of wind and solar resources in Sicily and Tunisia, with Tunisia showing a higher average potential. April was identified as the month with the highest simultaneous wind and solar producibility in both territories. The analysis of connection requests and the development of RES capacity scenarios indicate significant short-term growth, particularly in the north-western and north-eastern areas of Sicily, with solar generation prevailing over wind generation.
Steady-state power flow simulations under normal operating conditions showed the 220 kV network operated stably across all analyzed scenarios. However, the 150 kV network exhibited more significant overload conditions, especially in north-western and north-eastern areas in the 2035 scenarios. In the absence of targeted infrastructure reinforcements, these conditions may require the implementation of operational mitigation measures, such as renewable generation curtailment, to ensure system security, with potential negative economic implications.
The analyses conducted under N-1 contingency conditions revealed progressively increasing congestion as early as April 2028, particularly in north-western Sicily. The south-central and north-eastern areas are affected by fewer overloaded lines and only in the long-term scenarios. These critical conditions arise from different factors. In the north-west area, the network is significantly affected by power injections from the TUN-ITA interconnection and by high wind generation levels. In the north-east area, the current limited presence of large RES plants means that the existing grid infrastructure cannot fully accommodate the expected future capacity growth.
Overall, the study identified the transmission lines and network sections most exposed to congestion risks, providing useful guidance for planning priority infrastructure interventions. Key mitigation measures include reconductoring existing lines, implementing DTR systems on the most stressed corridors, and integrating energy storage systems to manage generation peaks and fast transients associated with non-dispatchable renewable generation. These measures should be complemented by the planning and construction of new transmission lines to relieve overloaded corridors and ensure the long-term security, reliability, and flexibility of the electricity system.

Author Contributions

Conceptualization, S.P.; methodology, F.M., A.S., S.P. and E.D.M.; Software, S.P.; Validation, S.P. and N.C.; Writing—original draft preparation, A.S.; Writing—review and editing, F.M. and N.C.; Supervision, F.M. and E.D.M. All authors have read and agreed to the published version of the manuscript.

Funding

This research received no external funding.

Data Availability Statement

The original contributions presented in the study are included in the article. Further inquiries can be directed to the corresponding author.

Conflicts of Interest

A.S., S.P., E.D.M. and N.C. were employed by Terna S.p.A. The remaining authors declare that the research was conducted in the absence of any commercial or financial relationships that could be construed as a potential conflict of interest.

Abbreviations

The following abbreviations are used in this manuscript:
RESRenewable Energy Sources
PNIECIntegrated National Energy and Climate Plan
TSOTransmission System Operator
PDSPiano di Sviluppo
HVDCHigh Voltage Direct Current
CFCapacity Factor
HVHigh Voltage
TMYTypical Meteorological Year
EDEuclidean Distance
GUGeneration Unit
MVMedium Voltage
LVLow Voltage
STMDDetailed Minimum Technical Solution
STMGGeneral Minimum Technical Solution
DSADynamic Security Assessment
LLLine Loading
DTRDynamic Thermal Rating

References

  1. Commissione Europea. Il Green Deal Europeo, Comunicazione della Commissione al Parlamento Europeo, al Consiglio, al Comitato Economico e Sociale Europeo e al Comitato delle Regioni, COM 640 Final, Bruxelles; Commissione Europea: Brussels, Belgium, 2019. [Google Scholar]
  2. Ministero dell’Ambiente e della Sicurezza Energetica. Piano Nazionale Integrato per l’Energia e Il Clima; Ministero dell’Ambiente e della Sicurezza Energetica: Rome, Italy, 2024. [Google Scholar]
  3. Medina, C.; Ana, C.R.M.; González, G. Transmission Grids to Foster High Penetration of Large-Scale Variable Renewable Energy Sources—A Review of Challenges, Problems, and Solutions. Int. J. Renew. Energy Res. 2022, 12, 146–169. [Google Scholar] [CrossRef] [Scilit]
  4. Ríos Melgar, A.C.; Medina, C.A.; González, G. La Flexibilidad y Otros Retos de la Integración Masiva de Generación Eólica y Solar en Los Sistemas de Potencia. Prism. Tecnol. 2022, 13, 88–96. [Google Scholar] [CrossRef] [Scilit]
  5. Terna S.p.A. Piano di Sviluppo 2025—Overview—Una Rete Sostenibile e Digitale per Affrontare le Sfide della Transizione; Terna S.p.A.: Rome, Italy, 2025. [Google Scholar]
  6. Favuzza, S.; Giuseppe Ippolito, M.; Massaro, F.; Mineo, L.; Musca, R.; Zizzo, G. New Energy Corridors in the Euro-Mediterranean Area: The Pivotal Role of Sicily. Energies 2018, 11, 1415. [Google Scholar] [CrossRef] [Scilit]
  7. Terna S.p.A. Tyrrhenian Link: The Authorisation Process for the East Section Connecting Campania and Sicily Begins, Press Release; Terna S.p.A.: Rome, Italy, 2021. [Google Scholar]
  8. Terna S.p.A. Collegamento HVDC: Collegamento ‘Sicilia–Campania’ ‘Tyrrhenian Link’—Progetto per la Partecipazione e Consultazione del Pubblico—Opuscolo Informativo; Terna S.p.A.: Rome, Italy, 2021. [Google Scholar]
  9. Terna S.p.A. Authorisation Process for the Italy–Tunisia Interconnection Begins; Terna S.p.A.: Rome, Italy, 2022. [Google Scholar]
  10. Terna S.p.A. Collegamento HVDC Italia-Tunisia; Terna S.p.A.: Rome, Italy, 2019. [Google Scholar]
  11. Di Gloria, P.; Paradiso, S.; Pede, M.; Sorrentino, V.M.E.; Vergine, C.; Massaro, F.; Vasile, A.; Zizzo, G. On the Impact of Renewable Generation on the Sicilian Power System in Near-Future Scenarios: A Case Study. Energies 2024, 17, 3352. [Google Scholar] [CrossRef] [Scilit]
  12. Watson, N.R.; Watson, J.D. An Overview of HVDC Technology. Energies 2020, 13, 4342. [Google Scholar] [CrossRef] [Scilit]
  13. Stan, A.; Costinaș, S.; Ion, G. Overview and Assessment of HVDC Current Applications and Future Trends. Energies 2022, 15, 1193. [Google Scholar] [CrossRef] [Scilit]
  14. Zhu, G.; Dong, J.; Grazian, F.; Bauer, P. A Hybrid Modulation Scheme for Efficiency Optimization and Ripple Reduction in Secondary-Side Controlled Wireless Power Transfer Systems. IEEE Trans. Transp. Electrif. 2025, 11, 6840–6853. [Google Scholar] [CrossRef] [Scilit]
  15. Moscoloni, C.; Zarra, F.; Novo, R.; Giglio, E.; Vargiu, A.; Mutani, G.; Bracco, G.; Mattiazzo, G. Wind Turbines and Rooftop Photovoltaic Technical Potential Assessment: Application to Sicilian Minor Islands. Energies 2022, 15, 5548. [Google Scholar] [CrossRef] [Scilit]
  16. Frysztacki, M.M.; Hörsch, J.; Hagenmeyer, V.; Brown, T. The Strong Effect of Network Resolution on Electricity System Models with High Shares of Wind and Solar. Appl. Energy 2021, 291, 116726. [Google Scholar] [CrossRef] [Scilit]
  17. Halloran, C.; McCulloch, M. Spatial Clustering of Temporal Energy Profiles with Empirical Orthogonal Functions and Max-p Regionalization. arXiv 2023, arXiv:2308.12274. [Google Scholar] [CrossRef] [Scilit]
  18. Bonanno, R.; Collino, E. Assessing the Impact of Climate Change on Solar Energy Production in Italy. Reg. Environ. Change 2025, 25, 78. [Google Scholar] [CrossRef] [Scilit]
  19. Carlini, E.M.; De Cesare, A.; Gadaleta, C.; Giordano, C.; Migliori, M.; Forte, G. Assessment of Renewable Acceptance by Electric Network Development Exploiting Operation Islands. Energies 2022, 15, 5564. [Google Scholar] [CrossRef] [Scilit]
  20. Syranidou, C.; Linssen, J.; Stolten, D.; Robinius, M. Integration of Large-Scale Variable Renewable Energy Sources into the Future European Power System: On the Curtailment Challenge. Energies 2020, 13, 5490. [Google Scholar] [CrossRef] [Scilit]
  21. L’Abbate, A.; Vitulano, L.C.; Zizzo, G.; Musca, R.; Vasile, A. Studi Sulla Rete Siciliana con Inclusione di Funzioni di Controllo Evolute dei Collegamenti HVDC; RSE S.p.A.: Milan, Italy, 2023. [Google Scholar]
  22. Musca, R.; Sanseverino, E.R.; Vasile, A.; Zizzo, G.; Iaria, A.; L’Abbate, A.; Vitulano, L.C. Load-Flow Studies on the Future Power Grid of Sicily: Analysis of 2030 Scenarios; IEEE: New York, NY, USA, 2023. [Google Scholar]
  23. Huld, T.; Paietta, E.; Zangheri, P.; Pascua, I.P. Assembling Typical Meteorological Year Data Sets for Building Energy Performance Using Reanalysis and Satellite-Based Data. Atmosphere 2018, 9, 53. [Google Scholar] [CrossRef] [Scilit]
  24. Taylor, N.; Martinez, A.; Alexandris, N.; Gounari, O.; Szabo, S.; Chatzipanagi, A.; Mercado, L. Photovoltaics Geographical Information System: Status Report 2024; Publications Office of the European Union, Ed.; Publications Office of the European Union: Luxembourg, 2025. [Google Scholar]
  25. Urraca, R.; Gracia-Amillo, A.M.; Koubli, E.; Huld, T.; Trentmann, J.; Riihelä, A.; Lindfors, A.V.; Palmer, D.; Gottschalg, R.; Antonanzas-Torres, F. Extensive Validation of CM SAF Surface Radiation Products over Europe. Remote Sens. Environ. 2017, 199, 171–186. [Google Scholar] [CrossRef] [Scilit] [PubMed]
  26. Smith, A.; Lott, N.; Vose, R. The Integrated Surface Database: Recent Developments and Partnerships. Bull. Am. Meteorol. Soc. 2011, 92, 704–708. [Google Scholar] [CrossRef] [Scilit]
  27. Krähenmann, S.; Walter, A.; Brienen, S.; Imbery, F.; Matzarakis, A. High-Resolution Grids of Hourly Meteorological Variables for Germany. Theor. Appl. Clim. 2003, 131, 899–926. [Google Scholar] [CrossRef] [Scilit]
  28. Nga, P.T.T.; Ha, P.T.; Hang, V.T. Satellite-Based Regionalization of Solar Irradiation in Vietnam by k-Means Clustering. J. Appl. Meteorol. Clim. 2021, 60, 391–402. [Google Scholar] [CrossRef] [Scilit]
  29. Bolson, N.; Prieto, P.; Patzek, T. Capacity Factors for Electrical Power Generation from Renewable and Nonrenewable Sources. Proc. Natl. Acad. Sci. USA 2022, 119, e2205429119. [Google Scholar] [CrossRef] [Scilit] [PubMed]
  30. Terna S.p.A. Caratteristiche Generali delle Linee Elettriche Aeree Facenti Parte della RTN; Terna S.p.A.: Roma, Italy, 2008. [Google Scholar]
  31. Japan International Cooperation Agency (JICA). Republic Tunisia Ministry of Industry, Energy and Mines Société Tunisenne de I’Electricite et du Gaz Data Collection Survey on Power Sector in Tunisia Final Report; Japan International Cooperation Agency: Tokyo, Japan, 2022. [Google Scholar]
  32. Camera dei Deputati, U.D.T. Aree Idonee per l’installazione di Impianti a Fonti Rinnovabili; Camera dei Deputati, U.D.T.: Roma, Italy, 2025. [Google Scholar]
  33. Terna S.p.A. Documento di Descrizione Degli Scenari 2024; Terna S.p.A.: Rome, Italy, 2024. [Google Scholar]
  34. Gestore dei Servizi Energetici (GSE). Solare Fotovoltaico—Rapporto Statistico 2024; Gestore dei Servizi Energetici: Rome, Italy, 2024. [Google Scholar]
  35. Messineo, A. Aggiornamento Piano Energetico Ambientale Della Regione Siciliana (PEARS); Sicilian Autonomous Region: Palermo, Italy, 2019. [Google Scholar]
  36. Terna S.p.A. Rapporto di Avanzamento del Piano di Sviluppo 2025; Terna S.p.A.: Rome, Italy, 2026. [Google Scholar]
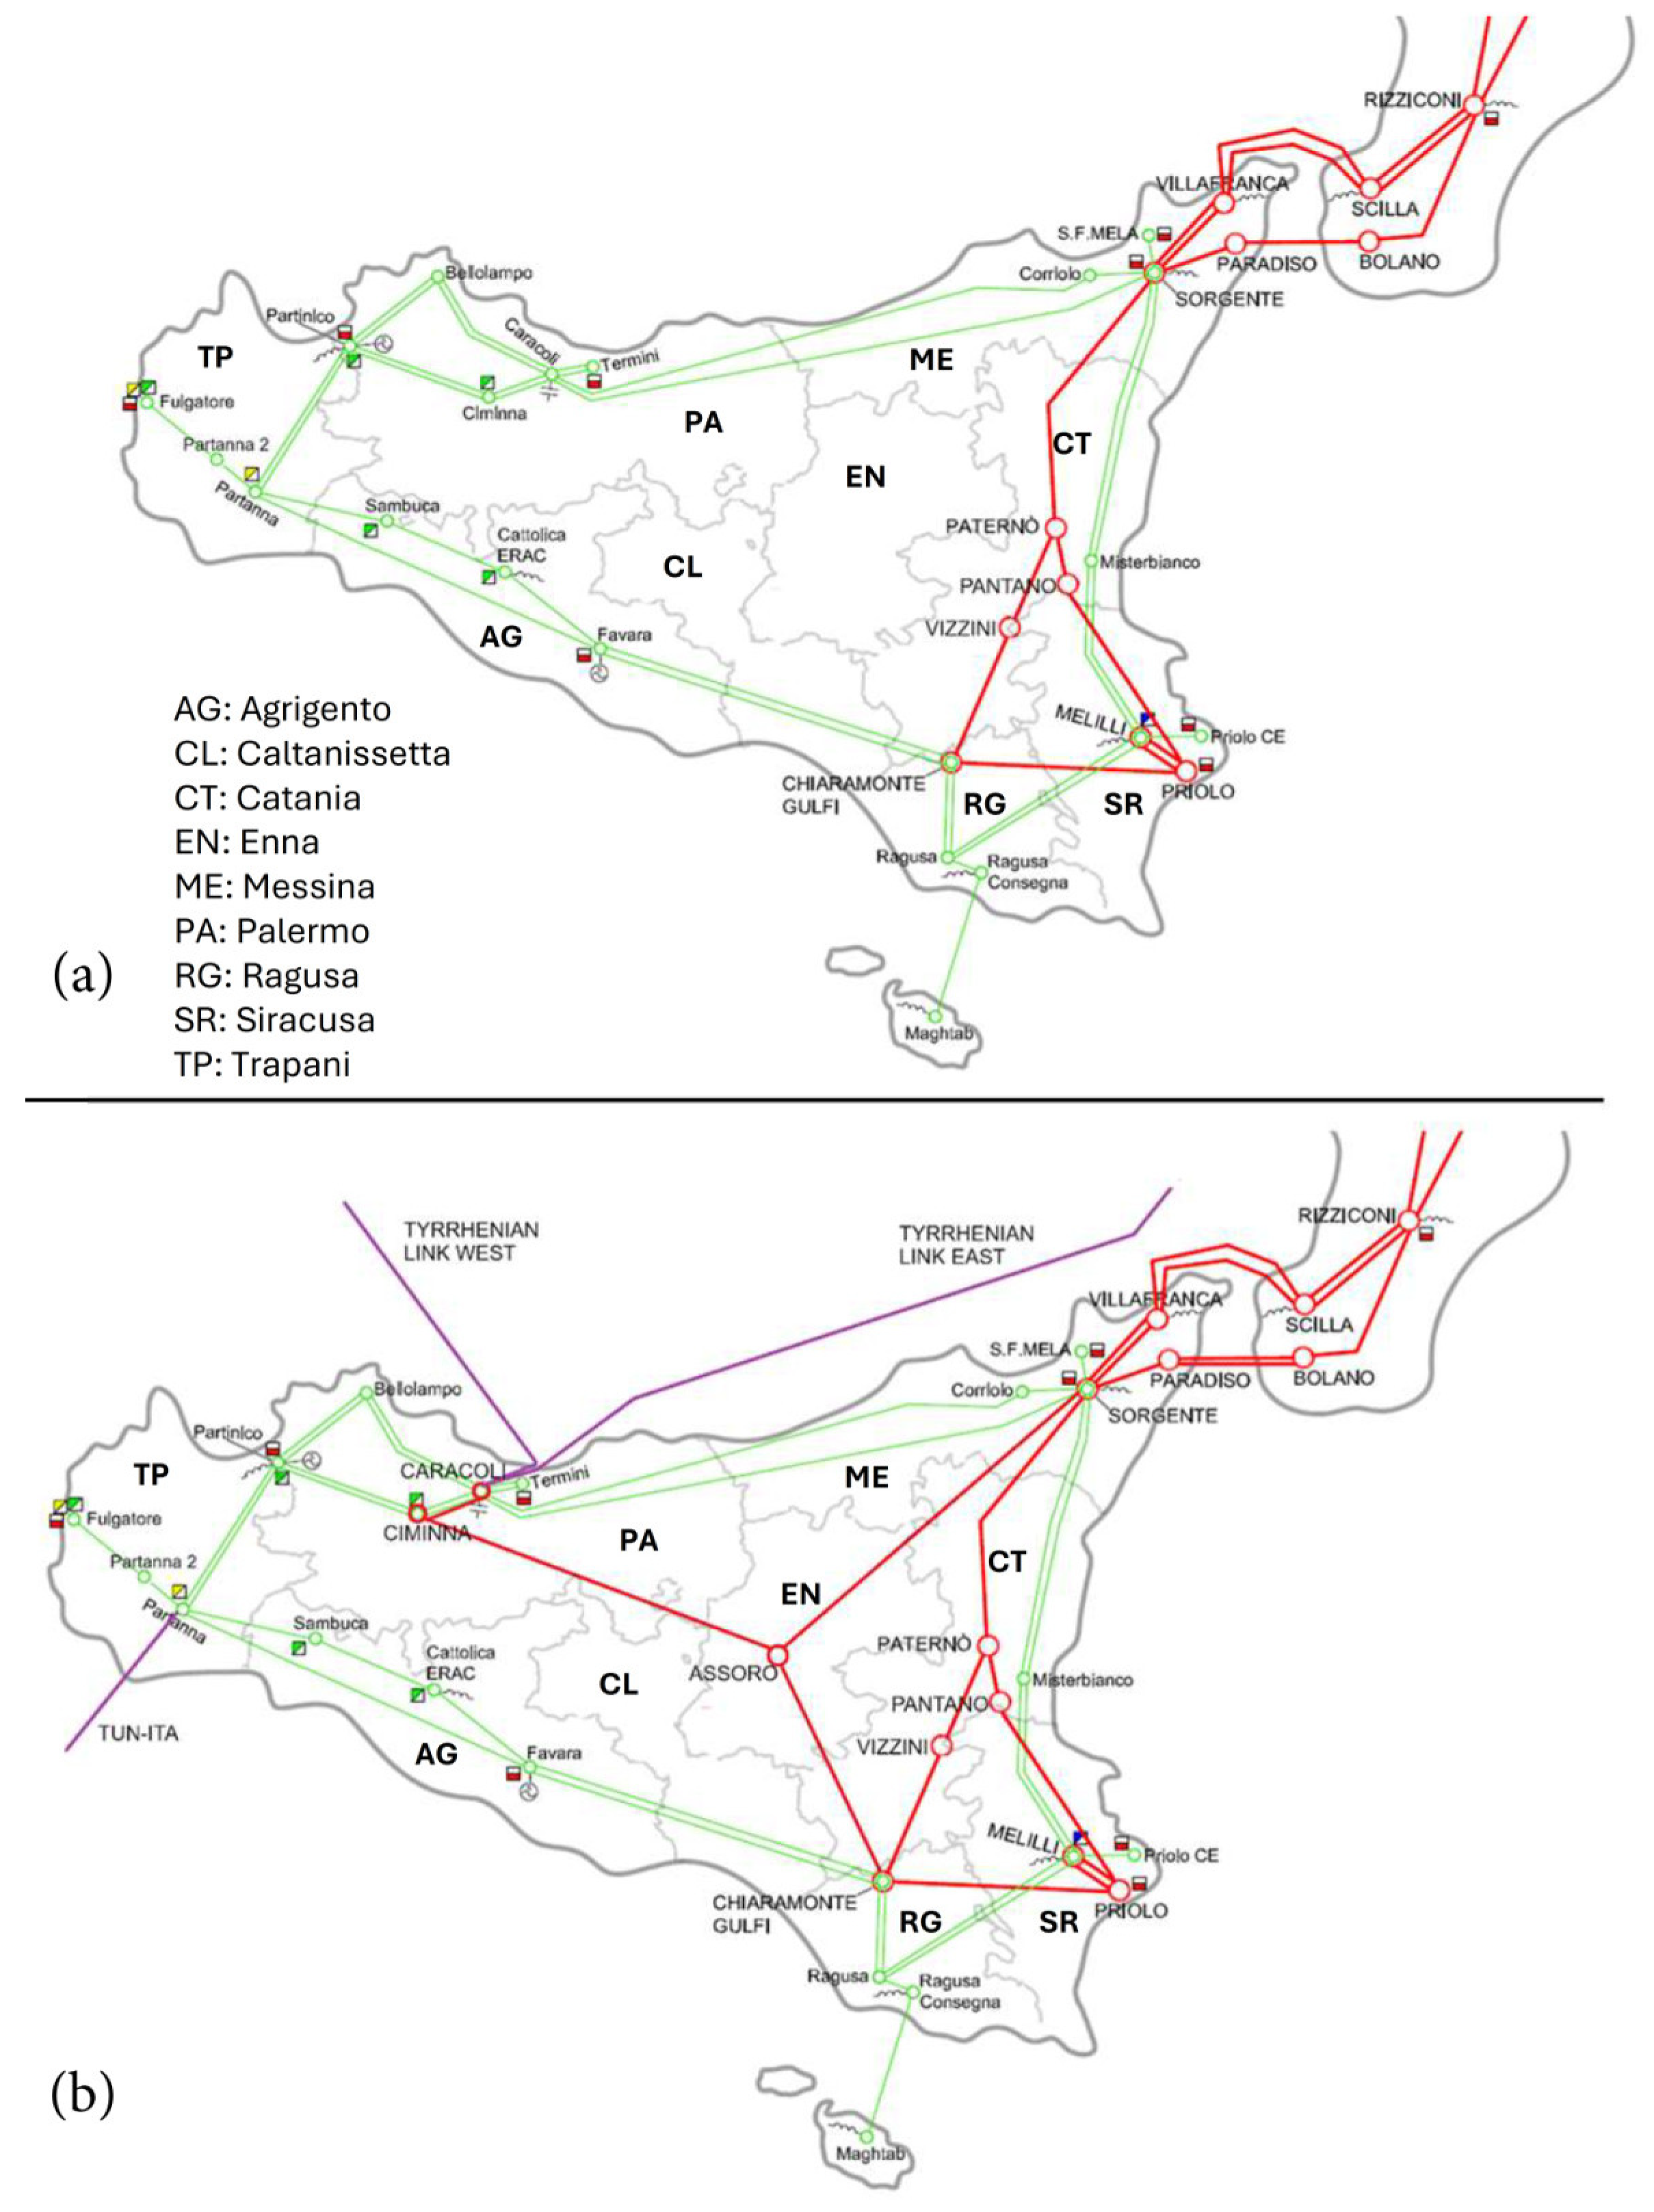
Figure 1. Sicilian electricity transmission system: 380 kV network in red, 220 kV network in green, and HVDC interconnections in purple. (a) Transmission network configuration as of 2024; (b) projected 2030 transmission network configuration based on Terna’s 2023 Development Plan, including the TUN-ITA and Tyrrhenian Link HVDC interconnections [11].
Electronics 15 02121 g001
Figure 2. Schematic overview of the four phases of the proposed methodology.
Electronics 15 02121 g002
Figure 3. Example of territorial subdivision into microzones and selection of sample points within one of them.
Electronics 15 02121 g003
Figure 4. Geographical Microzone Division of Sicily and Tunisia.
Electronics 15 02121 g004
Figure 5. Annual Profile of Average Monthly Wind Speeds in the Microzones of Sicily and Tunisia.
Electronics 15 02121 g005
Figure 6. Annual Profile of Average Monthly Solar Irradiation in the Microzones of Sicily and Tunisia.
Electronics 15 02121 g006
Figure 7. Comparison of the Average Seasonal Profiles of Wind and Solar Capacity Factor (CF) for Sicily and Tunisia. Solid Lines Represent Sicily; Dashed Lines Represent Tunisia (Green: Solar; Brown: Wind).
Electronics 15 02121 g007
Figure 8. Distribution of renewable energy connection requests in the Sicilian transmission network as of 31 March 2025, aggregated by microzone and authorization process status.
Electronics 15 02121 g008
Figure 9. Forecast of RES capacity in Sicily on the HV network up to 2040.
Electronics 15 02121 g009
Figure 10. Forecast of RES capacity in Sicily on the MV–LV network up to 2040.
Electronics 15 02121 g010
Figure 11. Evolution of the load status of 220 kV transmission lines in the analyzed scenarios under normal (N) operating conditions.
Electronics 15 02121 g011
Figure 12. Evolution of the load status of 150 kV transmission lines in the analyzed scenarios under normal (N) operating conditions.
Electronics 15 02121 g012
Figure 13. Evolution of the load status of 220 kV and 400 kV transmission lines in the analyzed scenarios under N–1 contingency condition.
Electronics 15 02121 g013
Table 1. Targeted Renewable Generation Capacity in Italy by 2030 under the PNIEC Framework [MW].
Source2021202220252030
Hydropower19,17219,26519,41019,410
Geothermal8178179541000
Wind11,29011,85815,82328,140
Bioenergy4106405040383240
Solar22,59425,06444,17379,253
Total57,97961,05584,398131,043
Table 2. Homogeneity Analysis of Wind and Solar Potential between the Microzones of Sicily and Tunisia Based on Euclidean Distance Minimization.
Sicilian ZoneMost Homogeneous Tunisian Zone
(Solar)
Minimum E.D.
(Solar)
Most Homogeneous Tunisian Zone
(Wind)
Minimum E.D. (Wind)
North-CentralN-E83.9N-W0.69
North-EastN-E94.5N-W0.75
North-WestN-E112.32N-E1.28
South-CentralN-E57.85N-E2.04
South-EastN-E65.98N-W2.26
E.D.: Euclidean distance.
Table 3. Monthly Wind Capacity Factor Values for the Microzones of Sicily and for the Entire Region.
ZoneSourceJan.Feb.Mar.Apr.MayJun.Jul.Aug.Sep.Oct.Nov.Dec.
N-WWind29%29%32%27%17%17%18%11%22%20%18%31%
N-CWind27%26%26%25%13%11%12%8%15%12%15%26%
N-EWind24%26%24%18%14%10%8%6%15%11%16%24%
S-CWind25%23%26%29%15%11%12%9%14%12%16%25%
S-EWind22%20%23%23%11%8%7%7%14%8%14%19%
SicilWind26%25%27%25%14%12%12%8%17%14%16%26%
Table 4. Monthly Solar Capacity Factor Values for the Microzones of Sicily and for the Entire Region.
ZoneSourceJan.Feb.Mar.Apr.MayJun.Jul.Aug.Sep.Oct.Nov.Dec.
N-WSolar10%17%22%28%33%35%35%35%27%13%14%11%
S-ESolar10%14%23%28%30%29%31%27%21%19%14%12%
SicilSolar10%15%23%28%31%31%33%30%24%16%14%12%
Table 5. Monthly Sum of Wind and Solar Capacity Factor in Sicily and Tunisia.
AreaSourceJan.Feb.Mar.Apr.MayJun.Jul.Aug.Sep.Oct.Nov.Dec.
SicilW + S 136%40%50%53%46%43%45%38%40%29%30%37%
TunW + S41%41%58%66%53%52%58%41%47%35%33%45%
W + S 1: combined wind and solar capacity factors.
Table 6. Estimated connection timelines to the transmission network according to application status.
Application StatusEstimated Timeframe (Months)Probability of Completion
STMD/Contracts24–36High
Authorization Granted36–48High
Under Evaluation≥48Low
Accepted/To Be Accepted STMG≥54Low
Table 7. Forecast RES capacity in 2028, 2029, and 2035 on the HV network, broken down by microzone and energy source.
YearZoneWind [MW]Solar [MW]RES [MW]
2028N-W870.41238.52108.9
N-C348.0350.0698.0
N-E397.31186.41583.6
S-C456.8191.7648.5
S-E416.6510.8927.3
SICILY2489.03477.35966.4
2029N-W1062.41580.52642.9
N-C390.0398.0788.0
N-E397.31521.21918.4
S-C512.0260.1772.1
S-E425.0776.01200.9
SICILY2786.64535.77322.4
2035N-W1852.82447.24300.0
N-C523.3619.81143.1
N-E455.62462.12917.6
S-C746.5439.61186.1
S-E691.91515.32207.1
SICILY4270.07483.911,754.0
Table 8. Evolution of regional net load in the simulation scenarios (April and July) for the 2028, 2029, and 2035 horizons.
YearMonthHV Load [MW]
2025
2025
April
July
1840
2165
2028
2028
April
July
1320.3
1563.4
2029
2029
April
July
1203.6
1438.3
2035
2035
April
July
934.3
1116.5
Disclaimer/Publisher’s Note: The statements, opinions and data contained in all publications are solely those of the individual author(s) and contributor(s) and not of MDPI and/or the editor(s). MDPI and/or the editor(s) disclaim responsibility for any injury to people or property resulting from any ideas, methods, instructions or products referred to in the content.