1. Introduction
The evolving field of Low Power Wide Area Networks (LPWANs) has become popular with the advent of 6G technology [
1]. LPWANs are comprised of small devices with restricted processing resources and limited energy budget connected with each other using various communication protocols [
2]. These networks will be the enabling technology for the Internet of Things (IoT) ecosystem [
3]. They operate borrowing features mainly from short-range wireless devices and cellular network connectivity [
4]. Their main objective is to transfer data from various types of sensors and end-user devices to any network, under the constraints of energy and the demand for low-complexity processing tasks [
5]. LPWANs serve as a foundational technology for the IoT environment, driving efficiency, productivity, and innovation across various industries [
6]. Their energy efficiency, long-range capabilities, cost-effectiveness, scalability, diverse applications, and interoperability contribute to their widespread adoption and enable the proliferation of connected devices [
7,
8,
9].
Among the most popular LPWAN technologies like Sigfox, Narrowband Internet of Things (NB-IoT) [
10], Long Term Evolution Machine-type communication (LTE-M) [
11] and LoRa [
12,
13], the latest is the most widespread technology. It is adopted from numerous application areas like smart metering, asset tracking, environmental monitoring and industrial automation due to its advantages over other wireless technologies including the long range, the low power consumption, the low cost, and the use of encryption [
5,
6,
7,
8,
9,
14]. Introduced by Semtech, the spread spectrum modulation technique implied in LoRa achieves an increased link budget as well as better immunity to network interferences. Under the LoRa specifications, each transmitter generates chirp signals by varying their frequency over time and keeping phase between adjacent symbols constant. In this work, we opted for LoRa technology as it offers extended range communication capability, lower power consumption, and also lower deployment cost in comparison to other technologies like NB-IoT. The latter demands the involvement of a network operator and the need for a licensed spectrum, while LoRa is based on an open standard operating in unlicensed spectrum bands, allowing for interoperability and compatibility between devices and networks from different manufacturers. On par with the previously mentioned technologies, Sigfox offers similar operational characteristics to LoRa; however, subscriptions add to the overall cost and as it operates on a proprietary network it has limitations regarding the operability compared to standardized solutions like LoRa.
Since LoRa is primarily intended for low-power networks, the energy efficiency of the communication protocol plays a major role in the viability of the communication system: energy outages compromise the operation of the underline application. In typical LoRa networks the main concern for the sources of energy consumption is targeted at the nodes, though in some applications the gateway (GW) may end up being the point of failure of the network. When the entire network installation is subject to energy scarcity, the duty cycle constraints may enable nodes to retain limited energy reserves; however, GWs face substantial challenges in sustaining continuous operational functionality.
The motivation behind this research stems from the growing need to ensure sustainable and resilient operation of LoRa-based IoT networks deployed in remote or off-grid areas where continuous power supply is unavailable. In such environments, GWs—unlike end-nodes—often represent the most energy-demanding components, and their premature energy depletion can lead to partial or complete network failure. Despite extensive research on optimizing node energy consumption, the energy sustainability of GWs has received limited attention. This work, therefore, aims to fill this gap by introducing a communication protocol that explicitly targets GW energy efficiency through intelligent scheduling and adaptive operation, thereby extending overall network lifetime and enabling reliable IoT connectivity in energy-constrained scenarios.
In this work, a Time Division Multiple Access (TDMA)-based protocol is tested for the energy longevity of the GWs in a LoRa network. Our focus has been directed toward the prolongation of the GW lifetime, particularly in installations characterized by minimal energy resources and high node density. In such scenarios, the GW is required to relay a substantial volume of messages to the application server, thereby challenging its energy efficiency. In this type of application, GWs set the limit for the network operation as their energy resources diminish rapidly from the vast number of messages exchanged between the nodes and the application server. The proposed algorithm primarily targets the prolongation of the GW lifetime, thereby contributing to overall network longevity in remote deployments characterized by energy scarcity. To the best of our knowledge, this is the first study pertaining to the GW lifespan, since GWs under consideration are not powered by reliable uninterrupted power supply but exclusively renewable energy sources. Current studies only focus on the node lifespan, not on the GWs longevity.
The main contributions of this work are summarized as follows.
Proposal of a novel communication protocol—GEOT: Designed specifically to improve the energy efficiency and lifetime of LoRa GWs operating in off-grid environments powered by renewable energy sources.
Shift of focus from EN to GWs: Unlike most existing studies that optimize end-node energy use, this work targets GW energy management, addressing the key bottleneck for network longevity.
Introduction of a TDMA-based scheduling mechanism: Enables GWs to alternate between active and sleep modes based on a predefined transmission schedule, reducing unnecessary energy consumption while maintaining reliable communication.
Development of a comprehensive analytical model: Captures the interplay between node distribution, spreading factors (SFs), and GW operation, offering theoretical insight into best- and worst-case completion times.
Extensive simulation-based validation: Evaluated under four spatial node distributions—uniform, normal, grid, and Pareto—showing up to sixfold improvement in network lifetime compared to a LoRaWAN TDMA baseline, with minimal latency impact.
The remainder of this work is organized as follows.
Section 2 provides the latest works in the field while in
Section 3 the network model is described.
Section 4 presents the proposed communication with an analysis related to the distribution of the nodes, followed by the simulation results in
Section 5. Result analysis along with discussion is in
Section 6, while the work is concluded in the last
Section 7.
2. Related Work
While most of the studies related to the GWs mainly concentrate on the problem of GWs’ location selection, in this work the main interest is the energy resiliency of LoRa GWs. These GWs are considered to have limited energy resources as they are not constantly fed with energy from a typical power grid as in most LoRa networks deployments.
In general, the majority of works in the energy field of LoRa networks try to improve the energy efficiency by selecting the most appropriate set of SFs and the transmission power from a node-oriented perspective [
15,
16,
17]. Along the same lines, a comprehensive analysis of the end node (EN) energy consumption was conducted in [
18] based on experimental comparative analysis of popular practical LoRaWAN end nodes (ENs). It should be mentioned here that while the LoRaWAN is a contention-based protocol, there are numerous works that promote the use of the TDMA-based protocol to enhance the energy management [
19,
20].
To address the inherent limitations of contention-based mechanisms, several researchers have explored deterministic access approaches such as Slotted ALOHA and TDMA-based medium access control (MAC) protocols. Ref. [
21] implemented Slotted ALOHA over LoRaWAN and demonstrated up to a sixfold throughput gain under heavy traffic conditions, validating the benefits of slot synchronization for large-scale networks. Moving beyond random access, ref. [
22] proposed an on-demand TDMA protocol using wake-up radios (WuRs), which enables asynchronous yet energy-efficient communication by minimizing idle listening; this design achieved significant reductions in latency and power consumption compared to conventional listen-before-talk methods. Ref. [
23] investigated several alternatives to ALOHA, including deterministic slot-based access schemes, and analytically demonstrated their scalability advantages over contention-based approaches. Complementarily, ref. [
24] presented design considerations, implementations, and perspectives for time-slotted (TDMA-like) LoRa networks, emphasizing synchronization mechanisms and slot-based scheduling as key enablers of reliable and energy-efficient communication. Additional studies have further refined TDMA designs for LoRaWANs. Chasserat et al. [
19] introduced a short TDMA-based scheme for dense LoRaWAN deployments, showing that deterministic slot allocation can significantly enhance energy efficiency and reduce packet collisions compared to ALOHA. More recently, Xu et al. [
25] proposed an energy-efficient co-channel TDMA mechanism that integrates bidirectional timestamp correction and addressed recognition, effectively reducing synchronization overhead and wake-up delays. While these studies confirm the growing relevance of TDMA in LPWANs, they remain primarily node-centric, targeting end-device access rather than infrastructure coordination. Building on these foundations, ref. [
26] introduced a multilevel TDMA scheme integrating WuR technology for hierarchical slot allocation in dense deployments. Extending this idea to dynamic environments, ref. [
27] designed a TDMA-based access protocol tailored for mobile LoRa nodes, effectively managing synchronization and latency challenges under node mobility. In the same vein, the present work adopts a TDMA-based approach, but applied from a GW-centric perspective to optimize energy consumption and extend network lifetime.
Moreover, the issue of deploying multiple GWs with the aim of improving the overall performance on LoRa networks has also been studied in the literature. The densification of GWs provides among other things increased energy efficiency of the EN as well as scalability and extended coverage. In detail, the authors in [
28] implement a multigateway LoRaWAN network simulator (ns-3), proving that a greater number of GWs allows for the option of using lower SF in a dense deployment while at the same time makes it possible to share the load of downlink (DL) traffic. As expected, more DL messages can be sent in the RX1 window and as a direct consequence there is no need for the EN to open both receive windows. In [
29], the deployment of several GWs was taken into consideration to assess the performance of LoRaWAN in the industrial IoT (iIoT), where various classes of EN were utilized to guarantee a low-cost and effective industrial process. Realistic measurements including both confirmed and unconfirmed DL traffic were used in the evaluations. Through this study, LoRaWAN demonstrated its ability to handle IoT sensing applications with a 90% packet success ratio.
The majority of the works that take into consideration renewable energy characteristics [
30] do not provide a solution for the GW energy-consumption aspect as they consider that the backhaul of the network, a.k.a. the GWs, runs continuously on grid power, without depending on batteries or renewable sources. However, recent research has highlighted the challenge of ensuring the energy resiliency of LoRaWAN GWs, especially in scenarios where they are powered by finite or non-permanent energy sources. For example, McIntosh et al. [
31] demonstrated the feasibility of deploying solar-powered LoRaWAN GWs for smart agriculture in rural areas lacking grid access, emphasizing the need for careful energy dimensioning to sustain reliable operation. Similarly, Jabbar et al. [
32] developed a renewable energy-powered LoRaWAN system for water quality monitoring in remote regions, showing that variability in environmental energy availability may lead to service disruption when the power supply is depleted. Beyond static off-grid solutions, Sobhi et al. [
33] investigated vehicle-mounted LoRaWAN GWs and found that GW uptime depends heavily on battery capacity and mobility patterns, affecting network reliability. In parallel, Jouhari et al. [
34] studied UAV-mounted LoRaWAN GWs, where the limited flight duration poses strict energy constraints, and proposed deep reinforcement learning strategies to optimize power consumption and maximize coverage before battery exhaustion [
35]. Collectively, these studies confirm that the continuity and resilience of LoRaWAN networks depend strongly on the stability of the energy supply, with renewable-powered, mobile, and aerial GWs facing the persistent risk of energy depletion that can render the network temporarily non-functional. Within a similar framework, Rizal et al. [
36] try to improve the energy efficiency of the GWs’ operation by optimizing the frame sizes sent to the application server. The proposed GEOT protocol can operate complementarily to such approaches, as it introduces distinct operational states for GWs based on scheduled activity, further optimizing energy use without compromising transmission performance.
The work most relevant to the GEOT communication algorithm can be considered the work in [
37]. The authors of that study derived a new protocol after identifying the critical aspects and research challenges involved in designing energy-efficient LoRaWAN communication protocols [
38]. In the latter work, the authors consider the impact of GW energy consumption on the network’s lifetime by associating each EN with specific GWs, taking into account the distance, the load, and the remaining available energy of each GW.
To better position the contribution of this work within the existing literature,
Table 1 provides a concise comparative assessment of the most directly relevant studies focusing on TDMA-based LoRaWAN communication and energy-aware network infrastructures. While a broader spectrum of works contributes to various aspects of LoRaWAN performance and energy optimization, the studies summarized here represent the subset that most closely aligns with the scope of this study, namely, deterministic access strategies, GW operation, and energy-constrained scenarios. The comparison highlights both the strengths of existing approaches and the limitations that remain unaddressed.
Table 1 reveals that although significant progress has been made, current approaches address either channel access efficiency or GW energy autonomy, but not both simultaneously. TDMA-based mechanisms typically assume continuously powered GWs and focus on improving EN performance, while renewable-powered deployments lack coordination mechanisms to maintain reliable network operation during limited energy availability. As a result, existing LoRaWAN infrastructures remain vulnerable to reduced coverage, increased latency, or network downtime in constrained-power environments.
To address these limitations, this work introduces the GEOT scheme, a GW-centric and energy-aware communication framework for LoRaWAN. GEOT orchestrates the transmissions of multiple GWs through a global time-slotted structure and dynamically adjusts their operational states, active, idle or sleep-based on scheduled traffic and real-time renewable energy availability. By ensuring that GWs remain active only when required for reception, GEOT minimizes unnecessary power consumption while maintaining high communication reliability. Consequently, GEOT significantly improves sustainability and operational lifetime in LoRaWAN deployments reliant on intermittent energy sources.
4. Gateway Energy-Oriented TDMA
The proposed communication protocol consists of two phases. The first phase contains the joints of the EN in the network. During this procedure, the ADR mechanism of the LoRaWAN protocol controls the transmission parameters of the end devices including SF and Transmission Power (TP). In this phase, the network server has the primary role of assigning the EN to each GW trying to keep the TP and the SF as low as possible (typical ADR). By assigning, we mean the process of comparing the signal received from each node and return via the ADR the appropriate parameters for the uplink connection between the nodes and the GW. Processing-wise, the network server is responsible for gathering all signal data from the GWs and calculating the transmission parameters for the nodes with an average time complexity of O(). As this node fragmentation is based mainly on the distance from each GW, it may end up completely unbalanced due to random node placement in relation to the GWs. This assignment entails energy-consumption imbalance as some GWs may have significant load as a result of their position. For that reason, the GEOT protocol through its second phase balances the load of GWs by distributing the nodes equally to the GWs. Having the signal measurements from all the nodes, it balances the first assignment from the ADR and provides to the nodes new directions about the applied communication parameters. Once completed, it responds to the GWs to transmit these parameters to each node. In this message, the server forwards lists to each GW containing the specific node IDs that each GW will handle exclusively by listening only to those IDs. That way, each GW receives messages from a subset of the end node pool via a scheduled way implemented in a TDMA-based way and not from every node in the system like in normal LoRaWAN implementations.
GEOT avoids co-channel interference and packet loss by employing a TDMA-based schedule that assigns each node a unique timeslot within its SF group. Parallel transmissions occur only across orthogonal SFs, which do not interfere with each other. For nodes using the same SF, the network server ensures non-overlapping timeslots. As each GW listens only to its assigned nodes during these slots, no collisions or interference occur.
More specifically, the network server takes into consideration the number of GWs, the total number of nodes and the periodicity of the measurements and calculates the number of timeslots and their duration for each cycle. The first timeslot of each cycle is reserved by the system to compensate for potential clock drifts (CDs) of the devices (on the order of microseconds), ensuring that all ENs of the network can be resynchronized through the subsequent outbound broadcast message. This design implies that, even if certain ENs—owing to temporary desynchronization—attempt to transmit during this reserved timeslot (i.e., prematurely, as their internal clock runs ahead), the outbound broadcast message from the GW in the following timeslot will allow them to detect the misalignment, retransmit their data at the proper timeslot, and resume normal communication. Consequently, synchronization across all ENs is maintained. After that timeslot, the server has divided the remainder of the cycle to a number of slots equal to twice the number of GWs (these timeslots are not of equal length): for each GW, there is one timeslot for the broadcast of the reception program to the EN and one for the actual reception of the data transmitted from the EN. As the number of nodes increases, this leads to linear growth in the Time period (Tp); in the appropriate part of the Tp, the CD factor is excluded from the analysis, since it remains constant, as each node will require a fixed amount of time (related to the SF). Inside the second type of timeslot, each GW dedicates a small fraction of the time to transmitting the data to the server via the LTE upload link. Due to the relatively high data rate of this uplink (1 Mbps) this portion of the timeslot is at the levels of μs.
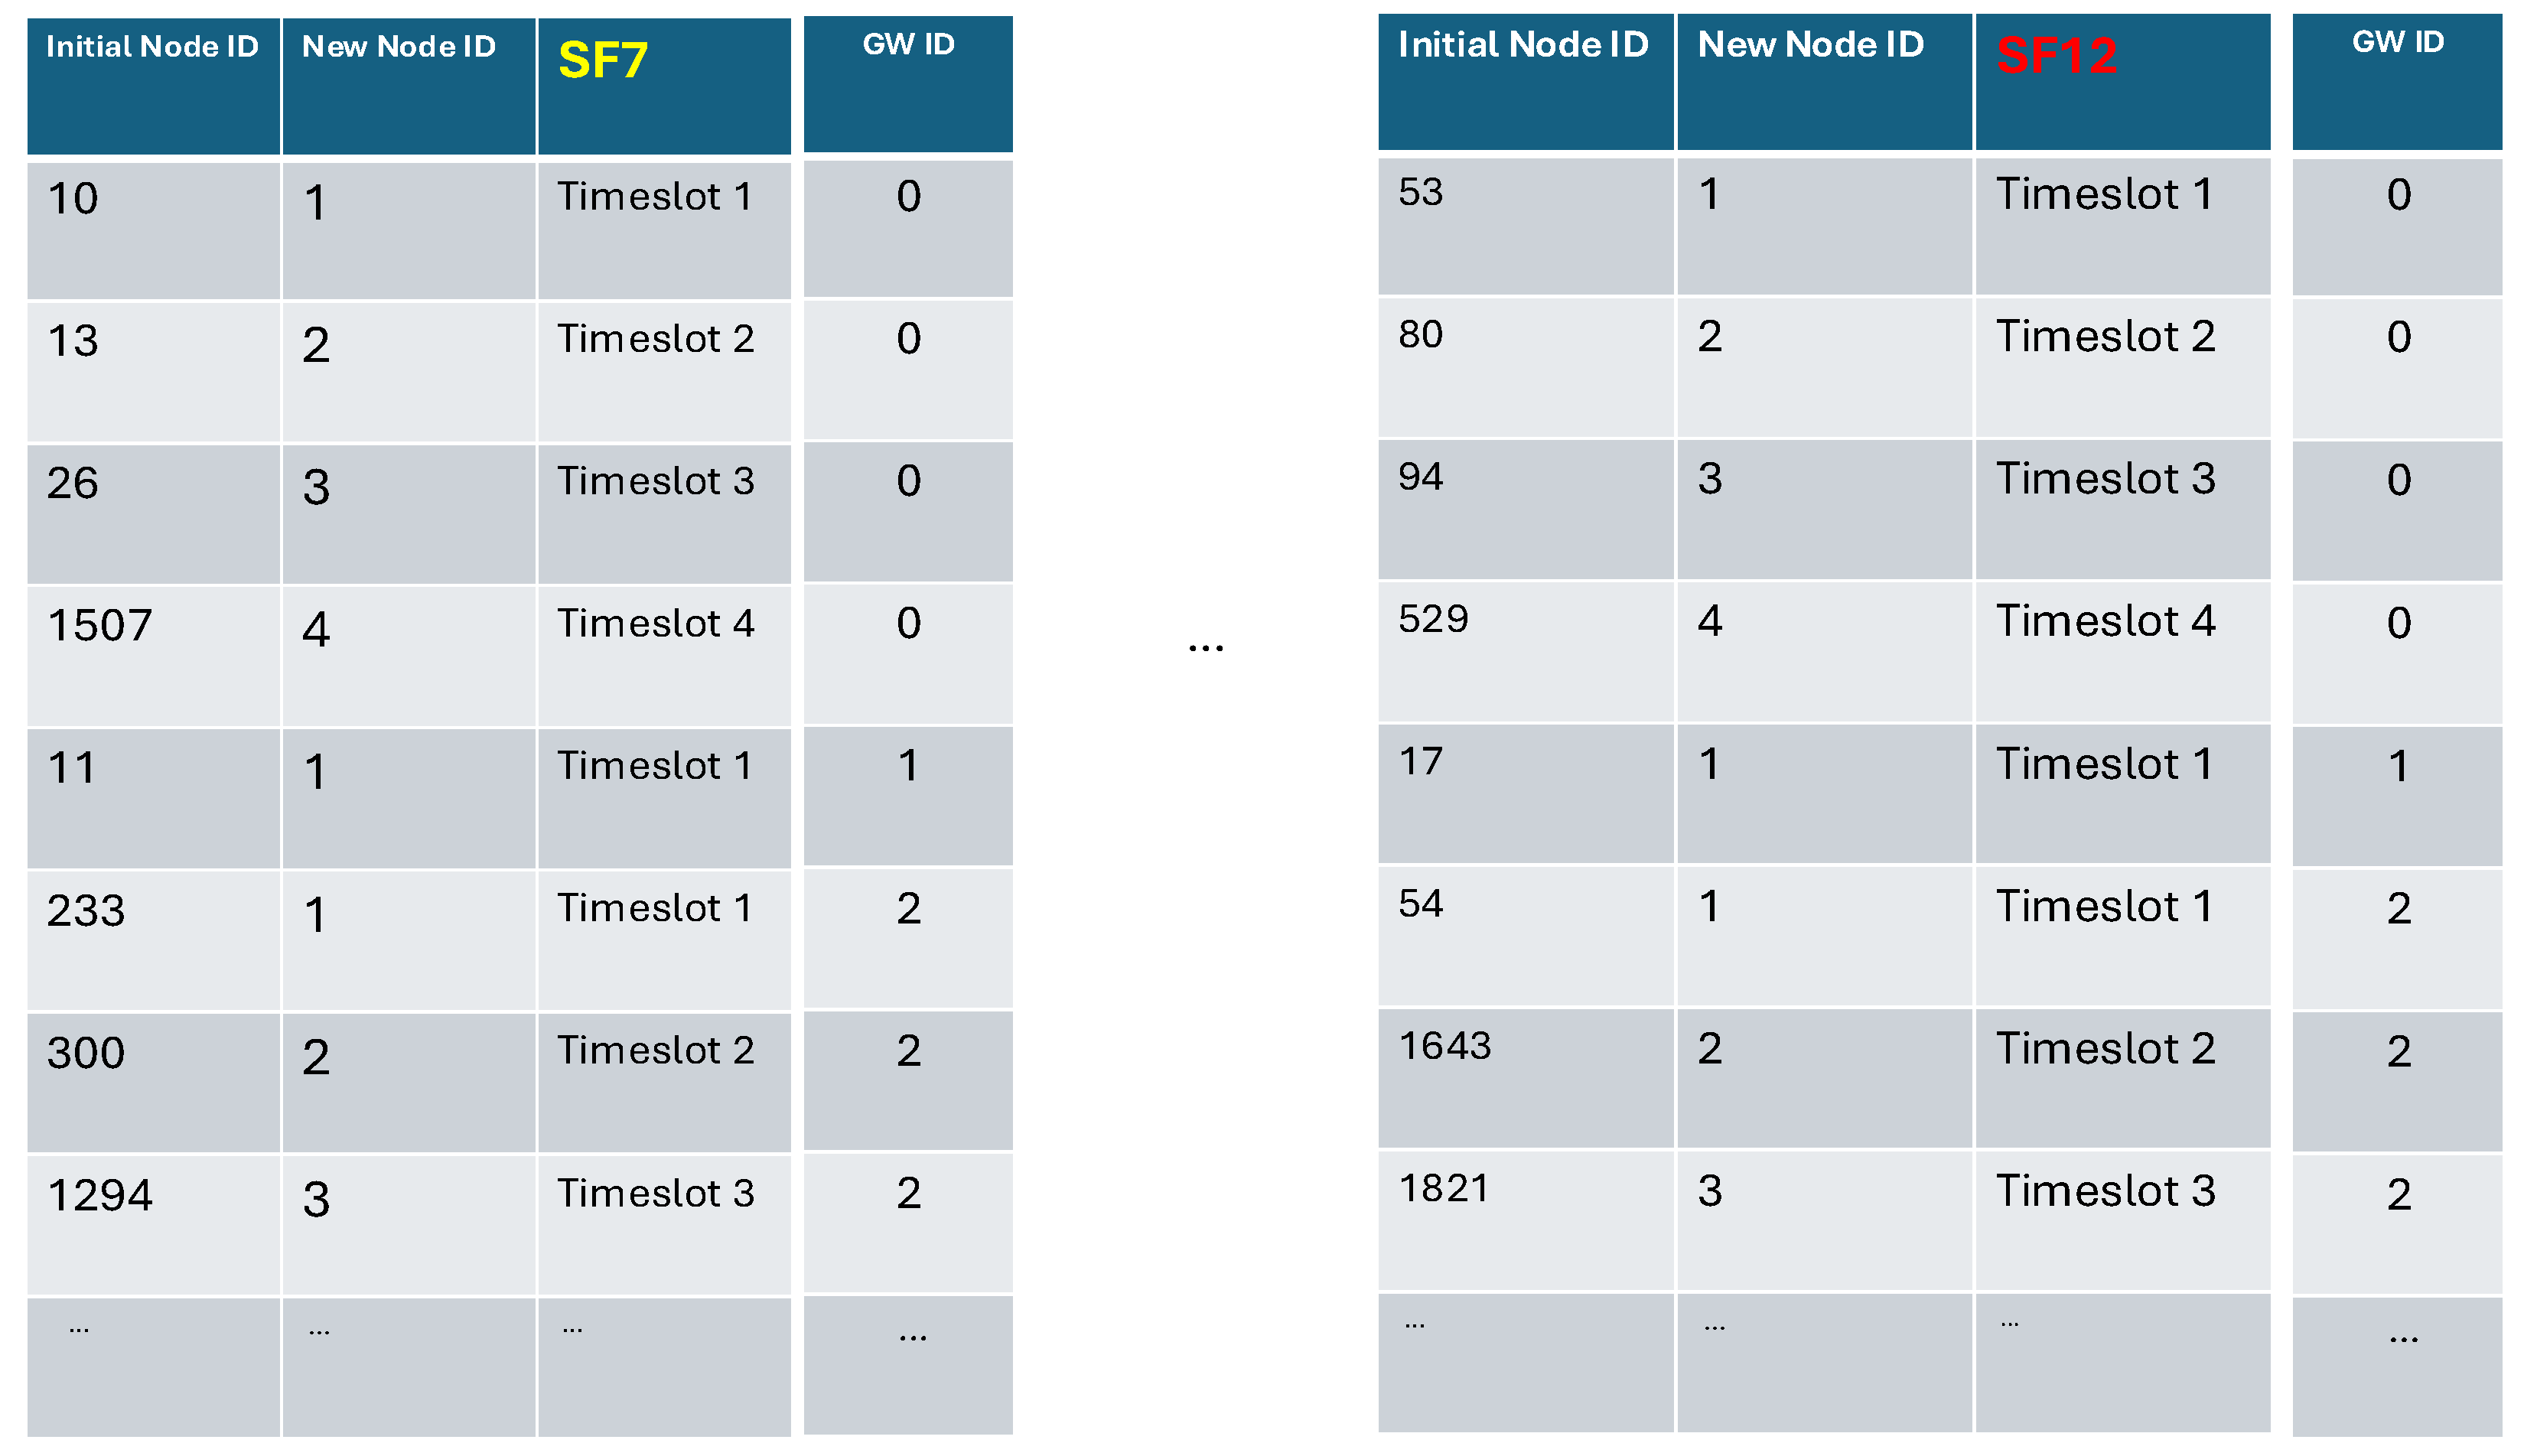
During the first time slot assigned to each GW, the transmission program to the nodes is broadcasted from each GW divided into six lists, where each list stands for the different SF transmission program. Each list contains the unique ID (MAC Address) of the nodes and another new ID that represents the sequence of transmission inside every list, as depicted in
Figure 2. The network server calculates the new ID and the GW broadcasts the message back to the nodes. Since the maximum data capacity of a LoRa GW broadcast message may not be sufficient to include all node IDs, each GW may need to transmit multiple broadcast messages in order to disseminate the complete transmission schedule for all SFs and all nodes. This is the case when there is a high number of node insertions in the network or during a new site installation. During normal operation, only a small number of IDs may have to be included in a lightweight single broadcast message. A typical broadcast message format is shown in
Figure 2.
The exact number of broadcast messages depends solely on the spatial node distribution in relation to the GW position. It should be pointed out that during this timeslot, each GW is kept active to receive join requests from newly installed nodes, and the broadcast operation is performed only after this phase is completed. Since the size of the broadcast message is known from the previous cycle, the duration of the active period dedicated to handling inbound requests can thus be determined. Newly installed nodes will receive their transmission program during the next cycle in a differential way, meaning that only the changes will be broadcasted from the GWs and not the complete transmission program. The only external intervention needed is to provide the node beforehand with the exact time it will send the join request in order to avoid timeouts. Consequently, only at the initialization phase will the GWs have to send a relatively high number of broadcast messages to the nodes while during the next cycles they have to transmit only the program for the newly installed EN as mentioned above. Although this approach may not directly reduce the energy consumption of GWs, as they remain active throughout the entire timeslot, future work could explore a distributed algorithm that leverages the typically low transmission load of GWs during normal operation to achieve additional energy savings.
The next bunch of timeslots are assigned to the transmission of the data from the nodes to the GWs. For all the SF lists, each node will transmit its data based on the latest ID acquired from the previous phase of the protocol. Parallel transmissions take place as nodes from different SFs will transmit at the same time, based on the TDMA program they have received from the broadcast messages sent from the GWs. As the latter are aware in advance of the scheduled data transmissions, they remain in listening mode only during the time slots assigned for receiving data from their associated nodes, as well as during the timeslots corresponding to inbound and outbound broadcast messages interchangebly (as mentioned above, new joint requests should be made during the first bunch of slots). During the remaining slots within the cycle, the GWs enter sleep mode, conserving energy while ensuring synchronization and reliable communication with the EN. Consequently, by enabling GWs to remain in sleep mode during all non-essential time slots—unlike conventional LoRa approaches—the system significantly reduces energy consumption, thereby enhancing overall energy efficiency and contributing to a prolonged system lifetime.
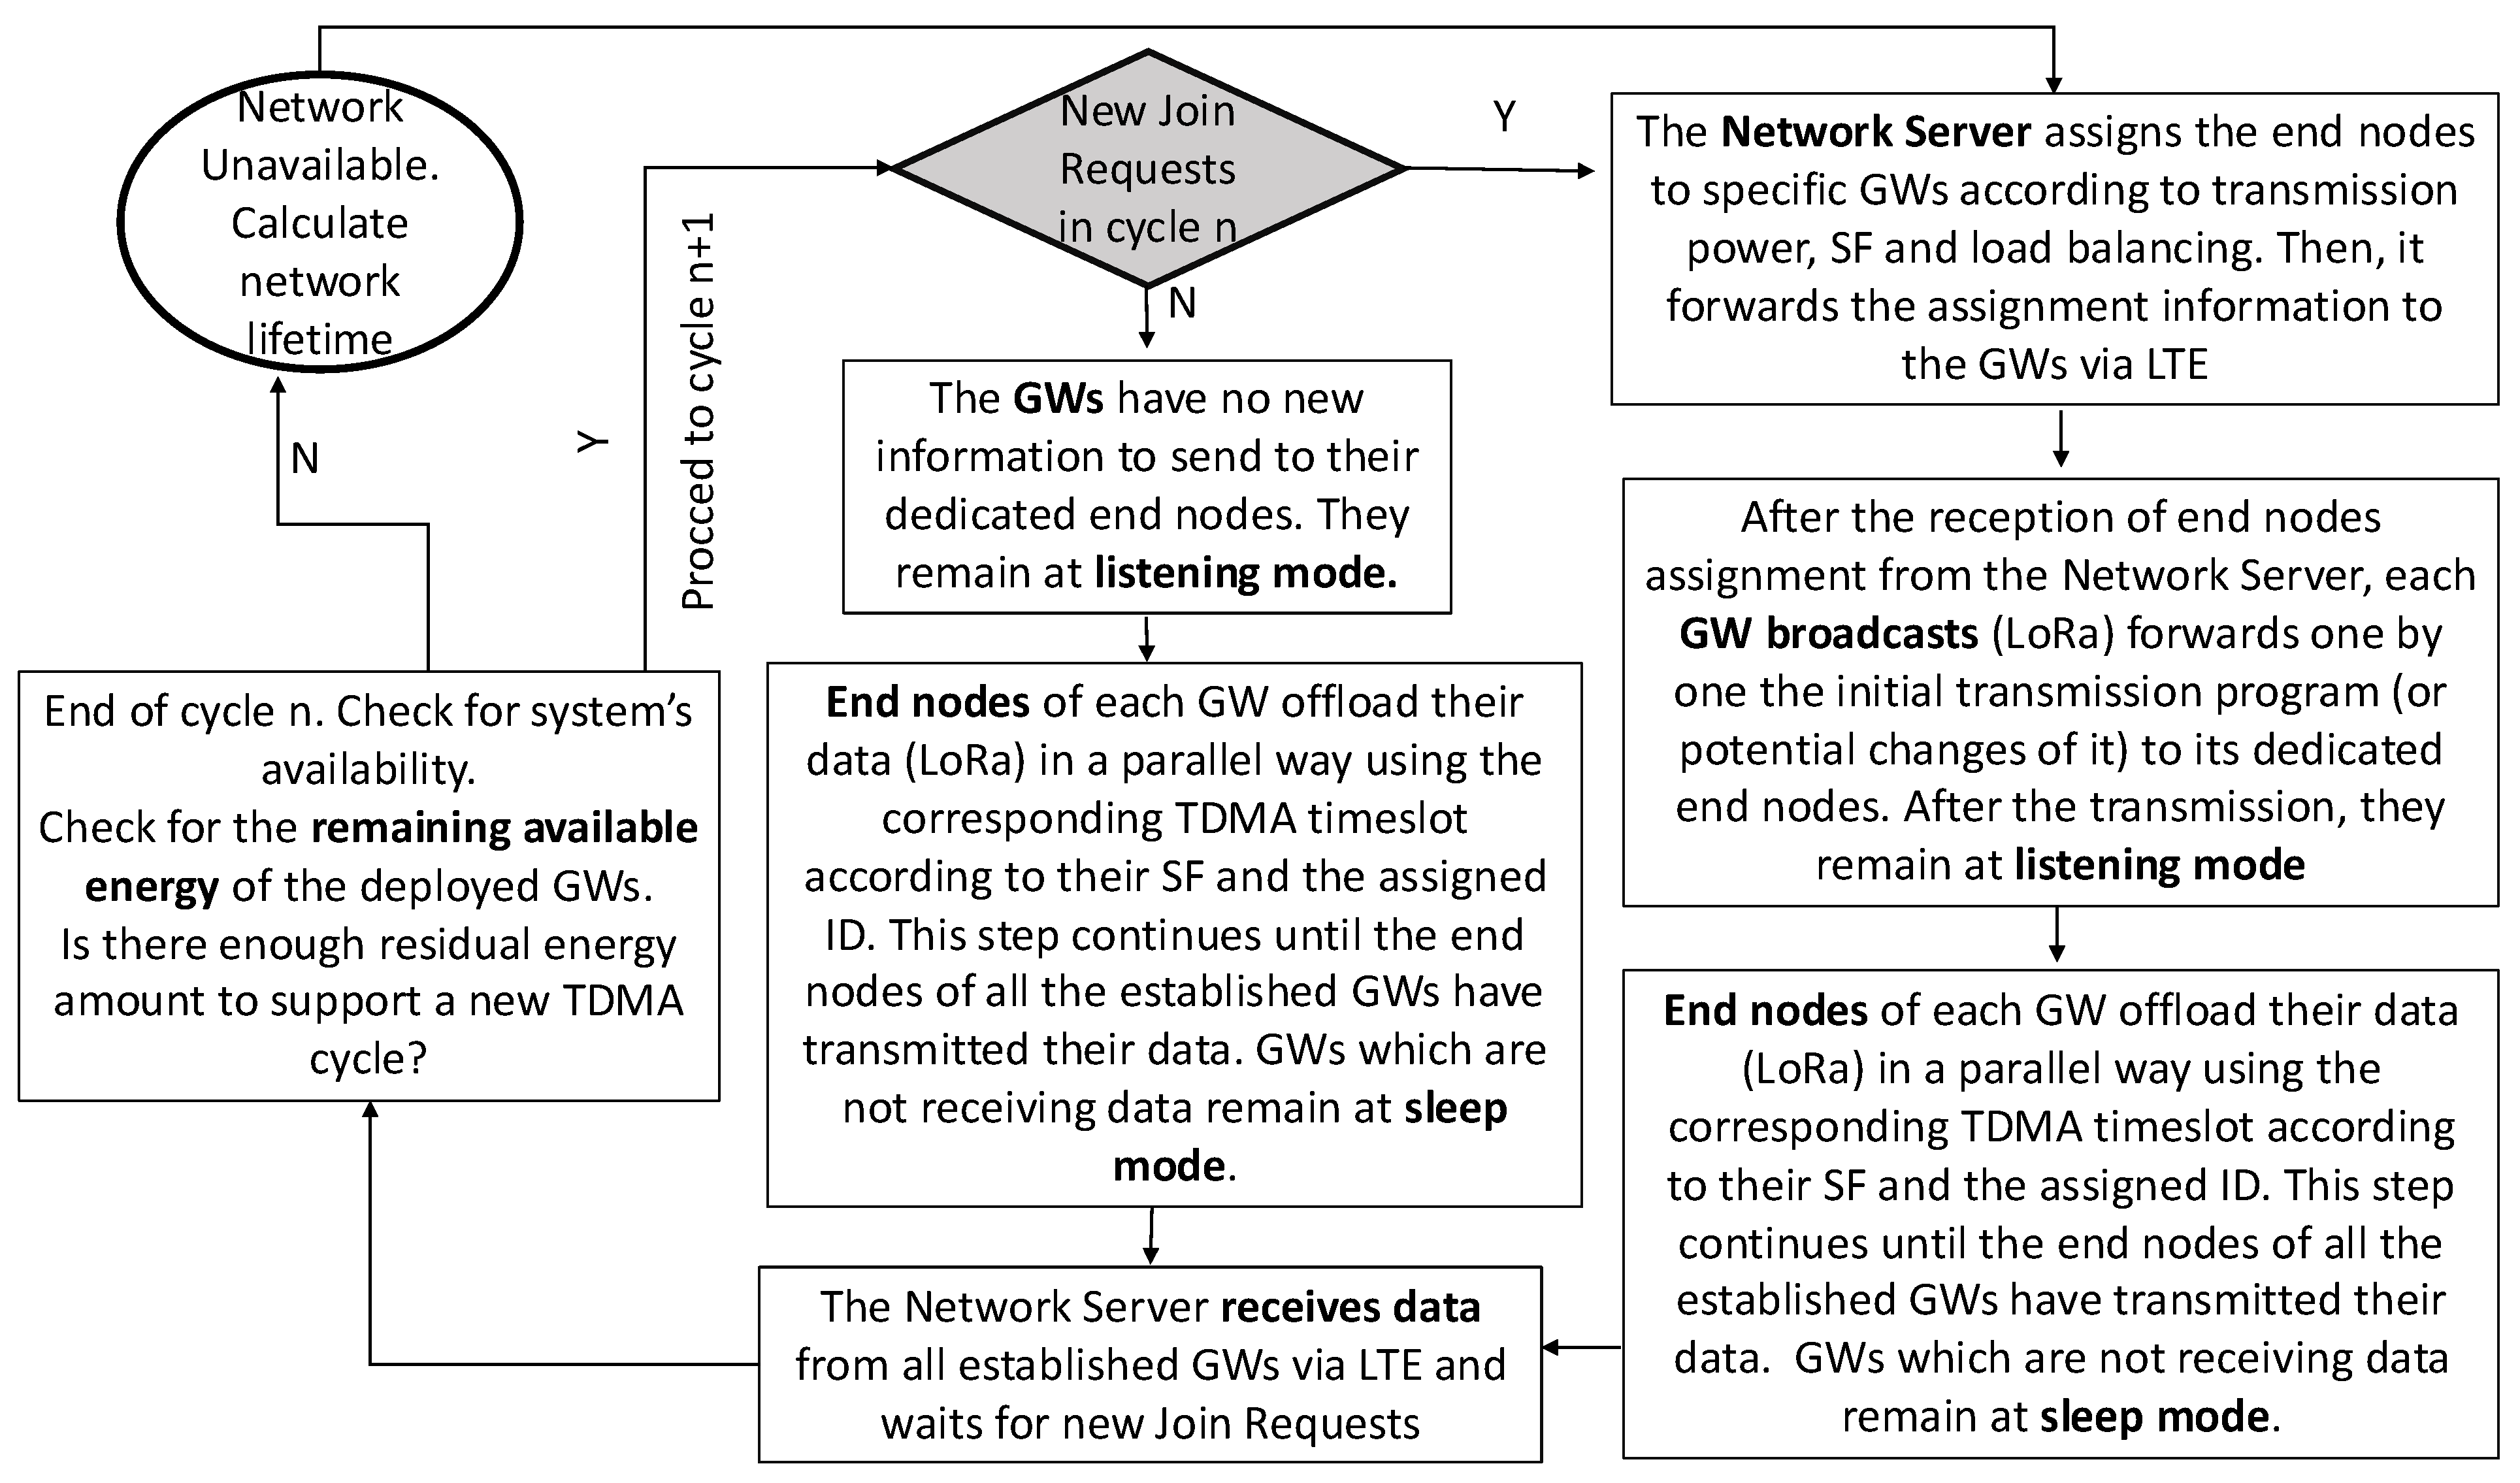
Before the end of this timeslot, each GW enters the GW-transmit-LTE state and sends all the data acquired from the nodes during the timeslot, to the server, over LTE. The flowchart of the algorithm is shown in
Figure 3. Owing to the fact that each node is assigned to only one GW and during each instance of data transmission from the nodes, only the assigned GW is in listening mode; there is no need for any data-deduplication mechanism at the network server side improving the resilience of the network. We should note here that the network server, which is responsible for the scheduling of the transmissions and the appropriate node assignments to the GWs, carries out a constant check to ensure that the constraint for the time of a period is satisfied. This is shown in Relation (1) which reads:
The above relation consists of four different parts calculated with specific data from the application of the proposed algorithm to the precision agriculture scenario we consider.
refers to the guard time for the CD of the EN and the GWs. This is a constant term, and it is set in advance of the installation. That way, we ensure that all network components have adequate time to be in synchrony.
is function of the number of nodes and their assigned SF:
. This formulation stands for the second part of the time slots. It captures the influence of both node density and position with respect to the GWs and mainly depends on the spatial distribution of the nodes (normal, uniform, or other distribution). Distant nodes transmit using higher SFs (s parameter), which results in the utilization of more bits in the broadcast message. Furthermore, as the number of newly joined nodes increases (), additional data must be transmitted to convey the updated SF assignments. When these new SFs correspond to higher levels, the GWs are required to transmit proportionally larger amounts of data back to the nodes. During this time segment, there are two different types of broadcast messages. The first type is the inbound broadcast messages, meaning newly installed nodes broadcast their messages to the GW. This is the inbound broadcast phase. The network server receives all the inbound messages and calculates the transmission program as mentioned above. Upon completion, GWs broadcast the result of the network server’s calculation to the nodes (outbound broadcast phase). Nodes located in the vicinity of the GW have lower SFs and the broadcast messages from the GWs to the nodes demand less bytes, resulting in equally less time for the complete transmission program. The first variable of the function is the number of nodes added to the previous cycle and the second variable represents the SF assignment of each node.
The third term stands for the time that is required for the nodes of each GW to complete their data transmission. This is also related to the spatial distribution in relation to the GW position, and the total number of nodes assigned to each GW, so it should be a function of:
. Here,
and
refer to the number of GWs and the number of ENs, respectively. The first variable is the number of nodes assigned to each GW and the second variable is translated to the ToA for each node transmission.
Section 4.3 and
Section 4.4 present a detailed account of the relation g, outlining how it is affected by the geographical location of the ENs.
Finally,
is the time needed for every GW to transmit their data over the LTE connection to the network server and it is almost zero as the speed of this link is high enough to transfer all data at the speed of 1 Mbps. We considered the Frequency Division Duplex (FDD) LTE bands and specifically the uplink one [
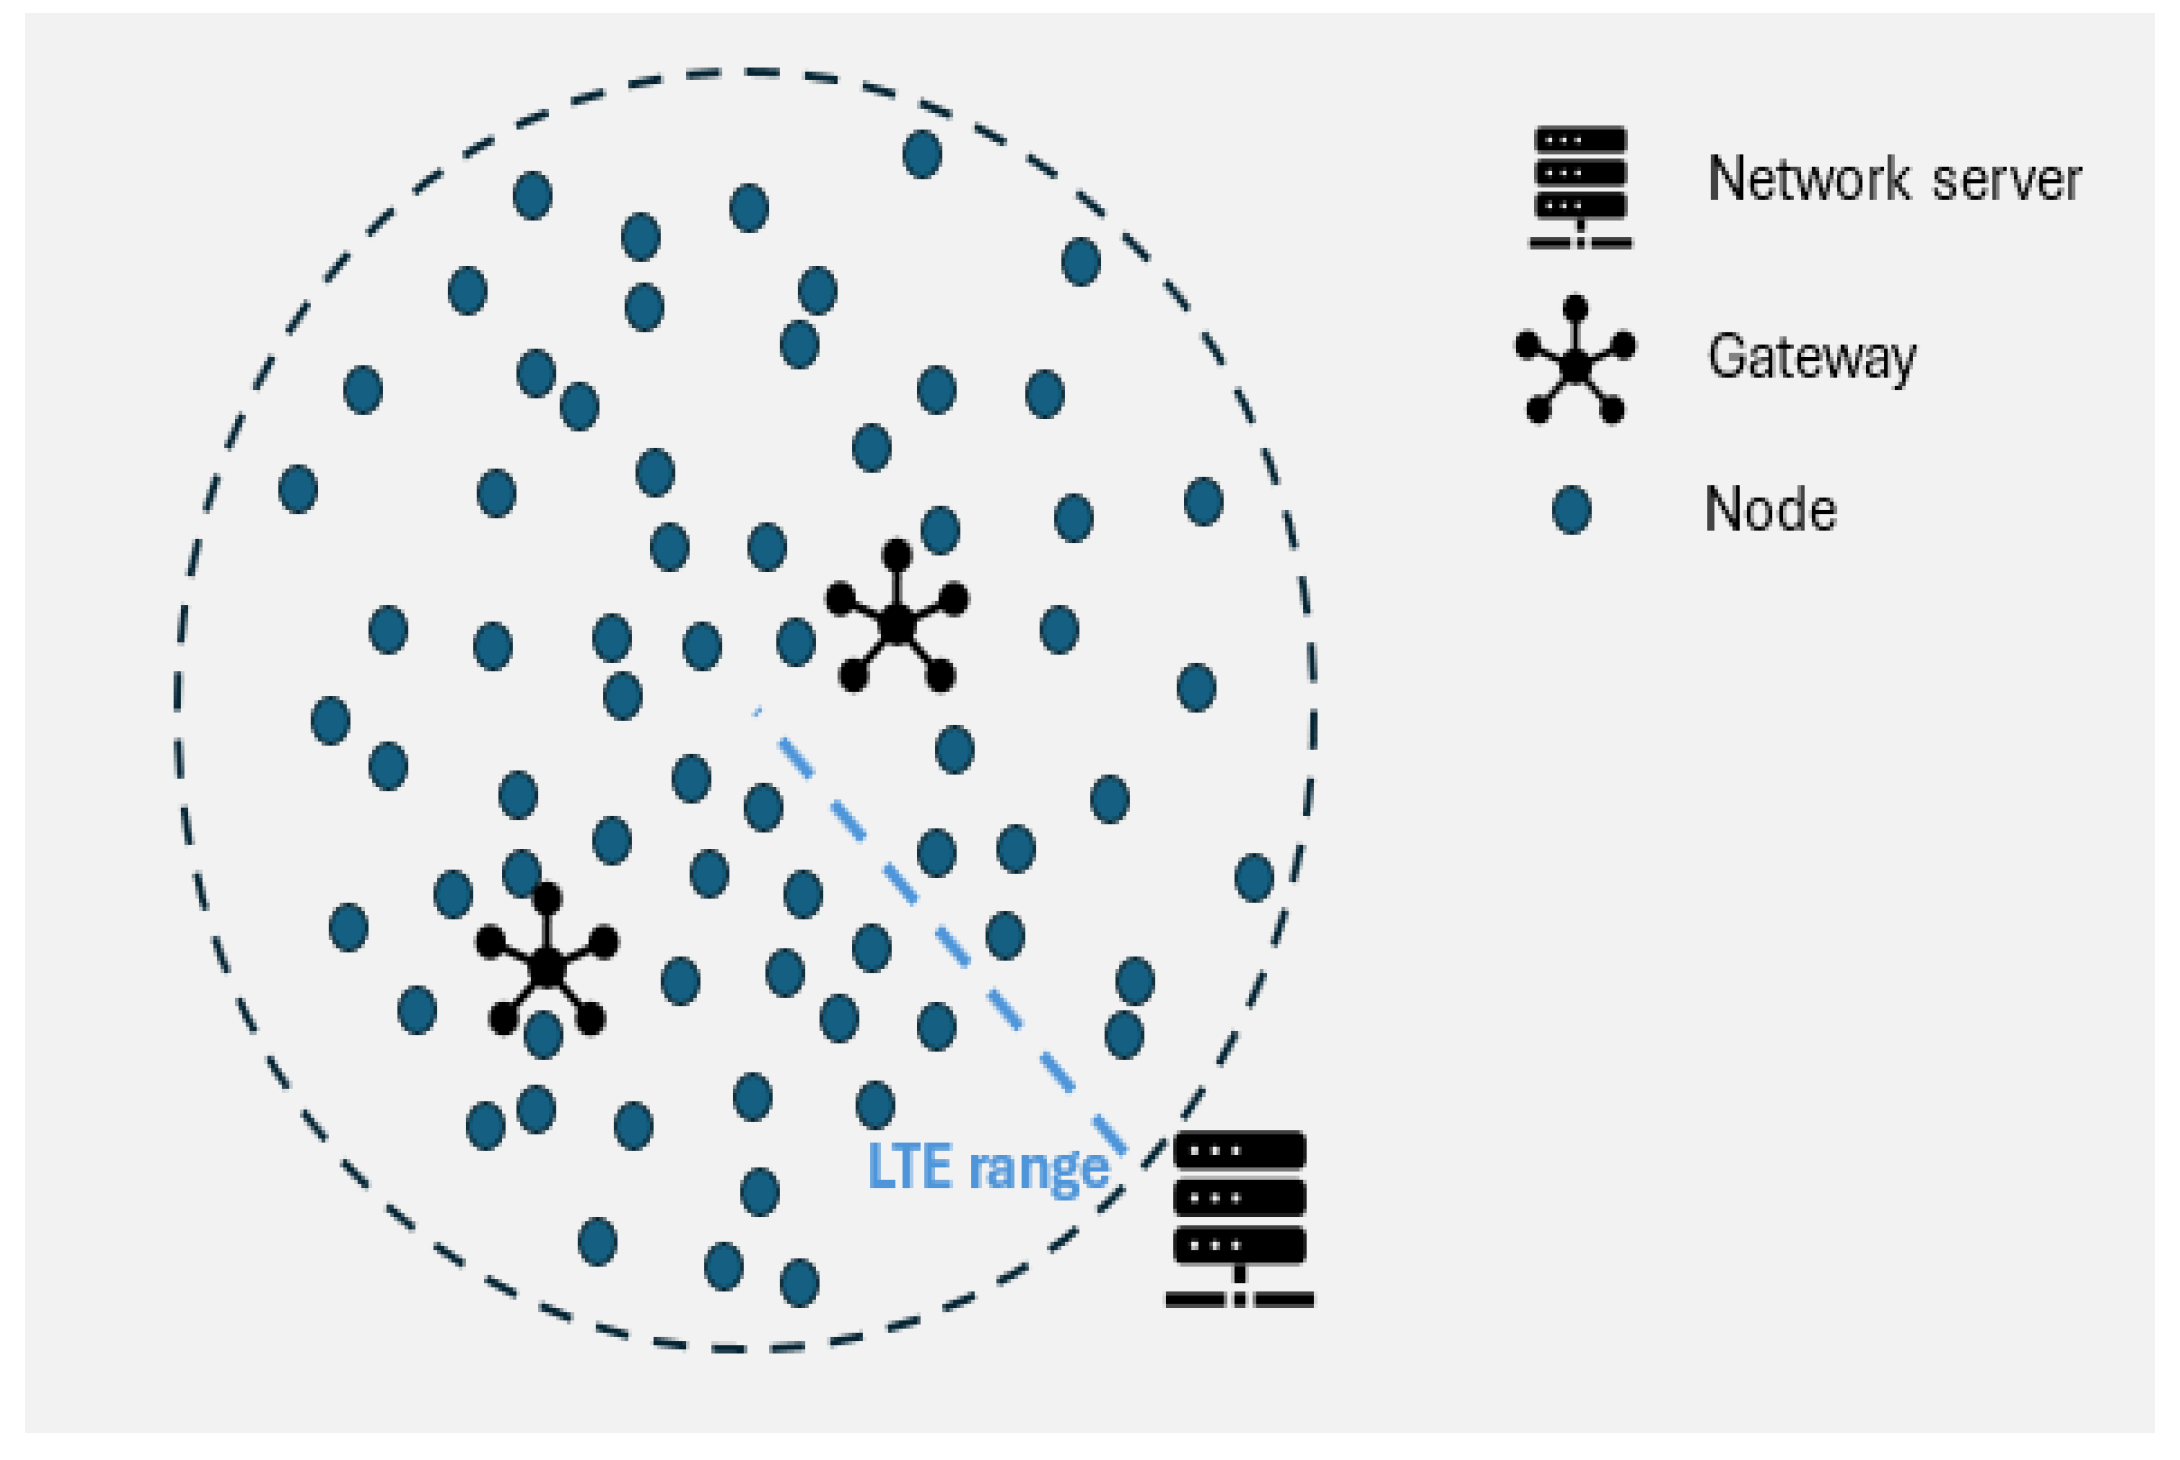
39]. The practical range of such a system is around 25 km, indicating that the GW is positioned approximately 25 km away from the network server. The network server has all the information to calculate the outcome of Equation (
1) after the first phase of the algorithm (the ADR one). This should ensure
dictated from the application layer.
consists of two parts with respect to their duration: (i) a constant duration part, , and (ii) a variable part that depends on the number of nodes, their spatial distribution, and the number of GWs. We denote the second part (transmit/receive phase). comprises the following: (a) , the outbound broadcast message timeslots whose count equals the number of GWs; (b) , the uplink receive timeslots from nodes to GWs, equal to the number of GWs; and (c) , the mobile backhaul transmission from each GW to the application server. As a result, .
: the time allocated to newly inserted nodes to announce their presence so they can be incorporated into the next GEOT cycle.
is fixed per cycle and per application scenario (for the configuration shown here, we set
min; other applications may adjust this duration according to their needs, as discussed in
Section 6.2).
is obtained from Relation (1) after the other terms are computed and subtracted from the 12 min cycle. In this way, newly inserted nodes have sufficient time to broadcast their intent to the GWs. Because this is the only part of the algorithm that may experience collisions, nodes employ a backoff mechanism and re-attempt within the same
timeslot. If transmission remains unsuccessful (as indicated by LoRa’s ADR), the node transmits again in the
timeslot of the next cycle with external intervention. As under normal operation only a very small number of nodes join in each cycle, this term is excluded from the performance evaluation, since competing protocols typically do not manage it explicitly.
: the number of GWs. Because O is a broadcast, only the total duration is affected by this factor.
: the total duration of the timeslots dedicated to node-to-GW data transmissions; this depends on , the total number of nodes, and their spatial distribution. The GEOT algorithm assigns nodes to GWs to balance the load, improving each GW’s energy management and lifetime.
: the total duration of the timeslots used by each GW to transmit data to the application server over the mobile backhaul (e.g., LTE/5G).
4.1. Analytical Model of Completion Time
In this subsection, the relation of the application Tp will be analyzed for the way each factor contributes to the total duration. The completion time of the protocol is defined as in Equation (
1):
: guard time delay to compensate for clock drift, constant term,
: overhead of control information dissemination,
: LTE backhaul transmission time, negligible at the μs scale,
: the GW transmission time, which dominates .
In what follows, we will concentrate on the last term, which dominates the total duration.
4.2. Gateway Transmission Time
For each GW
i, the time required for the assigned nodes to complete their transmissions depends on their number and the SFs in use. In GEOT, the total transmission time is determined by the heaviest SF list for each GW
i, since parallelism across SFs is exploited:
where
is the number of nodes assigned to GW
i with SF
s, and
the time-on-air of one packet at specific SF
s. In spatial distributions where nodes are located close to the GWs, the majority will utilize lower spreading factors (s: SF7–SF9), while only a small fraction of distant nodes will employ higher s values. Consequently, the total transmission time will be dominated by the large number of consecutive short-duration transmissions using low SFs. Conversely, in scenarios characterized by greater node dispersion, a higher proportion of nodes transmit using higher s values, leading to a substantial increase in the total GW transmission interval (
). In such cases, the overall transmission duration is primarily determined by the slower, high-s value transmissions, as low-s value transmitting nodes complete their data transfer significantly earlier.
In contrast, the reference LoRaWAN TDMA protocol [
22], which is analyzed in detail in
Section 5 and compared to the GEOT performance, assumes sequential transmissions:
4.3. Best Case and Worst Case Bounds
Two theoretical bounds can be derived:
In both bounds, GEOT and the reference scheme converge, since no parallelism can be exploited in a single-SF configuration. The gain for the GEOT protocol in both cases lies on the total consumed energy due to the scheduled uploads from the nodes and the matching sleep mode of the GWs, while in the reference protocol the GWs remain active throughout the whole duration of the cycle.
4.4. Impact of Node Distribution
Let
be the spatial probability density function (PDF) of node locations in domain
. For GW
i and SF
s, we define the region:
Here, denotes the Voronoi cell of GW i, i.e., the subset of the plane containing all points closer to GW i than to any other GW. The interval corresponds to the radial distance range (annulus) that maps to SF s, with and . Thus, can be interpreted as the intersection of the Voronoi polygon of GW i with a ring-shaped region centered at , where is the position of a GW i in the region. This construction enables us to rigorously define which nodes are simultaneously associated with GW i and assigned SF s.
The probability that a randomly placed node belongs to GW
i with SF
s is:
Hence, the expected number of nodes is:
The expected GW transmission times are therefore [
22]:
4.5. Spatial Distribution Analysis
Equations (
9) and (
10) directly link the spatial distribution of nodes to completion time. For example:
Uniform/grid distributions: these lead to balanced values of
, which reduce the maximum term in (
2) and favor the GEOT protocol, considering that the GWs are equally distributed inside the area of interest.
Normal distributions: these are centered around the GWs and increase the share of low-SF nodes, thus reducing the overall completion time .
Pareto distributions: these introduce in general heavy-tailed spatial patterns, where a significant fraction of nodes may be located far from the GWs (specific case distributions). This results in an over-representation of nodes in high spreading factors (SF11–12), inflating the maximum term and pushing to higher values.
This analysis shows that GEOT offers high gains under mixed-SF conditions concerning the latency, as parallel transmissions take place, while in boundary cases (all SF7 or all SF12) both GEOT and the reference protocol coincide in latency terms. However, regarding the lifetime of the GWs, the GEOT outperforms the reference protocol due to the scheduled sleep states of the GWs without affecting the round-trip time.
In the next section, the diurnal energy variations in the solar generation model are incorporated in the GEOT operating cycle.
4.6. Energy Supply Modeling Under Clear-Sky Conditions
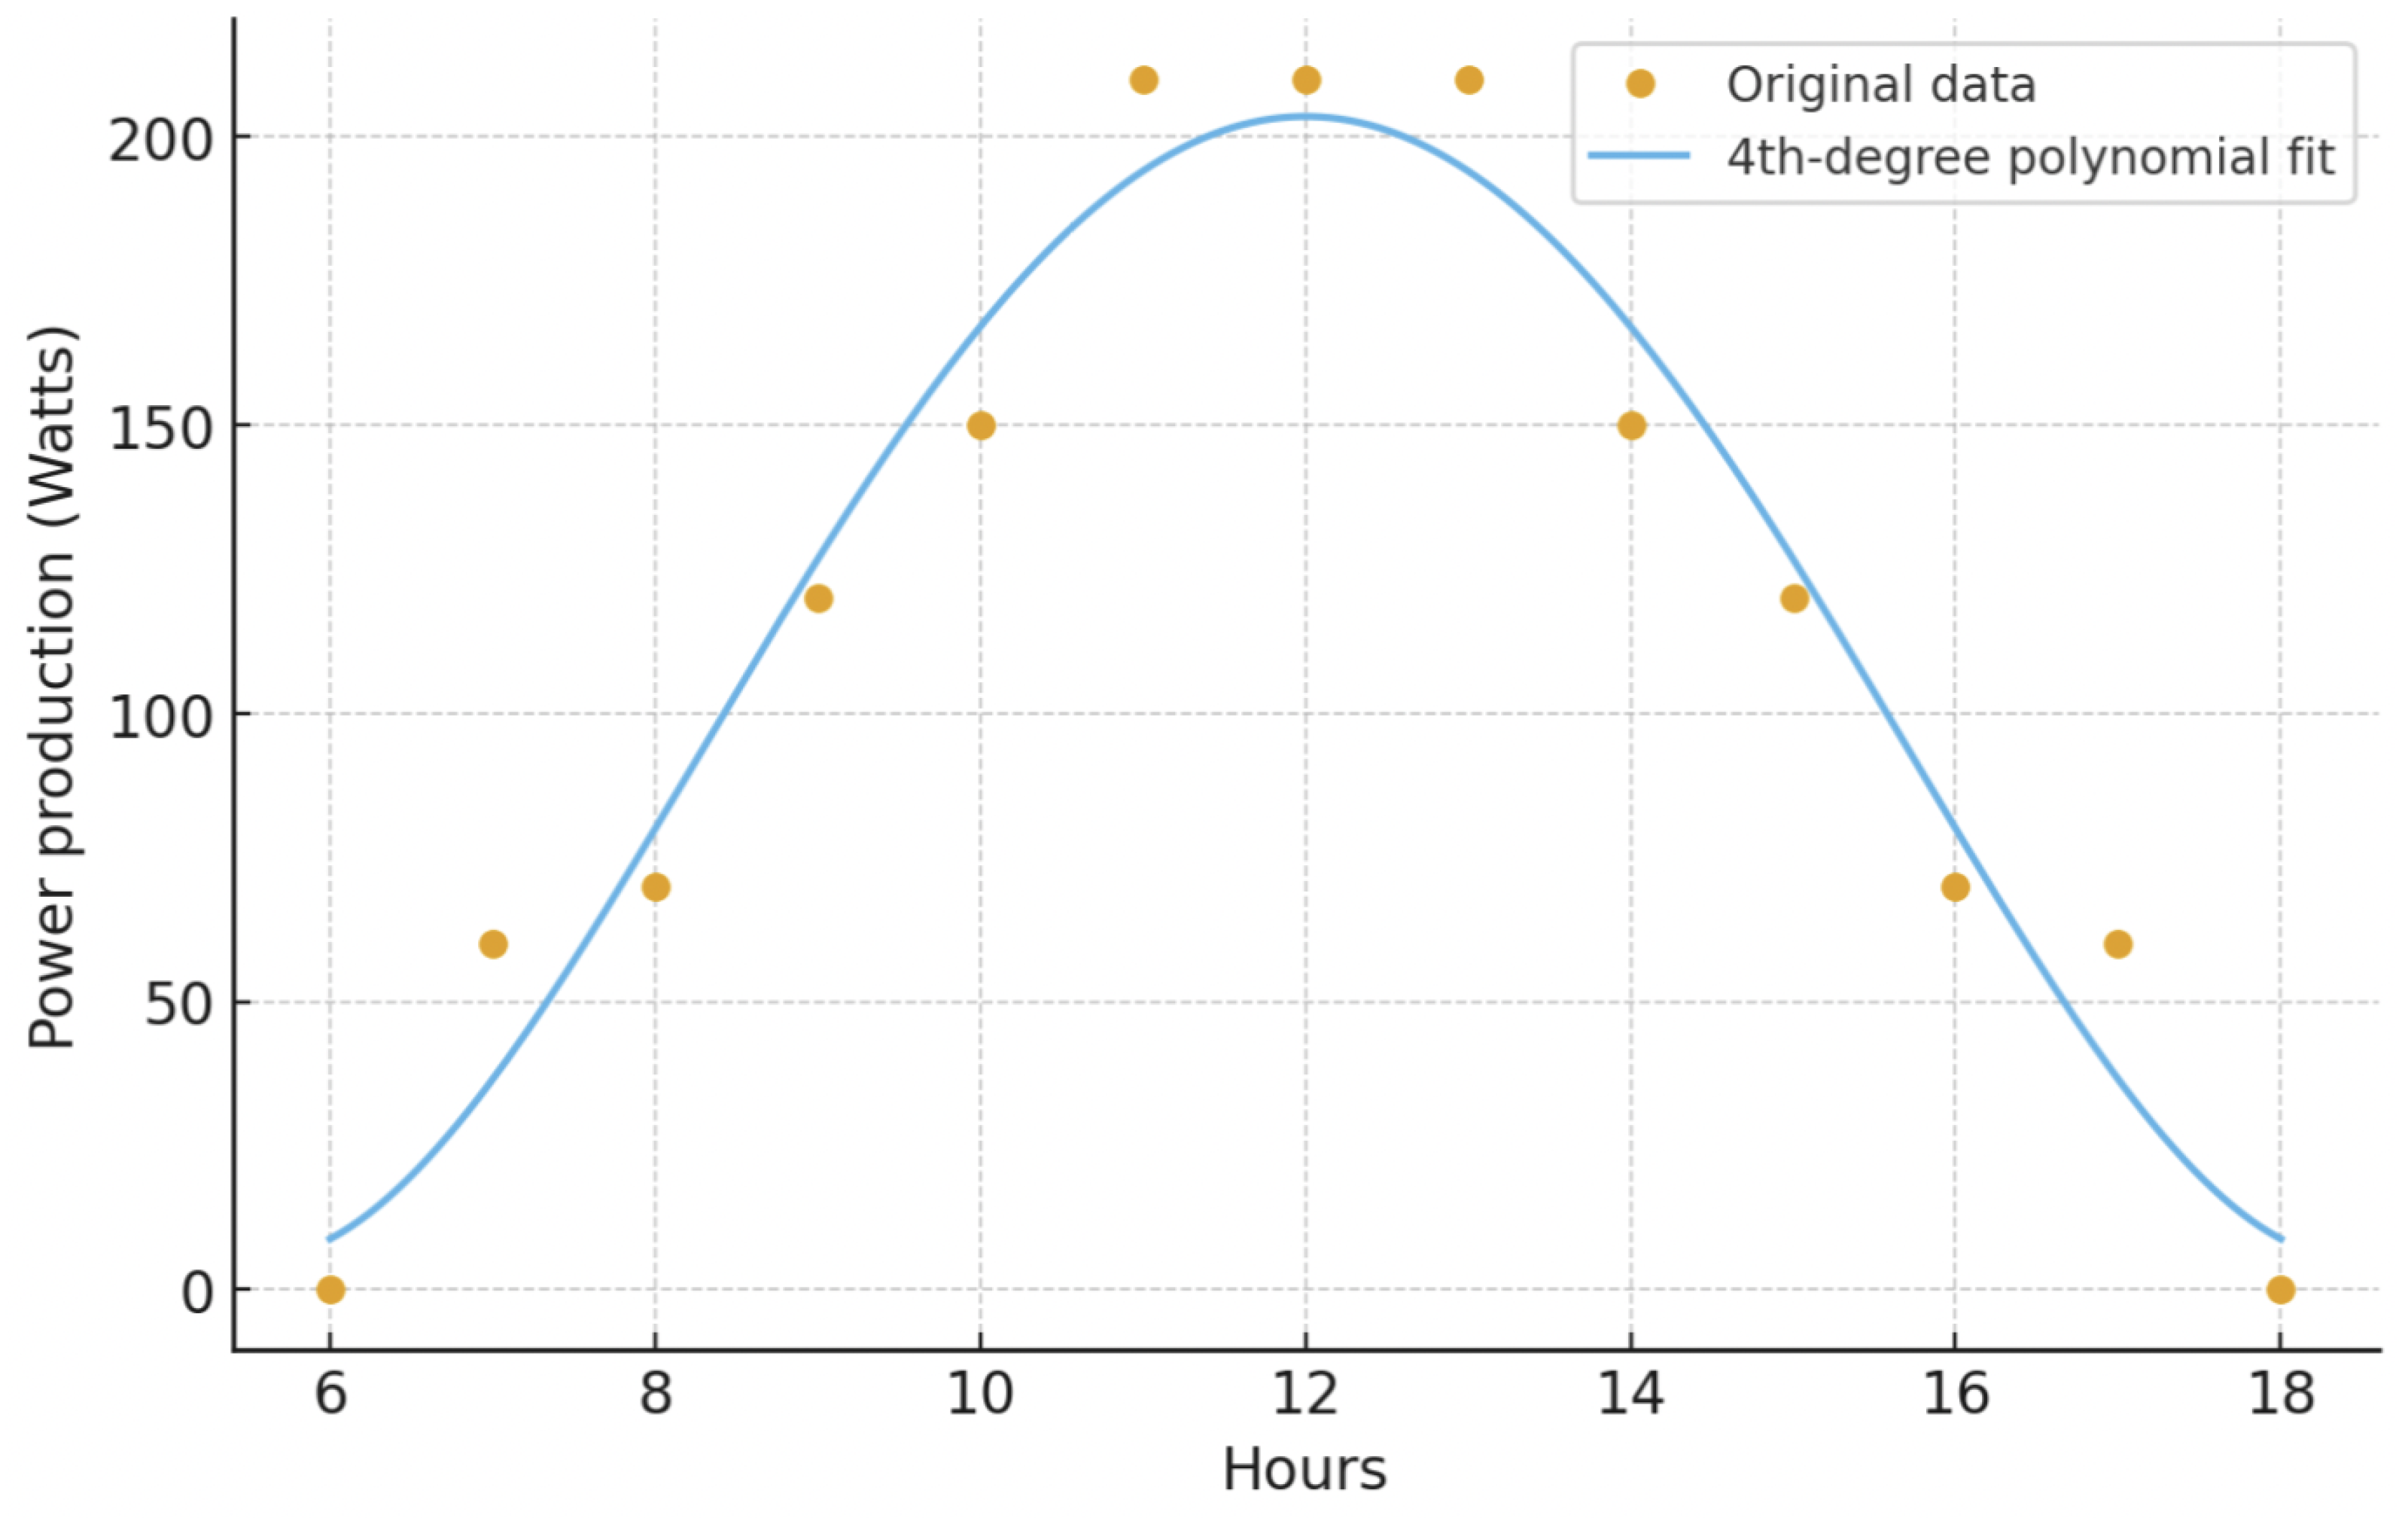
To quantitatively describe the diurnal energy production of the photovoltaic (PV) subsystem, we derived an analytical model of the instantaneous power (P(t)) as a function of time (t) (in hours). The PV generation profile was obtained by fitting experimental data from the reference study from [
30] to a 4th-degree polynomial using least-squares regression. The original dataset represents the average daily energy production of a PV plant under clear-sky conditions, as illustrated in
Figure 4.
The fitting process resulted in the below formula:
where (P(t)) is given in watts, valid for the hours between 6 a.m. and 18 p.m. (6 ≤ t ≤ 18). This expression accurately reproduces the bell-shaped daily power output observed in the PV system, peaking around solar noon and diminishing toward sunrise and sunset. The corresponding fitted curve and the extracted data points are depicted in
Figure 4, illustrating the good agreement between the model and the experimental solar generation profile.
The total daily energy yield (E) of the PV system is obtained by integrating the power function over the daylight period:
Assuming a nominal DC bus voltage of Vsys = 12 V the same as the voltage of the GW battery storage system, this corresponds to approximately 118.7 Ah/day of available charge. This baseline clear-sky model therefore provides the theoretical upper limit of daily PV production and serves as a reference case for assessing GW energy autonomy.
In subsequent analyses, this deterministic model can be extended to incorporate stochastic fluctuations caused by irradiance variability and cloud coverage. Such effects can be represented by a time-dependent attenuation factor
, leading to an adjusted power function:
where
models transient reductions in PV output. Integrating
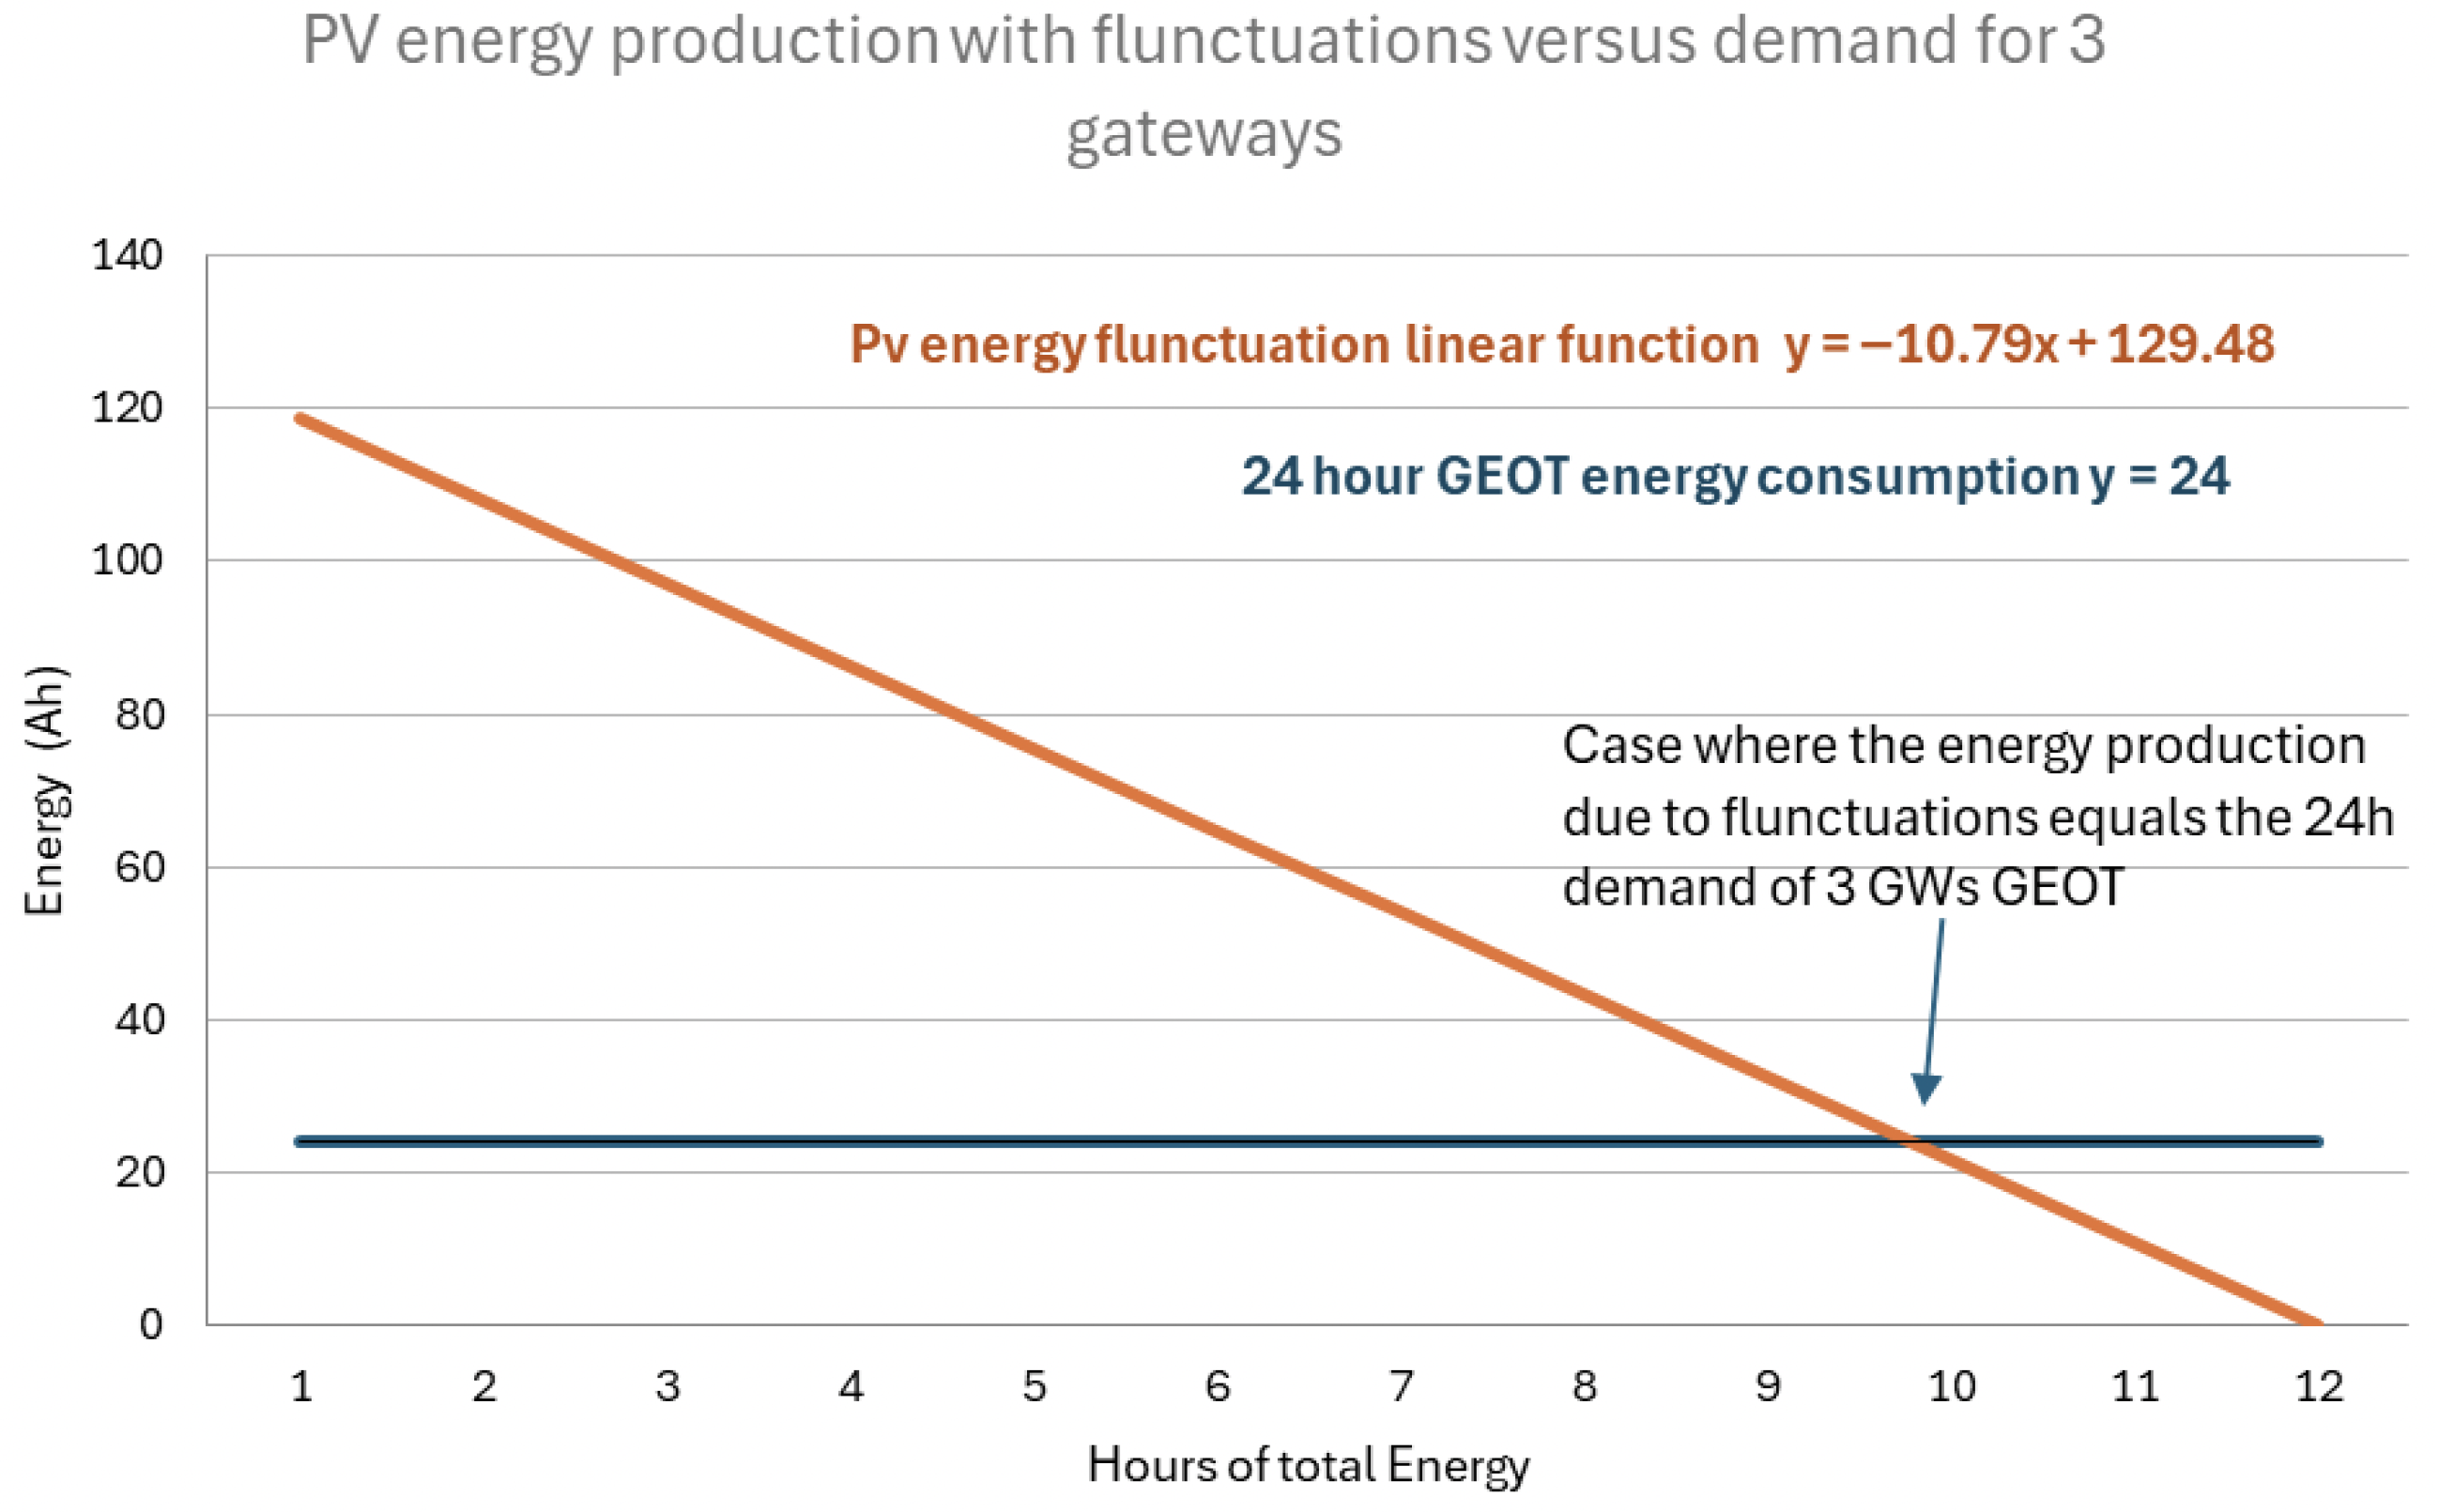
yields the effective daily energy under non-ideal atmospheric conditions. In order to assess the GW’s lifetime and battery depth-of-discharge under unstable supply scenarios—bridging the gap between ideal clear-sky operation and realistic renewable-energy fluctuations—we used a linear reduction model.
As shown in
Figure 5, the total energy consumption from the three GWs is calculated as below:
where
denotes the energy consumption of the GWs. In the same figure, we also plot the aforementioned linear reduction model. The intersection point of the two curves represents the minimum energy-production level required to match the total energy consumption of the three-GW GEOT scheme. The hour axis indicates that, in certain conditions, the PV system may require up to 10 h of operation to produce only the minimum energy needed to sustain the GEOT scheme.
From the model above, if the fluctuations in PV-produced energy result in an average output of 24 Ah, then the system will be up and running without any limitation. Below that threshold, the system will not be able to satisfy the energy demand and will eventually become energy depleted. One should keep in mind that this is the energy balance without the utilization of the system’s battery.
To realistically capture daily variability in solar energy generation, a stochastic model was employed to represent the irradiance fluctuation factor f(t), which scales the nominal PV output. On normal days, the solar availability factor fd is represented from a Beta distribution parameterized as , yielding a symmetric distribution with a mean value of and a standard deviation of approximately 0.16. This formulation models typical variations in irradiance between 25% and 75% of the full-sun condition, consistent with clear-to-partly-cloudy weather patterns and a Beta shape similar to the energy-production pattern.
To account for extended low-irradiance events, full cloudy blocks were introduced as a discrete random process. Each day has a probability pstart = 0.01 of initiating a full cloud event lasting dstorm = 7 consecutive days. During such periods, the PV generation factor is fixed at fd = 0.05, representing a severe reduction to 5% of the nominal energy output. Assuming independence of cloud/storm occurrences, the expected probability that a randomly selected day falls within a storm interval is approximately:
indicating that roughly 7% of days experience near-zero PV contribution due to extended cloud coverage (on a yearly basis for the Mediterranean region).
Overall, the daily solar availability can thus be described as a mixture distribution:
And average value 0.5 meaning normal days have 50% of the maximum energy production on a yearly basis.
This probabilistic framework allows the simulation of long-term system autonomy and quantifies the likelihood of battery depletion under realistic solar intermittency scenarios. The daily energy balance of the GW’s battery (capacity
)
where the load consumption is
.
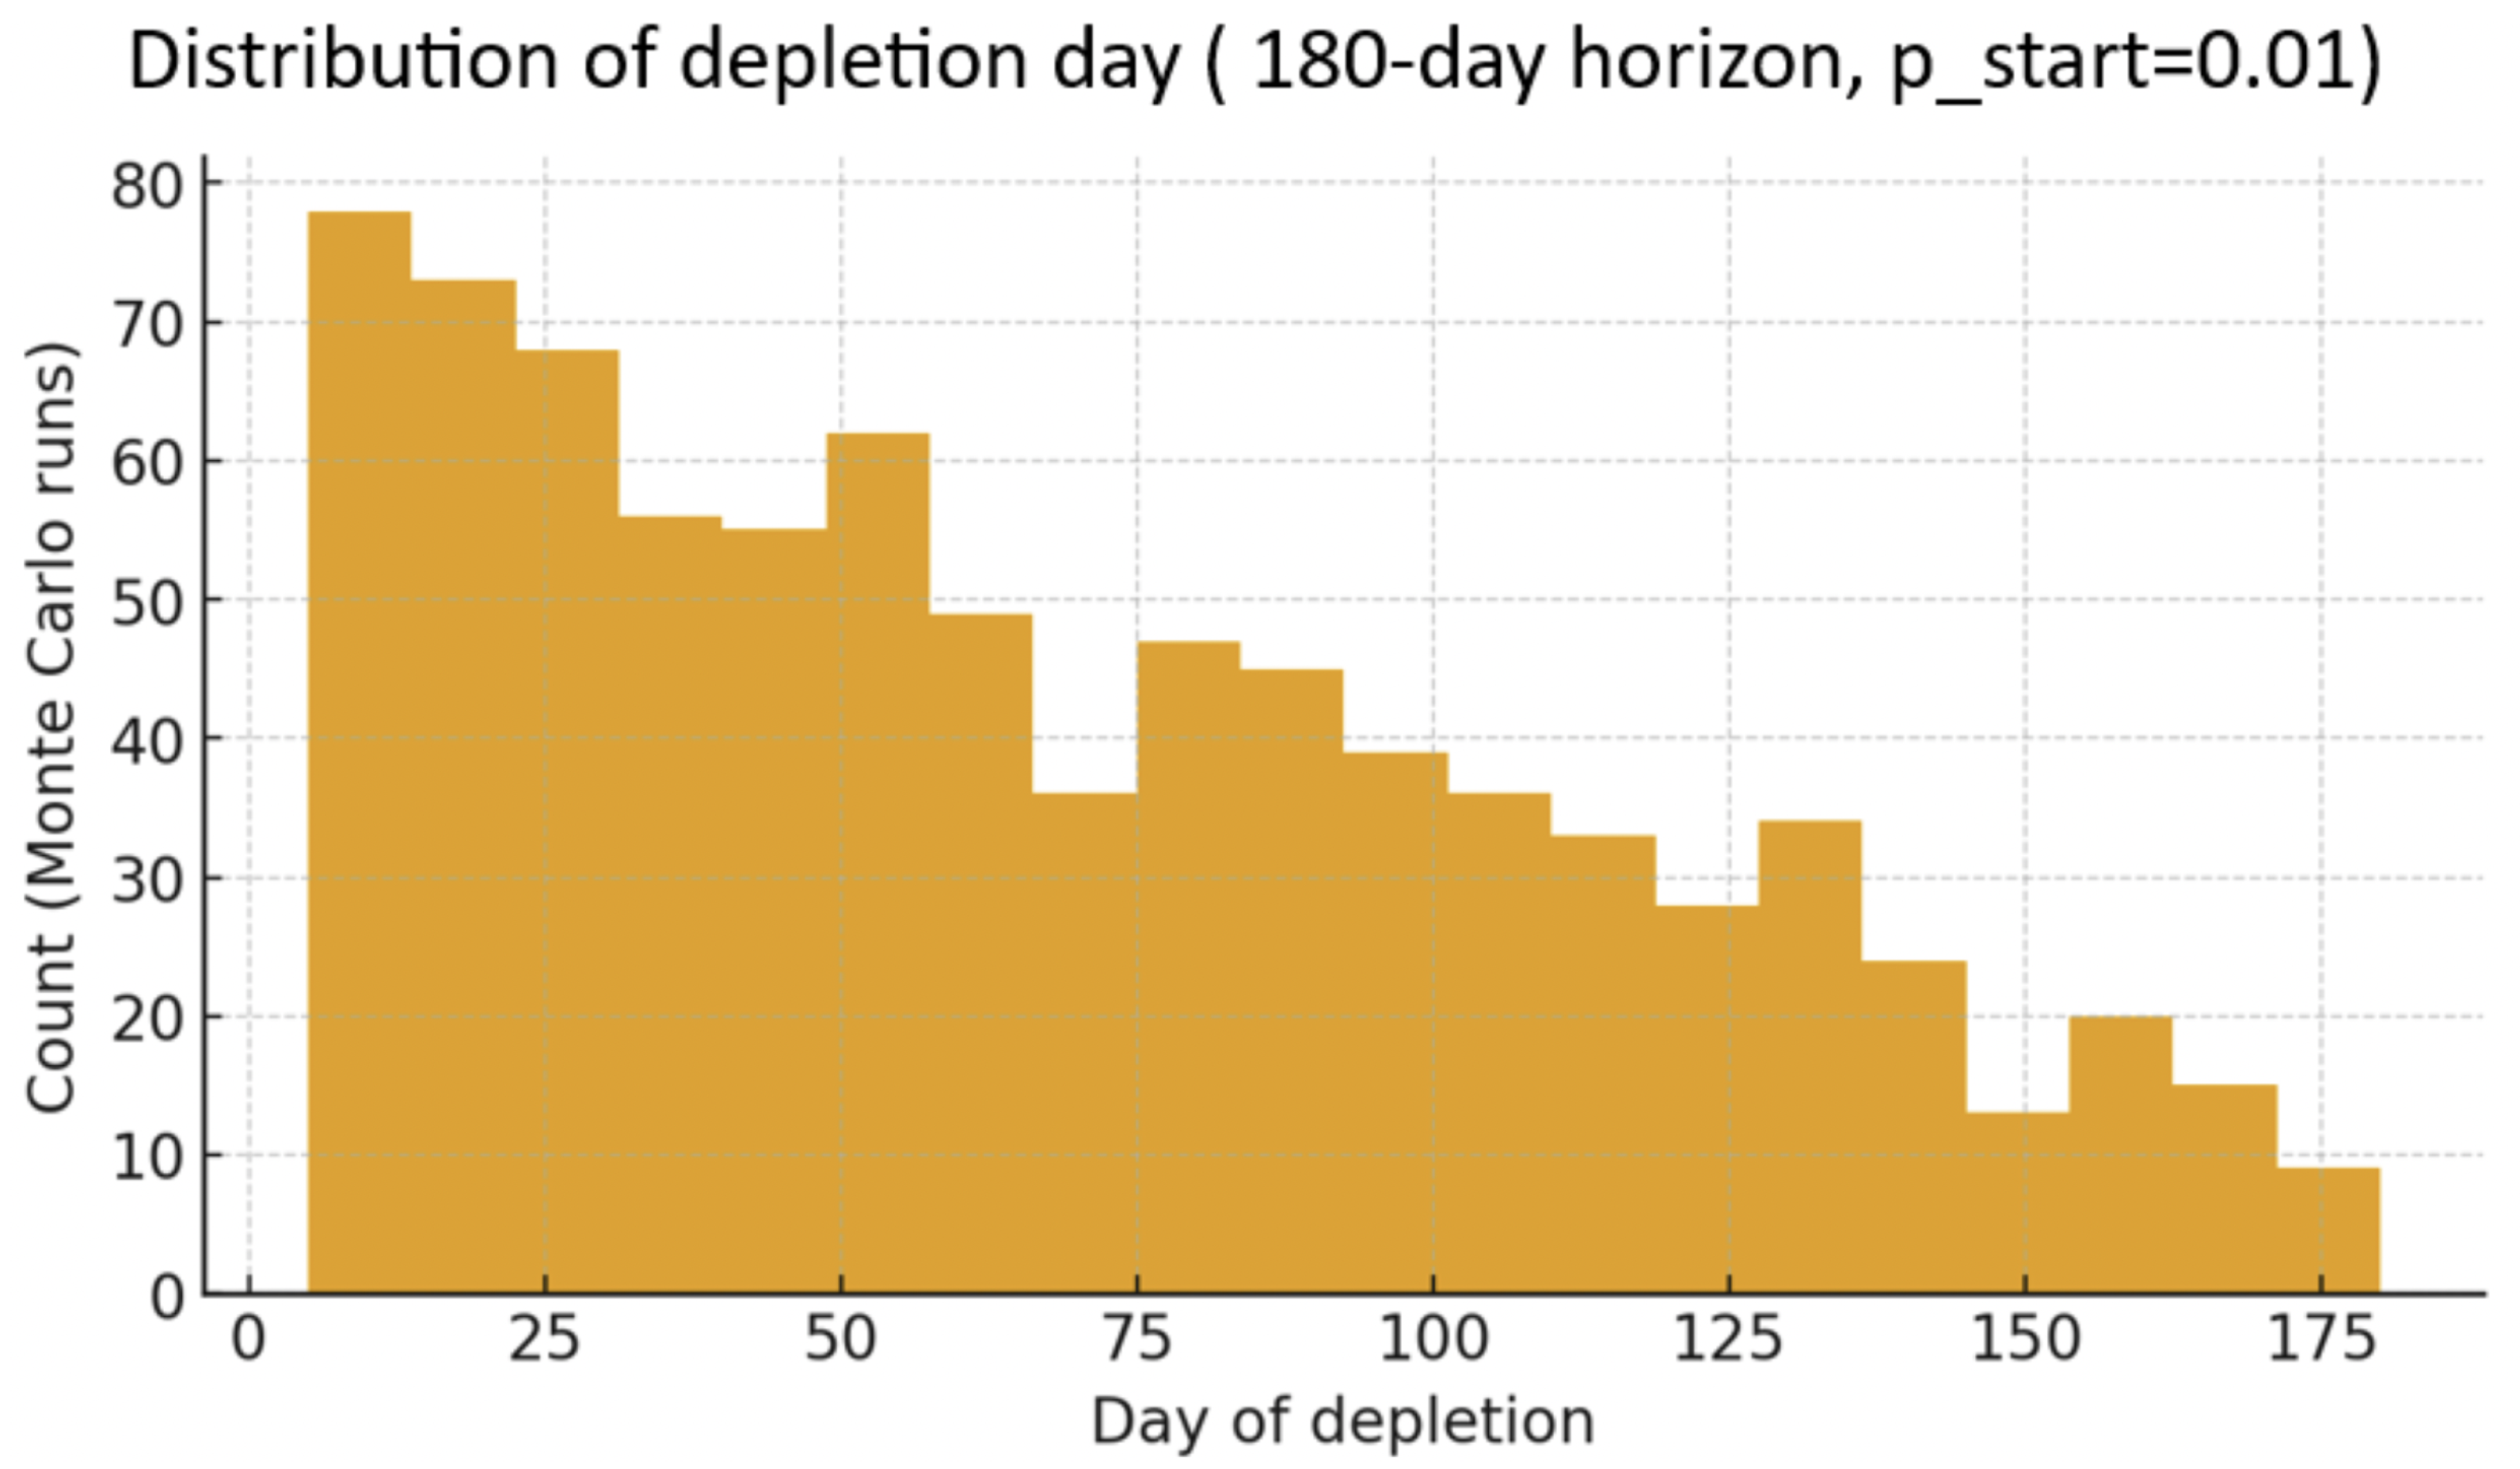
Monte Carlo simulations (1000 realizations, 180-day horizon) were performed to capture the stochastic variability of solar input and its effect on battery autonomy.
Figure 6 presents the distribution of depletion day over 1000 Monte Carlo runs.
As shown in
Figure 6, the distribution of depletion days reveals that even under infrequent 7-day storm conditions (pstart = 0.01), the 90 Ah battery fails to sustain continuous operation beyond six months in more than half of the simulated cases. The majority of failures occur within the first 40 days, corresponding to early storm events, while the tail of the histogram represents late-season depletion from isolated cloudy periods.
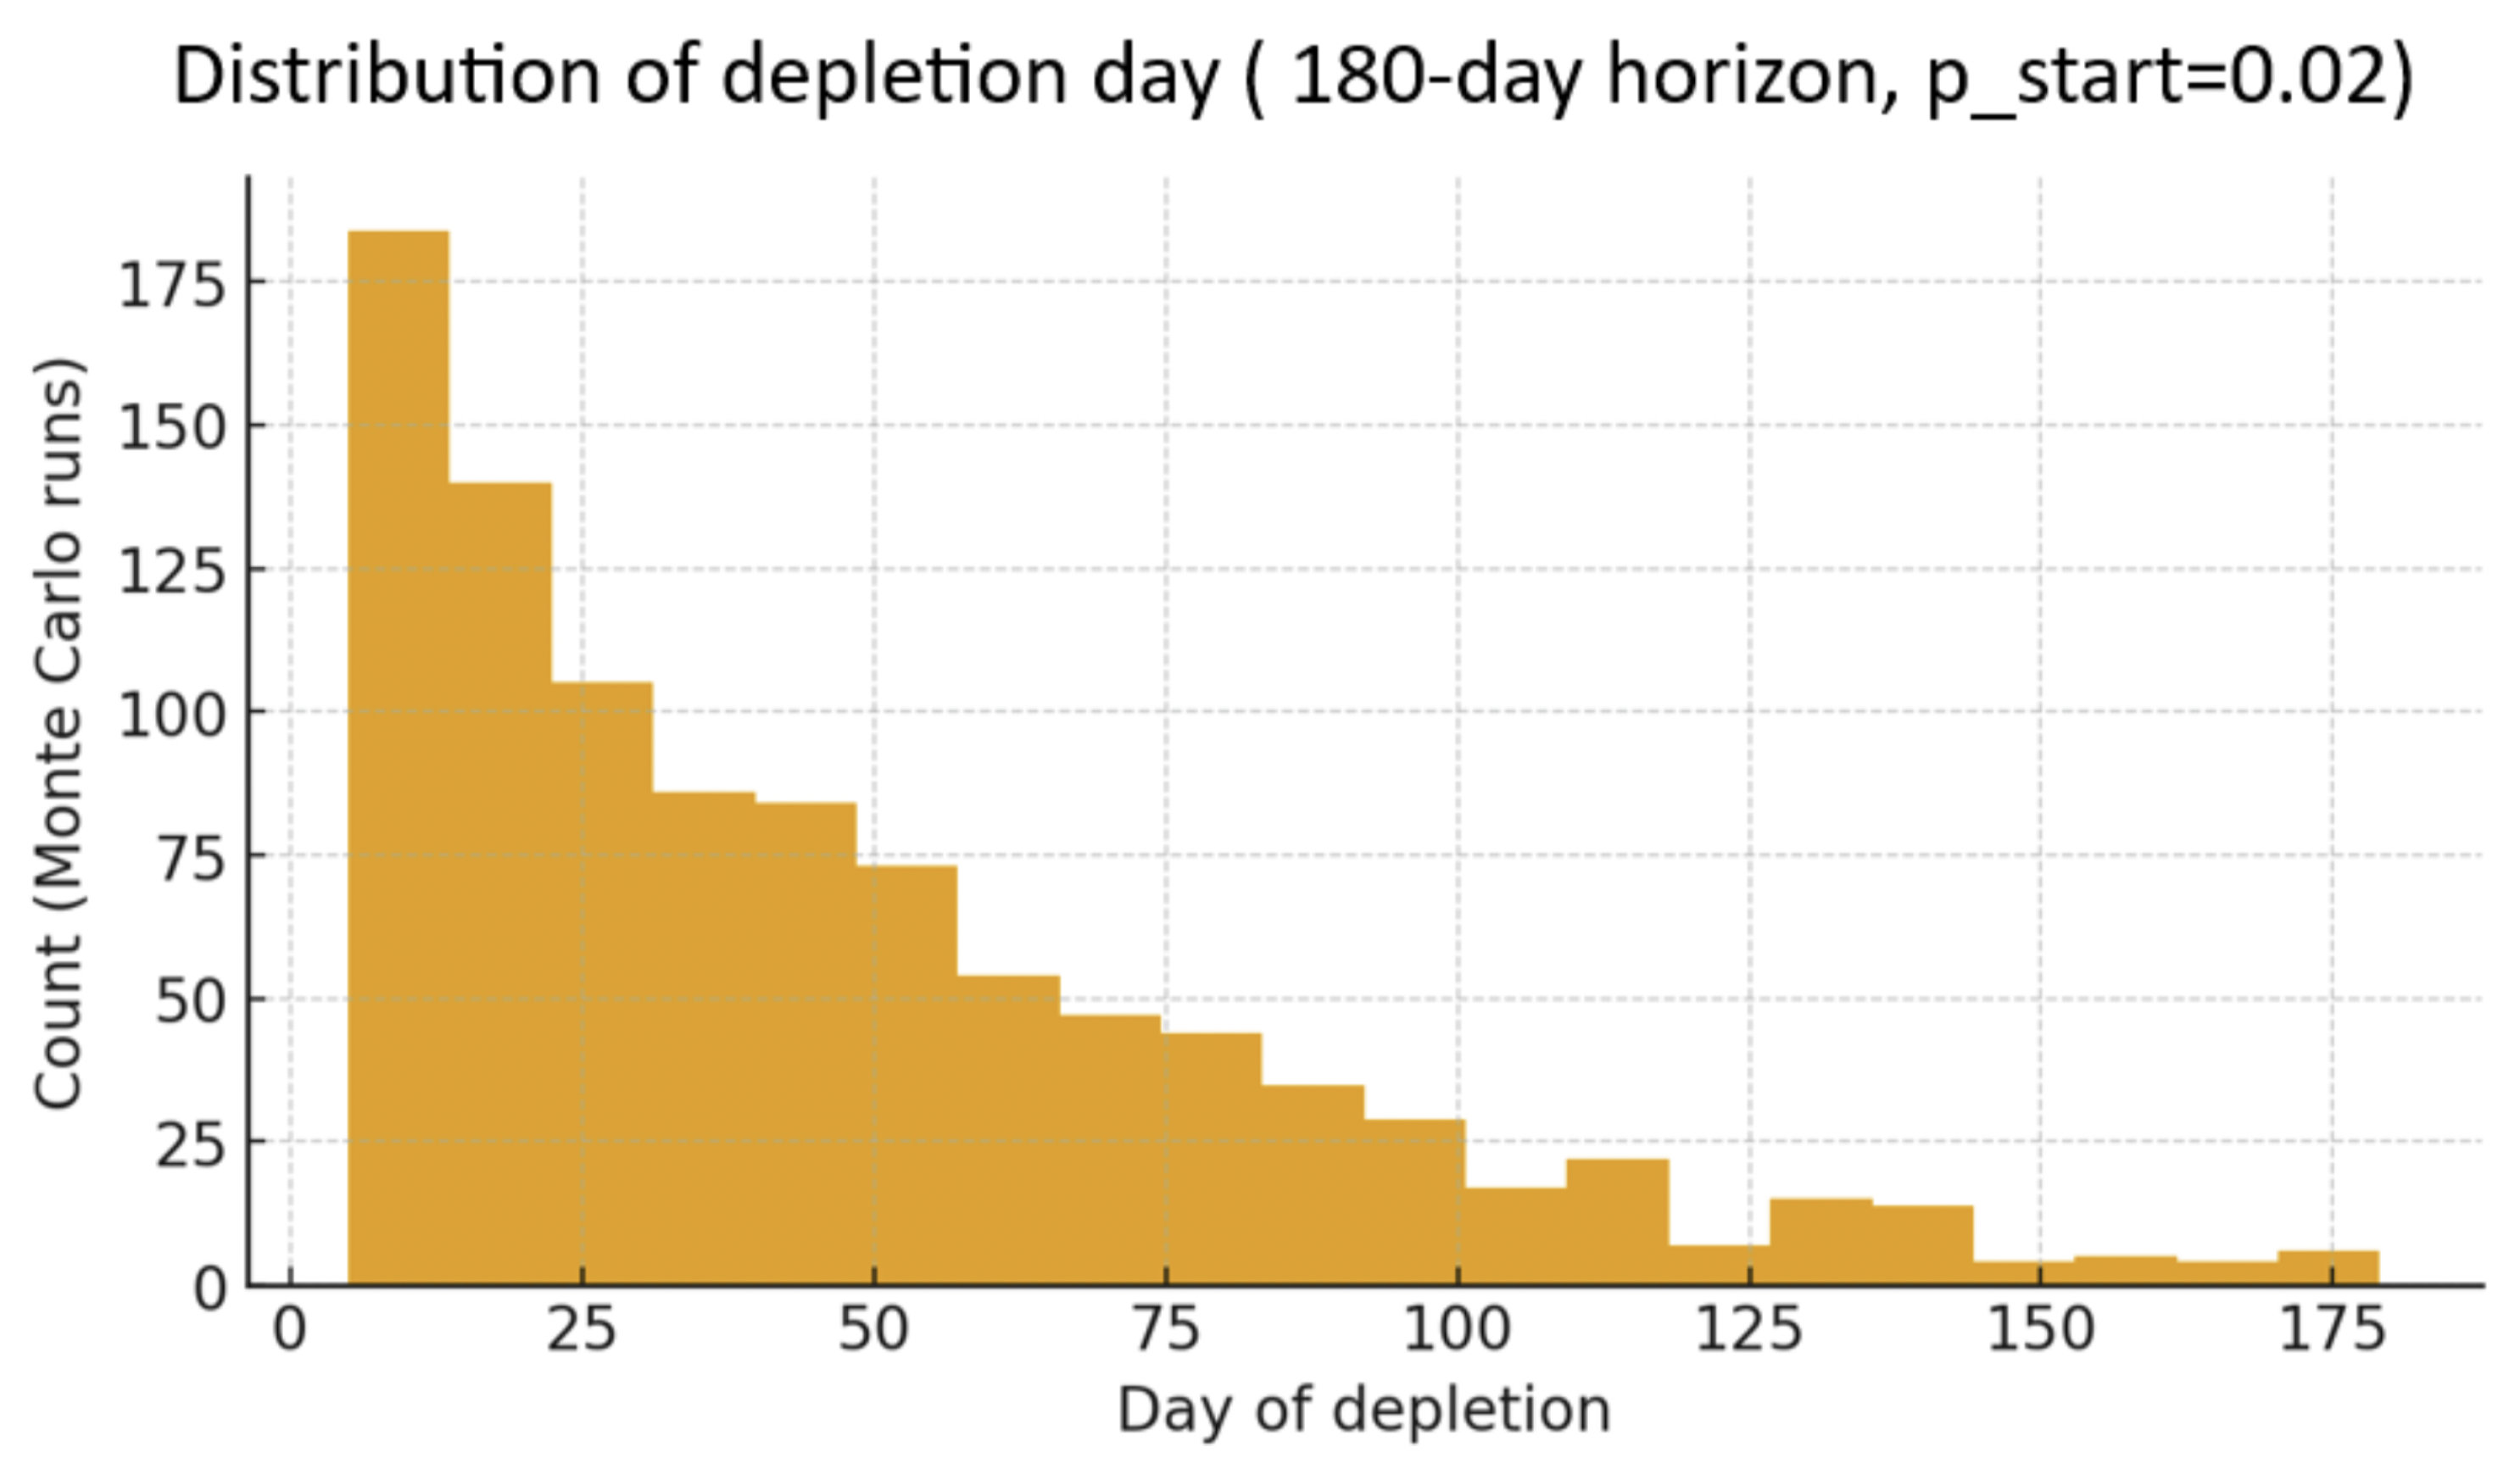
For a pstart = 0.02, the distribution is illustrated in
Figure 7. In this case, where the storm start probability is 0.02 (2% change for each day), almost 99% of runs have reached depletion—meaning nearly all GWs lose power at least once in six months. Yet this is a high probability representing worst case scenarios for the Mediterranean region.
In the next section, we test the GEOT in four lifelike simulation scenarios to evaluate its performance.
5. Simulation Results
Based on the above notions, we developed four simulation setups that will certify the potential of the GEOT to extend the energy lifetime of a LoRaWAN network system. With this in view, a LoRa network simulator was designed and implemented using Python 3.7 on Spyder (the scientific Python development environment) running Apple (Thessaloniki, Greece), macOS 12.1 Monteray with a 2.2 GHz Intel Core i7 Processor. The simulator models the MAC operation of the proposed protocol in detail, while using only the absolutely necessary elements to represent the physical layer. In the following scenarios, we considered a system consisting of 2000 static ENs in total shared among 3 GWs randomly positioned. This setup represents our main simulation scenario, which was evaluated under four different spatial distributions: normal, uniform, grid, and Pareto. The parameters for the network layout considered in this study are depicted in
Table 2. The transmission power of the single antenna used in each node (shown in
Table 2) plays a role primarily in energy consumption indirectly affecting node lifetime. For simplicity, we consider that the GWs utilize the same antenna with the same power consumption characteristics (as in the work of [
22]). The standard deviation differs between the distributions in order to maintain the same network coverage. As a consequence, the GEOT protocol is tested for various network parameters that could be fit in different application scenarios. By this means, a broader spectrum of applications could fit one or the other setup. The application requirements for periodic data acquisition were fulfilled, with a periodicity of 12 min. In other words, each cycle’s duration was 12 min in order to offer continuous data acquisition with respect to the total number of nodes. We emphasize that the application requirements dictate this time slot. Moreover, each GW was equipped with a 90 Wh battery and the simulations were run until the energy exhaustion of all the GWs. The rest of the simulation parameters are shown in
Table 2. As the proposed protocol is a novel approach to the GWs’ energy management following some basic principles of the work in [
26], in order to provide reliable evidence about its performance, we migrated a well-established LoRaWAN protocol [
22] towards the GW energy optimization.
In this new protocol derived from the work of [
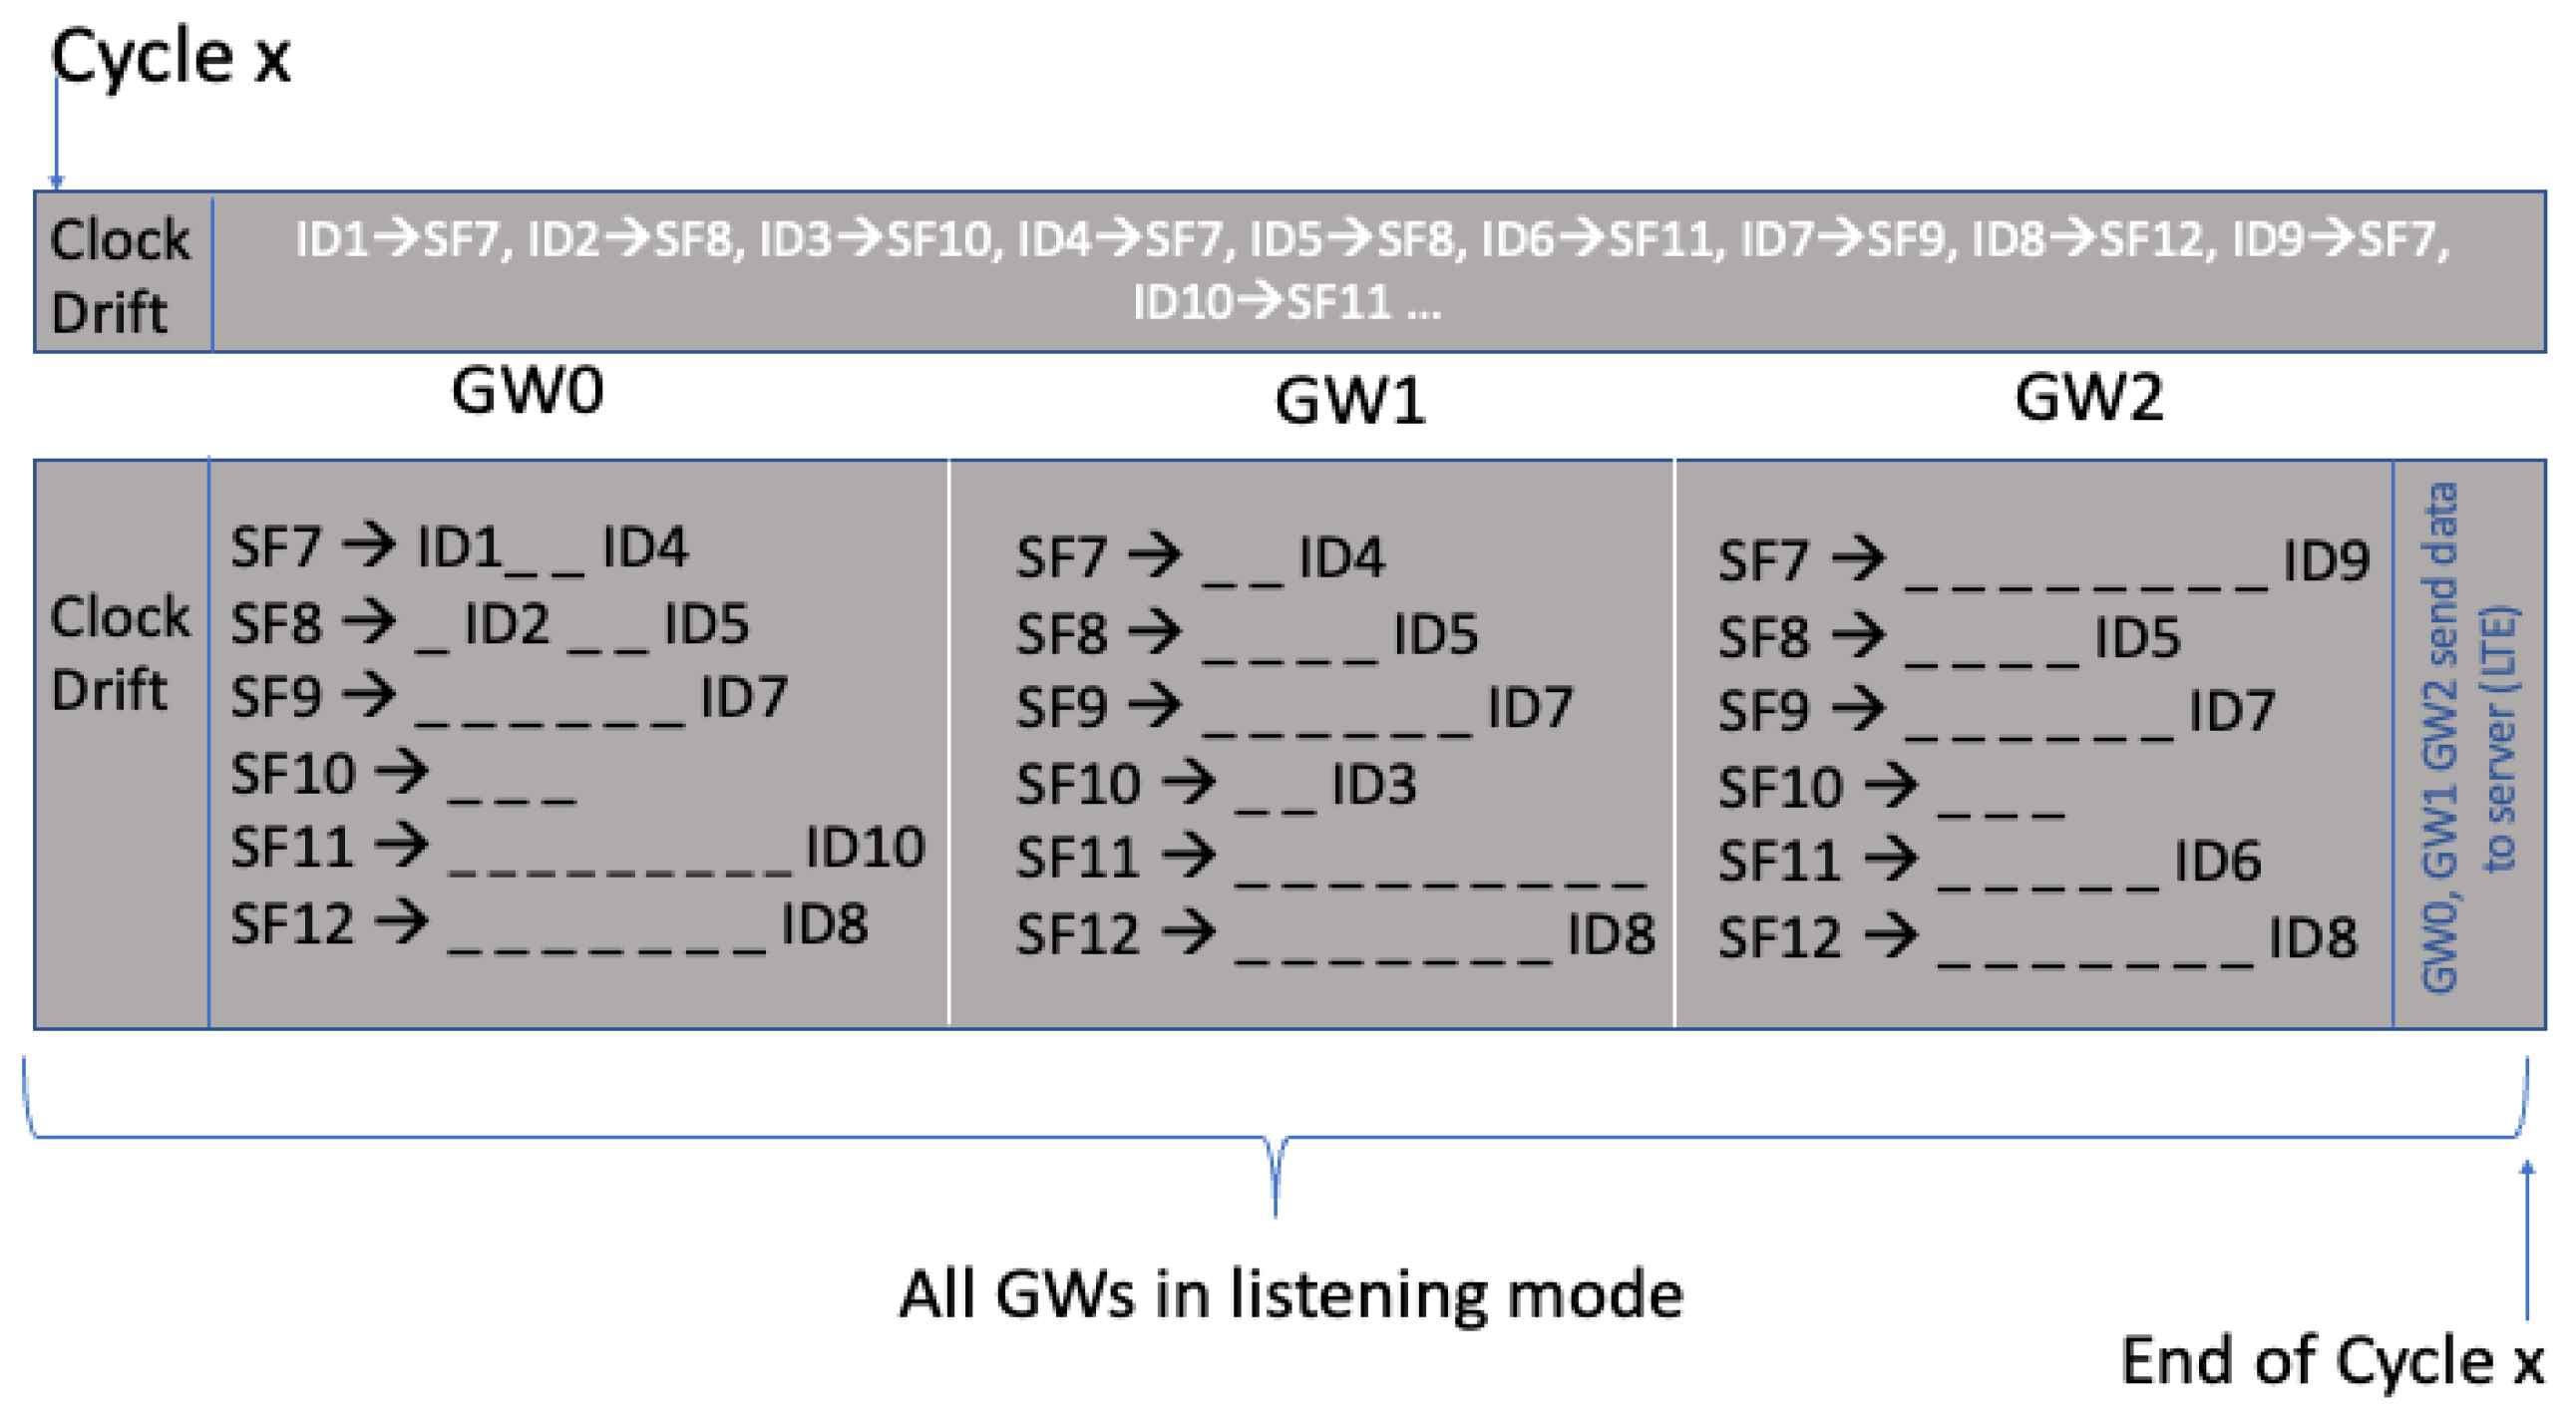
22], the nodes transmit their data using TDMA scheduling, utilizing the lowest SF and TE. Based on their assigned unique ID, the nodes transmit their data considering that each node in their SF list had the previous ID number. In other words, take a node with ID 12 and assigned SF11, and calculate its transmission timeslot based on the assumption that the previous ID will also transmit to the same SF, as the original protocol of [
22] dictates. Following the GEOT operational principles, there are six different lists, but this time there may exist empty slots between transmissions, as the GWs do not broadcast any algorithmically processed transmission program and any assumptions are based on the ID of the previous node. For both algorithms, the timeslot schedules are presented in
Figure 8 and
Figure 9, respectively.
5.1. Uniform Distribution
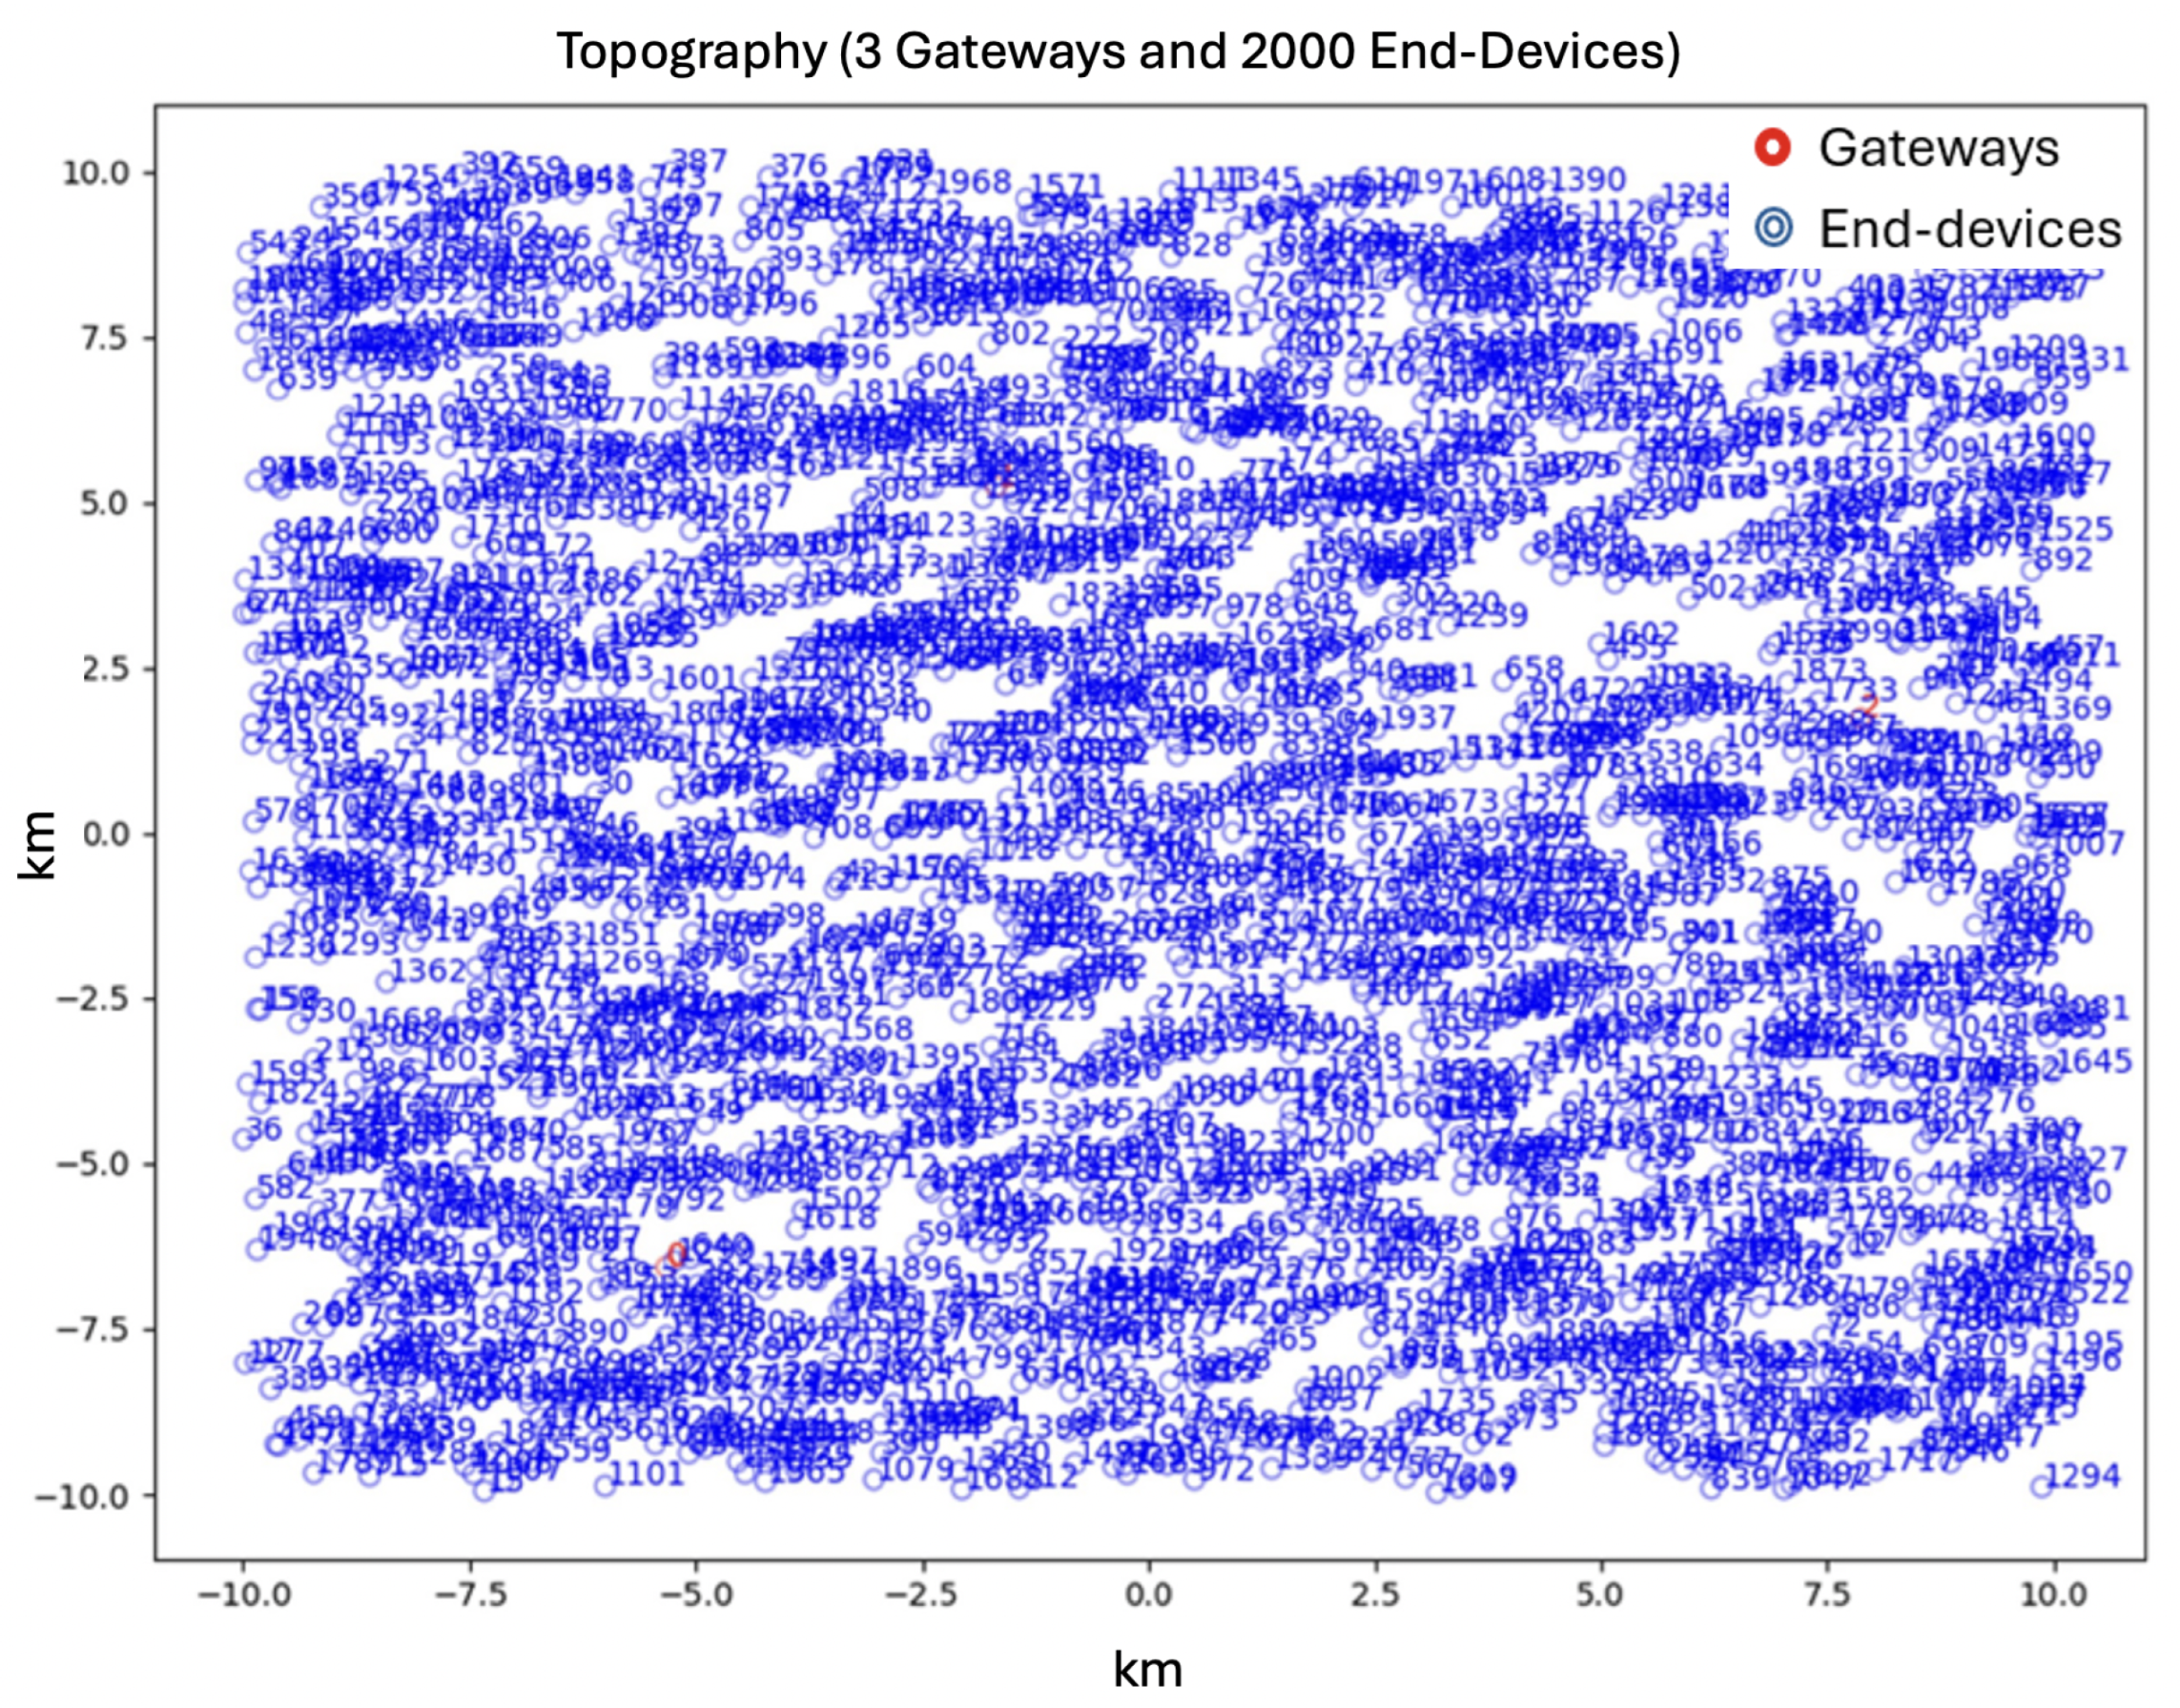
Figure 10 shows the nodes and GW spatial distribution of an instance from the simulation runs. A Python program was developed to generate
Figure 10, visualizing the positions of the nodes for the uniform statistical distribution. The same applies in a subsequent figure for the normal distribution. Inside the squared area with side length of 10 km, as we can see there are evenly distributed nodes with blue color and 3 GWs with red color.
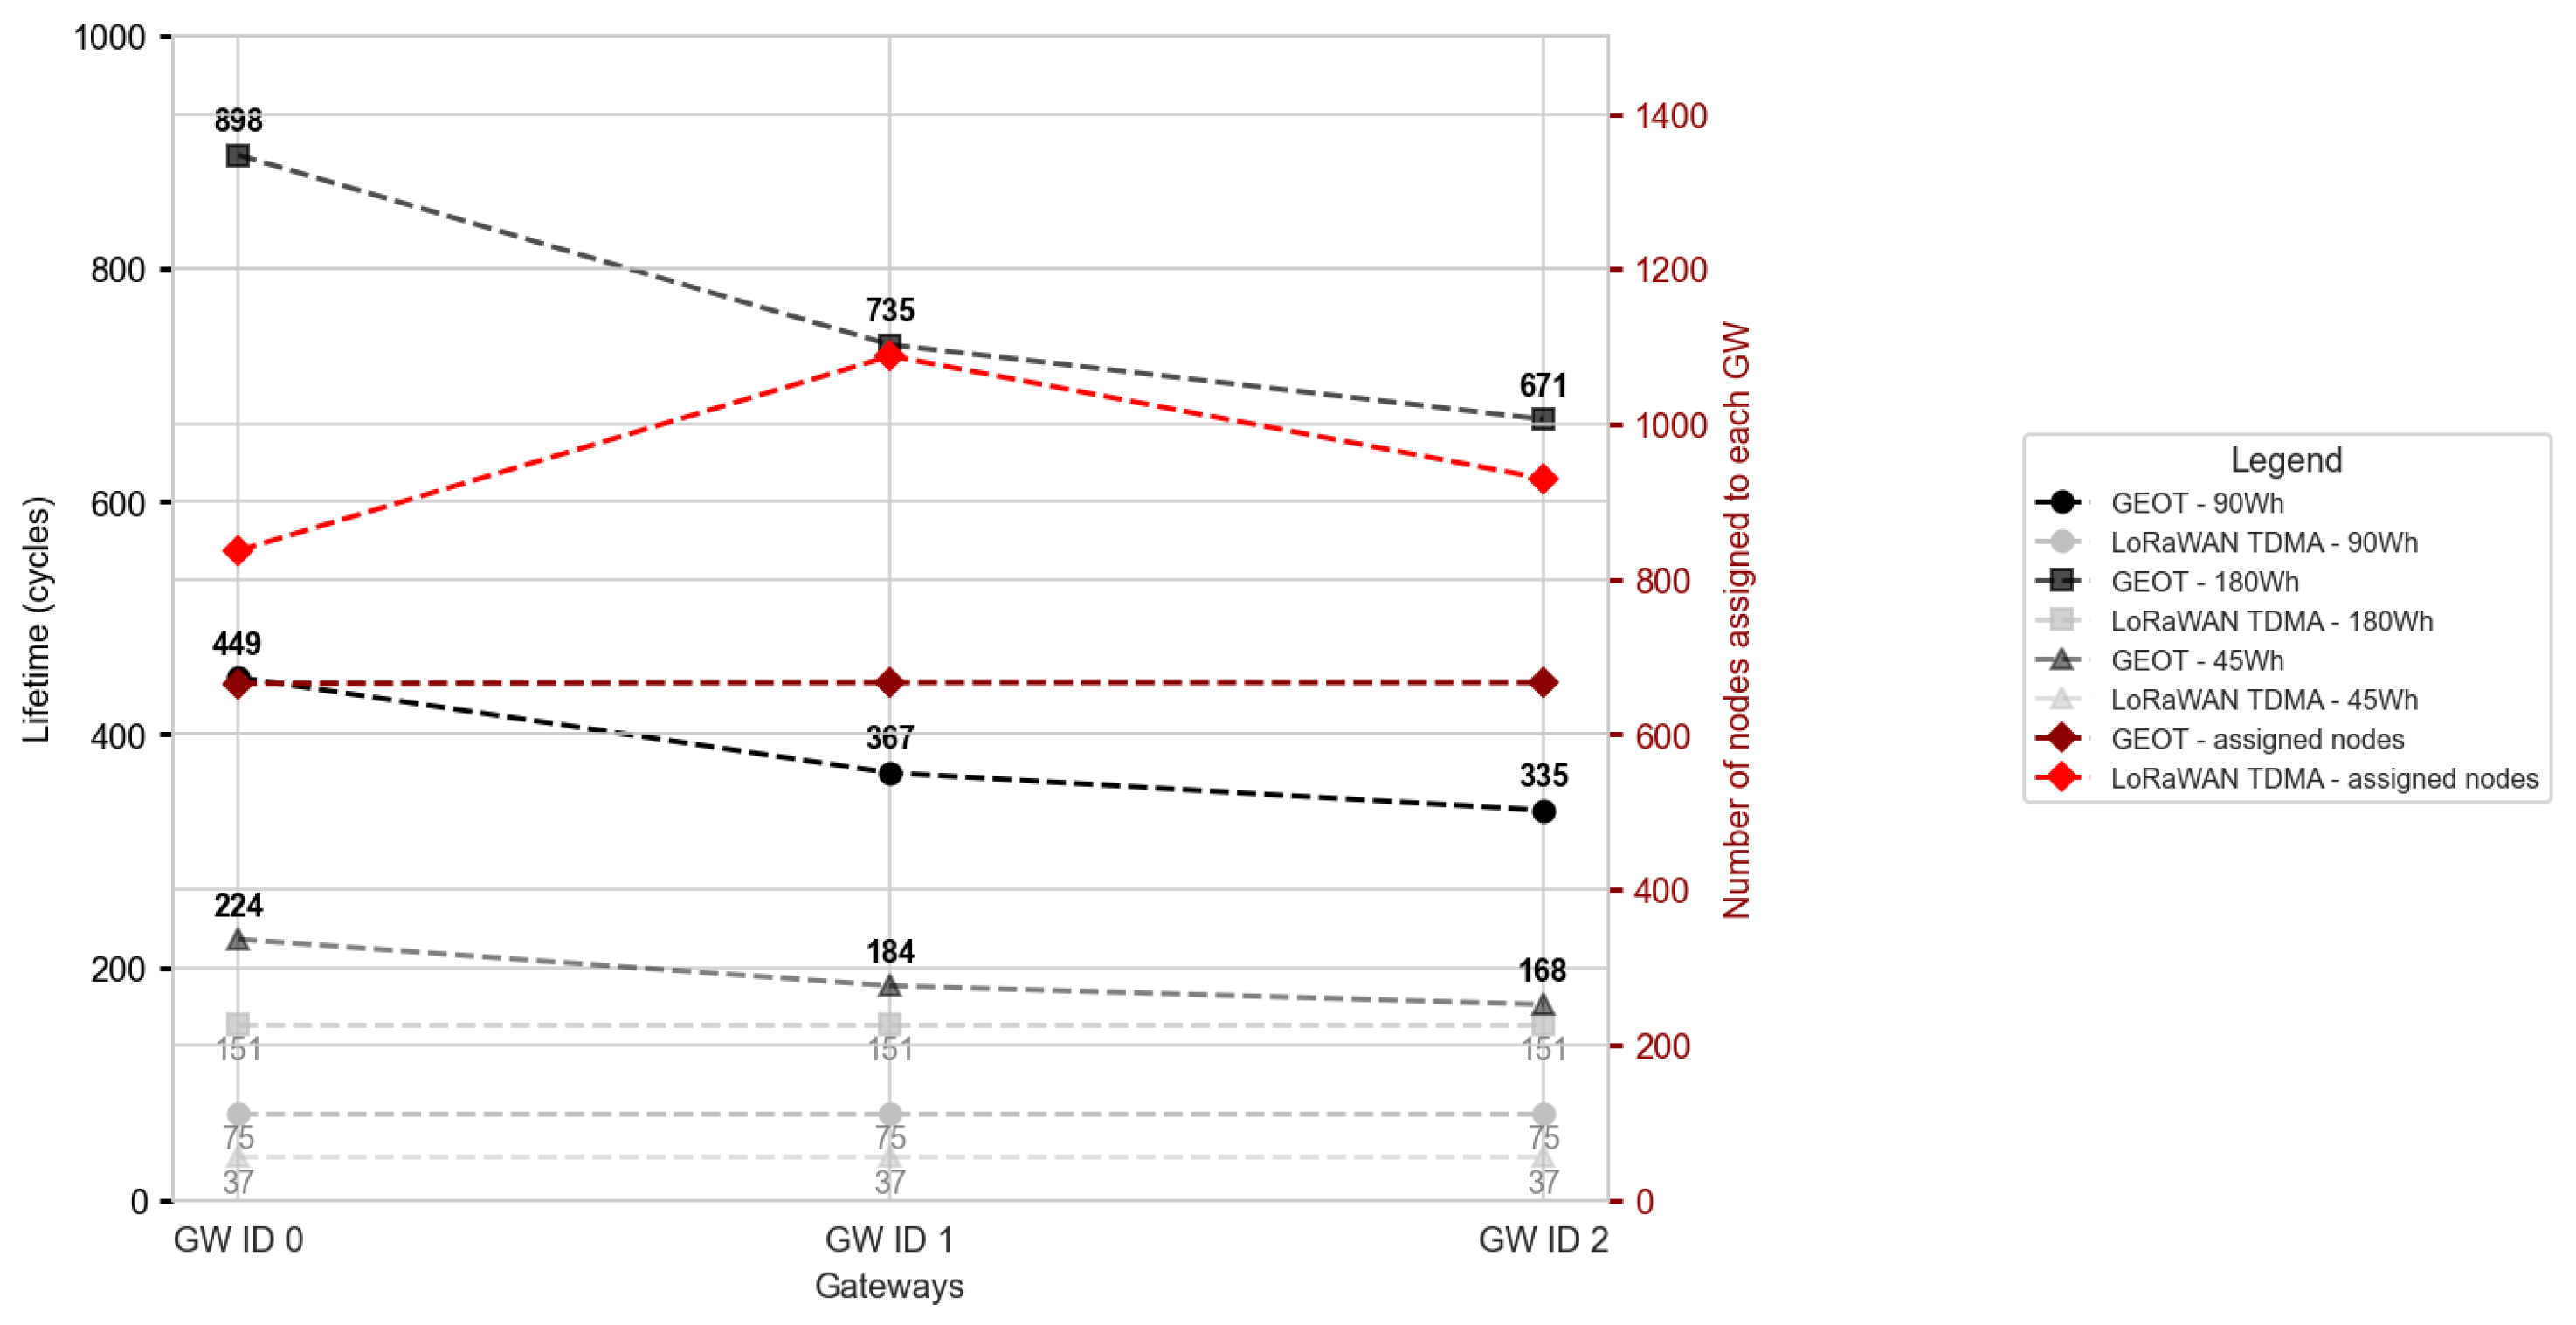
Setting the periodicity to 12 min, in
Figure 11 we see the total number of cycles until energy exhaustion for the GWs along with the number of nodes assigned to them. Under the GEOT algorithm, all GWs share the same number of nodes 666/667, while with the protocol of [
22] each GW receives messages from multiple nodes, elevating the corresponding graphical representation. The fact that in the second protocol there is no node assignment operation is responsible for this outcome. Hence, a plethora of nodes transmit their message and these are received from more than one GWs resulting in values at the level of 1200 nodes/GW, as the distance from the GW, the SF, and the TP are the only parameters that affect the node assignment to the GWs for the reference protocol. The difference in the node assignment between the two approaches can be attributed to the fact that GEOT distributes the nodes through an additional step to maintain an energy balance between GWs, while the LoRaWAN node assignment to the GWs derives solely from the distance as a result of the spatial distribution in each simulation scenario. The second metric in the figure is related to the network lifespan. The GEOT protocol’s energy management results in almost 449 cycles for GW 0 and 335 cycles for GW 2. By contrast, the migrated algorithm resides at the levels of 75 cycles. The multiple copies of the same data received from the GWs and the lack of energy state management (GWs stay always at the receiving state), are responsible for this substantial difference in energy performance between the two protocols. As each GW may receive messages from approximately 800 to 1200 nodes, this directly impacts their energy consumption. Conversely, each GW using GEOT receives messages from up to 666 nodes in total, resulting in a longer network lifespan.
Beyond the baseline evaluation with 90 Wh battery capacity, the proposed GEOT algorithm was further assessed for GW batteries of 45 Wh and 180 Wh. As illustrated in
Figure 11, the network lifetime scales linearly with the available energy capacity. Specifically, for 45 Wh batteries, the average lifetime of the GWs is half compared to the 90 Wh case (224 cycles for GW 0), while for 180 Wh batteries, the lifetime nearly doubles (898 cycles for GW 0). This linear behavior indicates that GEOT efficiently adapts to the available energy resources, maintaining proportional energy consumption across GWs. In contrast, LoRaWAN TDMA also exhibits a linear increase in lifetime with higher battery capacities, but at significantly lower absolute levels (37, 75, and 151 cycles for 45, 90, and 180 Wh, respectively). This highlights that, although both protocols scale proportionally with the available energy, GEOT achieves considerably higher efficiency and lifetime extension due to its energy-management and node-assignment mechanisms. These results confirm GEOT’s scalability and robustness under diverse energy constraints, validating its suitability for off-grid deployment scenarios.
5.2. Normal Distribution
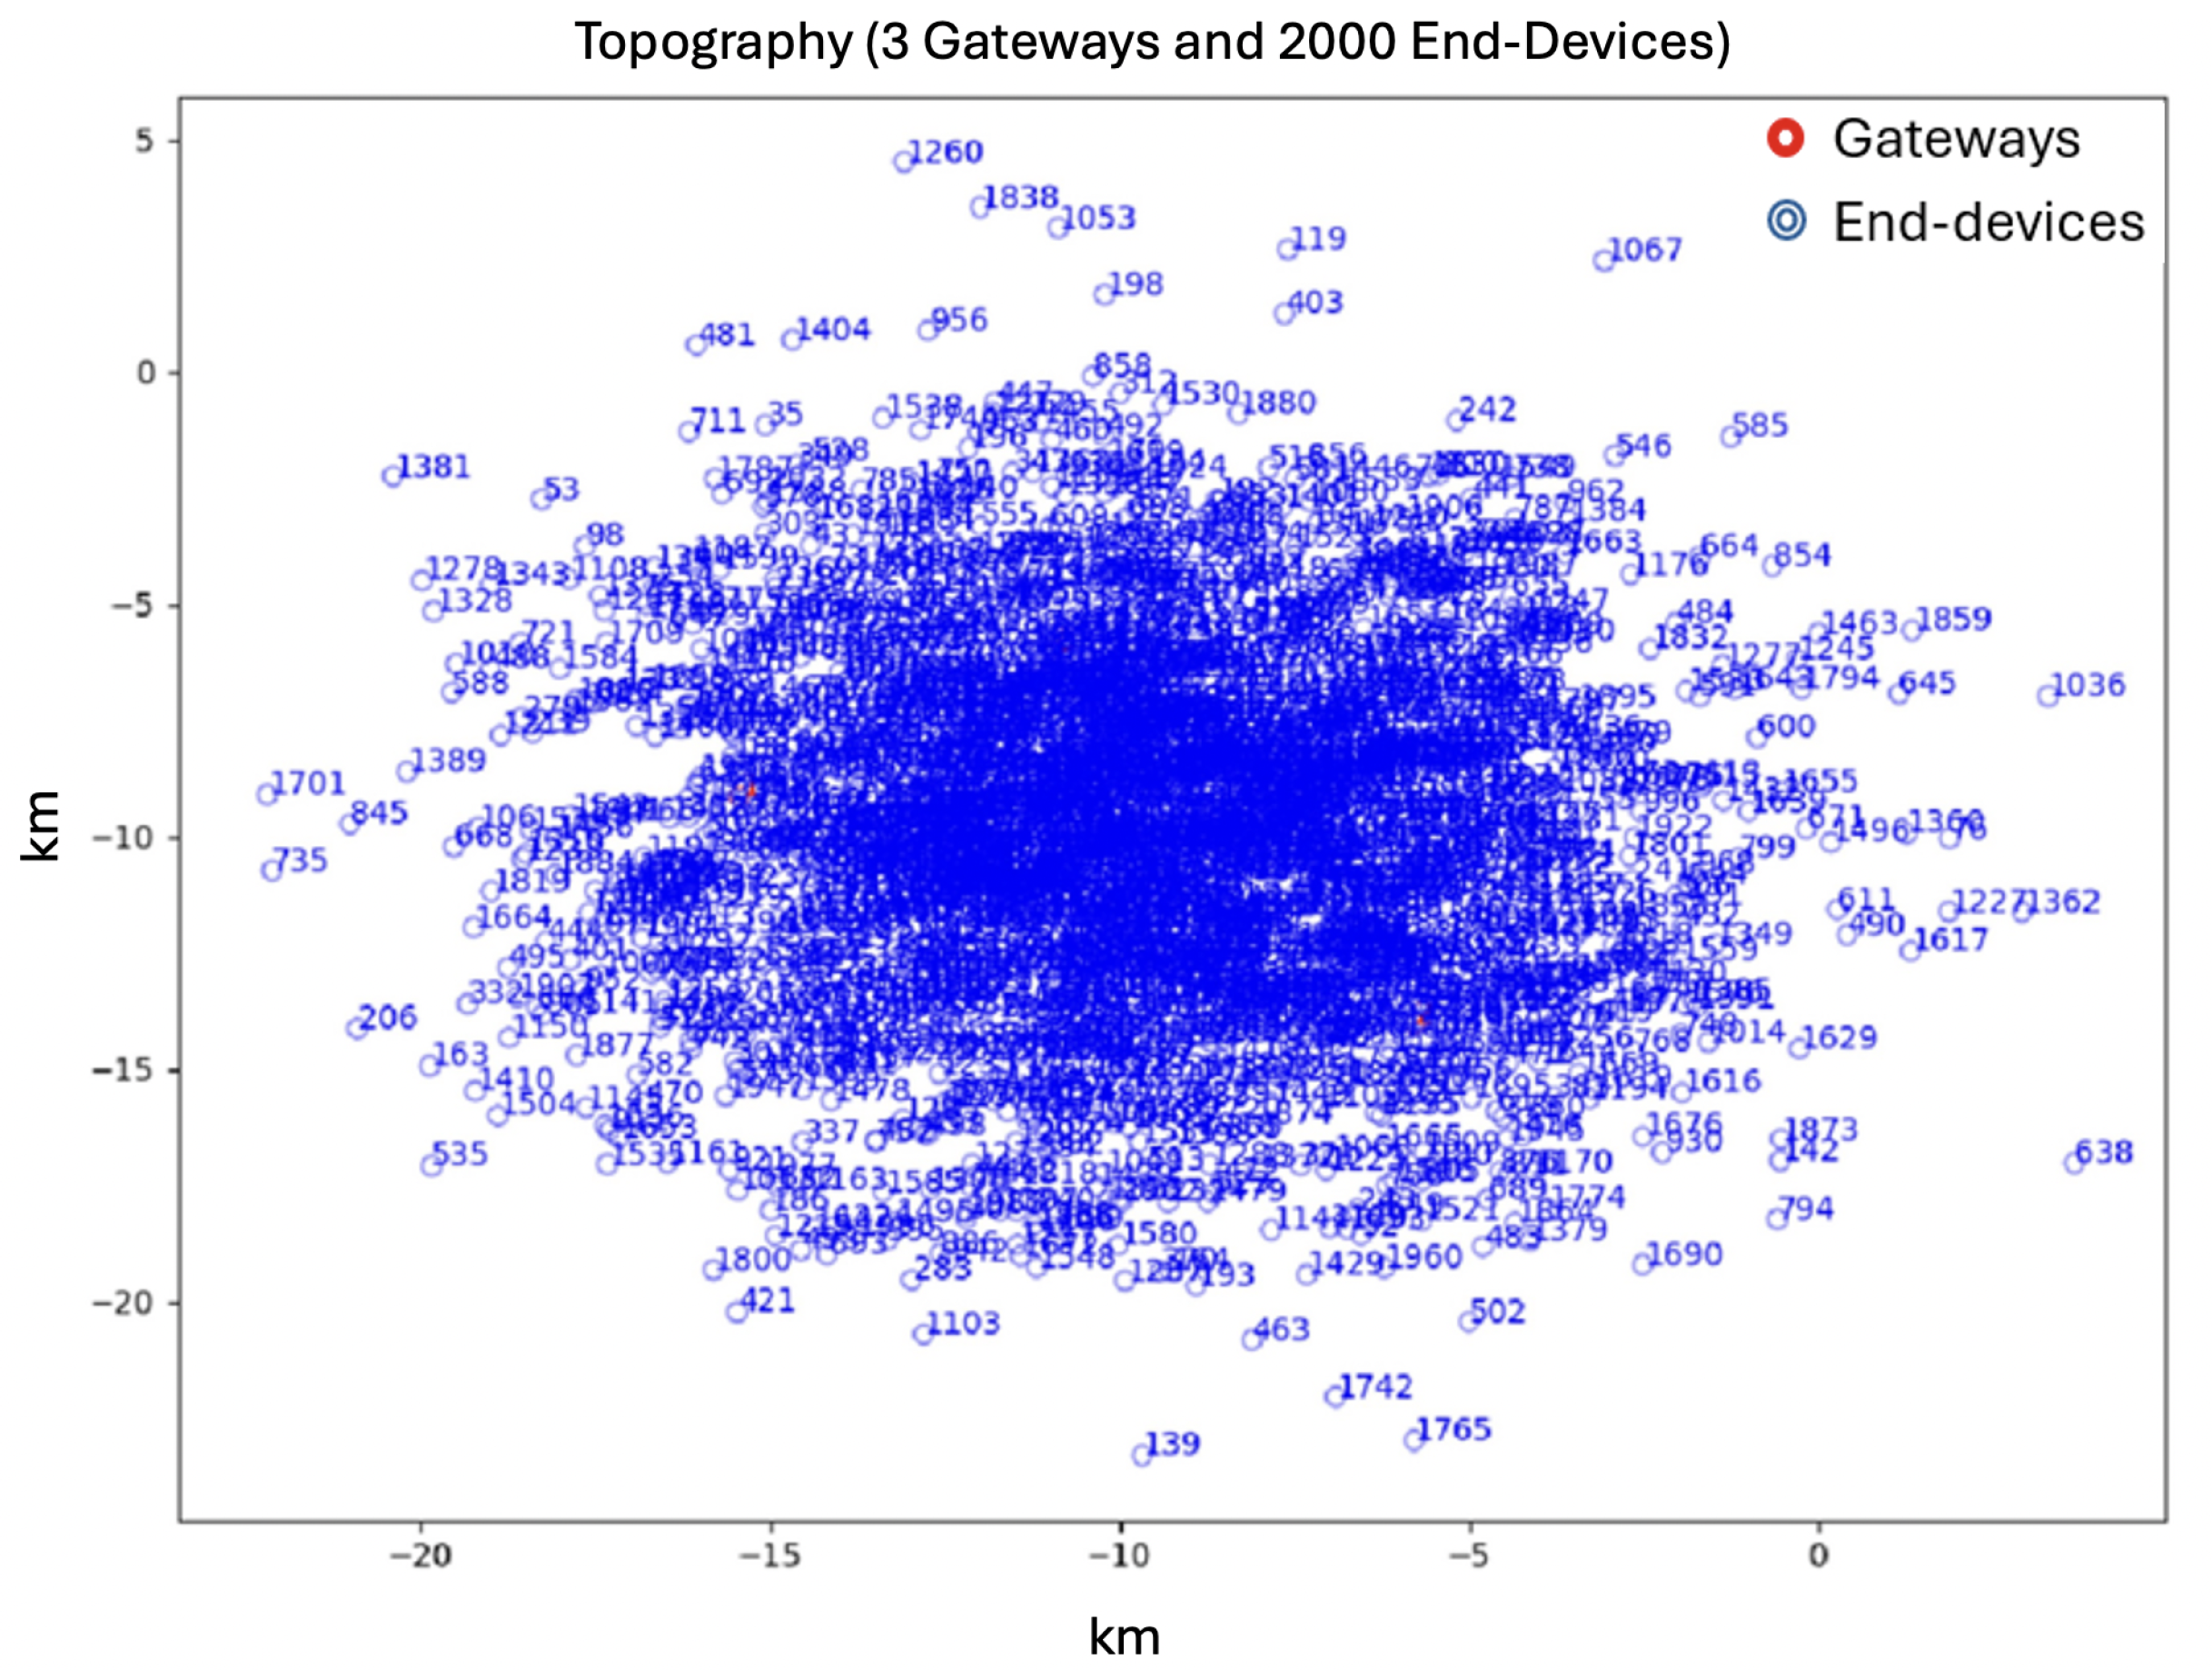
In
Figure 12, we tested a normal distribution for the spatial node positioning. The dimensions of the simulation area were set approximately as 25 km × 20 km. We opted for these dimensions knowing that due to the nature of the statistical distribution, the nodes will be scattered mainly in a squared area of 10 km × 10 km considering a LoRa range between 10 km and 20 km, as in the previous case above. In comparison with the previous distribution, the nodes are concentrated at the center of the area, providing insight for different types of applications with these types of operational characteristics.
Figure 13 reveals the differences in network lifespan and assigned nodes per GW for the normal distribution. Obviously, the GEOT algorithm entails longer network operation service times, due to the knowledge of the node-transmission schedule. The maximum number of cycles each GW can stay operational is almost 450 cycles for GW 0 and 1, while in the [
22] protocol it is 75 cycles. Concerning the number of nodes assigned to each GW, GEOT offers absolute balance between the nodes while the reference protocol ranges from 1417 to 1642 nodes per GW.
To examine the impact of node density, we conducted a series of simulation scenarios with 1000 and 3000 nodes under a normal spatial distribution. Although the placement of GWs plays a pivotal role in network performance, a representative case with GWs dispersed and positioned near the center of the region is illustrated in
Figure 14 and
Figure 15.
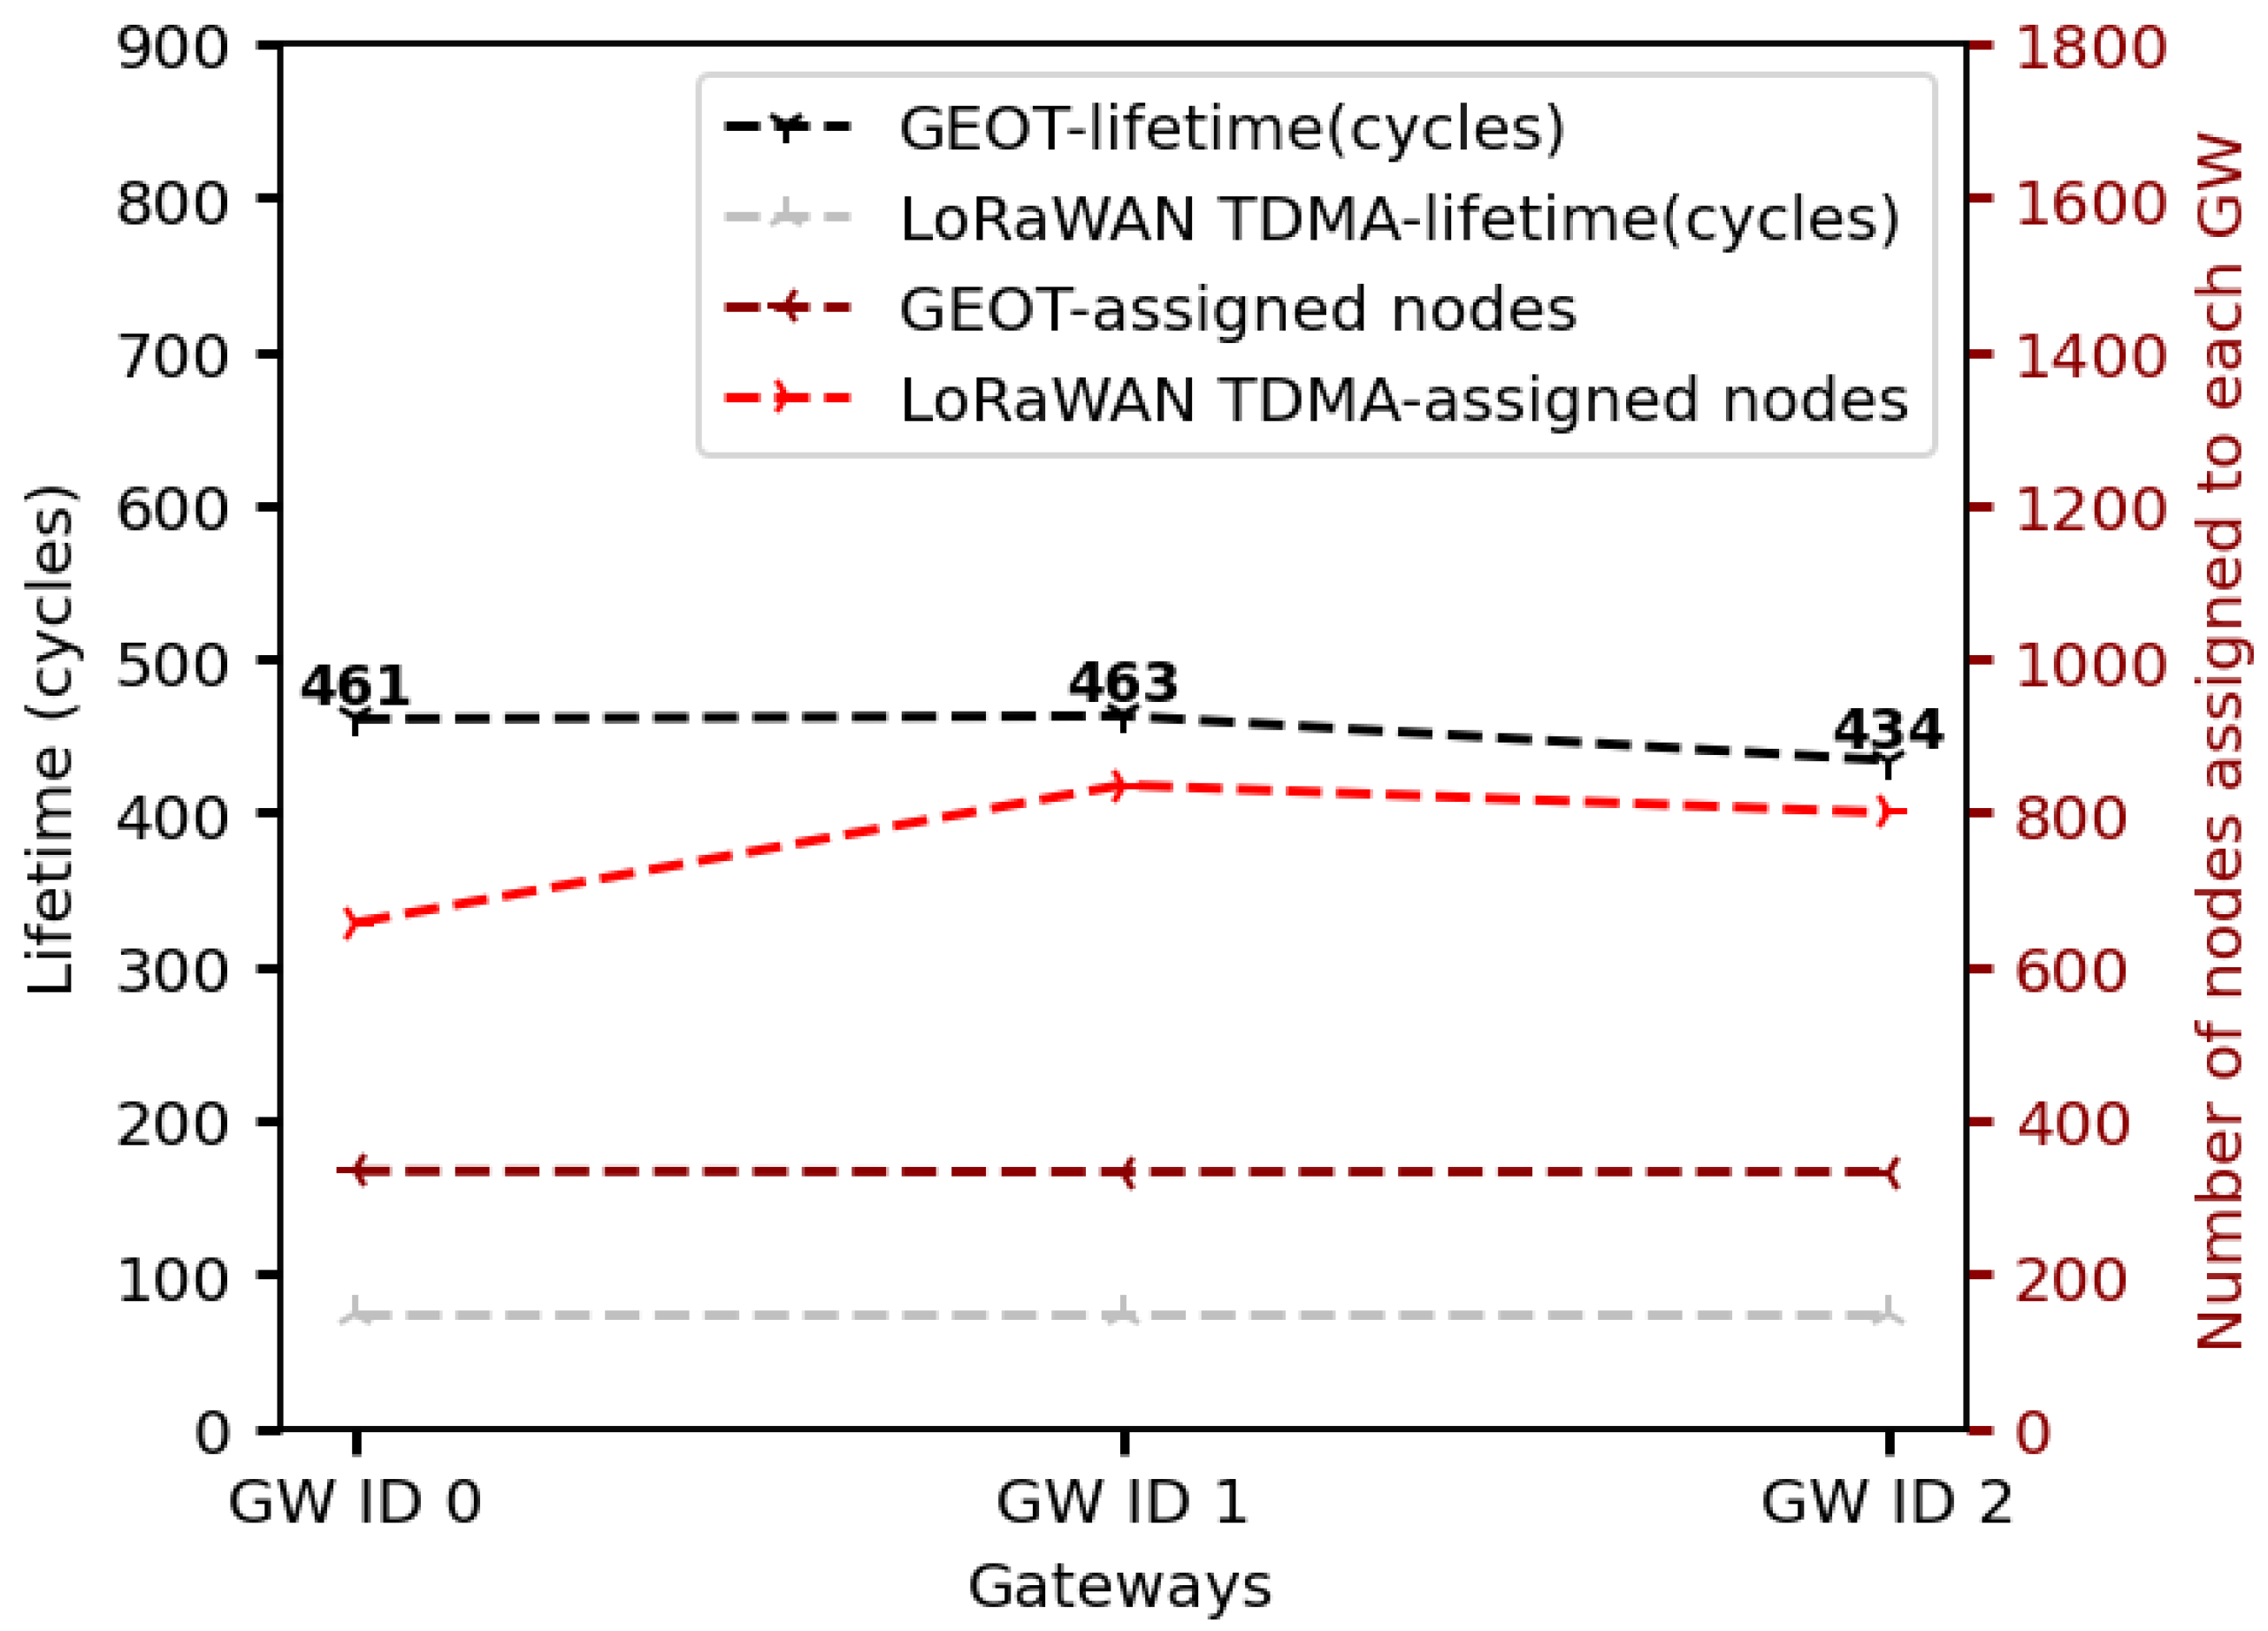
For the scenario with 1000 end devices following a normal spatial distribution, GEOT achieves a substantially higher GW lifetime compared to LoRaWAN TDMA (
Figure 14). Specifically, the measured lifetime of the three GWs under GEOT is 461, 463, and 434 cycles for GW0, GW1, and GW2, respectively, whereas LoRaWAN TDMA yields only 75 cycles for all GWs. This corresponds to an improvement of approximately 6× in operational lifetime. GEOT maintains this advantage by (i) explicitly assigning each end device to a single GW, thereby eliminating redundant uplink receptions at multiple GWs; (ii) employing a TDMA schedule that allows simultaneous transmissions on different spreading factors; and (iii) enabling GWs to remain in sleep mode outside their allocated reception windows, which significantly reduces idle listening energy. GW2 exhibits a slightly reduced lifetime (434 cycles) compared to GW0 and GW1, which is attributed to a higher share of end devices using higher spreading factors and thus longer time-on-air per frame, increasing its per-cycle energy cost. In terms of load distribution, GEOT assigns the end devices nearly uniformly across GWs (approximately one third of the 1000 nodes per GW). In contrast, the baseline LoRaWAN TDMA configuration results in an unbalanced effective association of roughly 330, 425, and 400 nodes for GW0, GW1, and GW2, respectively, due to overlapping coverage regions. This uneven load concentration in LoRaWAN TDMA stresses specific GWs earlier and further limits their lifetime. Overall, even at this lower network density (1000 nodes), the observed trends are consistent with the 2000-node case: GEOT not only prolongs GW lifetime but also balances the served node population across GWs, whereas LoRaWAN TDMA exhibits both reduced lifetime and less uniform node distribution. The GW lifetime under LoRaWAN-TDMA remains approximately 75 cycles in all cases, as the GWs remain active throughout the entire operation, resulting in identical energy consumption and lifespan.
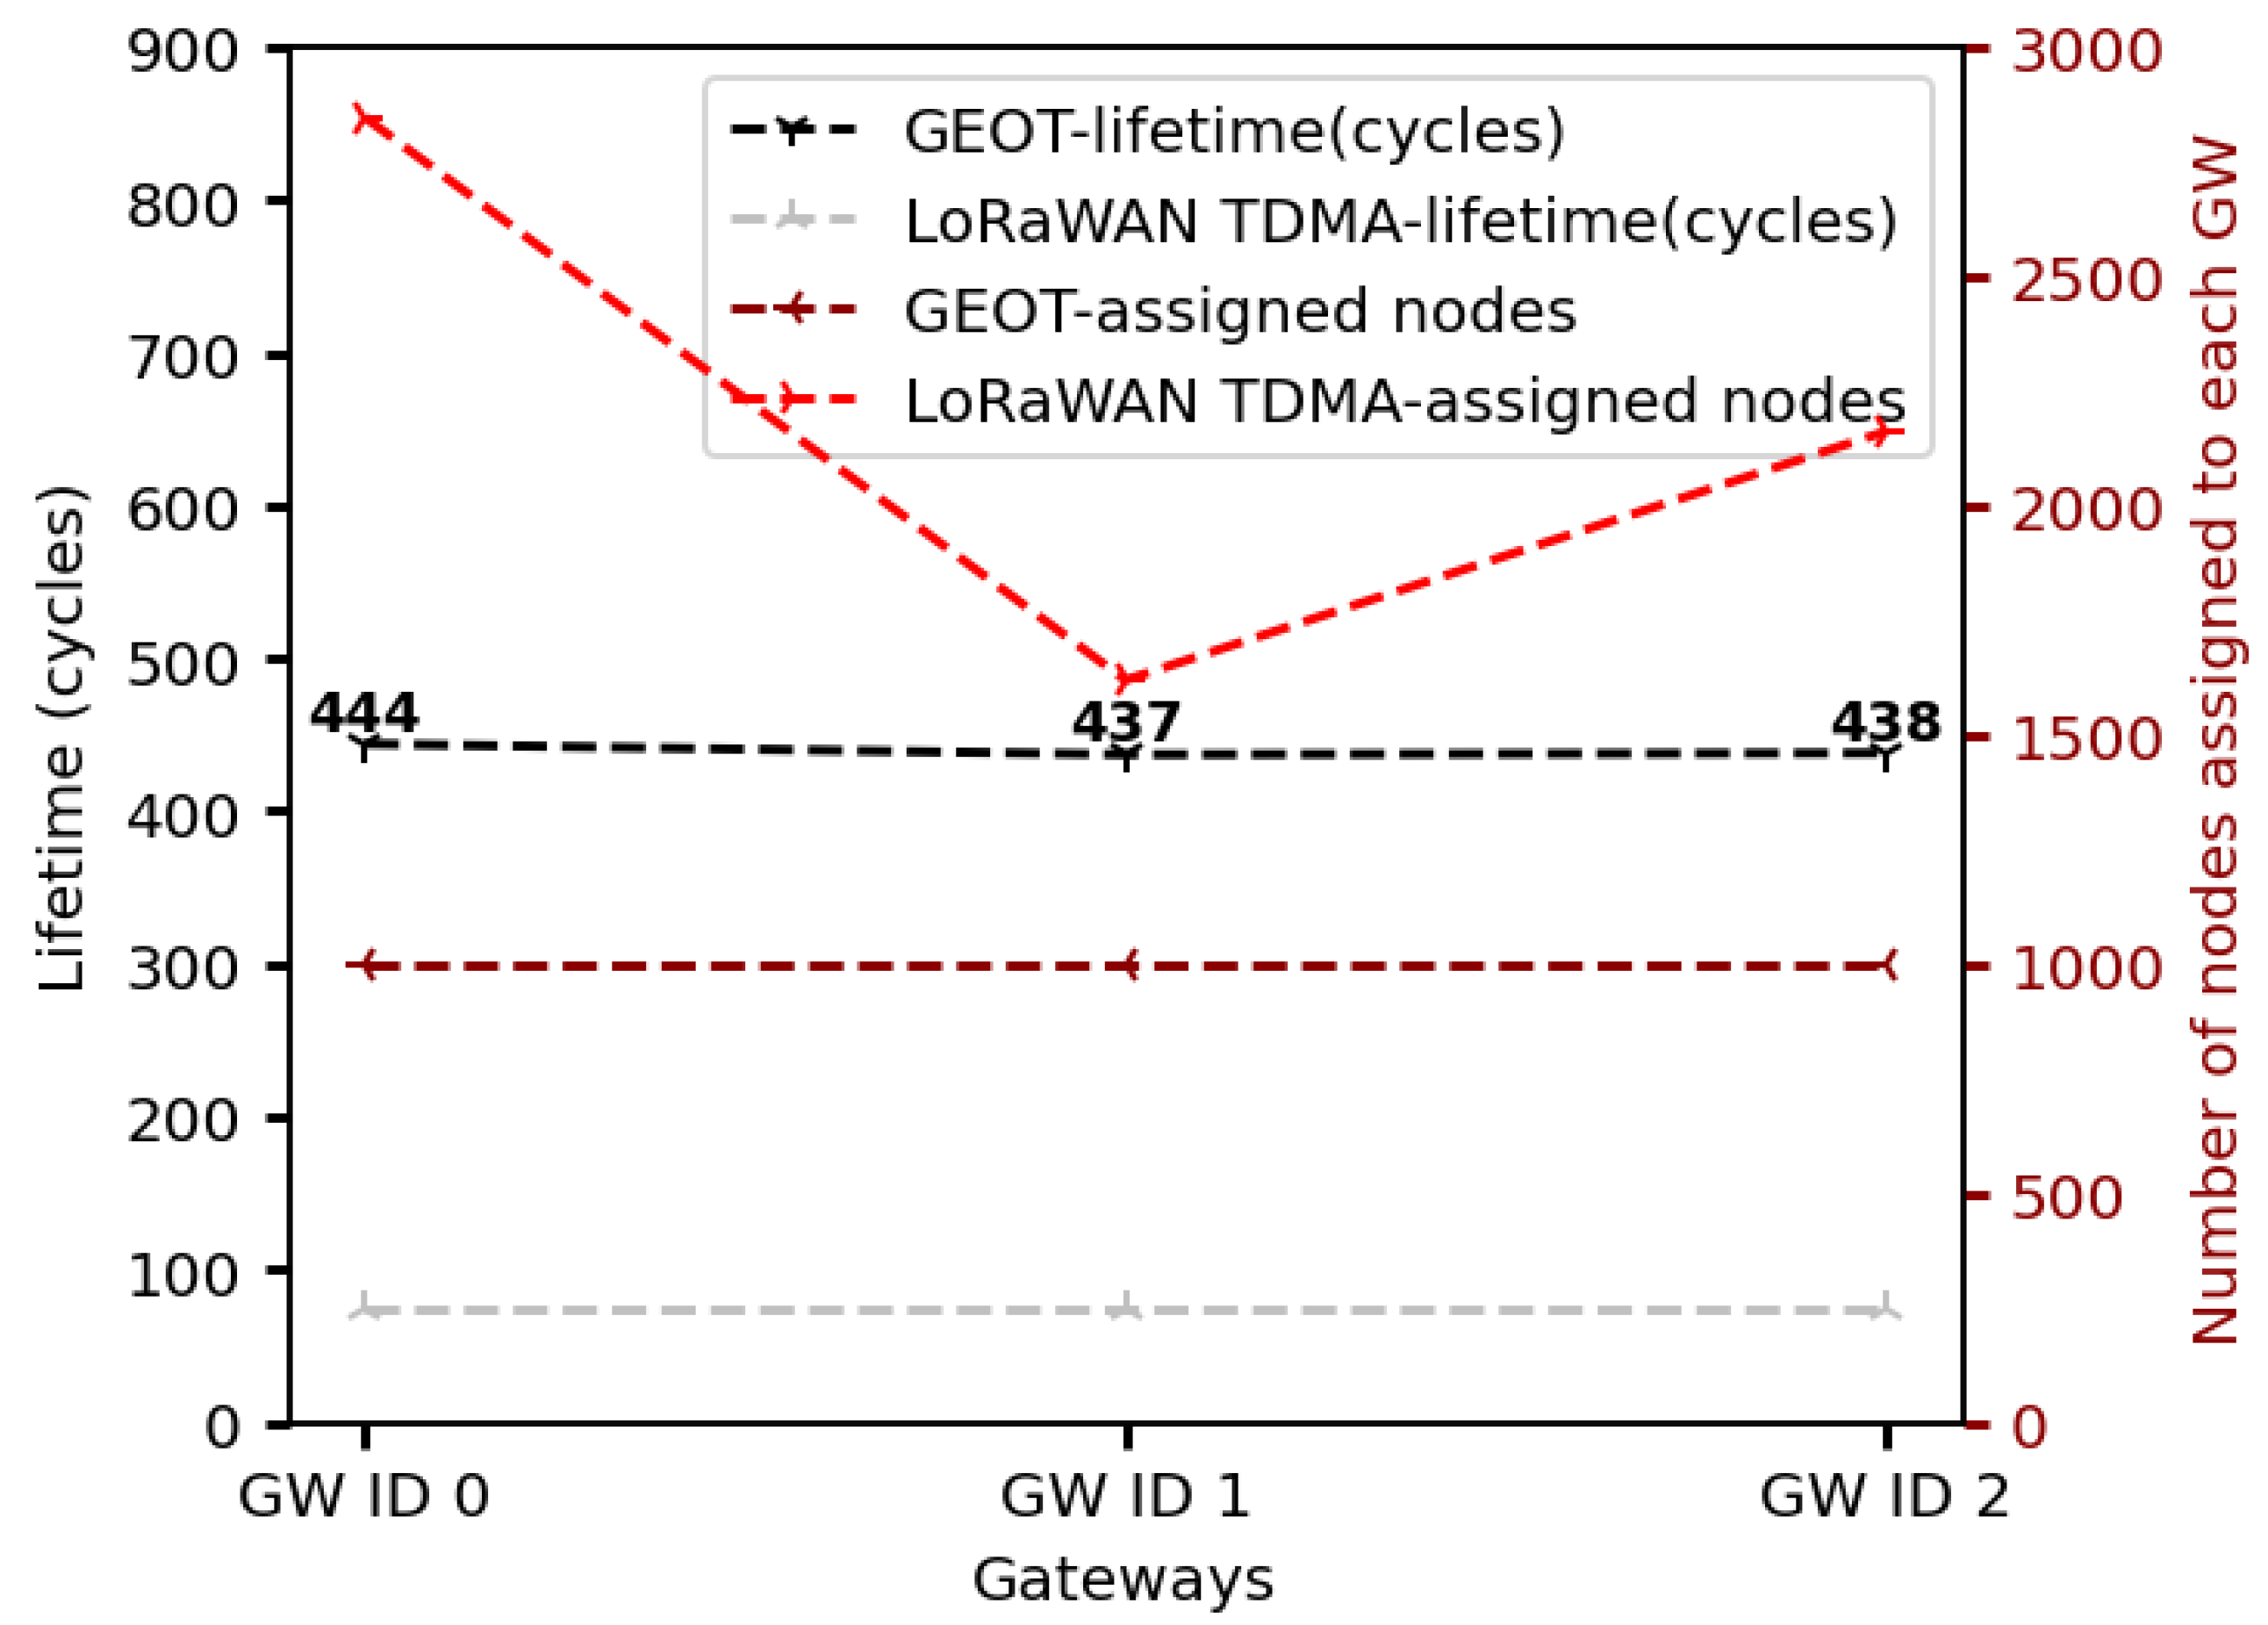
In the case of 3000 nodes as shown in
Figure 15, GEOT keeps the served load evenly balanced, assigning approximately one third of the total population (1000 nodes) to each GW while LoRaWAN TDMA exhibits a highly skewed effective association pattern. Importantly, the GW lifetime under GEOT remains in the 440-cycle range even at 3000 nodes, confirming that GEOT scales to higher network densities without sacrificing either lifetime or fairness across GWs.
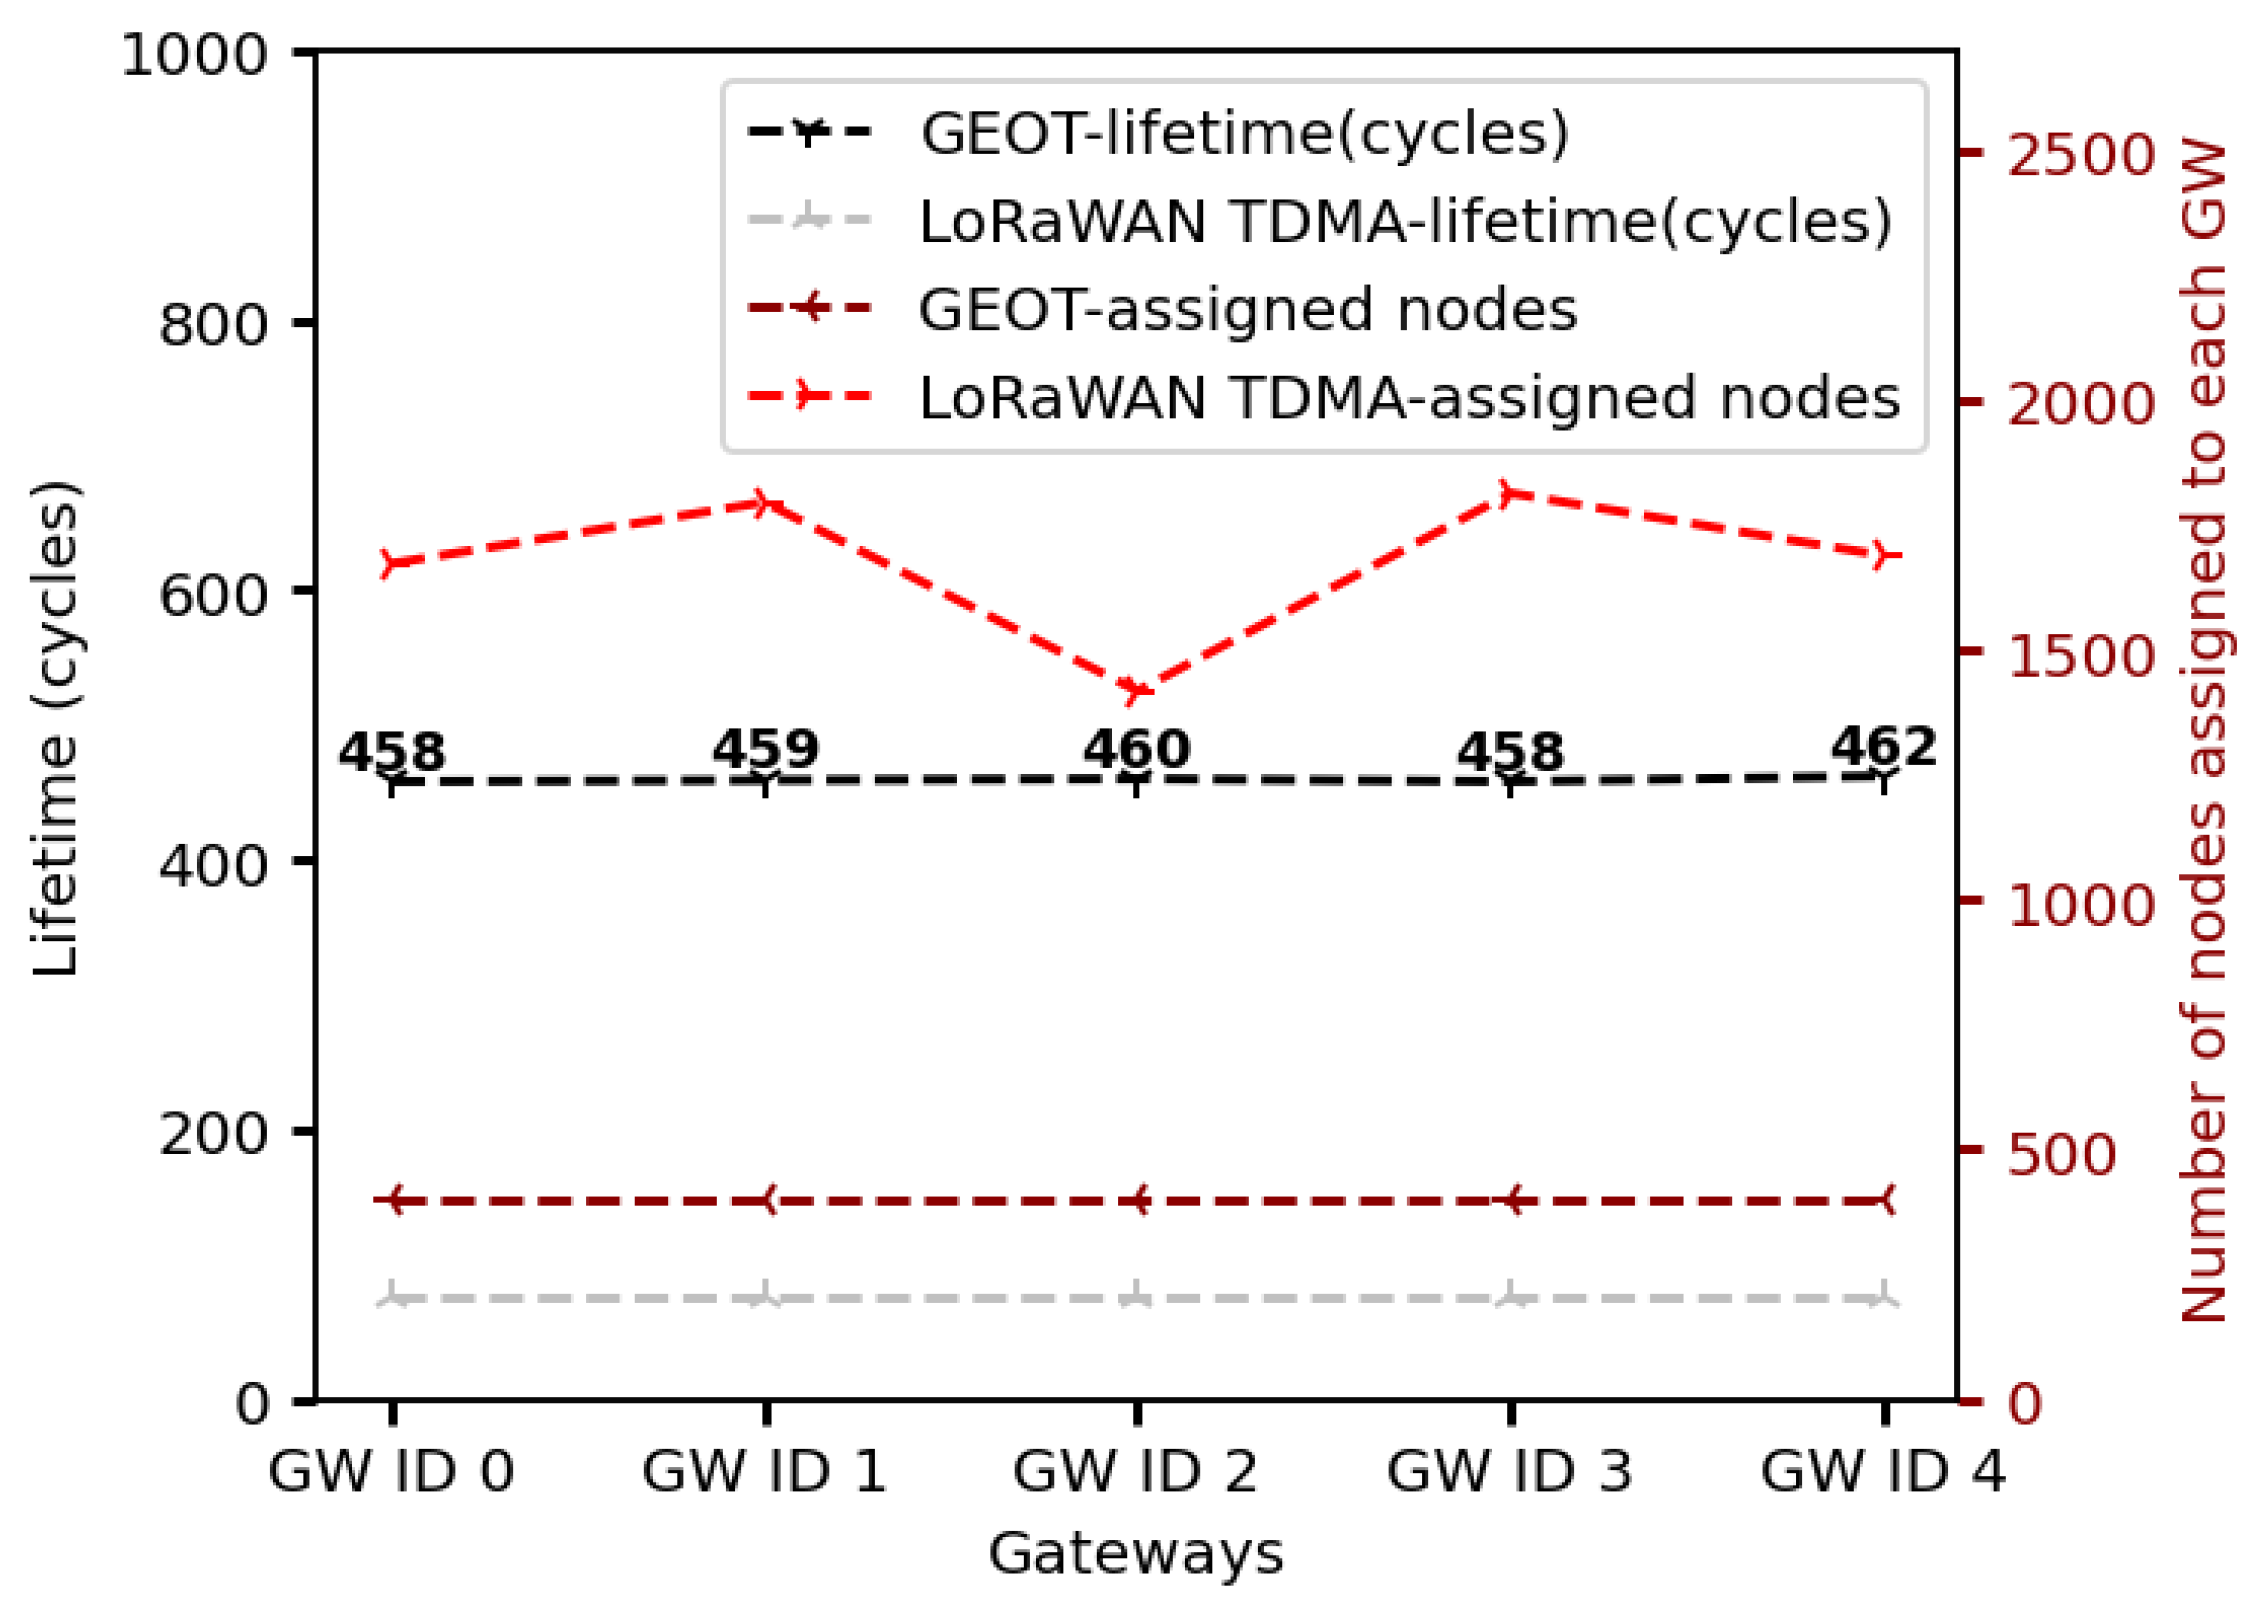
Figure 16 shows the GW lifetime and node assignment for the normal spatial distribution when we scale the infrastructure to five GWs and deploy 2000 end devices. GEOT sustains a nearly uniform lifetime across all GWs, with GW0–GW4 reaching 458, 459, 460, 458, and 462 cycles, respectively. In contrast, the baseline LoRaWAN TDMA configuration again achieves only on the order of 75 cycles per GW. This means GEOT extends GW operational lifetime by roughly a factor of six, even when the number of GWs increases.
The key reason is load shaping. Under GEOT, node association is explicitly coordinated so that each of the five GWs is assigned approximately one fifth of the total population (400 nodes per GW). This even partitioning allows each GW to (i) listen only during its scheduled TDMA reception windows, (ii) collect collision-free uplinks organized by the spreading factor, and (iii) remain in sleep mode the rest of the time, significantly reducing idle energy draw. By contrast, in LoRaWAN TDMA the effective number of end devices served by each physical GW is both much higher and unbalanced, with some GWs logically “seeing” around 1800+ nodes due to overlapping coverage and redundant receptions, while others see notably fewer. This imbalance forces certain GWs to remain active longer and process far more traffic, which accelerates their energy depletion and limits lifetime.
From the above, we conclude that the lifetime benefit of GEOT generalizes beyond the 3 GW scenarios: adding more GWs does not erode GEOT’ s energy advantage.
5.3. Other Distributions
For the grid distribution, shown in
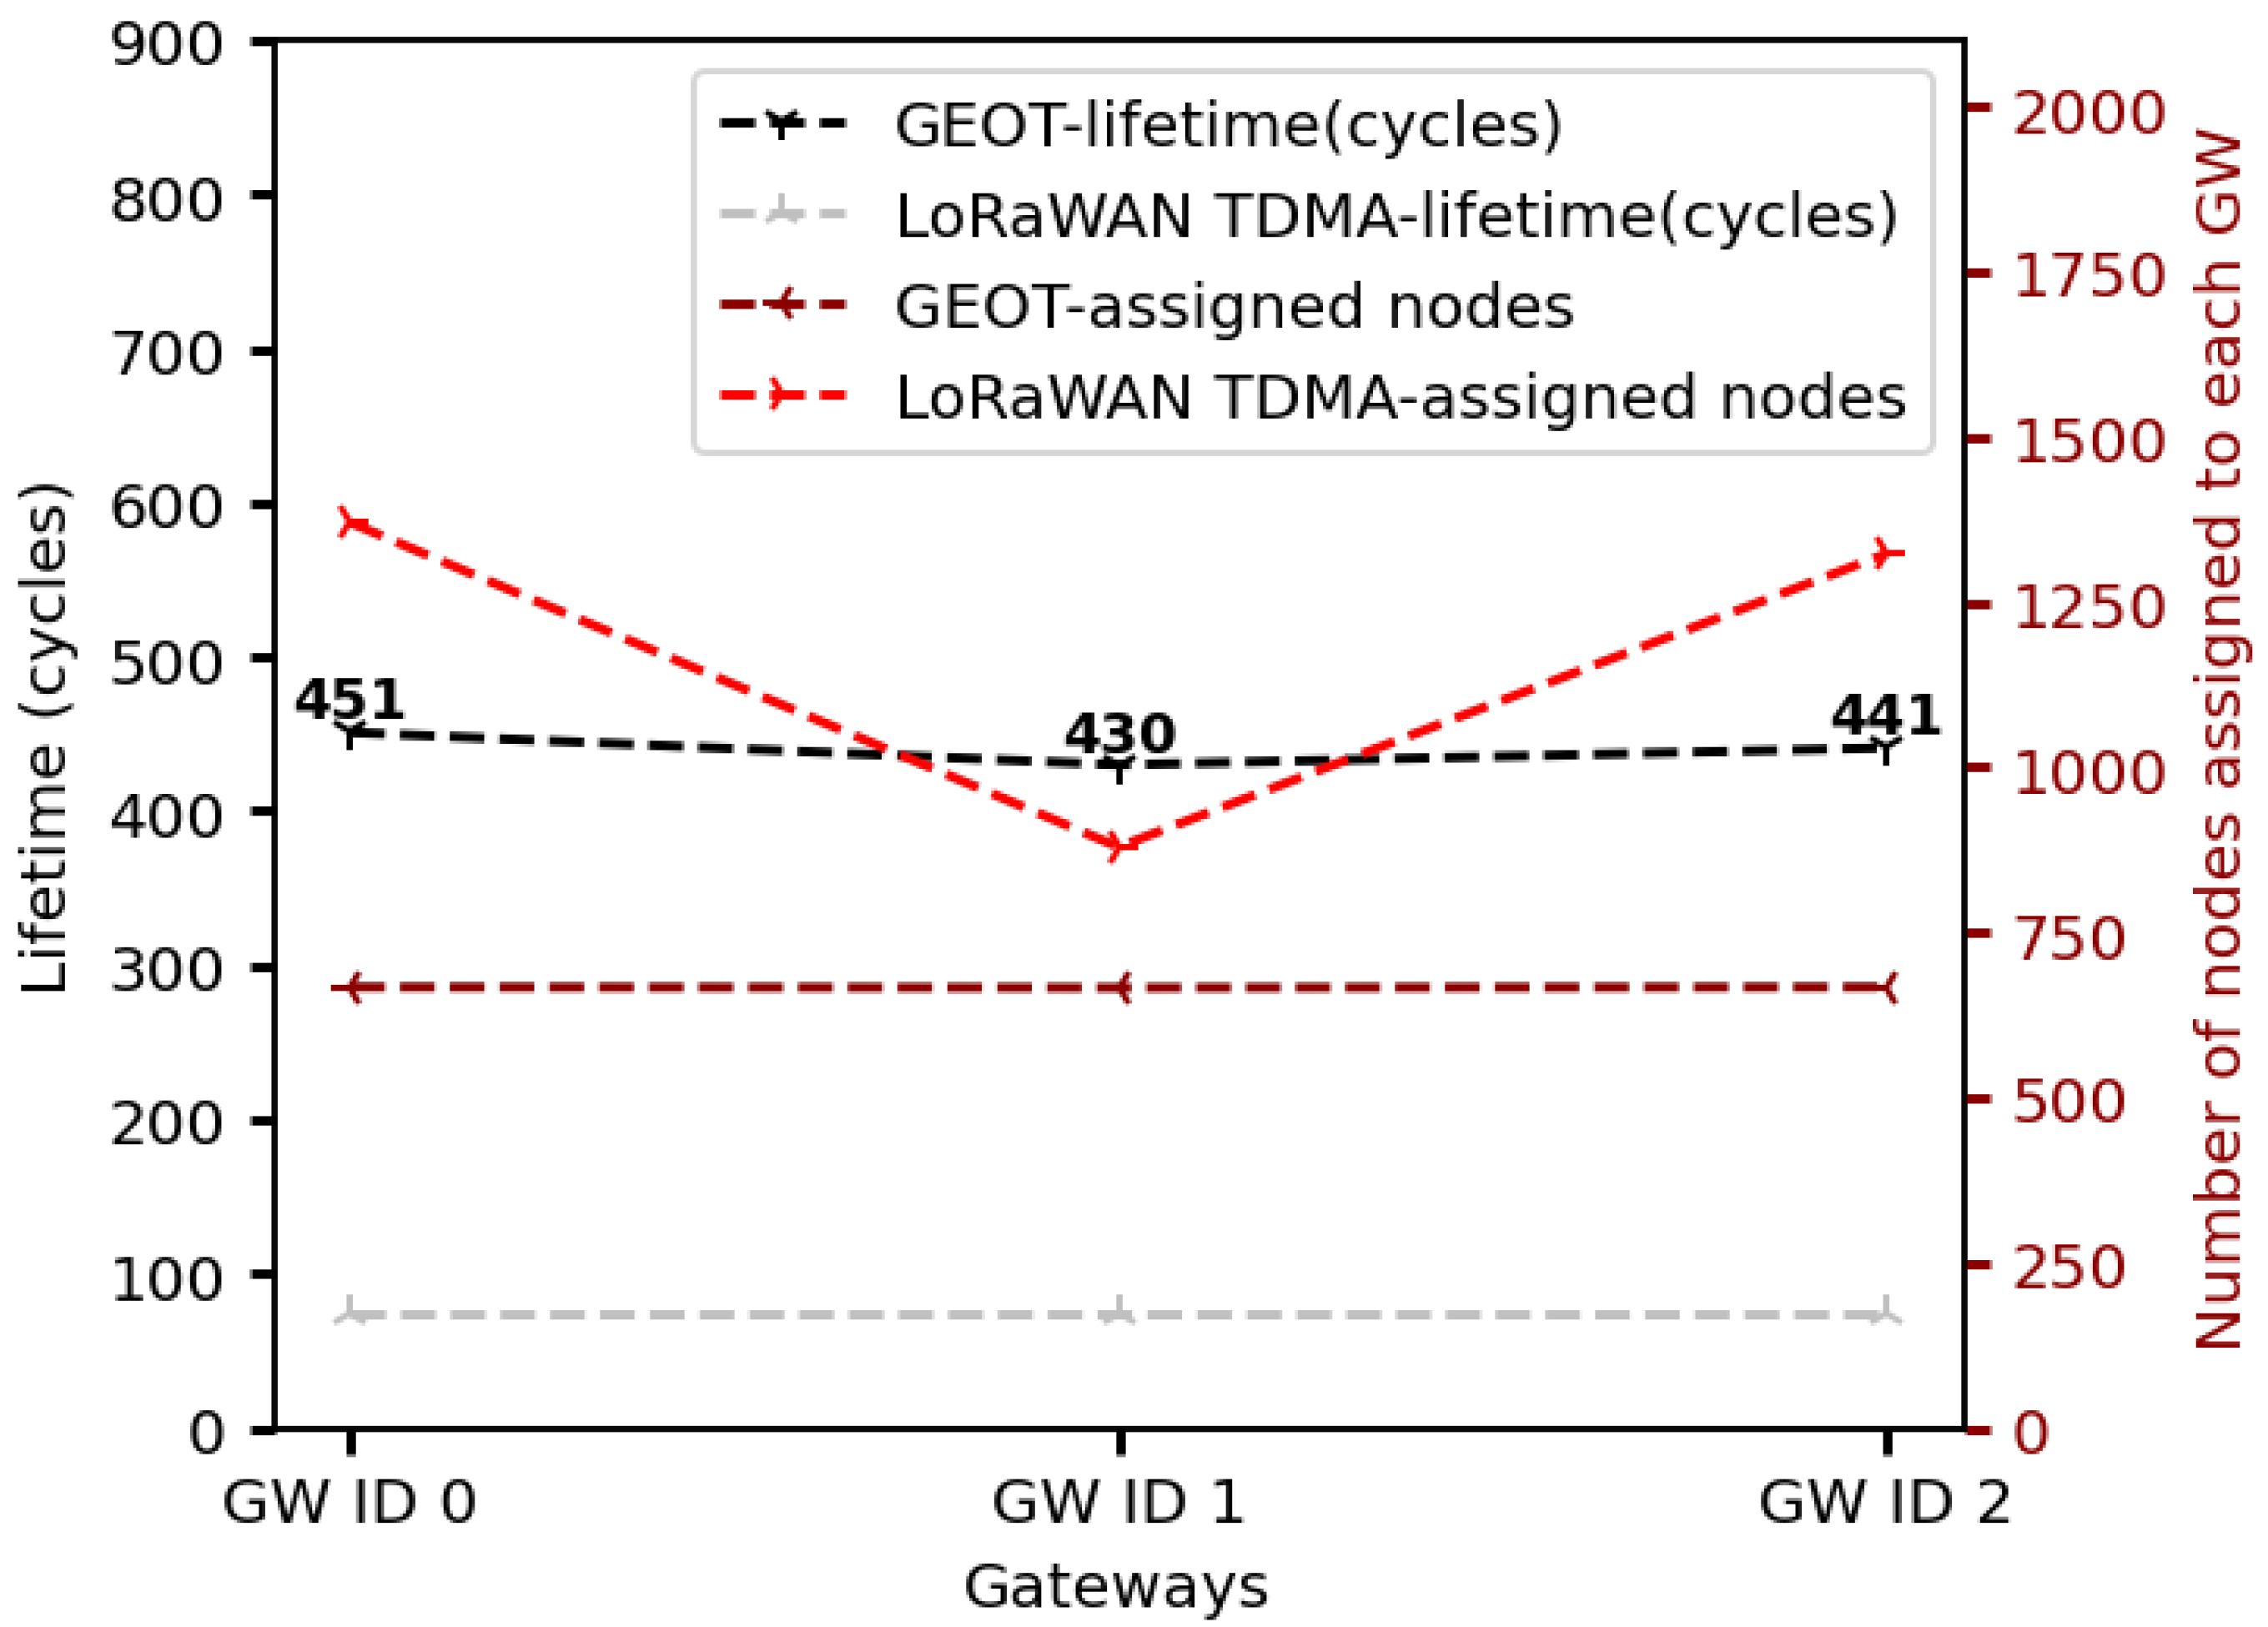
Figure 17, the nodes are deterministically placed across the squared area, forming a regular lattice. This results in an almost ideal load balancing between the three GWs under the GEOT protocol, since each GW is assigned approximately the same number of nodes (around 666), as depicted in
Figure 18. Consequently, the energy consumption among the GWs remains highly uniform, leading to network lifetimes of 451, 430, and 441 cycles, respectively. In contrast, the LoRaWAN TDMA approach again produces significant asymmetry in node assignment, with some GWs receiving more than 1300 nodes while others serve fewer than 700, which directly accelerates energy depletion. The deterministic nature of the grid distribution highlights scenarios where this setup would be applicable, such as smart agriculture fields with equally spaced sensors, precision environmental monitoring, or industrial sites where devices are deployed in a structured manner and military facilities. In such cases, the GEOT protocol proves especially effective, as it leverages the inherent regularity of the deployment to extend network lifespan and ensure balanced resource utilization.
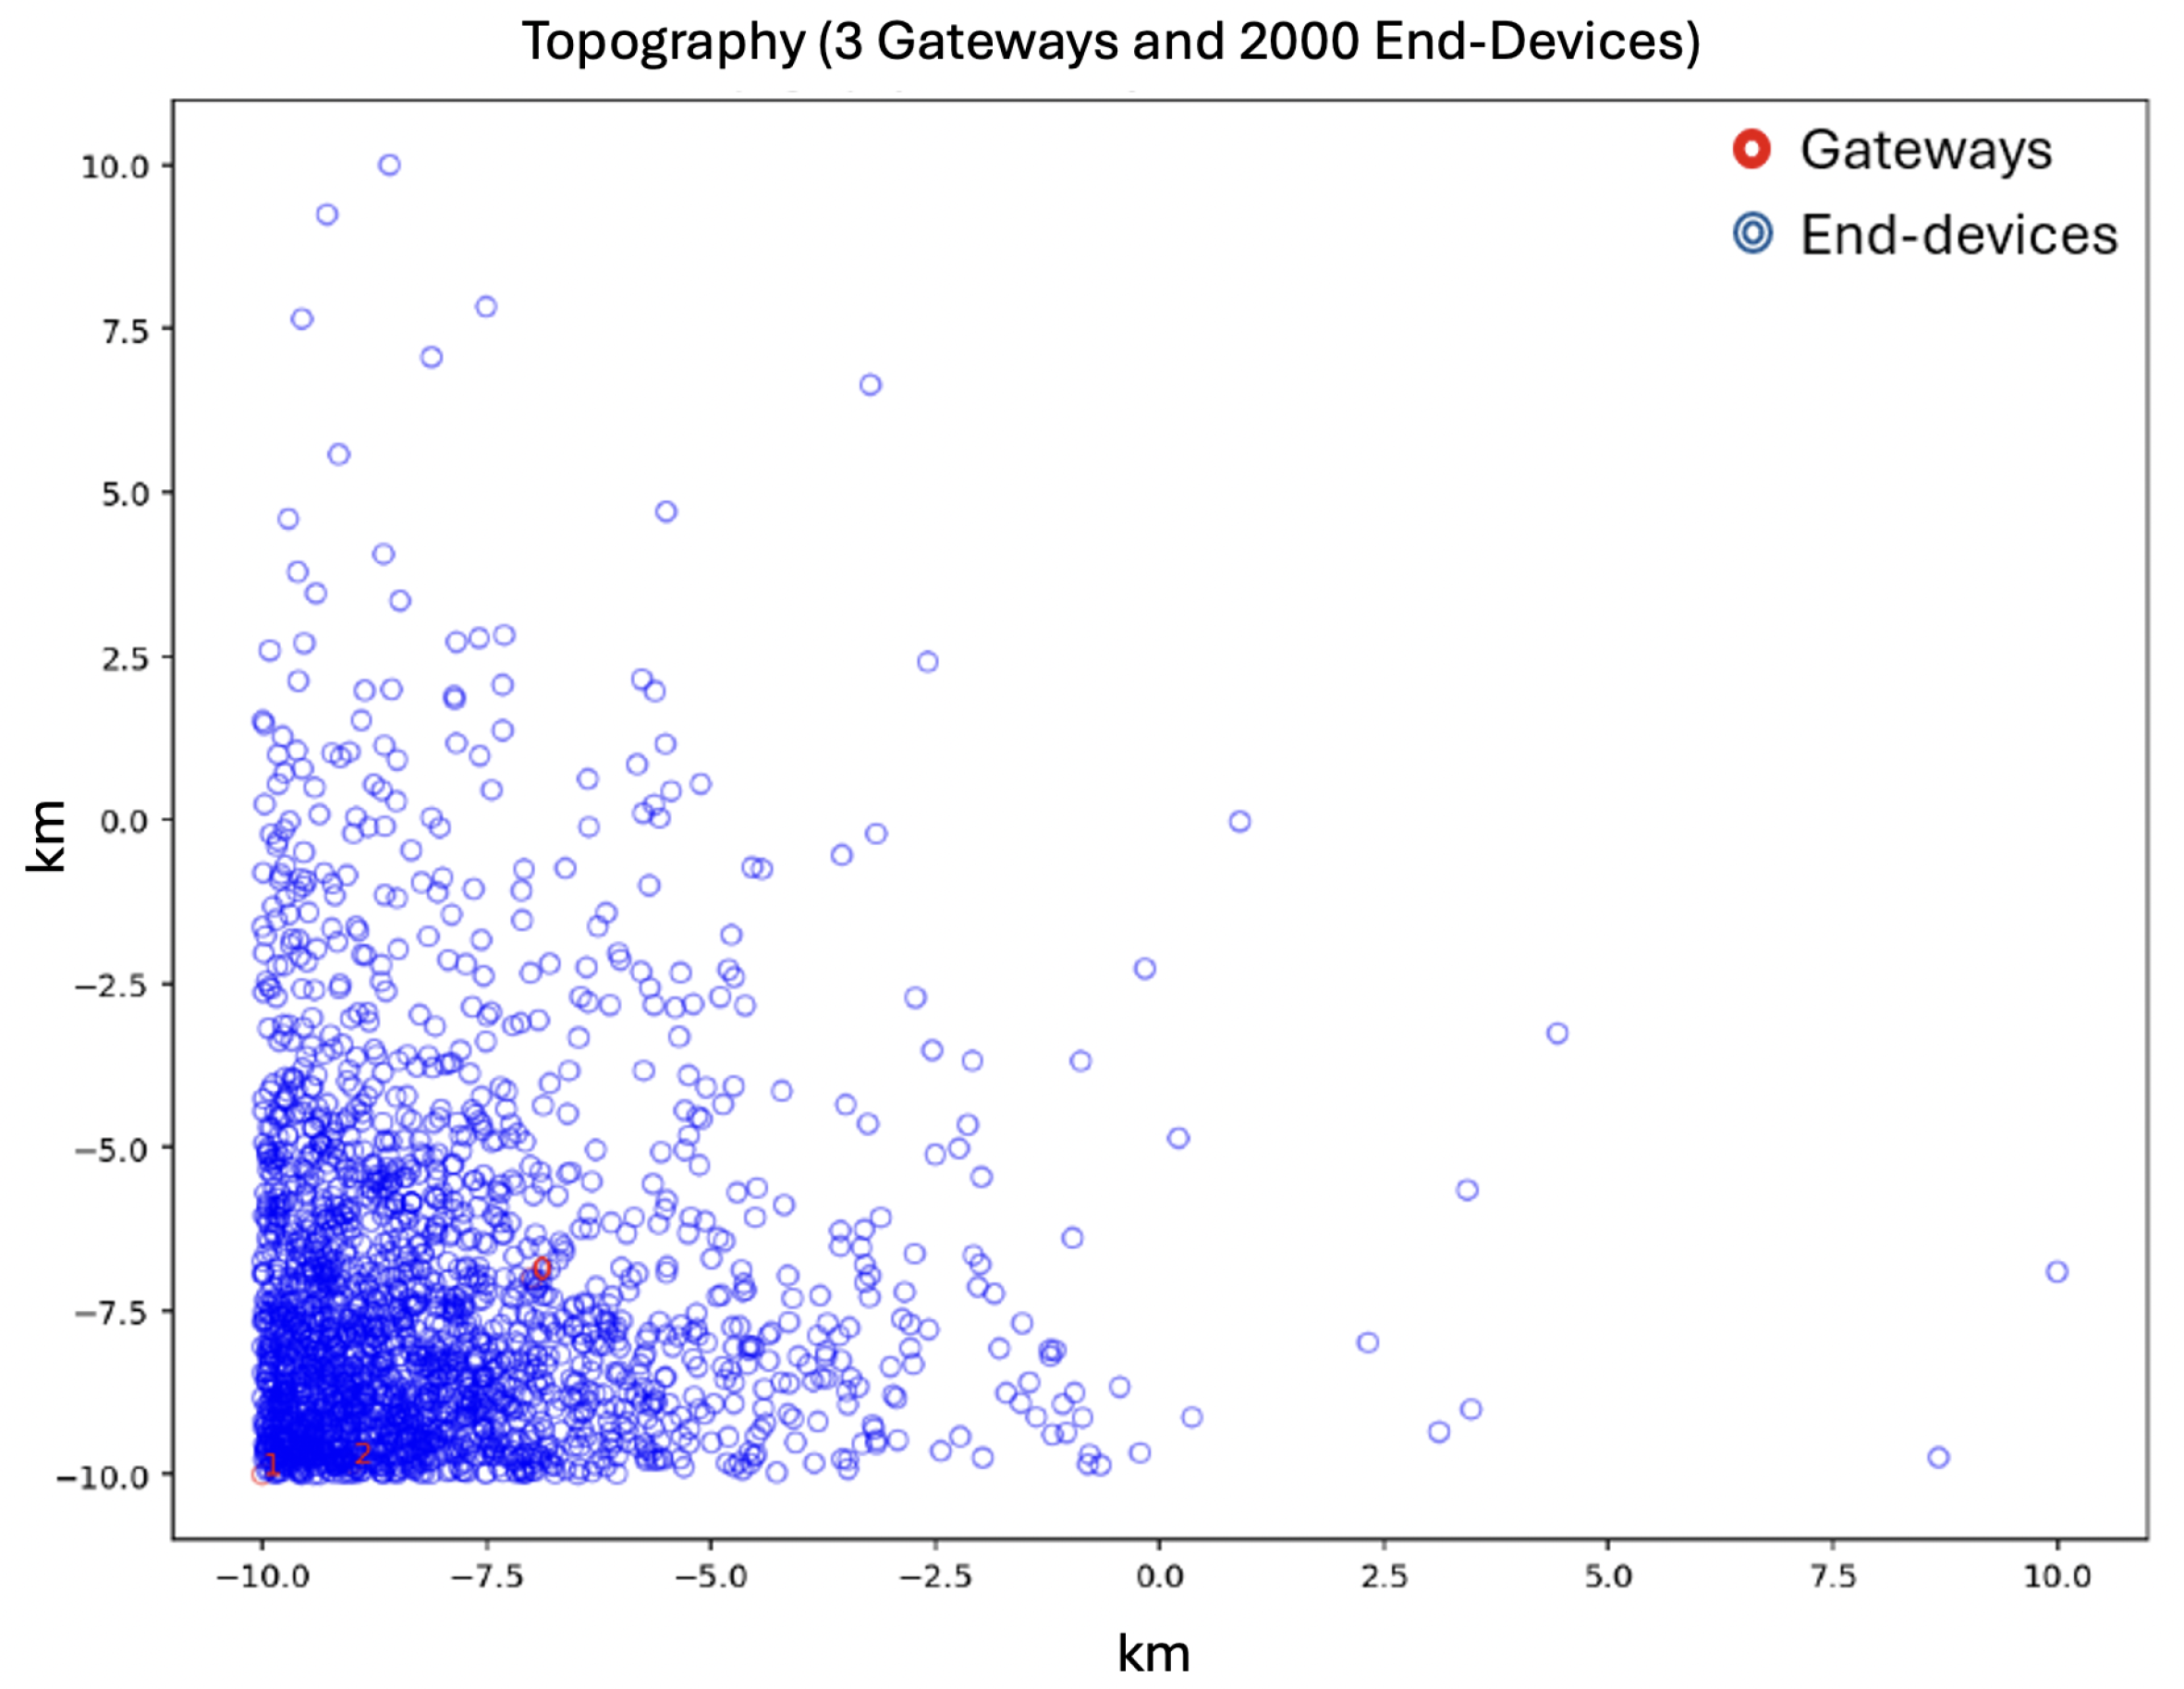
For the Pareto distribution shown in
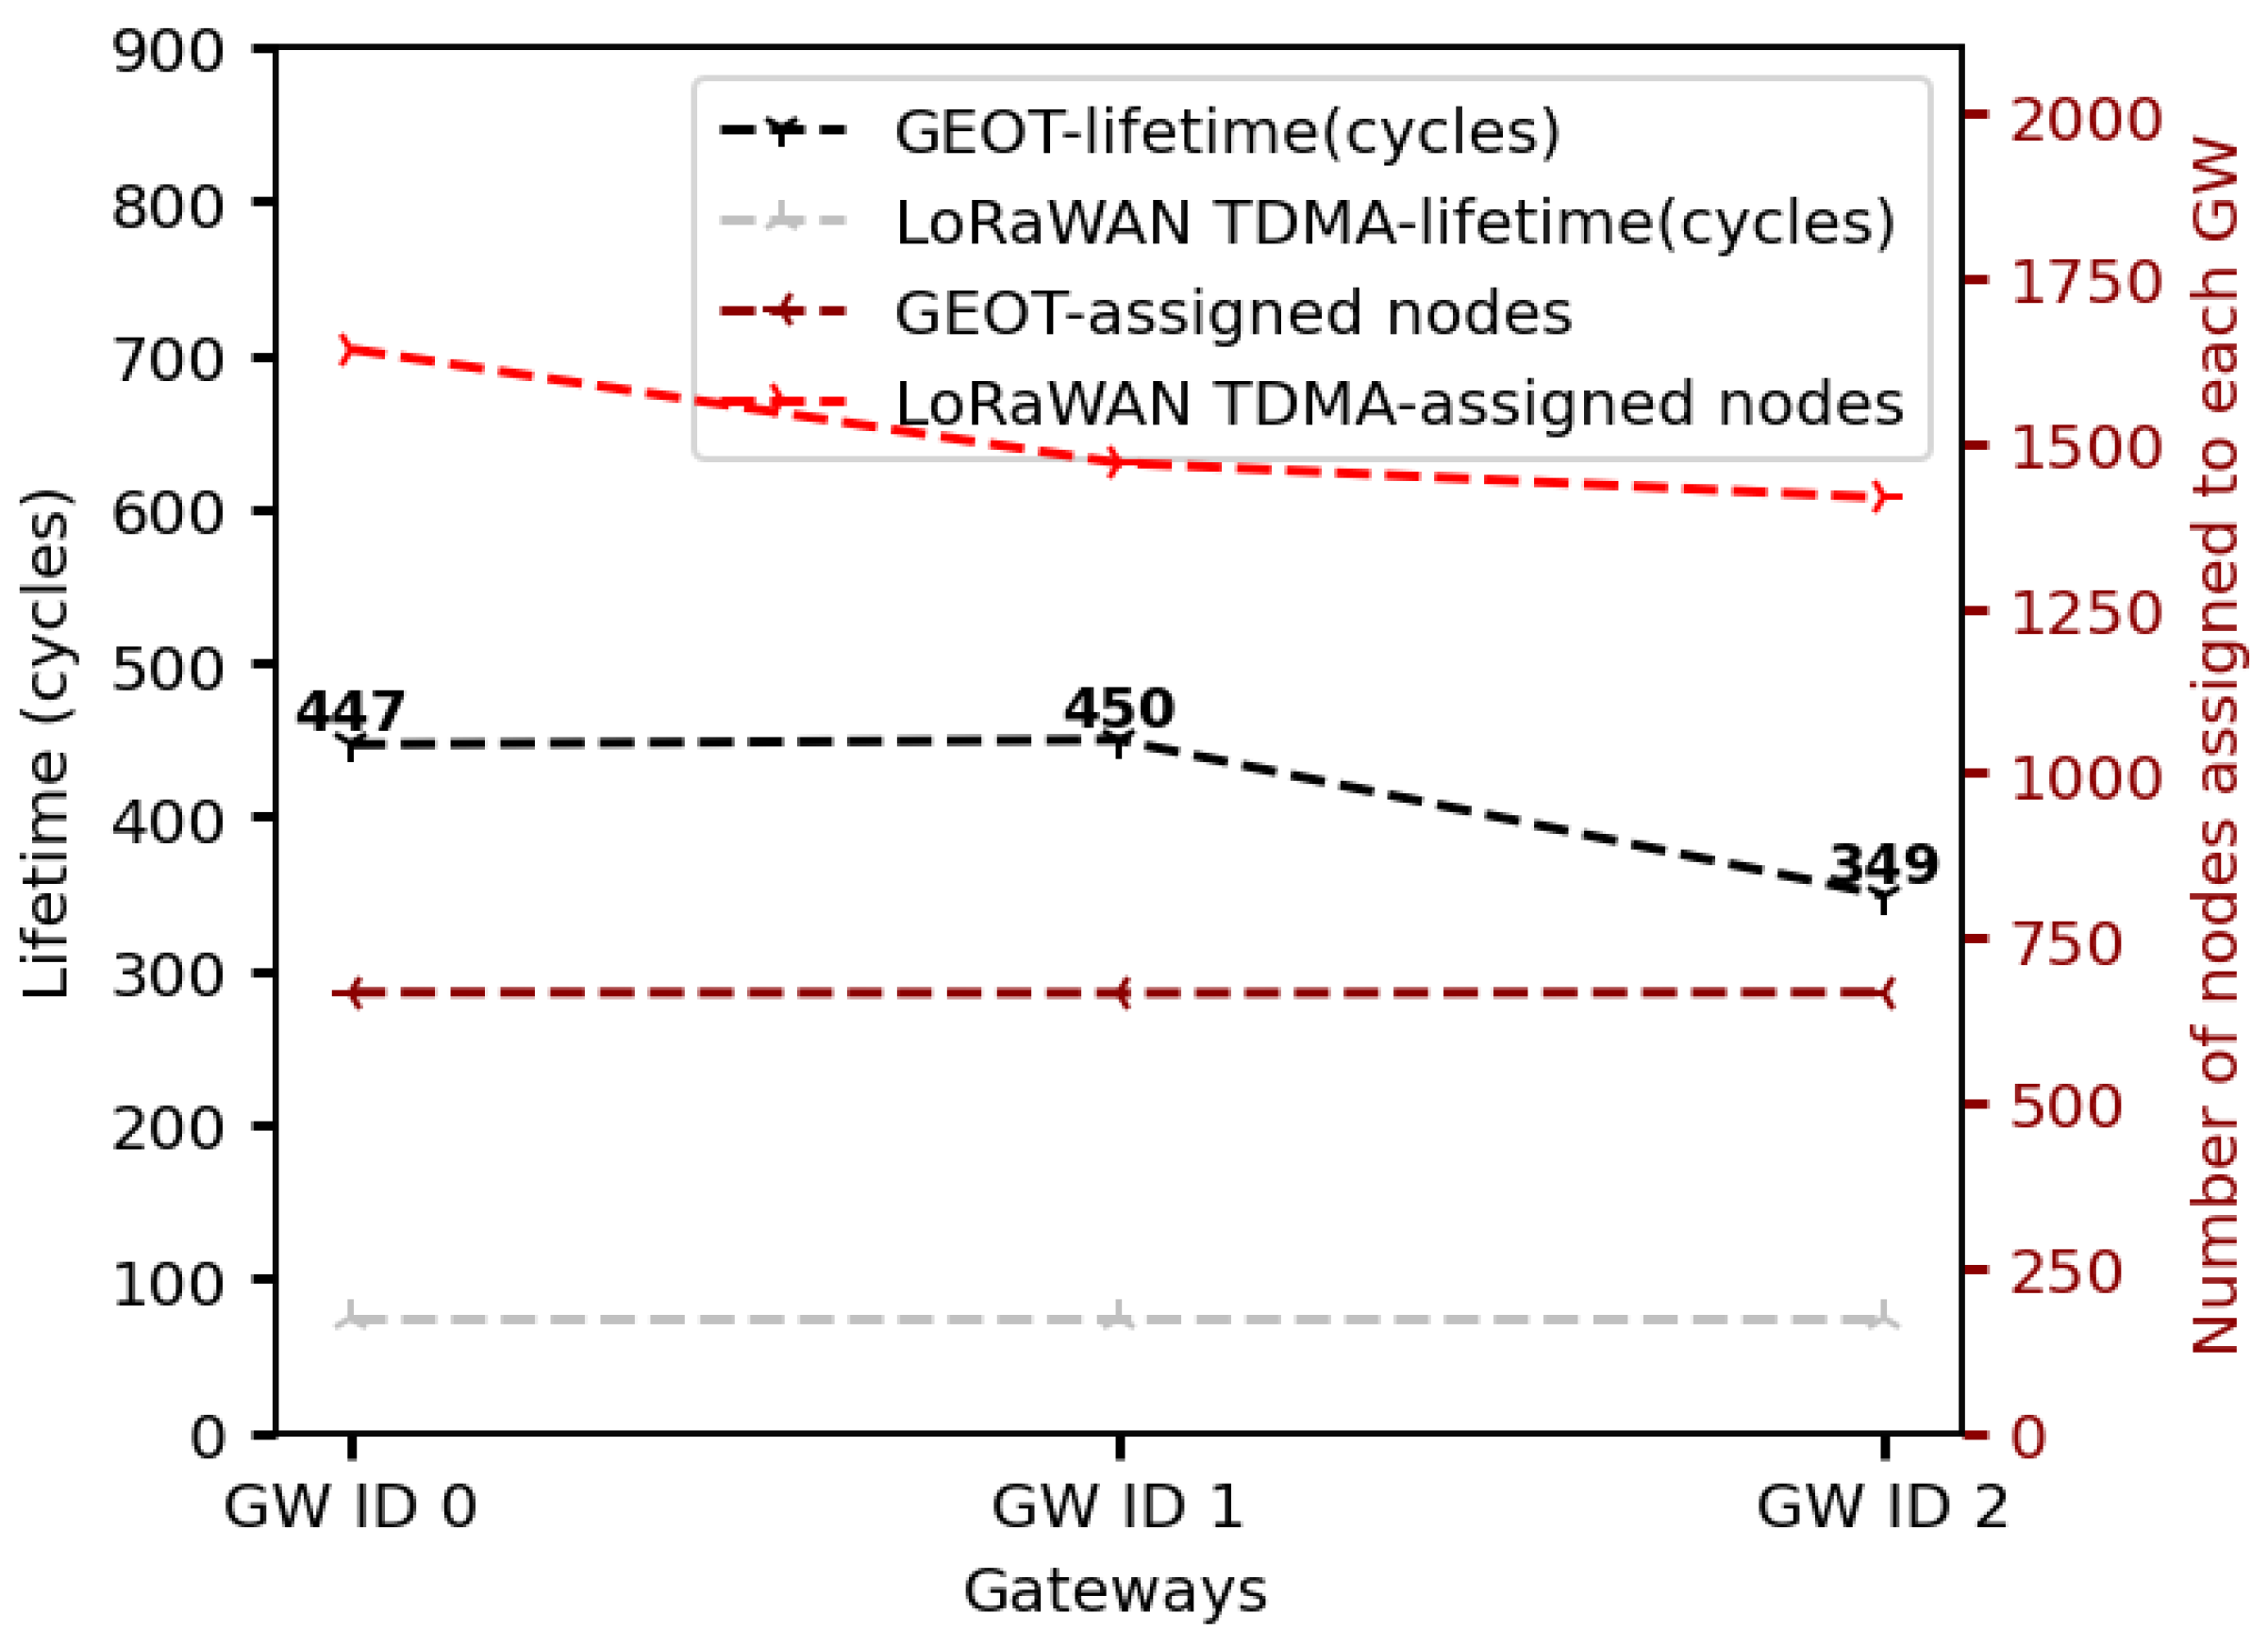
Figure 19, the nodes are unevenly clustered, leading to a heavy-tailed placement where certain regions contain significantly more devices than others. This irregularity directly affects the load sharing among the three GWs under the GEOT protocol. As illustrated in
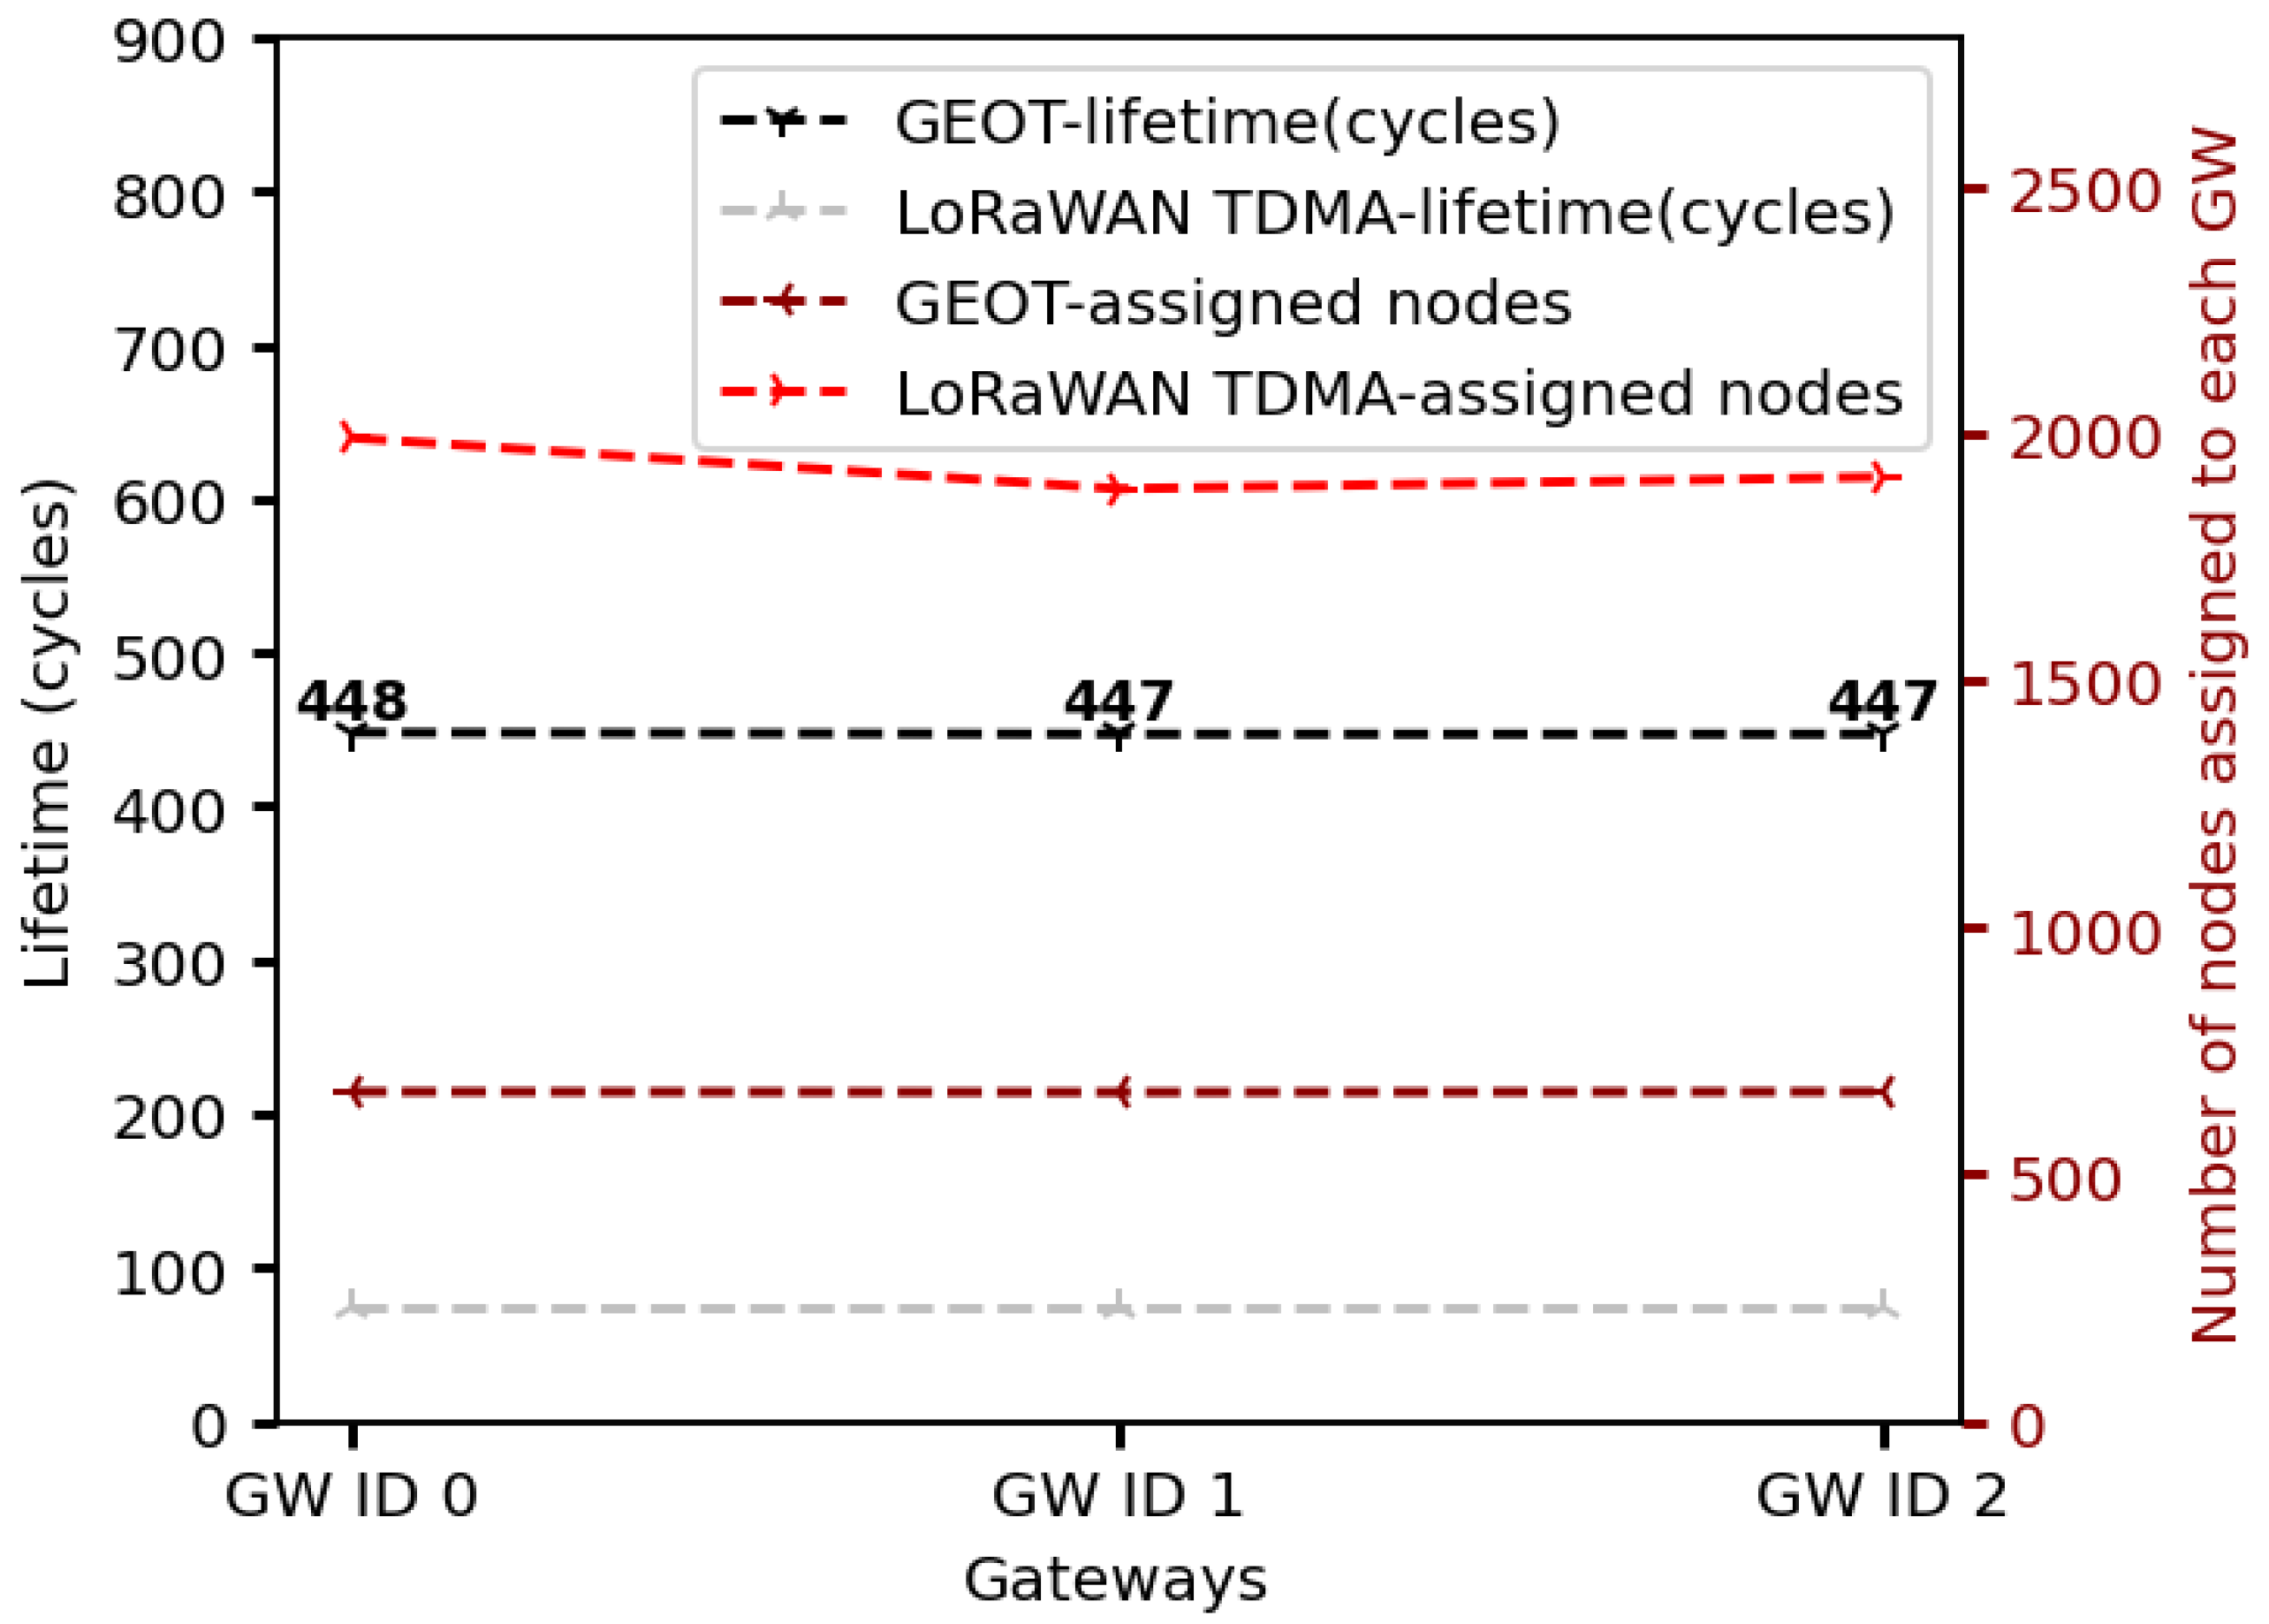
Figure 20, GEOT manages to redistribute nodes more evenly than the LoRaWAN TDMA baseline having placed the GWs near the denser deployment areas. Network lifetimes under GEOT reached 448, 447, and 447 cycles, respectively, demonstrating a clear improvement over LoRaWAN TDMA, where node-assignment asymmetry is much more severe, exceeding 1900 nodes per GW, reducing operational duration to fewer than 100 cycles. The spatial distribution is representative of scenarios where many sensors are concentrated around a center of activity, while fewer are scattered across a wider radius. Such examples include:
Smart cities where most sensors are deployed near high-activity hubs (e.g., squares, traffic intersections), with fewer extending toward the outskirts.
Environmental risk-monitoring scenarios, such as pollution measurement around an industrial facility, where density is higher near the source and decreases with distance.
Logistics and warehouse systems where sensors are densely placed around loading/unloading points and become sparser in the outer zones.
In such cases, the adaptability of GEOT enables sustainable operation despite the initial asymmetry of the spatial distribution.
6. Discussion
6.1. Results
In this section, we delve into the results from the simulation scenarios and provide justifications for the behavior of the system for each different case.
First and foremost, the GEOT protocol distributes the nodes, providing them at their join phase, with a new transmission ID based on the distance from the GW and their SF and TP, while in the migrated work of [
22] this distribution is based on the ADR mechanism of the classical LoRaWAN. A direct result of this distribution is the presence of empty slots in the migrated protocol while in GEOT the server removes the empty slots by providing the aforementioned sequential new IDs to the nodes. These empty slots are responsible for the increased delay in the reception of the data from the GWs.
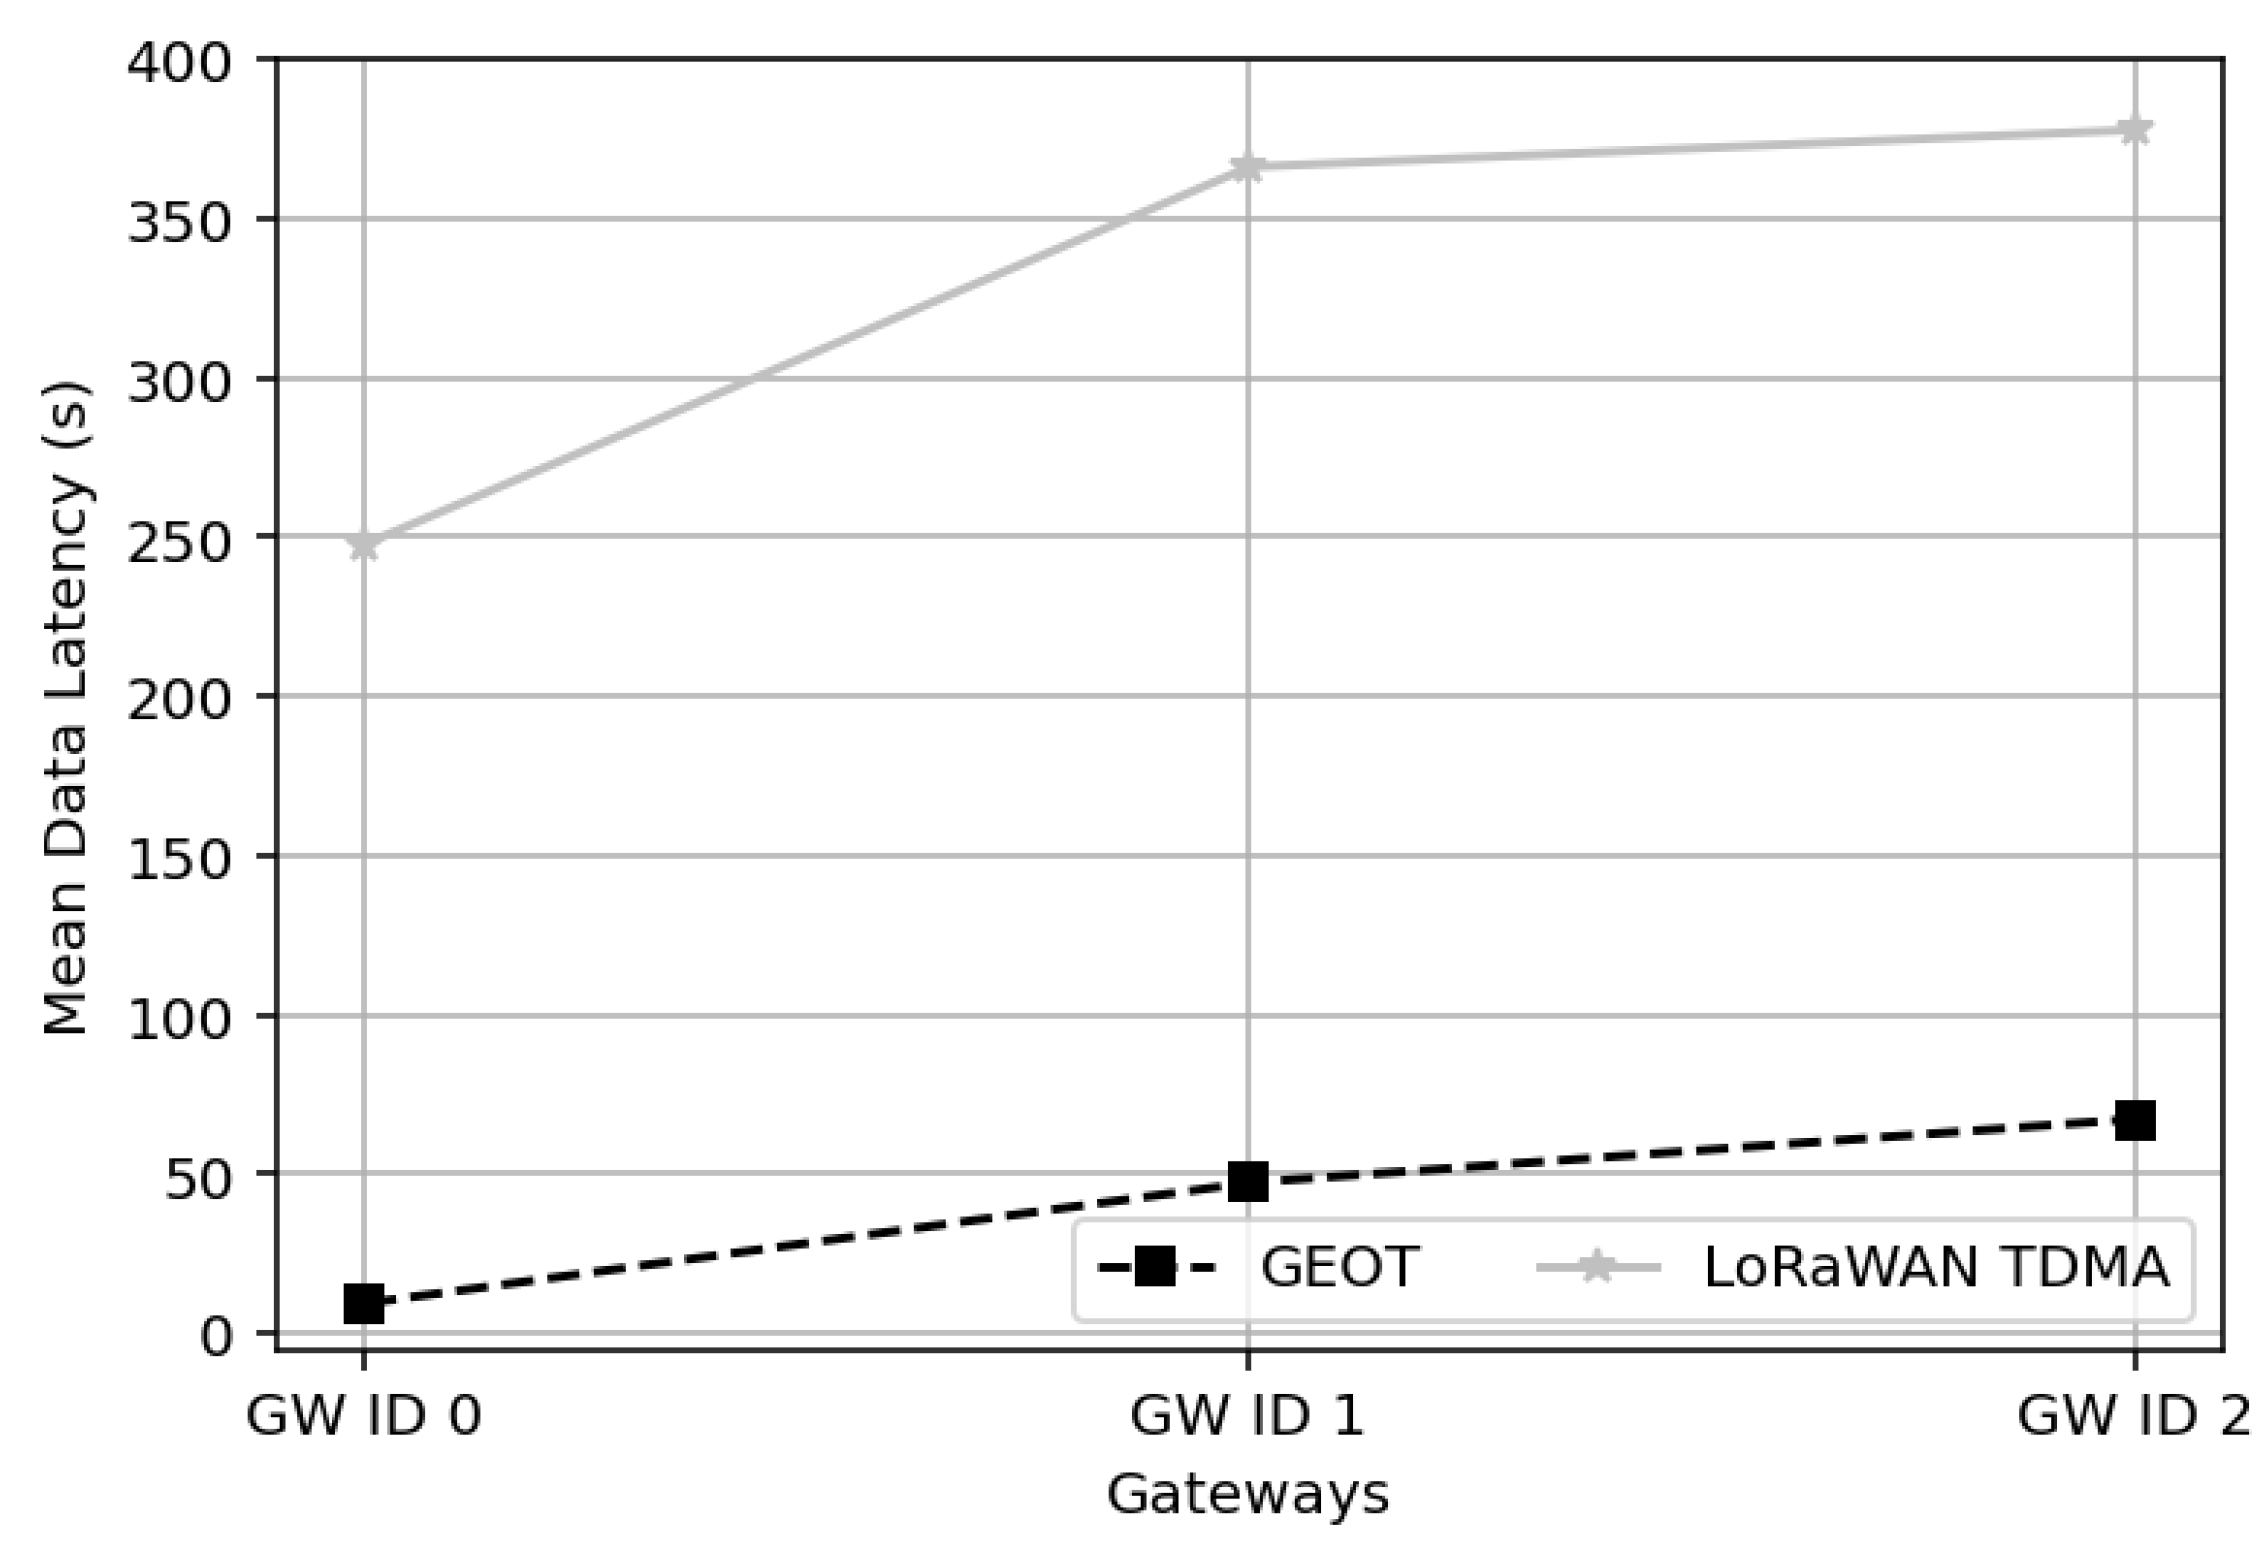
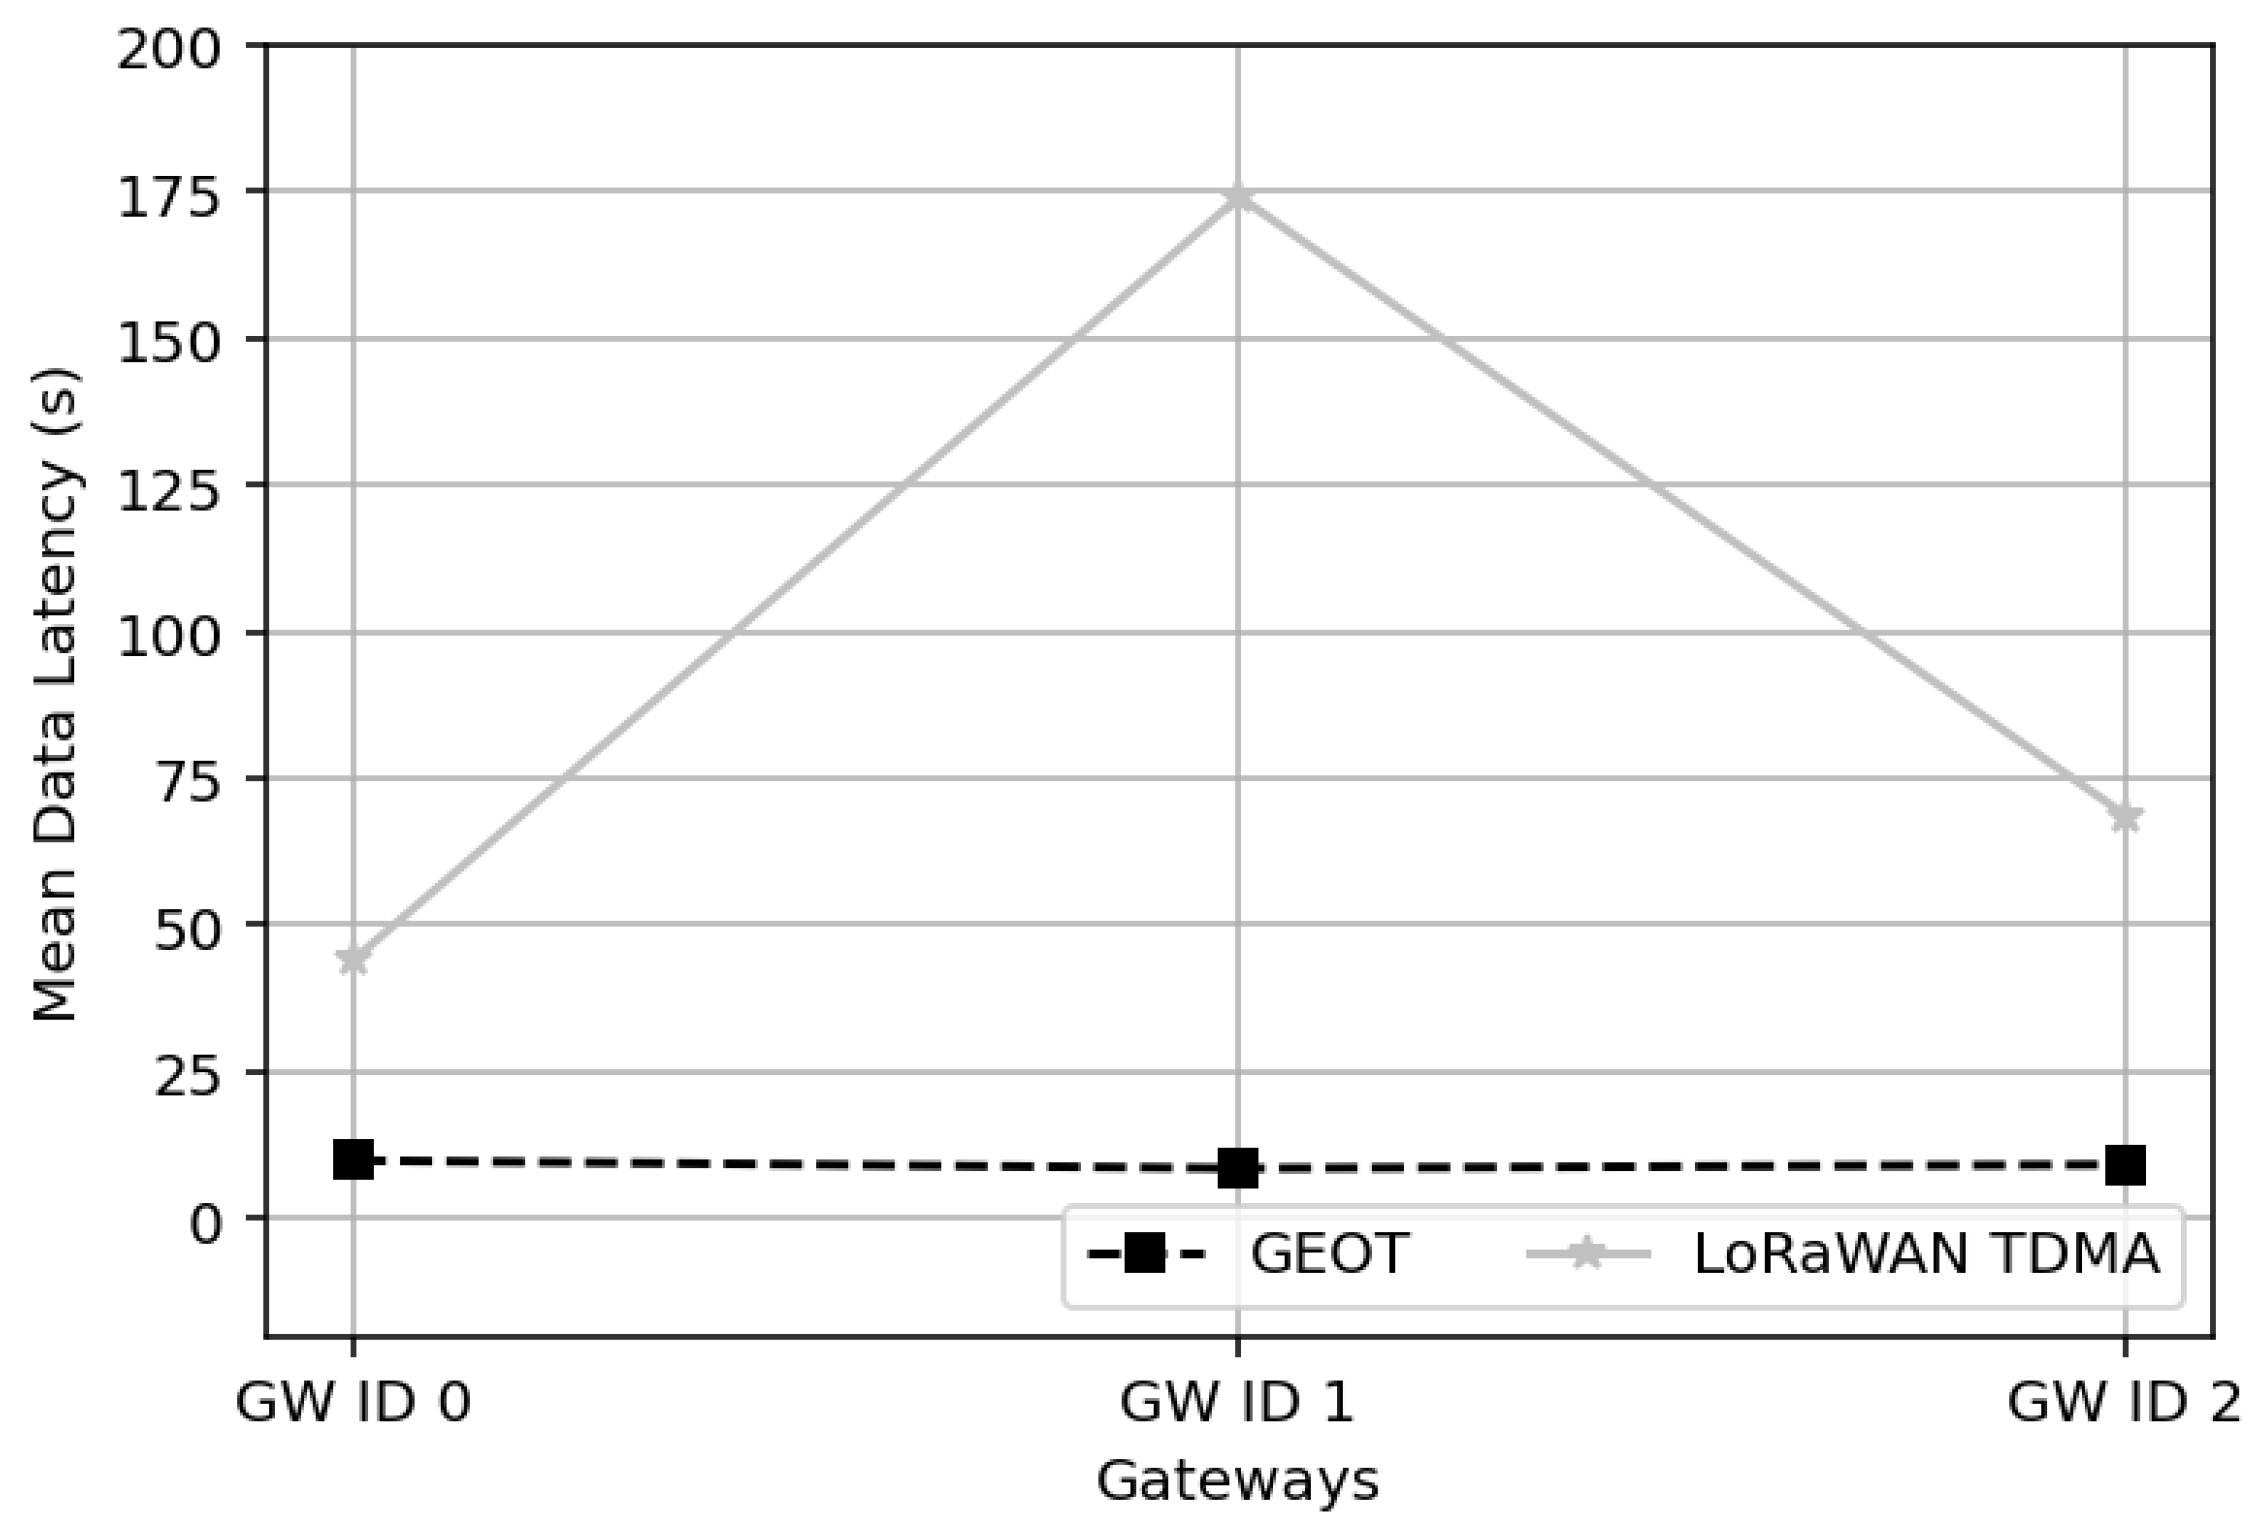
Figure 21 reveals the difference in the total time for transmissions towards the GWs. For a GEOT operated network, the time for the completion of the transmissions ranges from 9000 ms to 67,000 ms while the transferred protocol starts from 247,590 ms up to 377,730 ms for uniform distribution. The same applies also for normal distribution where the GEOT protocol is below 10,000 ms with consistent behavior, while the reference protocol reaches the level of 174,000 ms, almost 17 times higher (
Figure 22).
Another interesting outcome from
Figure 21 and
Figure 22 is the difference in delay between the two distributions: the normal distribution has a total delay of around 10,000 ms while the uniform one reaches values of 67,000 ms. The above Figures (
Figure 10 and
Figure 12) of the spatial distribution reveal the reason behind this result: in normal distribution, the nodes are concentrated near the center of the system as well as the GWs. This results in the use of lower SFs for the transmission and by that way the system completes its transmissions sooner than the similar network with uniform distribution. It is important to note that the results depicted in
Figure 21 and
Figure 22 refer to the mean data latency arising from the 12 min time cycle. These results pertain to the total number of nodes and not to a single node. In other words, these figures reveal the mean data latency aggregated across all nodes, representing a cumulative mean.
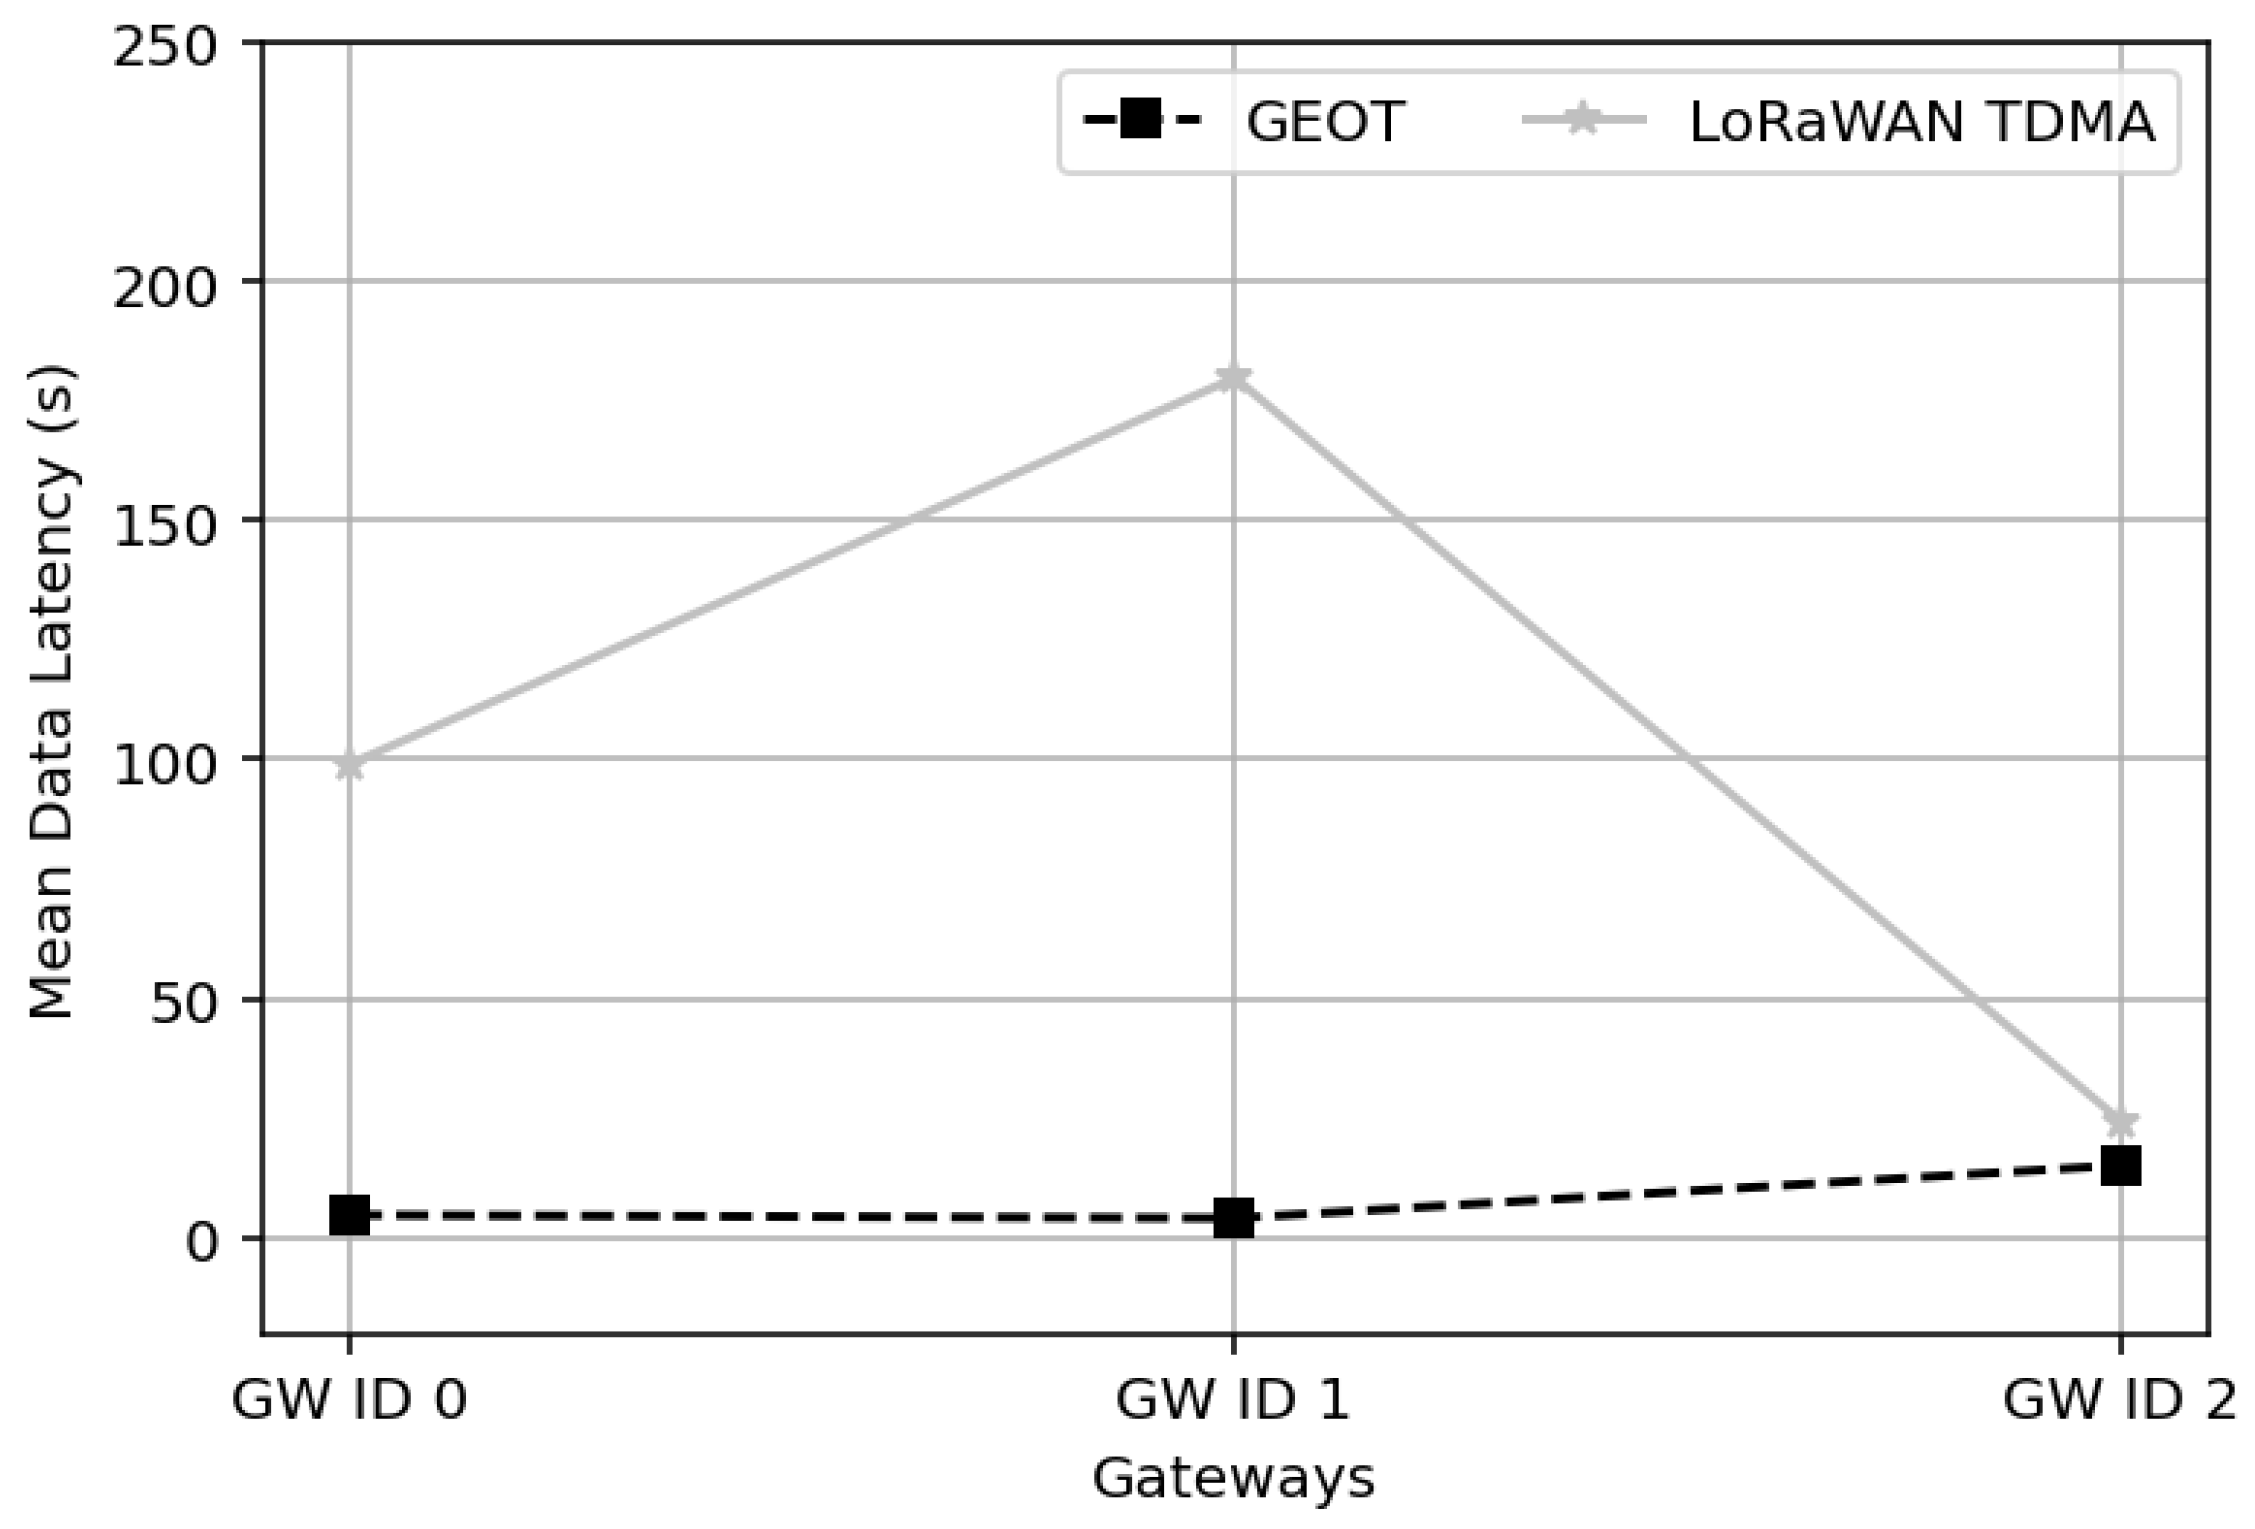
Figure 23 presents the mean data latency per GW for the normal spatial distribution scenario with 1000 deployed end devices. GEOT retains a consistently low latency across all GWs, with mean delivery times on the order of only a few seconds (5 s for GW0 and GW1, and 15 s for GW2). In contrast, the LoRaWAN TDMA approach exhibits significantly higher mean latency, reaching approximately 100 s at GW0 and increasing to nearly 180 s at GW1 and around 25 s at GW2. This variability across GWs in LoRaWAN TDMA is the result of contention and congestion imbalance: GWs that are effectively responsible for a denser subset of end devices experience longer accumulation and forwarding delays. GEOT largely avoids this behavior by explicitly allocating end devices to GWs and enforcing deterministic, collision-free TDMA collection rounds scoped per GW and per spreading factor. As a result, each GW can retrieve its assigned data stream in a predictable and tightly bounded time window, leading to uniformly low latency even under uneven spatial densities.
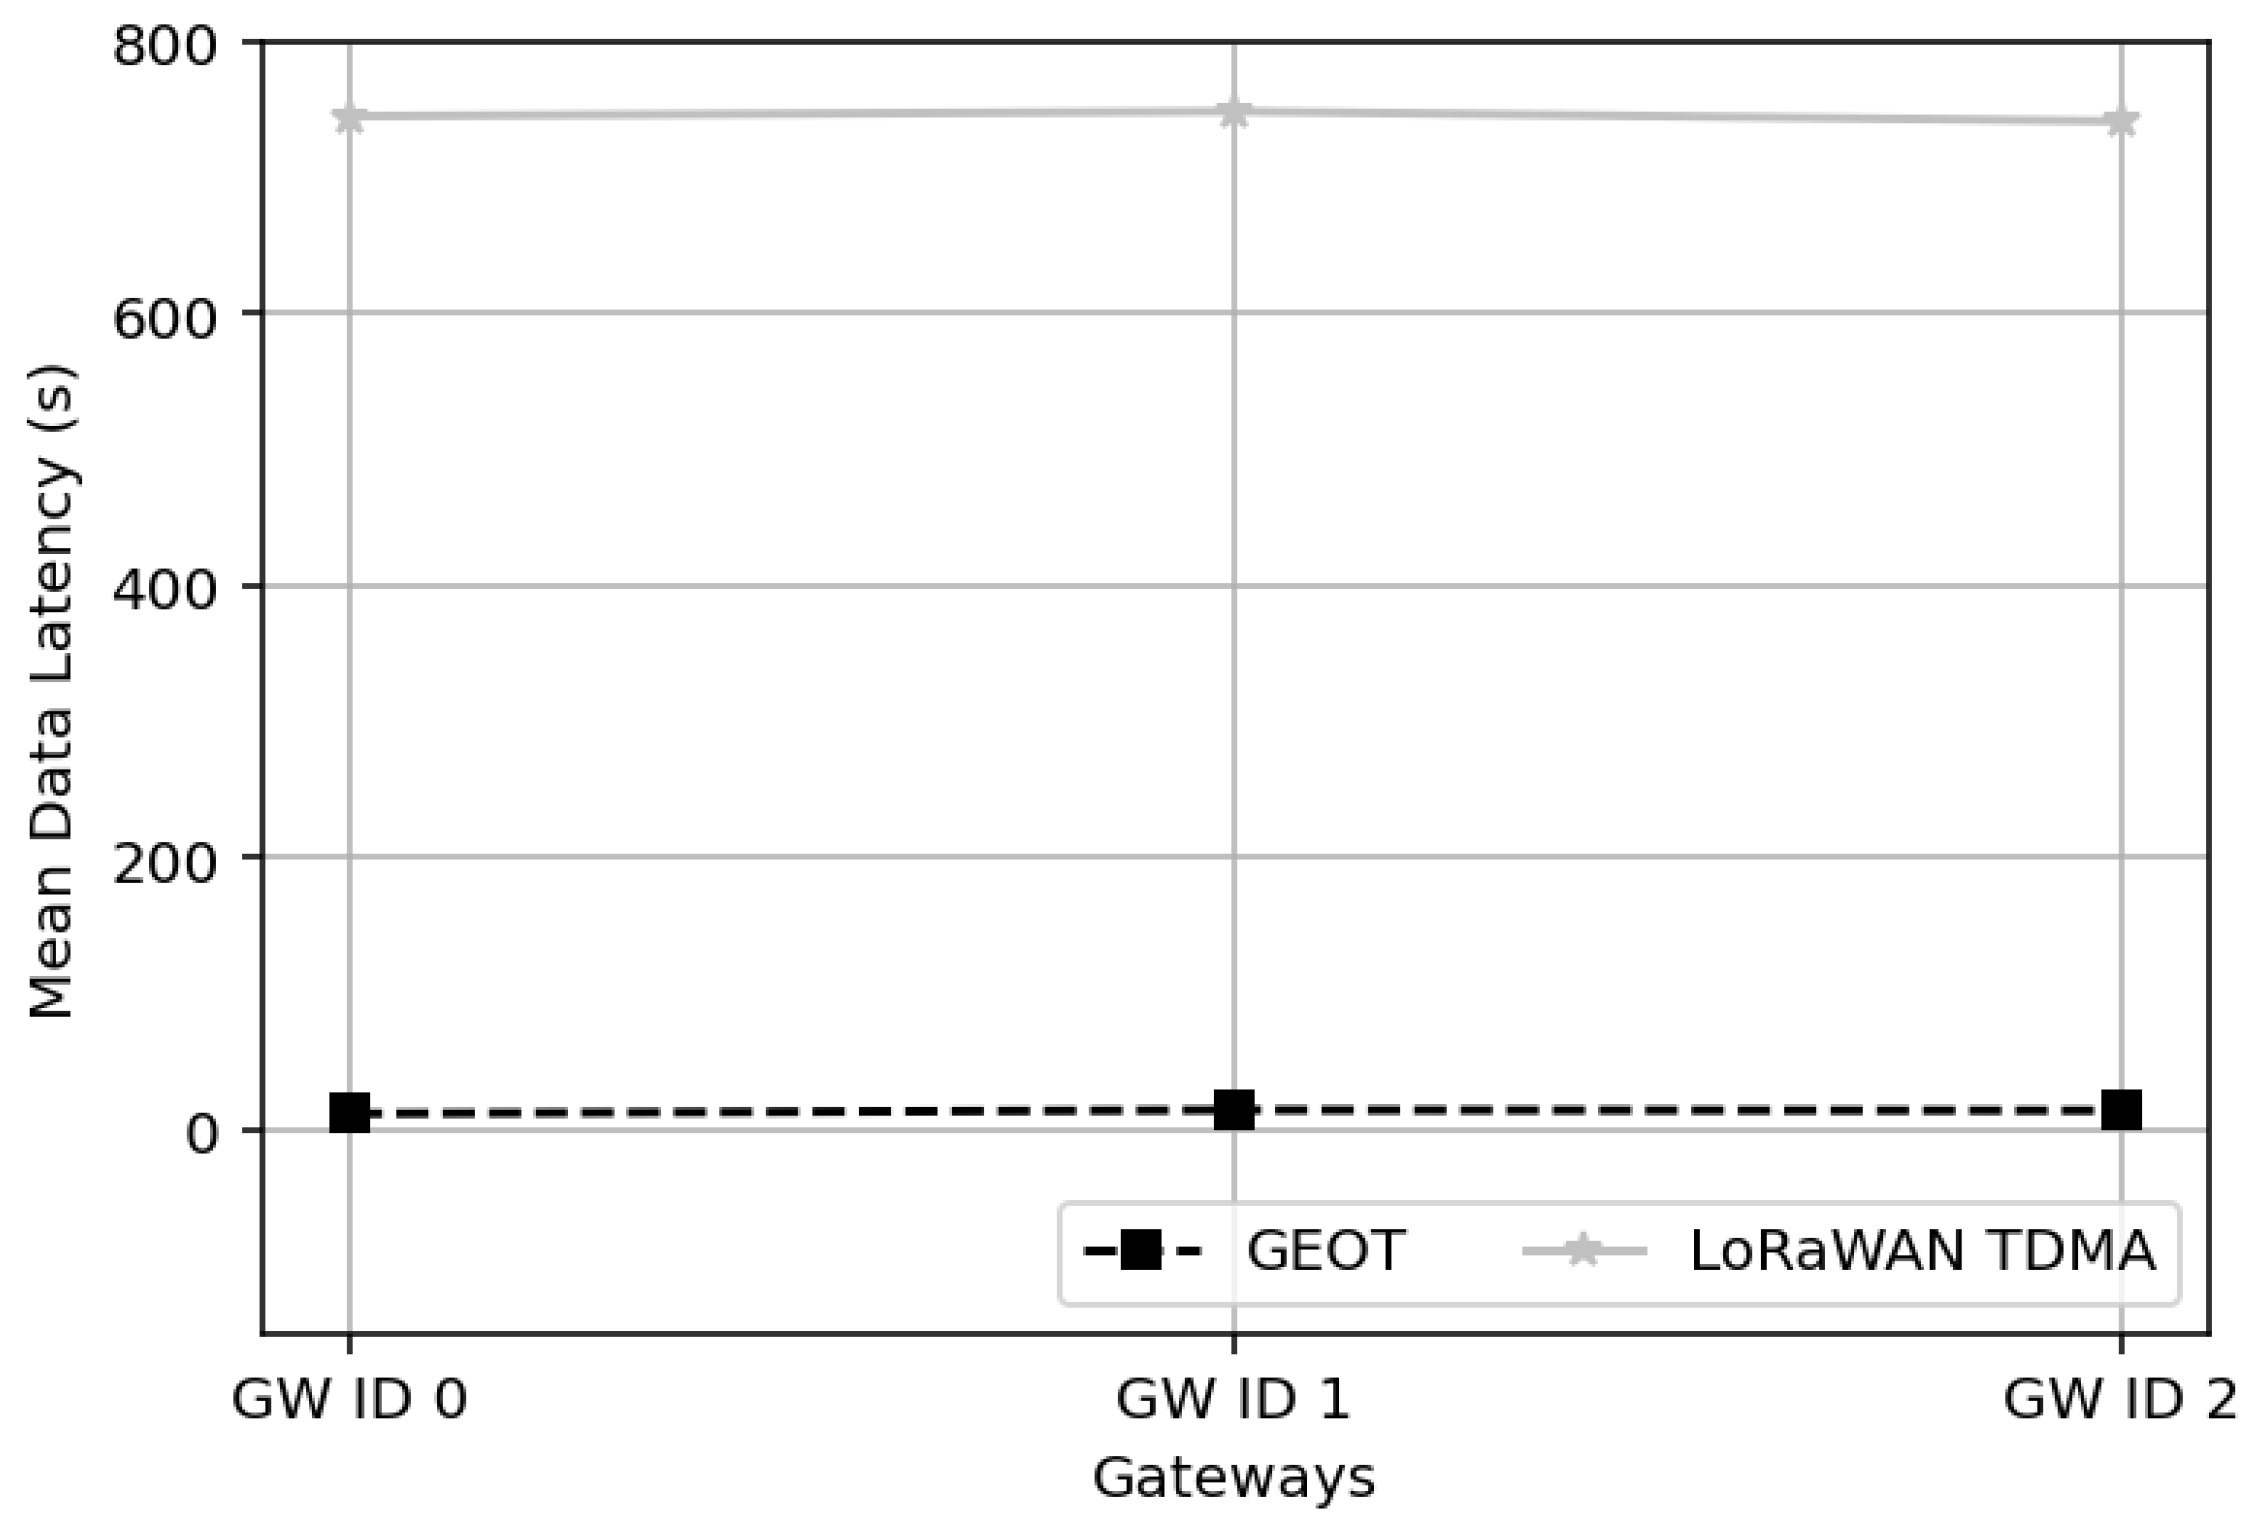
We further stress the system by increasing the number of end devices to 3000. Under this higher load (
Figure 24), GEOT still maintains mean data latency at the same order of magnitude (15 s for all GWs), demonstrating that the collection schedule scales with node population without introducing a significant backlog. On the other hand, LoRaWAN TDMA experiences a drastic degradation in timeliness: the mean latency per GW rises to approximately 750 s and becomes essentially flat across GWs, indicating that the baseline can no longer promptly service the accumulated traffic and must defer transmissions over multiple collection cycles. GEOT achieves more than an order of magnitude lower data latency than LoRaWAN TDMA for both sparse (1000 nodes) and dense (3000 nodes) deployments. Additionally, GEOT preserves this low-latency behavior across all GWs. Together with the lifetime and load-balancing results, this shows that GEOT provides not only higher GW energy sustainability but also substantially faster data availability at the network server, even at high network densities.
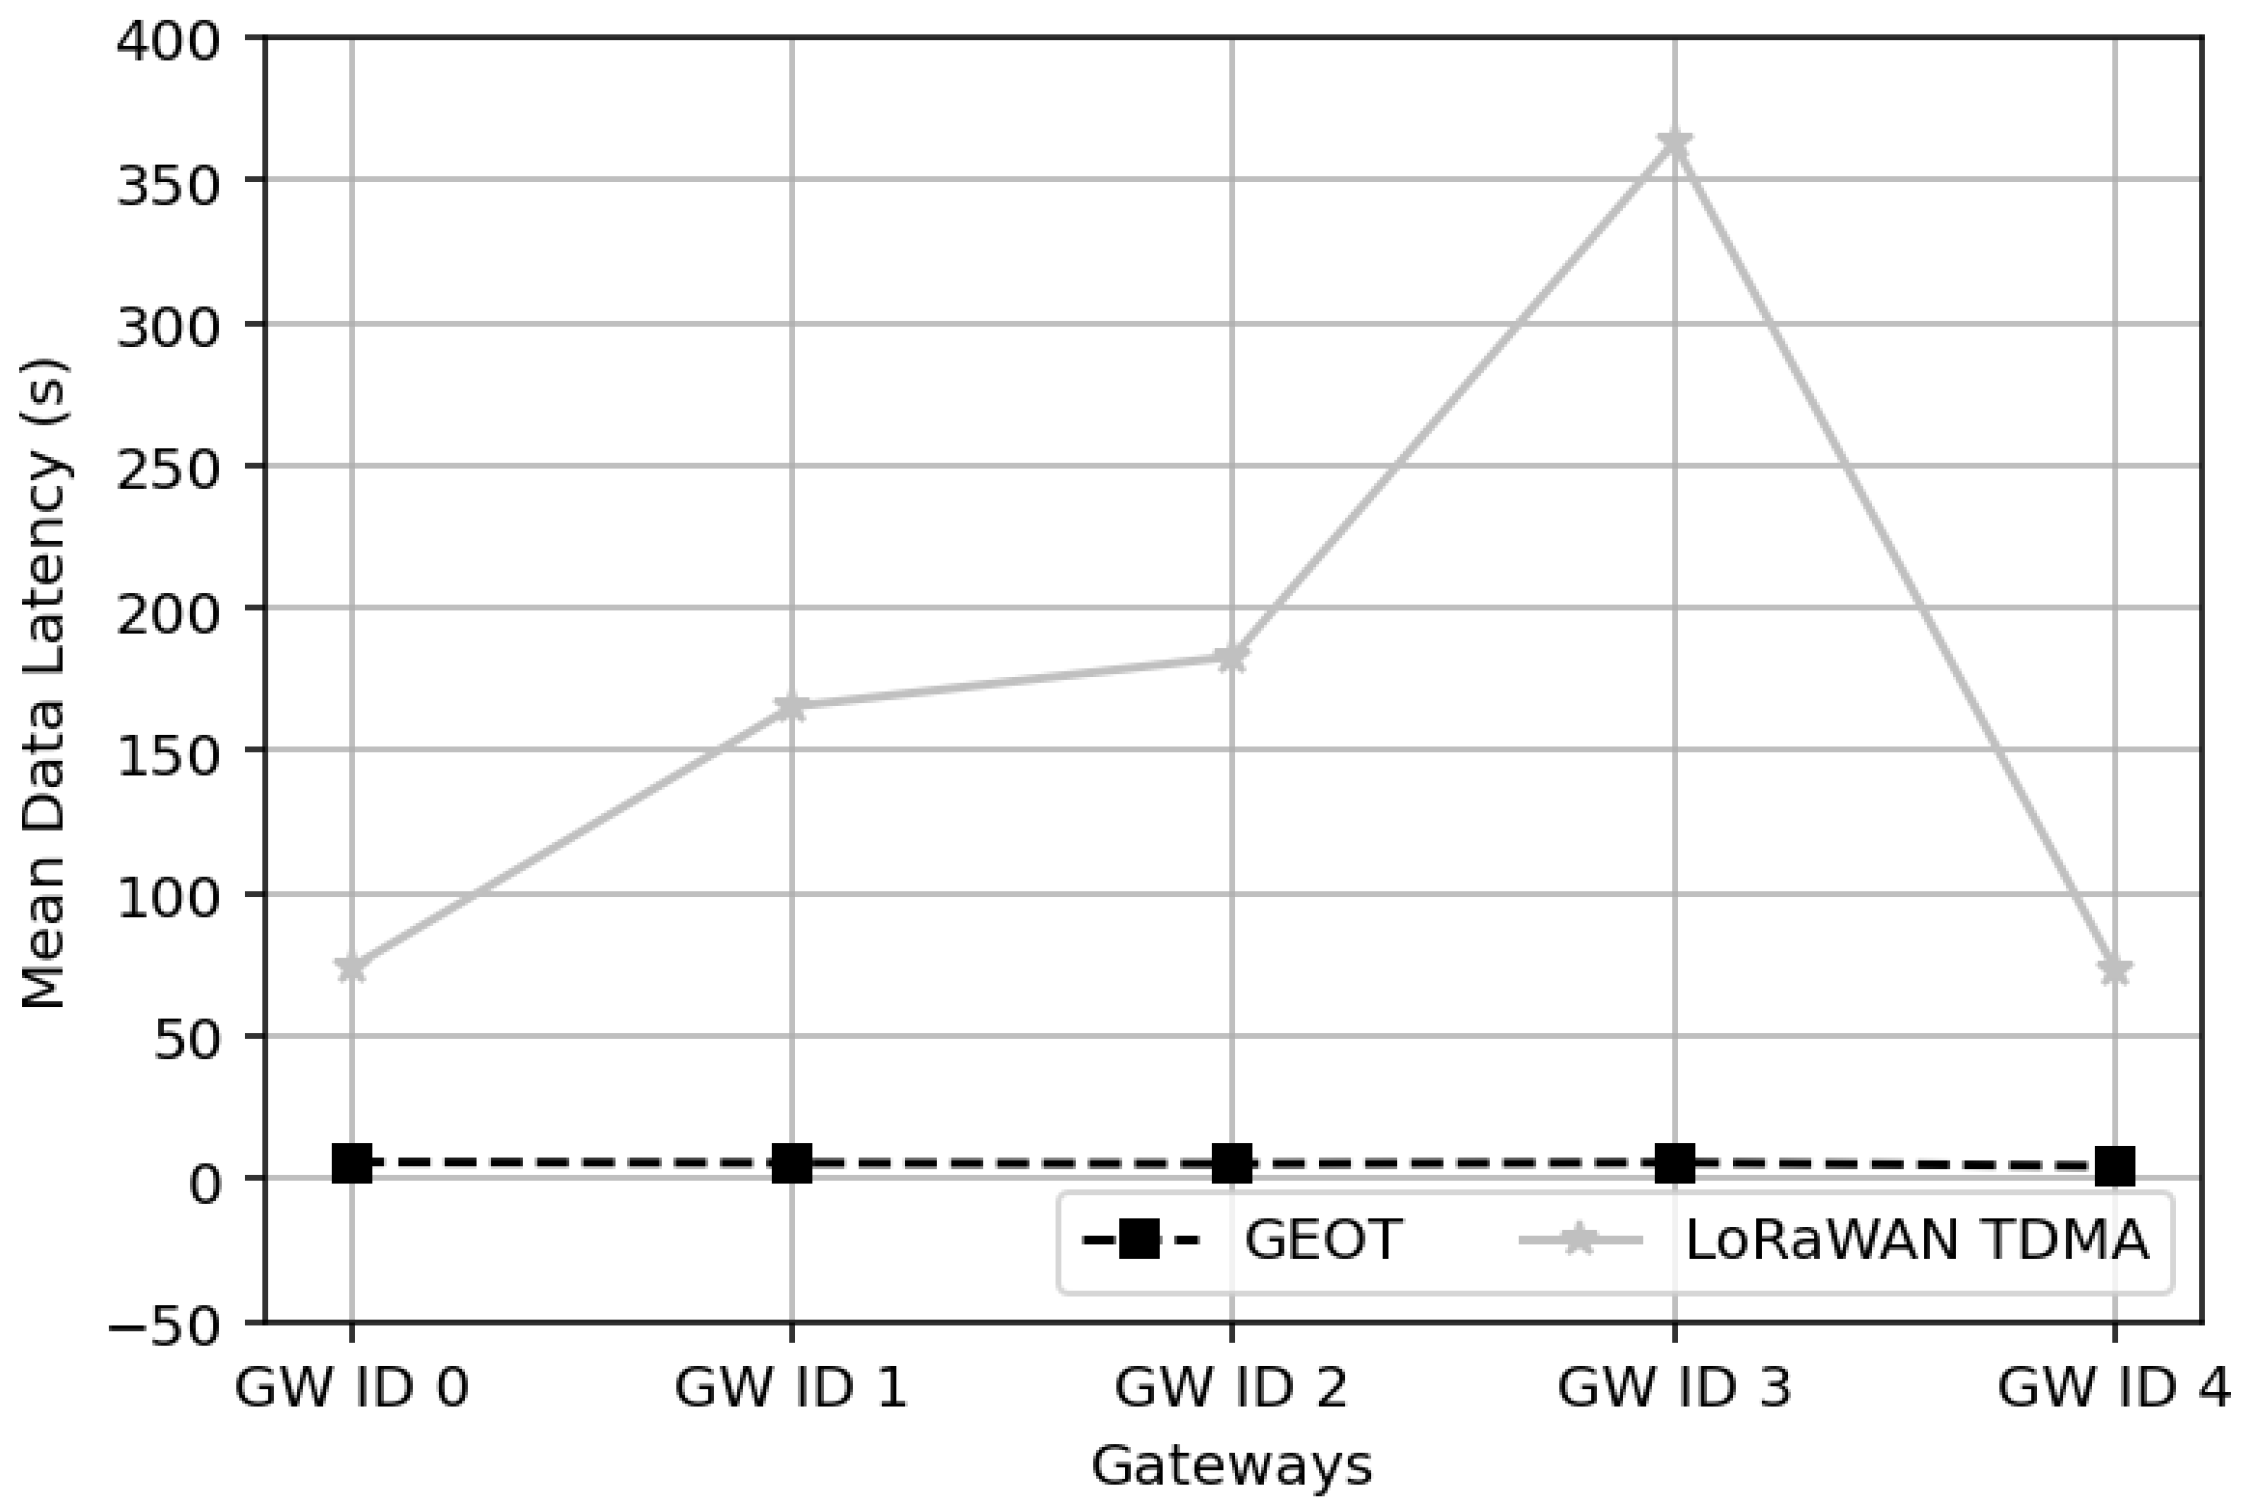
Figure 25 presents the mean data latency per GW for the normal spatial distribution with 2000 end devices and 5 GWs. GEOT achieves consistently low latency across all GWs, with mean delivery times of only a few seconds (about 5 s). In contrast, for the LoRaWAN TDMA configuration the mean latency ranges from about 75 s at GW0 and GW4, up to 170 s at GW1 and GW2, and it peaks at approximately 360+s at GW3. This spread reflects congestion asymmetry: certain GWs (e.g., GW3) accumulate data from many contending end devices. In other words, LoRaWAN TDMA cannot guarantee timely data extraction when multiple GWs cover overlapping dense regions. Taken together with the lifetime results, this confirms that GEOT not only improves GW energy sustainability and balances load, but also delivers faster and more predictable data availability at the network server in multi-GW deployments.
The root cause for the higher lifespan of the network adopting the GEOT protocol is the different energy states of the GWs. Having in advance the knowledge of the incoming transmission, each GW switches between different energy states, lowering the consumption for the part of each timeslot they do not have to listen for incoming messages. Adding into the equation the absence of empty slots and the positive impact in the network availability is evident. The cost for the alleviation of the empty slots is the extra time the GWs stay in the energy-consuming state of GW-transmit-LoRa but the compensation comes in the next cycles as the GW broadcasts only the new addition of nodes, keeping the energy savings from the fully utilized transmission slots. In numbers, this means that there are 2000 messages in total transmitted from the GWs to the servers under the GEOT protocol, while with the migrated protocol there are 2855 with the uniform and 4529 messages transmitted to the network servers with the normal distribution. The only compromise to consider is that the GEOT protocol requires processing power for calculating each GW’s node-assignment list, a task performed on the server side.
It is interesting to point out the reasons for the identical lifespan of the network in both distributions. Staying at the GW-listen energy state for almost the complete duration of the time slot, the GWs consume the same amount of energy in both distributions. The difference in the total number of messages they have to relay to the network server is leveled by the high transmission speed of the uplink between the GWs and the networks server as they stay in the GW-transmit-LTE state for a negligible amount of time in both cases. This difference is not capable of altering the lifespan of the network. The difference between the energy consumption for the transmissions between the GW and the network server lies at the level of W. From the above discussion, it is evident that the GEOT protocol is better suitable for application scenarios where the GW installation takes place in remote locations, far away from power landlines as distinct from typical LoRa network installations.
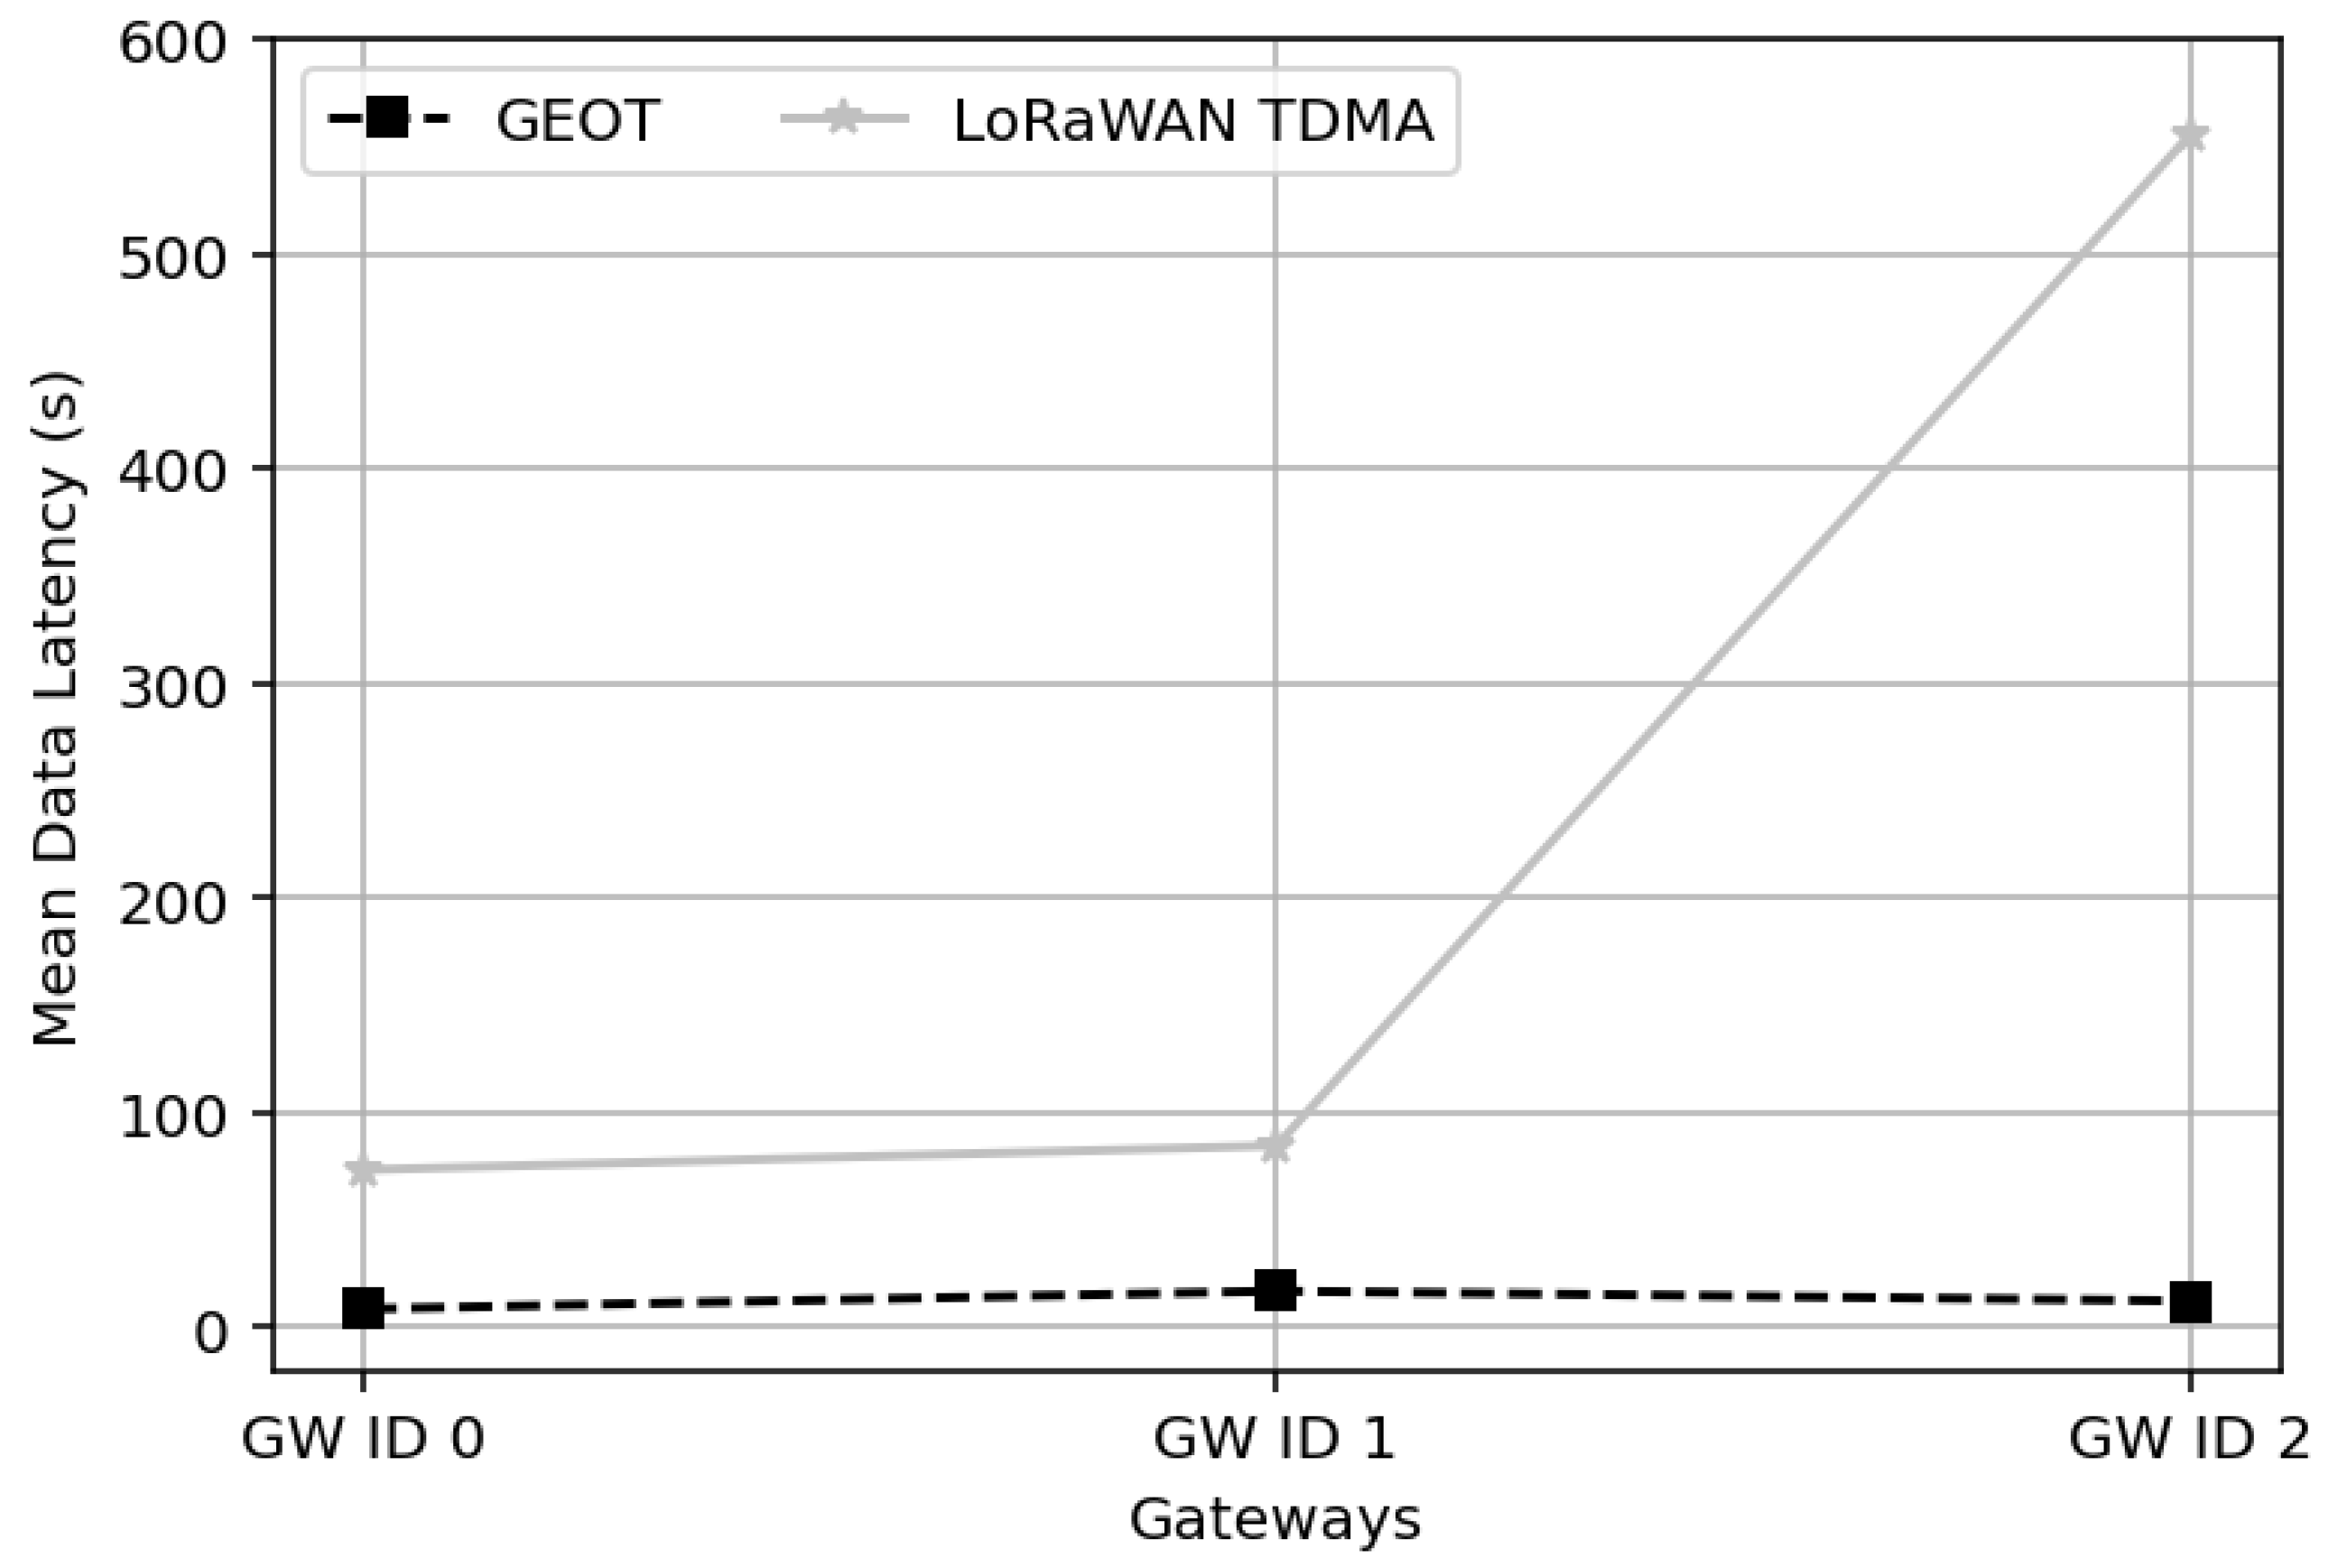
For the grid distribution (
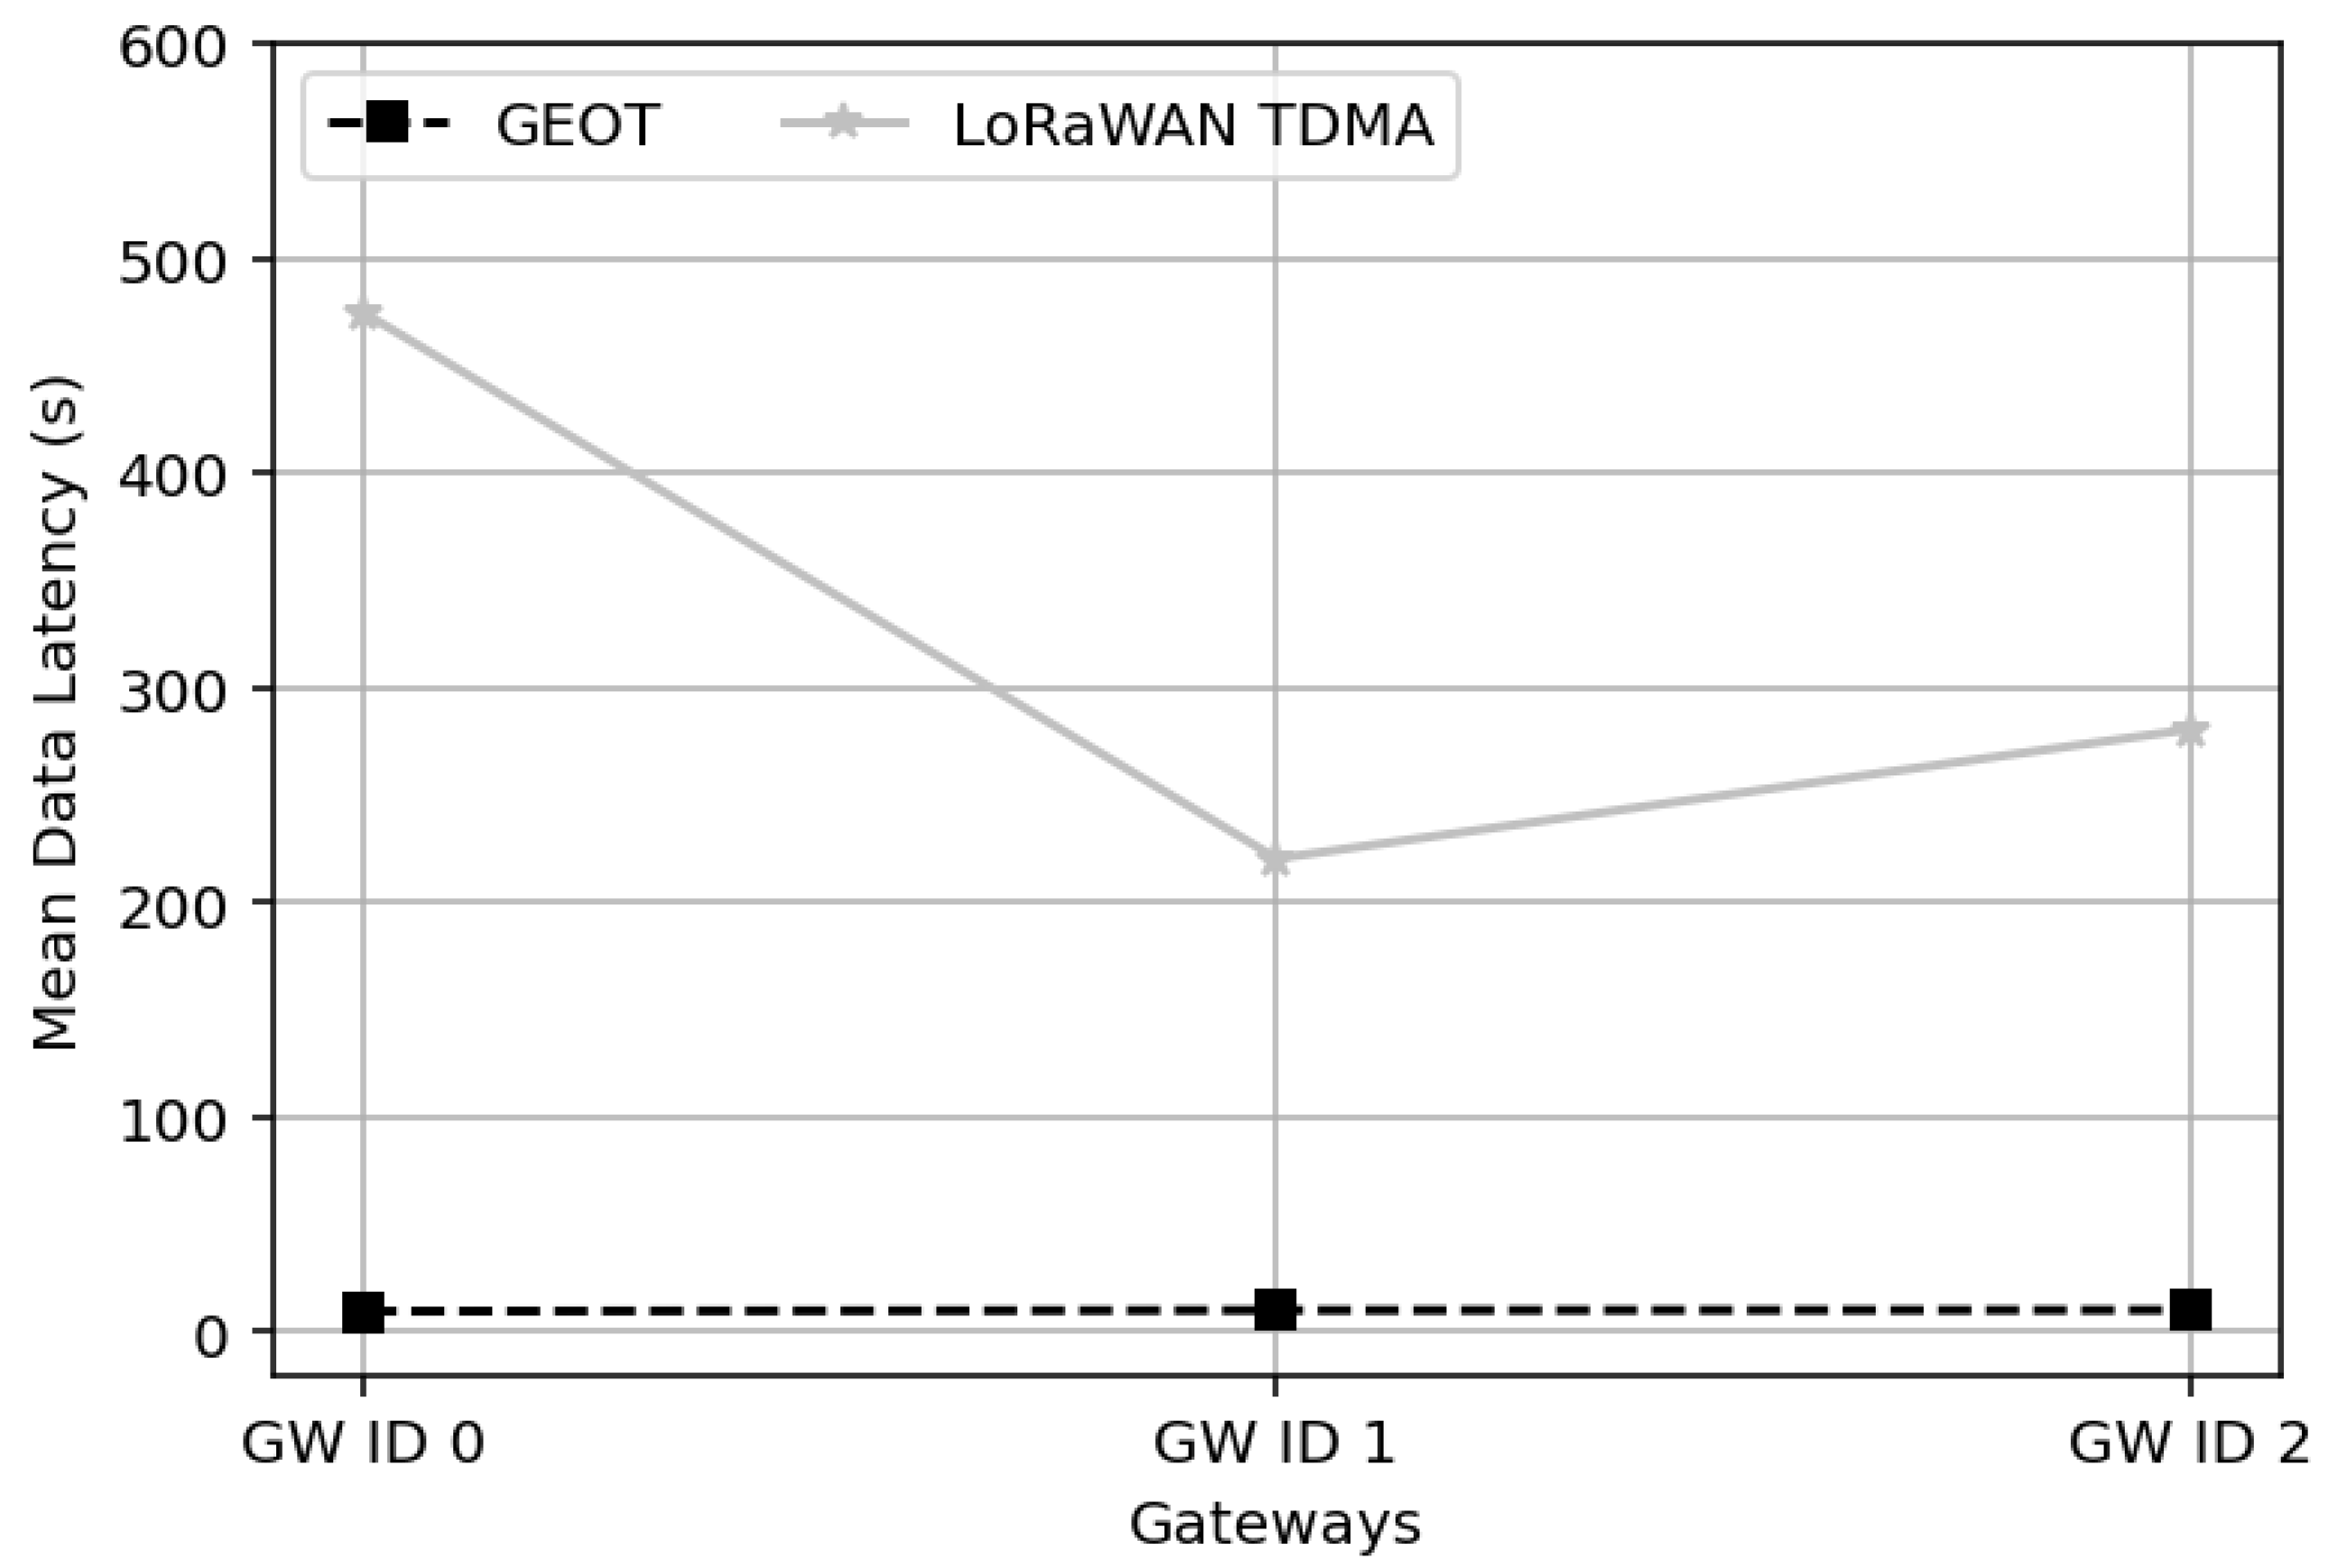
Figure 26), the deterministic placement of nodes across the squared area produces a very balanced traffic distribution among the GWs. As shown in the latency results, GEOT achieves consistently low delays across all GWs, remaining below 20 s, whereas the migrated LoRaWAN TDMA scheme exhibits a sharp increase in delay, rising from about 70 s at GW0 to more than 550 s at GW2. This divergence is explained by the way slots are allocated in the two schemes. In the migrated LoRaWAN TDMA protocol, slots are assigned in a static manner, which leads to congestion when too many nodes compete for the same GW. Even in the regular grid deployment, this static allocation leaves some GWs overloaded while others remain underutilized. As a result, delays increase significantly, especially at the more congested GWs. In contrast, GEOT dynamically reassigns transmission IDs and removes empty slots, so every available timeslot is effectively used. This mechanism keeps the traffic evenly spread across GWs and prevents bottlenecks, which explains the much lower and more stable latency. Such behavior makes GEOT particularly effective in structured deployments like smart agriculture fields, industrial monitoring sites, or precision environmental sensing, where deterministic placement is common and low latency is crucial for timely decision-making.
In the Pareto distribution (
Figure 27), the impact of uneven spatial deployment becomes even more evident. The heavy-tailed nature of the distribution leads to strong asymmetries in node placement, with some GWs receiving thousands of devices under the migrated TDMA scheme while others serve only a few hundred. This imbalance directly translates into high mean data latency, reaching almost 500 s at GW0, compared to about 220–280 s for the other GWs. By contrast, GEOT consistently maintains latency below 20 s across all GWs, thanks to its sequential ID assignment and elimination of empty slots, which prevents overloaded GWs from becoming bottlenecks. The node allocation under GEOT remains nearly equal (about 666 per GW), and the lifetime is extended to 447 cycles, compared to fewer than 80 cycles for TDMA. This highlights GEOT’s robustness in real-world scenarios with naturally uneven deployments, such as urban IoT infrastructures, crowd-sourced sensing in transport hubs, or commercial hotspots, where Pareto-like clustering of devices is unavoidable. In these environments, GEOT not only stabilizes latency but also ensures balanced resource usage and prolonged system operation.
In remote areas, where the LTE uplink rate may drop below 1 Mbps, reaching values down to 100 kbps (ten times lower), the average LTE transmission power of each GW remains practically unchanged. In this case, each GW transmits one aggregated LTE message per 12 min cycle. Using the transmission power shown in
Table 2, the total LTE airtime per cycle is
s where
is the LTE uplink transmission rate in bits per second (bps), i.e., 0.15 s at 1 Mbps and 1.49 s at 100 kbps, corresponding to only 0.02–0.2% of the 12 min cycle. The resulting average LTE power per cycle is
W at 1 Mbps and
W at 100 kbps. Hence, even for degraded LTE backhaul rates, the overall GW lifetime remains practically unaffected.
In order to assess the impact of GW state transitions on the overall energy consumption, a transition energy analysis was performed. Each GW performs at most six state transitions per 12 min communication cycle (sleep -> listen, listen -> sleep, sleep -> active, active -> sleep) in the worst case scenario, for instance, the second GW in the scheduling sequence. Assuming a conservative transition duration of at the listening power level , the total transition energy per GW is calculated as .
As previously derived, the total energy consumed by the three GWs during a 12 min cycle is . Considering a source voltage of , the total energy consumption per cycle is .
Hence, the relative contribution of the transition energy to the total system energy consumption is .
Therefore, the transition term contributes less than 1.25% of the total per-cycle energy consumption. Given that the steady-state energy terms (listening and transmission) dominate the GW power profile, the omission of transition energy introduces an error well below 1–1.5%, which does not affect the comparative lifetime results or the overall conclusions of this work.
All simulation results of the conducted experiments are summarized in
Table 3, which reports the performance gains of the proposed GEOT scheme over LoRaWAN TDMA across various network distributions and configurations. Here, latency denotes delay reduction, lifetime indicates the achieved network lifetime improvement, and assigned nodes reflects the optimization of GW load distribution.
6.2. Practical TDMA Applications in Remote IoT Deployments
TDMA has been widely employed in emerging IoT architectures, particularly in scenarios involving remote or hard-to-reach environments. Recent studies have highlighted its strong suitability for aerial IoT deployments, where predictable delay and interference mitigation are essential for reliable communication performance. For instance, TDMA-based scheduling has been integrated into UAV-assisted Agri-IoT networks, enabling enhanced outage performance and extended connectivity in smart farming environments while leveraging hybrid energy-harvesting methods for sustainable operation [
40]. Likewise, full-duplex UAV relay systems have utilized TDMA to coordinate multi-user transmissions efficiently, achieving significant improvements in coverage and spectral efficiency for IoT applications requiring simultaneous uplink and downlink communication [
41].
Under the same rationale, TS-LoRa introduces autonomous slot assignment with lightweight synchronization, showing implementation-backed improvements in predictability and reliability for industrial IoT under duty-cycle constraints [
42]. In transportation safety, Greitans et al. implement a TDMA-based Mobile Cell Broadcast Protocol on off-the-shelf LoRa radios as a real-time vehicular fallback layer, reporting lab-tested multi-client notification performance [
43].
Taken together, these works evidence the deployability of TDMA over LPWANs, which our study builds upon by shifting emphasis to GW-centric energy scheduling in off-grid deployments.
Motivated by these trends, the proposed GEOT approach seeks to shift attention from energy optimization solely at the node side to a more holistic perspective that also considers GW sustainability. GW-driven coordination, when combined with TDMA-based access, has strong potential for improving load balancing and ensuring that network lifetime is extended even under high traffic or sparse energy availability. Therefore, existing TDMA applications not only validate the feasibility of such mechanisms but also reinforce the value of adaptive GW collaboration for future LoRa and 6G-enabled IoT deployments.
It is also worth noting that the proposed GEOT framework has been patented, further demonstrating its practical applicability and innovation potential (
Section 8).
6.3. Future Outlook
LoRa and beyond 5G/6G represent two distinct but complementary paradigms in the realm of wireless communication and IoT. LoRa, known for its low-power, long-range capabilities, has emerged as a pivotal technology in enabling cost-effective, energy-efficient connectivity for IoT applications across various industries. With its ability to penetrate obstacles and cover extensive areas, LoRa networks have found applications in smart cities, precision agriculture, industrial monitoring, and more. On the other hand, beyond 5G and 6G aim to revolutionize connectivity with unprecedented speed, ultra-low latency, and massive device connectivity. While LoRa excels in providing long-range communication with low power consumption, 6G is expected to focus on delivering ultra-fast data rates, also enabling futuristic applications. Combining the strengths of LoRa’s energy efficiency and long-range coverage with the high-speed, low-latency capabilities of beyond 5G and 6G could unlock novel use cases and create synergistic opportunities for advancing the future of wireless communication and IoT deployment.
As more and more applications will be placed in remote locations due to the higher 6G coverage, this will transform the existing LoRa infrastructure, with node-allocation schemes playing a pivotal role in the performance of all channel access mechanisms. Consequently, the demand for remote GWs powered by renewable energy sources will arise, along with the necessity for protocols that focus on managing the energy consumption of GWs, rather than solely focusing on individual nodes as the majority of established works suggest.
Future work will focus on the design of an adaptive collaborative GEOT framework, enabling GWs to periodically exchange information regarding their energy reserves and traffic load. This mechanism will support node reassignment, synchronized sleep/awake cycles, and balanced energy consumption across the network.
In addition, integration with renewable-energy-prediction models presents a promising direction for research. By leveraging weather forecasting or solar radiation-prediction data, future versions of the GEOT protocol could dynamically adapt transmission cycles and GW activity periods to align with expected energy availability, thus enhancing operational resilience in environments with fluctuating renewable energy input.
Furthermore, AI-driven optimization of TDMA parameters may significantly improve network performance. Machine learning and reinforcement learning techniques could be employed to automatically adjust time-slot allocation, energy-state transitions, and GW activation patterns in real time, optimizing latency, throughput, and power usage under varying network and environmental conditions.
