Abstract
The integration of distributed generation (DG) and electric vehicles (EVs) introduces significant uncertainties, challenging traditional deterministic methods for assessing distribution network hosting capacity. This paper proposes a novel hosting capacity assessment method that integrates stochastic scenario simulation with multi-dimensional risk quantification. The core innovation lies in constructing a comprehensive risk indicator system spanning security, reliability, and the economy. These indicators are aggregated using a combined weighting method to derive a comprehensive risk index. Applied to the IEEE 33-node system, the method identifies an optimal hosting capacity of 3.9 MW and a maximum hosting capacity of 5.201 MW under a defined acceptable risk threshold. This maximum capacity represents a 33.36% increase over the security-risk-only optimal hosting capacity of 3.715 MW, effectively quantifying the trade-off between capacity integration and operational risk. The proposed framework provides a more robust and practical tool for distribution network planning under uncertainty.
1. Introduction
Against the backdrop of the global low-carbon transition and China’s “Dual Carbon” goals, the large-scale integration of DG and EVs has become a defining feature in the development of low-voltage distribution systems. This evolving energy structure not only intensifies the random fluctuations on both the supply and demand sides but also introduces a range of challenges for ensuring the safe and stable operation of distribution networks. With the widespread adoption of DG and EVs, the operational characteristics of distribution networks have changed significantly. On the supply side, distributed renewable energy, notable for its output uncertainty and intermittency, now constitutes a major component. On the demand side, uncertainty has sharply increased with the large-scale integration of EV charging loads, which are heavily influenced by user travel behavior. As a result, distribution networks have shifted from a model of traditional deterministic supply meeting deterministic demand to a new paradigm where uncertain supply must meet uncertain load. The uncontrollable nature of distributed renewable energy outputs, together with the spatiotemporal randomness of EV charging loads, greatly complicates the challenge of maintaining power balance within the network. In addition, large-scale integration of renewables alters power flow patterns; when DG output is high, surplus power can be injected back into feeders, causing reverse power flow and resulting in issues such as voltage limit violations, feeder overloads, and transformer reverse overloads [1,2,3].
To rationally assess distribution network hosting capacity while accounting for uncertainties in source-load power and configuration methods, researchers worldwide have conducted a variety of related studies [4,5]. Current research can generally be divided into two main categories of hosting capacity assessment methods: mathematical optimization-based approaches and stochastic analysis-based approaches. For instance, Reference [6] used a two-stage adjustable robust optimization framework to address uncertainties in distributed renewable energy output and load demand, proposing a hosting capacity assessment method that considers three-phase power flow uncertainty. Reference [7] transformed the probability distribution models of forecasting errors for distributed renewable energy output and load into chance constraints, developing an evaluation model that maximizes distributed renewable energy integration capacity through opportunity-constrained optimization. Reference [8] addressed the heightened operational uncertainty brought by the integration of distributed renewable energy and electric vehicles in distribution networks by formulating a solution model that maximizes EV charging load hosting capacity while ensuring distribution system security and a specified loss of power supply probability. Reference [9] aimed to optimize the hosting capacity for distributed photovoltaic integration by considering constraints such as static voltage stability margin, line loss rate, and voltage magnitude, utilizing an improved adaptive genetic algorithm. Reference [10] proposed a data-driven probabilistic assessment model for DG allocation considering multi-source uncertainty, while Reference [11] developed a robust stochastic programming approach to quantify DG hosting capacity under correlated renewable fluctuations. These emerging studies focus on uncertainty quantification through machine learning, robust optimization, and resilience-oriented modeling.
Although mathematical optimization methods often predefine the grid connection nodes for distributed generation, in practical applications the location and capacity of DG integration are frequently determined by user investment behavior. As a result, mathematical optimization methods have certain limitations in fully capturing the diversity of distributed renewable energy configurations present in distribution networks.
To overcome the limitations of mathematical optimization methods in accommodating the diversity of distributed resource scenarios, some researchers have employed stochastic scenario simulation techniques. Reference [12] introduced an hourly stochastic analysis approach, generating equal numbers of grid connection scenarios for candidate distributed photovoltaic nodes and defining two boundary hosting capacities: one where overvoltage is observed in at least one scenario and another where overvoltage is observed in all scenarios, thereby assessing hosting capacity accuracy by percentage. Reference [13] utilized Monte Carlo methods to simulate a range of photovoltaic integration scenarios, systematically iterating through every node in the distribution network to check for voltage limit violations after each additional photovoltaic integration, recording the integration capacity at the point of violation as the maximum allowable capacity. Reference [14] applied a Monte Carlo-based stochastic analysis to examine the distributed photovoltaic hosting capacity of distribution networks and analyzed its sensitivity with respect to network and photovoltaic system parameters. Stochastic scenario simulation approaches effectively account for uncertainties in distributed energy resource configurations, making them particularly appropriate for distribution networks with complex grid structures where optimal integration points for distributed energy are not readily apparent. Additionally, Reference [15] proposed a maximum hosting capacity evaluation model for multi-level distribution networks, aiming to maximize total renewable energy integration. This method employed the alternating direction method of multipliers (ADMM) to decompose the multi-level problem into subproblems for each distribution network level; however, this method lacks the consideration of multiple scenarios.
Owing to weak voltage support at the end of distribution network feeders, scenarios in which significant amounts of distributed renewable energy are concentrated at the feeder extremities are especially susceptible to node voltage limit violations and reverse power flow. To prevent these phenomena from unduly influencing final hosting capacity assessment outcomes, Reference [16] calculated overvoltage risk indicators at various photovoltaic penetration levels and determined the photovoltaic hosting capacity of the distribution network by setting an acceptable risk threshold. Reference [17] addressed overvoltage issues associated with large-scale distributed photovoltaic integration by introducing probabilistic voltage violation risks, thereby quantifying the overvoltage risk resulting from operational uncertainty in distributed photovoltaics. Reference [18] examined the reliability of distribution networks equipped with distributed generation, analyzing voltage enhancement, optimization, and the minimization of voltage deviation. While these studies primarily focus on overvoltage risks during network operation, practical operation is subject to a range of risks—including voltage limit violations, power flow overloads, transformer reverse overloads, and power supply reliability issues—all stemming from uncertainties in source-load power and distributed renewable energy configuration methods. Consequently, there is an urgent need to develop a comprehensive and scientifically grounded evaluation index system for distribution network hosting capacity.
This paper adopts a stochastic scenario analysis approach to generate a set of grid integration scenarios that encompass uncertainties in distributed generation (DG) location and capacity. Building upon risk quantification theory, a multi-dimensional hosting capacity evaluation index system is developed, encompassing voltage limit violations, line overloads, transformer forward and reverse overloads, loss of load, and network losses. To standardize the evaluation, a combined weighting method that incorporates both subjective and objective perspectives is used for indicator unification. The optimal hosting capacity for the distribution network is determined based on the minimum comprehensive risk, and the maximum hosting capacity is further established according to defined risk thresholds. The validity of the proposed approach is demonstrated using standard case studies, and the primary limiting factors affecting distribution network hosting capacities at various penetration levels are analyzed.
2. Stochastic Scenario Simulation Method for Distribution Network Hosting Capacity
Distribution network operators are confronted not only with uncertainties from both the source and load sides but also with grid-side uncertainties during hosting capacity assessment. These uncertainties make it challenging to precisely predict specific details of distributed energy integration, such as the locations and installed capacities of various resources within actual distribution networks. To address this challenge, this section introduces the concept of stochastic scenario analysis [19]. Leveraging the integration methods of distributed renewable energy into distribution networks, the Monte Carlo simulation method is employed to generate a large number of configuration scenarios. The objective is to encompass as many potential distributed renewable energy integration schemes as practical, thereby providing distribution network operators with more comprehensive and accurate hosting capacity assessment results.
The generation of stochastic scenarios for distributed renewable energy integration primarily involves two key elements: the locations and capacities of integration. In this section, various configuration scenarios are constructed by randomly assigning integration locations and capacities for distributed renewable energy resources, as illustrated in Figure 1. This methodology is particularly appropriate for distribution networks with complex grid structures, in which it is difficult to intuitively identify the most critical points for renewable energy integration. Furthermore, to analyze the principal limiting factors of hosting capacity at different levels of distributed renewable energy penetration, an initial penetration rate is established and systematically increased according to a predetermined step size. This process yields a series of configuration scenarios corresponding to various penetration levels, thereby facilitating a comprehensive analysis of hosting capacity constraints across different scenarios.
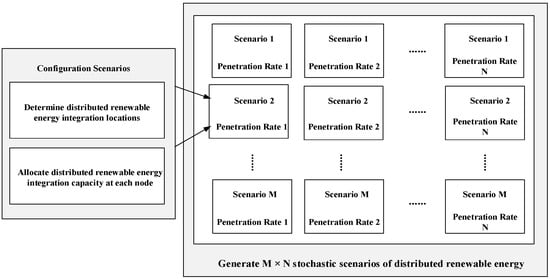
Figure 1.
Schematic Diagram of Stochastic Scenario Generation Method.
The specific workflow for generating DG grid integration scenarios based on stochastic scenario analysis is shown in Figure 2.
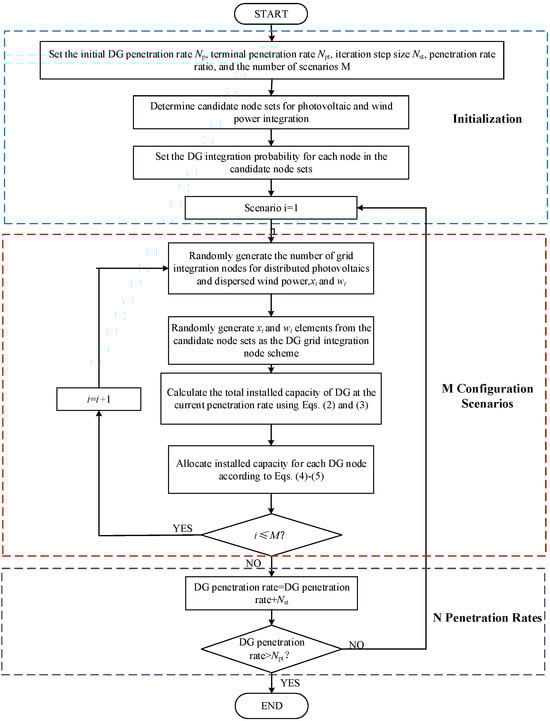
Figure 2.
Flowchart of Stochastic Scenario Simulation for Distributed Renewable Energy.
The Monte Carlo stochastic process includes randomly selecting distributed renewable energy integration points in the distribution network, simulating potential integration locations in practical scenarios. Furthermore, based on a given penetration rate, the integration capacities at these points are determined. The distributed renewable energy penetration rate is defined as the percentage ratio of the total installed capacity of distributed renewable energy to the sum of peak loads at all system nodes, denoted as :
where is the distributed renewable energy penetration rate; is the total installed capacity of distributed renewable energy; and is the sum of peak loads at all system nodes.
Step 1: Set the initial penetration rate , terminal penetration rate , penetration rate iteration step size , penetration rate ratio of distributed photovoltaic to distributed wind power , and the number of stochastic scenarios M.
Step 2: Based on distribution network planning requirements, define the candidate node set for distributed photovoltaic integration , where the number of elements is , and define the candidate node set for distributed wind power integration , where the number of elements is . Set the probability sets for integrating distributed photovoltaic and distributed wind power at each node as and , respectively.
Step 3: Randomly generate M values of and (, , ), forming the sets of the number of distributed photovoltaic grid integration nodes and the number of distributed wind power grid integration nodes for each scenario.
Step 4: During each Monte Carlo simulation, randomly select and elements from the candidate grid integration node sets to form the grid integration node scheme for the i-th scenario.
Step 5: Based on the current penetration rate, calculate the total installed capacities of distributed photovoltaic and distributed wind power in the distribution network according to the set distributed renewable energy penetration rate ratio, as shown in Equations (2) and (3):
Step 6: Assign installed capacities to each selected distributed renewable energy grid integration node according to Equations (4) and (5):
where is the installed photovoltaic capacity allocated at distributed photovoltaic grid integration node j; is the installed wind power capacity allocated at distributed wind power grid integration node k; and are the peak loads at nodes j and k, respectively; and and are the sums of peak loads at all distributed photovoltaic and distributed wind power grid integration nodes in the scenario, respectively.
Step 7: Increase the penetration rate within the range at a fixed step size, complete the configuration of distributed renewable energy locations and capacities for M scenarios, and ultimately obtain sets of distributed renewable energy stochastic scenarios.
By adjusting the values of M and N, the number of stochastic scenarios can be controlled to achieve a balance between computational complexity and assessment accuracy. Allocating distributed renewable energy installed capacities according to nodal peak loads adheres to the principle of local consumption, thus ensuring that the capacity configuration aligns with the characteristics of each node’s load. Additionally, by specifying iteration step sizes it is possible to analyze the effects of varying distributed renewable energy penetration rates on the hosting capacity of the distribution network [18].
3. Distribution Network Hosting Capacity Assessment Method Based on Multi-Dimensional Risk Quantification
3.1. Construction of Distribution Network Hosting Capacity Assessment Indicator System Based on Risk Quantification
Since traditional deterministic indicators are inadequate for capturing the dynamic effects of uncertainties in source-load power and distributed energy resource configuration methods on the boundaries of distribution network hosting capacity, this section introduces a distributed renewable energy hosting capacity evaluation index system grounded in multi-dimensional risk quantification. This approach incorporates both the probability of occurrence and the severity of issues—such as voltage limit violations, line overloads, and transformer overloads—caused by potential uncertainties in distributed energy resource configurations and supply–demand fluctuations on both the source and load sides.
This section assesses the risk levels of distribution networks under stochastic scenarios of distributed renewable energy integration from three key dimensions, as shown in Figure 3: security, reliability, and economy. Security indicators are used to capture the voltage profiles at distribution network nodes, line power flow conditions, and transformer loading levels. Reliability indicators are designed to reflect the network’s resilience to fault disturbances by quantifying the system’s capability to sustain load supply during line contingencies. The economic dimension is crucial for evaluating the operational efficiency of distribution networks. While the integration of distributed renewable energy can decrease losses in originally long-distance, single-end supply networks through decentralized supply, excessive reverse power flow may conversely increase network losses. Thus, a network loss indicator is introduced to quantify the economic consequences associated with network losses caused by the integration of distributed renewable energy resources.
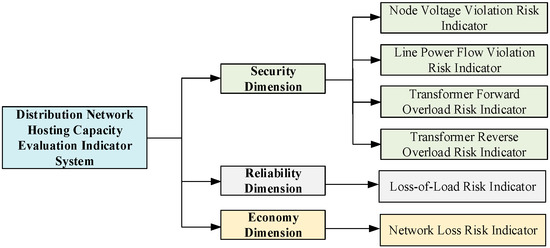
Figure 3.
Distribution Network Hosting Capacity Assessment Indicator System.
Risk indicators are designed to account for both the likelihood of risk occurrence and the potential consequences of those risks. In this section, this concept is applied to construct tailored risk indicators for evaluating distribution network hosting capacity. Additionally, the consequences of risks frequently demonstrate an exponential amplification effect corresponding to the severity of system issues. To quantify this nonlinear relationship, this section develops severity indicators for node voltage violations, line power flow violations, transformer forward overloads, transformer reverse overloads, and loss of load by integrating a risk-preference-based utility function into the evaluation framework.
The risk of indicator violations can be specifically expressed as:
where R represents the risk of different indicator violations; K denotes the cardinality of system states; is the probability of system state ; denotes the severity of indicator violations under system state .
The severity of indicator violations for voltage limit violations, line power flow violations, transformer forward overloads, transformer reverse overloads, and loss of load risks can be determined using Equations (7)–(11):
where represents the voltage violation severity under system state ; denotes the voltage at node i at time t; signifies the set of system nodes; and T indicates the 24 h chronological simulation cycle. The voltage violation thresholds of 0.93–1.07 p.u. correspond to the standard operational voltage limits defined by distribution network codes. Transformer forward and reverse overload limits are set according to equipment thermal ratings (110% and 120% of nominal capacity, respectively), while line overload limits are determined by conductor ampacity constraints. These threshold values ensure that the severity indices represent physically meaningful and safety-compliant risk boundaries.
where represents the line power flow violation severity under system state ; L denotes the set of distribution system lines; indicates the actual active power of line l at time t; and signifies the rated active power of the line.
where denotes the transformer forward overload severity under system state ; represents the set of transformers in the distribution system; indicates the load of transformer x at time t; signifies the rated capacity of transformer x; and is the forward overload threshold for the transformer.
where represents the transformer reverse overload severity under system state ; denotes the output of distributed renewable energy within the downstream network area of transformer x; indicates the electricity load within the downstream network area of transformer x; signifies the output of other power sources excluding distributed renewable energy within the downstream network area of transformer x; and is the reverse overload threshold for the transformer.
where represents the loss-of-load severity under system state ; denotes the loss-of-load flag corresponding to the k-th distribution system network structure under random line faults (equal to 1 if loss-of-load occurs under this network structure, otherwise 0); indicates the per-unit value of the loss-of-load amount corresponding to the k-th network structure under system state ; and is the per-unit value of the current system load.
Simultaneously, a distribution network loss economic indicator is introduced to evaluate the net loss reduction benefits brought by large-scale distributed renewable energy integration while considering risks such as overvoltage and power flow violations.
where represents the economic indicator of network losses in the distribution system; denotes the network loss cost under system state ; indicates the electricity price at time t; signifies the network loss power at time t under system state ; is the resistance value of line l; and represent the active power and reactive power flowing through line l at time t, respectively; and indicates the voltage value of line l at time t.
3.2. Integrated Distribution Network Hosting Capacity Assessment Method with Multi-Dimensional Risk Quantification Indicators
After constructing the evaluation indicator system for distribution network hosting capacity, a combined subjective-objective weighting approach—integrating the Analytic Hierarchy Process (AHP) with the entropy weight method—is employed to scientifically determine the weights of each indicator. This enables a comprehensive assessment of the effects of source-load uncertainties on distribution network hosting capacity.
The Analytic Hierarchy Process (AHP) assigns indicator weights by decomposing hosting capacity evaluation indicators into multiple levels—including the objective layer, performance layer, and indicator layer—forming judgment matrices, calculating weights, and validating consistency. In contrast, the entropy weight method is an objective approach based on information entropy principles. This method calculates the entropy value of each indicator to assess its information contribution and then determines the indicator’s weight in the comprehensive evaluation accordingly.
In the evaluation system of distribution network hosting capacity, the analytic hierarchy process quantifies the importance of each evaluation index based on expert judgment, so as to make up for the hidden factors ignored by the data-driven method. The entropy weight method calculates the weight based on the information entropy of the index data, reflecting the inherent law of the data itself. To more comprehensively reflect both subjective and objective factors in the evaluation process, the combined weighting method integrates subjective and objective weights using multiplicative synthesis [20]. This approach not only ensures data objectivity but also incorporates expert judgment, thus overcoming the limitations associated with single weighting methods. As a result, it is particularly well-suited for handling the complexities inherent in distribution network hosting capacity assessment.
where represents the combined weight of the j-th indicator; denotes the weight of the j-th indicator determined by the Analytic Hierarchy Process; and signifies the weight of the j-th indicator calculated by the entropy weight method.
In assessing the hosting capacity of distributed renewable energy in distribution networks, the core methodology centers on developing operational performance indicators for the network, performing steady-state operation simulations across various renewable energy penetration levels and configuration scenarios, and calculating the associated risk indicators. The optimal hosting capacity is identified as the one corresponding to the lowest comprehensive risk indicator. Additionally, by considering the maximum risk threshold acceptable to distribution network operators, the maximum permissible hosting capacity for distributed renewable energy is determined.
First, all stochastic scenarios outlined in Section 2 are iterated through to compute the risk indicators for each scenario. The coefficient of variation for each risk indicator is subsequently calculated using Equations (16)–(18), allowing for an evaluation of the Monte Carlo simulation’s convergence within the hosting capacity assessment framework:
where represents the total number of sampling iterations; denotes the indicator loss quantity of the i-th sampling; and indicates the coefficient of variation.
Finally, the DG penetration limit value corresponding to (where is the acceptable risk threshold of the distribution network) is selected as the maximum distributed renewable energy capacity that the distribution network can host.
When evaluating the new energy hosting capacity of distribution network, the random simulation of various DG configuration modes is realized by random scene analysis method, so as to avoid the limitation of single scene analysis. Based on the two-stage clustering method, the typical time series curve of wind–solar-load is generated to avoid the one-sidedness of the static peak hypothesis of node output and load level in the traditional method. A multi-dimensional risk index considering voltage over-limit, line overload, transformer heavy overload, network loss and load loss risk is constructed to achieve a comprehensive assessment of safety, reliability and economy. Distribution network operators can set risk thresholds according to the operation safety of distribution network, the regulation ability of electrical indexes such as voltage and power flow, and the planning demand of distributed new energy, and bear a certain possibility of exceeding the limit in exchange for more capacity of distributed new energy grid connection. The above-mentioned evaluation method process of distribution network hosting capacity considering the uncertainty of power on both sides of source and load and the uncertainty of distributed new energy configuration mode is shown in Figure 4.
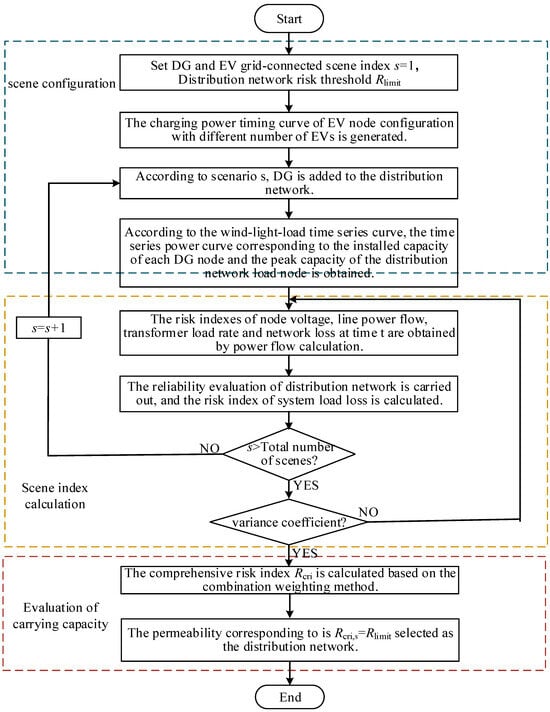
Figure 4.
Flow chart of distribution network hosting capacity evaluation method.
4. Case Studies
4.1. Parameter Settings
Simulation analysis is performed using the IEEE 33-node distribution system to validate the effectiveness of the proposed hosting capacity assessment methodology under multiple uncertainty factors. The network structure of the IEEE 33-node system, illustrated in Figure 5, consists of 33 nodes and 32 lines, with a total load of 3.715 MW and 2.3 Mvar. The system base voltage is 12.66 kV, and the permissible voltage deviation at nodes is ±7% of the nominal voltage. The line between nodes 2 and 3 uses the LGJ-70 model, the line at node 6 uses the LGJ-35 model, and all other lines use the LGJ-16 model. The respective current-carrying capacities are 195 A for LGJ-70, 135 A for LGJ-35, and 85 A for LGJ-16. The distribution transformer has a capacity of 5 MVA.
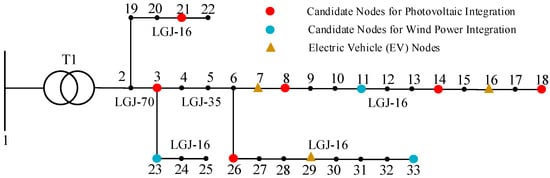
Figure 5.
IEEE 33-node Distribution Network Structure.
The initial penetration rate, terminal penetration rate, and penetration rate iteration step are set to 20%, 260%, and 5%, respectively. The distributed photovoltaic to dispersed wind power penetration ratio is set at 4:1. For each penetration rate, the number of simulated stochastic scenarios (M) is 2000. Electric vehicles (EVs) are integrated at nodes 7, 16, and 29, with quantities of 100, 50, and 80, respectively. The ownership distribution for private cars, buses, and taxis is set at 75%, 10%, and 15%.
A total of 2000 Monte Carlo scenarios were simulated for each penetration level. Convergence analysis based on the coefficient of variation (Equation (18)) confirmed that the variation in key risk indicators remained below 2%, which satisfies standard statistical stability requirements. The stochastic parameters follow Beta, Weibull, and Gaussian distributions for PV output, wind speed, and load demand, respectively, ensuring realistic uncertainty representation.
4.2. Analysis of Distribution Network Hosting Capacity Assessment Results
A stochastic scenario generation method utilizing Monte Carlo simulation is employed to resolve the distribution network hosting capacity, simulating sequences of distributed generation (DG) configuration scenarios that follow specific probability distributions. The maximum hosting capacity of the distribution network at an acceptable risk level is determined by establishing a comprehensive risk threshold for evaluation.
- Impact of Source-Load Power Uncertainty on System Risk
At a penetration rate of 20%, nodes 3, 14, 18, 21, and 26 are selected for photovoltaic integration, while nodes 23 and 33 are chosen for wind power integration. Typical day 4 serves as the source-load power curve representing the distribution network operation scenario. The node voltage distribution for this scenario is shown in Figure 6a, illustrating that voltages at the end nodes drop below the permissible lower threshold.
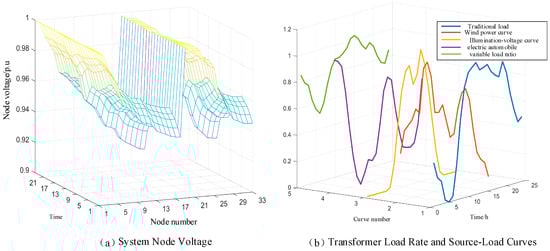
Figure 6.
System Voltage and Transformer Load Rate Status in Scenario M1.
Simultaneously, the distribution transformer in this scenario experiences forward overload. As shown in Figure 6b, peak electric vehicle (EV) charging occurs between 12:00 and 14:00, coinciding with the traditional load peak and resulting in a superposition effect. Although photovoltaic generation also peaks during this window, wind power output is at a minimum, and the overall penetration level remains low, leading to inadequate distributed generation (DG) supply capacity. This mismatch between supply and demand heightens the transformer’s burden in supplying power to downstream loads, ultimately causing transformer forward overload. These findings underscore the necessity for distribution network hosting capacity assessments to comprehensively account for the effects of source-load power uncertainties.
Given that the reactance of the interconnected line between stations is significantly greater than the resistance, the line resistance can be neglected. Under this condition, the mutual power is given by:
- 2.
- Differential Impact of Stochastic Scenario Configuration on System Risk
At a penetration rate of 180%, nodes 3, 21, and 23 are selected for photovoltaic and wind power installation, with typical day 5 serving as the source-load output curve for distribution network operation scenario M3. The line power and distribution transformer load rates for this scenario are depicted in Figure 7. As shown by the line power distribution in Figure 7a, when distributed generation units are concentrated near transformer nodes, the line’s power-hosting capacity is insufficient to accommodate the reverse power flow induced by high penetration levels of distributed generation, resulting in line power exceeding the rated capacity. The calculated branch power violation risk and transformer reverse overload risk for this scenario are 1.634 × 10⁻⁶ and 3.049 × 10⁻⁵, respectively.
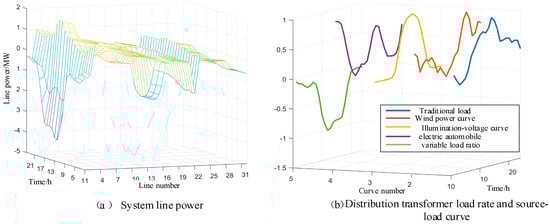
Figure 7.
Line Power and Transformer Load Rate Status in Scenario M3.
In this scenario, distributed generation (DG) is concentrated near transformer nodes. At high DG penetration rates, the distribution network demonstrates a degree of self-sufficiency in power supply, thereby reducing the reliance on the main transformer to supply downstream loads. However, when there is a mismatch between load demand and renewable generation output, instances occur where DG surpasses the network load demand, causing reverse power flow toward the main grid. These results reveal that changes in stochastic scenario configurations have a direct impact on the risk level of the system. Specifically, under high DG penetration, power backflow resulting from concentrated integration emerges as a key factor limiting the hosting capacity of distribution networks.
- 3.
- Multi-Dimensional Risk Quantification of Distribution Systems at Different Penetration Levels
As shown in Figure 8, when the penetration rate reaches 100%, the voltage violation risk in the distribution network decreases to its minimum value of 6.892 × 10⁻⁴. However, within the penetration range of 100% to 130%, the risk of voltage violation gradually increases as the integration capacity of distributed generation (DG) rises, reaching a value of 9.565 × 10⁻⁴ at 130% penetration.
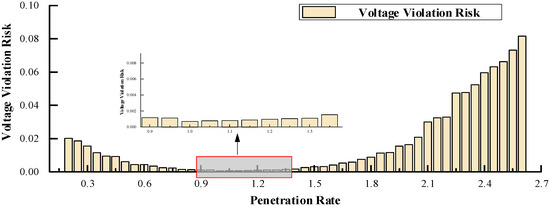
Figure 8.
Node Voltage Violation Risk Indicators at Different Penetration Levels.
In the low penetration phase, voltage violation risks in the distribution network are primarily attributed to the large-scale, concentrated integration of EV charging loads combined with insufficient distributed generation (DG) supply capacity. This mismatch results in the DG being unable to meet peak EV load demand, thereby leading to significant under-voltage risks. In the high penetration phase (105–260%), voltage violation risks progressively increase, chiefly due to reverse power flow caused by excessive DG output being fed back into the grid, ultimately resulting in over-voltage risks. Furthermore, the centralized deployment of DG during this phase further exacerbates voltage violation risks.
As shown in Table 1, at a DG penetration rate of 20%, the voltage violation risk is 2.025 × 10⁻² and the transformer forward overload risk reaches 3.937 × 10⁻³. When the penetration rate increases to 35%, the presence of multiple DG supply points optimizes the traditional single-end power supply mode of distribution networks. Consequently, the transformer forward overload risk falls to zero, the voltage violation risk decreases to 1.149 × 10⁻², and other risk indicators also decline. These results demonstrate that increasing the DG penetration rate effectively relieves the operational pressure on the distribution network. The decentralized nature of DG power supply reduces the load on heavily loaded nodes, improves voltage levels at these locations, and alleviates risks associated with concentrated integration of EV charging loads.

Table 1.
System Risk Indicators at Different Penetration Levels.
The trends in transformer forward and reverse overload risks are depicted in Figure 9. In the initial penetration phase (20–30%), forward overload is the predominant risk. During the mid-term penetration phase (35–145%), there is no observable overload risk. In the high penetration phase (150–260%), reverse overload risk emerges as the primary concern.
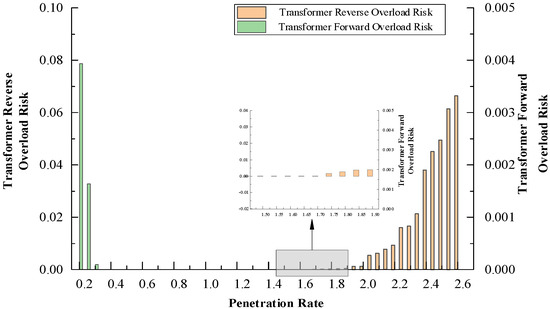
Figure 9.
Transformer Overload Risk Indicators at Different Penetration Levels.
In the initial phase of DG penetration, transformer forward overload risk is significant. As DG integration increases, the distributed generation effectively contributes to meeting grid load demand, resulting in a corresponding reduction in transformer forward overload risk. Within the DG penetration range of 35–145%, the transformer overload risk drops to zero—demonstrating that, under stochastic scenarios accounting for DG configuration and source-load output uncertainties, no transformer overload situations arise in this interval. This establishes a transformer overload risk boundary condition, offering valuable guidance for network operators when formulating distributed generation integration capacities.
In the 150–170% penetration phase, transformer forward overload risk remains relatively minor, with reverse overload risk—primarily resulting from the concentration of DG integration near transformers in stochastic scenario configurations—becoming the dominant factor. During this phase, the reverse overload risk can be mitigated through the optimization of DG spatial layout. However, as the penetration rate exceeds 175%, the reverse overload risk begins to rise nonlinearly, indicating an accelerating vulnerability of the system to such overloads at very high DG integration levels.
As indicated in Figure 10, line power flow overload risk increases slowly during the 25–125% penetration phase, but demonstrates a nonlinear growth pattern in the 150–260% penetration phase.
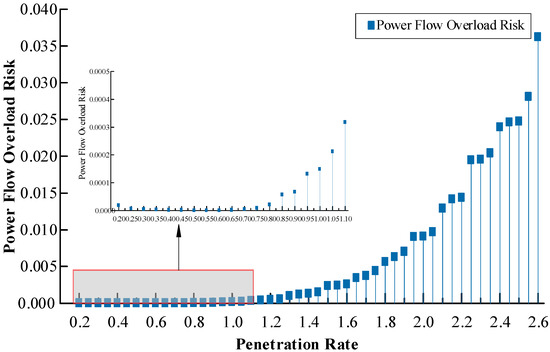
Figure 10.
Line Power Flow Overload Risk Indicators at Different Penetration Levels.
Within the 25–75% penetration range, distribution network power flow overload risk remains below 2.541 × 10⁻⁶ and is primarily attributable to extreme scenarios featuring highly concentrated DG configurations. Since practical distribution network planning generally employs dispersed DG integration, such extreme concentration scenarios are rare, and thus the power flow overload risk in this range is negligible. As DG penetration increases, the power flow overload risk shows gradual growth during the 75–145% penetration phase, offering network operators an adjustable window to manage overload risks. However, at penetration rates of 150% and higher, the line power flow violation risk escalates exponentially, subjecting the distribution network to unacceptably high levels of power flow violation risk.
As shown in Figure 11, the risk of load loss gradually decreases with the increase of DG permeability. In the low penetration stage, the access of DG helps to form an island power supply after the line fault, but the limited island operation capacity leads to the inability of some loads to supply power. The island operation ability in the high permeability stage is improved, which can effectively reduce the risk of system load loss.
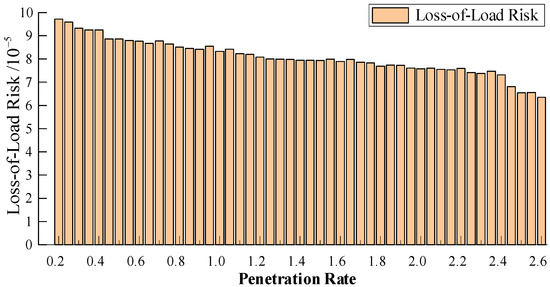
Figure 11.
Please cite this figure in the text and ensure that the first citation of each figure appears in numerical order.
The integration of distributed generation (DG) can significantly reduce network losses in distribution systems. As depicted in Figure 12, this loss reduction is most pronounced at a DG penetration rate of 165%. However, further increases in DG penetration lead to noticeable loss increases due to the effect of reverse power flow, thereby diminishing the effectiveness of the loss reduction indicator.
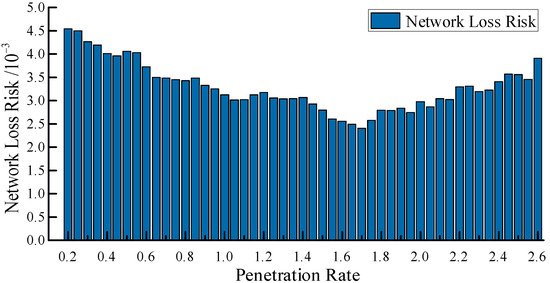
Figure 12.
System network loss risk under different permeability levels.
The loss-of-load risk and network loss risk assess the impact of DG integration capacity on system performance from reliability and economic perspectives, respectively. To achieve a comprehensive evaluation of the distribution network’s optimal hosting capacity and the maximum hosting capacity acceptable under specified risk levels, these risks must be integrated with security-related risks such as voltage limit violations, power flow overloads, and transformer overloads.
Nonlinear growth in Figure 10 and Figure 12 is mainly attributed to the compounded effects of reverse power flow and local voltage rise at high DG penetration, indicating that beyond 175% penetration, marginal integration yields diminishing stability returns.
A unified methodology for hosting capacity assessment is utilized to process and evaluate the multi-dimensional risk indicators present in the distribution network.
As illustrated in Figure 13, the security risk of the distribution system reaches its lowest value at a penetration rate of 100%. When considering only security risks, the optimal hosting capacity for distribution network operators is 3.715 MW. However, when incorporating a comprehensive set of factors—including security, network loss (economy), and power supply reliability—the minimum comprehensive system risk is observed at a penetration rate of 105%, with a value of 5.159 × 10⁻². Accordingly, the optimal hosting capacity considering all risk dimensions is 3.9 MW. Meanwhile, within the penetration range of 110% to 145%, security risks exhibit a gradual upward trend, while reliability and economic risks demonstrate a downward tendency. No reverse overload risk has been detected in transformers during this phase. For this penetration interval, distribution system operators (DSOs) may establish risk thresholds based on the voltage and power flow regulation capabilities of adjustable resources within the system, thereby assessing the maximum hosting capacity under acceptable risk levels. Under the constraint of a comprehensive risk threshold of 6.592 × 10⁻², the upper limit of DG penetration rate is identified as 140%, with a corresponding DG integration capacity of 5.201 MW, and exceeding this critical value triggers a nonlinear increase in voltage violation risk, transformer reverse overload risk, and line overload risk, consequently rendering the comprehensive risk of the distribution network excessive.
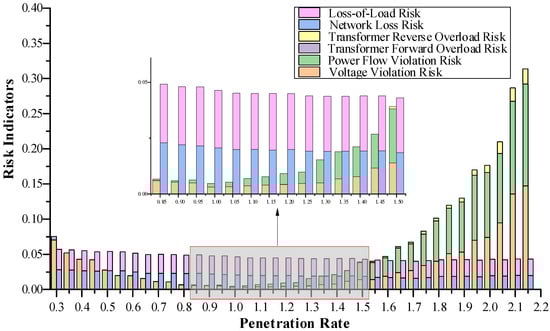
Figure 13.
System Network Loss Risk at Different Penetration Levels.
The corresponding quantitative results are summarized in Table 2 for clarity and comparison.
Table 2.
Summary of Optimal and Maximum Hosting Capacities with Corresponding Composite Risk Levels.
Although a detailed sensitivity analysis was not conducted, the influence of model parameters such as penetration step size, EV distribution, and DG capacity ratio (PV:WT) was qualitatively examined. It was observed that reducing the penetration step size can slightly improve the smoothness of risk convergence, while changes in EV spatial distribution primarily affect voltage violation risks in terminal nodes. In addition, variations in the PV-to-WT ratio may alter the relative contributions of intermittent sources to overall uncertainty, but the overall hosting capacity boundaries remain consistent within a reasonable range. These observations indicate that the proposed evaluation framework maintains good robustness with respect to parameter variations.
5. Conclusions
This paper investigates the impact of DG configuration uncertainties and source-load power uncertainties on distribution network hosting capacity, proposing an assessment method based on stochastic scenario analysis and multi-dimensional risk quantification. The stochastic scenario analysis method is adopted to generate configuration scenarios covering the diversity in DG integration locations and capacities. A multi-dimensional evaluation index system for distribution network hosting capacity is constructed to quantify risks, including voltage limit violations, line power flow overloads, transformer overloads, network losses, and loss of load, under different penetration levels. A comprehensive risk indicator for the distribution network is established via a combined subjective-objective weighting method. Based on typical scenarios of renewable generation, load, and DG configurations, the proposed method calculates distribution network risk indicators across various penetration levels. Finally, simulation validation using the IEEE 33-node system yields the following key conclusions:
- The proposed risk indicators effectively quantify security risks (voltage limit violations, line overloads, and transformer overloads) as well as economic and reliability risks (network losses and loss of load) arising from uncertainties in source-load power and DG configuration schemes. These indicators accurately capture the actual hosting capacity of distribution networks under multiple uncertainties, offering a more scientific basis for decision-making in planning DG integration capacity for new distribution systems with high penetration of DG and EV integration.
- Computational analysis of the multi-dimensional distribution network hosting capacity via the combined weighting method indicates that the optimal hosting capacity considering security risks alone is 3.715 MW, whereas that considering comprehensive risks is 3.9 MW. Under the constraint of an acceptable risk threshold, the maximum hosting capacity attains 5.201 MW. Compared with the optimal capacity of 3.9 MW, this corresponds to a 33.36% increase in hosting capacity under acceptable risk levels. Compared with deterministic hosting capacity evaluation, the proposed stochastic risk-based method significantly improves hosting capacity prediction accuracy and reduces the overall system risk. It can effectively provide more reasonable decision-making guidance for the evaluation of distribution network carrying capacity under the background of considering multiple uncertain factors.
Author Contributions
H.L. contributed to conceptualization and methodology. J.H. organized the data curation. L.D. performed the formal analysis. J.X. contributed to the investigation. Y.C. used software and wrote the original draft of the manuscript. All authors contributed to manuscript revision, read, and approved the submitted version. All authors have read and agreed to the published version of the manuscript.
Funding
This research was funded by the Technology Project of Maoming Power Supply Bureau of Guangdong Power Grid Co., Ltd., grant number 030900KC23120011 (GDKJXM20231514).
Data Availability Statement
The raw data supporting the conclusions of this article will be made available by the authors, without undue reservation.
Acknowledgments
This article is grateful to the China Southern Power Grid, Power Grid Project, for funding.
Conflicts of Interest
Authors Haitao Liu, Jinxiong He, Liuyi Deng and Jianyuan Xu were employed by the company Guangdong Power Grid Co., Ltd. Maoming Power Supply Bureau. The remaining author declares that the research was conducted in the absence of any commercial or financial relationships that could be construed as a potential conflict of interest.
References
- Liu, H.; Cao, R.Z.; Han, J.; Cai, C.; Pan, W.J.; Li, J.K. Research Status and Prospect of Distributed Generation Hosting Capacity Evaluation for Distribution Networks. Autom. Electr. Power Syst. 2025, 49, 21–33. [Google Scholar]
- Chen, X.; Wu, W.; Zhang, B. Robust Capacity Assessment of Distributed Generation in Unbalanced Distribution Networks Incorporating ANM Techniques. IEEE Trans. Sustain. Energy 2018, 9, 651–663. [Google Scholar] [CrossRef]
- Wu, S.; Yu, J.; Yang, W. Chance-Constrained Evaluation Model and Transformation Method for Maximum Grid Integration Capacity of Distributed Generation in Distribution Networks. Power Syst. Technol. 2018, 2, 3691–3697. [Google Scholar]
- Mahdavi, M.; Awaafo, A.; Schmitt, K.; Chamana, M.; Jurado, F.; Bayne, S. An Effective Formulation for Minimizing Distribution Network Costs Through Distributed Generation Allocation in Systems With Variable Loads. IEEE Trans. Ind. Appl. 2024, 60, 5671–5680. [Google Scholar] [CrossRef]
- Mahdavi, M.; Jurado, F.; Schmitt, K.; Chamana, M. Electricity Generation From Cow Manure Compared to Wind and Photovoltaic Electric Power Considering Load Uncertainty and Renewable Generation Variability. IEEE Trans. Ind. Appl. 2024, 60, 3543–3553. [Google Scholar] [CrossRef]
- Li, Q.; Deng, Q.; Lin, H. Evaluation and Enhancement Strategy for Electric Vehicle Hosting Capacity in Distribution Systems Considering Flexibility. J. Electr. Power Sci. Technol. 2019, 34, 37–46. [Google Scholar]
- Deng, M.L.; Chen, Y.J.; Bai, Z.Y. Quantitative Method for Distributed Photovoltaic Hosting Capacity of Distribution Networks Based on Static Voltage Stability Margin. J. Shanghai Jiao Tong Univ. 2025, 1–25. [Google Scholar] [CrossRef]
- Dubey, A.; Santoso, S. On Estimation and Sensitivity Analysis of Distribution Circuit’s Photovoltaic Hosting Capacity. IEEE Trans. Power Syst. 2017, 32, 2779–2789. [Google Scholar] [CrossRef]
- Wang, H.; Wang, Z.; Han, H.; Ji, R. Research on Photovoltaic Hosting Capacity of Residential Distribution Networks Using Monte Carlo Hourly Estimation Model. J. Northeast Electr. Power Univ. 2023, 43, 9–19. [Google Scholar]
- Li, Z.; Wang, Y.; Huang, J. Data-Driven Probabilistic Assessment of Distributed Generation Allocation Considering Multi-Source Uncertainty. IEEE Trans. Ind. Appl. 2024, 60, 5123–5135. [Google Scholar]
- Zhang, X.; Chen, L.; Deng, Y. Robust Stochastic Programming for Hosting Capacity Quantification under Correlated Renewable Fluctuations. IEEE Trans. Ind. Appl. 2023, 59, 6891–6902. [Google Scholar]
- Chen, X.; Tian, G.; Zhao, J. Multi-Level Cooperative Evaluation of Renewable Energy Hosting Capacity in Distribution Networks. J. Yanshan Univ. 2025, 49, 121–129. [Google Scholar]
- Ding, F.; Mather, B. On Distributed PV Hosting Capacity Estimation, Sensitivity Study and Improvement. IEEE Trans. Sustain. Energy 2017, 8, 1010–1020. [Google Scholar] [CrossRef]
- Abad, M.S.S.; Ma, J.; Zhang, D.; Ahmadyar, A.S.; Marzooghi, H. Probabilistic Assessment of Hosting Capacity in Radial Distribution Systems. IEEE Trans. Sustain. Energy 2018, 9, 1935–1947. [Google Scholar] [CrossRef]
- Yao, H.; Qin, W.; Jing, X. Assessment Method for Distributed Photovoltaic Hosting Capacity in Low-Voltage Distribution Networks Based on Possibility Theory. High Volt. Eng. 2024, 50, 2682–2692. [Google Scholar]
- Agajie, T.F.; Khan, B.; Guerrero, J.M.; Mahela, O.P. Reliability Enhancement and Voltage Profile Improvement of Distribution Network Using Optimal Capacity Allocation and Placement of Distributed Energy Resources. Comput. Electr. Eng. 2021, 93, 107295. [Google Scholar] [CrossRef]
- Zhao, B.; Wei, L.; Xu, Z. Stochastic Scenario Analysis of Feeder Photovoltaic Hosting Capacity Considering Energy Storage Systems. Autom. Electr. Power Syst. 2015, 39, 34–40. [Google Scholar]
- Liu, J.; Li, G.; Zeng, J. Spatiotemporal Optimal Scheduling of Electric Vehicles in Integrated Parks Considering Local Renewable Energy Consumption. Control Theory Appl. 2025, 42, 1345–1355. [Google Scholar]
- Wang, Y.; Yu, H.; Zeng, S. Research on Renewable Energy Hosting Capacity Evaluation Indicators for Active Distribution Networks with Renewable Energy Integration. Power Equip. Manag. 2025, 3, 45–47. [Google Scholar]
- Hao, W.; Meng, Z.; Zhang, Y. Research on Hosting Capacity Assessment Method for Distribution Networks with Multiple Distributed Energy Resources in New Power Systems. Power Syst. Prot. Control 2023, 51, 23–33. [Google Scholar]
Disclaimer/Publisher’s Note: The statements, opinions and data contained in all publications are solely those of the individual author(s) and contributor(s) and not of MDPI and/or the editor(s). MDPI and/or the editor(s) disclaim responsibility for any injury to people or property resulting from any ideas, methods, instructions or products referred to in the content. |
© 2025 by the authors. Licensee MDPI, Basel, Switzerland. This article is an open access article distributed under the terms and conditions of the Creative Commons Attribution (CC BY) license (https://creativecommons.org/licenses/by/4.0/).