Review

Challenges in Fault Diagnosis of Nonlinear Circuits

by
Stanisław Hałgas
Department of Electrical, Electronic, Computer and Control Engineering, Lodz University of Technology, Stefanowskiego 18, 90-537 Lodz, Poland
Electronics 2025, 14(22), 4427; https://doi.org/10.3390/electronics14224427
Submission received: 16 October 2025 / Revised: 8 November 2025 / Accepted: 12 November 2025 / Published: 13 November 2025

Abstract

The paper focuses on fault diagnosis in nonlinear analog circuits, a topic that has been explored in the literature for over 50 years but remains unresolved due to its complex nature. It reviews various aspects of nonlinear circuit diagnosis, including methods for assessing testability, selecting diagnostic tests, and conducting diagnostic processes through simulation before and after test methods. The paper also discusses the use of artificial intelligence tools in this context. Given the specific characteristics of nonlinear circuits used as DC-DC converters and the wealth of the existing literature—including review papers on the subject—this issue is addressed only briefly. The main aim of the paper is to identify research challenges in fault diagnosis for a general class of nonlinear circuits. To illustrate and discuss these challenges, the paper provides examples, including ambiguity in diagnostic equation solutions, multiple equilibrium points, and the effects of self-heating. These examples can serve as simple benchmarks for new proposals to advance comprehensive diagnosis methods for nonlinear circuits.

1. Introduction

Fault diagnosis is a critical issue in various engineering disciplines, including mechanical, electrical, and military systems. A well-structured diagnostic process can significantly enhance equipment performance, minimize the risk of failure, reduce service times, and ensure safe operations. Analog circuits represent fundamental elements in nearly every engineering solution. Advancements in integrated circuits and semiconductor technology have led to increased interest in computer-aided design methodologies for nonlinear circuits and systems. Research and development centers have made significant efforts to address key challenges, including developing efficient algorithms for circuit analysis and applying design-for-testability principles. Although approximately 20% of the circuits within an electronic circuit are analog, it is noteworthy that over 80% of faults arise from the analog section [1,2,3,4,5]. This disparity is a consequence of the diversity and complexity of these circuits, which operate on signals covering a wide range of values. Factors such as noise, temperature fluctuations, tolerance variations, measurement uncertainties, limited access for testing, ambiguous groups, and the infinite spectrum of parameter values further contribute to this complexity. These challenges underscore the necessity for effective diagnostic methods. The pursuit of improvements in the testing processes for analog circuits has been a longstanding focus of research, as evidenced by the increasing volume of scientific publications.
Analog circuits are vulnerable to both single faults (the most common type) and multiple faults. Faults can be categorized as either hard (catastrophic) faults, which can lead to changes in circuit topology due to shorts or opens, or soft (parametric) faults, which occur when parameter values fall outside acceptable tolerance ranges [1,3,6,7]. An incipient fault, as a special case of a soft fault, occurs when a component parameter changes slightly, allowing the circuit to function but with degraded performance (see e.g., [2,8,9,10,11,12]). Additionally, faults can be permanent or intermittent [7,13,14,15]. Most physical failures (80–90%) in integrated circuits (ICs) are due to local spot faults. Spot opens and shorts represent extreme cases in which there is a significant increase or decrease from the nominal values observed and can be modeled by connecting a high resistance (e.g., 100 k Ω –10 M Ω ) in series with a component or path. Conversely, a short fault can be simulated by connecting a low resistance (e.g., 10 Ω –10 k Ω ) between a pair of nodes [16].
To develop effective diagnostic methods, it is crucial to select appropriate measurement nodes, test frequencies, excitation waveforms, and signal amplitudes (or DC voltages) based on a specific application. This process is referred to as test point selection (see, e.g., [17,18,19,20,21,22,23]). The stimulus generator is tailored to the required measurement type. There are four main types of measurements. DC static measurements find the DC operating points, DC bias, DC offset voltages, and DC gains. AC dynamic measurements assess the circuit’s frequency response. Typically, a sine waveform with a variable frequency or a harmonic spectrum as the input is used. Time-domain measurements utilize pulse signals, square or triangular waves, steps, ramps, and pulse trains. Noise measurements evaluate how much the output signal varies when the input is set to zero [3]. Another critical factor in diagnosing analog circuits is their testability. Testability provides a theoretical, rigorous upper bound on the solvability of the test equations once a set of test points has been determined [7,24,25]. However, limited measurement accessibility and the existence of ambiguity groups can often lead to ambiguous solutions for nonlinear test equations. The literature discusses various techniques for assessing the testability of linear circuits and certain classes of nonlinear circuits, such as DC-DC converters.
Various diagnostic techniques are commonly employed to identify faults in electronic circuits. Typically, methods categorized simulation after test (SAT) are used to detect soft faults, while simulation before test (SBT) techniques are used for hard faults [3,6]. The objectives of the testing process may vary significantly. In its most fundamental application, this methodology assesses whether the circuit is functionally sound. More advanced techniques can identify faulty components, and the comprehensive diagnostic process also includes estimating parameter values. Parameter identification techniques, with enough independent measurements, identify all network parameters. Fault verification techniques assume that only a few elements are faulty (the k-fault hypothesis). Approximation techniques use optimization methods to estimate faulty elements [6,26].
The diagnostic methodologies are grounded in various mathematical concepts and techniques derived from circuit and signal theory. Among the most frequently utilized methods for feature extraction from measurement signals are the Fourier and wavelet transforms. The rapid advancements in artificial intelligence (AI), particularly in deep neural networks, have contributed to the increasing prevalence of these techniques in diagnostic applications [1,3,27], especially in the last years, e.g., [5,23,28,29,30,31,32,33,34,35,36,37,38,39]. The existing literature primarily focuses on testing linear or linearized circuits. Due to the specific nature of AI tools, methods generally consider only single soft faults with strictly defined values (e.g., faults corresponding to ±30% or ±50% of the nominal value) or faults that fall within preselected ranges. However, specific publications do permit the analysis of selected multiple faults. The nature of soft fault diagnosis limits the effectiveness of SBT methods during the design stage, when identifying multiple soft faults is necessary. In such cases, the SAT methods are typically used. The techniques usually yield a nonlinear test equation (NTE), and its solutions help identify the faulty parameters. During the diagnostic process, NTE is created and solved using measured values of some circuit quantities. The solutions to NTE provide the values of the element parameters. It is essential to recognize that the test equation is typically nonlinear, even for linear circuits, and may yield one or multiple solutions. If parameter variations are significant, iterative methods for solving NTE may either fail to converge or converge to virtual solutions. Furthermore, several parameter values for a set of fixed components may satisfy NTE.
The paper focuses on the fault diagnosis of nonlinear circuits. It discusses key concepts in this field as presented in the existing literature (Section 2). The paper presents some methods in testability, test point selection, and SBT and SAT approaches. For the review, we selected approaches from original papers that addressed nonlinear systems and demonstrated their application on nonlinear circuits. Given the unique nature of DC-DC converters and the extensive body of literature, including numerous review papers that address this specific class of nonlinear circuits, Section 2 provides only the most essential information. The central part of the paper is Section 3, which highlights selected problems and challenges in fault diagnosis for a general class of nonlinear circuits. Using simple circuits, it is shown that even with a single hard fault, fault diagnosis of transistor circuits can be challenging. It has also been demonstrated that soft faults and temperature effects can alter the number of operating points. Furthermore, there is currently no method that can determine all solutions to NTE for a given test. The paper concludes with a summary of these considerations.

2. Fault Diagnosis of Nonlinear Circuits

The diagnosis of linear circuits is well established and broadly understood. However, applying these diagnostic methods to nonlinear circuits is challenging due to their unique behaviors, including bias shifting and multiple operating points. A fault in a nonlinear component can disrupt the entire DC bias network, primarily because of feedback mechanisms, leading to significant voltage and current fluctuations that may cause functioning devices to appear faulty. Additionally, nonlinear circuits can have multiple valid operating points, although typically only one is used during regular operation, which complicates the accurate identification of faults [26]. A timeline of research achievements in nonlinear analog circuit fault diagnosis is presented in Table 1. Below, we discuss some significant contributions to the diagnosis of nonlinear circuits.

2.1. Testability and Test Selection

Berkowitz was the first to study how to determine a network’s element values using measurements taken at its test terminals. Navid and Willson [24] later established conditions under which the value of each element can be uniquely identified from the measurements based solely on the network’s topology. The approach described here assumes enough independent test measurements are collected to match the number of unknown parameters. The analysis focuses on transfer admittances between test terminals, with extensions provided for small-signal transistor and diode models. Approach [7] supports testability design by providing a structured, quantitative method for selecting and minimizing test points and defining input stimuli to meet detection and isolation goals. An isolation algorithm groups indistinguishable faults into ambiguity sets based on voltage ranges of ±0.7 V. Faults within the same set cannot be uniquely identified.
Piecewise-linear (PWL) approximation models a nonlinear characteristic by dividing its behavior into multiple linear segments. Each segment represents the system’s response over a specific input range, simplifying analysis and simulation. PWL is widely used for fault diagnosis, circuit modeling, and simplifying nonlinear computations. Fedi et al. [40] proposed a symbolic method for evaluating the testability of nonlinear analog circuits. The technique extends approaches originally developed for linear circuits by replacing each nonlinear device, such as a diode or transistor, with an approximate PWL model. Symbolic network functions are derived to build a testability matrix whose rank reveals the circuit’s testability. Incipient faults present a significant challenge for traditional testability assessment methods. They involve minor parameter deviations that often keep the system operating within or near normal ranges, making them hard to distinguish from natural variations due to tolerances, aging, or environmental effects. The theoretical foundations of testability, developed primarily for linear systems and based on symbolic analysis, assume ideal conditions with fixed measurement access and perfect precision - assumptions rarely met in practice. As a result, real measurements introduce additional ambiguities. Incipient faults usually cause only minor changes in circuit behavior. In such cases, nonlinear effects are limited, the operating points of nonlinear elements remain nearly constant, and linear approximations remain valid. A data-driven, simulation-based diagnostic model is proposed in [65] for testability analysis. Single hard faults are injected and simulated to generate data, and the K-nearest neighbors classifier is studied to evaluate the testability metrics. Four representative testability metrics are defined: fault detection rate, fault isolation rate, false alarm rate, and mean fault isolation time.
Selecting test points and choosing input stimuli are critical challenges in fault diagnosis. The following concepts, which focus on nonlinear circuits, are presented. A method for determining the smallest set of test nodes required to isolate all faults using the fault dictionary (FD) approach, accompanied by the supporting theorem and its proof, is presented in [17]. Paper [18] demonstrates that the techniques initially developed for selecting test nodes for FD are generally unsuitable for SAT approaches. A new method is proposed that manipulates ambiguity sets to guide test node selection by leveraging hashing. In [19], an efficient entropy-based method is suggested to select an optimal set of test points for FD techniques. This method uses a two-dimensional integer-coded dictionary to link measurements to faults and test points, selecting the points with the lowest entropy to form the optimal set. An integer-coded table technique for test point selection that considers both component tolerances and test point dependencies is proposed in [64]. This approach employs a heuristic graph search method alongside the concept of entropy. Paper [62] addresses a similar problem using a greedy randomized adaptive search procedure, whereas in [63] tabu search and genetic algorithms are explored. The method proposed in [81] combines clustering-based discretization with an extended FD concept to enhance fault diagnosis; it permits multiple integer codes for each fault and selects test points based on an entropy measure. Luo et al. [20] present a test node selection method for continuous parameter shifting faults. Ambiguous faults are identified through Kruskal-Wallis tests, and an optimal set of test nodes is selected by treating FDs as connected graphs and applying an improved depth-first search algorithm. Kernel density estimation with K-nearest neighbors is employed in [21] to evaluate diagnostic capability, and a genetic algorithm is then used to find a quasi-optimal set of test points. Paper [22] introduces a method for test point selection in DC circuits using an FD for each component, utilizing an exclusive-inclusive algorithm to assign grades to test points and eliminating those that fall below a certain threshold.
Reference [50] presents a method for generating transient tests by linking circuit functionalities to potential physical failures. Circuit specifications are mapped to process parameter limits, then to allowable measurement deviations, and finally back to parameter variations. Using a cost function, a PWL input stimulus is optimized to ensure that any violation of measurement thresholds indicates a specification failure. The same kind of stimuli is considered in [51]. To create an optimal transient test stimulus, a nonlinear programming problem is formulated. A merit function measuring differences between fault-free and faulty responses is optimized to find parameters that describe the stimulus. In [52], the optimization of PWL test stimuli for analog integrated circuits (ICs) is proposed, combining device-parameter extraction with cause-performance analysis using a genetic algorithm. Spinks et al. [53] propose a methodology for generating test stimuli and performing fault simulation to detect hard faults in transistors using RMS AC supply current monitoring. The parameters of a single sinusoid with a DC offset are optimized using sensitivity analysis and verified through fault simulation. A test selection model that employs a deep joint distribution to account for dependence and ambiguity groups is described in [79]. An improved binary particle swarm optimization (PSO) algorithm is used to select optimal tests while satisfying constraints on fault detection and isolation rates.
The literature review indicates that the current methods for testability analysis and test point selection have some limitations related to the semiconductor models used and the types of faults considered. While dictionary-based methods and AI-driven approaches have been well developed for handling single hard faults and preselected soft faults, specific challenges can arise in certain classes of nonlinear circuits. These issues are addressed in Section 3.

2.2. Simulation Before Test Methods and Artificial Intelligence-Based Approaches

The SBT (Signature-Based Testing) approach involves simulating a set of predetermined faults and recording the results in a fault dictionary (FD), either in their raw form or after processing. The methods enable the extraction of relevant diagnostic features. Measured responses from the faulty circuit are then compared with the FD signatures, with the closest match indicating the likely fault. The methods are effective for identifying a single hard fault; however, they become impractical when dealing with multiple soft faults, as the fault dictionaries must grow to unmanageable sizes. Faults such as open and short circuits involving both passive and active components can easily be included in FD. Paper [7] describes a method for creating analog FDs to detect and isolate single hard and soft faults. By using failure histories, carefully selected test stimuli, and specific test points, the approach can identify approximately 70% of these faults. Fault detection relies on measuring deviations in DC node voltages, and its effectiveness is heavily dependent on the engineer’s initial selection of likely fault modes, as only the preselected faults can be detected and isolated. Paper [7] was pioneering in the field of complete diagnosis of analog circuits using dictionary methods and inspired later research in this area.
The dynamic growth of artificial neural networks (ANNs) in various configurations began in the 1990s. ANNs quickly found applications in fault diagnosis as classifiers and approximators. Rutkowski [46] addresses fault isolation using a DC FD and introduces a strategy for selecting diagnostic measurements. The procedure treats measurements as outputs of an information channel and aims to minimize information loss. Unlike earlier approaches that considered only the number of ambiguity sets, the method also factors in their size and probability. Paper [47] introduces a concept for an ANN, featuring an enhanced strategy for input pattern resolution and a novel output presentation using Hamming coding. By encoding network outputs with Hamming codes, the number of outputs is reduced, allowing a pyramidal neural network (NN) structure and enabling the correction of single errors. The method proposed in [48] combines the previously mentioned approaches: a sensitivity-based method for identifying ambiguity sets, an information channel-based method for determining the minimum set of measurements, and a method for formulating an integer code FD that utilizes a quasi-Hamming distance between signatures. Another method that also uses an ANN is proposed in [49]. The frequency-domain FD is created using a linear regression technique. Multi-layered networks with one hidden layer, acting as autoassociators, are selected to identify the most likely faulty element. The method assumes gradual, single-element faults, while ignoring topology-altering faults. An ANN system developed in [58] is designed to diagnose soft and hard faults, including opened or shorted terminals. Node voltages are processed with wavelet and Fourier transforms, then refined through normalization and principal component analysis to yield a compact set of distinct features. In [59], another ANN-based fault diagnosis concept for large circuits is proposed. The circuit is divided into smaller sub-circuits, each tested with a dedicated back-propagation NN (BPNN). Zhang [82] proposes a method that combines generalized frequency response functions with least-squares support vector machine (LSSVM) classifiers. Frequency responses are estimated directly in the time domain, and two LSSVM classifiers with polynomial and Gaussian kernels are fused to enhance diagnostic accuracy. A learnable wavelet scattering network for fault diagnosis is applied in [4]. In contrast to fixed-wavelet scattering, this network adapts features through genetic-algorithm-based optimization of wavelet operators, with the Davies-Bouldin index guiding class separability. The learned features are classified using support vector machines (SVMs). An improved Harris Hawks algorithm is proposed in [80] to optimize ANN parameters, facilitating the identification of single soft faults. The method uses wavelet packet analysis of the output response. A generative adversarial network is proposed in [13] to tackle the challenge of detecting intermittent faults, combining an autoencoder and a discriminator trained in two stages. A spatial Fourier convolution block is added to the discriminator to enhance noise robustness and accuracy.
As mentioned in the previous section, PWL approximation simplifies computational procedures in nonlinear circuits and is therefore also used in SBT methods. A systematic SBT approach that employs an ANN combined with a genetic algorithm is presented in [56]. Once all nonlinear elements are replaced with PWL models, the circuit is analyzed using the Katzenelson algorithm. Worsman and Wong [44] describe a fault-diagnosis method in the DC domain that employs large-change sensitivity. This process explicitly targets single faults in circuits with a single nonlinear resistor, for which a unique solution exists. Using the PWL model of a nonlinear element, the DC solution can be obtained via the Katzenelson algorithm. Additionally, test nodes and FD entries for both DC and AC analyses are generated based on large-change sensitivity data. The method proposed in [45] extends the approach to PWL circuits containing several two-terminal voltage-controlled resistors. An FD constructed using section-wise PWL functions, which correlate node voltages to circuit parameters, is discussed in [83]. The approach enables the identification of multiple faults in DC transistor circuits.
The Volterra series can approximate a time-invariant causal nonlinear system with arbitrary accuracy. For weakly nonlinear circuits, a truncated Volterra series of limited order often provides a good approximation. Paper [66] uses second-order Volterra frequency kernels as fault signatures. An FD is constructed using an improved BPNN that stores kernels generated by simulations. Combining subband decomposition of the Volterra series with coherence functions and analyzing the decomposed signals to identify fault signatures and locate faulty components is proposed in [67]. As a result, 100% accuracy is achieved for several selected single hard and soft faults, including faults in MOS transistors, as well as some double ones. Another combination of subband Volterra series and fractional correlation is proposed by Deng et al. [8]. Feature vectors derived from fractional correlations between fault-free and faulty cases are used to train a Hidden Markov Model (HMM), which then performs incipient fault diagnosis. A method for diagnosing the same class of faults using the same concept, combined with fractional wavelet packet transformation, is presented in [68]. The obtained signatures are used to create observation sequences for the HMM, enabling fault diagnosis. In [69], a Wigner-Ville distribution of the first- and second-order Volterra kernels is proposed for soft fault diagnosis. The extracted features are fed into the HMM for classification. An approach using bispectral models based on Volterra kernels for locating faults is proposed in [70]. Fault features are extracted from integrated bispectra - circularly integrated, axially integrated, and the phase of radially integrated - mapped to hard or soft faults, mainly single.
Specific statistical measures are often used to diagnose nonlinear circuits. Paper [71] introduces a method that utilizes high-order statistical features of output signals. It extracts kurtosis and entropy from frequency responses, which are then used as inputs to a BPNN for fault classification. In [61], a weighted multi-feature fusion method for soft fault diagnosis is proposed. The method extracts fault characteristics from the frequency domain, statistical features, and the time domain using wavelet packet transforms. The ReliefF algorithm is used to calculate feature weights, and faults are classified using an SVM. Ref. [84] presents a hard-fault detection method based on measuring the power supply current under under- and overvoltage stress. Mean and RMS values of the current, along with overshoot and settling times, are used to extract fault signatures. A modified version of this concept is used for the identification and classification of single incipient, soft faults, and hard faults [85,86]. Additionally, three key features—overshoot/undershoot, damping, and relaxation point—are extracted. A notable characteristic of the algorithm presented in [86] is its self-learning capability; with each circuit tested, the classification boundaries are refined through recursive updates of the mean and standard deviation. Paper [60] suggests using Mahalanobis distance to select feature vectors and train multiple binary LSSVM classifiers. The approach considers wavelet type, decomposition level, and normalization, and applies to circuits with both hard and soft faults.
An approach to diagnosing selected soft faults is to model the circuit response using a polynomial. Papers [76,77,78] outline advancements in testing these faults through the use of polynomial and V-transform coefficients. The V-transform increases sensitivity to component variations by three to five times and ensures monotonicity of coefficients. The methods involve sweeping input signals, computing coefficients, and comparing them against precomputed bounds to detect faults.
Several proposals in the realm of SBT methods are challenging to categorize into the aforementioned classifications. Article [57] introduces a fuzzy logic approach for functional testing, utilizing the sparsity of the sensitivity matrix to identify faults. It proposes a streamlined expert system that effectively distinguishes between faulty and healthy circuits. A technique for diagnosing multiple hard faults, including cuts of some connecting paths and short-circuits of some pairs of points, is discussed in [55]. In this approach, an FD is used for preliminary fault identification, while a linear-programming-based verification process accounts for parameter tolerances. Paper [75] focuses on diagnosing local spot defect diagnosis in ICs, where faults are modeled as finite resistors. An approach is proposed that enables the detection, localization, and estimation of fault values. The method considers multiple operating points by employing families of parametric characteristics. The methodology is applied to circuits with transistors modeled using the Ebers-Moll and Shichman-Hodges models, and it uses a hybrid circuit description. The idea proposed in [87] is to establish the relationship between the real and imaginary parts of the output voltage with respect to the fault component. The relationship (a curve on the complex plane) is derived by using either an analytical method or simulation and recorded as a fault signature. Paper [2] proposes a technique for diagnosing incipient faults using feature extraction based on the high-order moment fractional transform of component parameter changes and the sensitivity analysis. An image-analysis-based method for detecting and diagnosing multiple semiconductor faults in power converters is proposed in [88]. The approach uses entropy-based normalized indexes derived from phase currents to distinguish between open- and short-circuit faults in transistors and can handle multiple faults.
A comparative overview of SBT fault-diagnosis methods applied to nonlinear electronic circuits is provided in Table 2.

2.3. Simulation After Test Methods

In the SAT methods, responses from the faulty circuit are used either to estimate all component parameters or to identify a small set of components most likely responsible for the fault. Network decomposition is an effective strategy for reducing computational complexity when analyzing large circuits [41,42]. A method for locating faults in analog circuits that involves decomposing the network into smaller subnetworks defined by measurement nodes is presented in [41]. Voltages at these nodes are analyzed to verify the consistency of Kirchhoff’s current laws and to determine which subnetworks are faulty by applying logical test functions. Self-testing and mutual-testing conditions help narrow the search to the smallest faulty regions, after which element-level verification or fault-model analysis can be conducted. In [26], a method is presented to address the existence of multiple solutions in nonlinear circuits using tableau descriptions. Every nonlinear device is modeled using PWL characteristics, introducing modeling errors to facilitate simpler analysis; for example, the diode characteristic is approximated by a PWL function with two segments. The method can identify single soft faults, but does not specify parameter values. Paper [43] proposes a component fault isolation through a two-stage process. The first stage involves analyzing the original nonlinear circuit and performing a verification process using a model linearized around the operating point of the nonlinear elements whose leads are accessible for measurement. In the second stage, the characteristics of the inaccessible nonlinear elements within the ambiguity group are approximated using PWL functions, and the verification process is repeated to isolate single faults. Robotycki and Zielonko [54] introduce a homotopy-based verification method for single-fault diagnosis in PWL circuits using bilinear transformation. If homotopy paths converge at the same endpoint, a fault can be identified. Paper [89] addresses soft-fault diagnosis without complete optimization techniques. Instead, only the first phase of the simplex method is used to determine whether component parameters remain within tolerance, leading to fault detection. Faulty elements are identified using the same principle. This method identifies faulty elements by approximating nonlinear relationships with a linear model. It is effective for minor parameter variations (up to 20% deviation), allowing the location of multiple faults but not the evaluation of parameter values. The diagnosis of multiple soft faults in circuits with bipolar transistors, modeled by the Ebers-Moll model, is presented in [90]. This study identifies faulty parameters, including several resistances and the beta factor of one transistor, by solving NTE without linearization, using the block relaxation method. Paper [72] presents a method for multiple soft-fault diagnosis, which allows for the localization and evaluation of faulty parameters by solving the NTE while considering multiple solutions. The approach reformulates the problem as an initial-value problem, which is solved using a fourth-order Runge-Kutta method, along with dc and sensitivity analyses. The technique demands significant computational resources for advanced MOS models (BSIM4, PSP103). Article [16] discusses various methods previously developed by the authors for multiple fault diagnosis, with a particular focus on cases involving multiple solutions to diagnostic equations. These methods utilize homotopy in combination with several algorithms, including simplicial and restart techniques. Tadeusiewicz and Hałgas [73] propose a method for diagnosing single soft spot short defects in ICs. This method accounts for parameter variations and chip self-heating. It detects, locates, and estimates the values of spot faults by minimizing an objective function through a Fibonacci-based optimization process using DC measurements. The approach described in [74] also uses DC measurements to estimate parameters by fitting parameterized output-voltage functions through an efficient iterative method that leverages normal equations and homotopy. This method is demonstrated on bipolar and nanometer CMOS circuits, with transistors modeled using the Gummel-Poon and BSIM 4.6 models, respectively. Multiple soft fault diagnosis based on DC measurements is also presented in [91]. In this case, an error function is minimized using a gradient-free Powell’s algorithm, thus eliminating the need for sensitivity analysis. Paper [92] proposes a numerical method for solving NTE using a homotopy simplicial approach combined with an integer algorithm. A procedure for initial simplex generation enhances this method via bounded-variable simplex optimization. Its effectiveness is demonstrated on several circuits, including both MOS and bipolar circuits, with the ability to handle up to three soft faults.
A comparison of SAT-based fault-diagnosis methods for nonlinear electronic circuits is presented in Table 3.

2.4. Fault Diagnosis of DC-DC Converters

DC-DC power converters are crucial across a range of applications, including aerospace, marine systems, electric vehicles, and renewable energy installations. The most failure-prone components in converters are electrolytic capacitors, which account for up to 50% of faults, and semiconductors, which account for 30%. Common semiconductor faults include short circuits, gate failures, and open circuits. Circuits that utilize a single diode and transistor switches have limited configurations, which simplifies diagnosis to two states that can be analyzed as two linear circuits [93,94]. Fontana et al. [95] provide a rigorous testability measure and a fully automated algorithm for testability analysis at both circuit and component levels, operating under the assumption of an ideal diode model. Paper [96] introduces a theoretical background based on the single-fault assumption and proposes a program for testability analysis using a symbolic method. Additionally, papers [97,98] discuss the testability issue and propose two methods of testability analysis under the single-fault hypothesis: analytical and graphical approaches. Numerous diagnostic methods have been proposed for this class of circuits, as outlined in various papers [93,99,100,101,102,103,104,105,106,107], and review studies, e.g., [108,109]. Paper [108] examines various faults by analyzing key failure spots and mechanisms, including both hard and soft faults at component and system levels. It presents a comprehensive review of recent advances in fault mode analysis, diagnostic signals and algorithms, and fault-tolerant control across different converter topologies. Article [109] reviews fault diagnosis methods for modular multilevel converters in the event of submodule failures, comparing their characteristics and verification results to highlight advantages and drawbacks. It categorizes and evaluates both diagnostic and control methods and discusses future research directions. Paper [106] investigates the effect of sampling frequency on the accuracy of soft fault diagnosis in DC-DC converters with degraded output capacitor and inductor.

3. Challenges in Fault Diagnosis of Nonlinear Circuits

The remainder of this paper presents original examples that highlight current diagnostic challenges. The presentation and analysis of these examples are made possible by the methods for analyzing and diagnosing nonlinear circuits that the author has developed or contributed to significantly. It is important to note that the following discussions do not address parameter tolerance, which further complicates the diagnostic process and generally makes it a very challenging task.
In many nonlinear analog circuits, faults can significantly alter the operating point. Additionally, these circuits may have multiple equilibrium states. In such cases, linearization around a single operating point provides only a local approximation, which is valid only within a narrow region. This local approximation is often used in small-signal AC analysis. When faults affect the polarization or topology of the circuit, the operating point can shift considerably, making it impossible to maintain a linear equivalent. Using PWL analysis in diagnostic procedures simplifies circuit testing. However, it is crucial to note that an improperly chosen PWL approximation can change the number of solutions in circuits with multiple equilibrium points. In circuits with a single equilibrium point, the simulation results may differ significantly from actual measurements.
In many practical cases, especially with low-cost, mass-produced analog circuits, it may be more economical and faster to replace a faulty part rather than perform a detailed fault diagnosis. When the cost of diagnosis exceeds the cost of replacement, complex diagnostic procedures lose their practical justification. However, there are several important applications where advanced diagnostics of nonlinear analog circuits remain necessary. In safety-critical systems such as avionics, medical devices, or power conversion systems in renewable energy networks, module replacement may not be immediately possible or safe. In such cases, detecting and isolating faults is critical to preventing catastrophic failures, ensuring continued operation, and initiating safe shutdown procedures. Embedded or large-scale systems, such as automotive control units, communications infrastructure, or industrial automation, often contain multiple interconnected analog modules. Diagnosing faults at the subcircuit or component level rather than replacing the entire system can significantly reduce shutdown time and maintenance costs. Early detection of incipient faults enables predictive maintenance, allowing faults to be repaired before they cause performance degradation or severe failure. From a research and engineering perspective, developing robust diagnostic procedures deepens the understanding of circuit behavior under fault conditions and contributes to the design of more fault-tolerant systems. Even if replacement remains the preferred practical solution in some cases, the ability to model, detect, and interpret faults improves overall knowledge of system reliability and supports innovation. Fault diagnosis in electronic circuits supports sustainability by extending device lifespans and reducing electronic waste through repair rather than replacement. It also promotes efficient resource use by minimizing the need for new components and reducing the environmental impact of manufacturing and disposal. Designing for testability is essential to ensure effective fault detection and isolation during the operation or production of electronic circuits. Understanding specific issues and having software tools available at the design-for-testability stage enables the proper selection of measured quantities, test stimuli, and data sets to develop diagnostic methods that yield reliable, and in many cases, unambiguous results.

3.1. Ambiguity of Solutions in the Time Domain

A two-stage transistor amplifier (microphone amplifier) (Figure 1) with a wide bandwidth and a maximum gain of 4.77 for a sinusoidal input signal is considered. Bipolar transistors are represented by the Gummel-Poon model [110,111] with the following parameters: BF = 190 , BR = 16 , IS = 40 fA , NE = 2.0 , NF = 1.015 , NR = 1.0 , RE = 0.81 Ω , RB = 3.3 Ω , RC = 0.33 Ω , CJC = 4.7 pF , CJE = 16 pF , TR = 62 ns , TF = 470 ps .
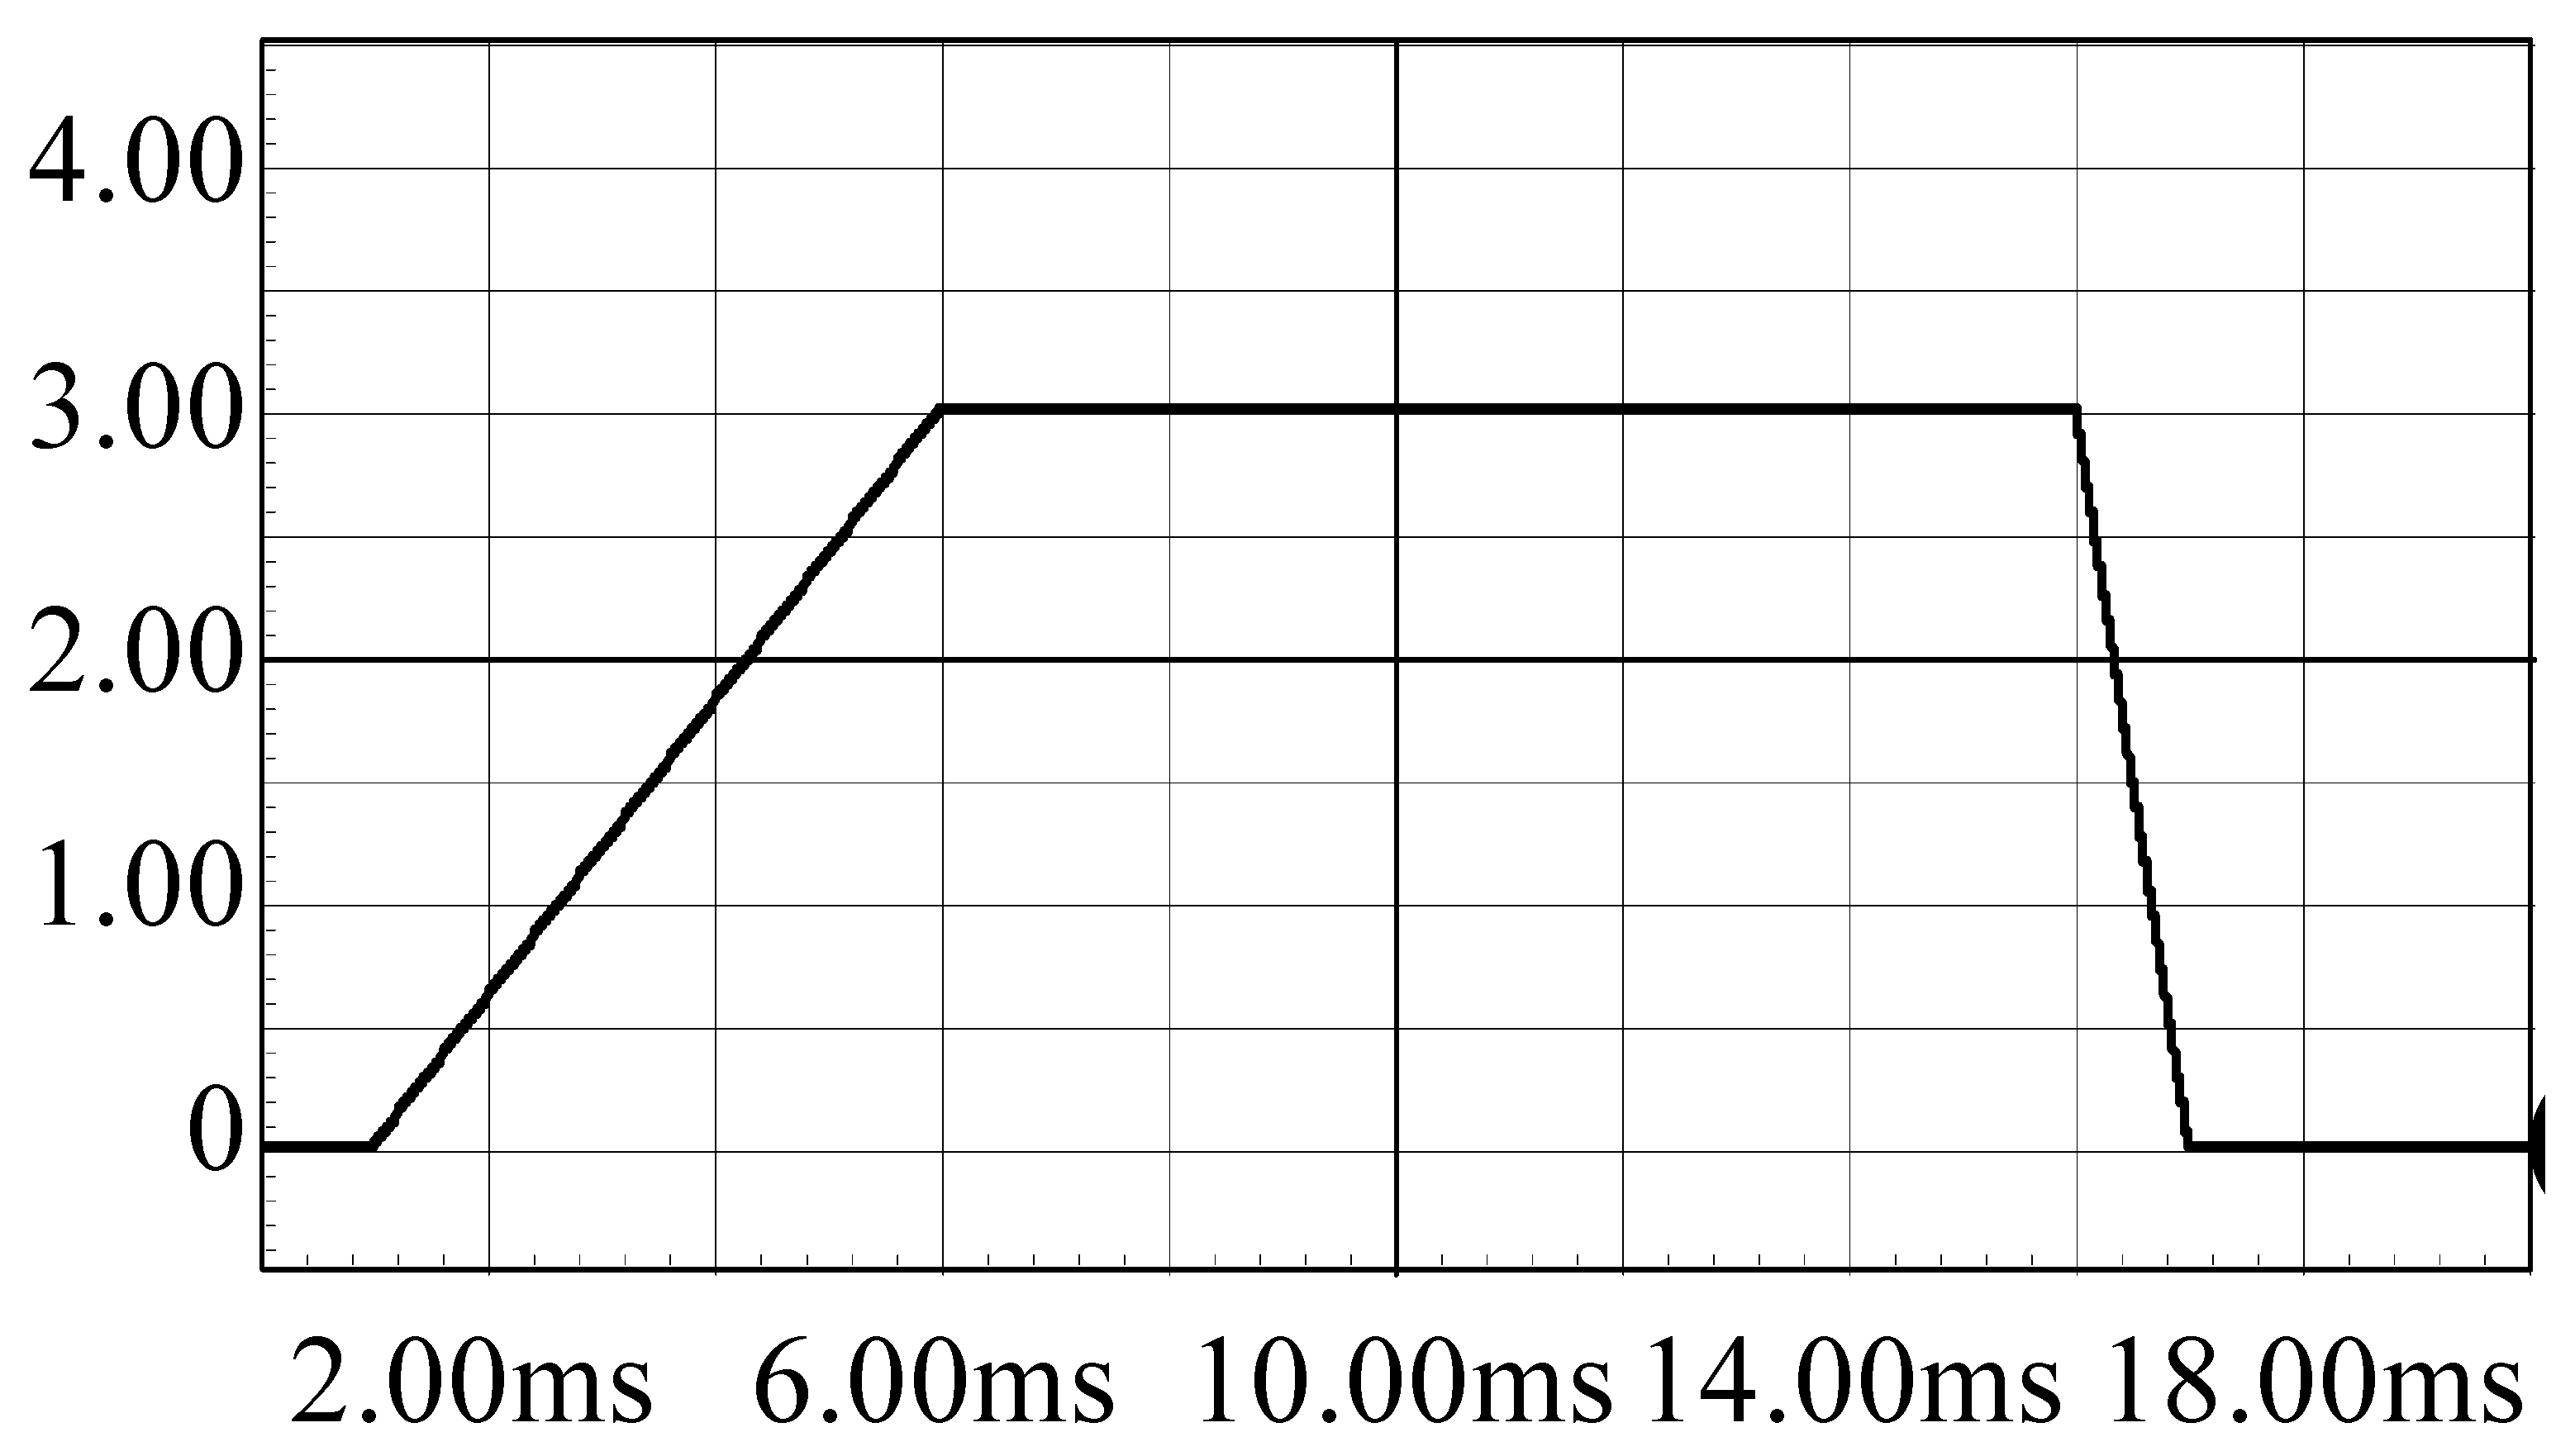
To illustrate the problem of ambiguity in both the context of sets of parameters and parameter values, it is assumed that the circuit is excited, under zero initial conditions, by the signal V i n ( t ) shown in Figure 2, and three signal samples are taken from the output voltage V o u t ( t ) at 2.5 ms , 5.0 ms , and 12.5 ms to the testing purpose.
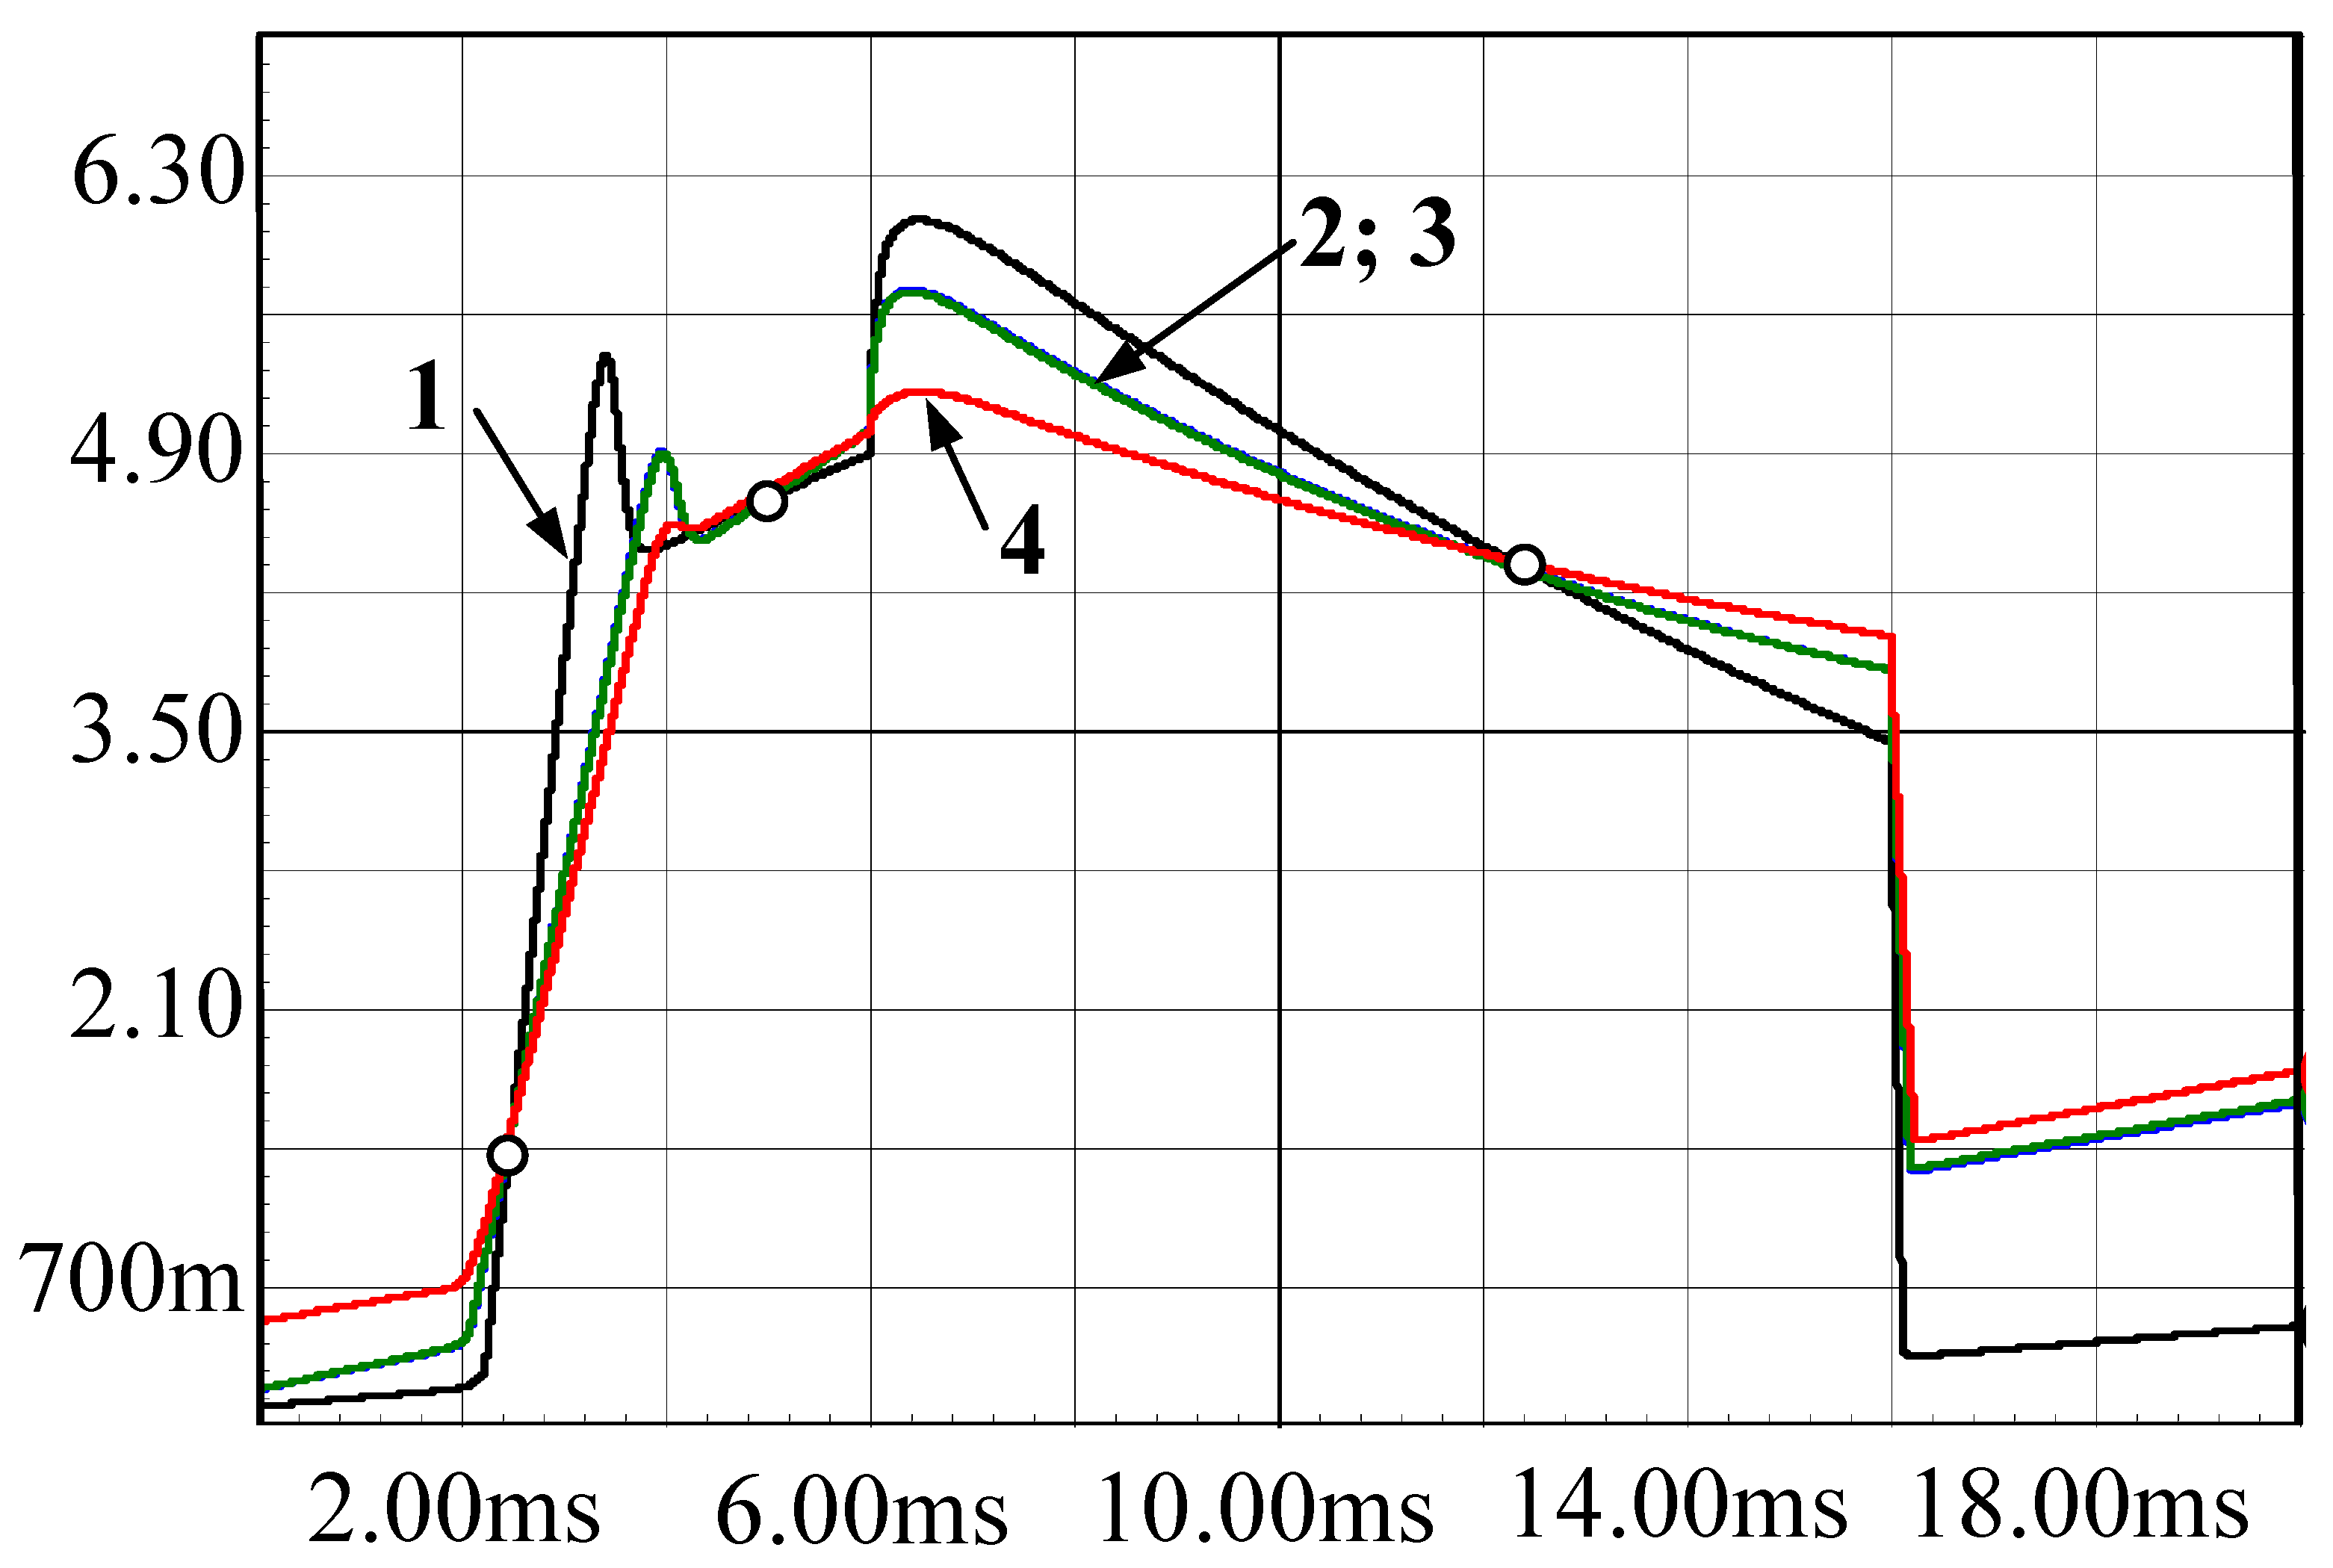
Figure 3 shows the output voltage waveform for nominal parameter values (curve 1). The operating points of the transistors are specified by u C E Q 1 = 2.847 V , i C Q 1 = 0.081 mA , u C E Q 2 = 5.389 V , i C Q 2 = 3.297 mA . Let assume the fault R 2 = 2 k Ω . As a result, the output voltage shown in Figure 3 (curve 2) is obtained. It is important to note that this assumed fault affects the operating points of the transistors, leading to the following values: u C E Q 1 = 2.325 V , i C Q 1 = 0.103 mA , u C E Q 2 = 8.869 V , i C Q 2 = 2.169 mA .
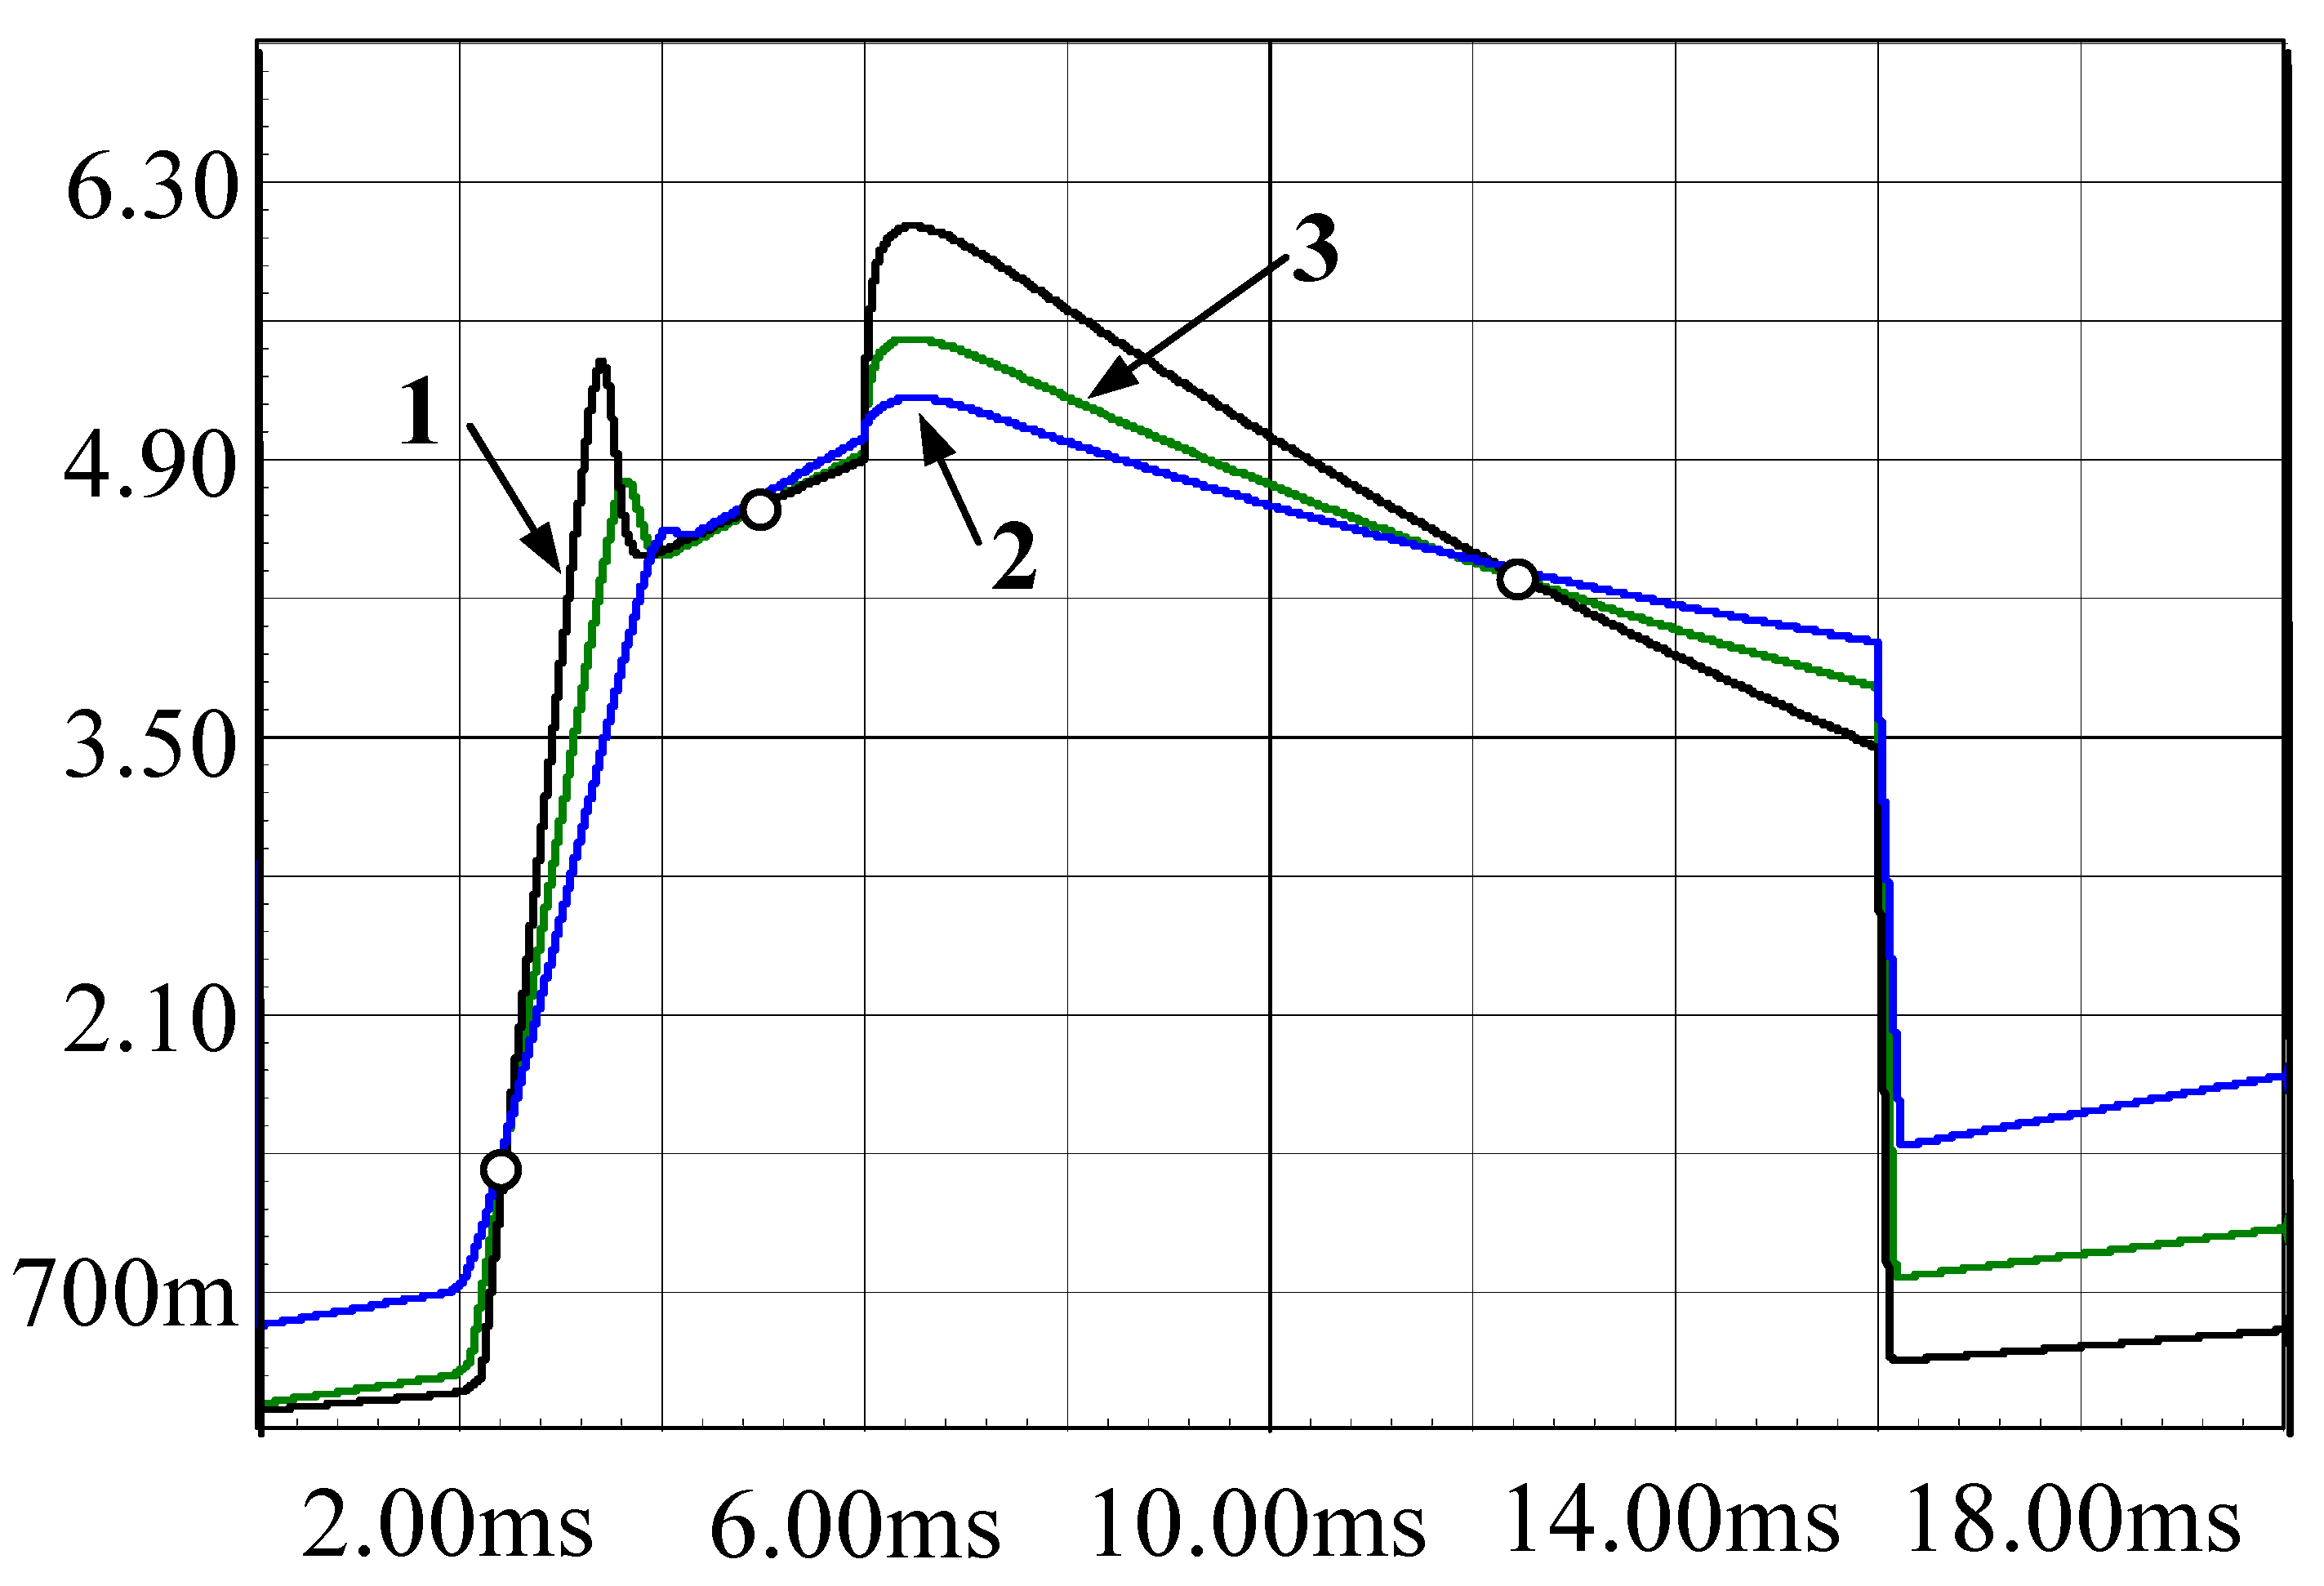
The samples of the output voltage V o u t for nominal parameter values are V o u t ( 2.5 ms ) = 0.456 V , V o u t ( 5.0 ms ) = 1.944 V , and V o u t ( 12.5 ms ) = 2.332 V . In the faulty circuits, at R 2 = 2 k Ω , these values are V o u t ( 2.5 ms ) = 1.477 V , V o u t ( 5.0 ms ) = 4.649 V , and V o u t ( 12.5 ms ) = 4.279 V , respectively. The samples are marked by open circles in Figure 3. To carry out the diagnostic process, a SAT method developed by the author was applied to the measured samples, enabling the determination of multiple solutions to the nonlinear test equation (although without guaranteeing the identification of all solutions). As a result, the parameter values for different sets of elements that yield the same samples are determined. For example, apart from the assumed fault R 2 = 2.0 k Ω (curve 1 in Figure 4), the following sets of parameters are found { C 1 = 145 nF , C 5 = 140 pF , R 5 = 725 Ω } (curve 2 in Figure 4), { C 1 = 144 nF , R 2 = 4.77 k Ω , R 5 = 719 Ω } (curve 3 overlaps curve 2 in Figure 4), and R 2 = 512 Ω , R 3 = 1.43 k Ω , R 5 = 634 Ω (curve 4 in Figure 4). Since the output voltages are the same at fixed points in time, all solutions pass the diagnostic test. Furthermore, for two of these solutions, the waveforms are almost identical, indicating that selecting other samples of the output signal will not allow unique identification.
For some parameter sets, several parameter values can be obtained that satisfy the diagnostic test. For example, for the set of components { R 2 , R 3 , R 5 }, there are at least three such sets. There are, apart from the set including the assumed fault { R 2 = 2.0 k Ω , R 3 = 12.0 k Ω , R 5 = 1.8 k Ω } (curve 1 in Figure 5), the values { R 2 = 512 Ω , R 3 = 1.43 k Ω , R 5 = 634 Ω } (curve 2) and { R 2 = 1.44 k Ω , R 3 = 5.67 k Ω , R 5 = 1.06 k Ω } (curve 3).
In the case of nonlinear circuits, there are no general methods for determining testability and ambiguity groups at accurate transistor models and with arbitrary parameter changes. The presented results illustrate the problem in the context of multiple sets that satisfy the diagnostic test. Furthermore, they show that even for a fixed set of parameters, many sets of values fulfill the test. These are two crucial diagnostic problems that have not yet been fully addressed. In particular, determining all sets of parameter values for a fixed set of components is a challenging research problem and remains an open question.

3.2. Ambiguity of Solutions in the DC Domain

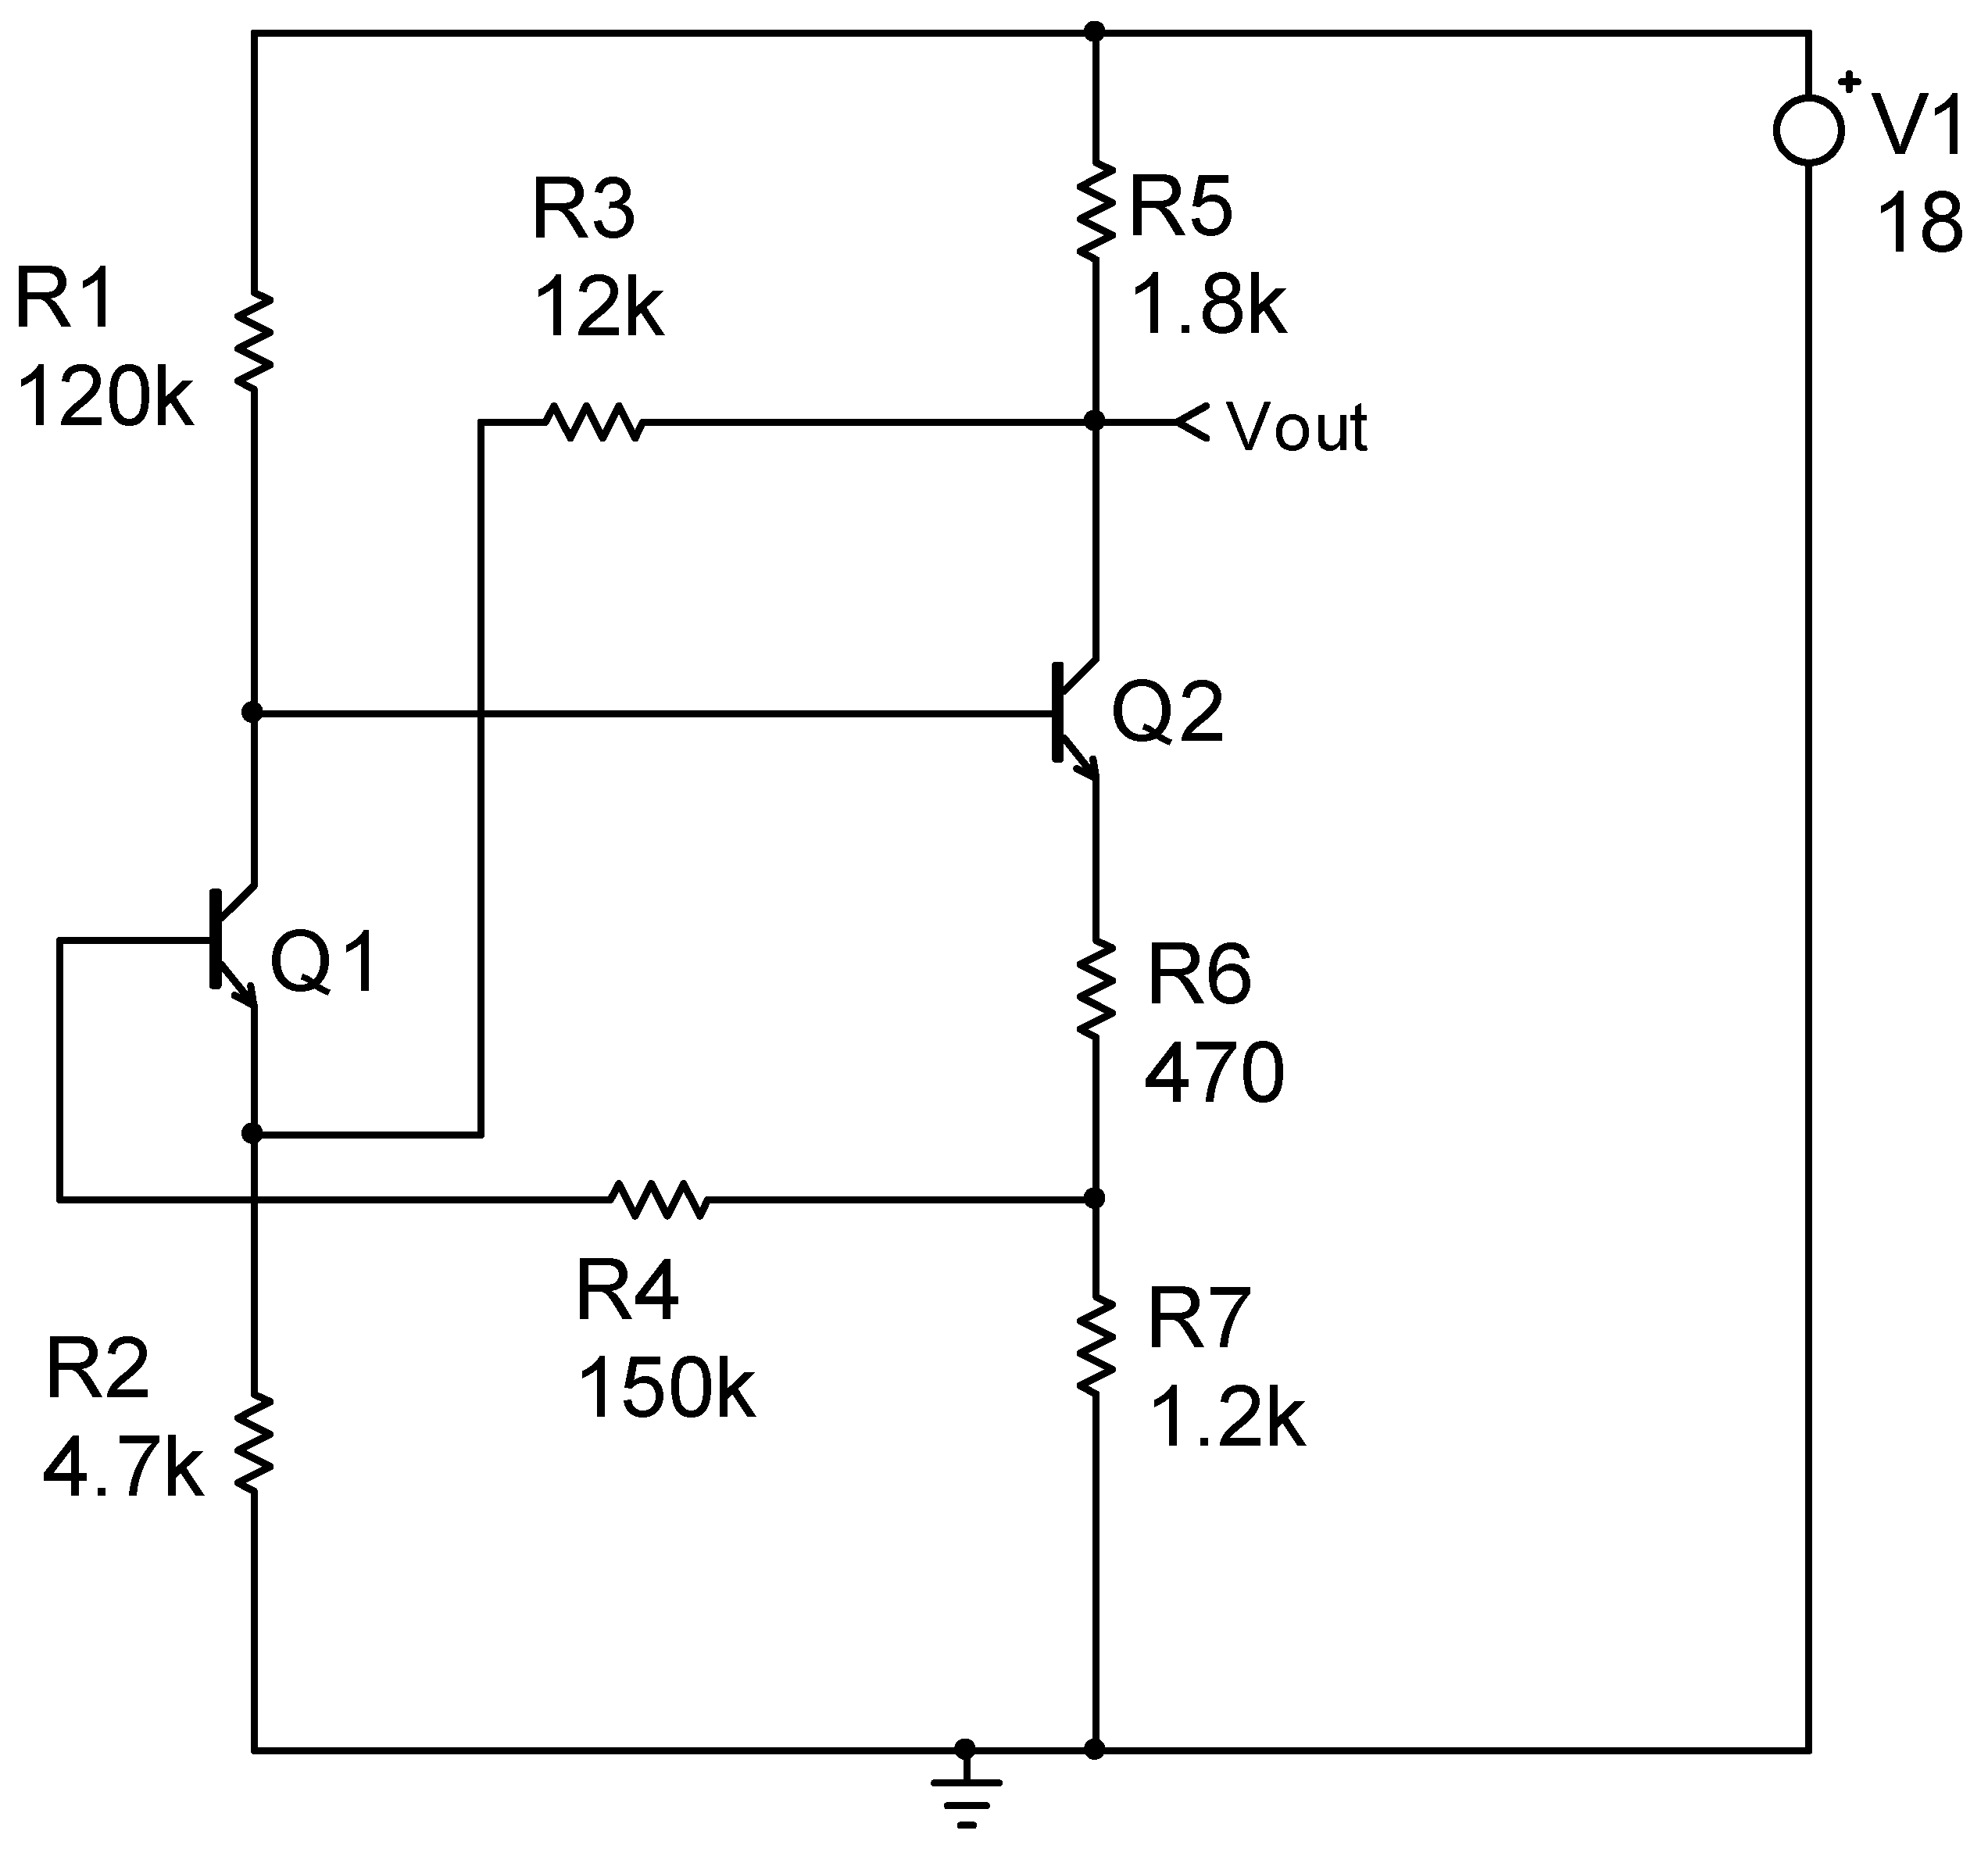
To illustrate the problem of ambiguity in DC diagnosis, a DC model of the circuit shown in Figure 1 is constructed, as shown in Figure 6.
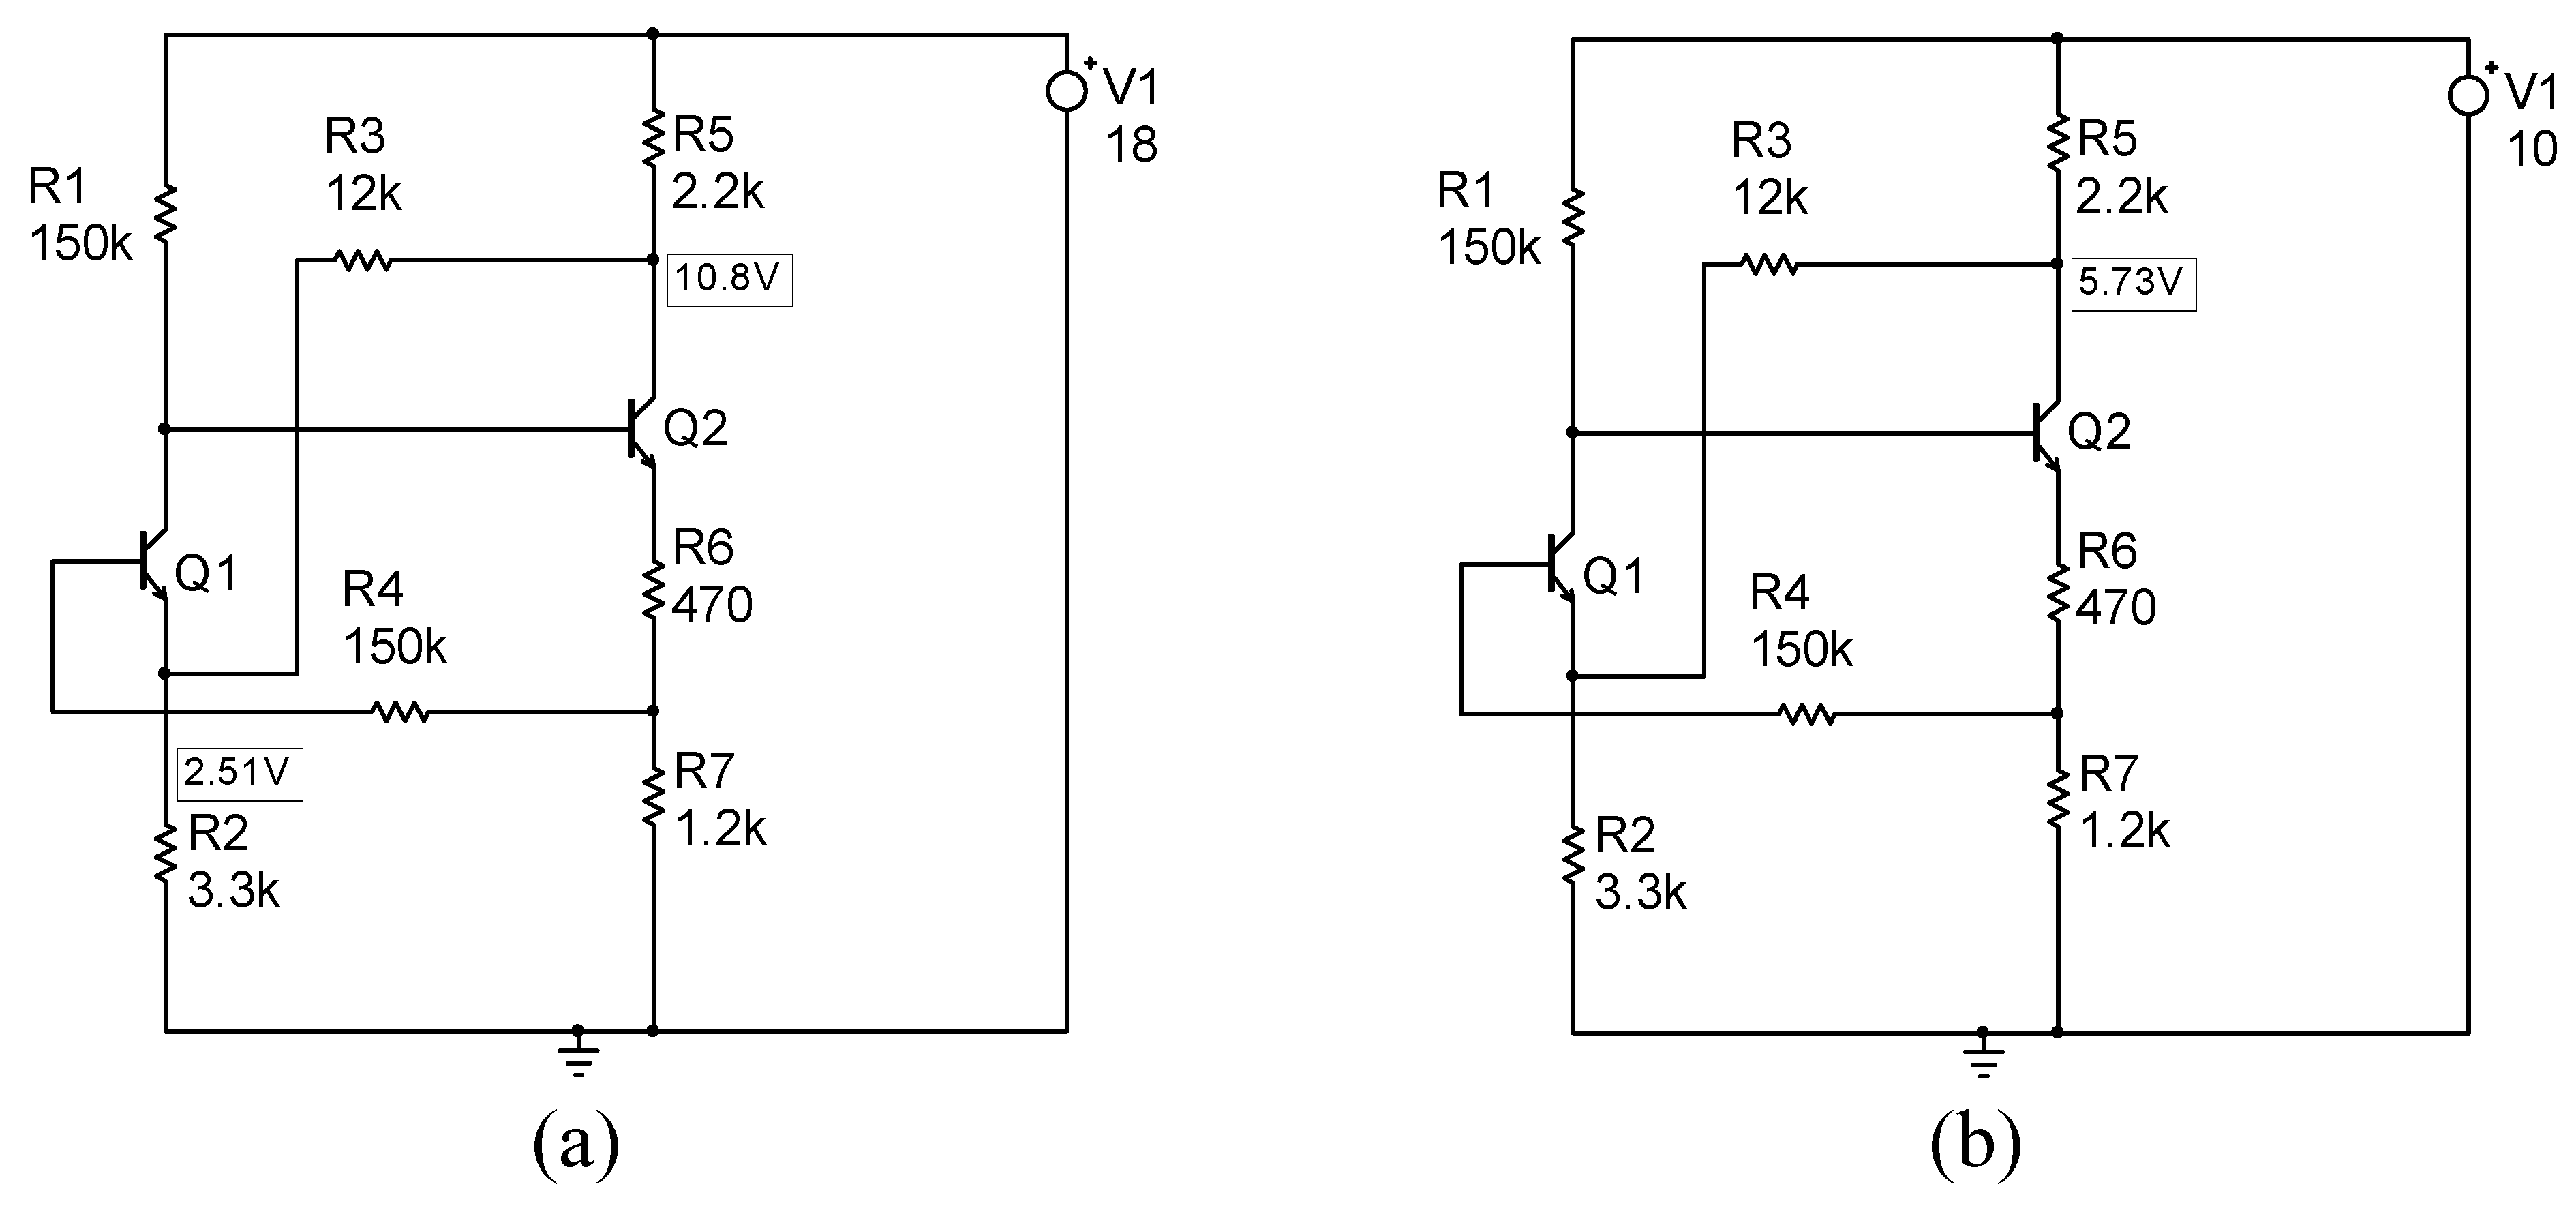
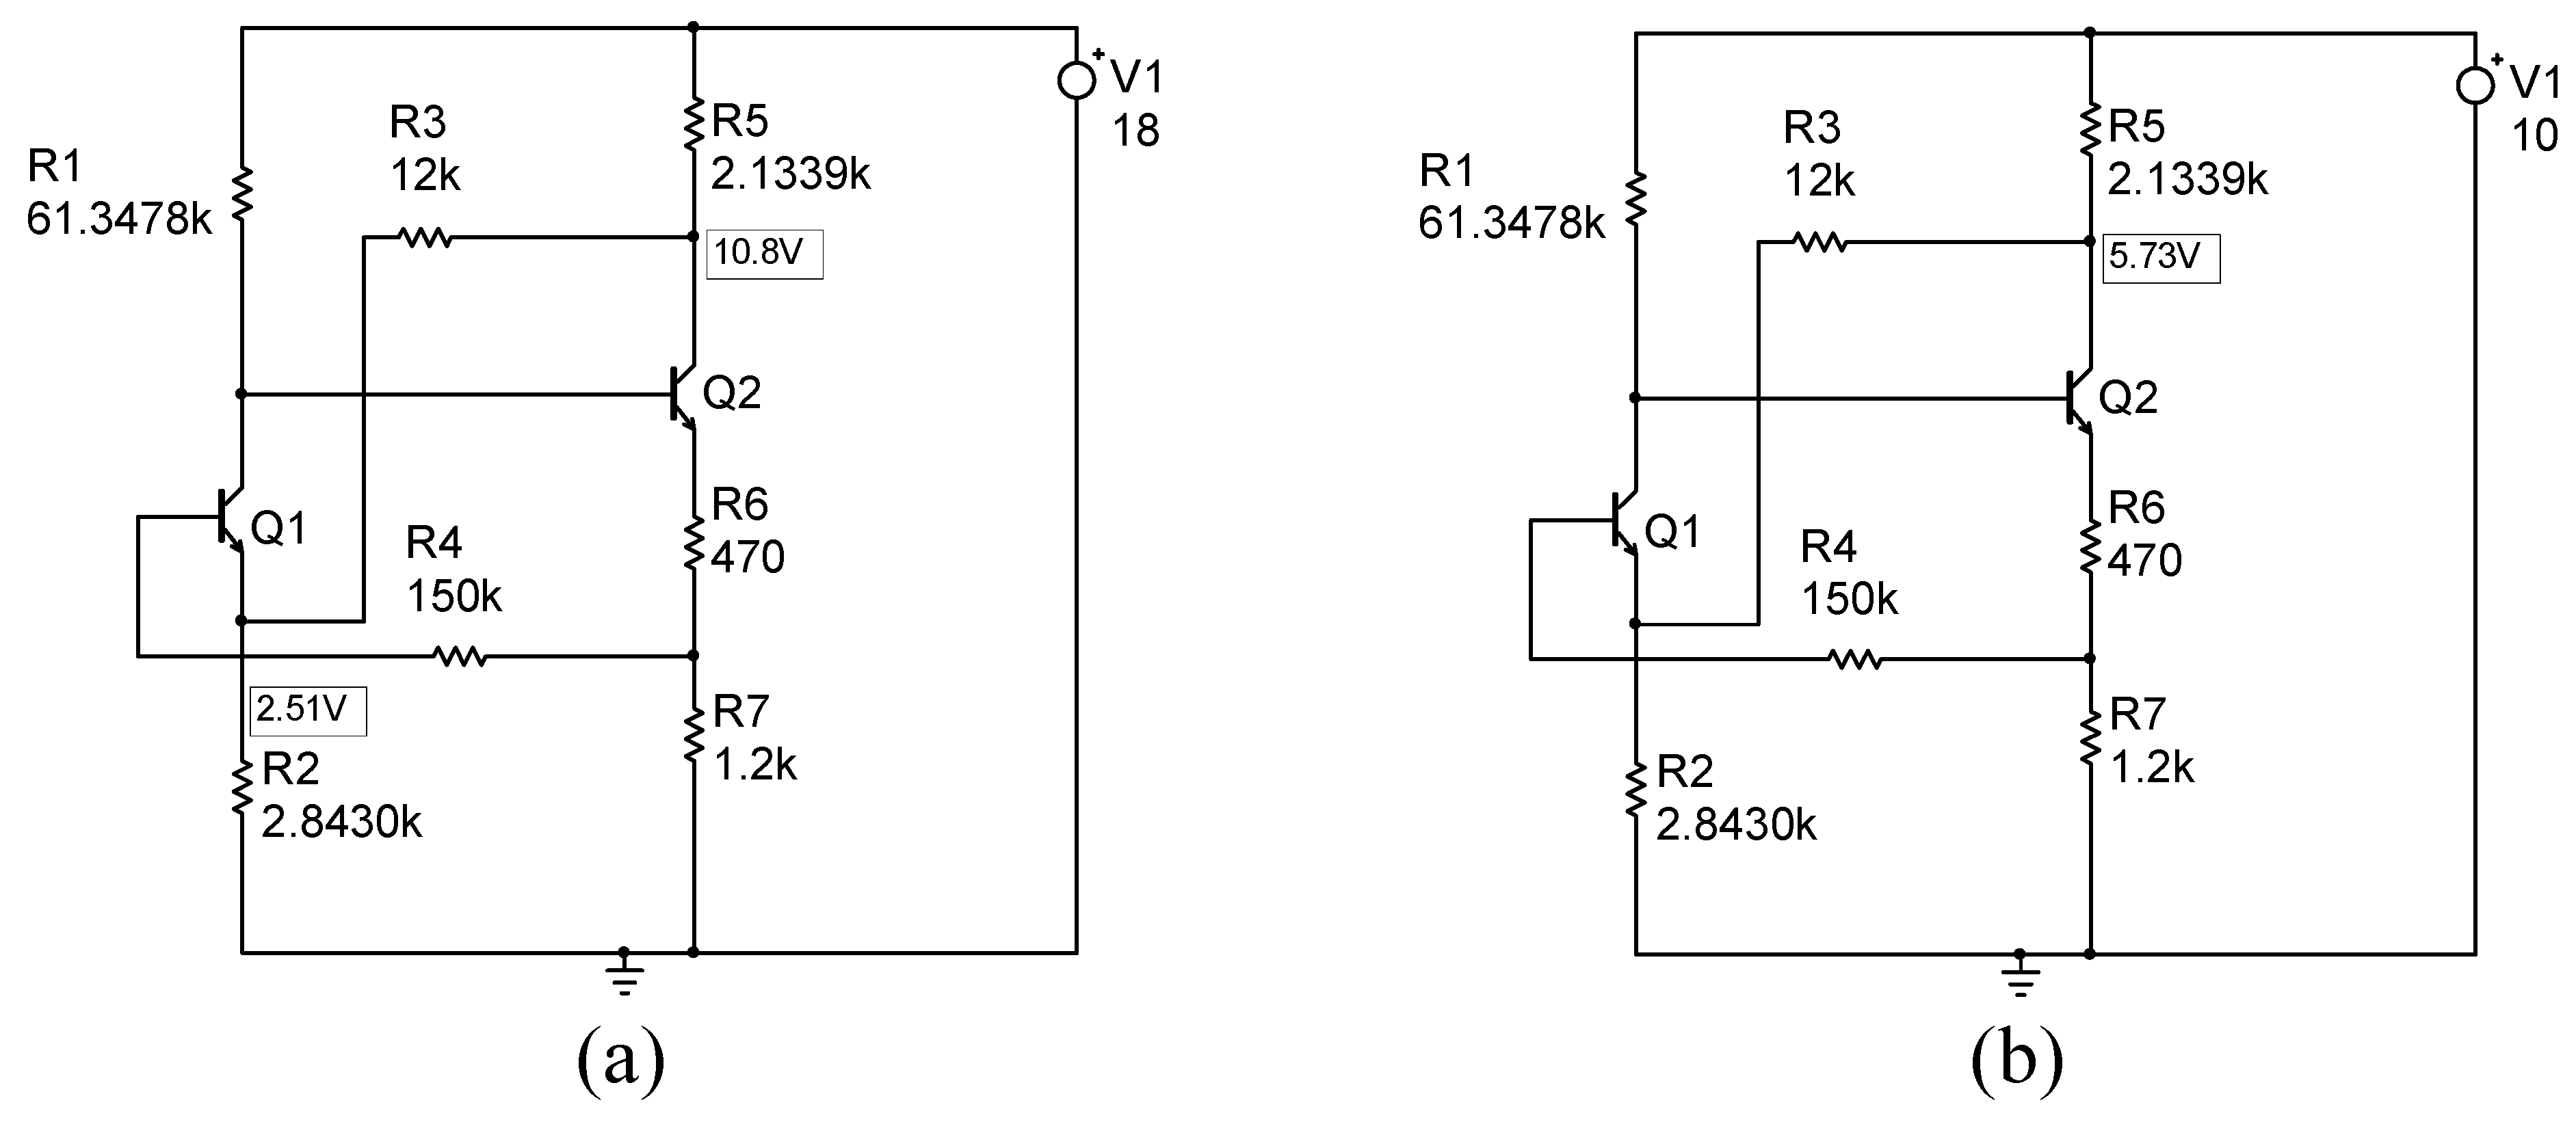
The same transistor model as described in Section 3.1 is used. In the context of nonlinear DC circuits, ambiguity refers to the situation where the same DC measurement (voltages or currents) can be obtained for different sets of components, and, more challenging, for a fixed set of components with different parameter values. Initially, a single fault in resistor R 5 is considered. It is assumed that the actual value of this resistor is R 5 = 2.5 k Ω . At the output node, this configuration produces an output voltage of V o u t = 9.31 V . In contrast, for the nominal value of R 5 ( R 5 = 1.8 k Ω ), the output voltage is 10.93 V . During the diagnostic procedure involving these measurements, other single fault solutions are identified, such as R 1 = 18.978 k Ω , R 2 = 10.908 k Ω , R 3 = 6.144 k Ω , R 7 = 810.5 Ω . It is important to note that there are additional solutions, including double and triple faults, that would also pass this diagnostic test. The following text demonstrates that even within a simple circuit, different parameter values from the same set can meet the requirements of a diagnostic test. In this case, it is assumed that the verification method involves determining the parameter values R 1 , R 2 , and R 5 . The measurement test includes assessing the voltages at the collector of transistor Q 2 and the emitter of transistor Q 1 under nominal power supply conditions ( 18 V ), as well as measuring the voltage at the collector of Q 2 with a power supply voltage of 10 V . Triple soft fault { R 1 = 150 k Ω , R 2 = 3.3 k Ω , and R 5 = 2.2 k Ω } is assumed, leading to test voltages of 10.8 V and 2.51 V at nominal supply (Figure 7a) and 5.73 V at 10 V supply (Figure 7b). By applying the diagnostic procedure outlined in [112], two solutions have been identified: the initially assumed solution and a second solution characterized by the following resistor values: { R 1 = 61.3478 k Ω , R 2 = 2.8430 k Ω , and R 5 = 2.1339 k Ω }. Simulations conducted in SPICE (see Figure 8) confirm that both solutions successfully pass the test. The voltages shown in Figure 7 and Figure 8 are identical.
Currently, no method in the literature guarantees the determination of all solutions for NTE under accurate semiconductor device models. This leaves open the possibility that other solutions may exist. The only reliable way to verify the total number of solutions is through brute force. This method analyzes the DC circuit using a standard iterative approach to explore all possible combinations of parameter values within defined ranges, with a small step size. The parameter values are recorded when the resulting voltages closely match the measurements. However, as discussed in the next section, this method may be unreliable when multiple operating points are present.

3.3. The Problem of Multiple Operating Point

In circuits with multiple operating (equilibrium) points, standard DC analysis often leads to one of them, which may be unstable and thus unobservable during measurements. To identify only physically achievable (stable) operating points, the following approach can be utilized. First, all possible equilibrium points—both stable and unstable—are determined using methods designed for finding DC operating points. However, it is important to note that no methods currently exist that guarantee the identification of all solutions in large, practical electronic circuits containing more than 20 transistors. Next, the local stability of each equilibrium point can be assessed using the Lyapunov stability criteria.
Even minor parametric faults in a circuit that has a single operating point for nominal parameter values can sometimes result in multiple operating points. To illustrate the problem of multiple equilibrium points in single-solution designed circuits resulting from various hard and soft faults, two circuits will be considered.
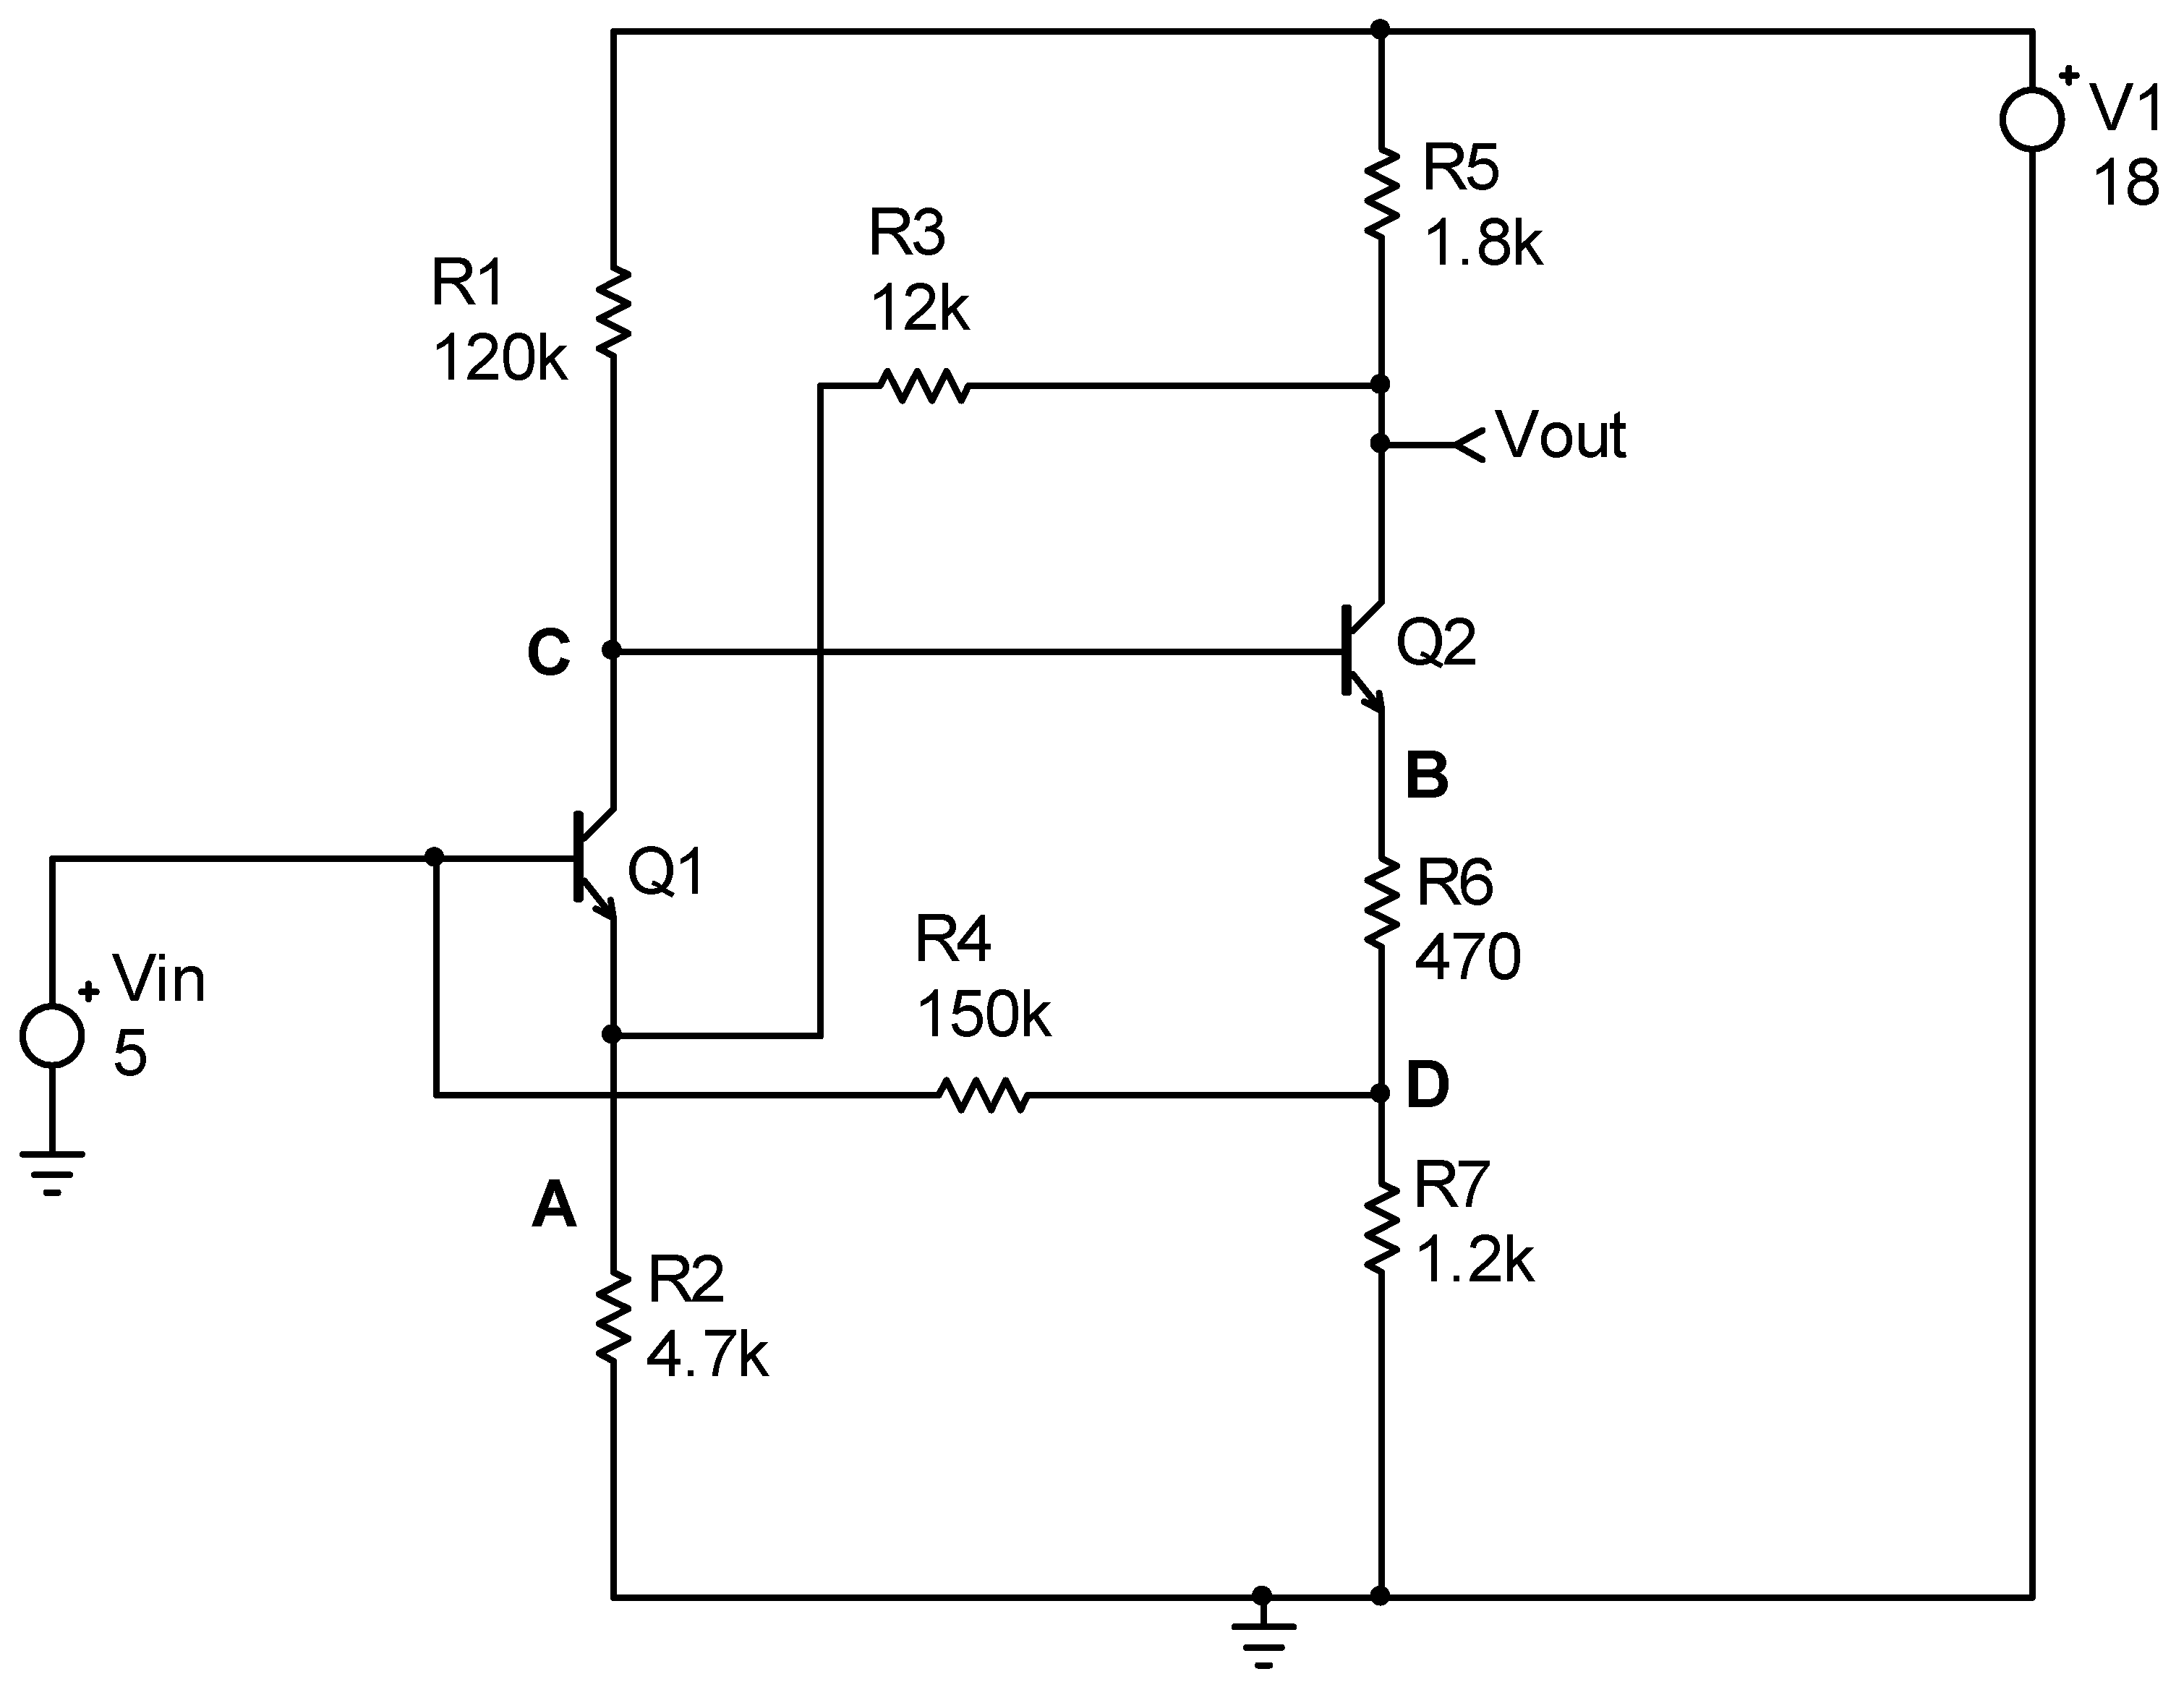
The first is the circuit shown in Figure 6. It is assumed that, for testing purposes, a 5 V DC voltage source V i n is connected to the base of transistor Q 1 (Figure 9) and the output voltage V o u t is measured. For the nominal parameter values, the circuit has a single DC solution, as confirmed by a program developed in collaboration with the author to identify all DC solutions. The output voltage V o u t equals 12.77 V . It is assumed that a spot fault (an ideal short circuit) occurs between points A and B. The default analysis in the SPICE software yields output voltage V o u t 1 = 11.74 V . However, this solution is just one of three operating points that exist in the circuit. Stability analysis indicates that this point is unstable, meaning it will never be observed in a typical measurement.
Upon determining all DC solutions, two additional stable solutions are found, leading to measurements V o u t 2 = 16.21 V or V o u t 3 = 7.42 V . The actual output voltage observed in a bench test will depend on various factors, including parasitic capacitances, capacitances in nonlinear device models, and the circuit’s initial conditions. To effectively detect a single hard fault, even when using dictionary methods or AI techniques, certain classes of circuits must account for the possibility of multiple DC solutions during dictionary creation. For this purpose, software is needed to determine all DC solutions, test their stability, and create appropriate signatures in an FD (see, e.g., [16]). Furthermore, a similar issue arises when there is a small resistance, such as 500 Ω , instead of an ideal short circuit between points A and B. The simulation then yields three output voltage values: V o u t ; V o u t 1 = 11.59 V , V o u t 2 = 14.72 V , and V o u t 3 = 7.52 V . The problem of multiple solutions can also occur in the circuit without the test voltage V i n . For instance, a double fault that consists of a short circuit between the base of transistor Q 1 and the collector of transistor Q 2 , along with a short circuit between point B and ground, results in three solutions, including two stable ones: V o u t 1 = 0.882 V , V o u t 2 = 0.107 V , and V o u t 3 = 1.31 V .
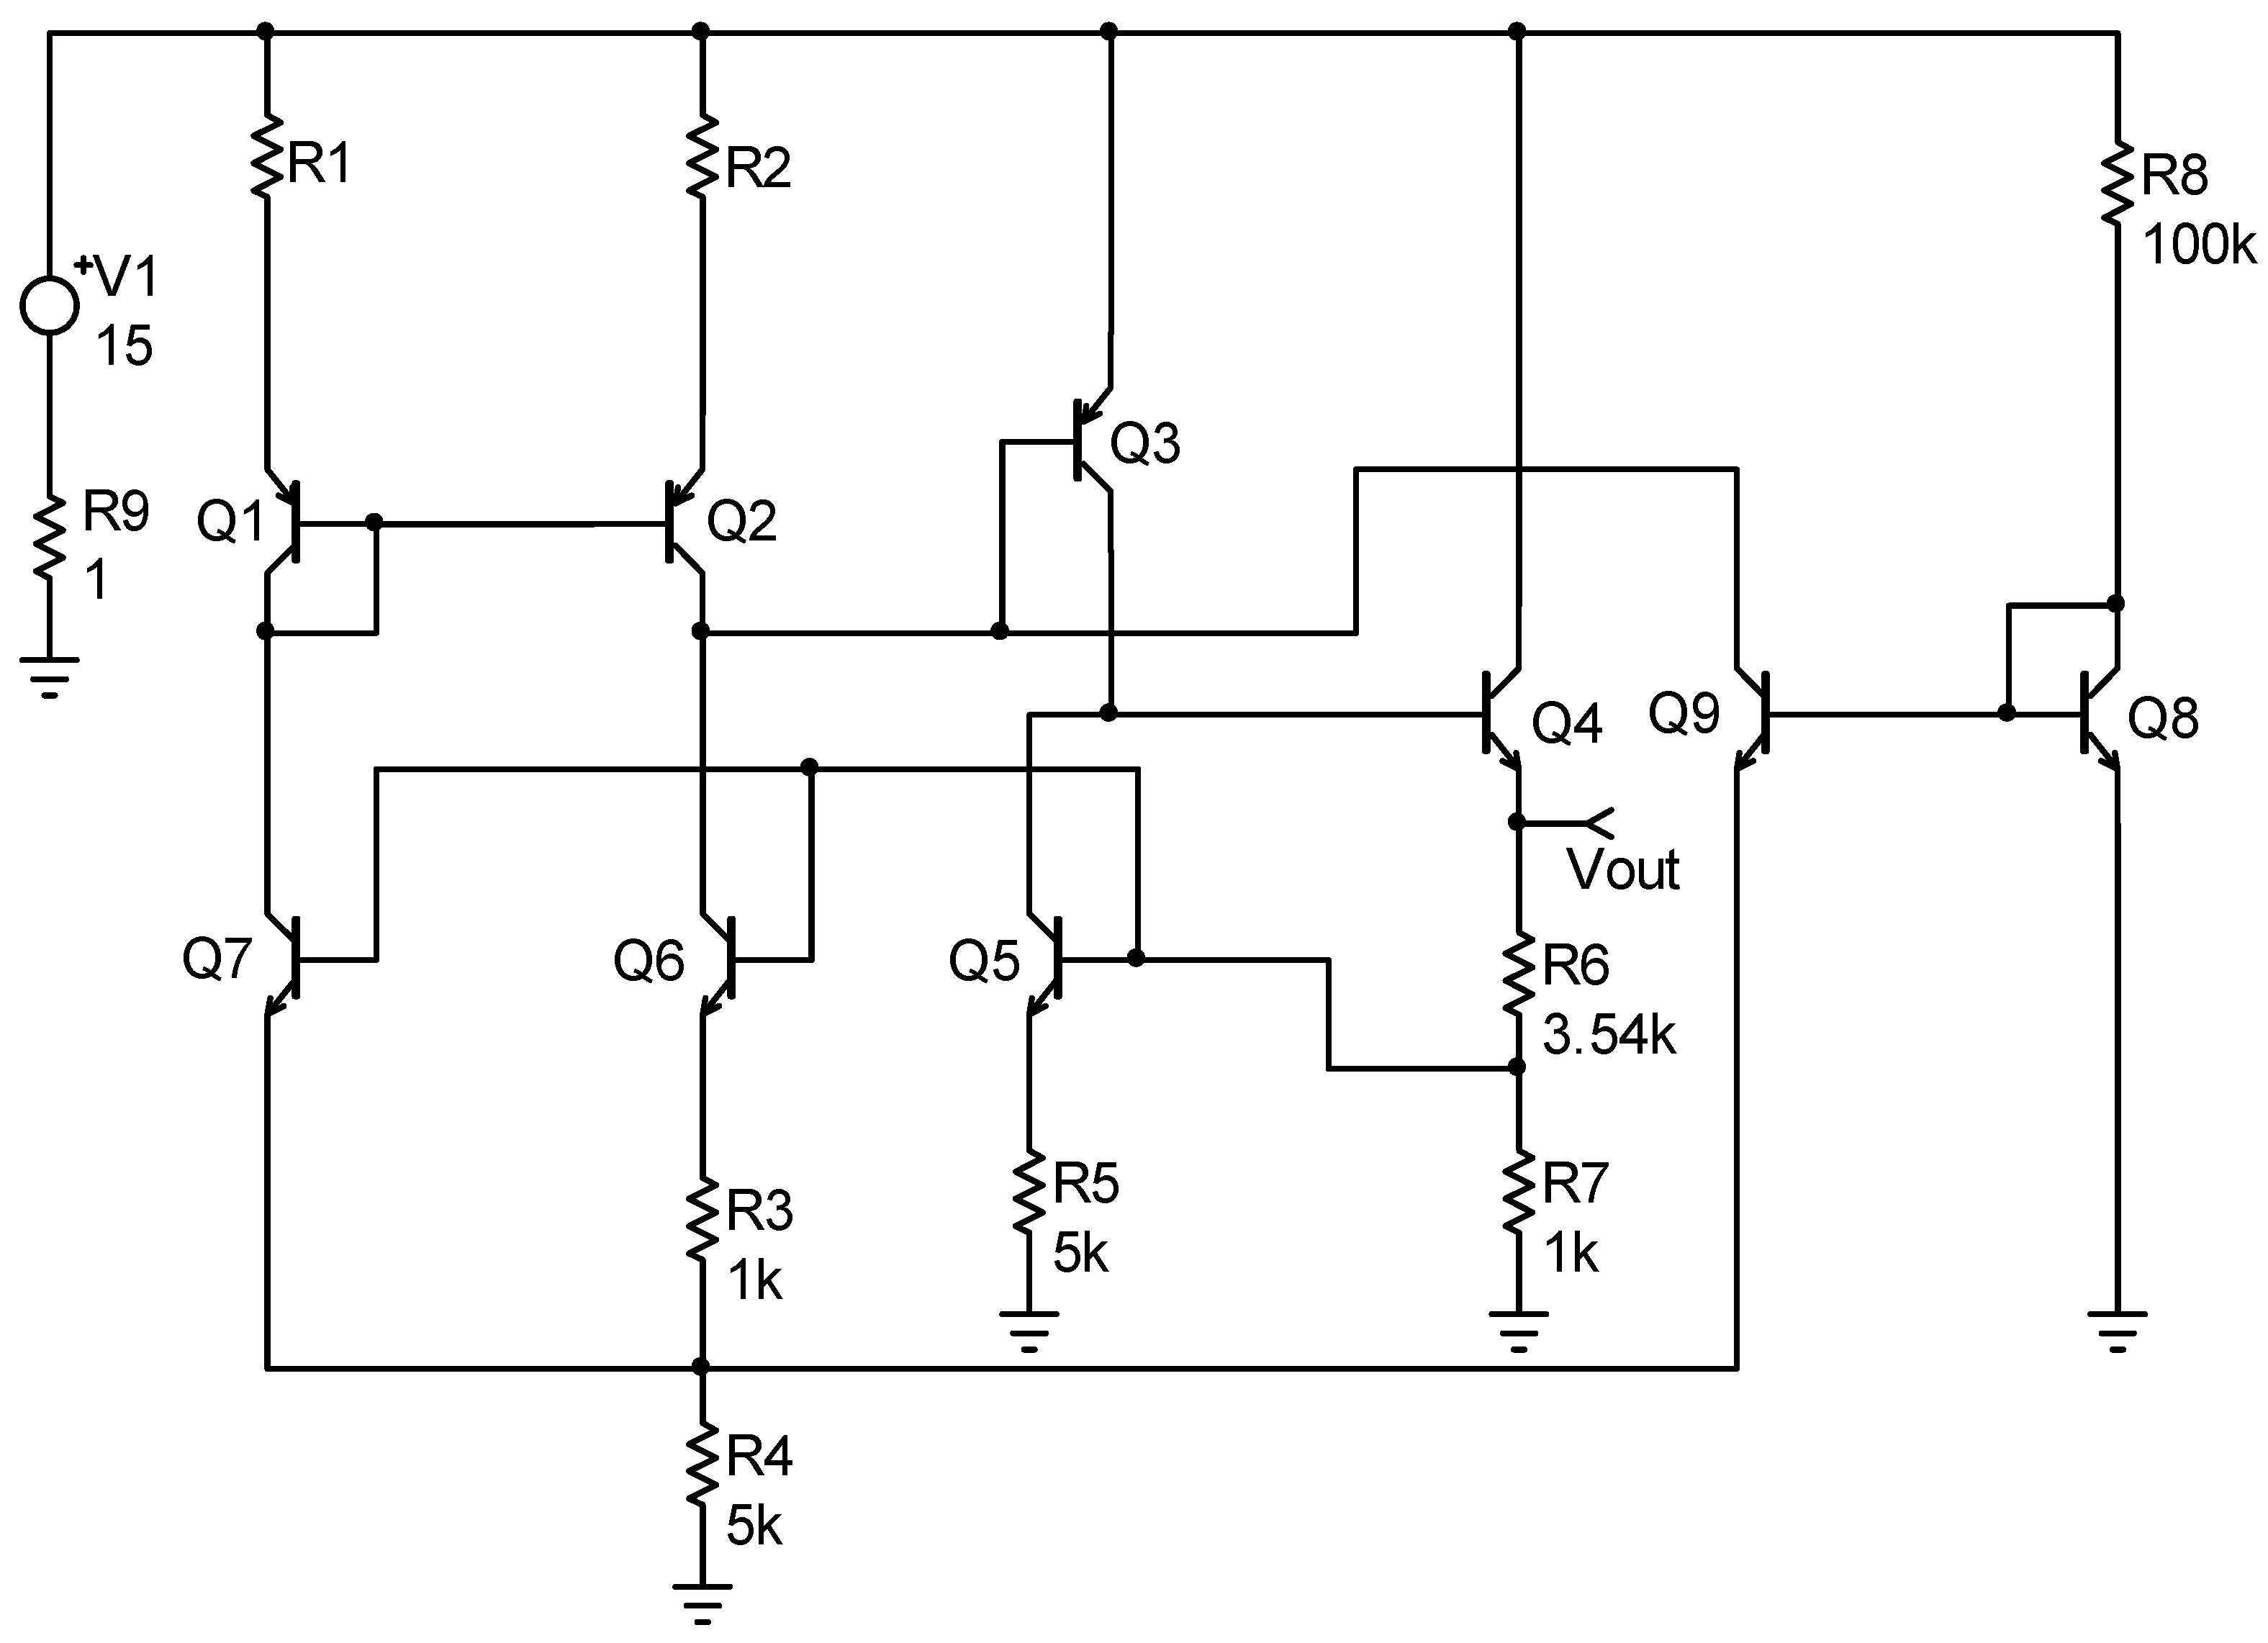
In larger circuits that include several dozen transistors, issues can become more pronounced, even with minor or incipient faults. The voltage regulator circuit shown in Figure 10 is considered. For testing purposes, it is assumed that the output voltage V o u t is being measured. The Gummel-Poon model of bipolar transistors, with parameters BF = 400 , BR = 35.5 , IKF = 0.14 A , IKR = 0.03 A , VAF = 80 V , VAR = 12.5 V , IS = 1.8 × 10 14 A , ISC = 1.72 × 10 13 A , ISE = 5.0 × 10 14 A , NC = 1.27 , NE = 1.47 , NF = 0.9955 , NR = 1.005 , RE = 0.6 Ω , RB = 0.56 Ω , RC = 0.25 Ω for npn transistors and with the parameters BF = 330 , BR = 13.0 , IKF = 0.10 A , IKR = 0.012 A , VAF = 84.56 V , VAR = 8.15 V , IS = 1.149 × 10 14 A , ISC = 1.43 × 10 14 A , ISE = 5.0 × 10 14 A , NC = 1.10 , NE = 1.40 , NF = 0.9872 , NR = 0.996 , RE = 0.4 Ω , RB = 0.2 Ω , RC = 0.95 Ω for pnp transistors. In this circuit, transistor Q 6 has its AREA parameter set to 5. To enhance the matching of the current mirror formed by transistors Q 1 and Q 2 , two identical resistors, R 1 and R 2 , have been integrated into the design. Additionally, the circuit includes a start-up circuit comprising Q 8 , Q 9 , and R 8 , which prevents the circuit from operating in a zero-state. The simulation shows that the circuit, with values of R 1 = R 2 = 2.5 k Ω , has one solution ( V o u t = 4.40 V ). Parametric faults in these resistors and a change in their values to R 1 = R 2 = 3.2 k Ω lead to three operating points: the desired one ( 4.40 V ), the latch state ( 14.30 V ), and a third, unstable operating point ( 11.88 V ). It is worth noting that three solutions are present even with an 8% change in the value of these resistors ( R 1 = R 2 = 2.7 k Ω ), i.e., with a so-called incipient fault. Even more complicated from the diagnostic point of view is the case where resistances R 1 = R 2 have a value of 5 k Ω and, in addition, a hard fault occurs (open circuit in the supply to collector Q 9 ). In this case, the DC analysis leads to 5 operating points corresponding to V o u t values of 0.00 V , 1.60 V , 4.40 V , 8.35 V , and 14.32 V (including three stable values of 0.00 V , 4.40 V , and 14.32 V ).
Of course, the opposite situation is also possible, i.e., a circuit with multiple solutions at nominal parameters may have a single solution for some soft or hard faults. The problem of multiple solutions should be considered in the diagnostic process of a general class of nonlinear circuits, regardless of the diagnostic method used. There are a few papers in the literature on the subject that use significant simplifications in semiconductor device models and PWL analysis. They enable the detection and localization of specific faults in circuits with multiple equilibrium points. This problem is substantial and constitutes a considerable research challenge.

3.4. The Issue of Self-Heating

Finally, the issue of thermal effects, including chip self-heating, on the fault diagnosis is considered. In DC circuits, this is particularly relevant for circuits manufactured using bipolar technology, whereas in dynamic circuits, it applies to all circuit classes. Circuit parameters depend on temperature, which involves the solutions. On the other hand, in any solution, some power is dissipated inside the chip. As a result, the circuit temperature will be higher than the ambient temperature and will generally vary depending on the solution. There is, therefore, a feedback loop between temperature and solutions; neither the temperature nor the circuit parameters are known in advance. Thus, the influence of temperature should not be overlooked, and solutions obtained without accounting for thermal constraints may not be reliable.
It is assumed that the circuit shown in Figure 10 is manufactured using IC bipolar technology. A temperature coefficient of resistance of 200 ppm/K is applied to all resistors, and the transistors’ thermal parameters are set to the default values built into the SPICE simulator. For illustrative purposes, it is assumed that the solution(s) do not significantly change the chip temperature. In reality, with two stable solutions for this circuit, the difference does not exceed a few degrees, given the circuit’s low power consumption. It is also assumed that, at ambient temperature and with the assumed chip thermal resistance, the temperature reaches 50 °C due to self-heating. Calculations at 27 °C show that the circuit, with values of R 1 = R 2 = 2.5 k Ω , has one solution ( V o u t = 4.40 V ). Simulation at 50 °C using the author’s DC analysis method shows that the circuit has three solutions, including two stable ones ( 4.338 V and 14.315 V ) and one unstable solution ( 13.605 V ). Controlled SPICE analyses confirm the solutions. It follows that, under certain conditions, ignoring the self-heating effect in fault diagnosis can yield inaccurate or erroneous results. To the best of the author’s knowledge, this problem has not been the subject of in-depth research in the context of analog circuit fault diagnosis and represents a research challenge. The only known paper that considers the self-heating effect concerns circuits with a single operating point and single-spot faults [73].
In nonlinear circuits with multiple soft faults or a combination of soft and hard faults, the coupling mechanism between the self-heating effect and changes in fault parameters becomes very complex and nonlinear. The self-heating effect results from power dissipation in circuit components, causing a local increase in temperature that, in turn, changes electrical parameters such as carrier mobility, threshold voltage, resistance, and gain. The few existing methods for DC circuit analysis that consider self-heating use simplified equivalent thermal circuits. In the case of multiple faults with preset values, it is therefore possible to perform a simplified analysis of the impact by simulation, assuming a uniform chip temperature and a small chip size. However, if the circuit is large or contains discrete components outside the chip, the thermal interactions are highly complex. A hard fault (such as a short circuit or open circuit) can locally alter current distribution and thermal gradients, leading to complex transient behavior or secondary degradation.

4. Conclusions

The diagnosis of analog nonlinear circuits in the general case remains an open problem across all aspects, i.e., testability, fault identification, and parameter estimation. There are some methods for detecting and locating single and preselected multiple soft and hard faults that may have practical applications. These test procedures are primarily based on dictionary methods and utilize various artificial intelligence techniques, including deep neural networks. In the area of soft faults, faults with pre-assumed values or ranges are typically considered at the feature extraction stage. Volterra series can approximate a time-invariant nonlinear system with arbitrary accuracy, and the Volterra kernels are an inherent feature of the circuits. The identification of nonlinear circuits based on the Volterra series has been successfully applied in recent years to a specific class of nonlinear circuits, where approximation using the Volterra series can be limited to the second order. However, for SBT methods applied to transistor circuits, as shown by the examples included in the paper, multiple equilibrium points are probable, which has not been the subject of intensive research to date. The few existing solutions for circuits with multiple solutions use simplified models of semiconductor elements. Additionally, the characteristics of the nonlinear elements in these models are approximated by piecewise linear functions, which can even affect the number of solutions. The results of piecewise-linear simulations used in diagnostic processes are also subject to errors and deviate from measurements in actual systems, necessitating a relaxation of parameter-estimation accuracy. Typically, a more complex circuit’s description is used for diagnostic purposes, e.g., a hybrid description. Multiple faults further complicate the problem, necessitating the use of SAT verification or identification methods. The methods require solving a nonlinear diagnostic equation, which, as shown in the examples in the paper, can yield multiple solutions for the same set of parameters. Although procedures for determining multiple solutions to an equation are known, there is still no method that guarantees finding all solutions. The influence of thermal effects, including the chip’s self-heating, has not been the subject of extensive research either. The only work concerns the diagnosis of single-spot faults. In recent years, considerable research effort has been directed towards the important and rapidly growing class of DC-DC converters. The specific nature of these nonlinear circuits, their design, and typical faults have led to the development of effective methods for testing and diagnosing them. In this class of circuits, transistors operate as switches, and their switching leads to two linear circuits. In typical DC-DC converter designs, there is no risk of multiple equilibrium points, which makes the established testing procedures reliable and effective. For other classes of nonlinear circuits, the development of such methods is still ongoing.
Generating large-scale fault data via simulation models and then using deep learning methods for diagnostics is a promising approach. It addresses the limitations of traditional fault diagnosis methods. Simulation models can generate comprehensive, diverse datasets that reflect a wide range of fault conditions. However, for this process to be effective, simulation tools are needed that can reliably account for the aspects highlighted in the paper. Unfortunately, no simulation tools are available that can, for example, determine all equilibrium points, assess their stability, and, in particular, account for self-heating. If such tools become available, deep learning techniques based on large amounts of data can effectively determine complex nonlinear relationships between circuit responses and fault types. Simulated fault data will provide the diversity needed for these models to generalize well and capture subtle diagnostic patterns that are difficult to describe analytically.

Funding

This research received no external funding.

Informed Consent Statement

Not applicable.

Data Availability Statement

No additional data available.

Conflicts of Interest

The author declares no conflict of interest.

Abbreviations

The following abbreviations are used in this manuscript:
ACAlternating Current
AIArtificial Intelligence
ANNArtificial Neural Network
BPNNBack Propagation Neural Network
DCDirect Current
FDFault Dictionary
FPGAField-Programmable Gate Array
HMMHidden Markov Model
ICIntegrated Circuit
LSSVMLeast Square Support Vector Machine
NNNeural Network
NTENonlinear Test Equation
PCAPrincipal Component Analysis
PSOParticle Swarm Optimization
PWLPiecewise-Linear
SATSimulation After Test
SBTSimulation Before Test
SVMSupport Vector Machine

References

  1. Binu, D.; Kariyappa, B. A survey on fault diagnosis of analog circuits: Taxonomy and state of the art. AEU-Int. J. Electron. Commun. 2017, 73, 68–83. [Google Scholar] [CrossRef]
  2. Deng, Y.; Chen, T.; Zhang, D. Diagnosis of incipient faults in nonlinear analog circuits based on high order moment fractional transform. J. Electron. Test. 2020, 36, 485–498. [Google Scholar] [CrossRef]
  3. Kabisatpathy, P.; Barua, A.; Sinha, S. Fault diagnosis of analog integrated circuits. In Frontiers in Electronic Testing; Springer: Dordrecht, The Netherlands, 2005. [Google Scholar]
  4. Khemani, V.; Azarian, M.H.; Pecht, M.G. Learnable wavelet scattering networks: Applications to fault diagnosis of analog circuits and rotating machinery. Electronics 2022, 11, 451. [Google Scholar] [CrossRef]
  5. Yuan, H.; Shi, Y.; Li, L.; Ling, G.; Zeng, J.; Wang, Z. Fault diagnosis in analog circuits using a multi-input Convolutional Neural Network with feature attention. Computation 2025, 13, 94. [Google Scholar] [CrossRef]
  6. Bandler, J.; Salama, A. Fault diagnosis of analog circuits. Proc. IEEE 1985, 73, 1279–1325. [Google Scholar] [CrossRef]
  7. Hochwald, W.; Bastian, J. A dc approach for analog fault dictionary determination. IEEE Trans. Circuits Syst. 1979, 26, 523–529. [Google Scholar] [CrossRef]
  8. Deng, Y.; Shi, Y.; Zhang, W. Diagnosis of incipient faults in nonlinear analog circuits. Metrol. Meas. Syst. 2012, 19, 203–218. [Google Scholar] [CrossRef]
  9. Gao, T.; Yang, J.; Jiang, S.; Li, Y. An incipient fault diagnosis method based on complex convolutional self-attention autoencoder for analog circuits. IEEE Trans. Ind. Electron. 2024, 71, 9727–9736. [Google Scholar] [CrossRef]
  10. Liu, X.; Yang, H.; Gao, T.; Yang, J. A novel incipient fault diagnosis method for analogue circuits based on an MLDLCN. Circuits Syst. Signal Process. 2023, 43, 684–710. [Google Scholar] [CrossRef]
  11. Liu, X.; Guo, X.; Yang, H. A novel analogue circuit incipient soft fault diagnosis method based on a multiscale fault diagnosis network. Circuits Syst. Signal Process. 2025, 1–20. [Google Scholar] [CrossRef]
  12. Yang, J.; Li, Y.; Gao, T. An incipient fault diagnosis method based on Att-GCN for analogue circuits. Meas. Sci. Technol. 2023, 34, 045002. [Google Scholar] [CrossRef]
  13. Fang, X.; Qu, J.; Liu, B.; Chai, Y. Overcoming limited fault data: Intermittent fault detection in analog circuits via improved GAN. IEEE Trans. Instrum. Meas. 2024, 73, 3500111. [Google Scholar] [CrossRef]
  14. Gao, S.; Zhao, K. Intermittent fault diagnosis of dynamic systems with model uncertainty and disturbance: An adaptive nondeterministic observer approach. IEEE Trans. Reliab. 2025, 74, 4131–4142. [Google Scholar] [CrossRef]
  15. Gao, S.; Zhao, K.; Si, W.; Wen, C. Time-varying threshold and signed-rectified regressor design of diagnosis observer for analog circuits with intermittent fault. IEEE Trans. Instrum. Meas. 2025, 74, 3510513. [Google Scholar] [CrossRef]
  16. Tadeusiewicz, M.; Hałgas, S.; Kuczynski, A. New aspects of fault diagnosis of nonlinear analog circuits. Int. J. Electron. Telecommun. 2015, 61, 83–93. [Google Scholar] [CrossRef]
  17. Prasad, V.C.; Babu, N.S.C. On minimal set of test nodes for fault dictionary of analog circuit fault diagnosis. J. Electron. Test. 1995, 7, 255–258. [Google Scholar] [CrossRef]
  18. Prasad, V.C.; Rao Pinjala, S.N. Fast algorithms for selection of test nodes of an analog circuit using a generalized fault dictionary approach. Circ. Syst. Signal Process. 1995, 14, 707–724. [Google Scholar] [CrossRef]
  19. Starzyk, J.; Liu, D.; Liu, Z.H.; Nelson, D.; Rutkowski, J. Entropy-based optimum test points selection for analog fault dictionary techniques. IEEE Trans. Instrum. Meas. 2004, 53, 754–761. [Google Scholar] [CrossRef]
  20. Luo, H.; Lu, W.; Wang, Y.; Wang, L. A new test point selection method for analog continuous parameter fault. J. Electron. Test. 2017, 33, 339–352. [Google Scholar] [CrossRef]
  21. Tang, X.; Xu, A.; Niu, S. KKCV-GA-based method for optimal analog test point selection. IEEE Trans. Instrum. Meas. 2017, 66, 24–32. [Google Scholar] [CrossRef]
  22. Khanlari, M.; Ehsanian, M. A test point selection approach for DC analog circuits with large number of predefined faults. Analog Integr. Circuits Signal Process. 2020, 102, 225–235. [Google Scholar] [CrossRef]
  23. Chang, Y.; Xu, X.; Deng, K.; Xu, Y.; Tu, B.; Gao, X.; Wei, Q. An analog circuit fault diagnosis method incorporating multi-objective selection of measurement nodes. Electronics 2025, 14, 1528. [Google Scholar] [CrossRef]
  24. Navid, N.; Willson, A. A theory and an algorithm for analog circuit fault diagnosis. IEEE Trans. Circ. Syst. 1979, 26, 440–457. [Google Scholar] [CrossRef]
  25. Stenbakken, G.; Souders, T.; Stewart, G. Ambiguity groups and testability. IEEE Trans. Instrum. Meas. 1989, 38, 941–947. [Google Scholar] [CrossRef]
  26. Liu, R.W. Testing and Diagnosis of Analog Circuits and Systems; Van Nostrand Reinhold: New York, NY, USA, 1991. [Google Scholar]
  27. Fenton, W.; McGinnity, T.; Maguire, L. Fault diagnosis of electronic systems using intelligent techniques: A review. IEEE Trans. Syst. Man Cybern. Part C 2001, 31, 269–281. [Google Scholar] [CrossRef]
  28. Chen, Y.; Peng, K.; Huang, D.; Tang, Q. Evaluating and optimizing conventional training circuits for analog fault diagnosis via transfer learning. IEEE Trans. Instrum. Meas. 2025, 74, 3549015. [Google Scholar] [CrossRef]
  29. Dieste-Velasco, M. Soft fault diagnosis in analog electronic circuits using supervised machine learning. Integration 2025, 104, 102482. [Google Scholar] [CrossRef]
  30. Du, X.; Jia, S.; Hu, Y.; Wang, Y. Fault diagnosis of analog circuits using an improved BiTCN combined with BiLSTM. J. Electron. Test. 2025, 41, 411–430. [Google Scholar] [CrossRef]
  31. Gao, J.; Guo, J.; Yuan, F.; Yi, T.; Zhang, F.; Shi, Y.; Li, Z.; Ke, Y.; Meng, Y. An exploration into the fault diagnosis of analog circuits using enhanced golden eagle optimized 1D-Convolutional Neural Network (CNN) with a time-frequency domain input and attention mechanism. Sensors 2024, 24, 390. [Google Scholar] [CrossRef]
  32. Hou, Z.; Liu, J.; Yu, S. Enhanced analog circuit fault diagnosis via continuous wavelet transform and dual-stream convolutional fusion. Sci. Rep. 2025, 15, 19828. [Google Scholar] [CrossRef]
  33. Puvaneswari, G. Parametric faults detection in analog circuits using variable ranking-based feature selection method and optimized SVM model. Meas. Sci. Rev. 2025, 25, 30–39. [Google Scholar] [CrossRef]
  34. Puvaneswari, G. SPOT faults: Parametric fault detection in linear analog circuit via sooty egret optimization based iterative decisioned CNN. Circuits Syst. Signal Process. 2025, 44, 7226–7250. [Google Scholar] [CrossRef]
  35. Singhal, M.; Ahmad, G. Fault Diagnosis in Analog Circuits Using Stacking Ensemble Machine Learning Approach. Circuits Syst. Signal Process. 2025, 44, 6255–6275. [Google Scholar] [CrossRef]
  36. You, D.; Liu, S.; Yuan, Y.; Zhang, Y. BCSSA-VMD and ICOA-ELM based fault diagnosis method for analogue circuits. Analog Integr. Circuits Signal Process. 2025, 123, 20. [Google Scholar] [CrossRef]
  37. Yue, Z.; He, L.; He, J.; Yang, G.; Yang, Y.; An, Y. A method of redundant feature suppression in circuit output positions for analog circuit soft and hard fault diagnosis. J. Electron. Test. 2025, 41, 441–465. [Google Scholar] [CrossRef]
  38. Zhou, X.; Tang, X.; Liang, W. A novel analog circuit fault diagnosis method based on multi-channel 1D-resnet and wavelet packet transform. Analog Integr. Circuits Signal Process. 2024, 121, 25–38. [Google Scholar] [CrossRef]
  39. Zhou, N.; Huang, J.; Zhao, Y.; Chen, S.; Zhao, J.; Long, F. Data-Driven Soft Fault Diagnosis for Analog Circuits Based on Contrastive Learning. IEEE Trans. Instrum. Meas. 2025, 74, 3559311. [Google Scholar] [CrossRef]
  40. Fedi, G.; Giomi, R.; Manetti, S.; Piccirilli, M. A symbolic approach for testability evaluation in fault diagnosis of nonlinear analog circuits. In Proceedings of the IEEE International Symposium on Circuits and Systems, Monterey, CA, USA, 31 May–3 June 1998; Volume 6, pp. 9–12. [Google Scholar] [CrossRef]
  41. Salama, A.; Starzyk, J.; Bandler, J. A unified decomposition approach for fault location in large analog circuits. IEEE Trans. Circuits Syst. 1984, 31, 609–622. [Google Scholar] [CrossRef]
  42. Starzyk, J.A.; Dai, H. A decomposition approach for testing large analog networks. J. Electron. Test. 1992, 3, 181–195. [Google Scholar] [CrossRef]
  43. Toczek, W.; Zielonko, R.; Adamczyk, A. A method for fault diagnosis of nonlinear electronic circuits. Measurement 1998, 24, 79–86. [Google Scholar] [CrossRef]
  44. Worsman, M.; Wong, M. Nonlinear circuit fault diagnosis with large change sensitivity. In Proceedings of the IEEE International Conference on Electronics, Circuits and Systems, Lisboa, Portugal, 7–10 September 1998; Volume 2, pp. 225–228. [Google Scholar] [CrossRef]
  45. Worsman, M.; Wong, M. Non-linear analog circuit fault diagnosis with large change sensitivity. Int. J. Circuit Theory Appl. 2000, 28, 281–303. [Google Scholar] [CrossRef]
  46. Rutkowski, J. A dc approach for analog fault dictionary determination. In Proceedings of the European Conference on Circuit Theory and Design, Davos, Switzerland, 30 August–3 September 1993; pp. 877–880. [Google Scholar]
  47. Rutkowski, J. The dc fault dictionary—A neural network approach. In Proceedings of the European Conference on Circuit Theory & Design, Istanbul, Turkey, 27–31 August 1995; pp. 295–298. [Google Scholar]
  48. Rutkowski, J.; Machniewski, J. Integer-code DC fault dictionary. In Proceedings of the IEEE International Symposium on Circuits and Systems), Geneva, Switzerland, 28–31 May 2000; Volume 5, pp. 713–716. [Google Scholar] [CrossRef]
  49. Catelani, M.; Gori, M. On the application of neural networks to fault diagnosis of electronic analog circuits. Measurement 1996, 17, 73–80. [Google Scholar] [CrossRef]
  50. Variyam, P.; Chatterjee, A. Specification-driven test generation for analog circuits. IEEE Trans. Comput.-Aided Des. Integr. Circuits Syst. 2000, 19, 1189–1201. [Google Scholar] [CrossRef]
  51. Burdiek, B. Generation of optimum test stimuli for nonlinear analog circuits using nonlinear programming and time-domain sensitivities. In Proceedings of the Design, Automation and Test in Europe, Munich, Germany, 13–16 March 2001; pp. 603–608. [Google Scholar] [CrossRef]
  52. Chatterjee, S.; Chatterjee, A. Test generation based diagnosis of device parameters for analog circuits. In Proceedings of the Design, Automation and Test in Europe, Munich, Germany, 13–16 March 2001; pp. 596–602. [Google Scholar] [CrossRef]
  53. Spinks, S.J.; Chalk, C.D.; Bell, I.M.; Zwolinski, M. Generation and verification of tests for analog circuits subject to process parameter deviations. J. Electron. Test. 2004, 20, 11–23. [Google Scholar] [CrossRef]
  54. Robotycki, A.; Zielonko, R. Fault diagnosis of analog piecewise linear circuits based on homotopy. IEEE Trans. Instrum. Meas. 2002, 51, 876–881. [Google Scholar] [CrossRef]
  55. Tadeusiewicz, M.; Hałgas, S.; Korzybski, M. Multiple catastrophic fault diagnosis of analog circuits considering the component tolerances. Int. J. Circuit Theory Appl. 2012, 40, 1041–1052. [Google Scholar] [CrossRef]
  56. Tan, Y.; He, Y.; Cui, C.; Qiu, G. A novel method for analog fault diagnosis based on neural networks and genetic algorithms. IEEE Trans. Instrum. Meas. 2008, 57, 2631–2639. [Google Scholar] [CrossRef]
  57. Grzechca, D.; Golonek, T.; Rutkowski, J. Analog fault AC dictionary creation—The fuzzy set approach. In Proceedings of the IEEE International Symposium on Circuits and Systems, Island of Kos, Greece, 21–24 May 2006; pp. 5744–5747. [Google Scholar] [CrossRef]
  58. Aminian, F.; Aminian, M. Fault diagnosis of nonlinear analog circuits using neural networks with wavelet and Fourier transforms as preprocessors. J. Electron. Test. 2001, 17, 471–481. [Google Scholar] [CrossRef]
  59. He, Y.; Tan, Y.; Sun, Y. A neural network approach for fault diagnosis of large-scale analogue circuits. In Proceedings of the IEEE International Symposium on Circuits and Systems, Phoenix-Scottsdale, AZ, USA, 26–29 May 2002; Volume 1, pp. 153–156. [Google Scholar] [CrossRef]
  60. Long, B.; Tian, S.; Wang, H. Feature vector selection method using Mahalanobis distance for diagnostics of analog circuits based on LS-SVM. J. Electron. Test. 2012, 28, 745–755. [Google Scholar] [CrossRef]
  61. Li, Y.; Zhang, R.; Guo, Y.; Huan, P.; Zhang, M. Nonlinear soft fault diagnosis of analog circuits based on RCCA-SVM. IEEE Access 2020, 8, 60951–60963. [Google Scholar] [CrossRef]
  62. Lei, H.; Qin, K. Greedy randomized adaptive search procedure for analog test point selection. Analog Integr. Circuits Signal Process. 2014, 79, 371–383. [Google Scholar] [CrossRef]
  63. Bilski, A.; Wojciechowski, J. Automatic parametric fault detection in complex analog systems based on a method of minimum node selection. Int. J. Appl. Math. Comput. Sci. 2016, 26, 655–668. [Google Scholar] [CrossRef]
  64. Gao, Y.; Yang, C.; Tian, S.; Chen, F. Entropy based test point evaluation and selection method for analog circuit fault diagnosis. Math. Probl. Eng. 2014, 2014, 259430. [Google Scholar] [CrossRef]
  65. Tang, X.; Xu, A.; Li, R.; Zhu, M.; Dai, J. Simulation-based diagnostic model for automatic testability analysis of analog circuits. IEEE Trans. Comput.-Aided Des. Integr. Circuits Syst. 2018, 37, 1483–1493. [Google Scholar] [CrossRef]
  66. Yin, S. Nonlinear analog circuit diagnosis based on Volterra series and neural network. In Proceedings of the International Conference on Wireless Communications Networking and Mobile Computing, Chengdu, China, 23–25 September 2010; pp. 1–3. [Google Scholar] [CrossRef]
  67. Deng, Y.; Shi, Y.; Zhang, W. An approach to locate parametric faults in nonlinear analog circuits. IEEE Trans. Instrum. Meas. 2012, 61, 358–367. [Google Scholar] [CrossRef]
  68. Shi, Y.; Deng, Y.; Zhang, W. Diagnosis of incipient faults in weak nonlinear analog circuits. Circuits Syst. Signal Process. 2013, 32, 2151–2170. [Google Scholar] [CrossRef]
  69. Deng, Y.; Chai, G. Soft fault feature extraction in nonlinear analog circuit fault diagnosis. Circuits Syst. Signal Process. 2016, 35, 4220–4248. [Google Scholar] [CrossRef]
  70. Deng, Y.; Liu, N. Soft fault diagnosis in analog circuits based on bispectral models. J. Electron. Test. 2017, 33, 543–557. [Google Scholar] [CrossRef]
  71. Yuan, L.; He, Y.; Huang, J.; Sun, Y. A new neural-network-based fault diagnosis approach for analog circuits by using kurtosis and entropy as a preprocessor. IEEE Trans. Instrum. Meas. 2010, 59, 586–595. [Google Scholar] [CrossRef]
  72. Tadeusiewicz, M.; Hałgas, S. A new approach to multiple soft fault diagnosis of analog BJT and CMOS circuits. IEEE Trans. Instrum. Meas. 2015, 64, 2688–2695. [Google Scholar] [CrossRef]
  73. Tadeusiewicz, M.; Hałgas, S. Diagnosis of soft spot short defects in analog circuits considering the thermal behaviour of the chip. Metrol. Meas. Syst. 2016, 23, 239–250. [Google Scholar] [CrossRef]
  74. Tadeusiewicz, M.; Hałgas, S. A Method for local parametric fault diagnosis of a broad class of analog integrated circuits. IEEE Trans. Instrum. Meas. 2018, 67, 328–337. [Google Scholar] [CrossRef]
  75. Tadeusiewicz, M.; Kuczynski, A.; Hałgas, S. Spot defect diagnosis in analog nonlinear circuits with possible multiple operating points. J. Electron. Test. 2015, 31, 491–502. [Google Scholar] [CrossRef]
  76. Sindia, S.; Singh, V.; Agrawal, V.D. Parametric fault diagnosis of nonlinear analog circuits using polynomial coefficients. In Proceedings of the International Conference on VLSI Design, Bangalore, India, 3–7 January 2010; pp. 288–293. [Google Scholar] [CrossRef]
  77. Sindia, S.; Agrawal, V.; Singh, V. Parametric fault testing of non-linear analog circuits based on polynomial and V-transform coefficients. J. Electron. Test. 2012, 28, 757–771. [Google Scholar] [CrossRef]
  78. Sindia, S.; Agrawal, V.D. High sensitivity test signatures for unconventional analog circuit test paradigms. In Proceedings of the IEEE International Test Conference, Anaheim, CA, USA, 6–13 September 2013; pp. 1–10. [Google Scholar] [CrossRef]
  79. Li, Y.; Zio, E.; Lu, N.; Wang, X.; Jiang, B. Joint distribution-based test selection for fault detection and isolation under multiple faults condition. IEEE Trans. Instrum. Meas. 2021, 70, 3504013. [Google Scholar] [CrossRef]
  80. Feng, H.; Li, G.; Yu, J.; Ma, X.; Wang, J. Analog circuit fault diagnosis based on enhanced Harris Hawks optimization algorithm with RBF neutral network. Eng. Rep. 2023, 5, e12634. [Google Scholar] [CrossRef]
  81. Cui, Y.; Shi, J.; Wang, Z. Analog circuit test point selection incorporating discretization-based fuzzification and extended fault dictionary to handle component tolerances. J. Electron. Test. 2016, 32, 661–679. [Google Scholar] [CrossRef]
  82. Zhang, J. Fault diagnosis of nonlinear analog circuit based on generalized frequency response function and LSSVM classifier fusion. Math. Probl. Eng. 2020, 2020, 8274570. [Google Scholar] [CrossRef]
  83. Hałgas, S. Multiple soft fault diagnosis of nonlinear circuits using the fault dictionary approach. Bull. Pol. Acad. Sci. Tech. Sci. 2008, 56, 53–57. [Google Scholar]
  84. Vassios, V.D.; Hatzopoulos, A.T.; Papakostas, D.K. Improved fault detection of analog circuits by utilizing the fundamental RMS of the supply current fluctuation. In Proceedings of the International Conference on Modern Circuits and Systems Technologies, Athens, Greece, 28–30 June 2023; pp. 1–6. [Google Scholar] [CrossRef]
  85. Vassios, V.D.; Hatzopoulos, A.; Intzes, I.G.; Papakostas, D.K. Parametric fault detection of analog circuits by utilizing the fundamental RMS of the supply current fluctuation. In Proceedings of the International Conference on Modern Circuits and Systems Technologies, Sofia, Bulgaria, 26–28 June 2024; pp. 1–4. [Google Scholar] [CrossRef]
  86. Vassios, V.D.; Hatzopoulos, A.T.; Intzes, I.G.; Tsiakmakis, K.; Papakostas, D.K. A self-trained, low-complexity method for detecting faults in analog circuits. IEEE Trans. Instrum. Meas. 2025, 74, 3510813. [Google Scholar] [CrossRef]
  87. Yang, C.; Tian, S.; Liu, Z.; Huang, J.; Chen, F. Fault modeling on complex plane and tolerance handling methods for analog circuits. IEEE Trans. Instrum. Meas. 2013, 62, 2730–2738. [Google Scholar] [CrossRef]
  88. Amaral, T.G.; Pires, V.F.; Foito, D.; Cordeiro, A.; Rocha, J.I.; Chaves, M.; Pires, A.J.; Martins, J.F. A fault detection and diagnosis method based on the currents entropy indexes for the SRM drive with a fault tolerant multilevel converter. IEEE Trans. Ind. Appl. 2024, 60, 520–531. [Google Scholar] [CrossRef]
  89. Tadeusiewicz, M.; Hałgas, S.; Korzybski, M. An algorithm for soft-fault diagnosis of linear and nonlinear circuits. IEEE Trans. Circ. Syst. I Fundam. Theory Appl. 2002, 49, 1648–1653. [Google Scholar] [CrossRef]
  90. Tadeusiewicz, M.; Hałgas, S. Multiple soft fault diagnosis of BJT circuits. Metrol. Meas. Syst. 2014, 21, 663–674. [Google Scholar] [CrossRef]
  91. Tadeusiewicz, M.; Hałgas, S. A fault verification method for testing of analogue electronic circuits. Metrol. Meas. Syst. 2018, 25, 331–346. [Google Scholar] [CrossRef]
  92. Tadeusiewicz, M.; Hałgas, S. Integer algorithm: A useful tool for fault diagnosis of analog circuits. Circ. Syst. Signal Process. 2023, 42, 5121–5141. [Google Scholar] [CrossRef]
  93. Shahbazi, M.; Jamshidpour, E.; Poure, P.; Saadate, S.; Zolghadri, M.R. Open- and short-circuit switch fault diagnosis for nonisolated DC-DC converters using field programmable gate array. IEEE Trans. Ind. Electron. 2013, 60, 4136–4146. [Google Scholar] [CrossRef]
  94. Cardoso, A.; Bento, F. Diagnostics and fault tolerance in DC-DC converters and related industrial electronics technologies. Electronics 2023, 12, 2341. [Google Scholar] [CrossRef]
  95. Fontana, G.; Luchetta, A.; Manetti, S.; Piccirilli, M.C. A testability measure for DC-excited periodically switched networks with applications to DC-DC converters. IEEE Trans. Instrum. Meas. 2016, 65, 2321–2341. [Google Scholar] [CrossRef]
  96. Aizenberg, I.; Bindi, M.; Grasso, F.; Luchetta, A.; Manetti, S.; Piccirilli, M. Testability analysis in neural network based fault diagnosis of DC-DC converter. In Proceedings of the International Forum on Research and Technology for Society and Industry, Florence, Italy, 9–12 September 2019; pp. 265–268. [Google Scholar] [CrossRef]
  97. Bindi, M.; Piccirilli, M.C.; Luchetta, A.; Grasso, F.; Manetti, S. Testability evaluation in time-variant circuits: A new graphical method. Electronics 2022, 11, 1589. [Google Scholar] [CrossRef]
  98. Bindi, M.; Corti, F.; Grasso, F.; Luchetta, A.; Manetti, S.; Piccirilli, M.C.; Reatti, A. Failure prevention in DC-DC converters: Theoretical approach and experimental application on a Zeta converter. IEEE Trans. Ind. Electron. 2023, 70, 930–939. [Google Scholar] [CrossRef]
  99. Pazouki, E.; Abreu-Garcia, J.; Sozer, Y. Fault diagnosis method for DC-DC converters based on the inductor current emulator. In Proceedings of the IEEE Energy Conversion Congress and Exposition, Milwaukee, WI, USA, 18–22 September 2016; pp. 1–6. [Google Scholar] [CrossRef]
  100. Su, Q.; Wang, Z.; Xu, J.; Li, C.; Li, J. Fault detection for DC-DC converters using adaptive parameter identification. J. Frankl. Inst. 2022, 359, 5778–5797. [Google Scholar] [CrossRef]
  101. Han, W.; Cheng, L.; Han, W.; Yu, C.; Yin, Z.; Hao, Z.; Zhu, J. Incipient fault diagnosis for DC-DC converter based on multi-dimensional feature fusion. IEEE Access 2023, 11, 58822–58834. [Google Scholar] [CrossRef]
  102. Han, W.; Cheng, L.; Han, W.; Yu, C.; Hao, Z.; Yin, Z. Soft fault diagnosis for DC-DC converter based on improved ResNet-50. IEEE Access 2023, 11, 81157–81168. [Google Scholar] [CrossRef]
  103. Jia, Z.; Liu, Z.; Vong, C.M.; Wang, S.; Cai, Y. DC-DC buck circuit fault diagnosis with insufficient state data based on deep model and transfer strategy. Expert Syst. Appl. 2023, 213, 118918. [Google Scholar] [CrossRef]
  104. Ke, L.; Hu, G.; Yang, Y.; Liu, Y. Fault diagnosis for modular multilevel converter switching devices via multimodal attention fusion. IEEE Access 2023, 11, 135035–135048. [Google Scholar] [CrossRef]
  105. Li, Z.B.; Feng, X.Y.; Wang, L.; Xie, Y.C. DC-DC circuit fault diagnosis based on GWO optimization of 1DCNN-GRU network hyperparameters. Energy Rep. 2023, 9, 536–548. [Google Scholar] [CrossRef]
  106. Miao, J.; Liu, Y.; Yin, Q.; Zhang, G.; Yuan, Y. Research on the influence of signal sampling frequency on soft fault diagnosis accuracy of DC/DC converters. CPSS Trans. Power Electron. Appl. 2023, 8, 33–41. [Google Scholar] [CrossRef]
  107. Khater, F.; Aibeche, A.; Fellag, S.A.; Doghmane, M.Z.; Akroum, H. Failure identification and isolation of DC-DC boost converter using a sliding mode controller and adaptive threshold. Diagnostyka 2024, 25, 2024303. [Google Scholar] [CrossRef]
  108. Khan, S.S.; Wen, H. A comprehensive review of fault diagnosis and tolerant control in DC-DC converters for DC microgrids. IEEE Access 2021, 9, 80100–80127. [Google Scholar] [CrossRef]
  109. Xiao, Q.; Jin, Y.; Jia, H.; Tang, Y.; Cupertino, A.F.; Mu, Y.; Teodorescu, R.; Blaabjerg, F.; Pou, J. Review of fault diagnosis and fault-tolerant control methods of the modular multilevel converter under submodule failure. IEEE Trans. Power Electron. 2023, 38, 12059–12077. [Google Scholar] [CrossRef]
  110. ICAP4. Working with Model Libraries; Intusoft: San Pedro, CA, USA, 2000. [Google Scholar]
  111. IsSPICE4 Users Guides; Rev 04/08; Intusoft: Carson, CA, USA, 2008; Volume 1,2.
  112. Hałgas, S. Diagnosis of analog circuits: The problem of ambiguity of test equation solutions. Electronics 2024, 13, 684. [Google Scholar] [CrossRef]
Figure 1. Two-stage transistor amplifier (microphone amplifier) considered in the time domain.
Electronics 14 04427 g001
Figure 2. The input signal waveform V i n ( t ) for the circuit shown in Figure 1 assumed for testing purposes.
Electronics 14 04427 g002
Figure 3. Output signal waveforms V o u t ( t ) for nominal parameter values (curve 1) and assumed fault R 2 = 2 k Ω (curve 2) with marked samples.
Electronics 14 04427 g003
Figure 4. Output signal waveforms V o u t ( t ) for R 2 = 2.0 k Ω (curve 1), C 1 = 145 nF , C 5 = 140 pF , In Proceedings of the R 5 = 725 Ω (curve 2), C 1 = 144 nF , R 2 = 4.77 k Ω , R 5 = 719 Ω (curve 3), and R 2 = 512 Ω , R 3 = 1.43 k Ω , R 5 = 634 Ω (curve 4) with marked samples.
Electronics 14 04427 g004
Figure 5. Output signal waveforms V o u t ( t ) for { R 2 = 2.0 k Ω , R 3 = 12.0 k Ω , R 5 = 1.8 k Ω } (curve 1), { R 2 = 512 Ω , R 3 = 1.43 k Ω , R 5 = 634 Ω } (curve 2) and { R 2 = 1.44 k Ω , R 3 = 5.67 k Ω , R 5 = 1.06 k Ω } (curve 3) with marked samples.
Electronics 14 04427 g005
Figure 6. DC model of the circuit shown in Figure 1.
Electronics 14 04427 g006
Figure 7. SPICE simulation results for triple soft fault { R 1 = 150 k Ω , R 2 = 3.3 k Ω , and R 5 = 2.2 k Ω } at nominal supply voltage (a) and at 10 V supply voltage (b).
Electronics 14 04427 g007
Figure 8. SPICE simulation results for triple soft fault { R 1 = 61.3478 k Ω , R 2 = 2.8430 k Ω , and R 5 = 2.1339 k Ω } at nominal supply voltage (a) and at 10 V supply voltage (b).
Electronics 14 04427 g008
Figure 9. The circuit shown in Figure 6 with the connected DC voltage source V i n = 5 V .
Electronics 14 04427 g009
Figure 10. Voltage regulator circuit.
Electronics 14 04427 g010
Table 1. Timeline of research developments in fault diagnosis of nonlinear analog circuits.
PeriodKey Research Developments and Methodologies
1970s–1980sAnalytical, topology, and circuit-equation-based methods [24]; sensitivity analysis; linearization of nonlinear circuits, PWL approach [40]; emergence of computer simulation; creation of early fault dictionaries [7], early parametric fault modeling to handle soft faults; decomposition methods [41].
1990sDevelopment of decomposition methods [42]; verification methods [43]; test point selection foundation [17,18]; large change sensitivity [44,45]; introduction of neural networks and wavelet transforms [46,47,48,49]; considering multiple operating points with PWL [26].
2000sTest signal optimization [50,51,52,53]; homotopy methods [54]; adaptation of optimization methods [55] and data-driven methods, such as genetic algorithms [56] and fuzzy logic [57]; progress in automated feature extraction [58,59].
2010sUse of SVMs for fault classification [60,61]; metaheuristic algorithms (GRASP [62], tabu search [63]); sophisticated graph methods [20,64]; integration of hybrid model-based and data-driven frameworks [20,63,65]; use of time-frequency and multi-domain analysis [61]; the Volterra series [8,66,67,68,69,70]; statistical models nd probabilistic models [2,8,61,68,69,71]; finding multiple solutions of test equations using homotopy-based methods [72,73,74,75]; polynomial models [76,77,78].
2020s–PresentExpansion of machine learning and deep learning (deep joint distribution [79], GAN, autoencoders [13], and wavelet scattering methods [4]); hybrid data-driven solution [4,79,80].
Table 2. Comparative overview of SBT fault diagnosis methods for nonlinear electronic circuits.
MethodDomain/Representative TechniquesStrenghtsDrawbacks
[7]DC, small signal AC/Fault dictionaryUtilizing fault history; stimuli and test points selectionDependence on the engineer’s experience; single hard faults
[46,47,48]DC/Fault dictionary; ANNUsing information channel–based method to select measurements; Hamming code outputs of ANNSingle hard faults
[49]AC/Fault dictionary; ANN;
linear regression
ANN acting as autoassociators;
gradual faults
Limited single fault classes
[44,45]DC, small signal AC/Fault dictionary; PWL models; Katzenelson’s algorithmExtension of large change sensitivity to nonlinear circuits; soft and hard faultsSingle faults; simple illustrative examples
[58]Time/ANN; PCAUtilizing wavelet and Fourier transform; hard and soft faultsSingle faults; Limited fault classes; soft faults with presumed values
[59]DC/BPNNBPNN for subcircuits; hard and soft faultsSingle faults; Limited fault classes; no guidelines for splitting into subcircuits
[57]AC/Fuzzy expert systemUtilizing the sparsity of the
sensitivity matrix
Single faults; fault detection only
[56]DC, small signal AC/ANN; PWL modelsUnified space characteristic of up to triple faults in linear circuits; multiple soft and hard faultsNo in-depth coverage of
nonlinear circuits
[83]DC/Fault dictionary; section-wise PWLIdentification and estimation of multiple soft faults; concise mathematical description of n–dimensional surfacesNecessity of solving nonlinear equations in identification process
[71]Time/BPNN; statistical featuresApplication of higher-order statistical methods; soft and hard faultsLimited fault classes; assumed specific soft faults ( ± 50 % of nominal value); simple illustrative nonlinear example
[66]Time/BPNN; Volterra seriesRanges of soft faultsLimited single fault classes; simple illustrative nonlinear example
[67]Time/Fault dictionary; subband Volterra series; coherenceHard and soft faultsLimited single fault classes and a few double faults; predefined values of
soft faults
[60]Time/Multiple LSSVM; Mahalanobis distanceWavelet types, wavelet decomposition level, and normalization discussion; hard and soft faults; wide ranges of soft faultsLimited single fault classes; simple illustrative nonlinear example
[55]DC/Fault dictionary; GA; linear programmingMultiple hard faultsFinite list of preselected faults; using simplex method in identification
[8,68]Time/HMM; subband Volterra series; fractional correlationIncipient faults; ranges of incipient faultsLimited single fault classes and a few double faults
[76,77,78]Time/Fault dictionary; polynomial and V-transform coefficientsEffective detection of faults; simple procedure; single soft faultsLimited single fault classes; necessity of estimating the circuit’s response; fault detection only
[87]AC/Fault dictionary; fault modeling on complex planeGraphic visualization of signatures; wide range of soft faultsLimited single fault classes
[75]DC/Fault dictionary; linear complementarity approachConsidering multiple operating points; local spot faultsFinite list of preselected faults; necessity of tracing and storing parametric characteristics; hybrid circuit description
[69,70]Time/HMM; subband Volterra series; Wigner-Ville distribution;
bispectral models
Hard and soft faults; ranges of soft faultsLimited single fault classes and a few double faults; narrow soft fault ranges
[2]Time/Fault dictionary; high order moment fractional transformIncipient faults belonging to predefined ranges; helpful to deal with aliasingLimited single fault classes and
a few double faults; high
computational complexity
[82]Time/Generalized frequency response function; LSSVMUsing fusion algorithm; soft faultsPreselected single faults ( ± 50 % of nominal value); simple illustrative nonlinear example
[61]Time/Canonical correlation analysis; PCA; SVM; ReliefF algorithmFusion algorithm from statistical, time and frequency domain; soft faultsLimited single fault classes; Preselected single faults ( ± 50 % of nominal value)
[4]Time/Learnable wavelet scattering networks; GA; SVMUsefulness in diagnosing industrial faults; wide range of soft faults; one class for each parameterLimited single fault classes and a few double faults
[80]Time/RBF ANN; Enhanced Harris Hawks Optimization (EHHO)Weights and thresholds of ANN optimized using EHHO; soft faultLimited number of single faults
[88]Time/Image analysis; entropy-based symmetry/asymmetry indexesDetection and diagnosis for power semiconductor fault; multiple hard faultsSpecific application–multilevel converters
[13]Time/Generative adversarial networkSpatial Fourier convolution to enhance detection performance; intermittent faults; concept of intermittent
faults implementation
Resistive faults with preset values; limited number and location of faults
[84,85,86]Time/Fault dictionary; Under/Over Voltage (UOV) algorithmMonitoring of the fluctuations of the power supply current; low-complexity; hard/soft/incipient faults; large number of considered faultsFault detection only
Table 3. Comparative overview of SAT fault diagnosis methods for nonlinear electronic circuits.
MethodDomain/Representative TechniquesStrenghtsDrawbacks
[41]DC/Nodal decomposition; checking the consistency of KCL in the decomposed circuit; nearest neighbor ruleLarge circuits; module-level fault diagnosis; necessary and almost sufficient conditions for subnetworks to be fault-free; fault verification to locate faults in faulty blocks; multiple soft faults; hard faultsMeasurement nodes must include decomposition nodes; complex test procedure; lack of general
decomposition procedure
[42]Time/Decomposition method; QR factorization; sensitivity analysisLarge-scale analog and mixed-mode circuits; study the impact of modeling errors; subsystems analyzed using methods best suited to type of subcircuit; test equations prepared on subnetwork level; parameter identification problem locally solved; hard and soft faultsInternal sensitivities must be calculated before evaluating the test matrix; all decomposition nodes are accessed for measurements; only linear example
[26], ch.4DC/PWL approachConsideration of polarization shift in nonlinear devices; diagnosis of nonlinear circuits with multiple operating points; reduced tableau equation; k-fault testability condition; soft faultsSimple semiconductor device models; two/three–segment PWL approximation
[43]DC/PWL approach; verification methodDefinition of a correlation indicator for individual faults and operating point consistence coefficient; two stage approach; tableau equation; soft faultsSingle faults; access to many
nodes required
[54]DC/PWL approach; homotopy concept; verification methodSmall number of hypothesis verifications; soft faults; fault localization and identification in one stageSimple illustrative example; single faults
[89]DC/linear–programming concept; verification methodOnly phase one of the simplex method applies to checking the existence of a feasible solution; multiple soft faultsAccess to many nodes required; faults up to ±20% of nominal value; fault localization only
[90]DC/Block relaxation method; Newton–Raphson methodMultiple solutions of nonlinear test equation; multiple soft faultsBJT circuits; only one transistor considered as potentially faulty; large number
of equations
[72]DC/Extended systematic search method; verification methodMultiple soft faults; multiple solutions of nonlinear test equation; broad class of analog circuits; intricate transistors modelsTime-consuming calculation process; complex sensitivity analyses required
[16]DC/Homotopy-simplicial algorithm; restart procedureLocal and global multiple soft faults; multiple solutions of nonlinear test equation; broad class of analog circuits; intricate transistors modelsClosed homotopy loop prevents continuation of calculations; In some cases homotopy path can be infinite spiral or bifurcation curve, time-consuming calculation process
[73]DC/Optimization procedure based on the Fibonacci method;
verification method
Consideration of chip thermal behavior; soft spot short defectsSingle defects only;
[74]DC/Homotopy concept; sensitivity analysis; verification methodMultiple soft faults; efficient iterative method; broad class of analog circuits; intricate transistors modelsSmall and middle-size circuits; complex sensitivity analyses required
[91]DC/Powell’s minimization method; verification methodMultiple soft faults; no sensitivity analysis requiredEffectiveness strongly depends on measurement accuracy; difficult to implement and less efficient for CMOS circuits designed in a
sub-micrometre technology
[92]DC/Integer algorithm; homotopy simplicial approach; verification methodMultiple soft faults; optimization method for constrained variables to initial simplex generationInteger algorithm requires more simplices than the standard simplicial algorithm; method fails if divergence or slow convergence in DC analysis occurs
Disclaimer/Publisher’s Note: The statements, opinions and data contained in all publications are solely those of the individual author(s) and contributor(s) and not of MDPI and/or the editor(s). MDPI and/or the editor(s) disclaim responsibility for any injury to people or property resulting from any ideas, methods, instructions or products referred to in the content.