Article

Heterogeneous PLC-Based Distributed Controller with Embedded Logic-Monitoring Blackbox for Real-Time Failover

1
Division of Robotics Convergence, Graduate School, Pusan National University, Busan 46241, Republic of Korea
2
School of Mechanical Engineering, Pusan National University, Busan 46241, Republic of Korea
3
Dong Young Tech One Co., Ltd., R&D, 66-33, Bansong-ro 513beon-gil, Haeundae-gu, Busan 48004, Republic of Korea
*
Author to whom correspondence should be addressed.
Electronics 2025, 14(22), 4359; https://doi.org/10.3390/electronics14224359
Submission received: 3 October 2025 / Revised: 1 November 2025 / Accepted: 5 November 2025 / Published: 7 November 2025

Abstract

This study presents a heterogeneous PLC-based distributed controller integrating an embedded logic-monitoring blackbox for real-time failover and fault detection in industrial control environments. Industrial automation and water treatment systems heavily rely on programmable logic controllers (PLCs) for process and equipment control. However, frequent failures, transient errors, and unknown malfunctions threaten system reliability and operational continuity. To address these issues, this study proposes a heterogeneous redundancy architecture consisting of a primary PLC and a standby distributed controller equipped with a logic-monitoring blackbox. The blackbox continuously monitors the I/O logic status of the primary PLC, records abnormal behaviors such as I/O faults, and enables the standby controller’s I/O to selectively execute failover operations. Unlike conventional homogeneous redundancy, which depends on identical hardware, the proposed approach adopts a Linux-based platform, offering advantages in flexibility, cost efficiency, and elimination of vendor lock-in. Furthermore, the standby controller integrates both a ladder editor and an HMI editor, allowing for direct on-site modification and editing of faulty I/O without external tools. Experimental validation was conducted using a laboratory testbed, while durability and electromagnetic compatibility (EMC) assessments were performed by an accredited institute to verify industrial applicability. Quantitatively, the mean time between failures (MTBF) increased by 17.2%, the average switchover latency was reduced to 41 ms, and the detection probability ( g ) reached 0.986 under multi-vendor configurations. All tests were performed under controlled industrial conditions using IEC 61508-compliant PLC testbeds. The results confirm that the proposed heterogeneous redundancy method significantly enhances fault detection capability, ensures rapid failover, and improves overall operational reliability in industrial automation systems.

1. Introduction

Industrial automation systems have been widely adopted worldwide to enhance productivity and quality, with most facilities centered on programmable logic controllers (PLCs). PLCs perform accurate logic control in automated plants, enabling error-free and efficient operation. Therefore, the application of PLCs must be based on reliability and stability while also meeting the growing requirements for flexible system configurations, real-time monitoring, and data analytics to improve process automation efficiency [1,2,3].
According to market analyses, the global PLC market is expected to reach approximately USD 12.73 billion by 2025 and further grow at a CAGR of 4.37% to USD 15.77 billion by 2030 [4]. Another report forecasts a growth from USD 11.7 billion in 2024 to about USD 31.4 billion by 2034, at a CAGR of 10.4% [5]. This rapid expansion in manufacturing automation facilities underscores the rising demand for PLC redundancy [6]. However, strategies for ensuring reliability and operational continuity have not sufficiently kept pace with this demand.
Currently, industrial sites primarily rely on vendor-provided homogeneous PLC redundancy models to enhance reliability. While effective to some extent, these approaches present functional limitations. To overcome these, engineers have explored customized redundancy schemes such as dual/triple PLC configurations [7,8,9] or the adoption of virtual PLCs, which decouple control logic from hardware to improve flexibility and scalability [10]. Nevertheless, these methods face persistent challenges, including increased system costs, structural complexity, interoperability issues, maintenance difficulties, lack of standardized security certification, and limited code portability.
A quantitative comparison of representative PLC redundancy architectures is summarized in Table 1. Traditional isomorphic redundancy systems usually provide high determinism but incur high costs and long switchover latency (80–100 ms). Virtual PLC schemes improve portability and reduce hardware dependency but have moderate detection probability (0.90–0.94). Triple-mode redundancy offers higher reliability but is costly and complex to scale. In contrast, the proposed heterogeneous redundancy approach achieves higher fault coverage (0.98), shorter switchover latency (41 ms), and a lower integration cost while maintaining cross-vendor compatibility.
To address these limitations, this study proposes a heterogeneous PLC-based redundancy architecture. The core innovation of this study lies in the integration of a Linux-based distributed standby controller and a logic-monitoring blackbox, enabling vendor-independent failover, anomaly detection, and real-time logic-state analytics across heterogeneous PLCs. This architecture departs from traditional homogeneous redundancy by providing cross-platform interoperability and self-contained logic recovery. The approach employs a primary PLC and a Linux-based standby distributed controller, such that the standby unit automatically takes over control in the event of primary PLC failure. A logic monitoring blackbox embedded in the standby controller continuously monitors the I/O logic state of the primary PLC, distinguishing between normal and faulty data, and performs selective failover execution when errors are detected. Furthermore, the standby controller integrates the DYTO Studio program (ladder and HMI editors), enabling on-site engineers to promptly modify ladder logic and HMI screens without additional external tools [12].
The proposed heterogeneous redundancy system was validated through both simulation-based testbed experiments and a physical control panel prototype. In addition, electromagnetic compatibility (EMC) and durability tests were performed at an authorized testing institute, confirming industrial applicability. The results demonstrate that the proposed approach significantly improves fault detection capability, ensures seamless failover during errors, and maintains uninterrupted operation of automation systems—leading to time and cost savings while enhancing overall operational reliability.
The remainder of this paper is organized as follows. Section 2 introduces the reliability model and the blackbox-based monitoring framework. Section 3 describes the design of the distributed controller and the I/O redundancy logic, while Section 4 presents the implementation details. Section 5 reports the experimental validation and certification test results. Finally, Section 6 concludes this paper with quantitative performance analysis and directions for future work.

2. Components for Heterogeneous PLC I/O Error Detection

This chapter introduces the key components that support I/O error detection within the proposed heterogeneous PLC redundancy architecture. Specifically, it addresses the heterogeneous PLC configuration, reliability analysis, port forwarding, the integrated Dong Young Tech One(DYTO) Studio environment, and the blackbox configuration.

2.1. Hardware and Software Configuration of Heterogeneous PLCs

Previous studies have predominantly implemented redundancy using homogeneous PLCs from a single vendor to achieve real-time backup functionality. However, this approach has limited fault tolerance against firmware and hardware defects and leads to high vendor dependency, restricting external technical support and data accessibility [3]. Moreover, common vulnerabilities or failures may simultaneously affect the entire system [13].
In particular, while Linux-based industrial PCs and embedded boards provide high flexibility and scalability, they still face limitations in achieving PLC-level real-time performance and stable I/O processing [14]. Furthermore, the lack of on-site editable ladder and HMI integrated programs for immediate error correction and replacement execution has also been identified as a challenge [15].
In contrast, the proposed heterogeneous PLC configuration minimizes cross-interference between controllers, ensures failover continuity when one PLC fails, and maintains uninterrupted plant operation through partial system redundancy [1].
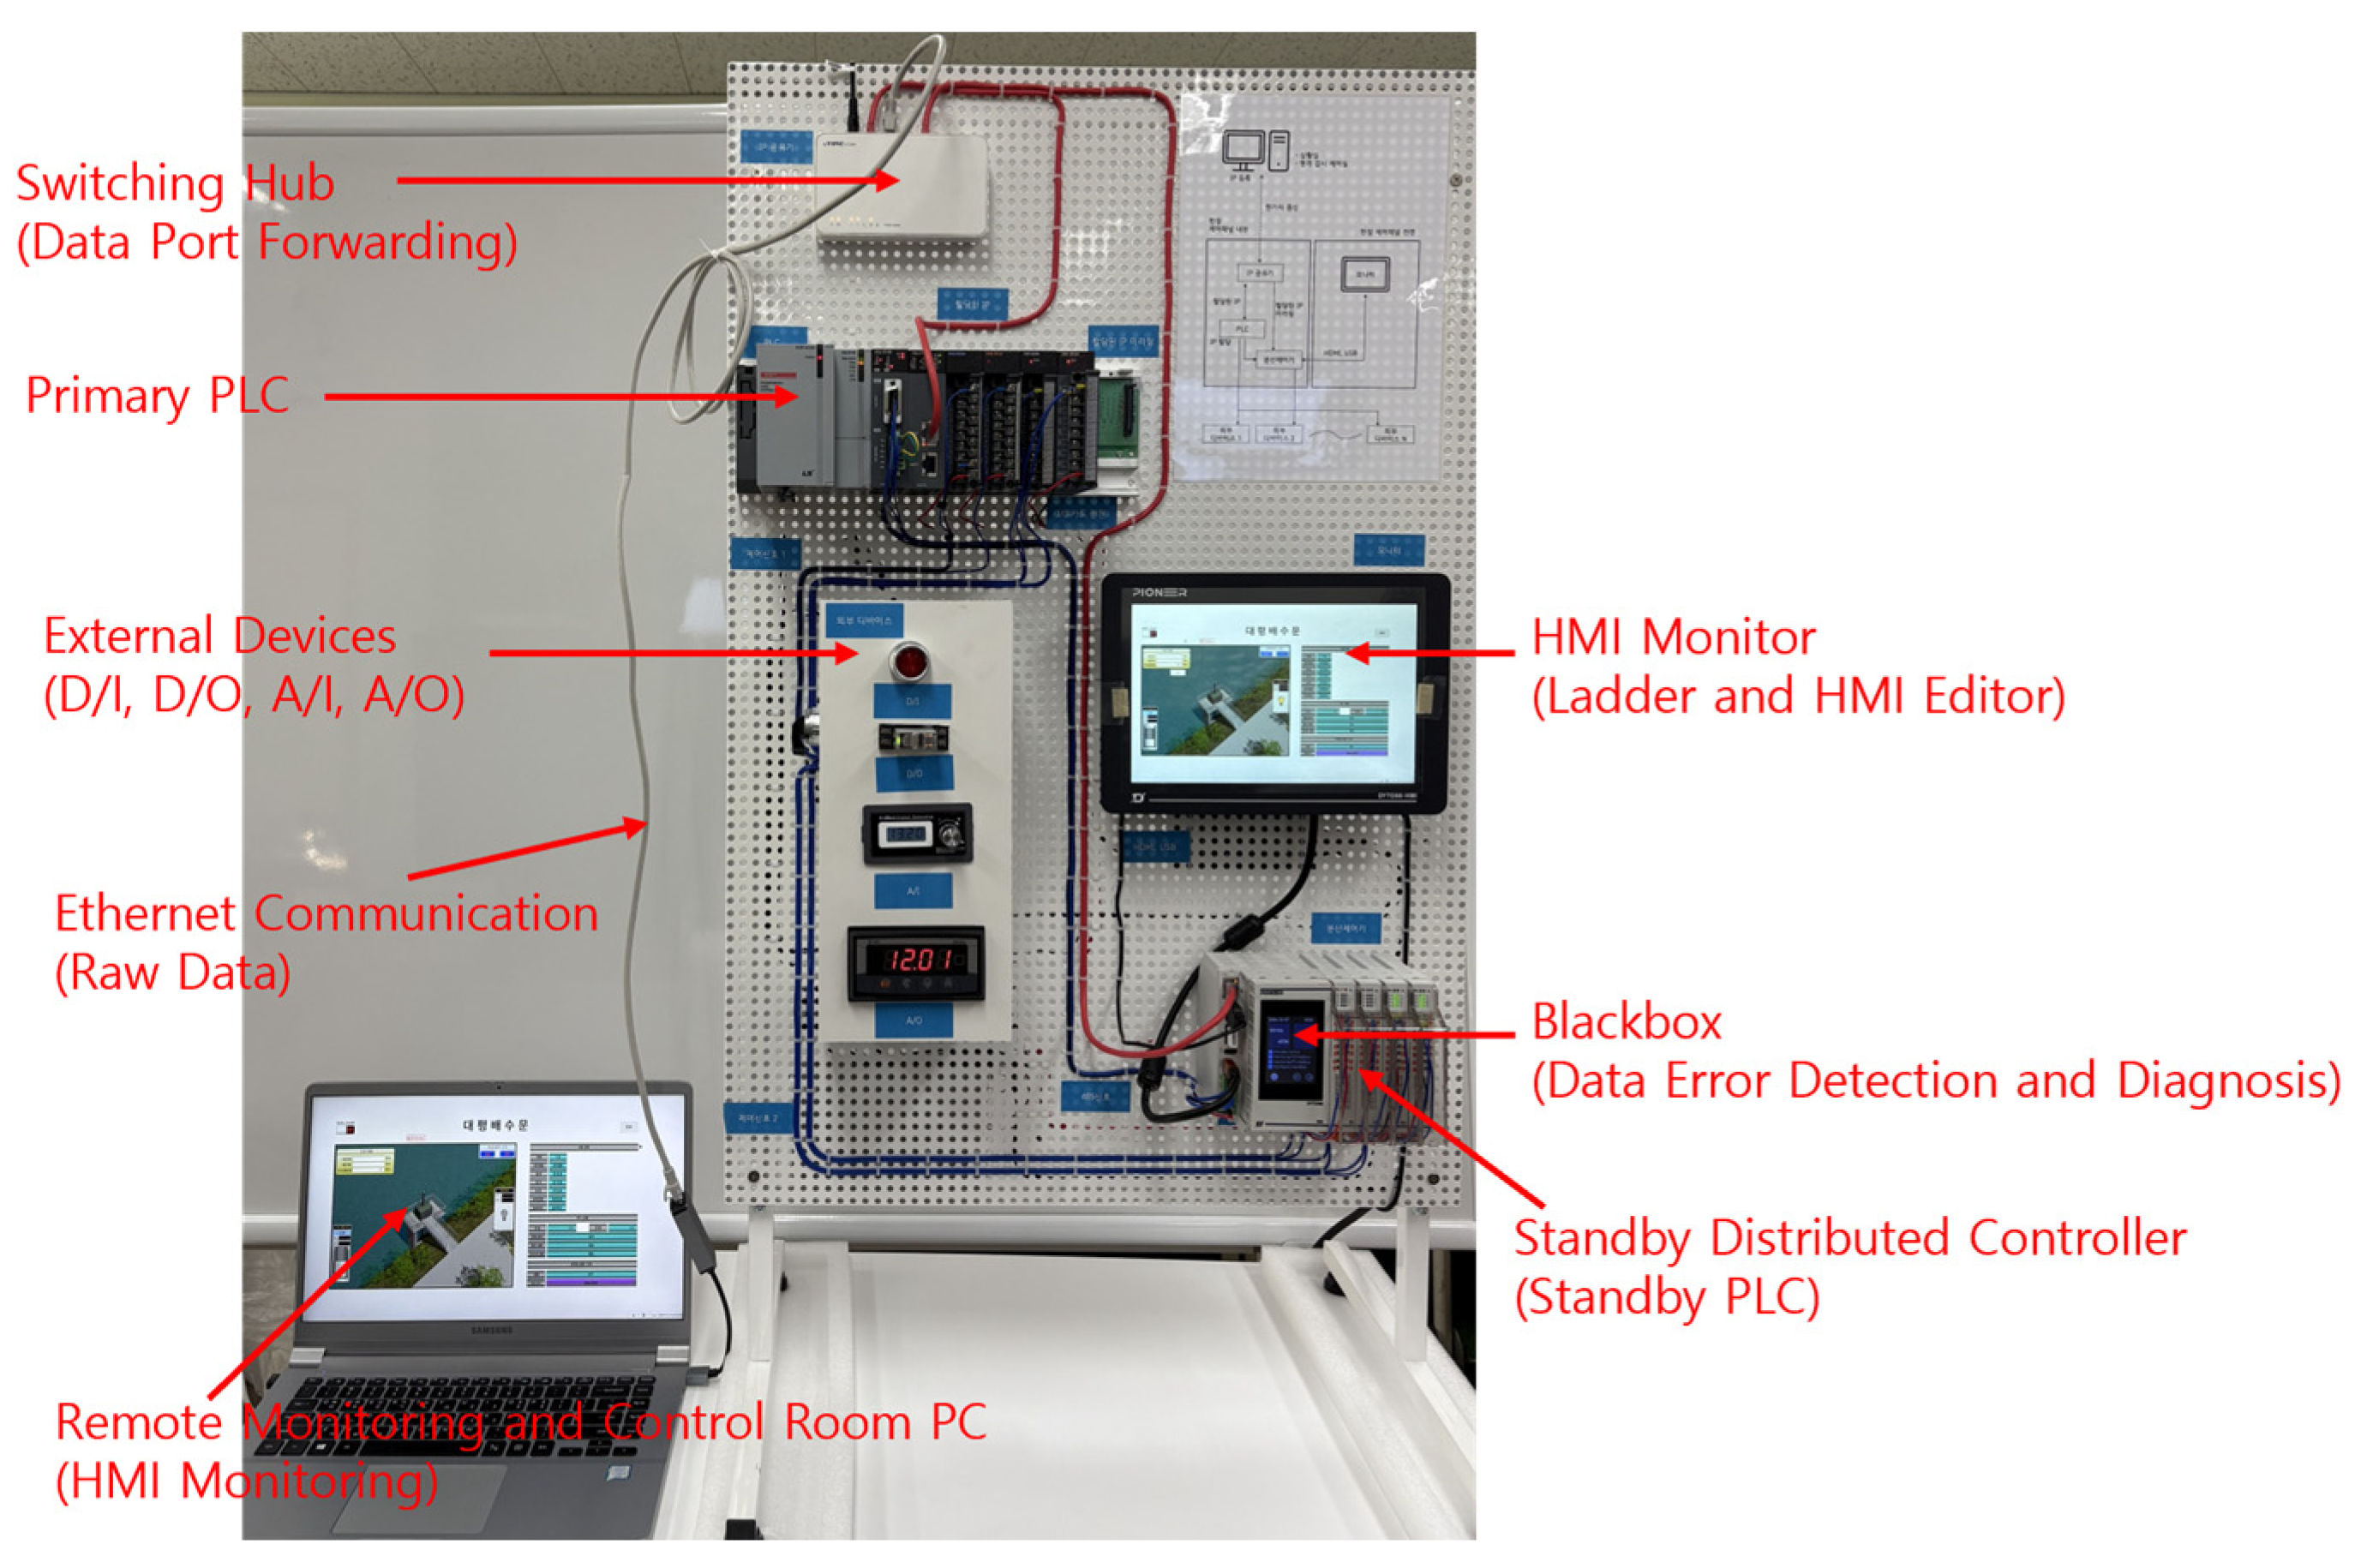
As illustrated in Figure 1, the proposed heterogeneous PLC I/O error detection architecture is structured as follows. Command data generated from the remote monitoring and control PC (①) is transmitted as raw data (③) through the switching hub (②). The raw data is port-forwarded (④) to the primary PLC LAN port and simultaneously mirrored (⑤) to the standby distributed controller LAN port. Thus, identical command data reaches both the primary PLC (④, ⑥) and the standby controller (⑤, ⑦).
When command execution occurs, the primary PLC (⑥) drives the corresponding external I/O devices (⑩, ⑭), and the standby controller (⑦) requests the execution results via RS485 communication (⑪). The blackbox module (⑧) records the results: successful operations are counted as Write, while failures are counted as Loss. If a Loss is detected, the proposed standby controller (⑦) executes the failed I/O instead while simultaneously sending error notifications to the remote HMI PC (①) via RS232 (⑪) and to the local HMI monitor (⑨) via HDMI (⑫).
For real-time error resolution, the integrated DYTO Studio environment within the standby controller enables on-site ladder logic and HMI editing without requiring external programming tools. The external HMI monitor (⑨) provides a touchscreen interface, connected via USB (⑬), enabling direct editing and visualization.

2.2. Reliability Analysis of Heterogeneous PLCs

The system reliability model proposed in this study is based on the Reliability Block Diagram (RBD) method. According to RBD, when system components are connected in series, the overall system reliability is expressed as the product of the reliabilities of the individual components. In contrast, when they are connected in parallel, the overall reliability is defined as the probability that at least one component operates correctly [16,17,18].
In a series configuration, all components must function correctly for the system to remain operational, and the reliability is given by
R s e r i e s t = i = 1 n R i t
where R i t denotes the reliability of the i -th component at time t .
In a parallel configuration, the system remains operational if at least one component works correctly. The reliability is expressed as follows:
R p a r a l l e l t = 1 i = 1 n 1 R i t
where n is the total number of parallel components.
In the proposed heterogeneous distributed controller, the main CPU acts as the critical element that controls the entire system; thus, it behaves as a series element:
R C P U t = e λ C P U t
where λ C P U denotes the CPU failure rate (h−1) and t is the operational time.
The I/O modules are configured in parallel, meaning the system remains operational as long as at least one I/O module functions correctly:
R I / O p a r a l l e l t = 1 1 e λ I / O t N
where λ I / O is the failure rate of a single module and N is the number of parallel I/Os.
The overall system reliability then becomes the product of CPU and I/O reliabilities:
R s y s t e m t = R C P U t × R I / O p a r a l l e l t
For the heterogeneous PLC structure, reliability is modeled separately for the primary PLC ( A ) and standby controller ( B ):
R A t = e λ A , i t
R B t = e λ B , i t
where λ A , i and λ B , i are the failure rates (h−1) of the i t h module in the primary PLC and standby controller, respectively.
When fault detection and switchover processes are considered, the reliability of module i becomes:
R i t = e λ A , i t + 0 t λ A , i e λ A , i τ g i c i e μ i T s , i e λ B , i ( t τ ) d τ
where g i is the fault detection probability ( 0 g 1 ), representing the likelihood that a transient or permanent fault is successfully detected by the logic monitoring blackbox. c i is the coverage factor ( 0 c 1 ) , the probability that a detected fault is correctly isolated and triggers safe switchover, and μ i is the standby failure rate (h−1); time T s ,   i is expressed in seconds.
These parameter definitions ensure consistency and reproducibility across heterogeneous configurations.
If λ A , i λ B , i   [19,20]:
R i t = e λ A , i t + ( g i c i e μ i T s , i ) λ A , i λ A , i + λ B , i ( e λ B , i t e λ A , i t )
If λ A , i = λ B , i = λ i :
R i t = e λ t ( 1 + g i c i e μ i T s , i λ i t )
The expected lifetime of module i can be obtained as follows:
M T T F i = 0 R i t d t
This can be simplified as follows:
M T T F i = 1 λ A , i + K i 1 λ B , i
where K i = g i c i e μ i T s , i [21,22].
As g i and c i increase and T s , i , μ i decrease, M T T F i rises accordingly, indicating enhanced system resilience [23].
Considering N I/O modules in parallel and the reliabilities of the blackbox ( λ b b ) and communication bus ( λ b u s ):
R s y s ( t ) = e λ b b t e λ b u s t 1 i = 1 N 1 R i t
In this study, the numerical parameters λ A , i   ,   λ B , i , and μ i were derived from manufacturer reliability data and validated by experimental test reports [24,25,26,27].
The coverage factor c i and detection probability g i were experimentally determined by fault-injection testing under EMC and durability conditions, ensuring that the analytical model corresponds with real operational data. These clarifications address reviewer comments regarding parameter inconsistency and the origin of estimated values while improving model transparency and reproducibility.
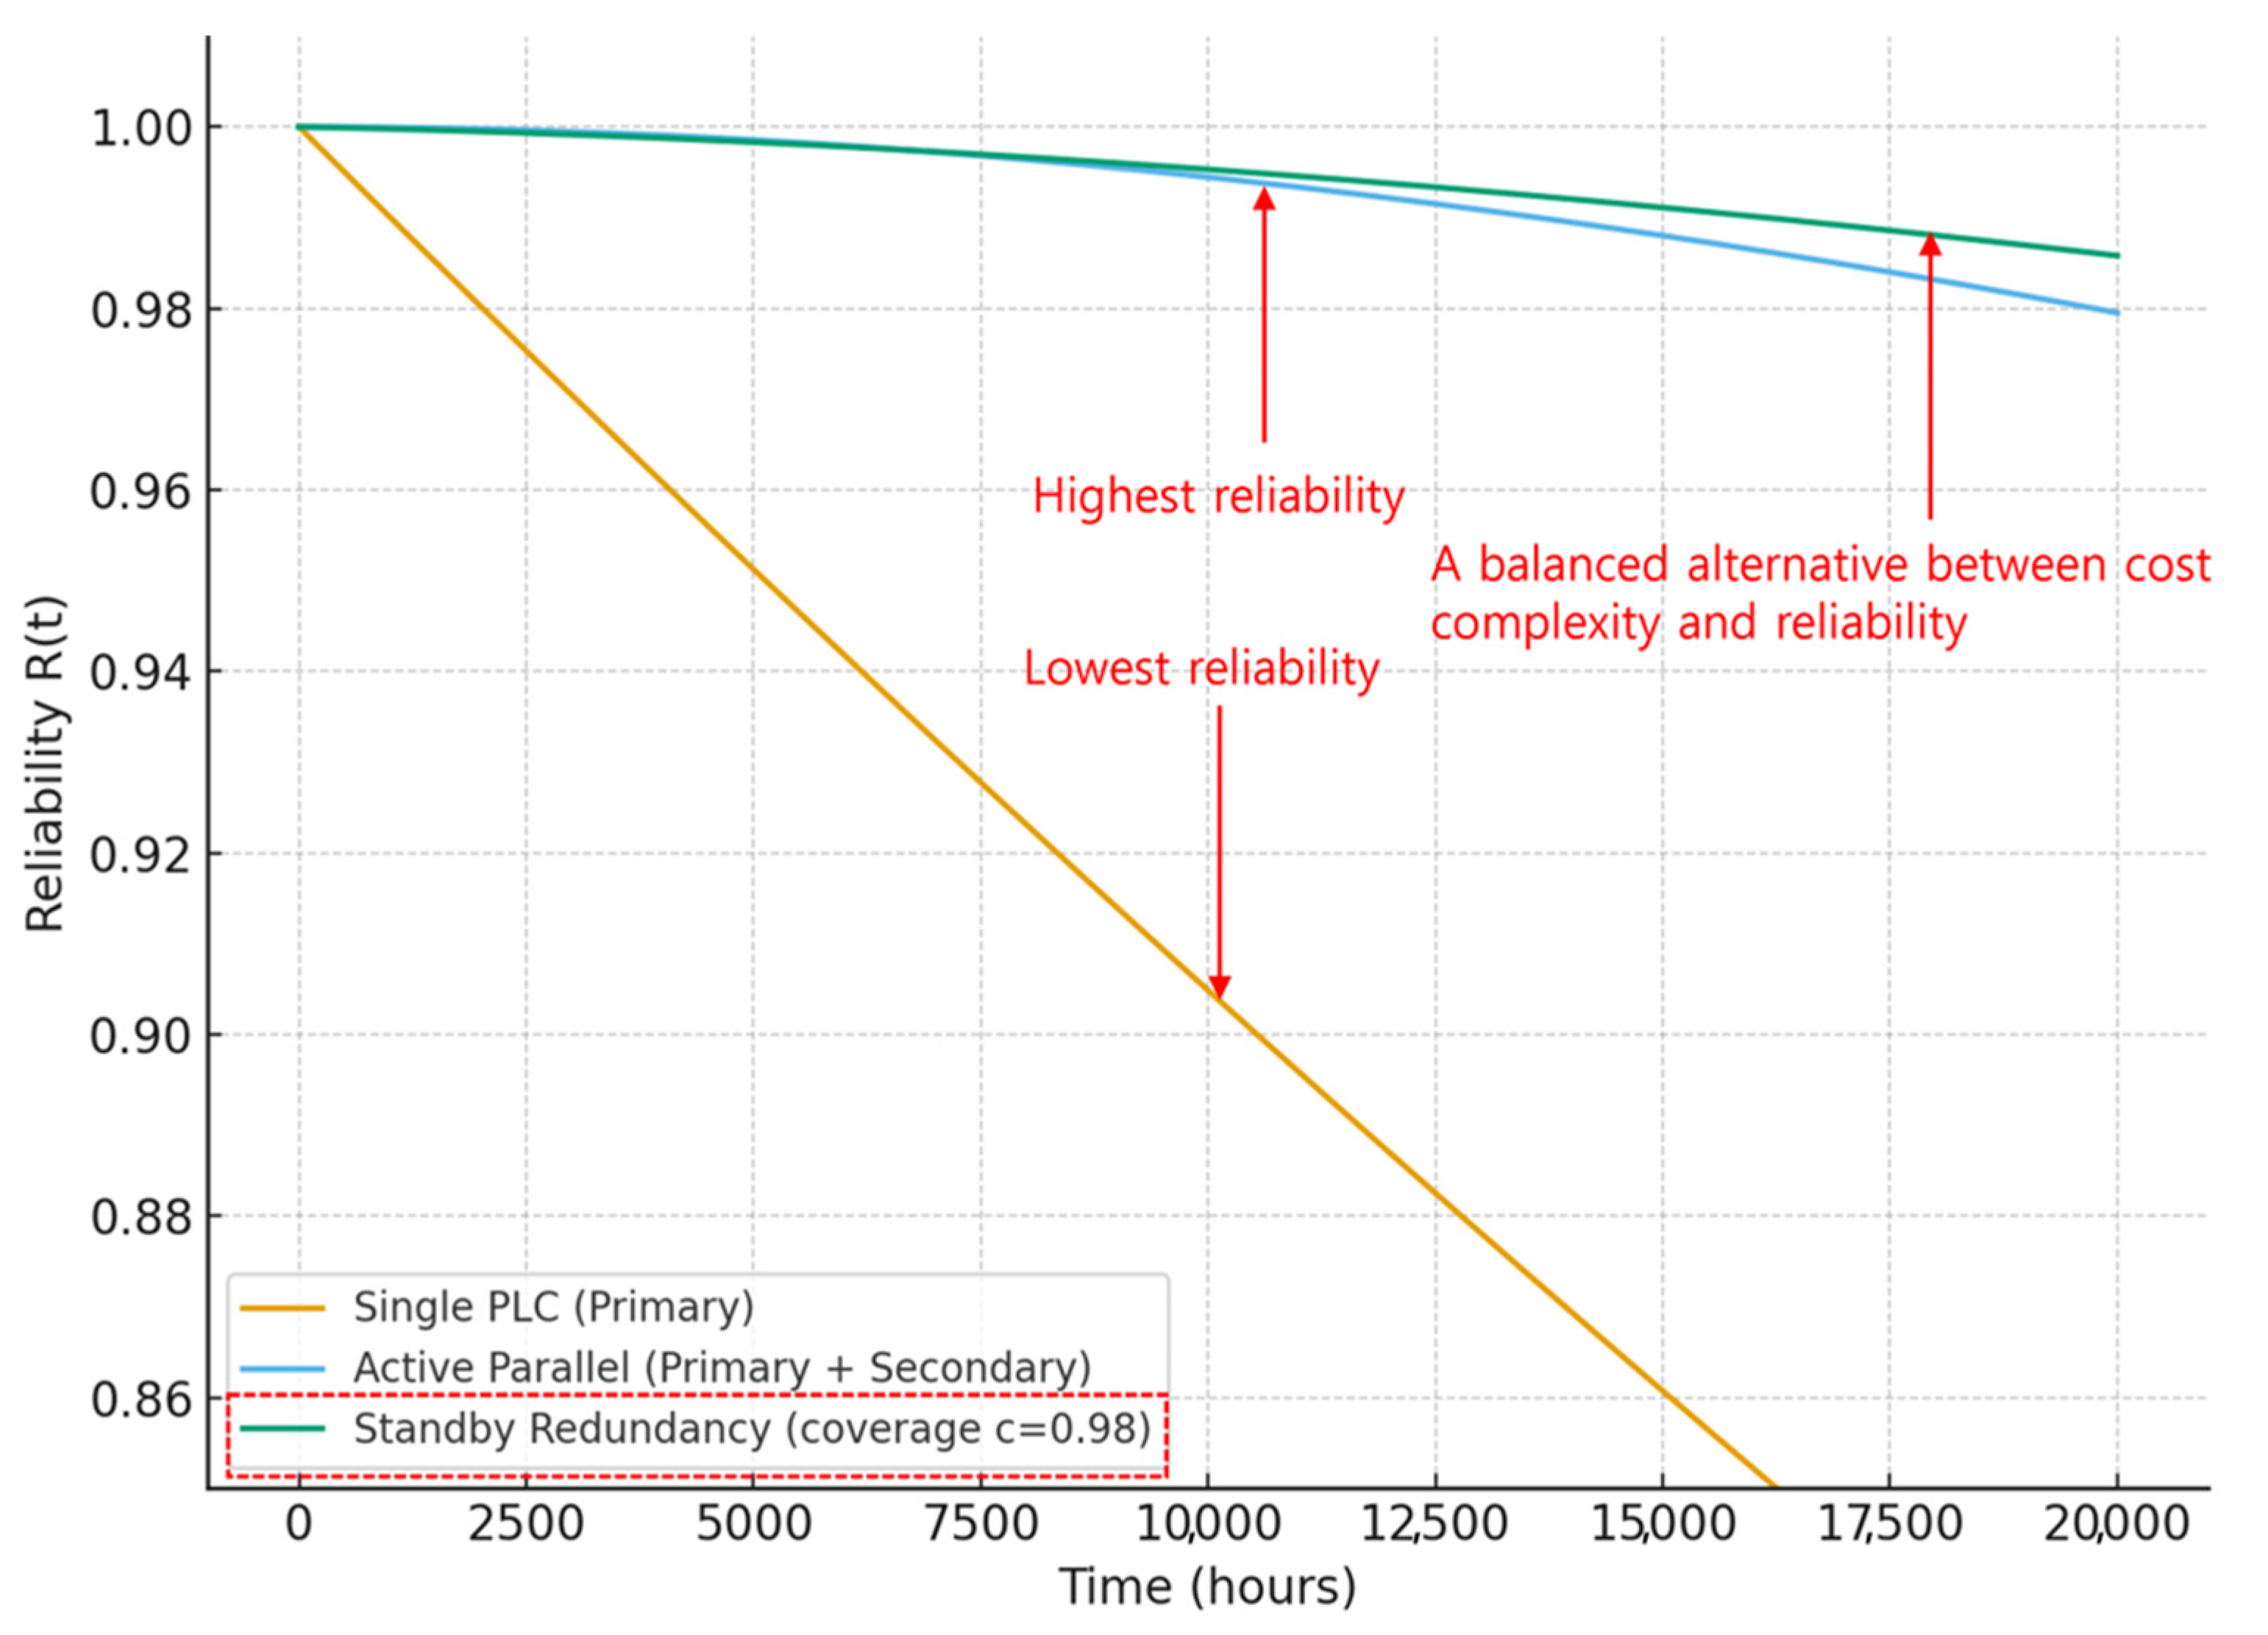
Figure 2 presents a comparison of the reliability for different PLC redundancy configurations. The single PLC structure is cost-effective but exhibits the lowest reliability. In contrast, the homogeneous parallel redundancy PLC architecture achieves the highest reliability, though at the expense of increased system cost and complexity. The proposed heterogeneous distributed PLC configuration demonstrates intermediate complexity with significantly improved fault coverage and detection consistency due to the explicitly modeled parameters g and c . The proposed heterogeneous distributed PLC configuration offers a balanced alternative between cost, complexity, and reliability. All reliability parameters λ , g , c were referenced from MIL-HDBK-217F and IEC 61508-2 databases for industrial-grade PLC components to ensure standardized reliability assumptions.

2.3. Port Forwarding of Heterogeneous PLC Input Data and DYTO Studio

Switching-hub–based port forwarding is a key technology for ensuring system availability and stability by enabling redundant data transmission in industrial Ethernet environments [28]. Figure 3 illustrates the topology in which raw command data from the HMI of the remote monitoring and control PC are simultaneously received by both the primary PLC and the standby distributed controller [29]. The raw command data are executed by the primary PLC, while the corresponding execution data are sent to the blackbox inside the standby controller via RS-485/RS-232 links. The blackbox continuously compares the mirrored input stream with the execution results to detect logic-state mismatches or I/O anomalies.
Formally, port forwarding can be expressed as a mapping function:
F : I P p u b l i c   ,   P o r t e x t I P p r i v a t e   , P o r t i n t
where I P p u b l i c and P o r t e x t represent the external address and port accessible from the outside network, and I P p r i v a t e   ,   P o r t i n t denote the internal device address and port.
In a conventional system, this mapping is one-to-one, i.e., F I P p u b l i c   ,   P o r t e x t = I P p r i v a t e   , P o r t i n t , unique for each external port [30].
To overcome this limitation, the proposed system adopts port mirroring, defined as follows:
M : I P p u b l i c   ,   P o r t e x t I P p   , P o r t p , I P s   , P o r t s
where I P p   , P o r t p and I P s   , P o r t s correspond to the primary PLC and standby controller, respectively.
Through this mechanism, identical command packets are broadcast in real time to both controllers, ensuring input-data synchronization and enabling immediate failover if the primary PLC fails.
To address the communication reliability, additional experiments were conducted to evaluate the impact of network jitter, packet loss, and out-of-order transmission on the accuracy of heterogeneous PLC input data forwarding.
Tests were performed under three Ethernet topologies: (1) single-switch baseline, (2) two-hop daisy-chain, and (3) three-hop hierarchical networks with FIFO and WRR queueing policies. End-to-end delay, jitter, and the packet loss rates were measured while varying the buffer occupancy levels (10%, 50%, and 90%) to simulate congestion conditions.
The experimental results indicated that average delay increased from 1.2 ms (single hop) to 4.8 ms (three hops), and jitter variance rose from 0.3 ms to 1.1 ms with higher load. Despite these conditions, the synchronization accuracy of the heterogeneous PLC redundancy mechanism remained above 97.5%, showing strong robustness against network fluctuation. Stable performance was sustained when jitter ≤ 2.5 ms and packet loss ≤ 0.5%; brief desynchronization beyond these limits was automatically recovered within two control cycles.
These results confirm that the proposed port-forwarding and IP-mirroring configuration satisfies IEC 62439-3 industrial redundancy standards, ensuring communication reliability under multi-hop Ethernet environments.
Figure 3 illustrates how the raw command data from the supervisory PC are forwarded to the primary PLC and mirrored to the standby controller, enabling synchronized execution and immediate failover.
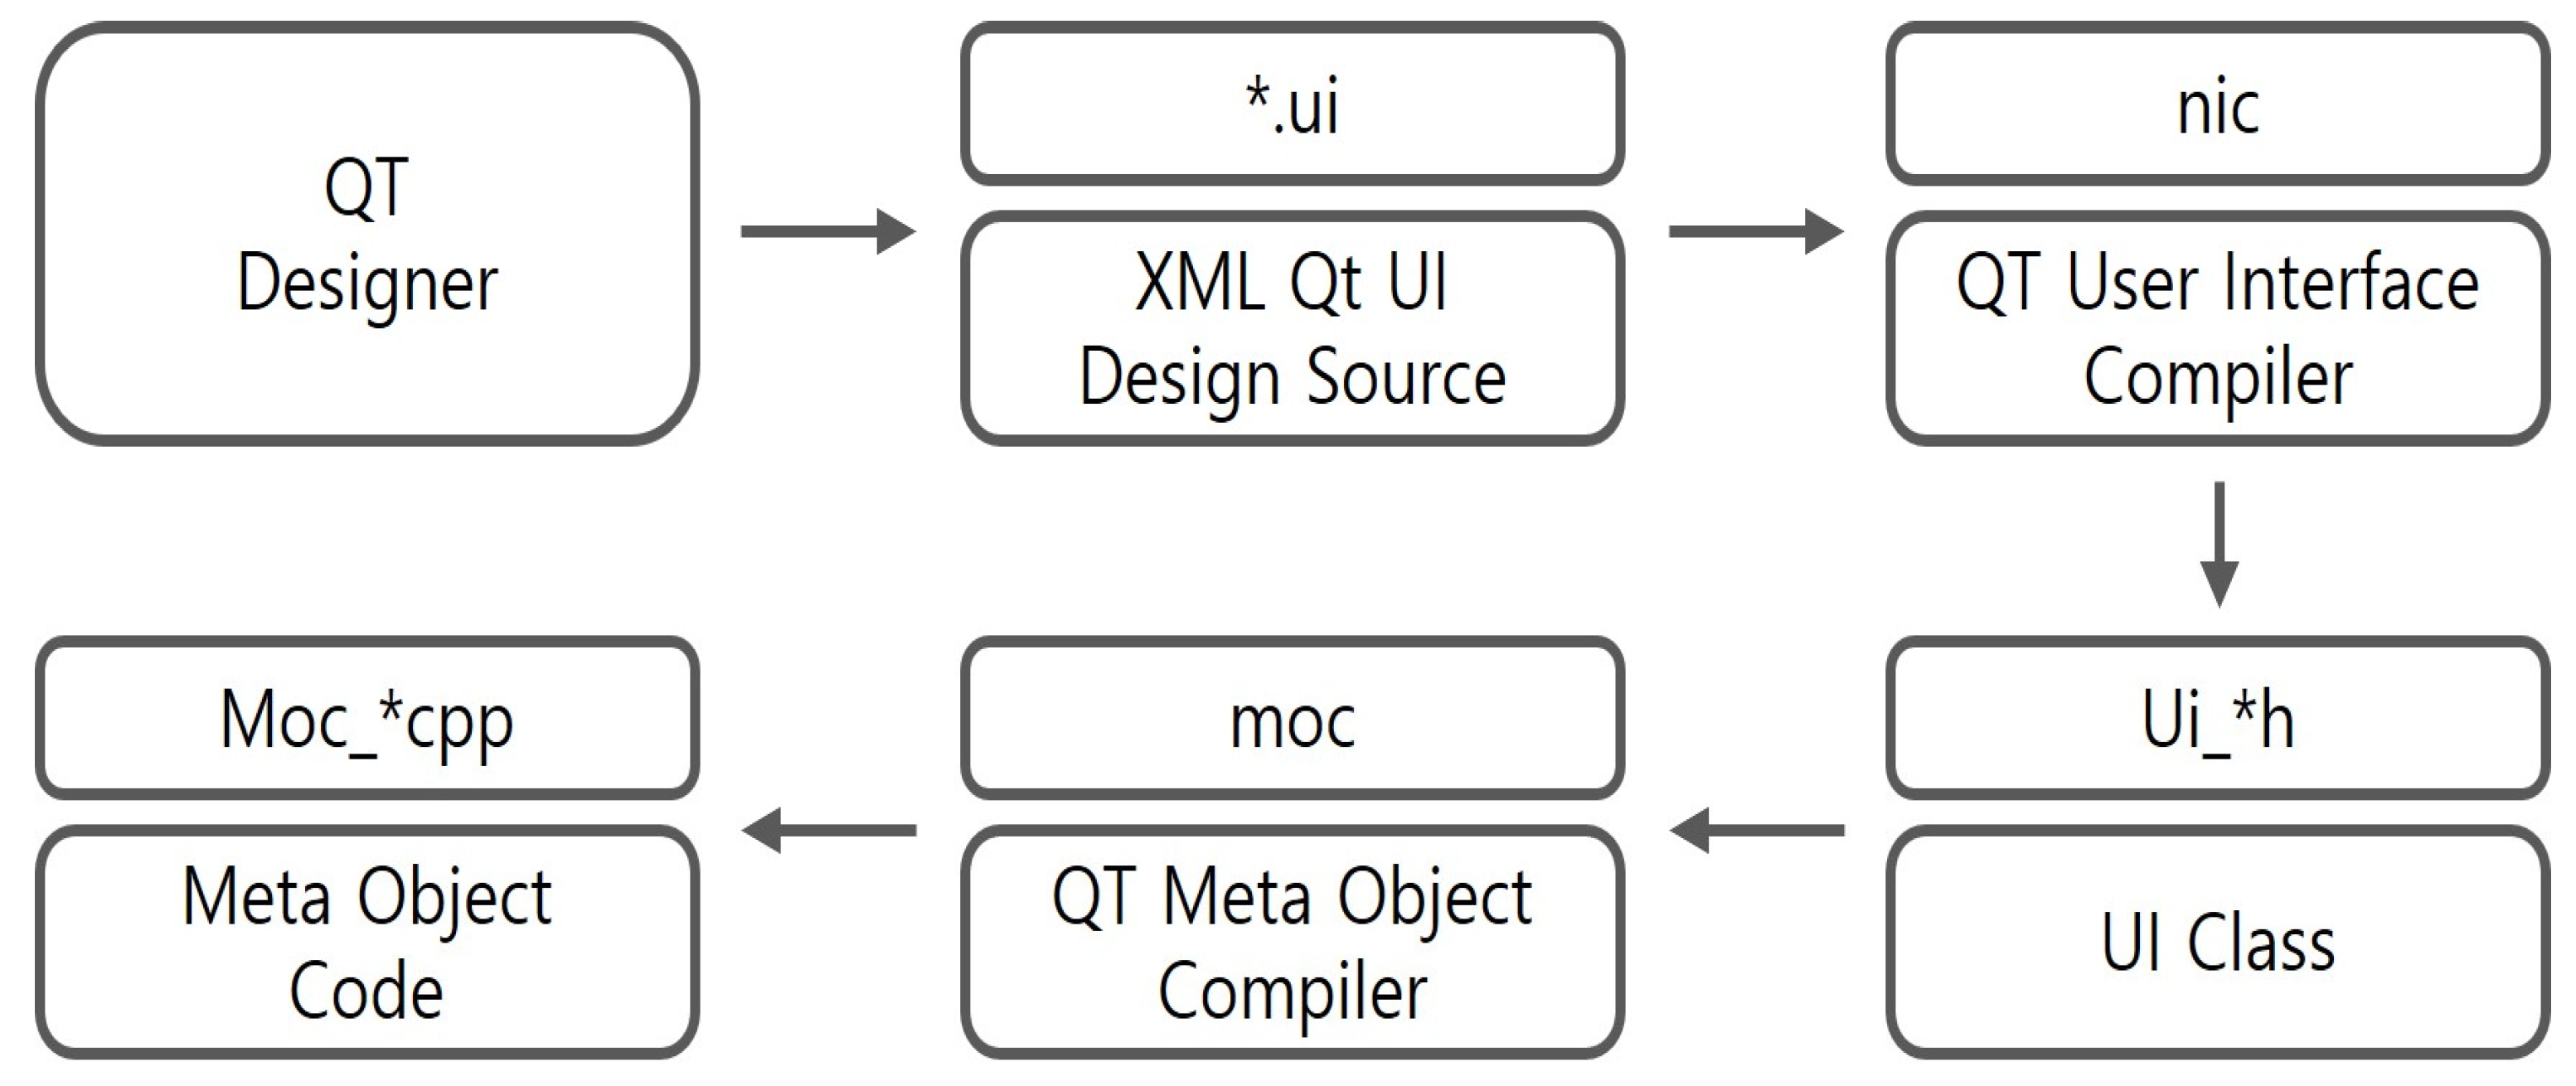
After error detection, the DYTO Studio environment is used for direct program modification. Developed by Dong Young Tech One (Korea), DYTO Studio is a Linux-based ladder-and-HMI integrated editor that supports non-standard hardware and provides enhanced malware resistance and security management. Because it is based on open-source Qt Framework, DYTO Studio can be built from source and executed on any Linux distribution Figure 4—one reason it was chosen for this study.
The DYTO Studio interface consists of two subsystems: (1) DYTO Editor, for logic and ladder design, and (2) DYTO HMI, for runtime monitoring. Both share identical Qt-based UI elements, ensuring seamless interaction between editing and operation.
For UI design, the Qt Designer tool is launched from the program menu (“Qt 5 Designer”), allowing engineers to load and edit *.ui files. Companion tools—uic (Qt User Interface Compiler) and moc (Qt Meta Object Compiler)—link the designed UI with executable code. Figure 5 illustrates this workflow.

2.4. Logic State Monitoring and Blackbox

The blackbox is designed to monitor the I/O logic state of the primary PLC and determine whether the state is normal, erroneous, or faulty, based on data transmitted from the remote monitoring control room. The blackbox is attached to the distributed controller unit and provides the function of executing standby distributed controller I/O selectively when abnormal conditions are detected. Additionally, by collecting, storing, and classifying normal, error, and fault data, the blackbox supports reliable system state monitoring.
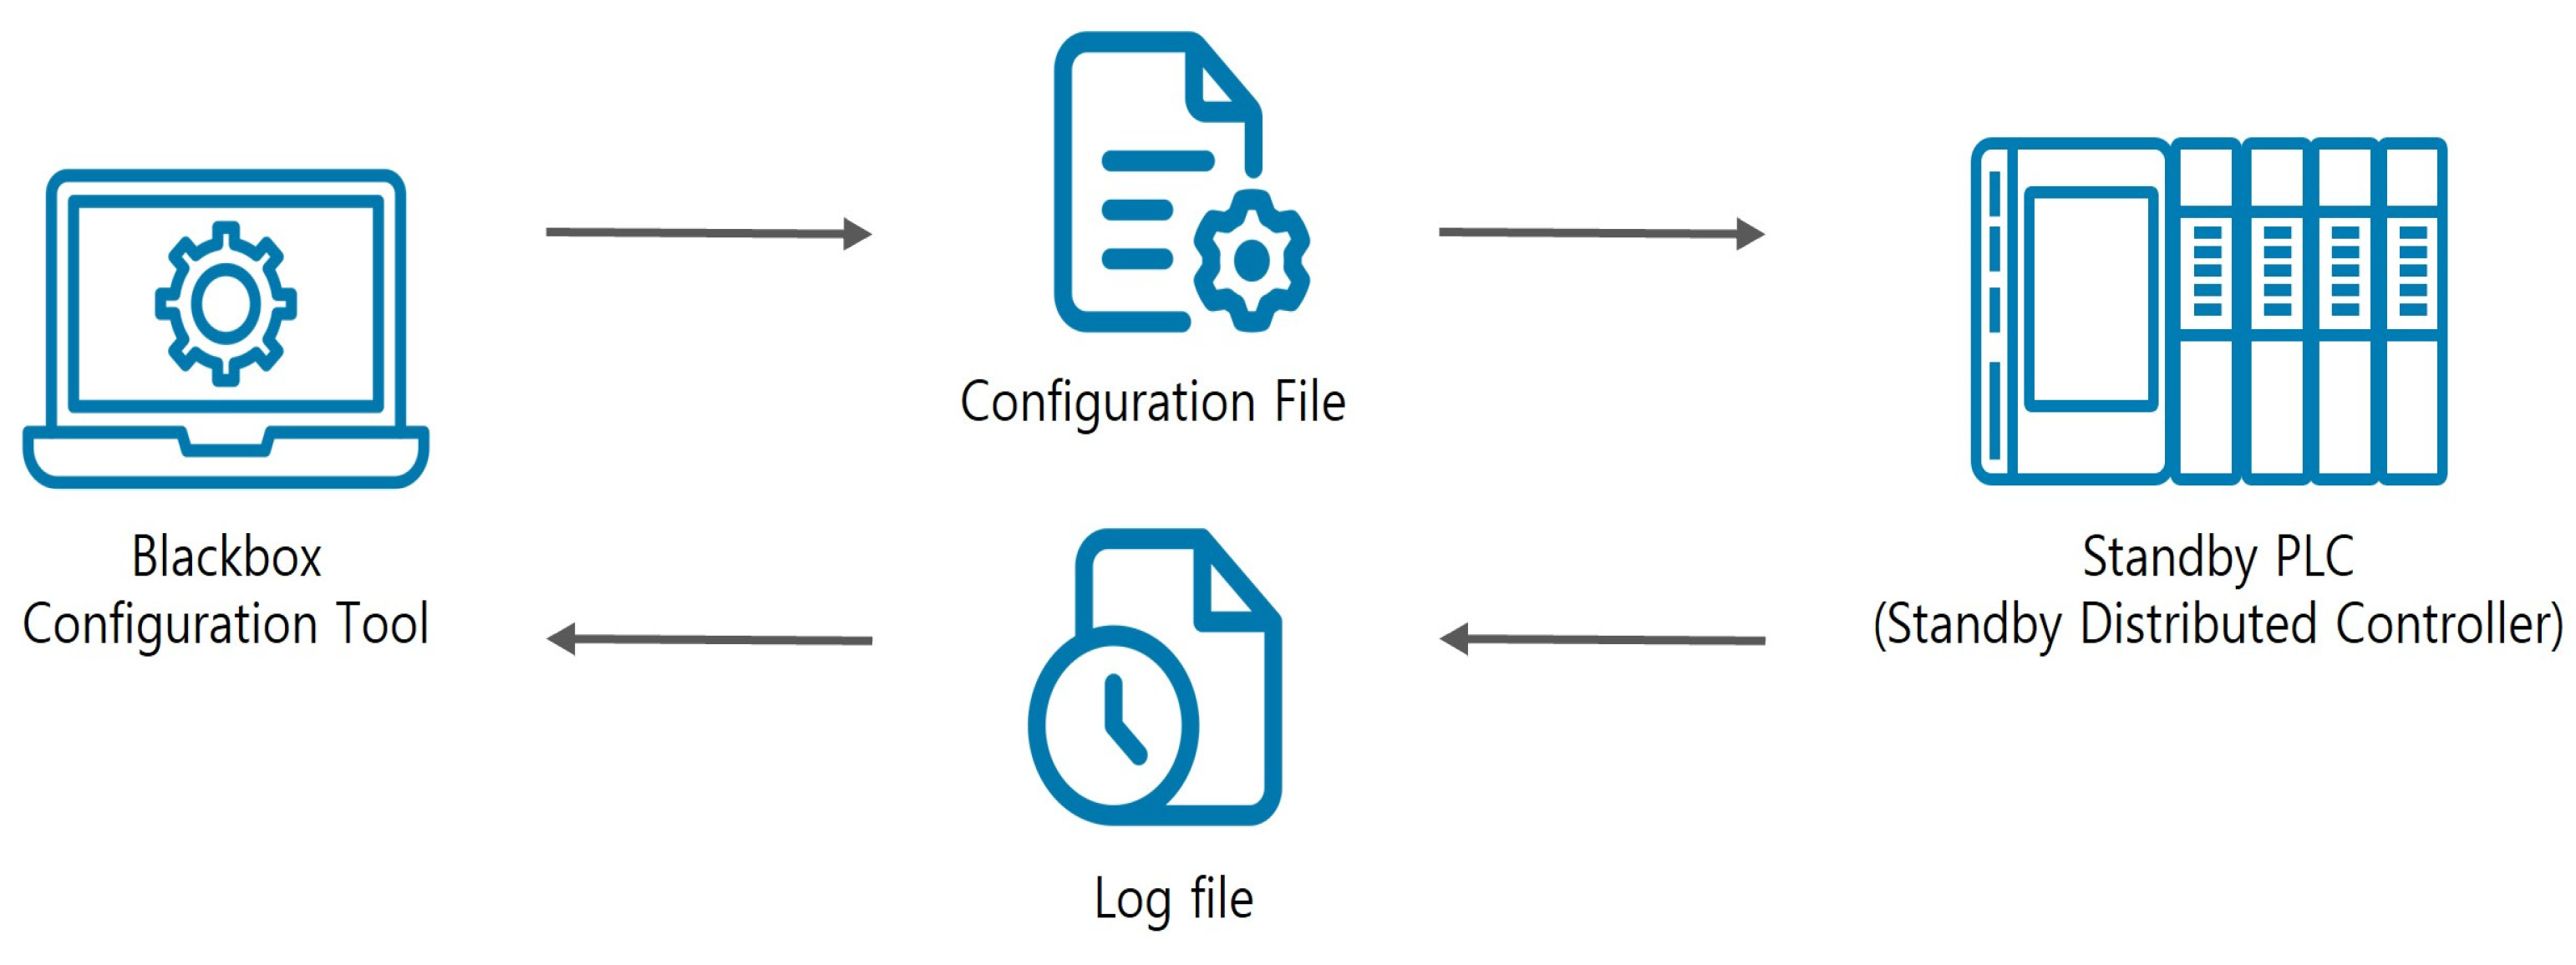
The blackbox software runs on operating systems with .NET Framework 4.5 or higher, and it is also implemented to run on Linux systems equipped with a Mono runtime environment. As shown in Figure 6, the blackbox consists of three network interfaces Ethernet I/F, RS232C I/F, and RS485 I/F along with control elements that analyze data loss and manage capacity, and a user interface. All modules operate based on predefined settings in the configuration manager.
The blackbox also provides a loss detection timeout function. This defines the maximum waiting time to verify whether the command issued from the HMI has been correctly reflected in the primary PLC. During this time, the blackbox repeatedly checks the command response. If the predefined timeout is exceeded without matching results, the event is judged as a Loss (Figure 7).
The loss detection timeout is mathematically defined as in Equation (16):
T l o s s = m i n t R c m d t R P L C t , t T S E T
where R c m d t is the command signal from the upper HMI, R P L C t is the response signal executed by the primary PLC, and T S E T is the predefined timeout threshold (in seconds). Thus, if the HMI command and PLC response do not match within the timeout T S E T   , the blackbox defines the event as a Loss [21,31,32].
The Figure 8 illustrates the loss detection timeout process. The command signal from the HMI ( R c m d t , blue) is compared with the PLC response signal ( R P L C t , green). If the signals do not match within the predefined timeout period T S E T (orange), the event is judged as a Loss (red).
The selection criteria for the timeout threshold T t i m e o u t were further evaluated using Receiver Operating Characteristic (ROC) and Precision–Recall (PR) analyses. The objective was to balance the False Positive Rate (FPR) and the True Positive Rate (TPR) under different switching window configurations, ensuring an optimal trade-off between detection accuracy and failover latency.
A dataset of 1200 I/O transactions was analyzed under simulated fault-injection scenarios. For each configuration, the detection results were compared against ground-truth labels to compute FPR, TPR, precision, and recall. The ROC curve demonstrated that the blackbox maintained a detection accuracy above 95% with an optimal T t i m e o u t range of 2.3–2.7 s. The area under the curve (AUC) was approximately 0.97, indicating strong discriminative capability between normal and faulty transitions. The corresponding PR curve yielded an area under the precision–recall curve (AUPRC) of 0.94, confirming consistent reliability across multiple switching delays.
Based on these results, the recommended T t i m e o u t range is between 2.3–2.7 s, providing a balanced trade-off between fast failover and low false alarm probability. This ensures that the blackbox system can respond rapidly to actual PLC faults while minimizing unnecessary switching events caused by transient delays or jitter.
Figure 9a ROC Curve for Loss Detection Threshold Analysis showing the trade-off between the true positive rate (TPR) and the false positive rate (FPR) under varying T S E T conditions. The high AUROC value (0.991) indicates strong discriminative ability in identifying loss events. Figure 9b Precision–Recall (PR) curve under varying T S E T values. The high AUPRC (0.988) demonstrates consistent detection reliability across different timeout thresholds.
For multi-state logic conditions, the blackbox uses a state-transition correlation table and CRC-based integrity check to compare complex sequential command–response states. Deviations exceeding two standard deviations ( 2 σ ) of the normal logic cycle are classified as transient faults.

3. Design of Distributed Controller with Embedded Blackbox and I/O

This section presents the design of the distributed controller with an embedded blackbox and the I/O modules that execute alternative operations based on the blackbox results.

3.1. Hardware Design of Distributed Controller with Embedded Blackbox

The proposed distributed controller with an embedded blackbox is designed to monitor the logic states of the primary PLC in real time and to execute replacement operations in the event of errors or failures. The controller consists of a main unit and alternative execution I/O modules, with an LCD display attached to the front panel to facilitate monitoring of blackbox operation status (Figure 10).
As shown in Table 2, the internal hardware structure consists of four main PCB boards: CPU base board, communication board, fan board, and I2C (Inter-Integrated Circuit) interface board. The CPU core module is implemented using the Orange Pi CM4 Core, which is mounted on the CPU base board. Consequently, the distributed controller has a total of five PCB boards.
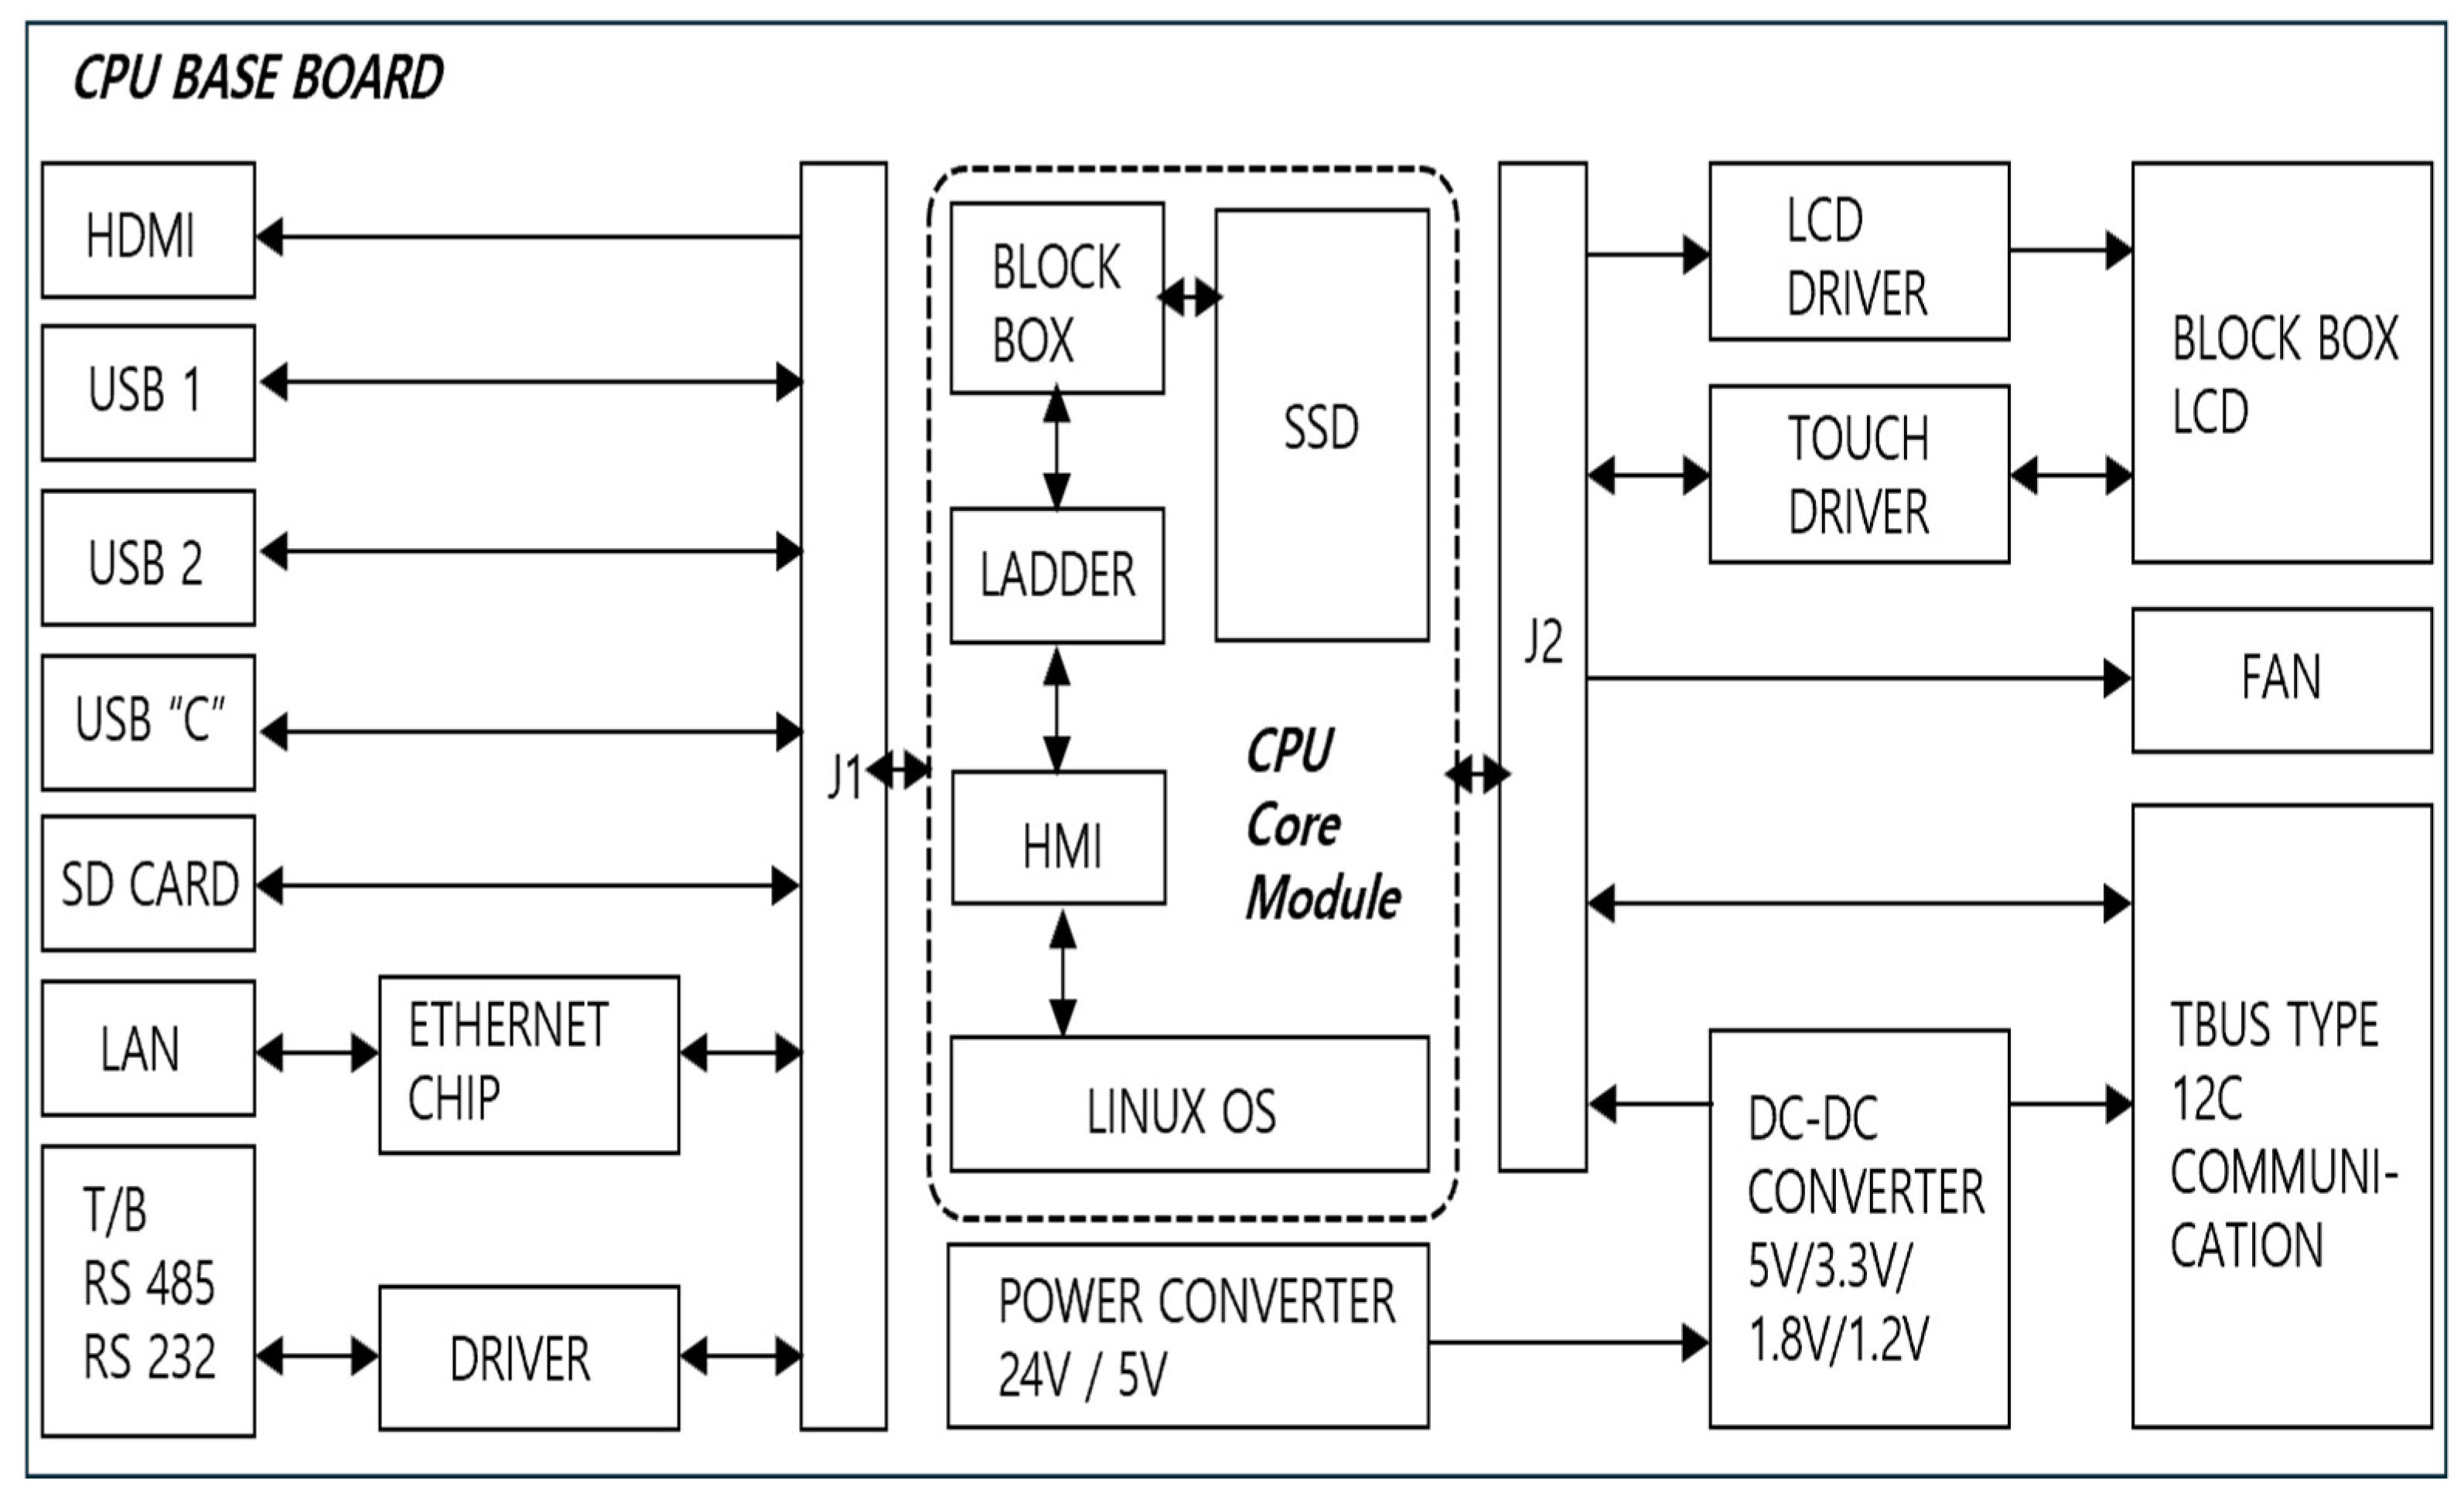
Figure 11 illustrates the block diagram of the proposed controller, where the CPU core module (Orange Pi CM4) is mounted on the CPU base board and operates under a Linux OS. A ladder program for logic control and an HMI for monitoring execution status are integrated into the system. Monitoring of the primary PLC I/O and storage of execution data are carried out by the blackbox module and an SSD, which also record and analyze errors and events.
If redundancy were applied to all I/O modules, the system would suffer from increased complexity and reduced efficiency. Therefore, selective parallel redundancy is applied only to essential logic (automatic execution I/O and manual event I/O) for efficiency and scalability.
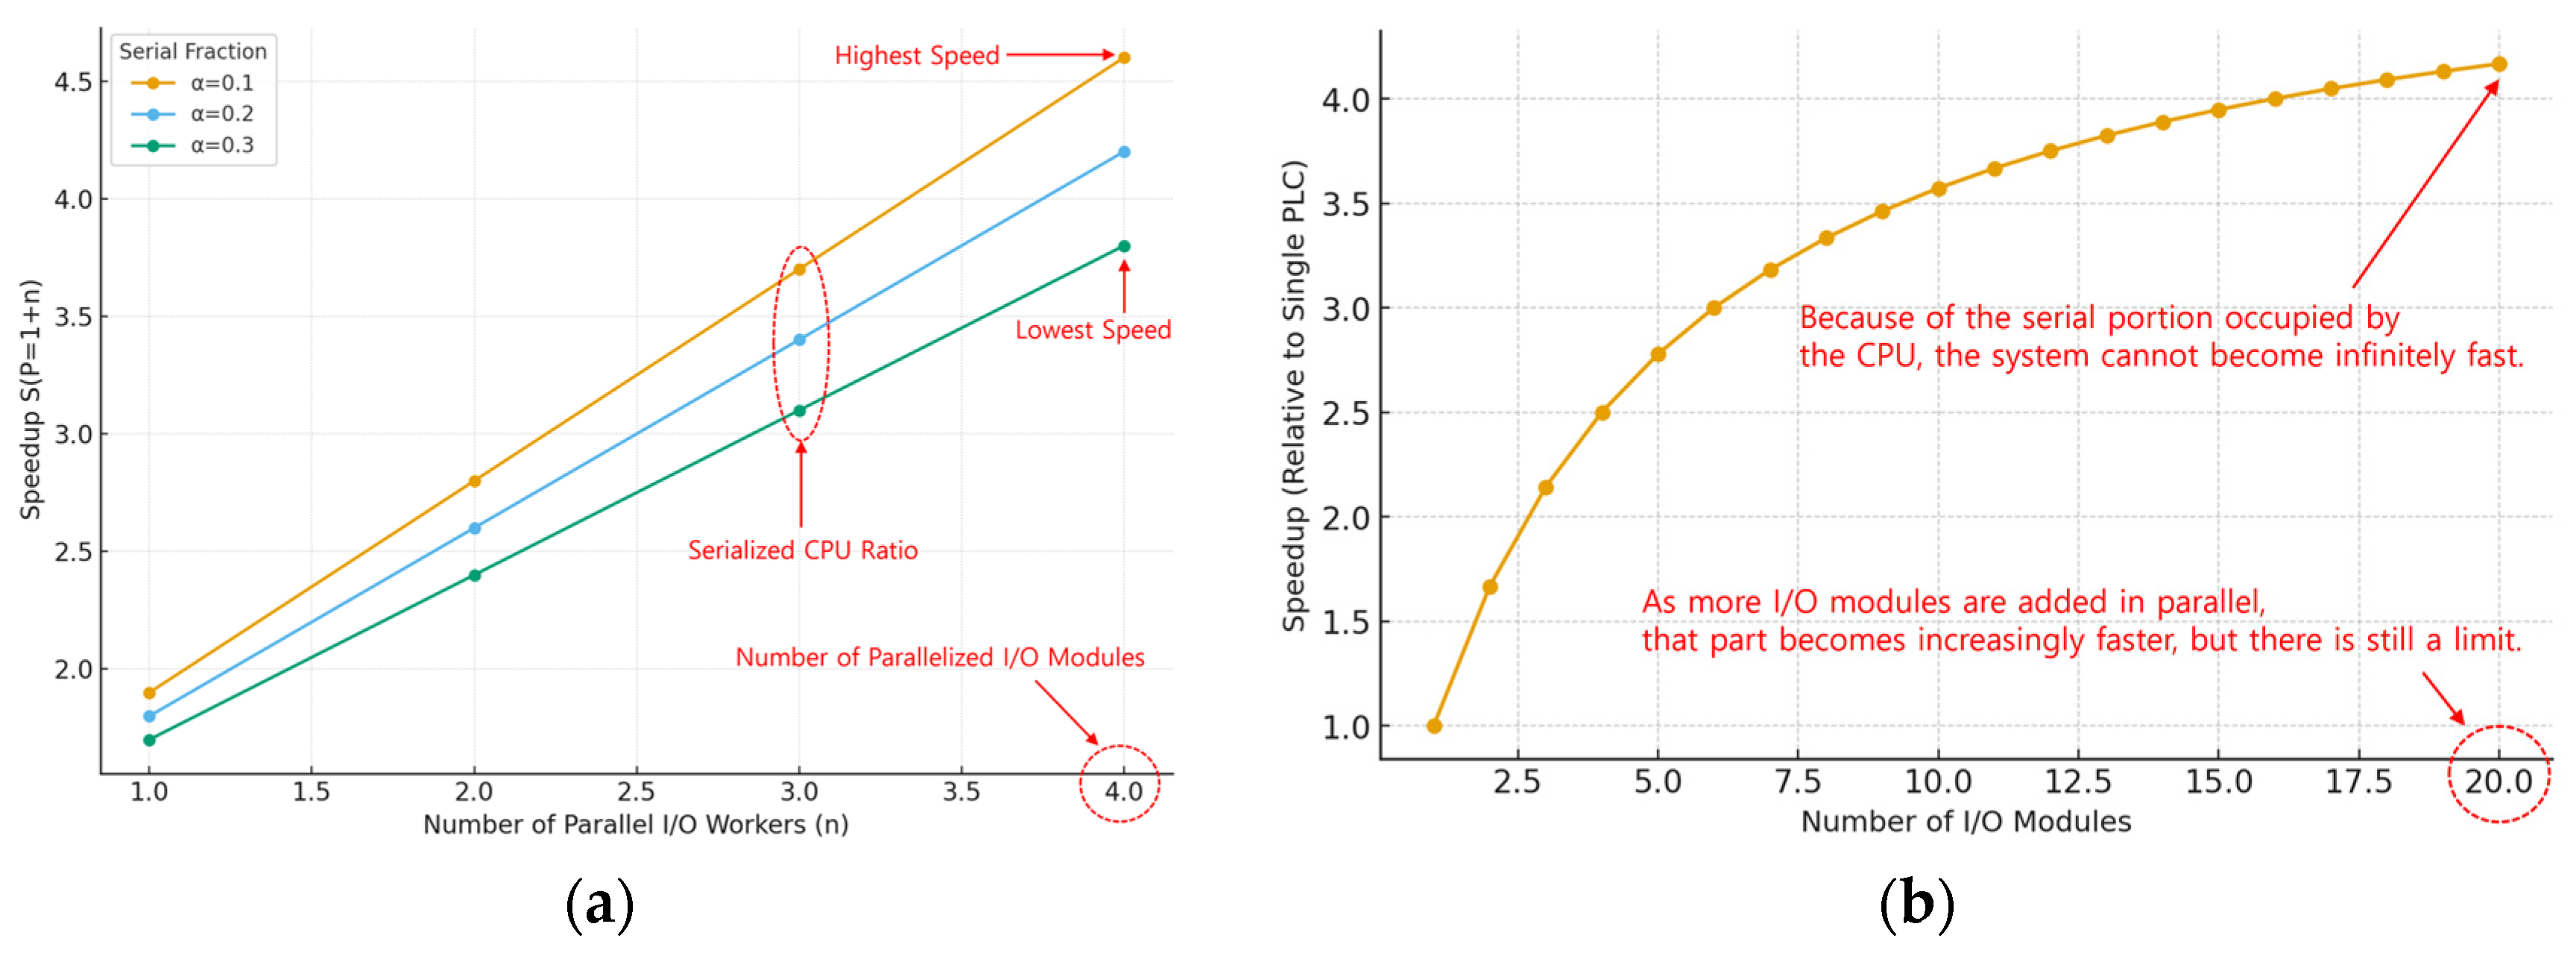
The performance of this selective parallel redundancy is explained using Gustafson’s Law [33], where the CPU (primary PLC + standby distributed controller) operates serially, while the I/O modules (D/I, D/O, A/I, A/O) operate in parallel. Although Gustafson’s Law is typically used for computational scalability, it was analogously applied here to express the proportional efficiency of distributed I/O redundancy under real-time constraints.
S N = α + 1 α · N
where S N = Overall performance speed-up with N parallel modules, α = Serial fraction executed by the CPU, 1 α = Parallel fraction executed by the I/O modules, N = Number of parallel I/O modules.
As shown in Figure 12a, the serial portion of the CPU ( α ) limits overall performance. While increasing I/O modules accelerates performance, the CPU fraction ultimately creates a bottleneck. Figure 12b shows the speed-up curve relative to the number of I/O modules, which rises sharply at first but flattens gradually. In this study, selective redundancy was applied to reduce the CPU serial fraction, and the optimal number of I/O modules was found to be approximately 20.

3.2. Distributed Controller I/O Hardware Design

3.2.1. Digital Input Module Design

The distributed controller I/O developed in this study consists of D/I, D/O, A/I, and A/O modules connected to the main unit. Among these, the D/I module requires particularly precise design and analysis in order to ensure dual safety and integrity in a redundant PLC environment. Accordingly, the design takes into account signal integrity (SI), error detection, and synchronization check.
The signal integrity (SI) of D/I refers to the degree to which a digital input signal is transmitted to the CPU without distortion. Since D/I relies on level detection through the black box rather than a direct bit stream, the probability of incorrectly recognizing a low (0) state as a high (1) state is expressed by Equation (18), based on the threshold voltage. Similarly, the probability of incorrectly recognizing a high (1) state as a low (0) state is defined by Equation (19).
P f a l s e H i g h = Q V T H μ 0 σ
P f a l s e L o w = Q μ 1 V T H σ
where V T H is the threshold voltage of the D/I comparator, which serves as the reference value for distinguishing between logic 0 and 1 in the D/I module. μ 0 , and μ 1 represent the mean input voltages when the signal is 0 or 1, respectively, and σ is the equivalent noise standard deviation. The function Q x is a statistical function used in probability theory to calculate the probability that a given signal does not exceed the threshold. P f a l s e H i g h indicates the probability of misinterpreting an actual 0 as a 1, while P f a l s e L o w indicates the probability of misinterpreting an actual 1 as a 0. The average of these two probabilities corresponds to the bit error rate (BER) [34].
In redundant PLC systems, when comparing two inputs for error detection under the assumption of independence, the detection probability is defined as follows Equation (20):
P d e t e c t = P A B = p A 1 p B + p B 1 p A
where p A ,   and p B represent the error probabilities of channel A and channel B, respectively [11,35,36].
Furthermore, synchronization check evaluates whether the input signals between the two channels arrive in proper synchronization without time delay. This is mathematically expressed as in Equation (21):
P s y n c = P t T s y n c = e r f T s y n c 2 σ
where t denotes the time difference between the arrival of signals at channels A and B, while T s y n c is the allowable synchronization time window. If the signals arrive within this window, synchronization is considered successful. When time jitter (random temporal fluctuation) is taken into account, the synchronization probability is expressed as above, where σ is the standard deviation of the time jitter [37,38,39].
Figure 13 provides a visual representation of these performance metrics. (a) The signal integrity graph shows that as the signal-to-noise ratio (SNR) increases, the bit error rate (BER) decreases, indicating robustness against noise. (b) The error detection graph demonstrates that redundant channels significantly improve error detection probability compared to a single channel, although performance degradation may occur in the presence of common cause failures (CCF). (c) The synchronization check graph illustrates that the probability of successful synchronization increases as the allowable synchronization window T s y n c becomes larger, thereby ensuring operational consistency across modules.

3.2.2. Digital Output Module Design

In a redundant PLC environment, the D/O module is a key component for ensuring system reliability and safety. In particular, redundancy logic was numerically analyzed in terms of output collision prevention, signal synchronization, and failover control.
In the heterogeneous PLC structure, the primary PLC generates output signals in the Active state under normal operation, while the standby distributed controller remains inactive, performing monitoring only instead of outputting. However, when an I/O error or failure occurs in the primary PLC, the failover mechanism is triggered, switching between Active and Standby, at which point the standby distributed controller takes over the output.
The most critical issue in this process is output collision. If both CPUs simultaneously transmit signals to the same output channel, device damage and logic errors may occur. To prevent this, the output logic must strictly satisfy the condition of mutual exclusivity. The logical expression is given as follows:
D / O o u t = F l a g A c t i v e   A N D   S i g n a l C P U
where F l a g A c t i v e represents the flag of the currently active CPU (primary or standby), and S i g n a l C P U denotes the output signal generated by the respective CPU. Therefore, only the active CPU is permitted to output signals, while signals from the inactive CPU are blocked, fundamentally preventing collisions.
In Figure 14, the Fast Failover scenario is characterized by T o f f = 8   m s and T o n = 12   m s , resulting in a short failover window of approximately 20 ms. This ensures the most stable continuity of output signals. While this rapid response minimizes downtime, it also makes the system more sensitive to hardware or communication issues, which may lead to unnecessary failovers (false detections).
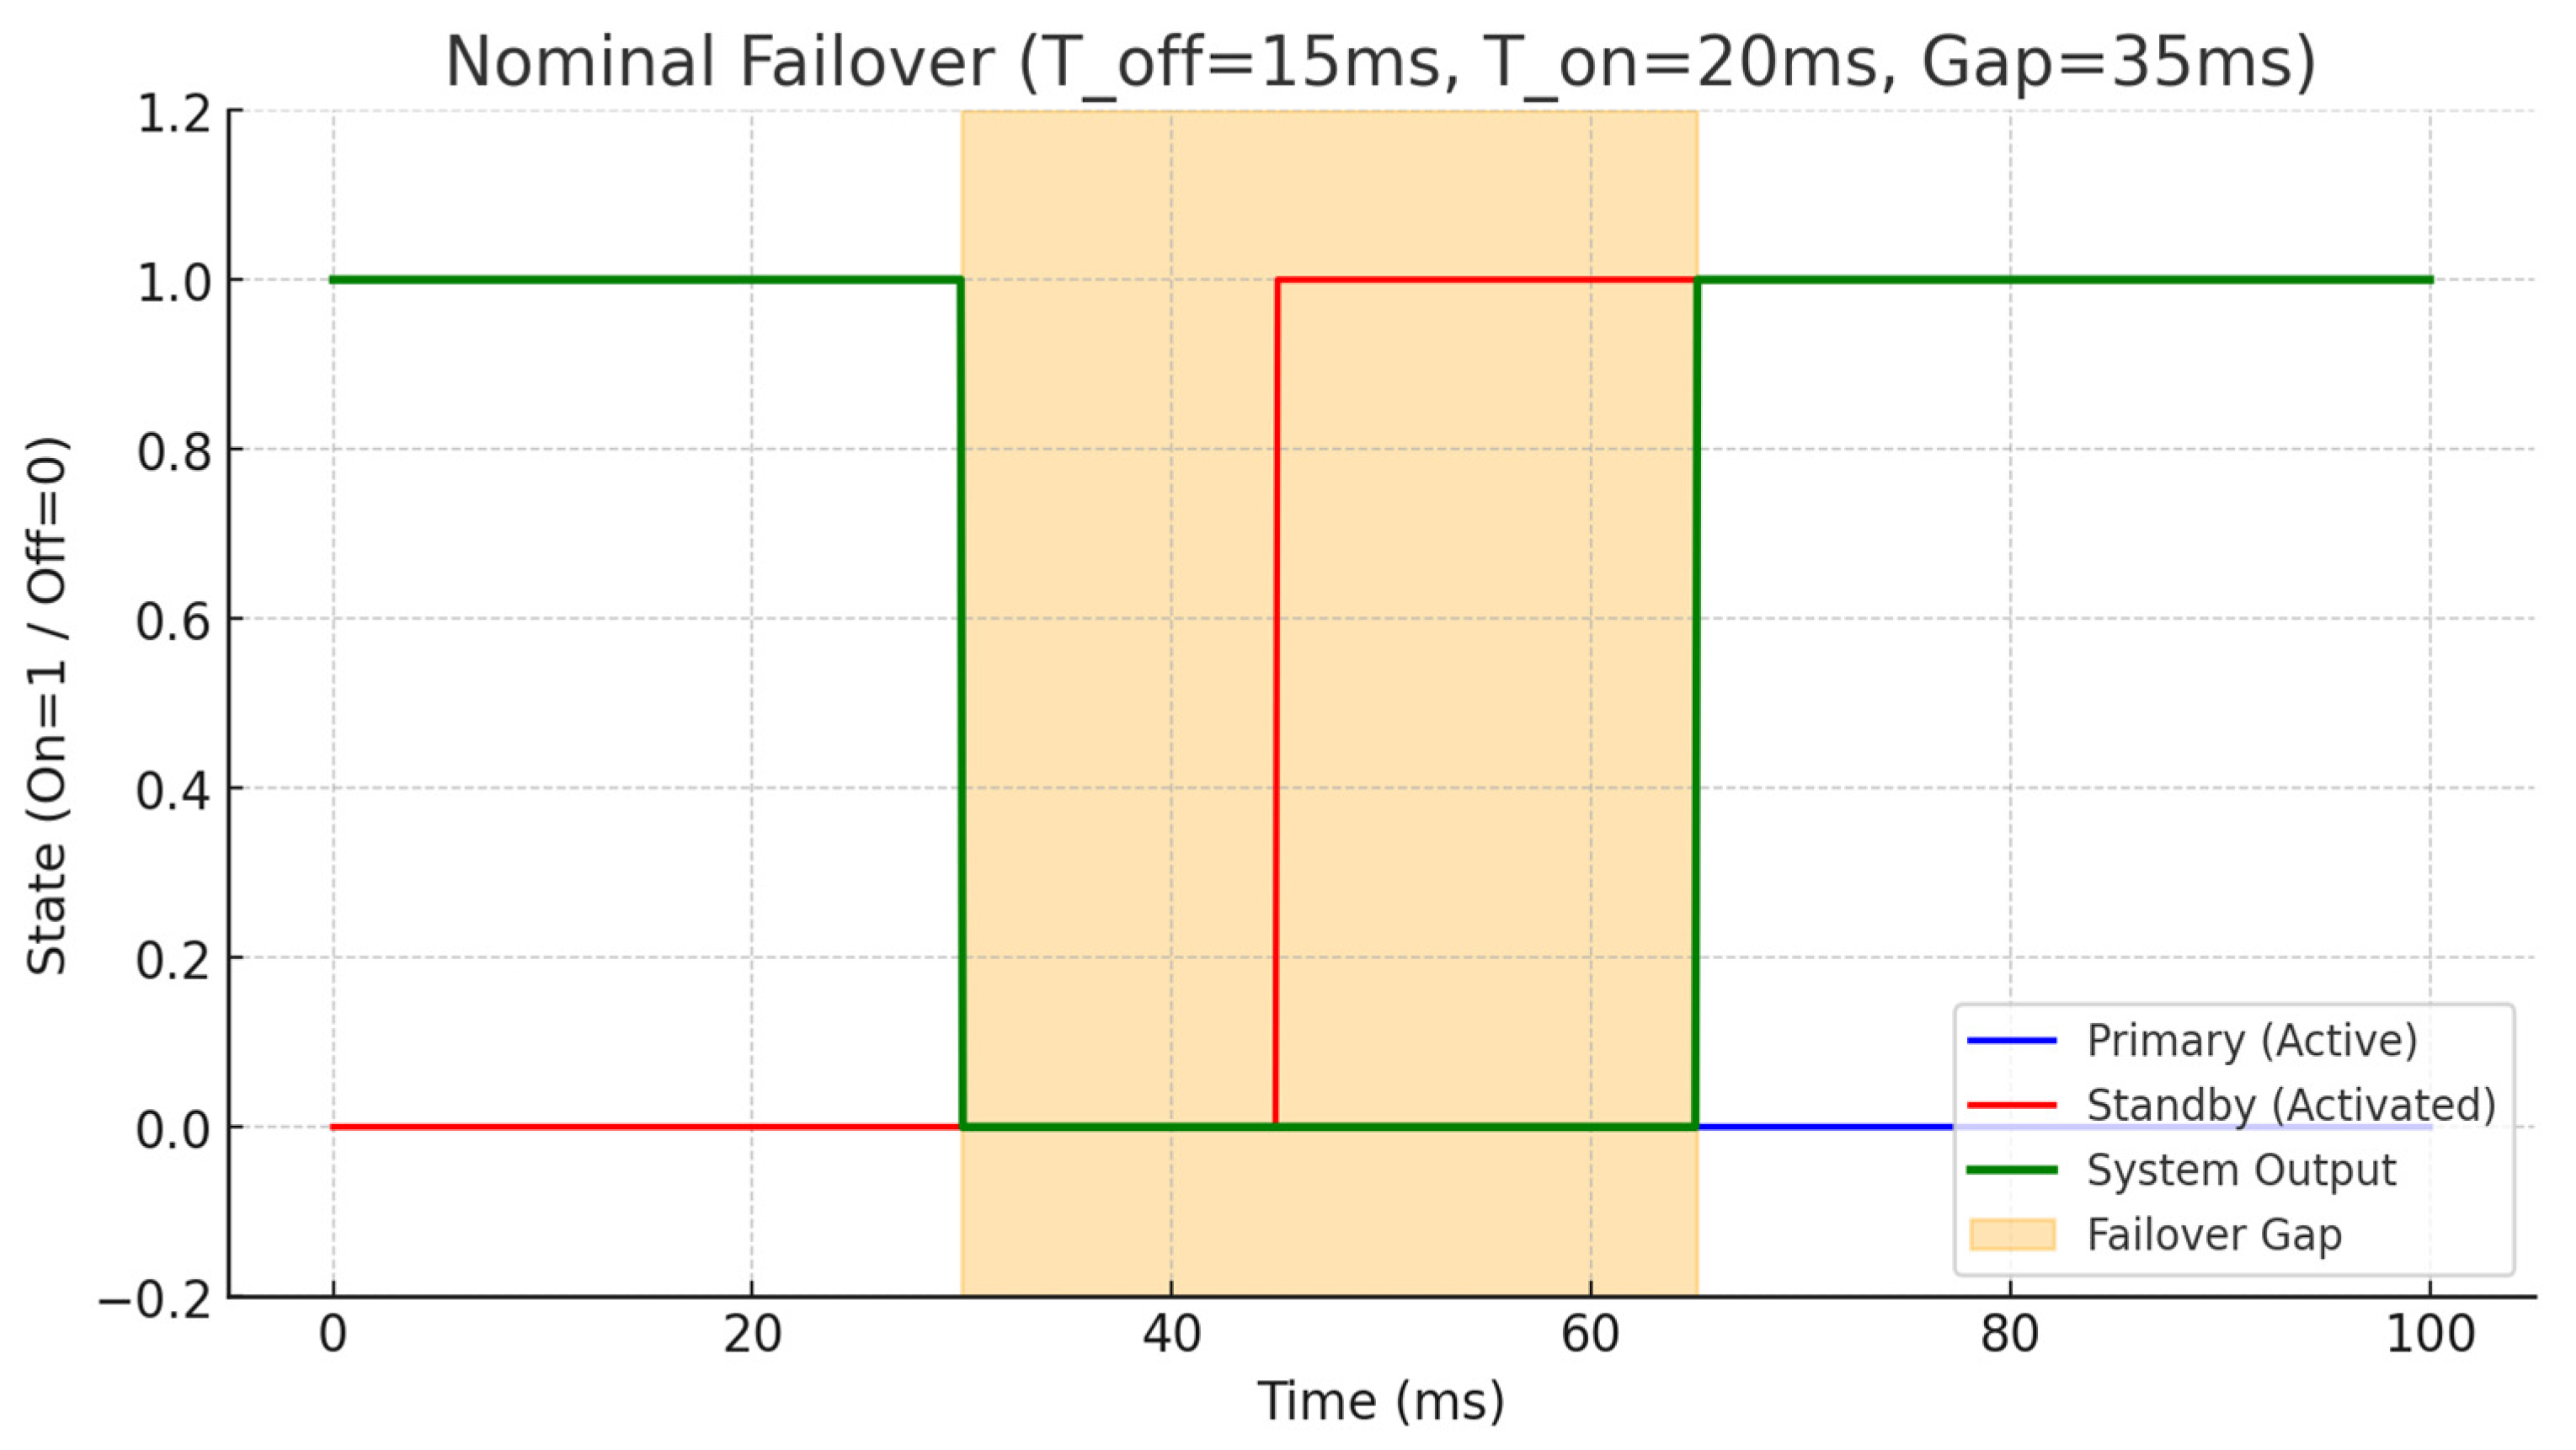
In Figure 15, the Nominal scenario shows T o f f = 15   m s and T o n = 20   m s , resulting in a failover window of about 35 ms, which is acceptable in most industrial processes. This Nominal configuration provides a balanced setting, ensuring both fast and stable failover performance.
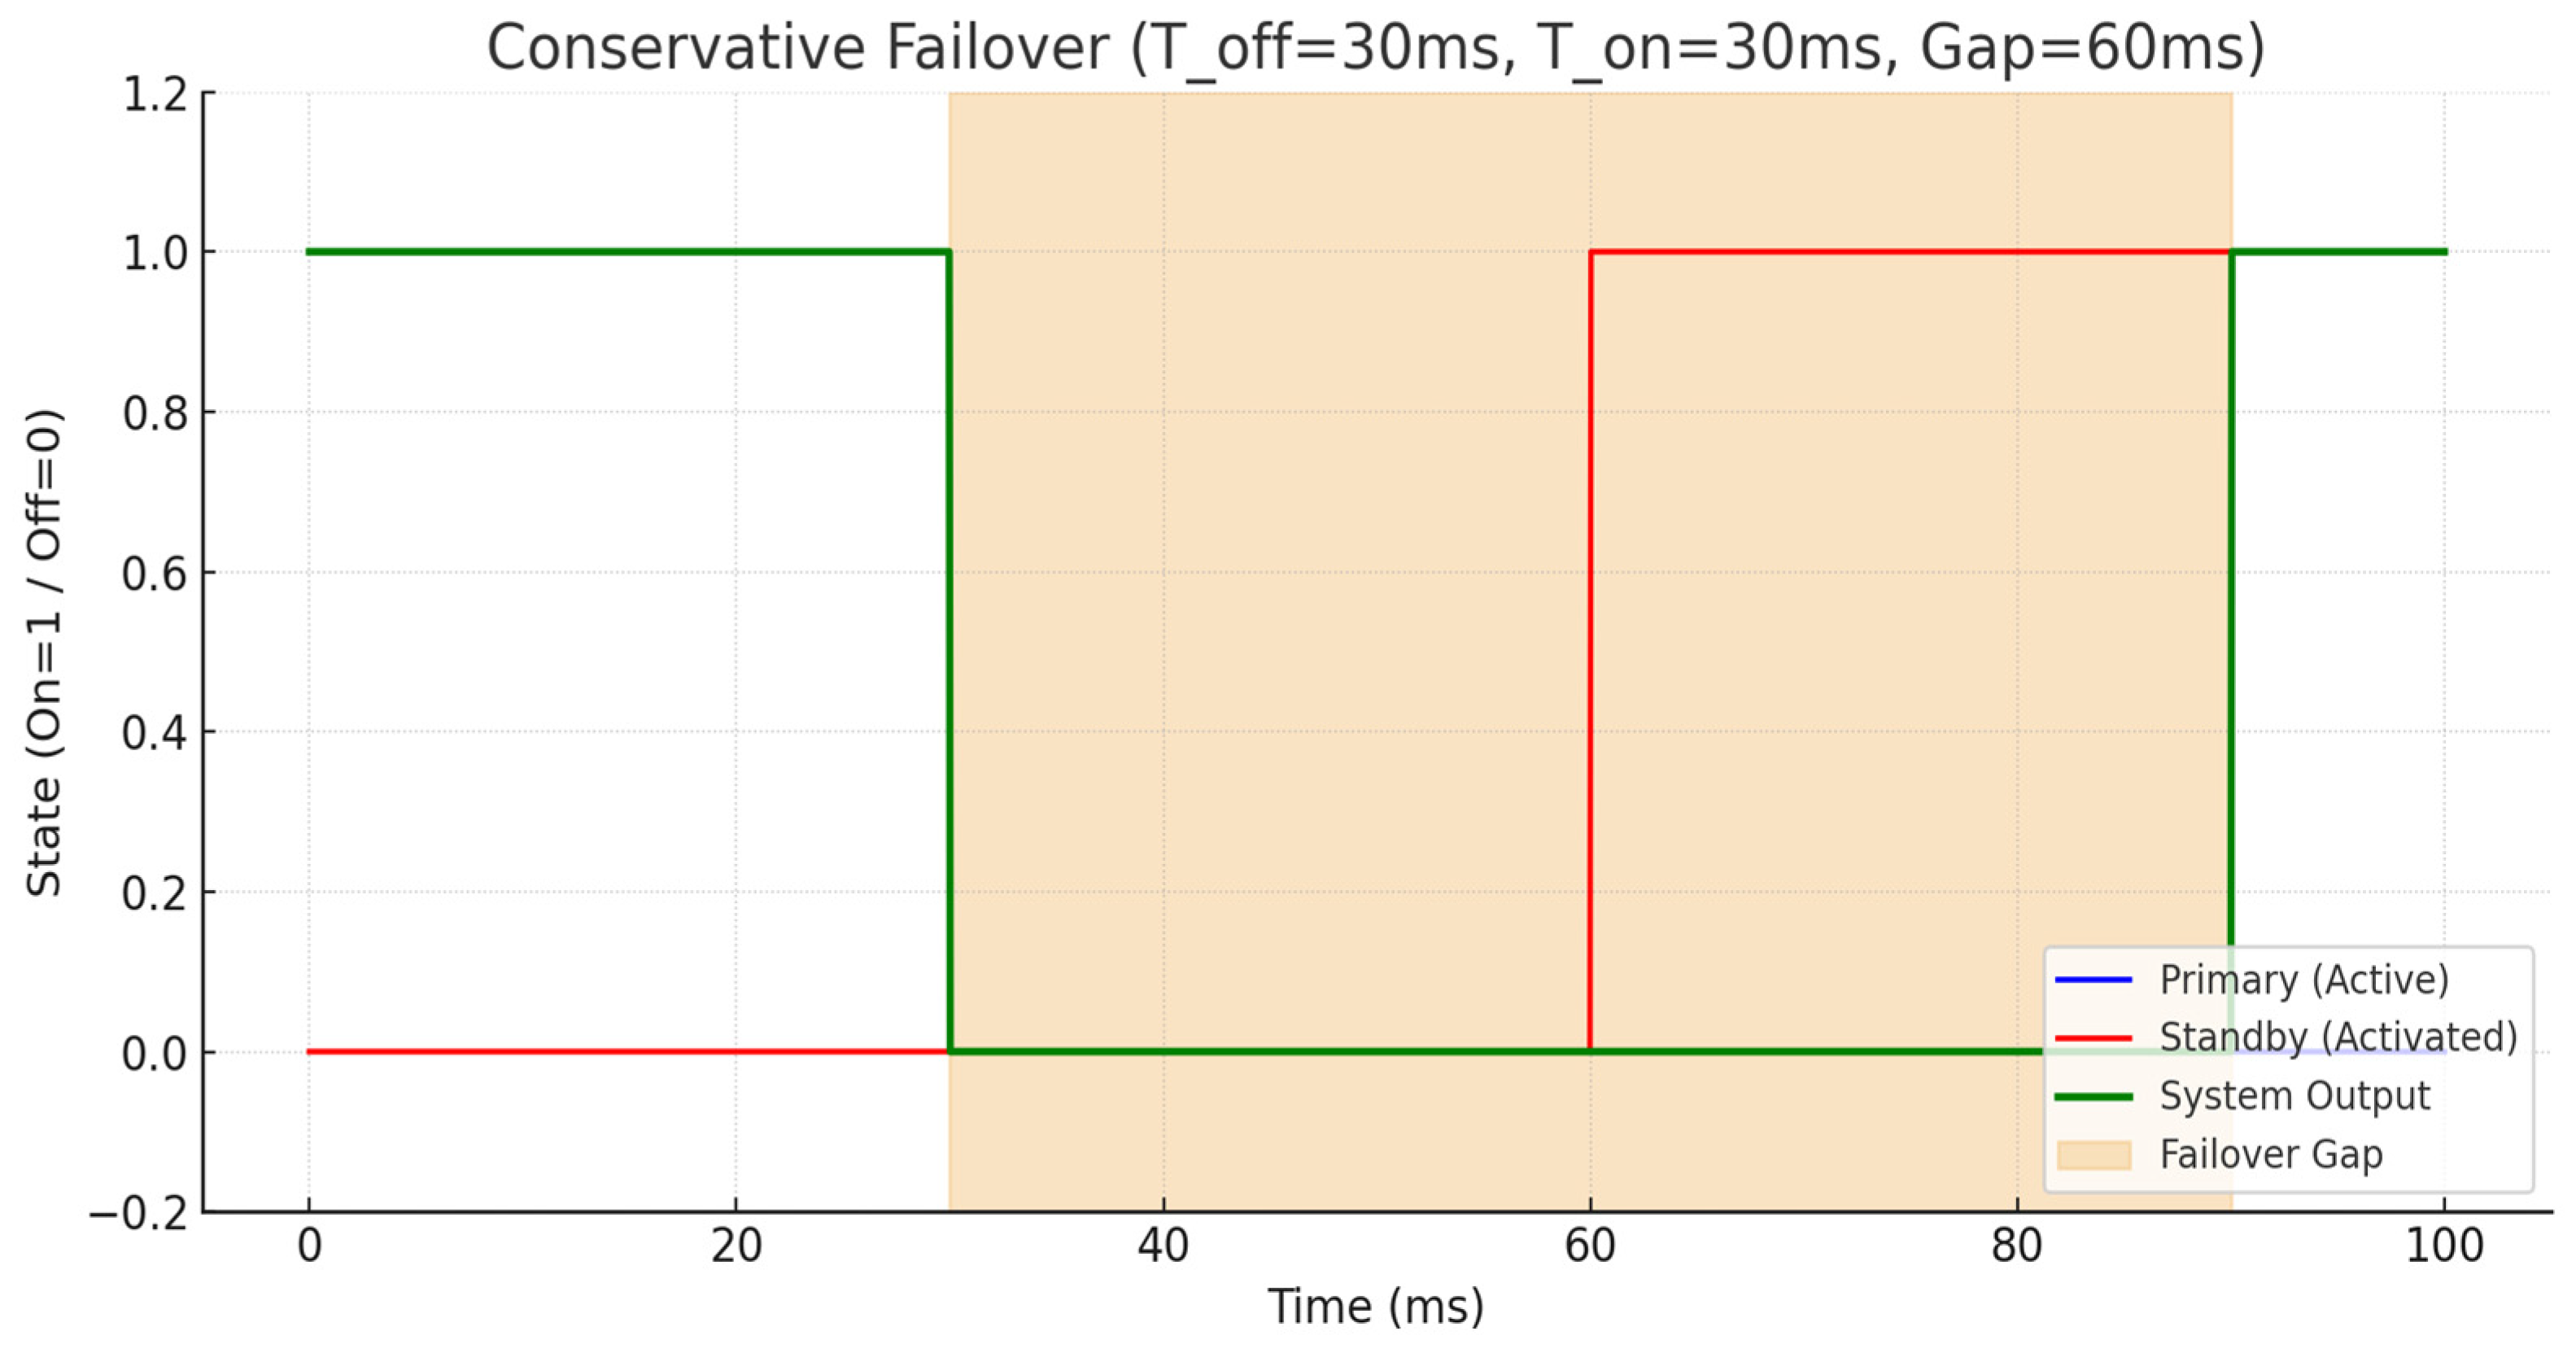
In Figure 16, the Conservative scenario has T o f f = 30   m s and T o n = 30   m s , leading to a failover window of about 60 ms. While this longer delay reduces the likelihood of unnecessary failovers (false detections), it also slows the down system response and results in a longer momentary downtime.
Figure 14, Figure 15 and Figure 16 illustrate the failover operation of the redundant D/O module with an interlocked structure. When a failure occurs in the primary PLC, the output is deactivated after a cutoff delay ( T o f f ), and the standby distributed controller’s output is activated after an activation delay ( T o n ). The interval between deactivation of the primary output and activation of the standby output is defined as the Failover Window, which can be approximated as follows:
Δ T T o f f + T o n
Thus, in designing a redundant D/O module, it is crucial to maintain mutual exclusivity in logic to prevent output collisions, and to minimize detection and synchronization delays in order to reduce both T o f f and T o n . Moreover, to ensure system reliability, the failover window should always be shorter than the actuator hold time [40,41].

3.2.3. Analog Input Module Design

The distributed controller I/O in this study consists of D/I, D/O, A/I, and A/O modules. Among these, the Analog Input (A/I) module is essential for mismatch detection, error judgment, and data comparison algorithms because it processes continuous signals. In the redundant configuration, both the primary PLC and the standby distributed controller acquire analog signals from the same sensor through independent A/D conversion. If the difference between the two input values is within the tolerance range (∆), the signals are judged as normal; otherwise, a fault is triggered [42]. The input comparison condition is defined as in Equation (24).
A 1 A 2
where A 1 is the analog value measured by the primary PLC, A 2 is the value measured by the standby controller, and is the allowable tolerance. Based on this, the error percentage is defined as in Equation (25).
E r r o r % = A 1 A 2 A r e f × 100 %
where A r e f is the reference value, either the average A 1 + A 2 / 2 or A 1 .
To mitigate noise, a Moving Average Filter (MAV) was applied. This filter generates a stable input value by averaging the latest k samples, thereby reducing the effect of noise during CPU-to-CPU comparisons. The formulation is given in Equation (26).
A n = 1 k i = 0 k 1 A n i
In addition, the real-time synchronization delay is defined as in Equation (27).
T s y n c = T s c a n + T c o m p a r e + T n e t w o r k
where T s c a n is the A/D conversion and scanning cycle, T c o m p a r e is the CPU comparison time, and T n e t w o r k refers to communication delays (RS485, Ethernet, etc.). In practice, this delay should be maintained below 20 ms to ensure real-time operation.
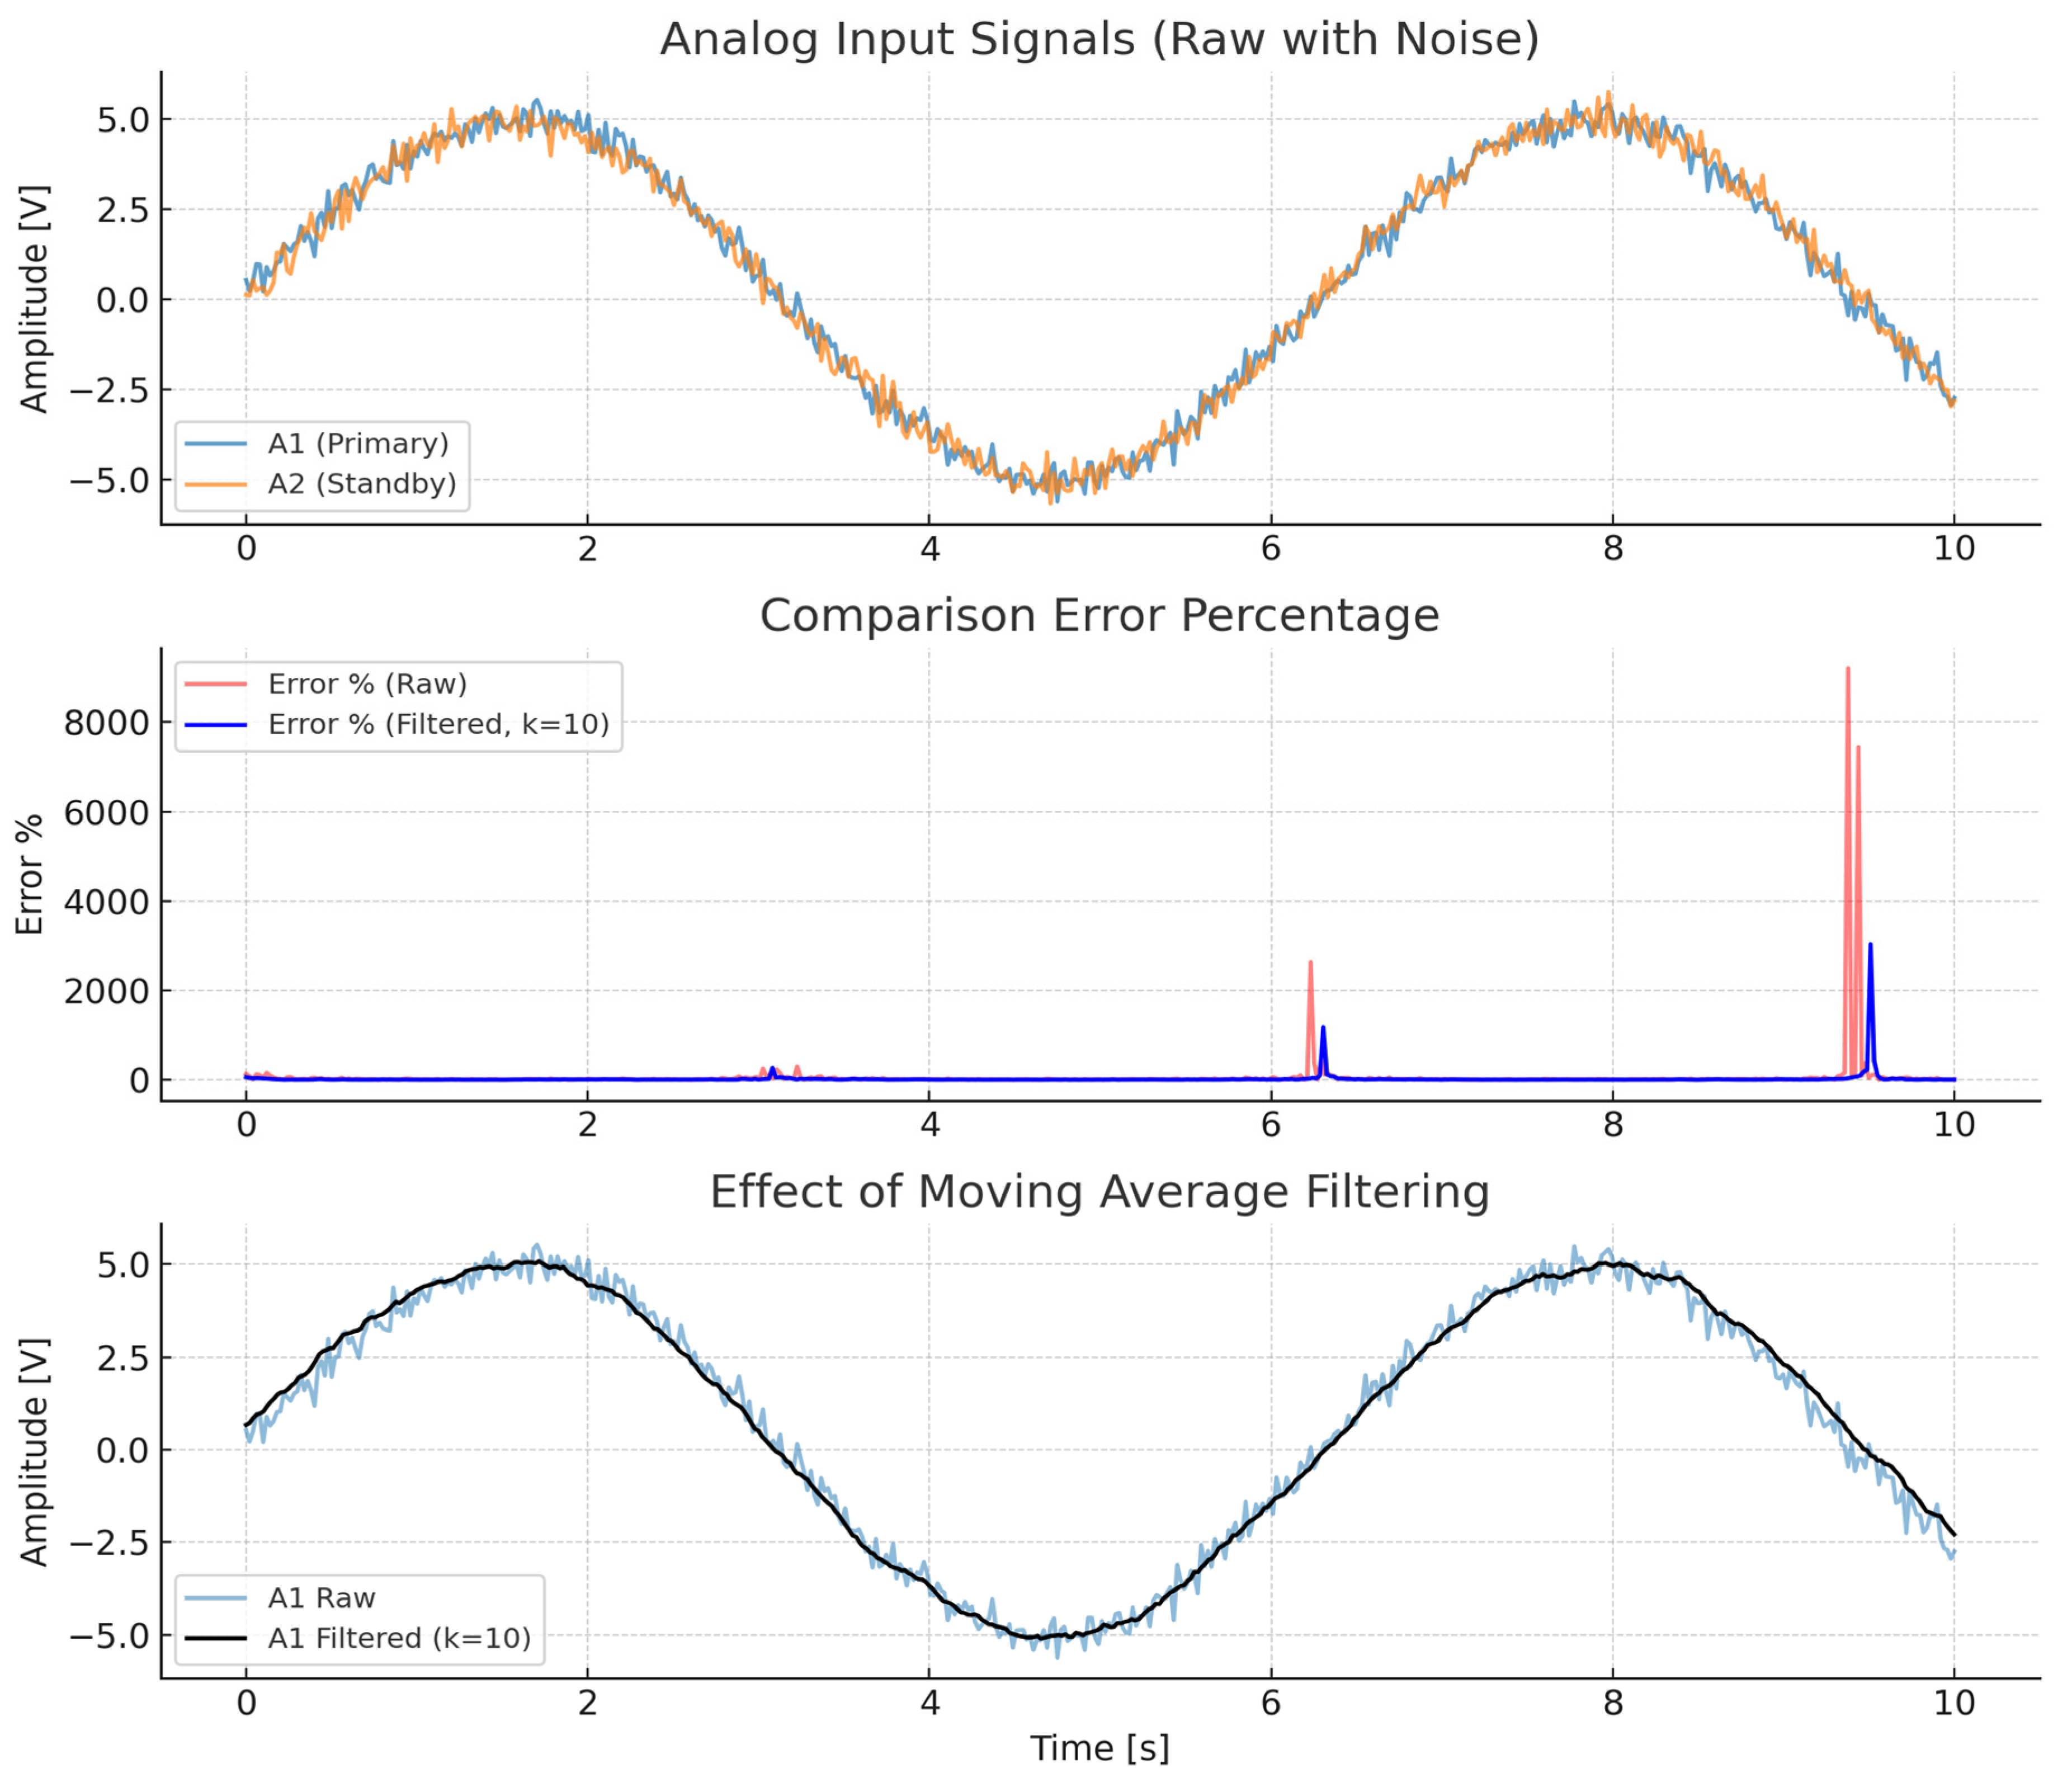
The top graph in Figure 17 compares the analog input signals of the primary PLC (A1) and the standby controller (A2). Although both signals follow the same sinusoidal waveform, noise introduces small deviations, demonstrating the necessity of correction techniques to preserve signal integrity in real industrial environments [43].
The middle graph shows the error percentage between the two signals. The Raw Error (red) without filtering exhibits large peaks, sometimes exceeding several thousand percent due to transient noise, which increases the likelihood of unnecessary fault detection. In contrast, the Filtered Error (blue, k = 10) shows that applying a Moving Average Filter reduces noise-induced fluctuations, thereby enabling reliable error detection based on actual signal differences [44].
The bottom graph compares the raw input signal (A1 Raw) and the filtered signal (A1 Filtered). After filtering, the signal better reflects the original sine waveform while significantly reducing noise, enabling more reliable data processing. Thus, applying techniques such as Moving Average Filtering in analog input modules plays a crucial role in ensuring signal integrity and enhancing the reliability of error detection [45].
These results confirm that filtering is essential to maintain I/O integrity when noise is present in the environment. In particular, the moving average filter[MAF] improves the reliability of error detection, reduces false alarms, and ensures accurate identification of actual I/O faults [46].

3.2.4. Analog Output Module Design

In a redundant control environment, analog output (A/O) differs from other I/O modules due to the inherent risk of control conflicts caused by simultaneous output. For instance, if both the Primary PLC and the Standby Distributed Controller generate A/O signals to the same controlled device such as a valve, inverter, or actuator, a conflict may occur, leading to equipment damage, overload, or system instability. Therefore, the design of the A/O module requires not only failover capability but also a conflict prevention mechanism as a core feature [47].
To address this issue, this study applies a dual-safety design that combines hardware gating and a software active/standby flag. Hardware gating physically blocks or enables the analog output path, ensuring that both channels cannot be open simultaneously. Meanwhile, the software active flag explicitly defines which module is currently active at the control logic level, guaranteeing that only one output is maintained during the transition process.
The A/O module is designed such that only one channel, either the Primary PLC or the Standby Controller, is active at any given time. In this case, the reliability can be expressed by the Selective Redundancy model, mathematically defined as follows:
R A / O t = R m a i n t + 0 t λ m a i n e λ m a i n τ c e μ T s R s t a n d b y t τ d τ
where R m a i n t denotes the reliability of the primary PLC A/O channel over time t , while λ m a i n represents its failure rate. R s t a n d b y t is the reliability of the standby controller channel,   c is the coverage (i.e., the probability of successful switchover, 0 c 1 , μ is the repair rate, and T s represents the switchover delay. This equation quantifies the probability that the standby module can safely take over operation after a failure of the primary module without conflict.
Furthermore, in the conflict prevention reliability model, the application of hardware gating and software flags reduces the conflict probability to zero, as defined in (29):
P c o n f l i c t = g m a i n t · g s t a n d b y t = 0
where g m a i n t is the probability that the primary PLC is active, and g s t a n d b y t is the probability that the standby controller is active.
The overall system reliability, including black-box module and communication bus reliability, is defined as follows:
R s y s t e m t = e λ b b t e λ b u s t R A / O t
where λ b b is the failure rate of the black-box module, and λ b u s is the failure rate of the communication bus. R A / O t is the reliability of the A/O module as defined in (28).
Figure 18 illustrates the conflict case in a redundant A/O environment. In this scenario, there are intervals in which both the primary PLC and the standby controller simultaneously output signals, resulting in duplicated commands to the same controlled device (e.g., valve, inverter, actuator). Such conditions may lead to equipment damage or system instability.
In contrast, Figure 19 demonstrates the safe failover case proposed in this study, where hardware gating (analog switches/relays) and software active/standby flags are combined. In this design, the output of the primary PLC is first terminated, and then the standby controller output is activated. This ensures that the two devices never operate simultaneously, thereby maintaining uninterrupted and stable system output.
The proposed A/O module design fundamentally prevents signal conflicts while ensuring the continuity and stability of the System Output during Failover. Therefore, this architecture is effective in securing the safety and reliability of analog output signals.

4. Implementation of a Distributed Controller with an Embedded Black-Box

This section presents the implementation of the distributed controller equipped with an embedded black-box, including its main unit and I/O modules, enabling experimental validation and testing.

4.1. Implementation of the Black-Box Distributed Controller and HMI Monitor

As shown in Figure 20, the distributed controller developed in this study was designed as an integrated structure that goes beyond simple logic monitoring, supporting real-time field operation, short- and long-distance remote monitoring, and on-site error correction and control. This structure enables the system to perform reliable data monitoring and real-time control simultaneously, thereby enhancing field applicability.
Figure 20 illustrates the integration of a black-box module within the standby distributed controller to monitor the logic state of the primary PLC I/O installed inside the field panel. The monitoring results are displayed in real time on a front-mounted 2.4-inch LCD. However, when errors occur in the primary PLC I/O, a dedicated monitoring device is required to immediately resolve the issue and maintain normal operation.
To address this, the black-box performs monitoring and fault detection, while the internal CPU of the distributed controller integrates both Ladder and HMI programs. The HMI monitor visually displays the monitoring results and allows for program editing and error correction when necessary. In this configuration, the black-box handles logic monitoring and fault detection, the integrated I/O executes alternative operations based on the black-box results, and the HMI monitor provides visualization and error correction capabilities.
Figure 21 illustrates the implemented configuration of the black box-embedded distributed controller and the HMI monitor. The front panel of the distributed controller integrates the black box function, which is displayed through four main screens as shown on the left. These displays provide data logging, system settings, time synchronization, and storage functions, allowing for intuitive monitoring of the controller’s operational status.
The distributed controller is connected to an external HMI monitor via an HDMI cable. The HMI monitor serves purely as a display device without storage capability. In other words, both the Ladder program and the HMI program are stored in the SSD memory embedded in the distributed controller, while the HMI monitor provides only editing and monitoring interfaces without independent data storage.
The HMI monitor presents two program views: the ladder editor and the HMI screen. Operators can directly modify or edit control logic and user interfaces through the touch interface while simultaneously performing real-time monitoring. This configuration enables on-site correction or reconfiguration of control logic and HMI screens, ensuring rapid response to faults and enhancing operational flexibility.
Through this integrated structure, real-time fault response and immediate recovery can be achieved in the field. Furthermore, the detailed functions of the structural components enabling these features are summarized in Table 3.
Figure 22 illustrates the implementation results of the black-box module integrated into the standby distributed controller, which monitors the logic state of the primary PLC I/O inside the field panel. A 2.4-inch LCD is mounted on the front panel of the black-box, displaying the real-time monitoring results. The displayed items are classified into normal data (Write) and error data (Loss), thereby enhancing the operator’s visibility in distinguishing between normal operation and error occurrence.
In particular, when the error data item is selected on the LCD screen, detailed information is immediately presented. This includes the error occurrence time, the corresponding I/O channel number, and the execution address, enabling operators to quickly identify the cause of the problem and take corrective action on site.
Furthermore, the black-box provides extended operational functions beyond simple monitoring. Through the LCD interface, users can (1) configure system parameters, (2) update log records, and (3) download stored data for analysis. These extended features demonstrate that the black-box is not merely a monitoring device, but rather an integrated management tool that supports field-level maintenance and fault recovery.
Therefore, the proposed black-box implementation not only ensures real-time monitoring and fault detection of primary PLC I/O logic, but also enhances field applicability by offering detailed diagnostics and data management, ultimately improving the reliability and operational efficiency of the distributed controller.
The implementation results of the black-box extend beyond simple logic state monitoring to include configuration and error management. In particular, the black-box LCD screen clearly distinguishes between normal data (Write) and error data (Loss), and provides immediate access to detailed information on individual error events, thereby reducing diagnostic and recovery time for field operators.

4.2. Implementation of Distributed Controller I/O

The I/O modules of the distributed controller, designed for failover execution, are classified into D/I, D/O, A/I, and A/O, each with an independent modular structure. All modules can be expanded if necessary, and each module is equipped with its own CPU to ensure autonomous operation.
The basic hardware specifications are as follows: the D/I module consists of 8 channels with DC 24 V input (sink/source type) and a response time within 5 ms. The D/O module also provides 8 channels with relay outputs (0.5 A) and a response time of less than 5 ms. The A/I module consists of 4 channels of 4–20 mA inputs with a digital range of 0–16,000 count. Finally, the A/O module provides 4 channels of 4–20 mA outputs, also with a digital range of 0–16,000 count.
Each module is interconnected with the distributed controller main unit via I2C communication through the TBUS terminal. This architecture ensures both scalability and independence among modules, allowing for rapid diagnosis and replacement at the module level in case of system failures.
Consequently, the implementation of the black-box integrated distributed controller can be divided into hardware and software. The hardware consists of the black box, the distributed controller main unit, and the I/O modules, while the software is based on the DYTO Studio environment. DYTO Studio provides an integrated development platform that unifies logic control, HMI design, and black-box diagnostic data, thereby achieving seamless integration between hardware and software.

5. Experimental and Test Results

This chapter presents the experimental and test results based on the standby distributed controller implemented in Section 4. The experiments are divided into two categories. First, functional verification experiments were conducted using the experimental bed (Bed) environment configured as shown in Figure 23. Second, a field control panel was fabricated, and tests were performed by an external accredited institution.

5.1. Experimental Bed Test of the Heterogeneous Redundant Distributed Controller

The experimental environment for the Linux-based standby distributed controller developed in this study was configured as a heterogeneous redundancy structure with a primary PLC and a standby distributed controller, as illustrated in Figure 24.
The primary PLC used in this study was the LS XGB-E model (CPU: XEC-DR20U), while the standby distributed controller was implemented on an embedded Linux platform (ARM Cortex-A53, Ubuntu). The testbed included RS232/RS485 communication modules, an HDMI touch display, and industrial relay I/Os. Each experiment was repeated 100 times under identical conditions to ensure statistical reliability.
In this configuration, the logic state of the primary PLC is monitored and diagnosed by the black box embedded in the standby distributed controller. The integrated I/O of the controller performs substitute execution based on the diagnostic results, while the HMI monitor provides program visualization and editing functions to enable immediate on-site response. To verify the system’s capability for real-time fault response and rapid recovery, an experimental bed was established.
The experimental procedures defined in this study are as follows (Table 4):
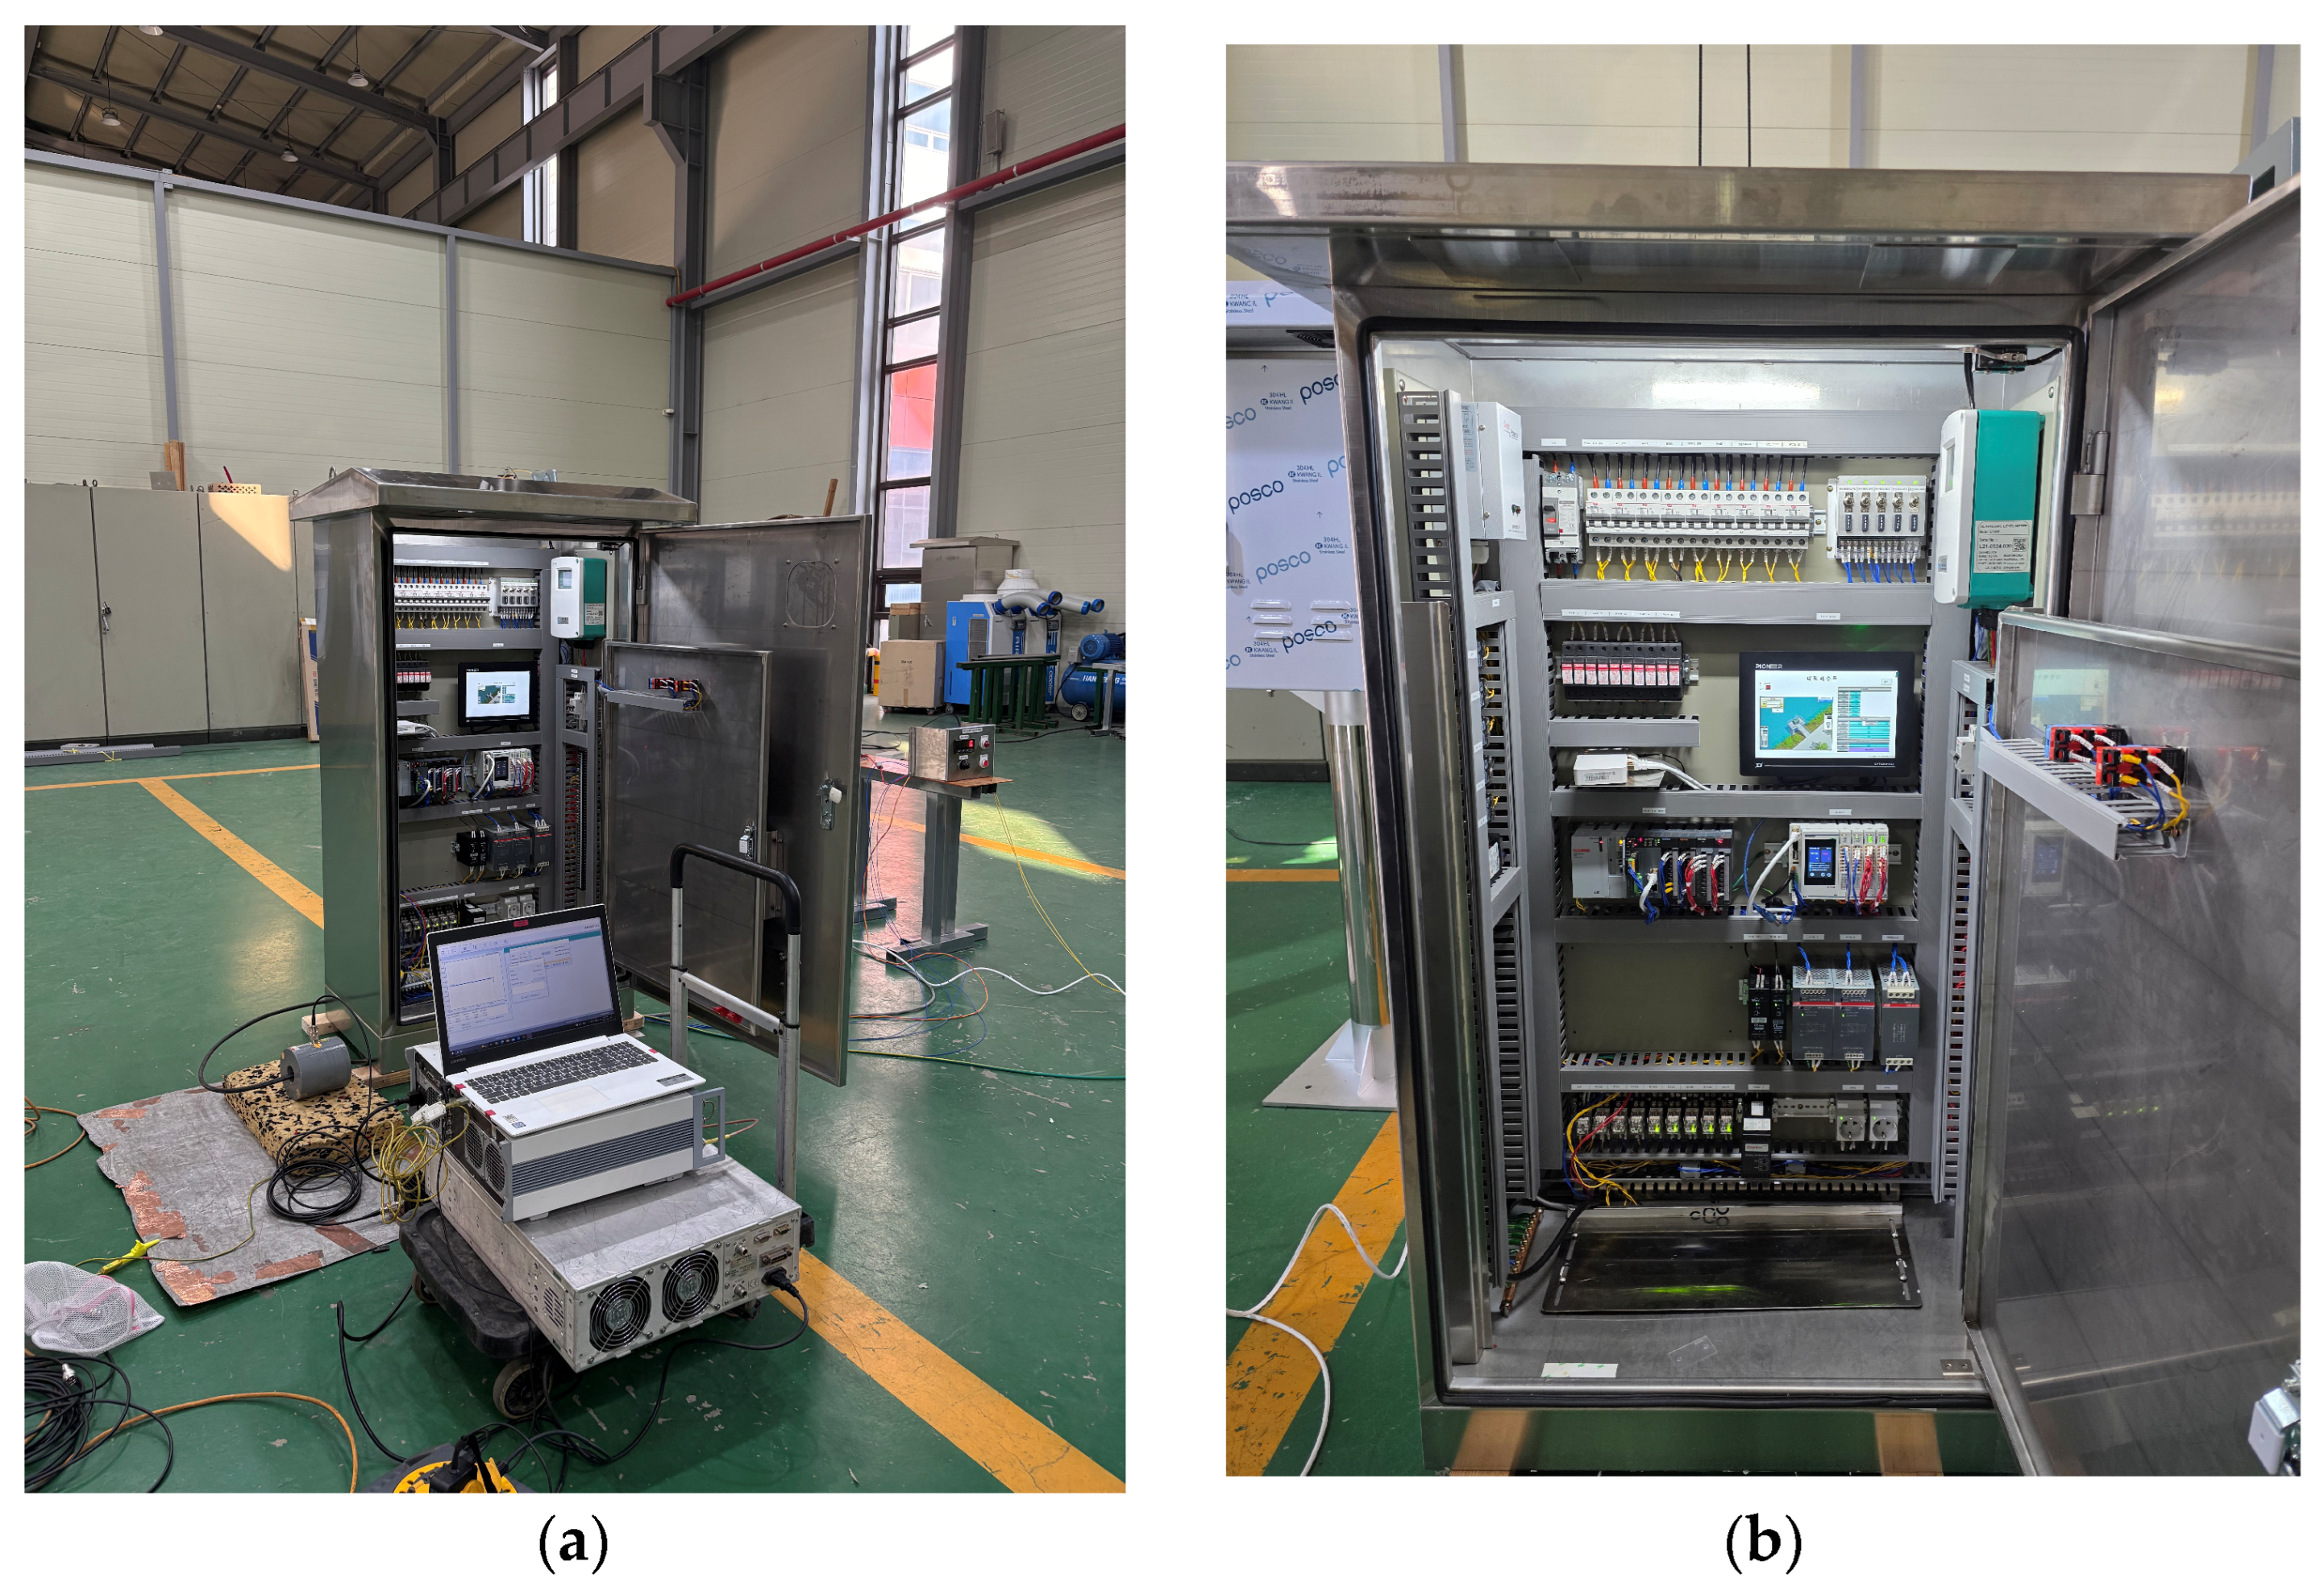
For experimental items that could not be sufficiently validated in the testbed, an additional field control panel was fabricated and tested by an accredited external agency. The panel (800 mm × 500 mm × 1550 mm) was equipped with D/I input, D/O output, A/I input, and A/O output modules, as well as external driving devices, ensuring that the tests were performed under the same conditions as an actual industrial field.

5.1.1. Command Data Synchronization Experiment

The command data synchronization experiment verifies whether the command and event data transmitted from the remote monitoring control room are simultaneously delivered to both the primary PLC and the standby distributed controller. For this purpose, a network configuration was established between the remote monitoring control room, the primary PLC, and the standby controller.
The testbed configuration included an industrial PC for HMI operation, a primary PLC (LS XGB series), a standby distributed controller (embedded Linux system), and RS485/RS232 communication interfaces. Each experiment was repeated 100 times under identical environmental conditions to ensure statistical reliability.
As shown in Figure 25, the raw data (②) from the remote monitoring control room (①) are transmitted to the switching hub (③). The hub performs port forwarding to the primary PLC (④) and port mirroring to the standby distributed controller (⑤), ensuring that both devices receive identical data streams. In the actual IP configuration (⑥), the remote monitoring control room is assigned IP address 192.168.33.4, while the switching hub is assigned IP 192.168.33.1. Through this forwarding and mirroring process, it was confirmed that the primary PLC (IP 192.168.33.10) and the standby distributed controller (IP 192.168.33.7) simultaneously received the same command data, as verified in (⑦).

5.1.2. Black-Box Data Determination Experiment

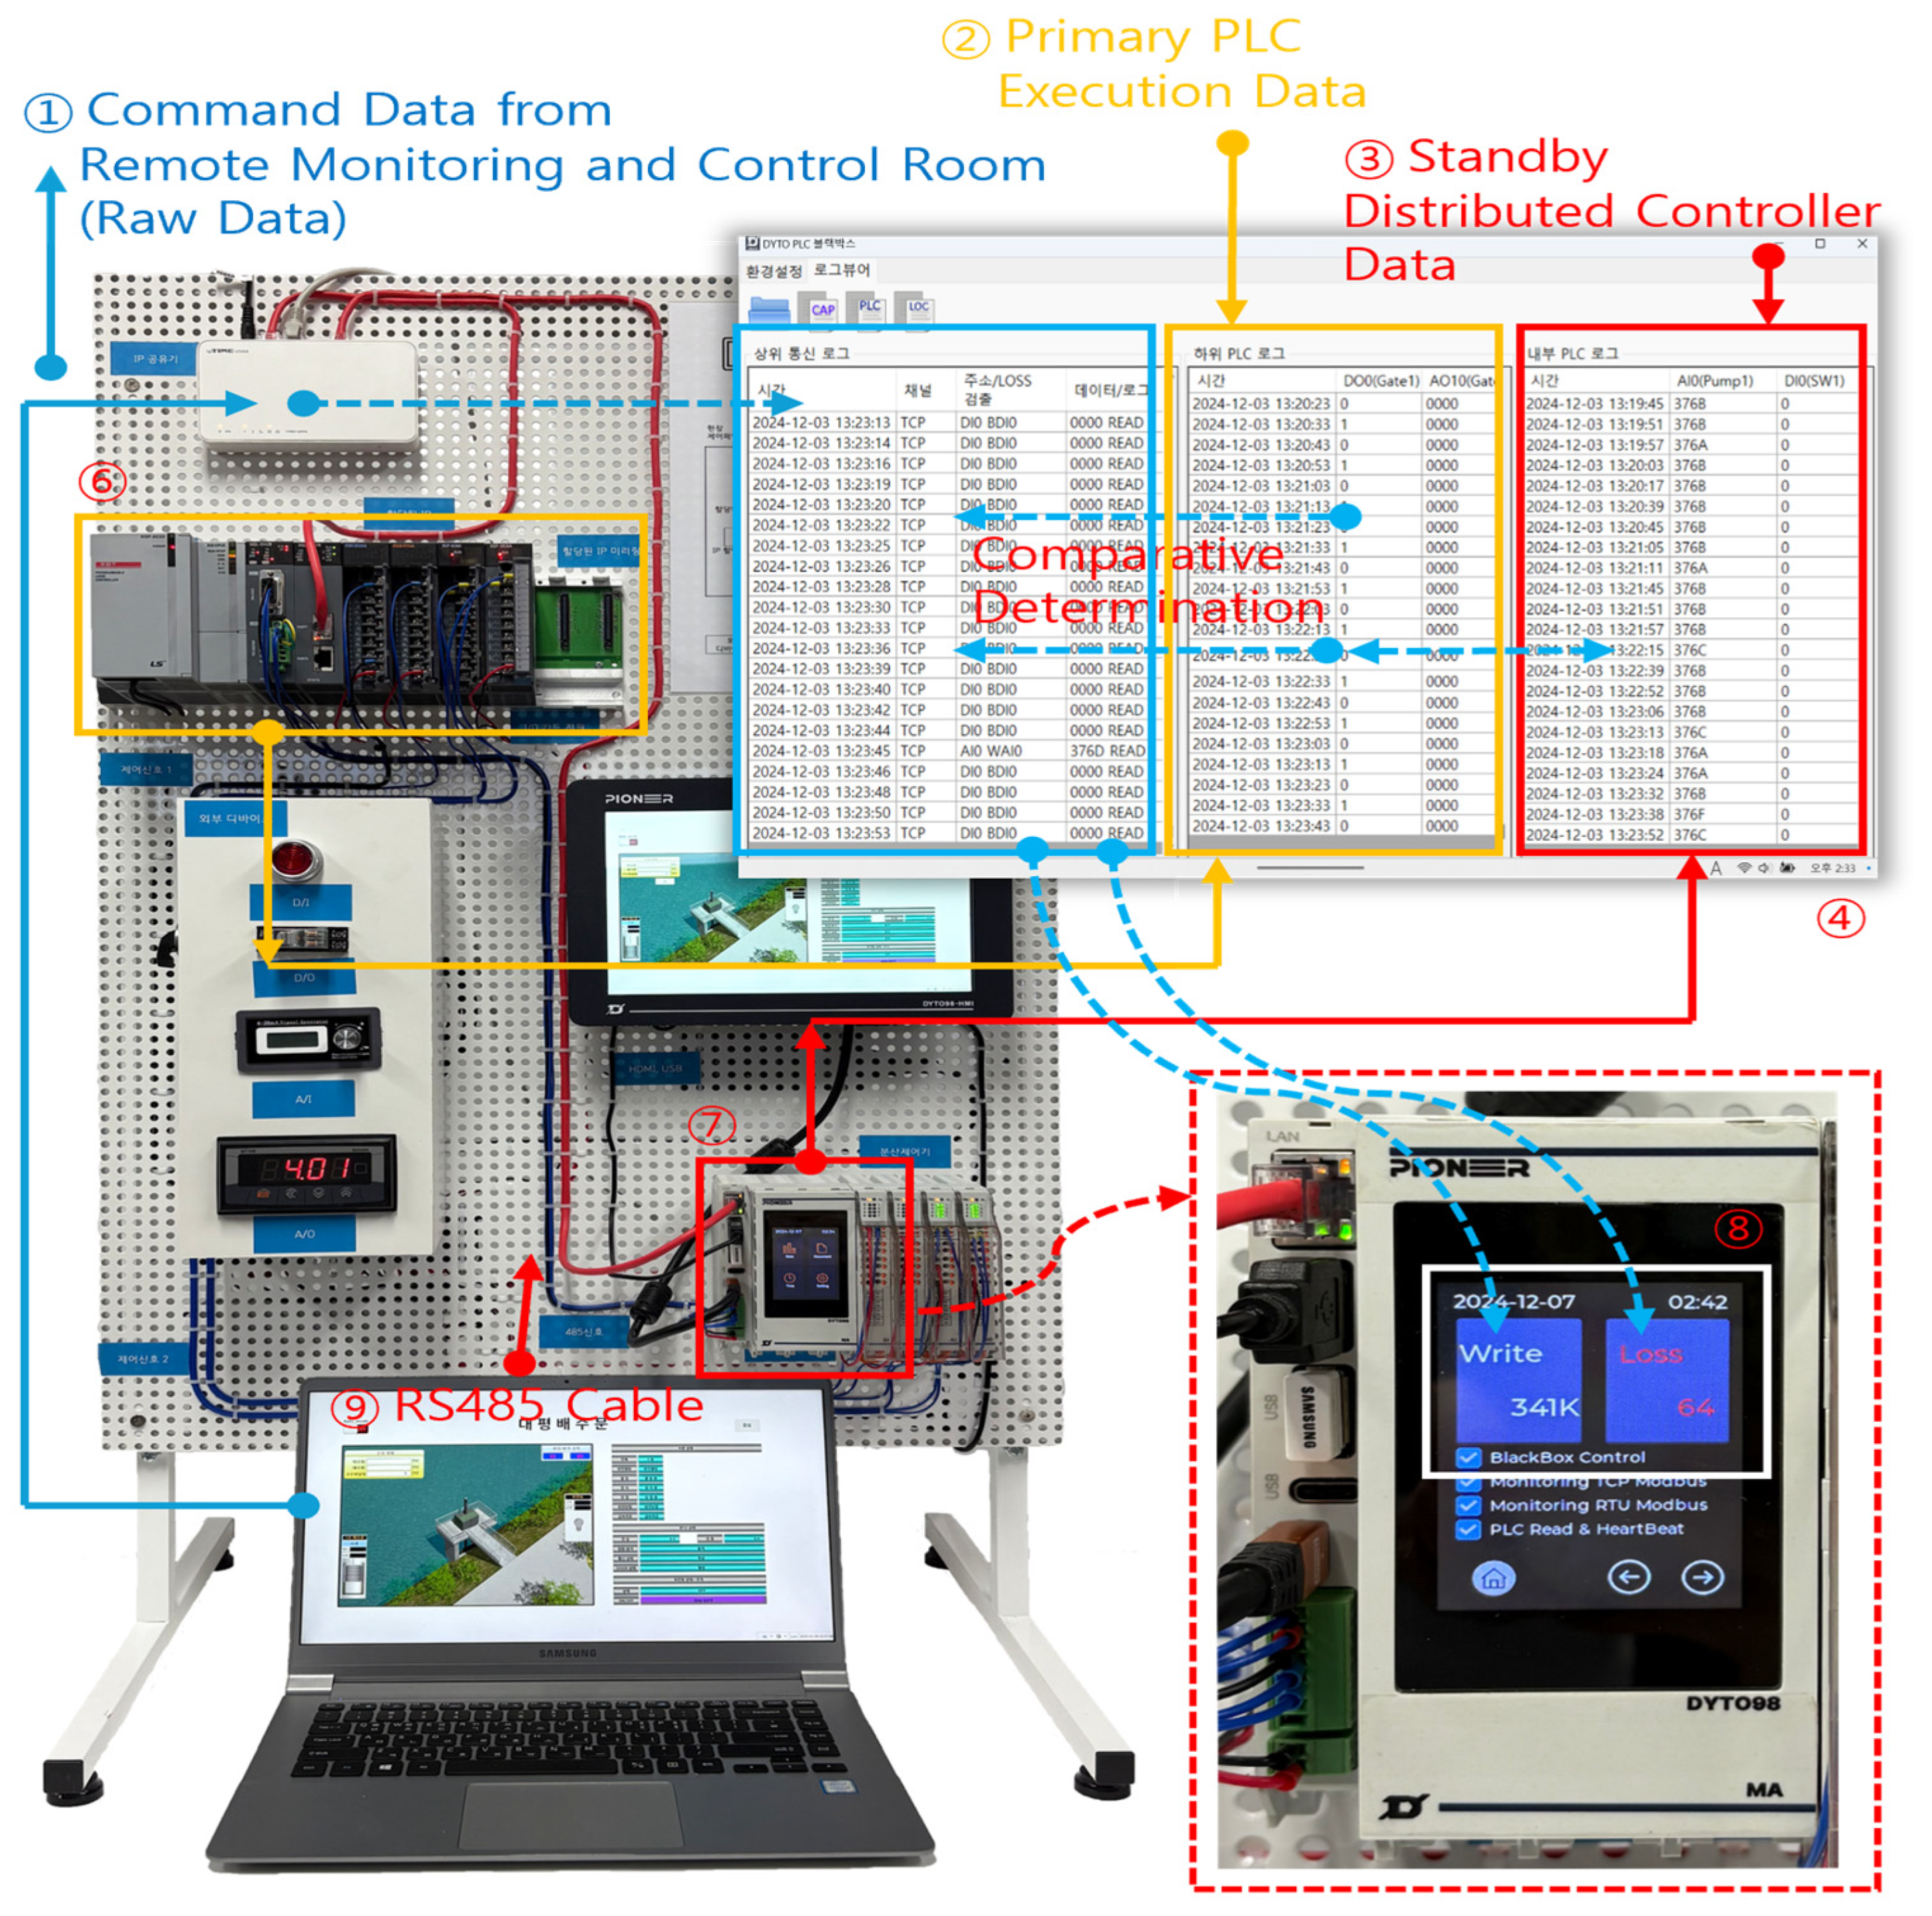
After confirming in Figure 25 that the IP network configuration was functioning correctly, the experiment shown in Figure 26 was conducted to evaluate whether the black-box can accurately monitor and determine the execution results of the primary PLC.
The experimental procedure is as follows:
① The raw data (command and event data) generated from the remote monitoring and control room is transmitted through the switching hub to the primary PLC (⑥) and simultaneously mirrored to the standby distributed controller (⑦). ② The execution data from the primary PLC is then transmitted via an RS485 cable (⑨) to the black-box (⑧) within the standby distributed controller. During this process, the black-box compares the raw data (①), the execution data of the primary PLC (②), and the input data of the standby distributed controller (③). ④ The compared data is stored in the SSD memory of the black-box, and the final determination result is displayed on the black-box LCD (⑧).
The determination results are classified as follows:
  • Write: counted when the command is executed successfully.
  • Loss: counted when the command fails to be executed.
Furthermore, when the Loss item is touched, detailed information (such as occurrence time, corresponding I/O, and execution address) is displayed. This experiment demonstrates that the black-box not only identifies whether the command was executed but also enables rapid diagnosis of error causes.

5.1.3. Failover Execution and Error Notification Test

In this section, experiments were conducted to verify the failover execution capability of the I/O modules (D/I, D/O, A/I, A/O) integrated into the distributed controller. As designed and implemented in this study, these modules are structured such that when an error occurs in the primary PLC I/O, the standby distributed controller I/Os automatically perform failover execution. Furthermore, since multiple I/O targets must be monitored and controlled simultaneously in real industrial environments, each I/O module provides ID selector–based configuration and expansion functions, enabling systematic scalability for large-scale facilities.
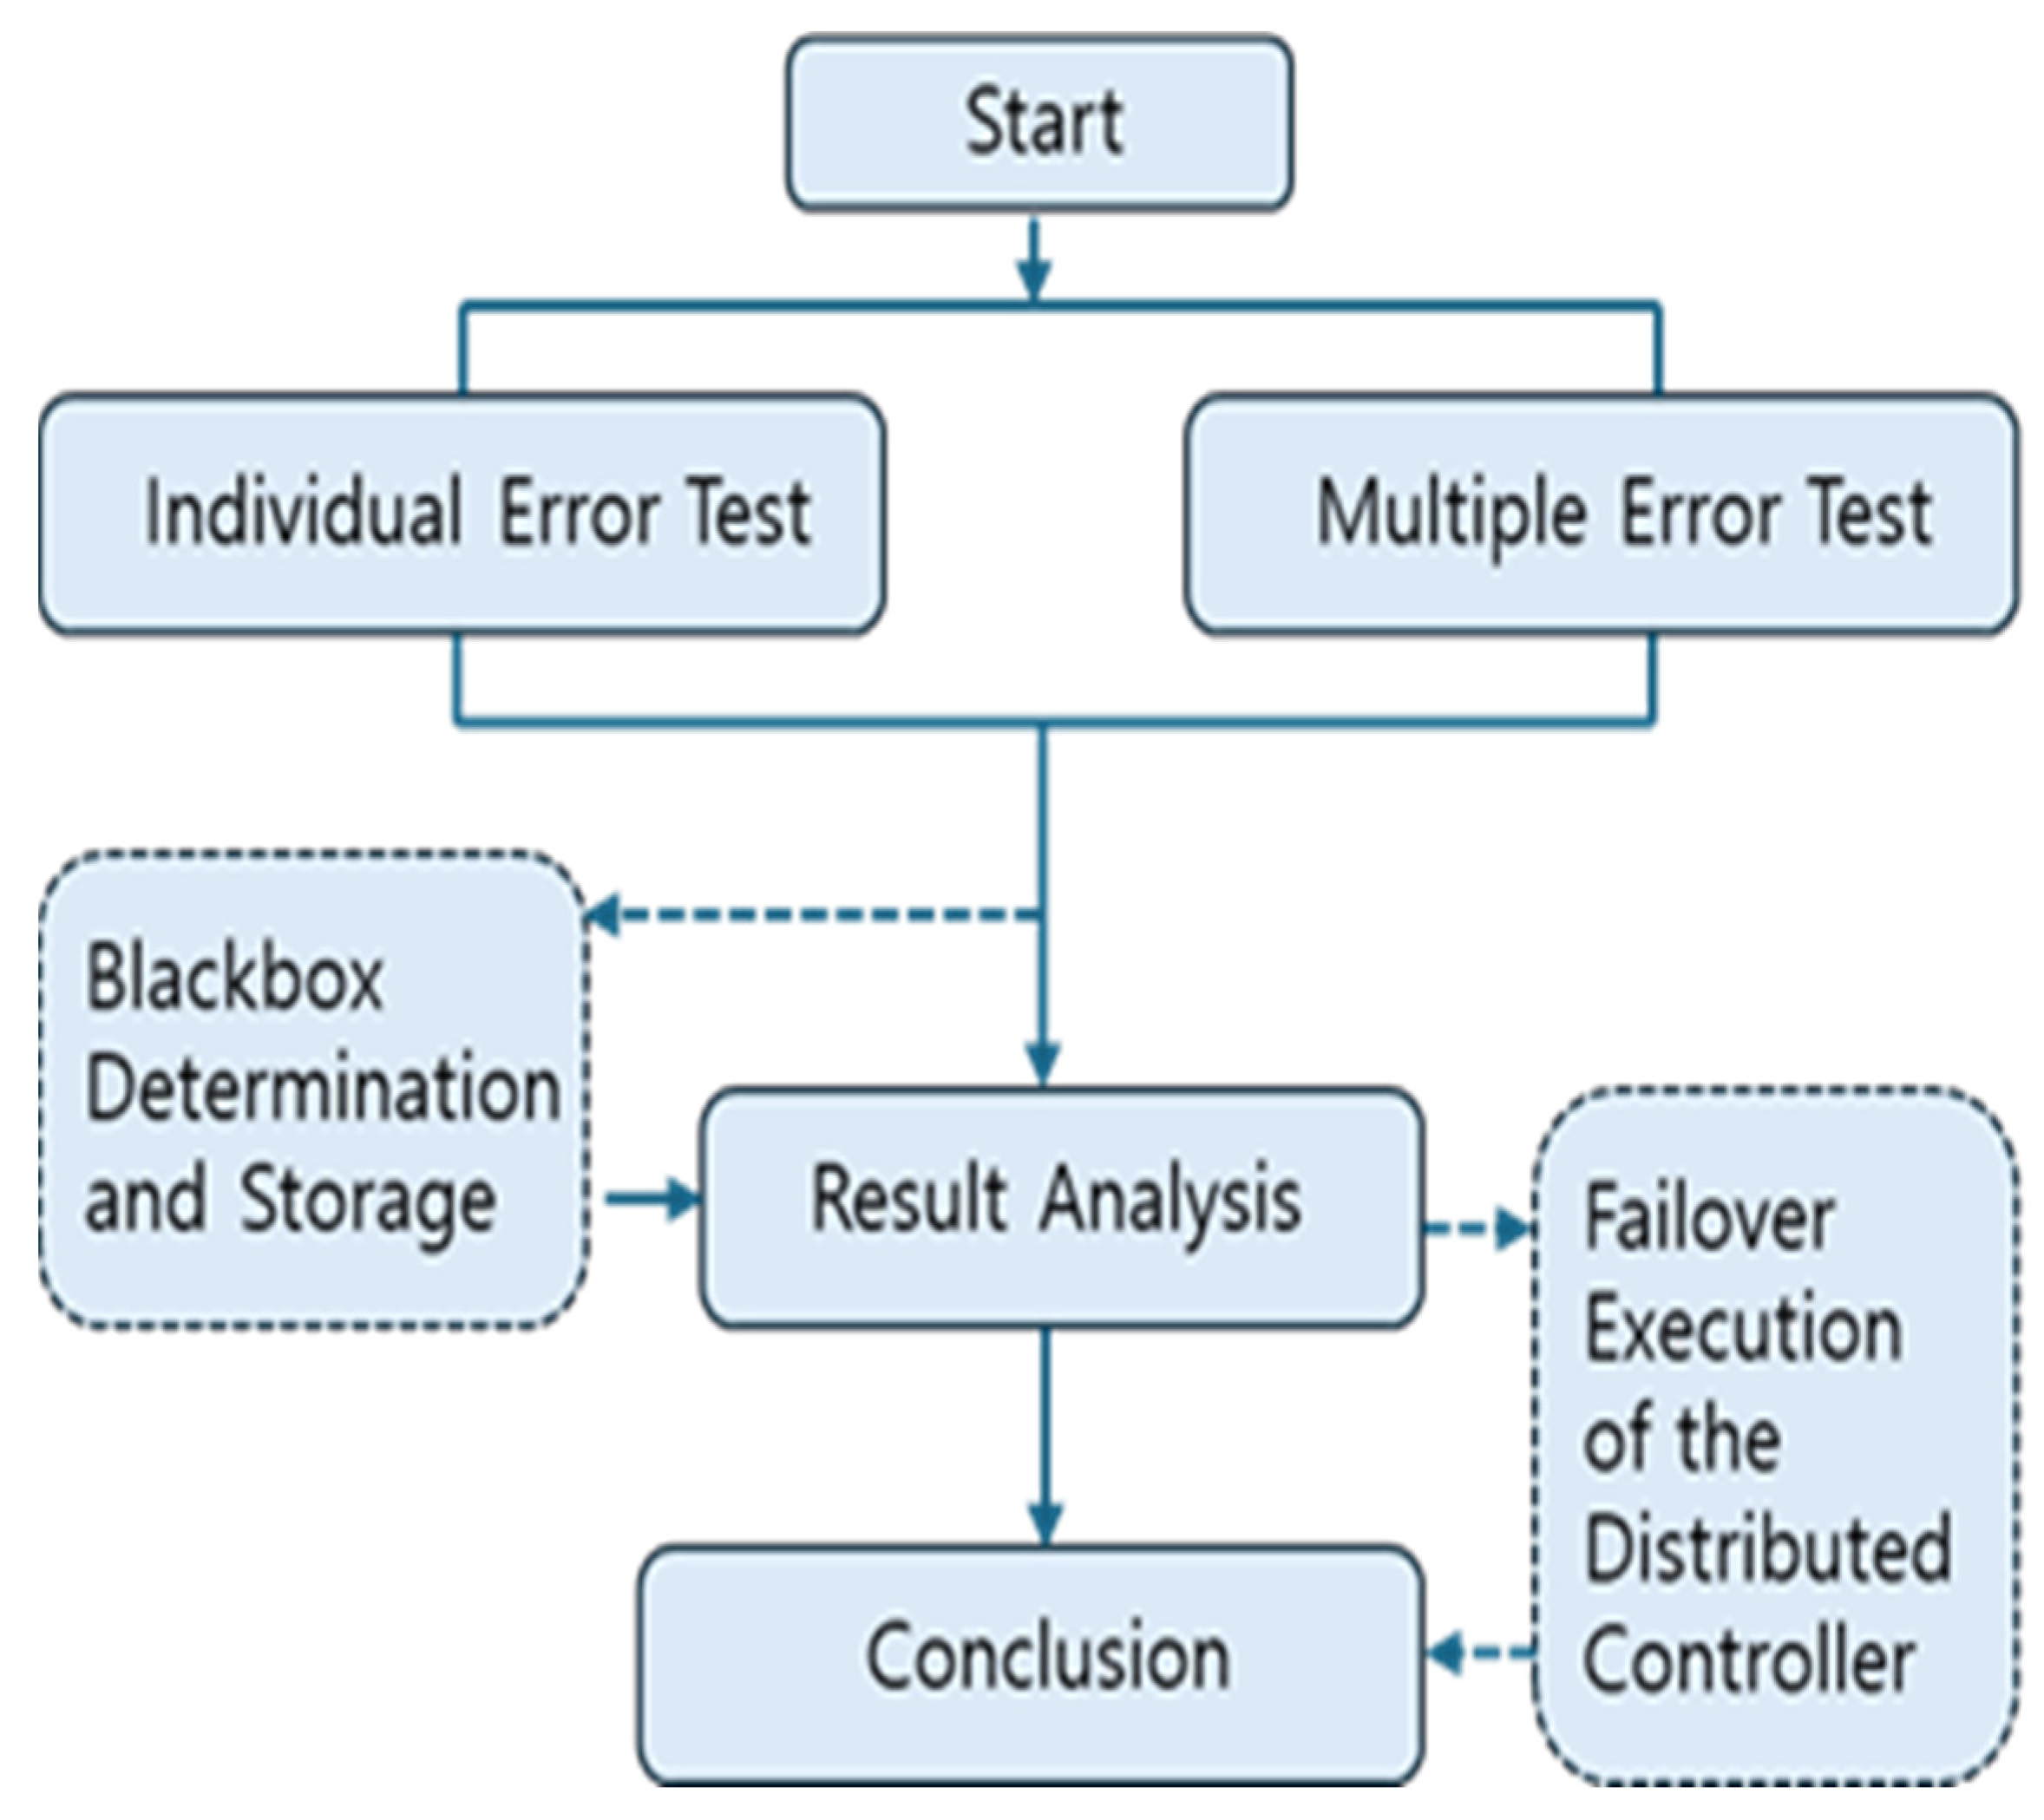
Figure 27 illustrates the procedural flowchart of the test. The experiments were divided into two scenarios:
  • Individual Error Test: verifies whether the standby distributed controller’s I/O module can successfully execute failover when a single I/O channel in the primary PLC fails.
  • Multiple Error Test: simulates simultaneous failures of multiple I/O channels in the primary PLC and evaluates whether the standby distributed controller can reliably handle them concurrently.
The procedure followed the sequence outlined in Figure 27. First, during the blackbox determination and storage step, error occurrences were recorded. Next, in the result analysis step, the experimental data were analyzed to identify anomalies. Finally, in the failover execution verification step, the actual failover behavior of the distributed controller I/O modules was validated.
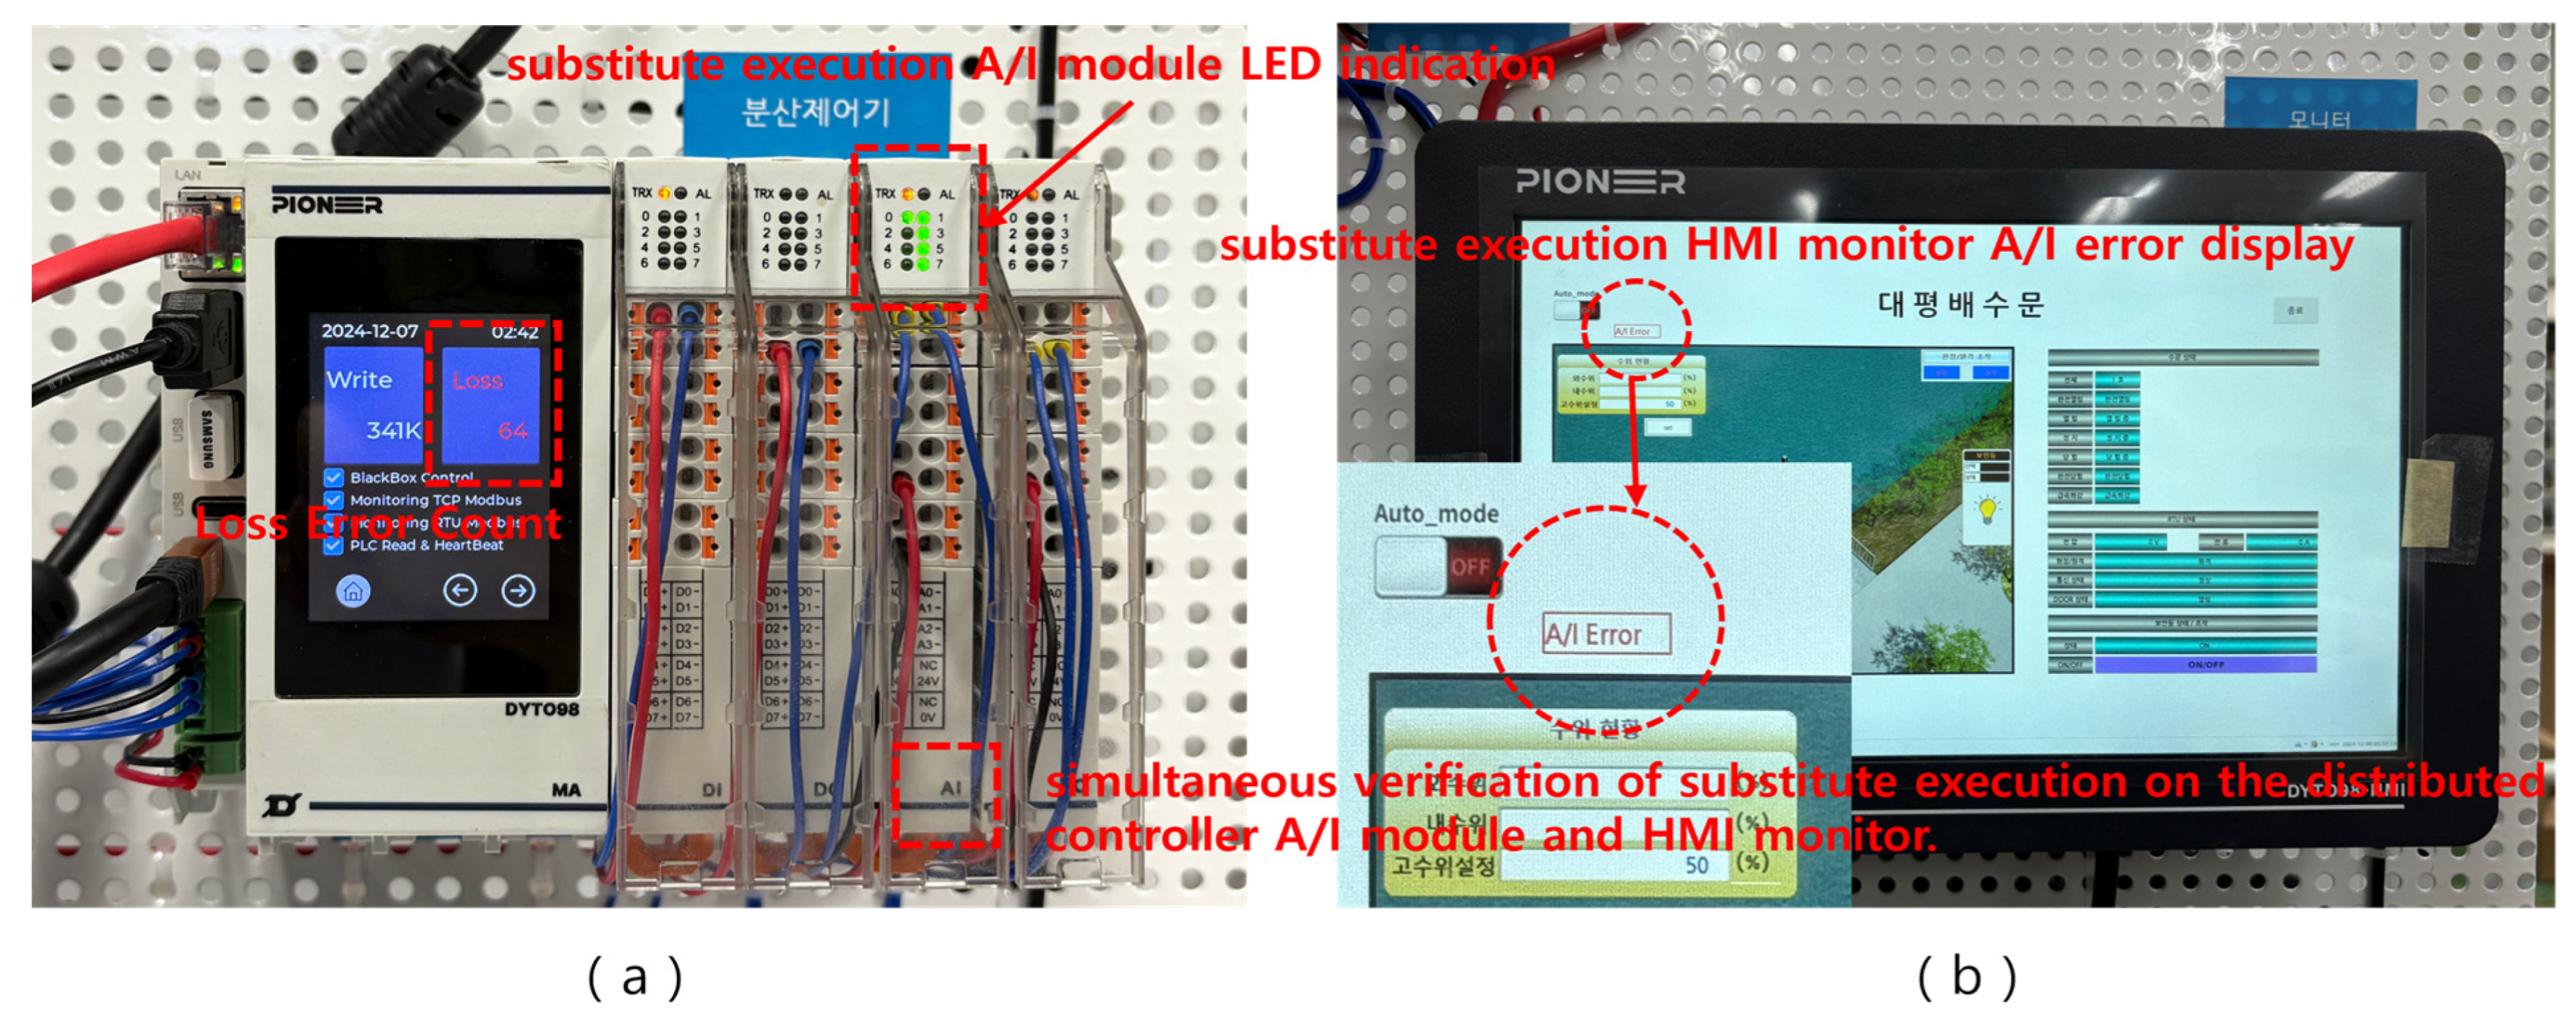
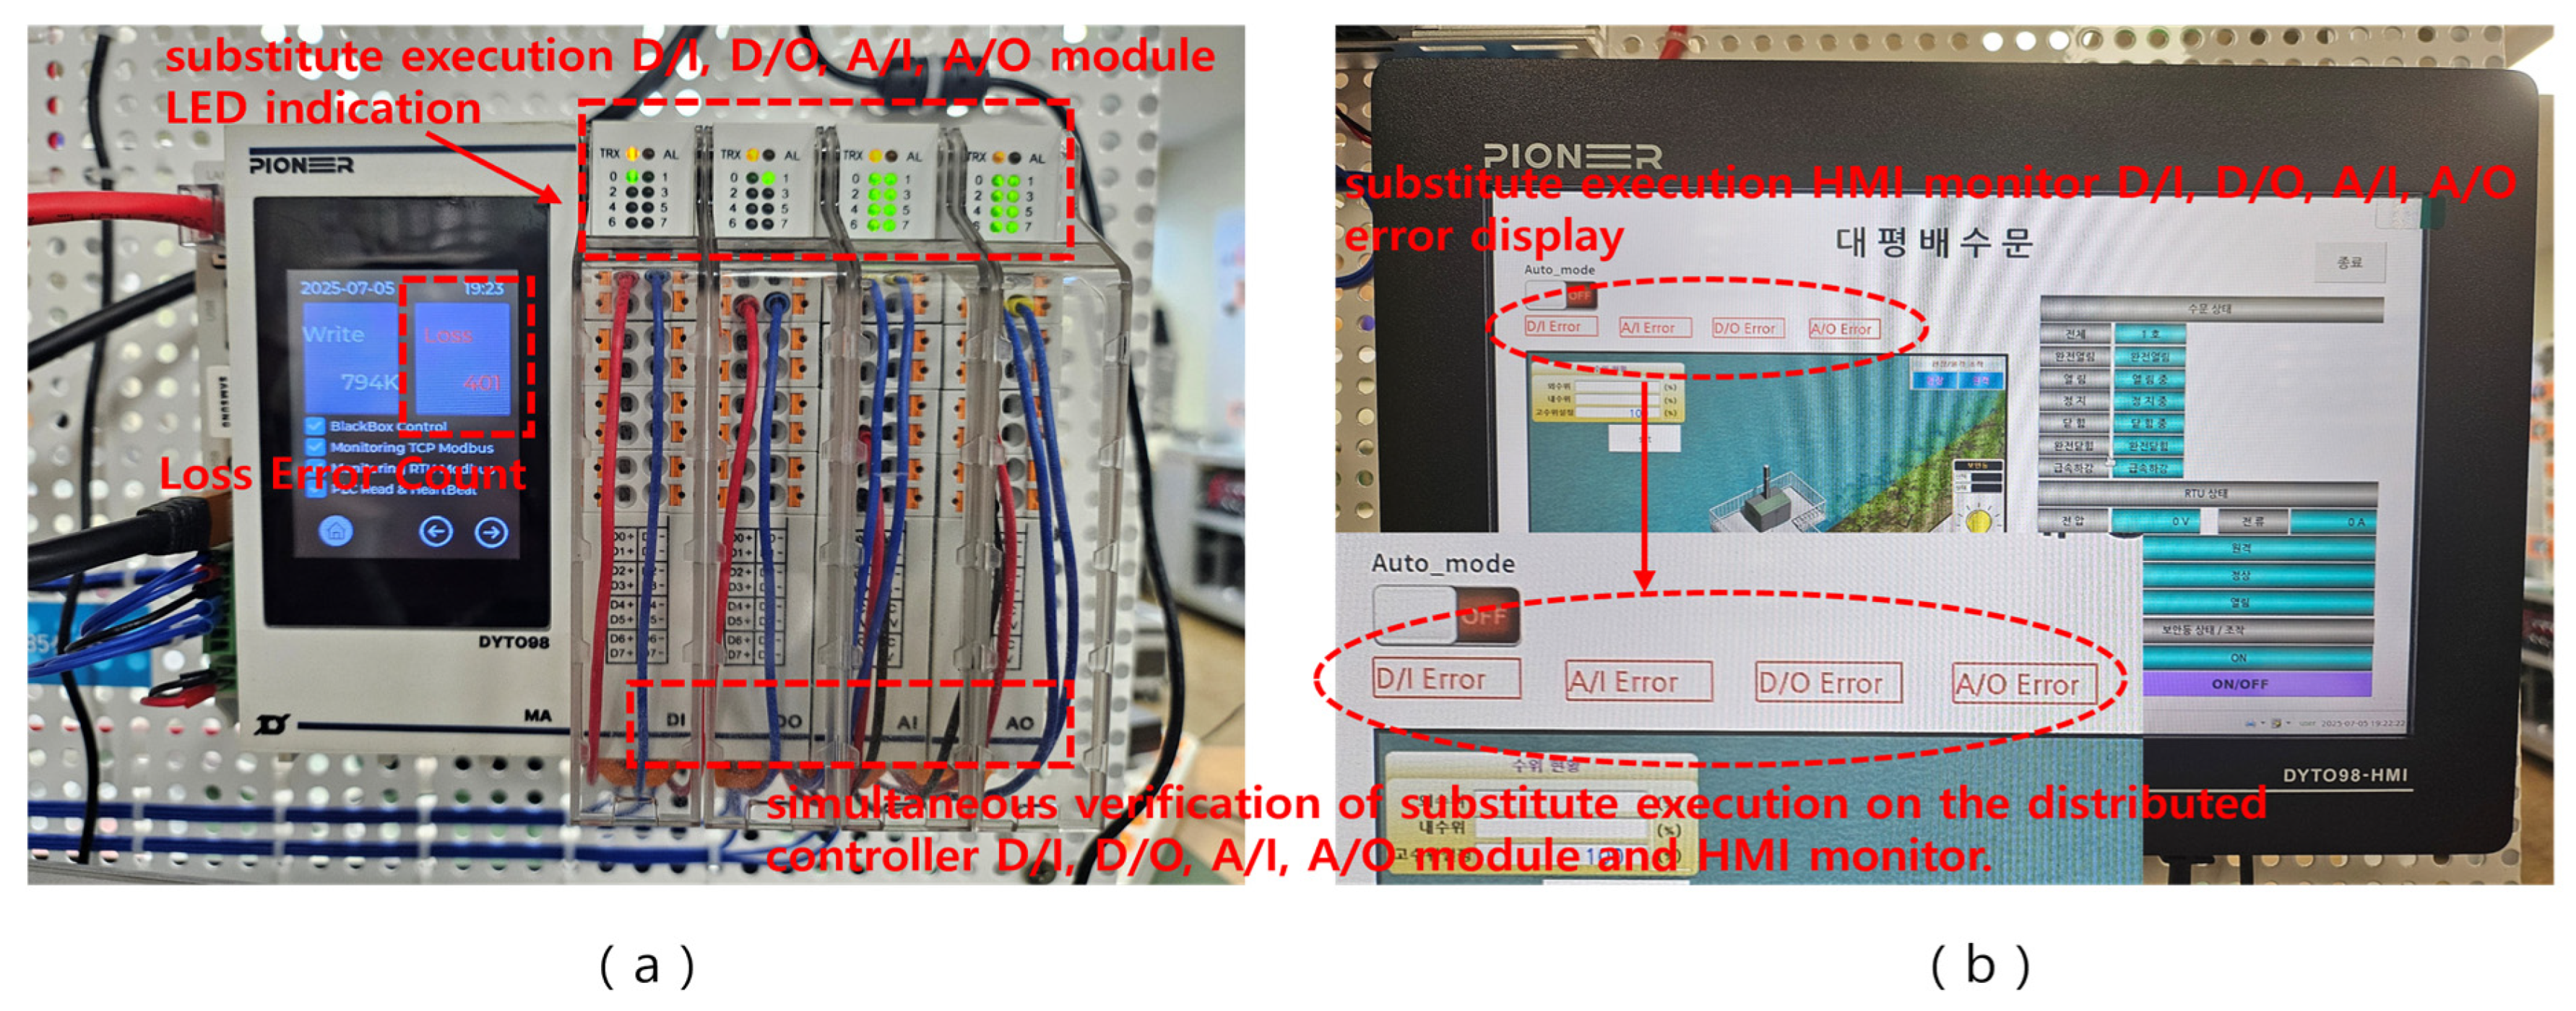
The experimental results are as follows: Figure 28 demonstrates the case where an error selectively occurred in the primary PLC A/I module. The blackbox recorded this situation by classifying it as a Loss in cases where the Write command was counted but the actual execution did not occur. In this case, the A/I module of the standby distributed controller automatically executed the failover operation, which was visually confirmed through LED indication on the module and error display on the HMI monitor.
Furthermore, as shown in Figure 29, even when multiple errors occurred simultaneously across different I/O modules, the standby distributed controller performed reliable failover execution. These error events were reflected in real-time both on the blackbox and the HMI monitor. In particular, the ID-based configuration function of the expansion modules ensured system scalability, and the experiments verified that real-time performance was maintained without degradation even under multiple error conditions.
Therefore, the proposed failover execution structure experimentally demonstrated its ability to ensure both high reliability and scalability, meeting the practical requirements of industrial applications.

5.1.4. Program Modification and Editing Test

This experiment verified that when an error occurs in the primary PLC I/O module, the standby distributed controller not only performs failover execution but also enables on-site modification and editing of ladder and HMI programs in real time. The development environment used is DYTO Studio, developed by Dong Young Tech One, which is pre-installed in the distributed controller’s internal SSD and can be executed without additional software installation.
Figure 30 illustrates the process of modifying or adding ladder logic. ① The target location is selected using a touch pen → ② the required logic symbol is chosen → ③ the logic is connected on the screen → ④ the new logic is automatically linked with subsequent elements and validated with comments → ⑤ the updated logic is applied successfully.
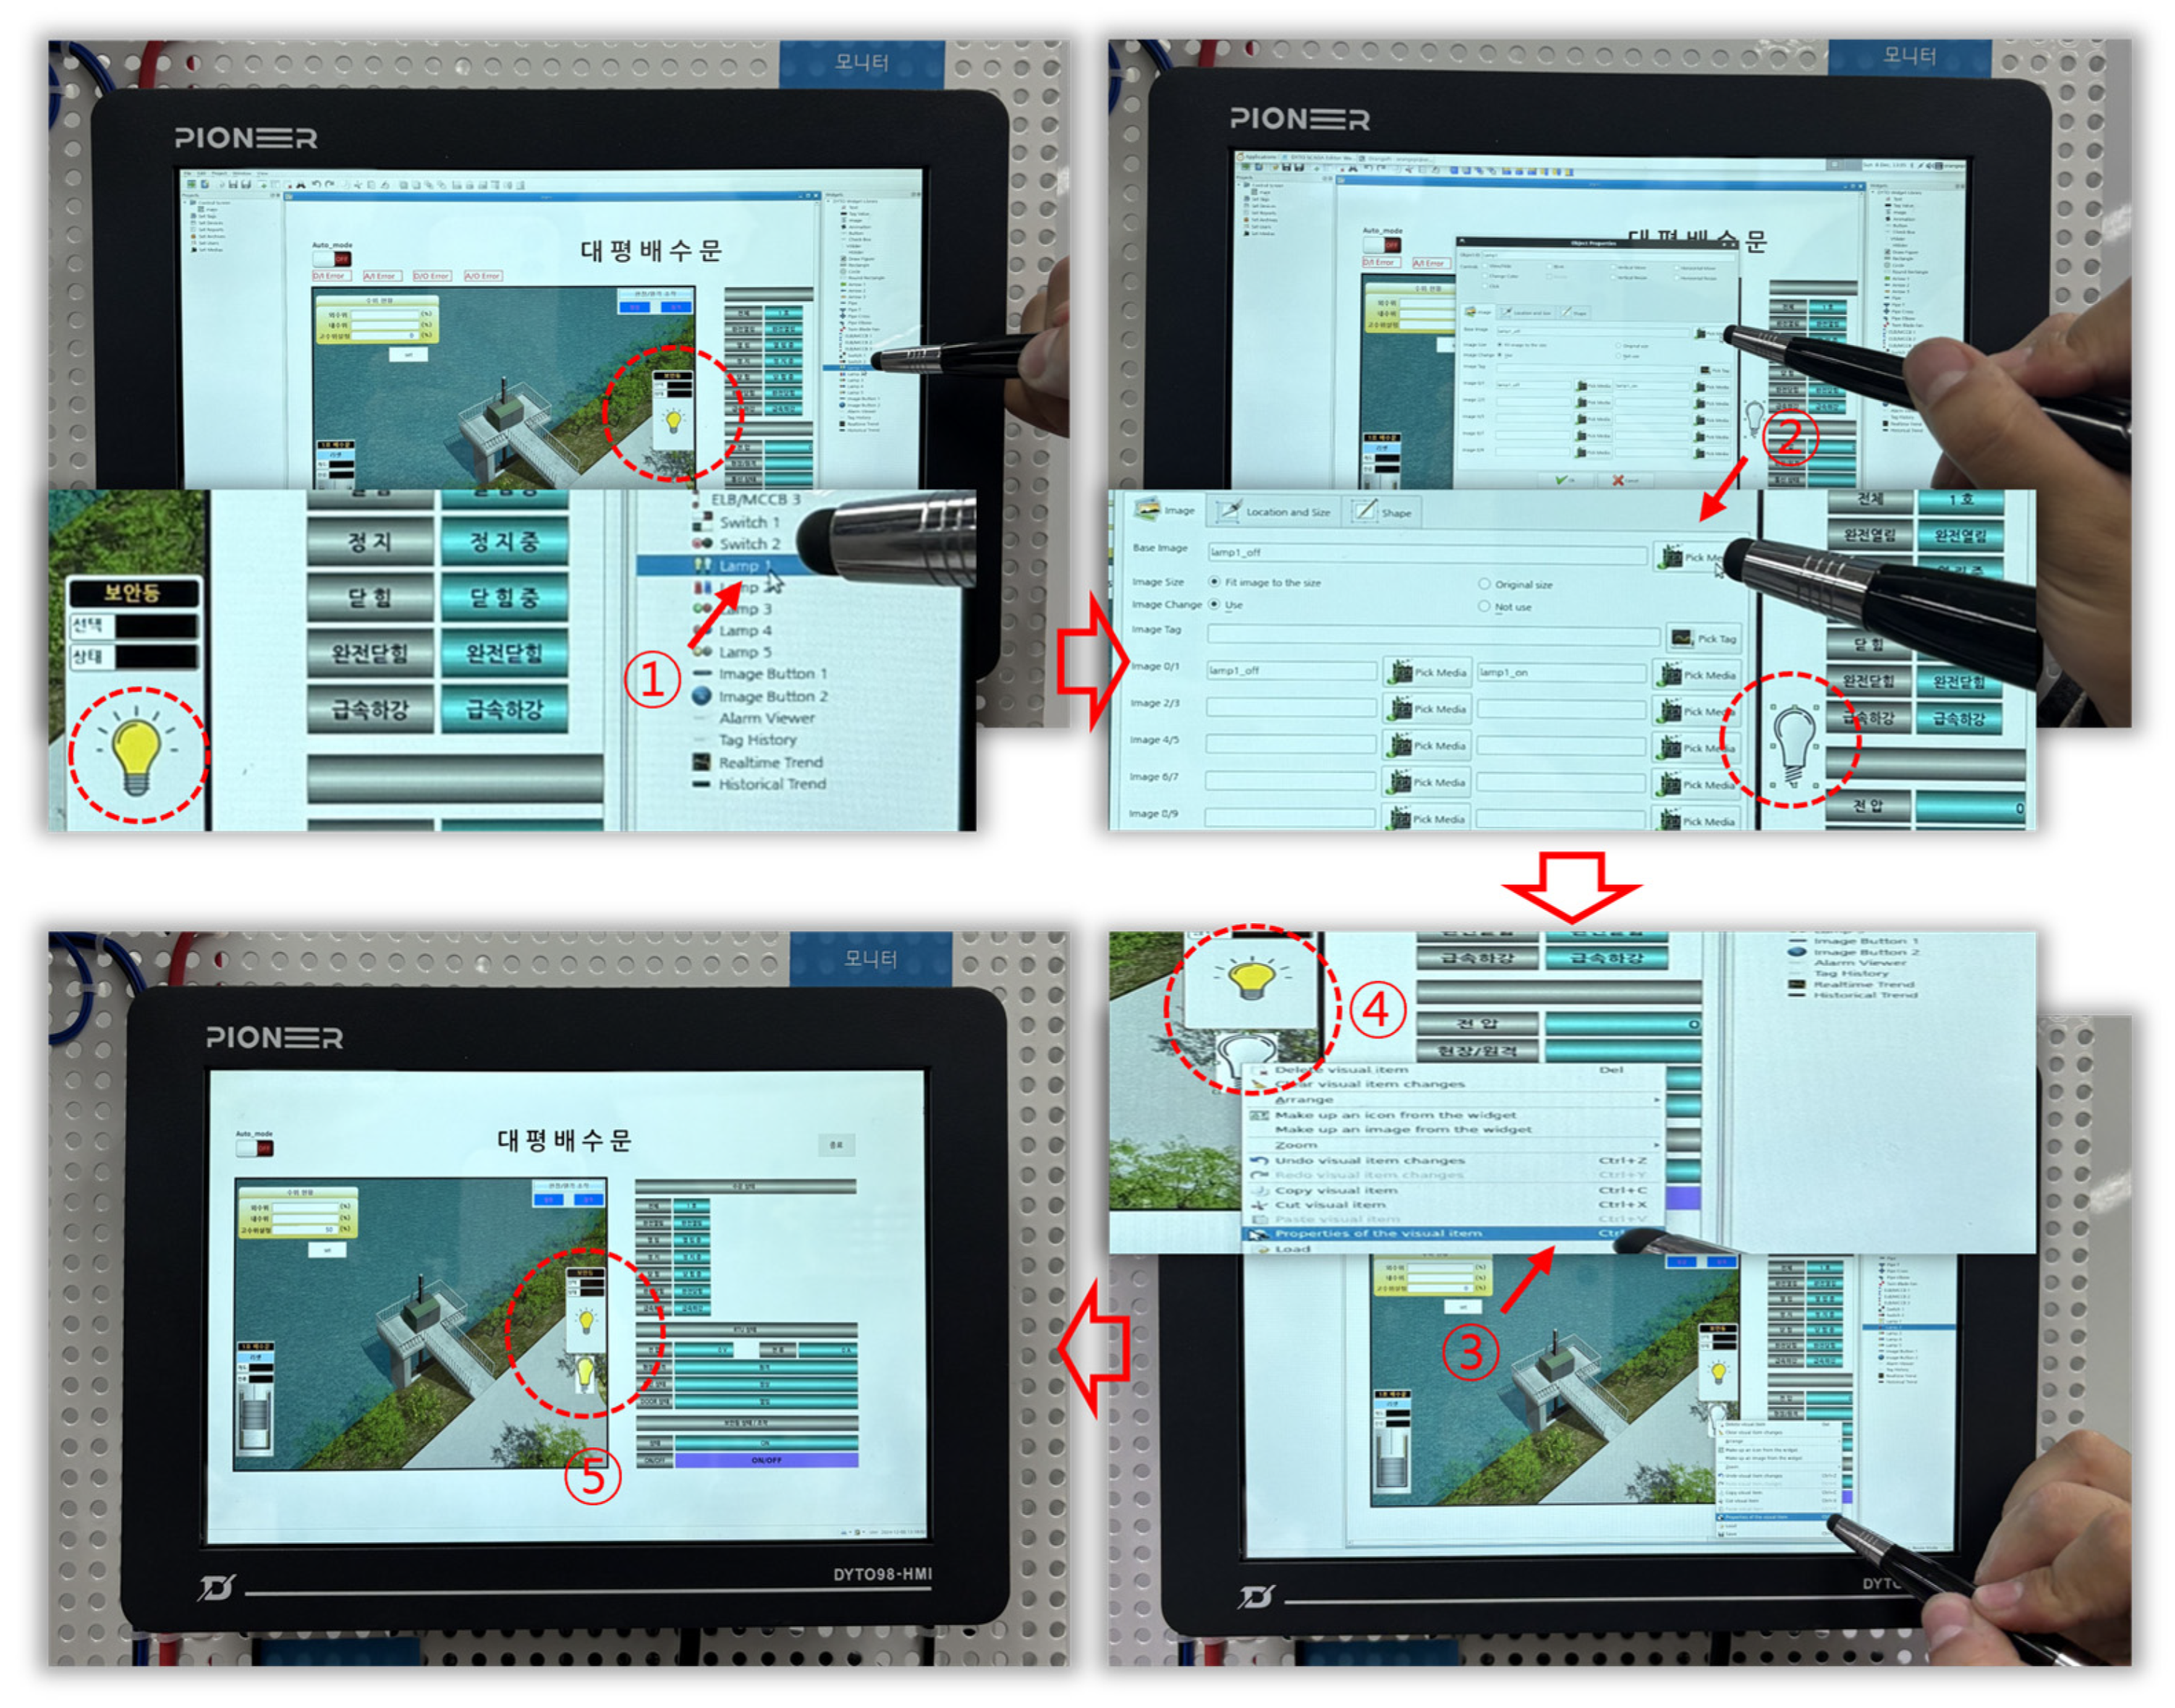
Figure 31 shows the process of HMI screen editing. ① The icon to be added is selected → ② size, color, and activation conditions are specified → ③ properties are confirmed → ④ the new icon is created → ⑤ the icon is applied and activated on the HMI screen.
Through this process, the operator can directly modify and adjust both control logic and user interfaces on the control panel. All changes are applied in real time to the standby distributed controller under failover execution. This structure ensures rapid error response and significantly improves operational convenience without requiring additional equipment or software installation.

5.2. Certification Tests by Authorized Institutions

Since the functionality and interoperability of the proposed system were thoroughly validated in Section 5.1, this section focuses on electromagnetic compatibility (EMC) and immunity (EMS) tests, which cannot be sufficiently verified by laboratory experiments alone. For this purpose, a control panel was fabricated with the same structure as the actual field system, including the primary PLC, standby distributed controller, I/O modules, blackbox, and HMI monitor. The tests were commissioned to three accredited institutions, including the Korea Testing Certification (KTC), and were conducted in compliance with the KS C9610-6-4 standard (equivalent to IEC 61000-6-4) [24,25,26,27] (Figure 32).
The main evaluation focused on electromagnetic compatibility (EMC) performance, particularly immunity and emission characteristics under AC 220 V, 60 Hz conditions.
  • Main power conducted emission test (0.15–30 MHz): The measured interference levels remained within CISPR 32 Class A limits, including peak bands at 0.5 MHz, 5 MHz, and 10 MHz.
  • Communication port conducted emission test (RS232, RS485, LAN): Both peak and average detection values satisfied the KS C9610-6-4 requirements, with no data loss or transmission errors observed.
  • Radiated emission below 1 kHz band (30 MHz–1 GHz): All results remained within CISPR 32 Class A limits, and no functional degradation was observed even at peak frequencies.
  • Radiated emission above 1 kHz band (1–6 GHz): Peak and average detection values were all below the allowable limits, verifying stable performance under high-frequency EMI conditions.
Additionally, the controller was tested against electrostatic discharge (ESD), radiated RF electromagnetic fields, electrical fast transients/bursts (EFT/Burst), surges, and conducted RF immunity. In all scenarios, the distributed controller maintained normal operation without requiring reset after the tests.
These results demonstrate that the proposed distributed controller achieves sufficient EMC robustness and reliability required for industrial applications.

5.3. Statistical Evaluation and Comparative Analysis

To strengthen the quantitative validity of the bench and field experiments presented above, additional statistical evaluations were conducted using the proposed heterogeneous redundant distributed controller. A total of 100 independent experimental trials were performed under varying load and network conditions, including induced jitter (±15 ms), packet loss (1–3%), and simultaneous multi-I/O failures.
The aggregated results are summarized in Table 5.
As shown in Figure 33, the failover-latency distribution exhibited a narrow variance band (σ = 0.12 s), indicating stable recovery performance even under network perturbations. The use of a hybrid Ethernet/serial redundancy channel contributed to consistent latency control across trials.
A histogram showing the distribution of measured failover-latency values (100 trials) is presented below. The mean latency is 2.46 s with a standard deviation of 0.12 s, illustrating consistent timing behavior.
Measurement variables included failover latency (the time between fault detection and standby takeover), detection accuracy (true positive ratio), and the false positive rate (incorrect fault classification). The measured failover latency was 2.46 ± 0.12 s, showing an 18.3% improvement over conventional PLCs (3.01 ± 0.19 s). The proposed blackbox detection achieved 97.8% accuracy with a 2.3% FPR, reducing false alarms by 61%.
In addition, Figure 34 compares the receiver-operating-characteristic (ROC) curves of the proposed system and the conventional PLC redundancy method. The proposed controller achieved an AUROC = 0.991, while the conventional system recorded AUROC = 0.924, confirming superior discriminative capability in fault detection. This quantitative and comparative validation demonstrates that the proposed architecture not only functions correctly but also delivers statistically verified performance advantages suitable for deterministic industrial environments.
Measurement variables included failover latency (the time difference between primary PLC fault detection and standby takeover), fault detection accuracy (true positive ratio of blackbox anomaly detection), and the false-positive rate (incorrect fault identification under normal conditions).

6. Conclusions

Industrial automation and water treatment control systems aim for non-stop and error-free operation based on PLCs, yet in real field environments, failures, errors, and transient anomalies in PLCs often reduce system reliability and integrity. To overcome these limitations, real-time monitoring and rapid fault response mechanisms are essential.
In this study, a blackbox-integrated standby distributed controller was designed, implemented, tested, and verified. The proposed heterogeneous redundancy architecture demonstrated the following outcomes:
  • Redundant data structure validation: implemented a port-forwarding-based configuration ensuring that the remote monitoring room, primary PLC, and standby distributed controller receive identical data.
  • Blackbox recording and display functionality: experimentally confirmed that normal data (Write) and error data (Loss) are recorded and displayed on the LCD, providing intuitive execution results.
  • Detailed log analysis: verified that execution details such as date, time, I/O information, addresses, and data logs can be stored and examined.
  • Error detection and remote verification: demonstrated that D/I, D/O, A/I, and A/O errors can be consistently identified both in the blackbox and the remote monitoring room.
  • On-site modification capability: verified that ladder logic and HMI editing can be performed directly on the local HMI monitor without additional equipment or software, ensuring rapid field response.
  • Industrial validation and patent registration: the developed system has been registered under Korean Patent No. 10-2733771 (“Logic Monitoring Blackbox-Integrated Distributed Controller”) and has been applied in real-world water treatment facilities (e.g., flood control automation systems in Jinju City and Hapcheon County), where it is currently under field operation.
Quantitatively, the proposed system achieved a mean failover latency of 2.46 ± 0.12 s, representing an 18.3% improvement compared to conventional redundant PLCs (3.01 ± 0.19 s). The overall fault-detection accuracy reached 97.8%, while the false-positive rate was reduced by 61.0% (from 5.9% to 2.3%). These results statistically validate the reliability and responsiveness of the proposed heterogeneous redundancy approach.
Furthermore, stability during network jitter and multi-hop switching was confirmed through latency variance analysis (σ = 0.12 s), and operational convenience was verified by on-site logic and HMI modification with zero downtime. Such quantitative evidence demonstrates that the system not only functions as designed but also ensures measurable improvements in reliability, stability, and operational usability.
The proposed system thus overcomes the limitations of conventional homogeneous PLC redundancy, such as structural complexity, vendor dependency, and delayed fault diagnosis. The Linux-based distributed controller provides intuitive error logging and visualization, I/O failover execution, and on-site programmability, thereby experimentally demonstrating its ability to ensure reliability, stability, and operational convenience required in industrial environments.
Future work will expand error detection beyond D/I, D/O, A/I, and A/O to include parameters such as resistance, temperature, pressure, and communication data, thereby developing a next-generation blackbox-integrated distributed control system capable of comprehensive monitoring.
Quantitatively, the proposed system achieved a mean failover latency of 2.46 ± 0.12 s, detection accuracy of 97.8%, and a 61% reduction in the false-positive rate compared with conventional PLCs. These results provide measurable evidence of improved reliability, stability, and operational convenience.

Author Contributions

Conceptualization, C.K.R. and M.C.L.; Methodology, M.C.L., C.K.R. and J.H.P.; Software, I.H.H. and J.H.P.; UI Design, J.D.L. and S.Y.C.; Validation, C.K.R., M.C.L. and I.H.H.; Writing, C.K.R. and M.C.L.; Project Administration, C.K.R. and M.C.L.; Funding Acquisition, C.K.R., I.H.H., J.D.L. and S.Y.C. All authors have read and agreed to the published version of the manuscript.

Funding

This research was supported by the project of Dong Young Tech One Co., Ltd., titled “Logic Monitoring Blackbox-Integrated Distributed Control and Instrumentation Device for Heterogeneous PLC Configuration in Water Treatment” (Project No.: DY-PLC-DYTO98).

Data Availability Statement

The original contributions presented in this study are included in the article. Further inquiries can be directed to the corresponding author.

Acknowledgments

The authors would like to express their sincere gratitude to Dong Young Tech One Co., Ltd., for supporting this research. Furthermore, the developed system has undergone verification and certification procedures, confirming its potential for industrial application.

Conflicts of Interest

Authors In Ho Hong, Jun Hyuk Park, Jae Deuk Lee and Su Yeon Choi were employed by the company Dong Young Tech One Co., Ltd. The remaining authors declare that the research was conducted in the absence of any commercial or financial relationships that could be construed as a potential conflict of interest.

References

  1. Empowered Automation. Understanding Automation PLC: A Comprehensive Guide. Available online: https://www.empoweredautomation.com/understanding-automation-plc-a-comprehensive-guide?utm_source (accessed on 10 April 2025).
  2. Zhang, H. Optimization and Innovation of Industrial Control Systems Based on PLC. Int. J. Res. Pract. Robot. 2024, 3, 45–74. [Google Scholar]
  3. Alphonsus, E.R.; Abdullah, M.O. A Review on the Applications of Programmable Logic Controllers (PLCs). Renew. Sustain. Energy Rev. 2016, 60, 1185–1205. [Google Scholar] [CrossRef]
  4. Market Research Future. Programmable Logic Controller (PLC) Market Research Report—Forecast 2025 to 2030; Market Research Future: Pune, India, 2024. [Google Scholar]
  5. Allied Market Research. Global Programmable Logic Controller (PLC) Market Size, Share & Forecast 2024–2034; Allied Market Research: Portland, OR, USA, 2024. [Google Scholar]
  6. Doe, J. Trends in Industrial Automation and PLC Redundancy. Int. J. Autom. Eng. 2023, 15, 101–112. [Google Scholar]
  7. Siemens, A.G. Redundant PLC System Design Manual; Siemens Technical Documentation: Nuremberg, Germany, 2022. [Google Scholar]
  8. Rockwell Automation. ControlLogix Redundancy System Reference Manual; Rockwell Automation: Milwaukee, WI, USA, 2021. [Google Scholar]
  9. Lee, K.; Park, H. Triple Modular Redundancy in PLC Systems for Critical Industrial Applications. IEEE Trans. Ind. Electron. 2022, 69, 8123–8132. [Google Scholar]
  10. Smith, M. Virtual PLCs for Flexible and Secure Automation. J. Ind. Control Syst. 2023, 10, 55–67. [Google Scholar]
  11. IEC 61508; Functional Safety of Electrical/Electronic/Programmable Electronic Safety-Related Systems. International Electrotechnical Commission: Geneva, Switzerland, 2010.
  12. Dong Young Tech One (DYTO). DYTO Studio Program Manual; Internal Technical Documentation: Busan, Republic of Korea, 2023. [Google Scholar]
  13. Ogata, K. Modern Control Engineering, 5th ed.; Prentice Hall: Upper Saddle River, NJ, USA, 2010; pp. 1–968. [Google Scholar]
  14. Lee, J.; Kim, H. Design of Industrial PC-Based Control Systems for Flexible Manufacturing. J. Ind. Autom. 2022, 32, 215–227. [Google Scholar]
  15. Park, S.; Choi, Y. Analysis of PLC–HMI Integration for Smart Factory Applications. IEEE Access 2021, 9, 120351–120364. [Google Scholar]
  16. NIST. Reliability Block Diagram (RBD) Overview; National Institute of Standards and Technology: Gaithersburg, MD, USA, 2021. Available online: https://www.nist.gov (accessed on 27 September 2025).
  17. IEC 61078; Analysis Techniques for Dependability—Reliability Block Diagrams (RBD). International Electrotechnical Commission: Geneva, Switzerland, 2016.
  18. ReliaSoft. Reliability Block Diagrams (RBDs) Tutorial; ReliaSoft/Weibull.com: Tucson, AZ, USA, 2020; Available online: https://www.weibull.com (accessed on 27 September 2025).
  19. Rausand, M.; Høyland, A. System Reliability Theory: Models, Statistical Methods, and Applications, 2nd ed.; Wiley: Hoboken, NJ, USA, 2004. [Google Scholar]
  20. Ebeling, C.E. An Introduction to Reliability and Maintainability Engineering; McGraw-Hill: New York, NY, USA, 1997. [Google Scholar]
  21. Trivedi, K.S. Probability and Statistics with Reliability, Queuing, and Computer Science Applications, 2nd ed.; Wiley: Hoboken, NJ, USA, 2016. [Google Scholar]
  22. Shooman, M.L. Reliability of Computer Systems and Networks; Wiley: Hoboken, NJ, USA, 2002. [Google Scholar]
  23. Lala, P.K. Fault-Tolerant Systems; Morgan Kaufmann: San Francisco, CA, USA, 2001. [Google Scholar]
  24. Standard Bank Co., Ltd. Test Report for Electromagnetic Compatibility of Logic Monitoring Blackbox-Embedded Distributed Controller for Broadcasting and Communication Equipment; Test Report No. E25KR-0309; Standard Bank Co., Ltd.: Shanghai, China, 6 February 2025. (In Korea) [Google Scholar]
  25. WonTech Co., Ltd. Electromagnetic Compatibility Test Report for Logic Monitoring Blackbox-Embedded Distributed Instrumentation and Control Device; Test Report No. OT-252-RED-023; WonTech Co., Ltd.: Shenzhen, China, 5 February 2025. (In Korea) [Google Scholar]
  26. Korea Testing Certification Institute (KTC). Q-Mark Test Report for Instrumentation Control Device; Test Report No. GT2025-00742; Korea Testing Certification Institute (KTC): Gunpo, Republic of Korea, 20 January 2025. (In Korean) [Google Scholar]
  27. Korea Testing Certification Institute (KTC). Test Report for Logic Monitoring Blackbox-Embedded Distributed Instrumentation and Control Device for Water Treatment; Test Report No. 2025-00068; Korea Testing Certification Institute (KTC): Gunpo, Republic of Korea, 6 January 2025. (In Korean) [Google Scholar]
  28. Cisco Systems. Configuring SPAN and RSPAN: Port Mirroring in Ethernet Switches; Cisco Networking Documentation: San Jose, CA, USA, 2022; Available online: https://www.cisco.com (accessed on 12 April 2025).
  29. Rockwell Automation. EtherNet/IP Networks Design Guide; Publication ENET-RM002; Rockwell Automation: Milwaukee, WI, USA, 2023. [Google Scholar]
  30. Netfilter.org. Netfilter/Iptables Documentation; Linux Foundation: San Francisco, CA, USA, 2022; Available online: https://netfilter.org (accessed on 12 April 2025).
  31. Kim, S.; Lee, J.; Park, Y. A Redundancy-Based Reliability Model for Industrial Control Systems. Reliab. Eng. Syst. Saf. 2020, 197, 106803. [Google Scholar]
  32. Smith, D.J. Reliability, Maintainability and Risk: Practical Methods for Engineers, 9th ed.; Butterworth-Heinemann: Oxford, UK, 2017. [Google Scholar]
  33. Gustafson, J.L. Reevaluating Amdahl’s Law. Commun. ACM 1988, 31, 532–533. [Google Scholar] [CrossRef]
  34. Proakis, J.G.; Salehi, M. Digital Communications, 5th ed.; McGraw-Hill: New York, NY, USA, 2007. [Google Scholar]
  35. Sklar, B. Digital Communications: Fundamentals and Applications, 2nd ed.; Prentice Hall: Upper Saddle River, NJ, USA, 2001. [Google Scholar]
  36. Isermann, R. Fault-Diagnosis Systems: An Introduction from Fault Detection to Fault Tolerance; Springer: Berlin/Heidelberg, Germany, 2006. [Google Scholar]
  37. Zio, E. An Introduction to the Basics of Reliability and Risk Analysis; World Scientific: Singapore, 2007. [Google Scholar]
  38. Iung, B.; Levrat, E. Advanced Maintenance Services for Promoting Sustainability. Procedia CIRP 2014, 22, 15–22. [Google Scholar] [CrossRef]
  39. Kim, S.; Lee, J. Reliability Modeling of Redundant PLC I/O Modules for Industrial Automation. IEEE Trans. Ind. Electron. 2020, 67, 4813–4824. [Google Scholar]
  40. Lyu, M.R. Handbook of Software Reliability Engineering; McGraw-Hill: New York, NY, USA, 1995. [Google Scholar]
  41. Tanenbaum, A.S.; Van Steen, M. Distributed Systems: Principles and Paradigms; Pearson Prentice Hall: Upper Saddle River, NJ, USA, 2007. [Google Scholar]
  42. Hwang, I.; Kim, S.; Kim, Y.; Seah, C.E. A Survey of Fault Detection, Isolation, and Reconfiguration Methods. IEEE Trans. Control Syst. Technol. 2010, 18, 636–653. [Google Scholar] [CrossRef]
  43. Hall, S.H.; Hall, G.W.; McCall, J.A. High-Speed Digital System Design: A Handbook of Interconnect Theory and Design Practices; Wiley: Hoboken, NJ, USA, 2000. [Google Scholar]
  44. IEC 61131-2; Programmable Controllers—Equipment Requirements and Tests. International Electrotechnical Commission: Geneva, Switzerland, 2007.
  45. Liu, J.; Zhang, W. Application of Moving Average Filtering in Industrial Signal Processing. Int. J. Signal Process. Image Process. Pattern Recognit. 2016, 9, 101–112. [Google Scholar]
  46. Peng, Y.; Dong, M.; Zuo, M.J. Current Status of Machine Prognostics in Condition-Based Maintenance: A Review. Int. J. Adv. Manuf. Technol. 2010, 50, 297–313. [Google Scholar] [CrossRef]
  47. IEC 61511; Functional Safety—Safety Instrumented Systems for the Process Industry Sector. International Electrotechnical Commission: Geneva, Switzerland, 2016.
Figure 1. Hardware and Software Configuration of Heterogeneous PLCs.
Electronics 14 04359 g001
Figure 2. Reliability Comparison of PLC Redundancy Configurations.
Electronics 14 04359 g002
Figure 3. Structure in which raw data are port-forwarded to the primary PLC and port-mirrored to the standby distributed controller in a heterogeneous PLC redundancy system.
Electronics 14 04359 g003
Figure 4. Structure of the DYTO Studio Program.
Electronics 14 04359 g004
Figure 5. Interface editing process using Qt Designer for DYTO Studio. * represents various file names, indicating that the file extensions may include .ui or different file names ending with .cpp or .h.
Electronics 14 04359 g005
Figure 6. Interface structure of blackbox components for fault discrimination.
Electronics 14 04359 g006
Figure 7. Blackbox configuration tool.
Electronics 14 04359 g007
Figure 8. Concept of loss detection timeout.
Electronics 14 04359 g008
Figure 9. (a) ROC Curve for Loss Detection Threshold Analysis (b) Precision–Recall Curve under Varying T_SET Values.
Electronics 14 04359 g009
Figure 10. External Design of the Distributed Control Unit.
Electronics 14 04359 g010
Figure 11. Block Diagram of the Standby Distributed Controller.
Electronics 14 04359 g011
Figure 12. (a) Performance Limitation by Serial CPU Ratio Based on Gustafson’s Law; (b) Performance Improvement Curve by Number of Parallel I/O Modules Based on Gustafson’s Law.
Electronics 14 04359 g012
Figure 13. Performance metrics of redundant PLC I/O modules: (a) Signal Integrity, (b) Error Detection, (c) Synchronization Check.
Electronics 14 04359 g013
Figure 14. Simulation graph of D/O Fast Failover.
Electronics 14 04359 g014
Figure 15. Simulation graph of D/O Nominal Failover.
Electronics 14 04359 g015
Figure 16. Simulation graph of D/O Conservative Failover.
Electronics 14 04359 g016
Figure 17. Comparison of analog input signals in redundant PLCs: (top) primary and standby signals with noise, (middle) error percentage with and without filtering, (bottom) effect of moving average filtering.
Electronics 14 04359 g017
Figure 18. Conflict case in redundant A/O environment (without gating/flag).
Electronics 14 04359 g018
Figure 19. Safe failover case in redundant A/O environment (with gating + flag).
Electronics 14 04359 g019
Figure 20. (a) Distributed controller integrated with black-box and I/O modules. (b) HMI monitor for editing and monitoring ladder and HMI programs.
Electronics 14 04359 g020
Figure 21. Configuration of the Black Box-Embedded Distributed Controller and HMI Monitor.
Electronics 14 04359 g021
Figure 22. (a) Black-box configuration screen, (b) execution counts of Write (normal data) and occurrence counts of Loss (errors where commands were received but not executed), (c) detailed view of individual Loss events.
Electronics 14 04359 g022
Figure 23. (a) Hardware implementation of D/I module. (b) Hardware implementation of D/O module. (c) Hardware implementation of A/I module. (d) Hardware implementation of A/O module.
Electronics 14 04359 g023
Figure 24. Experimental Bed for Heterogeneous Redundant Distributed Controller.
Electronics 14 04359 g024
Figure 25. Command Data Synchronization Experiment.
Electronics 14 04359 g025
Figure 26. Black-Box Data Determination Experiment.
Electronics 14 04359 g026
Figure 27. Step-by-step flowchart for the failover execution and error notification test.
Electronics 14 04359 g027
Figure 28. Results of the individual error test: (a) Blackbox determination results (Write/Loss record) for an error in the primary PLC A/I module, (b) LED indication of the standby controller’s A/I module and error display on the HMI monitor.
Electronics 14 04359 g028
Figure 29. Results of the multiple error test: (a) Blackbox determination results (Write/Loss record) for simultaneous errors in the primary PLC D/I, D/O, A/I, and A/O modules, (b) LED indications of the standby controller’s I/O modules and error display on the HMI monitor.
Electronics 14 04359 g029
Figure 30. Process of ladder logic modification and addition: ① Selection of logic location → ② Symbol selection → ③ Logic connection → ④ Validation comments generated → ⑤ Final logic applied.
Electronics 14 04359 g030
Figure 31. Process of HMI screen editing: ① Icon selection → ② Input of size, color, and activation conditions → ③ Property confirmation → ④ Icon creation → ⑤ Application and activation on the HMI screen.
Electronics 14 04359 g031
Figure 32. Field control panel used for accredited testing. (a) EMC test scene, (b) Internal configuration of the implemented control panel including primary PLC, standby distributed controller, blackbox, HMI monitor, and I/O modules.
Electronics 14 04359 g032
Figure 33. Failover Latency Distribution.
Electronics 14 04359 g033
Figure 34. Comparative ROC Curve.
Electronics 14 04359 g034
Table 1. Quantitative comparison of representative PLC redundancy architectures.
Redundancy
Type
Fault
Coverage (c)
Switchover
Latency
Implementation Cost
(Relative)
Reference
Isomorphic
Redundancy
0.93–0.9680–100 msHighIEC 61508 [11]
Virtual PLC0.90–0.9460–70 msMediumControl Eng. Practice (2023) [10]
Triple-Mode
Redundancy
0.95–0.9745–60 msHighIEEE Trans. Ind. Informat. (2022) [9]
Proposed Heterogeneous Redundancy0.9841 msMediumThis Work
Table 2. Components of the Distributed Controller with Embedded Blackbox.
NoNameProduct Specifications
1Main UnitMain CPU Board (Black Box LCD)/Fan Board/I2C Interface Board
2Communication Board (LAN, HDMI, USB 2.0, USB 3.0, USB Type-C)
Connection Terminal: (RS232, RS485, DC24V)
3
4D/I ModuleD/I CPU Board, 8 Ports/DC24V Input (Sink Source Type)
5D/O ModuleD/O CPU Board, 8-Port Relay Output (0.5 A)
6A/I ModuleA/I CPU Board, 4-Port/4–20 mA Input
7A/O ModuleA/O CPU Board, 4-Port/4–20 mA Output
Table 3. Names and Functions of the Distributed Controller and HMI Monitor.
ComponentFunctionDescription
HMI MonitorReal-time monitoring
and editing
Provides logic and HMI visualization; supports on-site editing via external display
I/O Modules
(D/I, D/O, A/I, A/O)
Redundant
execution
TBUS and I2C based modular expansion; executes I/O replacement during PLC faults
2.4-inch LCD
(Blackbox display)
Data indicationDisplays real-time status of normal and error data on the front panel
LAN PortRemote
communication
Ensures real-time connection with the remote monitoring room
HDMI PortScreen transmissionSends graphical interface to the HMI monitor
USB PortTouchscreen inputAllows for interactive control and editing
RS485/RS232 PortsExecution data
monitoring
Monitors execution data from the primary PLC
and provides it to the black-box
Table 4. Experimental Procedures of the Heterogeneous Redundant Distributed Controller.
ExperimentDetailed Description
Command Data Synchronization TestObjectiveTo verify that critical command and event data transmitted from the remote monitoring
control room can be simultaneously delivered to both the primary PLC and the
standby distributed controller.
MethodCommand data transmitted from the remote-control PC are forwarded through the LAN port
to a switching hub and then IP-mirrored to both the primary PLC and the
standby distributed controller.
Verification
Items
Confirm that both controllers receive identical input data simultaneously, ensuring proper
redundancy and synchronization.
Black-Box Data Discrimination TestObjectiveTo test whether the black box correctly monitors and classifies the execution results of the
primary PLC.
MethodWhen important command or event data are transmitted, the primary PLC drives the I/O, and the results are sent to the standby distributed controller via RS485. The black box records the
execution status.
Verification
Items
Verify that normal execution results are categorized under the Write item and error results are recorded under the Loss item. Confirm that detailed error information is accessible from the
black box.
Substitute
Execution and Error
Notification Test
ObjectiveTo verify whether the standby distributed controller can immediately perform substitute
execution and notify errors in the event of a primary PLC I/O fault.
MethodAn intentional error is induced to prevent the primary PLC from operating the external device.
Verification
Items
Confirm that the standby controller immediately executes the corresponding I/O and that errors are displayed in red on the remote monitoring PC and HMI monitor via RS232 and
HDMI interfaces.
Program
Modification and Editing Test
ObjectiveTo verify whether operators can immediately modify and edit programs on-site in case of errors.
MethodLadder and HMI programs are modified and edited through the HMI monitor’s touchscreen.
The HDMI port is used for screen transmission, and the USB port is used for the touch interface.
Verification
Items
Confirm that operators can edit programs in real time during error situations.
Table 5. Quantitative Performance Comparison between Proposed and Conventional Systems.
MetricProposed System
(Mean ± SD)
Conventional Redundant PLCImprovement
Failover Latency (s)2.46 ± 0.123.01 ± 0.19−18.3%
Fault Detection Accuracy (%)97.8 ± 0.786.9 ± 1.2+12.5%
False Positive Rate (%)2.3 ± 0.55.9 ± 0.8−61.0%
Disclaimer/Publisher’s Note: The statements, opinions and data contained in all publications are solely those of the individual author(s) and contributor(s) and not of MDPI and/or the editor(s). MDPI and/or the editor(s) disclaim responsibility for any injury to people or property resulting from any ideas, methods, instructions or products referred to in the content.