Article

Adaptive Deep Belief Networks and LightGBM-Based Hybrid Fault Diagnostics for SCADA-Managed PV Systems: A Real-World Case Study

by
Karl Kull
1,
Muhammad Amir Khan
2,
Bilal Asad
3,*,
Muhammad Usman Naseer
3,
Ants Kallaste
3 and
Toomas Vaimann
3
1
Evecon OÜ, Lossi Street 3, 93819 Kuressaare City, Estonia
2
Department of Electrical Power Engineering, The Islamia University of Bahawalpur, Bahawalpur 63100, Pakistan
3
Department of Electrical Power Engineering and Mechatronics, Tallinn University of Technology, 19086 Tallinn, Estonia
*
Author to whom correspondence should be addressed.
Electronics 2025, 14(18), 3649; https://doi.org/10.3390/electronics14183649
Submission received: 28 July 2025 / Revised: 29 August 2025 / Accepted: 31 August 2025 / Published: 15 September 2025

Abstract

Photovoltaic (PV) systems are increasingly integral to global energy solutions, but their long-term reliability is challenged by various operational faults. In this article, we propose an advanced hybrid diagnostic framework combining a Deep Belief Network (DBN) for feature pattern extraction and a Light Gradient Boosting Machine (LightGBM) for classification to detect and diagnose PV panel faults. The proposed model is trained and validated on the QASP PV Fault Detection Dataset, a real-time SCADA-based dataset collected from 255 W panels at the Quaid-e-Azam Solar 100 MW Power Plant (QASP), Pakistan’s largest solar facility. The dataset encompasses seven classes: Healthy, Open Circuit, Photovoltaic Ground (PVG), Partial Shading, Busbar, Soiling, and Hotspot Faults. The DBN captures complex non-linear relationships in SCADA parameters such as DC voltage, DC current, irradiance, inverter power, module temperature, and performance ratio, while LightGBM ensures high accuracy in classifying fault types. The proposed model is trained and evaluated on a real-world SCADA-based dataset comprising 139,295 samples, with a 70:30 split for training and testing, ensuring robust generalization across diverse PV fault conditions. Experimental results demonstrate the robustness and generalization capabilities of the proposed hybrid (DBN–LightGBM) model, outperforming conventional machine learning methods and showing an accuracy of 98.21% classification accuracy, 98.0% macro-F1 score, and significantly reduced training time compared to Transformer and CNN-LSTM baselines. This study contributes to a reliable and scalable AI-driven solution for real-time PV fault monitoring, offering practical implications for large-scale solar plant maintenance and operational efficiency.

1. Introduction

As the need for clean and renewable sources of electricity continues to grow, solar energy stands out as one of the leading solutions. PV technologies are very popular due to their ease of installation and maintenance, scalability, and the absence of complex mechanisms. Nonetheless, like any other power-generating unit, PV panels are liable to operational defects, and the need for their fault detection in PV panels is geared towards enhancing the operational reliability of large-scale solar power plants [1]. More recently, the implementation of artificial technologies like machine learning and deep learning has become one of the most promising avenues in PV fault detection. Recently, researchers have been incorporating both machine learning and deep learning into hybrid models, merging the two to improve the overall accuracy and reliability of fault detection [2]. In this paper, we present a hybrid approach, where a Deep Belief Network (DBN) is combined with a Light Gradient Boosting Machine (LightGBM) for multi-class PV fault detection using real-time SCADA data. Photovoltaic (PV) systems have two of the most potentially failed parts, which include inverters and PV modules, influencing system performance and energy generation to a significant degree. Research has demonstrated that inverters contribute to about 30–45 percent of system failures overall because of the complexity of power electronics, incursion by thermal stress, and sensitivity to grid perturbation. Such failures may cause system downtime or inefficiency in production. Conversely, PV modules are the second leading cause of failures, contributing 20–30%. Common causes include cell cracks, delamination, hot spots, potential-induced degradation (PID), and soiling. The module failures can easily cause a gradual performance drop, whereas inverter faults may result in instantaneous power losses. Consequently, faults in the two components are critical to ensure optimum reliability of the PV system and limit the downtime required in operation [3,4]. Figure 1 represents the pie chart showing the occurrence proportions of different types of failures within photovoltaic (PV) systems.

1.1. Importance of Fault Detection in PV Systems

The renewable and clean generation of electricity is greatly aided by solar energy due to the adoption of photovoltaic (PV) systems around the world. However, these systems require constant monitoring and upkeep to ensure their long-term performance, safety, and cost efficiency. Like other mechanical systems, PV systems require maintenance, and one of the most vital components of this maintenance is timely and precise fault diagnosis, in other words, identifying exceptions. Various environmental, mechanical, and electrical factors give rise to PV system faults, which include but are not limited to dust accumulation, shading, temperature stress, aging, component degradation, or manufacturing defects [6]. The identification of faults concerning PV systems has been conducted through manual checks, infrared cameras, or simply monitoring electrical current and voltage with basic thresholds. Such strategies have some advantages but fail in terms of being time-efficient, costly due to the need for additional specialized tools, or too simplistic to detect intricate or emerging faults. This is precisely the gap where intelligent fault detection using machine learning (ML) and deep learning (DL) fills. These strategies seek to make use of the enormous data on the system’s Supervisory Control and Data Acquisition (SCADA) interfaces, which are often available in real-time, for pattern recognition and nullifying functions to improve its resolution and efficiency [7,8]. With the increased adoption of PVs at the utility scale, the use of smart, automated, and diagnostic systems in solar operations is going to become routine. Such systems improve dependability, reduce operational costs, and make the modern solar solution economical for the sustainable world.

1.2. Challenges in PV Fault Diagnosis

Even with the implementation of monitoring technologies and sophisticated algorithms, fault diagnosis on photovoltaic (PV) systems is still a challenging task. One of the most significant challenges is the dynamic and non-linear behavior of PV systems. Solar panels are greatly affected by changeable environmental factors such as wind, dust, temperature, and solar irradiance. These factors can frequently obscure fault manifestations or mask normal operational fluctuations, making distinguishing between fault conditions and normal variability extremely difficult. The absence of labeled fault data, especially for large-scale solar power plants, is a significant hurdle too. In-site PV installations that do have SCADA systems get monitored more from an optimization perspective as opposed to a fault labeling perspective, leading to a scarcity of well-annotated datasets with a rich variety of fault types [9,10]. Limited data makes the training of properly functioning ML or DL models highly difficult, making them less applicable, as models require sufficient data to adapt to new or varied inputs. Furthermore, certain faults show more insidious signs, such as microcracks, formation of hotspots, or early-stage soiling that does not impact output greatly in the beginning but can cause gradual degradation over time. The most sensitive detection methods, combined with high-sensitivity and high-frequency data collection, are more expensive and complex and increase the system’s cost, where multiple faults overlap and produce complex symptoms that challenge precise classification [11,12].

1.3. Latest Trends in PV Fault Detection Using Hybrid Models

Over the past decade, the implementation of machine learning (ML) and deep learning (DL) techniques in fault diagnosis has greatly impacted the monitoring of renewable energy systems, specifically solar photovoltaic (PV) systems. There has been a shift from traditional rule-based systems and threshold monitoring to intelligent algorithms that learn from historical data, which enable greater accuracy, quicker response times, and adaptive behavior in constantly changing environments. Within the machine learning domain, several algorithms have been quite effective, including support vector machines (SVM), k-nearest neighbors (k-NN), decision trees, and random forests. These models utilize labeled datasets to classify faults, make failure predictions, and outline preventive actions [13,14,15,16]. The achievement of deep learning models, in particular convolutional neural networks (CNNs), recurrent neural networks (RNNs), and long short-term memory networks (LSTMs), is the capability to extract features from raw data inputs, including current, voltage, and power signals. Their performance is exceptional for sequential fault detection problems due to their capturing of both spatial and temporal aspects [17,18]. In addition, researchers are using time-series sensors along with environmental factors such as irradiance and temperature to help hybrid models perform multi-dimensional fault detection and handle the problem of limited labeled data about PV by employing transfer learning and data augmentation techniques [19]. Table 1 shows the Hybrid Models for PV Fault Detection employing different hybrid models.
Although the intelligent fault diagnostics of photovoltaic (PV) systems have seen some advancement over traditional approaches, they are straightforward but oftentimes do not possess the flexibility or sensitivity to identify complex or subtle defects. Advanced proficient approaches, like machine learning (ML) algorithms, are often overly reliant on domain-specific features and raw data, especially with changes in weather or system operations. Secondly, deep learning (DL) approaches are very demanding in large amounts of data, are considered less interpretable, and require significant processing resources [20]. Additionally, there is a lack of research integrating the temporal modeling capability of sequence-based DL models, such as LSTM, with strong decision boundary gradient boosting frameworks like LightGBM [21,22]. Table 2 shows the research gaps between traditional techniques and the proposed DBN–LightGBM hybrid approach, integrating assumptions of gaps left by conventional deep learning approaches.
Detecting faults in photovoltaic (PV) systems is very important in terms of energy efficiency, maintenance cost, and preventing irreversible damage to the system. The ever-growing availability of machine learning (ML) and deep learning (DL), as well as hybrid approaches, has significantly improved PV fault diagnosis, which allows faster and more accurate identification of various faults, such as shading, hotspots, open circuits, and module degradation. In [23], the authors developed a hybrid ResNet + XGBoost algorithm to detect the photovoltaic (PV) faults in a solar system by reproducing the features of the input data, whereas the XGBoost classifier returned both appropriate and rapid classification. In [24], the authors proposed convolutional neural networks (CNN) extracted features, and the support vector machine (SVM) was used for classifications and achieving an accuracy level of 93.5% for PV fault diagnosis. In [25], the authors suggested Bi-directional LSTM (Bi-LSTM) in combination with XGBoost to enhance the fault detection accuracy. Bi-LSTM extracted temporal information (forward and backward), and XGBoost effectively identified them, achieving an accuracy of 94.9%. In [26], the authors adopted a recurrent neural network (RNN) with SVM as a classifier and showed that sequence modeling is capable of diagnosing faults with excellent accuracy. In [27], the authors proposed a hybrid technique named PCA-XGBoost, with Principal Component Analysis (PCA) for dimensioning the features and XGBoost performing the classification, and an effective method of thorough cost reduction in computation.
In [28], the authors suggested ResNet along with a random forest (RF) classifier, and ResNet was used to extract the features of the images or signals, and the RF gave a high robustness in terms of classification accuracy for diagnosing PV faults. In [29], the authors adopted the combination of a hybrid algorithm autoencoder and an SVM. An autoencoder was used to learn the compressed features, and an SVM was used to classify the features in an unsupervised manner for PV module fault detection. In [30], the researchers suggested a triple-hybrid system that integrates CNN, RF, and XGBoost. The application of CNN to extract features and classification is conducted by combining model RF and XGBoost algorithms and achieves the highest level of classification accuracy. In [31], the authors suggested a GRU model coupled with an SVM, where gated recurrent units (GRU) were used to process time-sequence data and then an SVM was used as a classifier based on time-series PV fault diagnostics. In [32], the authors proposed a Dense-Net architecture in combination with random forest, where Dense-Net is employed for the extraction of features and classification was performed on the RF model. In [33], the author proposed a Gradient Boosting Machine (GBM) architecture in which automatic feature learning was performed by CNN, and GBM is used for the detection of abnormal conditions in PV faults.
In [34], the authors utilized an autoencoder hybrid model with RF in which the autoencoder learned compact feature representations, and then the RF model was used for the classification of abnormal conditions. In [35], the authors suggested a CNN-based hybrid architecture named VGG16-XGBoost, where a deep CNN model, VGG16, extracted meaningful features and XGBoost effectively classified the faults with excellent accuracy. In [36], the authors utilized a deep learning model named GRU in combination with LightGBM in a hybrid sequence-based method to handle sequential data and LightGBM classification architecture. In [37], the researchers developed a hybrid algorithm, CNN-RF, to classify PV faults and a CNN model to generate stable features out of the input, and the random forest is used for diagnosing them. In [38], the authors proposed a hybrid model based on LSTM-CatBoost, in which LSTM was used to learn the temporal trends in the time-series data, and CatBoost accurately classified the class probabilities. In [39], the authors suggested a hybrid model in which random forest was used as the classifier, instead of the LSTM network, and showed excellent results in diagnosing abnormal conditions in PV systems. In [40], the authors implemented hybrid architecture of PCA and gradient boosting, where PCA was used to reduce the dimensionality of input features, and gradient boosting was used as a PV faults classifier. In [41], the authors proposed CNN and LightGBM, in which CNN is employed to extract deep features and LightGBM for the classification of PV faults. In [42], the authors proposed hybrid architecture based on an autoencoder and CatBoost, where the autoencoder is used to extract the input features and CatBoost is used as a final classifier for abnormal conditions detection in PV networks. Table 3 represents the summary of recent hybrid approaches for the diagnostics of abnormal conditions in PV modules.
Smart monitoring and diagnostic tools are required to make the use of photovoltaic (PV) energy systems as efficient and reliable as possible, since the deployment of the systems worldwide is gaining momentum. Most solar power plants experience significant problems with their operation in terms of the variability of the environment, the degradation of their components, and faults occurring at the system level, especially with large-scale installations, such as the 100 MW Quaid-e-Azam Solar Park (QASP). Fault identification should be timely and precise, not only because it will give power output efficiency but also to reduce downtime and maintenance costs. In that regard, the use of data-driven strategies based on real-time operational data and machine learning is on the rise. This study is expected to overcome such challenges by creating an intelligent hybrid model that includes deep learning approaches together with gradient boosting techniques that can detect and classify faults in PV systems accurately. The main objectives and contributions of this paper can be summarized as follows:
  • Development of an improved hybrid fault diagnostic framework based on the DBN–LightGBM framework for photovoltaic (PV) systems fault diagnostics using real-time operational data collected from large-scale grid-connected photovoltaic systems.
  • To utilize a combination of deep learning-based feature extraction as DBN with LightGBM, leveraging the strengths of both sequential modeling and gradient-boosted classification, employing PV operational parameters such as DC, voltage, irradiance, module temperature, and inverter output power.
  • Utilization of the QASP PV Fault Detection Variables (QPV-FDV) Dataset, a practical dataset collected from a 100 MW operational PV plant, offering real fault scenarios rarely available in open-source databases.
  • The proposed model demonstrates superior classification accuracy and reliability for various PV faults, while ensuring lightweight deployment feasibility for real-time PV monitoring systems.
  • The framework is designed to be scalable for larger PV systems and compatible with real-time deployment in smart grid environments, ensuring early fault detection and efficient maintenance planning that make it suitable for real-time deployment in smart grid environments.

2. Preliminaries

2.1. Photovoltaic (PV) System Overview

A solar photovoltaic (PV) system is a complex system that transforms solar energy into usable electricity, and an attractive part of the system is PV panels made up of multiple photovoltaic cells. Modern PV systems integrate SCADA systems for real-time monitoring, fault detection, and performance evaluation. SCADA systems communicate with a large number of environmental sensors, which provide continuous external monitoring of wind, ambient, and module temperatures and irradiance, among other parameters. In addition to these external inputs, SCADA systems monitor a number of critical operational parameters such as DC voltage and current, AC power output, inverter efficiency, power factor, and other parameters essential to the reliability of the system. Any deviation that occurs in real-time data signals may indicate the onset of faults like shading, soiling, inverter failure, and degradation [43,44]. The integration of photovoltaic (PV) panels, battery units, and the utility grid is indicated in a schematic diagram of a grid-tied solar power system with battery storage. It brings to our attention the application of solar energy in immediate consumption, storing, and further use and whereby any surplus energy is fed into the grid [45]. Figure 2 represents the solar energy conversion system block diagram or grid-tied solar system with a battery backup system.

2.2. PV Fault Types

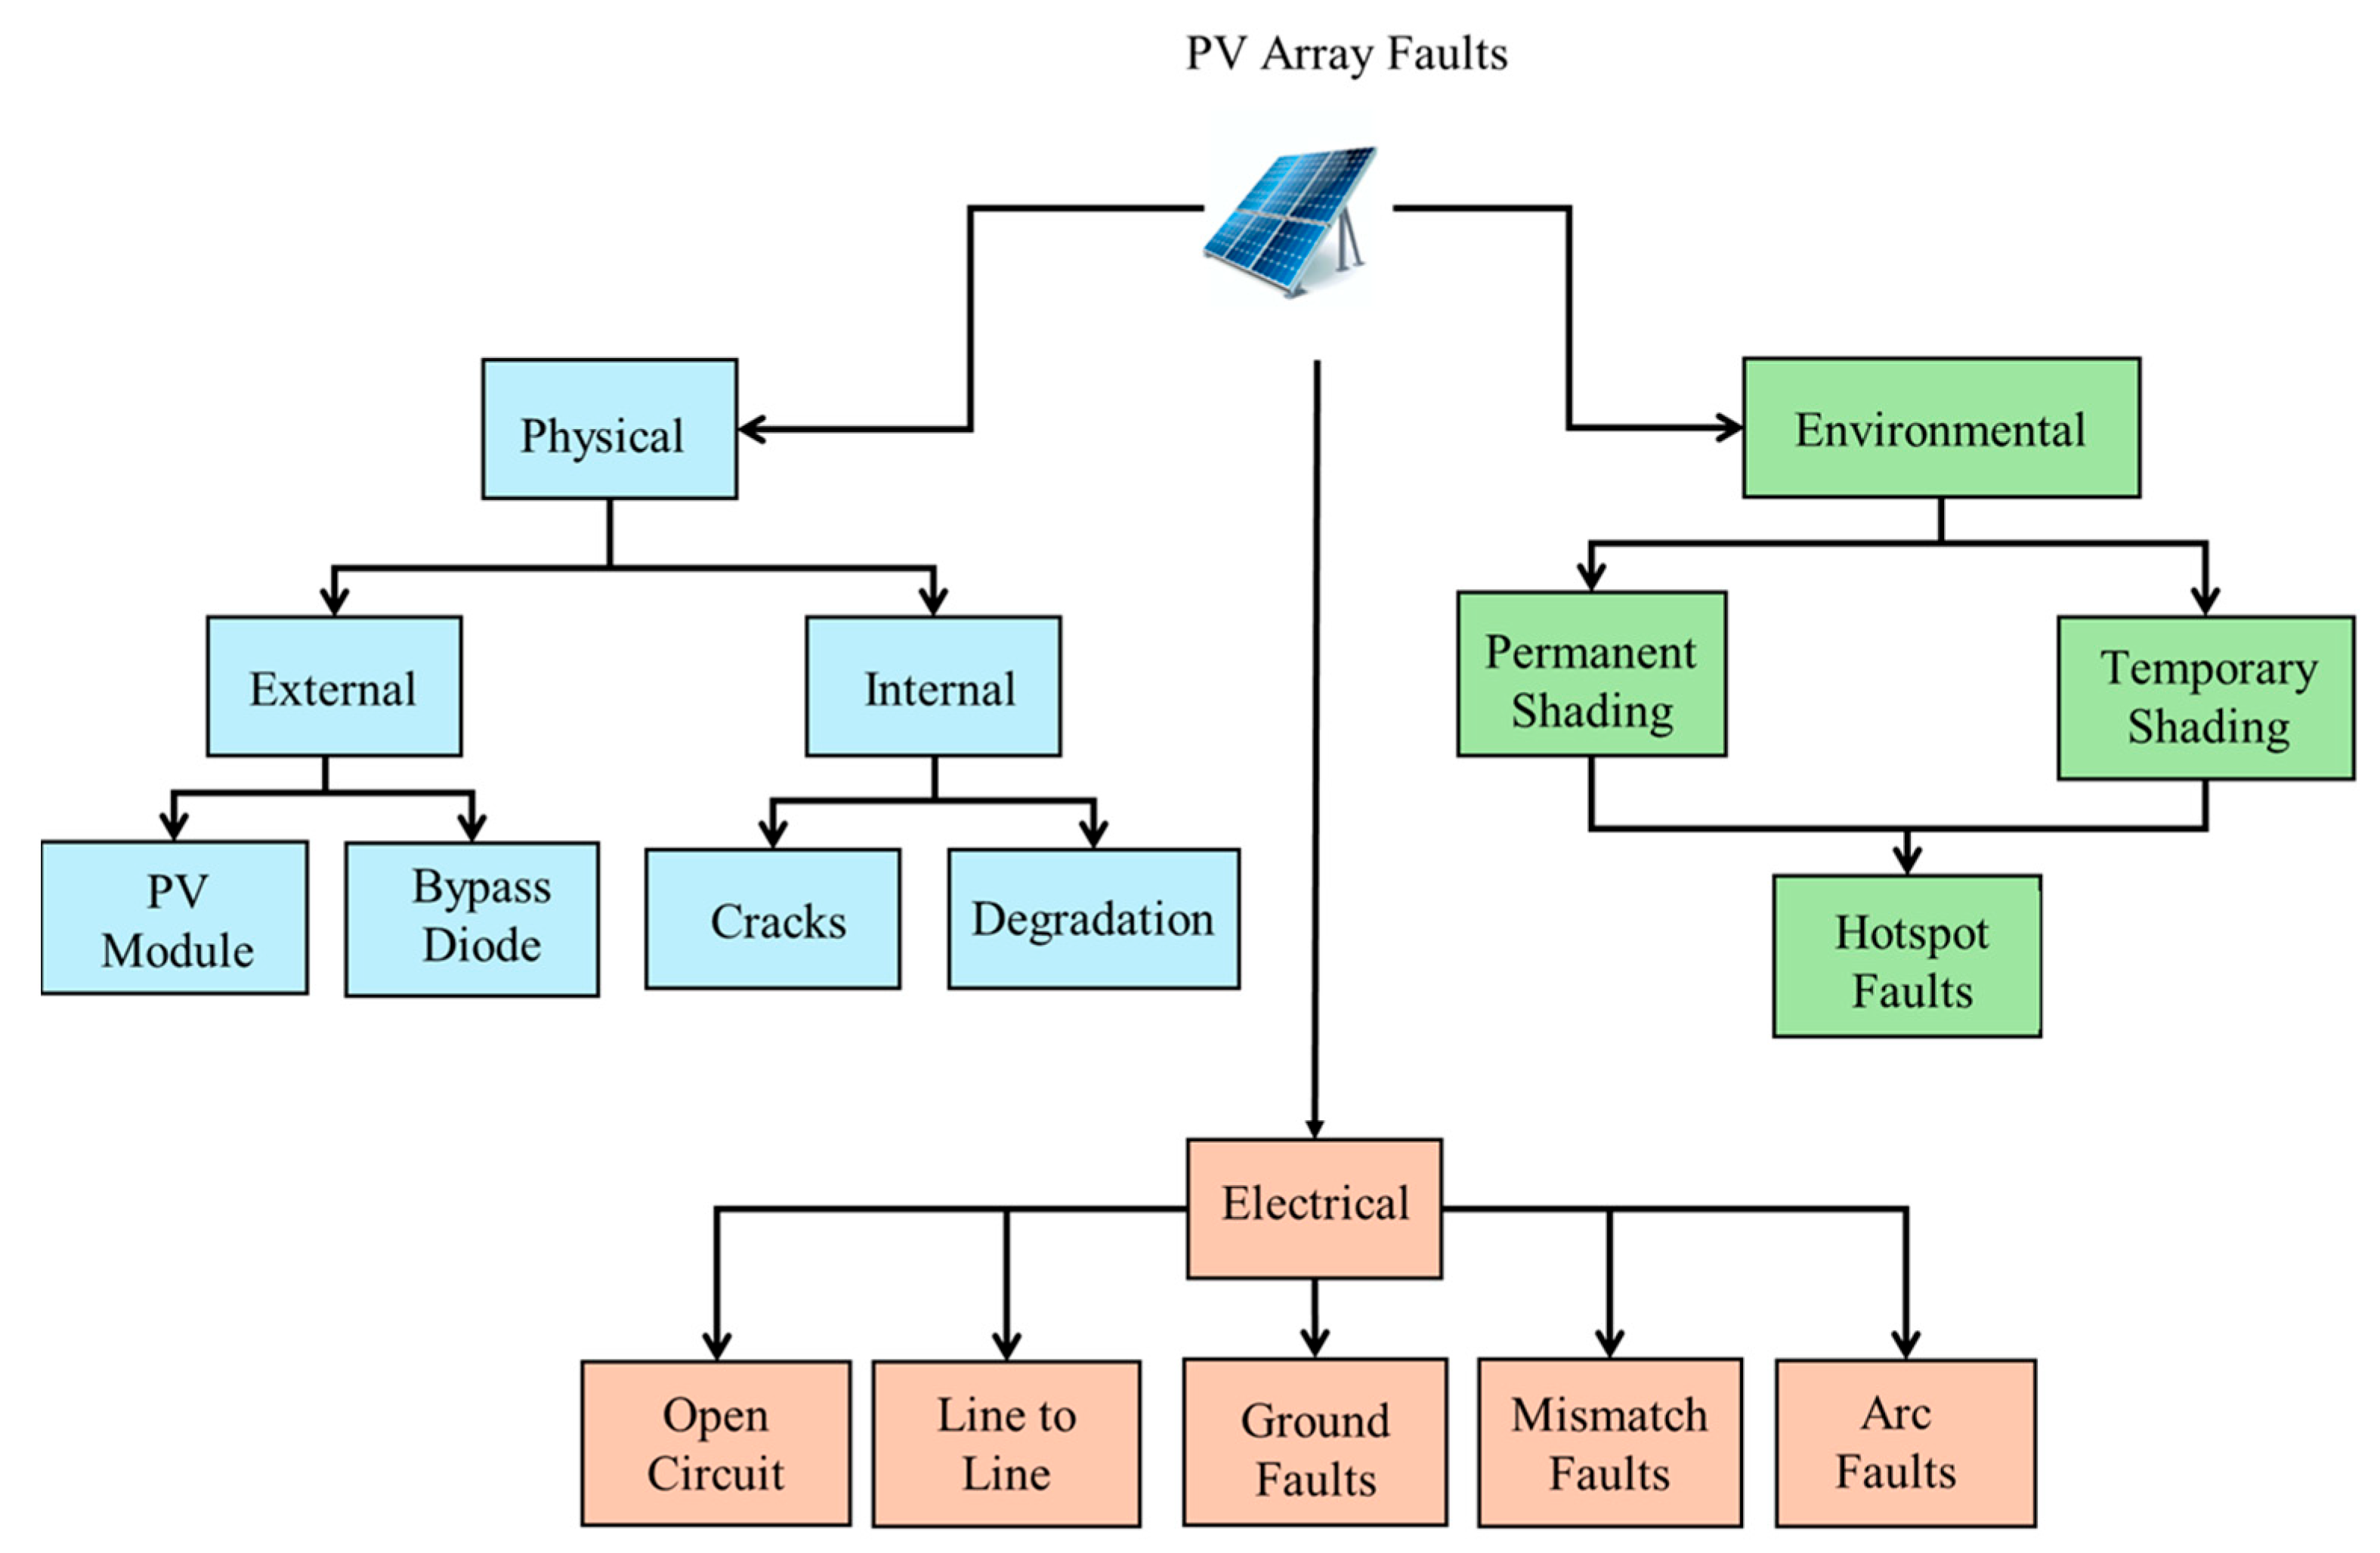
Like other systems, photovoltaic (PV) systems can have faults that reduce reliability and affect performance, efficiency, and safety, which may result in deterioration of the performance of the systems. These faults may be broadly classified as physical faults (e.g., cracks in the cells and broken glass), environmental faults (e.g., shading and soiling), and electrical faults (e.g., open circuiting and ground faults) [46,47]. Figure 3 represents the comprehensive classification of abnormal conditions in photovoltaic arrays: physical, environmental, and electrical failures.

2.3. Research Hypotheses and Variable Structure

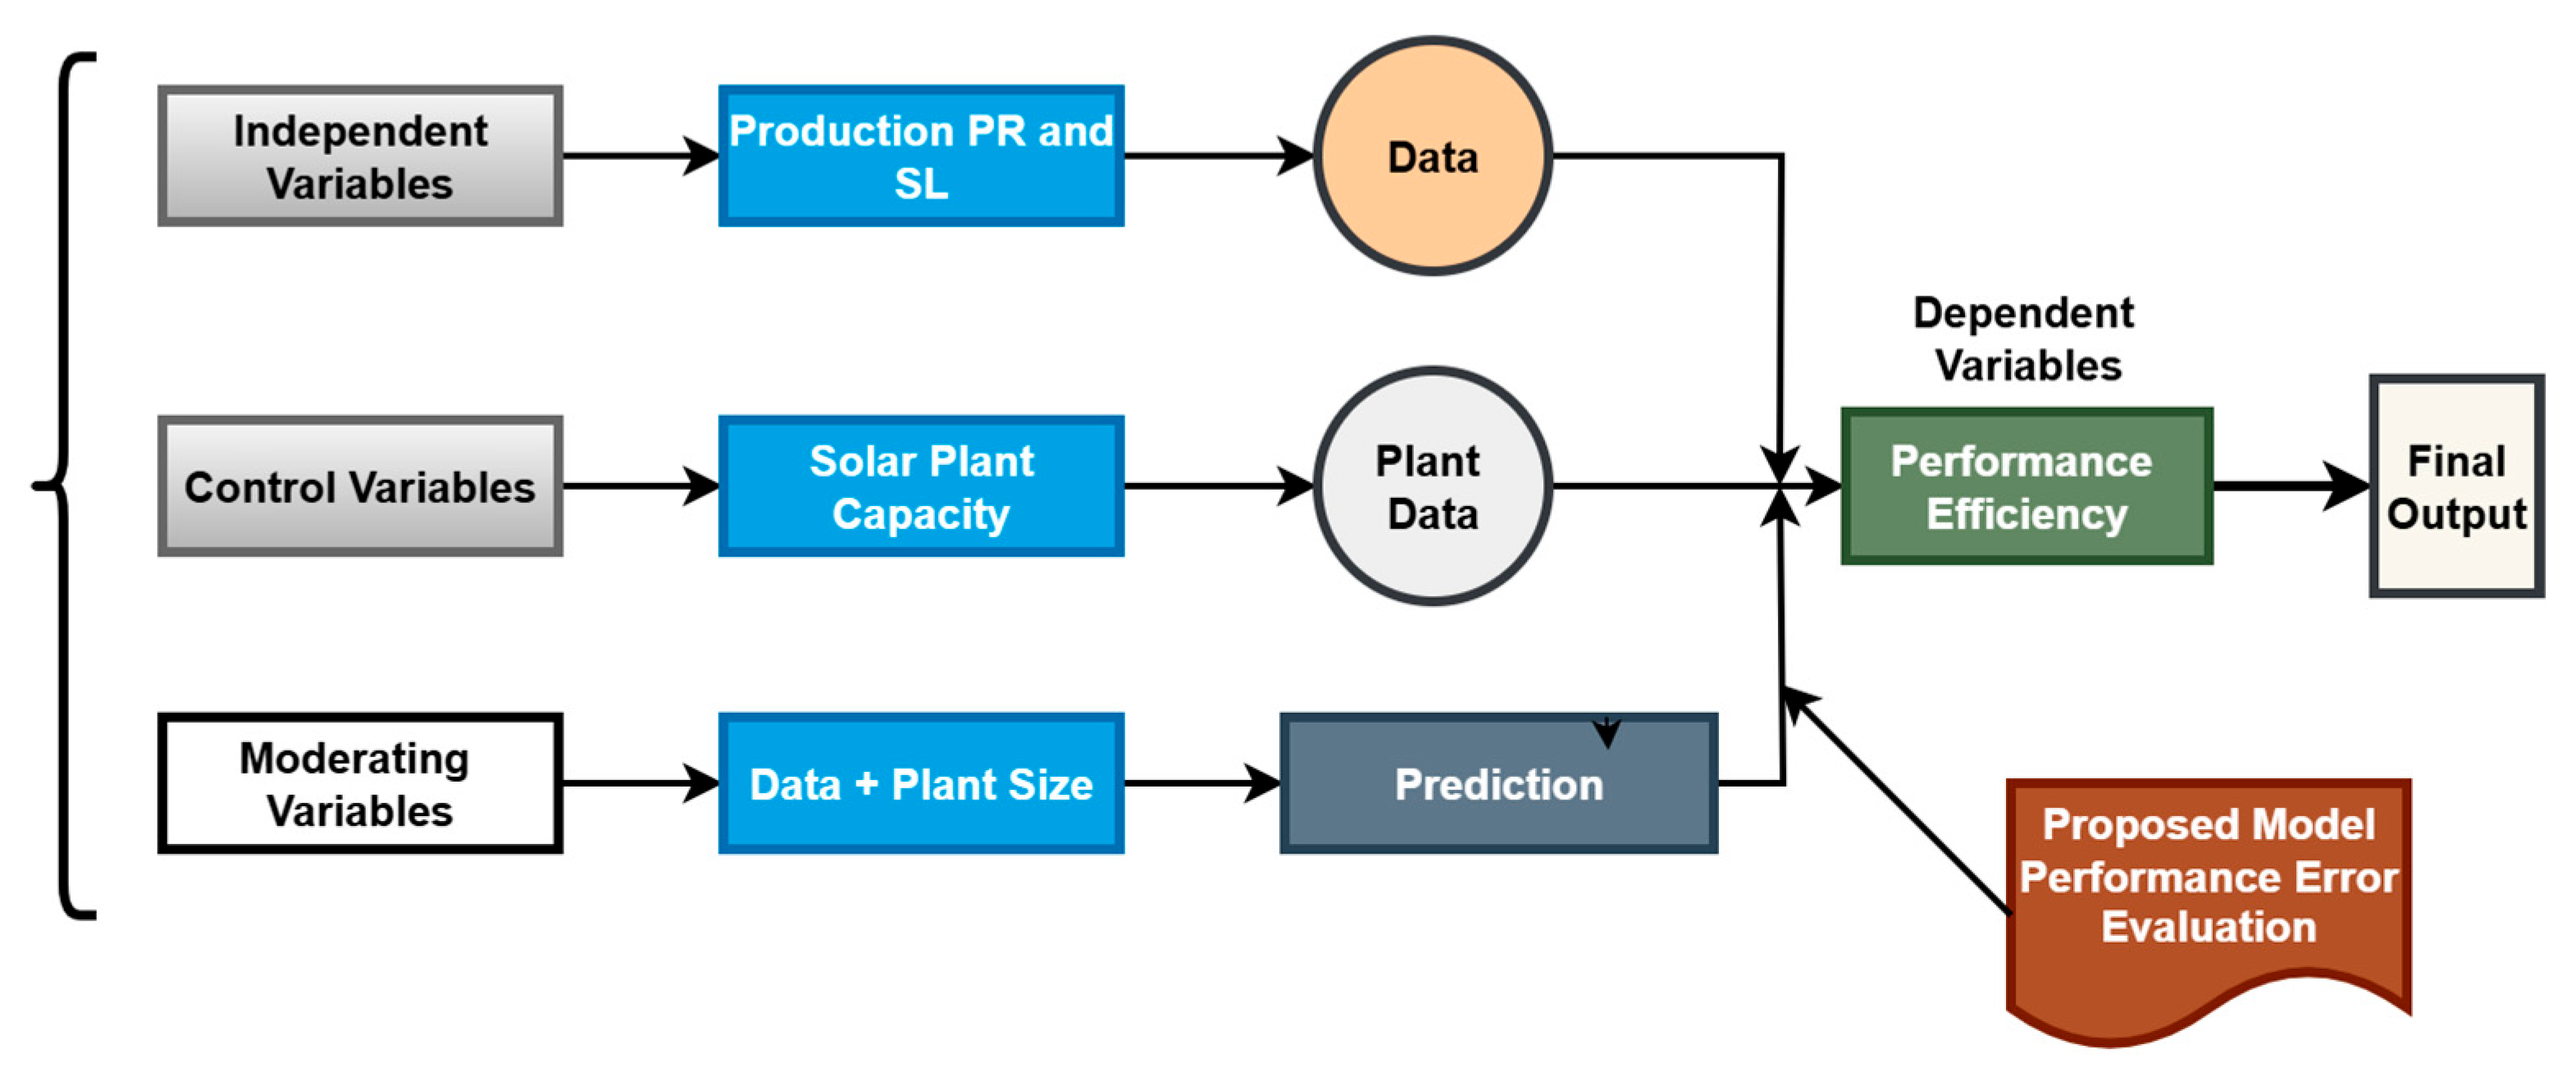
The power output behavior of the Quaid-e-Azam Solar Park (QASP) is predicted and analyzed in this study based on the major environmental and operational parameters. The hypotheses of the research are principally structured around the connection between external conditions (i.e., solar irradiance, ambient temperature, wind speed, and soiling loss) and the performance of the PV system (both in power generation and efficiency performance). As a hypothesis, it is expected that solar irradiance and optimal temperature ranges will increase the performance of PV, whereas soiling losses and extreme ambient temperatures will have adverse effects. As an add-on, it is presumed that the integration of deep-learning-based forecasting models can lead to massive improvement in prediction accuracy under dynamic environmental conditions. The variable format of the forecasting model comprises the following:
  • Independent Variables: The environmental conditions include solar irradiance (GHI), temperature, wind speed, humidity, and soiling loss (SL).
  • Dependent Variables: The amount of power that is given (kW), the performance ratio (PR), and the total energy efficiency of the solar plant.
  • Control Variables: Installed solar plant capacity (100 MW), module specifications (JA Solar 255 W), and systems configuration and location-specific constants (e.g., tilt angle and oriented in a fixed direction).
  • Moderating Variables: Temporal measurements like time of the day, season, and flux of daily irradiance, which determine the presence of the strength as well as the direction of the links between the key variables.
The architecture of this model is designed to provide an evaluation of these ties in a data-driven manner, and deep learning (DL) algorithms are used to make predictions. Historical and real-time observations recorded on the QASP are used to model and test hypothesized relationships. The hierarchy makes it possible to identify influential variables and assess their effect on predictive performance. The method assists in improved choices, operational preparation, and energy control in large, distributed PV frameworks. Figure 4 shows the choice of important variables that are connected with each other for forecasting the objectives and variables under consideration.

2.4. Adaptive Deep Belief Network (A-DBN)

The adaptive deep belief network (DBN) is an enhanced generative probabilistic model in deep learning that is made up of many layers of stochastic generative neural networks, known as Restricted Boltzmann Machines (RBMs). These layers are trained in a step-by-step fashion in an unsupervised way to learn abstract and hierarchical structures of the input data by stacking on top of each other [48,49]. In this study, DBN is employed as a deep feature extractor from raw or preprocessed SCADA signals, including voltage, current, irradiance, and other parameters relevant to PV fault diagnostics. An RBM consists of a visible layer v and a hidden layer h , and the joint probability distribution is:
P ( v , h ) = 1 Z e E ( v , h )
where E v , h is the energy function and mathematically given as:
E v , h = i = 1 D × j = 1 F v i w i j h j i = 1 D b i v i j = 1 F c j h j
in which, w i j is the visible weight between v i and h j , b i and c j are the visible and hidden layers, and Z is the partition function. The marginal probability of a visible vector is:
P v = h P ( v , h )
Each layer in RMB is greedily trained by using Contrastive Divergence (CD-k) and, for a DBN with L layers, the overall joint probability is:
P v , h 1 , h L = P v h 1 P h 1 h 2 P ( h L 1 | h L )
Once trained, the top-level hidden layer features h L act as a deep feature representation. To further enhance its discriminative power, Adaptive DBN integrates a feedback mechanism that adjusts its internal parameters (especially in higher hidden layers) based on external insights and LightGBM feature importance. Specifically weights ω i j ( 2 ) in the second hidden layer are updated as follows:
ω i j ( 2 ) ω i j ( 2 ) + η × i m p j × D B N ω i j ( 2 )
in which i m p j shows the feature importance score of feature j from LightGBM, η is the rate of learning, D B N represents the reconstruction loss in DBN, and the feedback loop promotes relevant features and suppresses irrelevant ones. This feedback loop encourages the network to promote highly relevant features while suppressing less informative ones, thereby making the model more focused and robust in fault classification. Figure 5 shows the block diagram of the proposed adaptive deep belief network (A-DBN) integrated with LightGBM for intelligent PV fault classification.

3. Development of Hybrid Model (Adaptive DBN + LightGBM) for PV Fault Diagnosis

The suggested hybrid architecture for photovoltaic fault diagnosis combines Deep Belief Networks (DBN) for feature learning without supervision and with a Light Gradient Boosting Machine (LightGBM) as a supervised classifier. This approach achieves remarkable multi-class classification of photovoltaic panel faults and non-linear high-dimensional SCADA data. An Advanced DBN is a generative probabilistic model composed of multiple layers of Restricted Boltzmann Machines (RBMs) and a layer of visible units v 0,1 n , hidden units h 0,1 m W R m n , and b and c are visible and hidden layer bases. The energy function of a joint configuration ( v , h ) is defined as follows:
E v , h = v T W h b T v c T h
where W R n m is the weight matrix and b and c are the bias vectors of the visible and hidden layers, respectively. The joint probability distribution has the form:
P v , h =   1 Z e x p ( E v , h )
where Z is the partition function
Z = v , h e x p ( E v , h )
The probability associated with a specific v is:
P ( v ) = 1 Z h e x p ( E v , h )
Training completes with Contrastive Divergence (CD),
W i , j = η ( v i h j ) d a t a · ( v i h j ) r e c o n
in which η is the learning rate, ( v i h j ) d a t a shows the probability under the data’s distribution, and ( v i h j ) r e c o n represents the expectation after reconstruction. Several RBMs are arranged in a stack, each hidden layer of one RBM serving as the visible layer for the next. The topmost hidden representation is denoted as:
f = D B N ( x ) R d
where x R n is the raw input vector originating from the QASP PV fault dataset (DC voltage, irradiance, power, etc.) and f is the complex feature vector of non-linear patterns related to different PV fault types. After feature extraction with DBN, they are used as the input to LightGBM, which is a gradient-boosting-based framework that creates an ensemble of decision trees. The objective function for LightGBM is:
L = i = 1 N l y i ,   y ^ i t + k = 1 t Ω ( f k )
where y i { 1,2 , , C } is the actual fault label for sample i , y ^ i t is the predicted output at iteration t , and Ω ( f k ) is the complexity control regularization term in which T is the number of leaves and w is leaf weights. Each decision tree f k F represents a sequential split and performs Laplace polynomial fitting around the node as sufficiency tests:
L ( t ) i = 1 n [ g i f k f i + 1 2 h i f k ( f i ) 2 ] +   Ω ( f k )
in which,
g i = y ^ i ( t 1 ) l y i ,   y ^ i t 1
h i = 2 y ^ i ( t 1 ) l y i ,   y ^ i t 1
LightGBM optimizes using the best gain-based information for leaf-wise tree growth. The tree depth increases next based on:
G a i n = 1 2 G 2 L H L + λ + G 2 R H R + λ + ( G L + G R ) 2 H L + H R + λ γ
where G L ,   G R , and ( G L + G R ) are the sums of gradients and Hessians for the left and right splits, respectively. Figure 6 represents the integration of the proposed hybrid deep learning architecture: integration of Deep Belief Network (DBN) with LightGBM classifier for PV faults diagnosis.
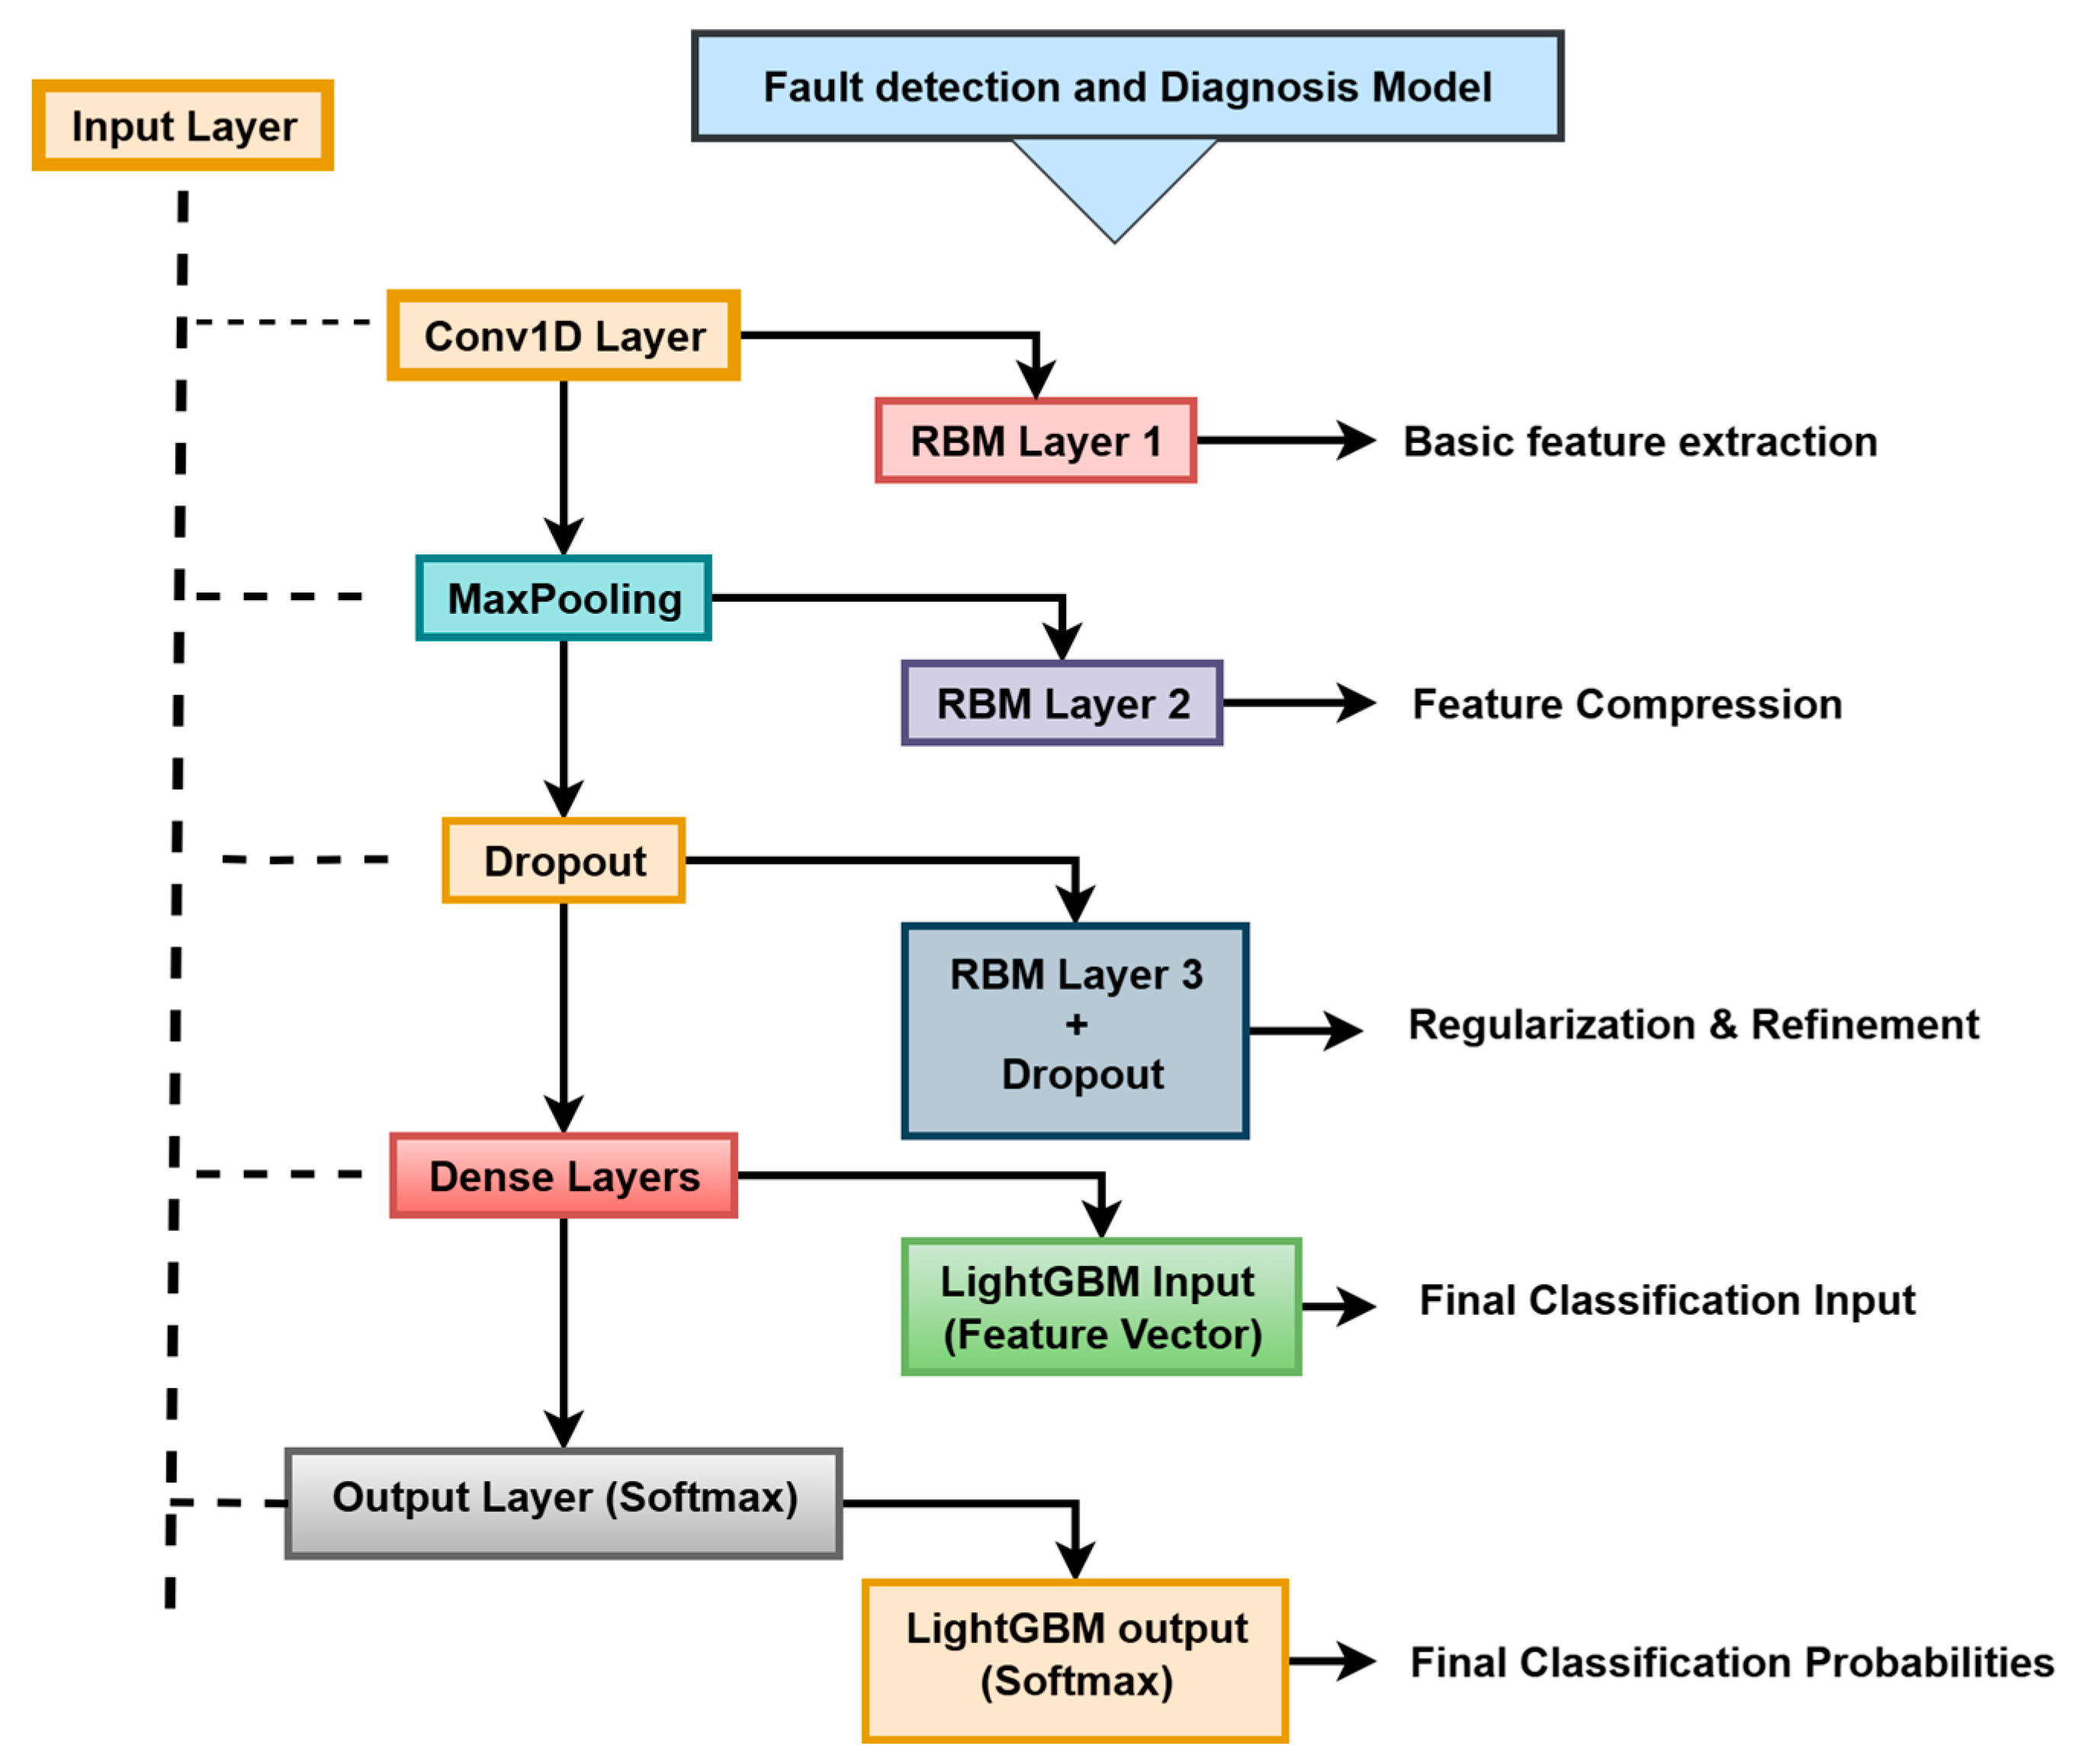
Figure 7 depicts the architecture of the proposed hybrid model, in which a Deep Belief Network (DBN) is used for feature extraction and LightGBM acts as the classifier in the final stage. The initial step begins with the input layer, which accepts signal data in its raw or already processed form and then sequentially flows signal data within a stack of Restricted Boltzmann Machines (RBMs), which are kept one above the other and tend to stepwise transform the raw data into higher-level feature representations. The first RBM layer is responsible for initial feature extraction, analogous to a Conv1D layer in CNNs, by capturing low-level patterns; the second RBM layer compresses those features, which can be compared to a Max-Pooling operation, while the third RBM layer further refines the features and applies a form of dropout to mitigate overfitting, similar to the function of dropout layers in deep CNNs. The last output of the RBM layers, deeply learned features, is sent to LightGBM after being subjected to flattening. In the final output layer, the model produces class probabilities using a softmax function by mapping an input to one of the stored fault types, and this hybrid model captures the feature abstraction through deep learning from the DBN and the rapid and precise boundary classification from LightGBM at lower tree levels [50,51,52,53]. The detailed implementation strategy is given in Algorithm 1.
Algorithm 1 SCADA-based hybrid PV fault diagnosis using DBN + LightGBM
Start
Input Parameters (SCADA features):   X = V d c , I d c , G , P i n v , T m o d , P R
Where;
  • V d c = DC Voltage
  • I d c = DC Current
  • G = Solar Irradiance
  • P i n v = Inverter power output
  • T m o d = Module Temperature
  • P R = Performance Ratio
Output Parameters:   Y { H ,   O C ,   P V G ,   P S ,   B B F ,   S F , H S F }
Where,
  • H = Healthy module
  • O C = Open circuit
  • P V G = Photovoltaic ground
  • P S = Partial shading
  • B B F = Busbar fault
  • S F = Soiling loss fault
  • H S F = Hotspot fault
Data Preprocessing:
Normalize each input using min-max scaling:
X = X X m i n X m a x X m i n
Handle missing values and outliers using median imputation filtering.
Deep Feature Extraction using Adaptive DBN:
DBN Architecture: A stack of 3 Restricted Boltzmann Machines (RBMs) trained layer-by-layer in an unsupervised fashion.
Let   the   input   vector   to   DBN   be   X R 6   outputs   a   deep   feature   vector   F R 32
Each RBM layer is trained to model the probability:
P v , h =   1 Z e x p ( E v , h )
In which,
  • v = visible layer
  • h = hidden layer
  • Z = partition function (normalization constant)
E v , h = i b i h i i C j h j i , j W i , j h j

Adaptive Training Strategy:
For   each   RMB   layer ,   start   with   hidden   size   h = h 0   and   monitor   reconstruction   error   e t
  • If   e t > threshold, increase hidden units
  • If   e t < low threshold, freeze structure
After pre-training all layers, we extract features from the final hidden layer:
F = f a d a p t i v e D B N ( X ) R 32
Fault Classification using LightGBM
Use the extracted feature vector F as input to the LightGBM classifier.
LightGBM minimizes the objective:
L = i = 1 N l y i ,   y ^ i t + k = 1 t Ω ( f k )
In which,
  • l y i ,   y ^ i t = log loss for multi-class classification
  • f k = Individual tree
  • Ω f k   =   γ T + 1 2 λ | | ω 2 | | : Regularization term
  • T = number of leaves
  • ω = leaves weights
Output:   Final   prediction   Y ^ { H , O C , P V G , P S , B B F , P S , H S , H S F }

Hyperparameter Optimization

Table 4 contains the optimized hyperparameters for the hybrid model combining Deep Belief Networks (DBN) and Light Gradient Boosting Machine (LightGBM) aimed towards the classification of photovoltaic (PV) faults. This hyperparameter configuration seeks to leverage DBN’s deep representation learning alongside the decision-making speed and reliability of LightGBM. Regarding LightGBM, hyperparameters like the number of estimators, learning rate, maximum tree depth, and sub-sampling ratio were adjusted to improve generalization while also avoiding overfitting. All of these parameters govern the boosting approach, how intricate patterns are captured, and the adaptation of the model to changes in fault characteristics. Collectively, these updated parameters guarantee that the hybrid framework is resilient, scalable, and appropriately tailored for instantaneous fault diagnosis within PV systems accustomed to functioning in extensive solar power plants.

4. Project Profile and Specifications of Quaid-e-Azam Solar Park (QASP)—100 MWp

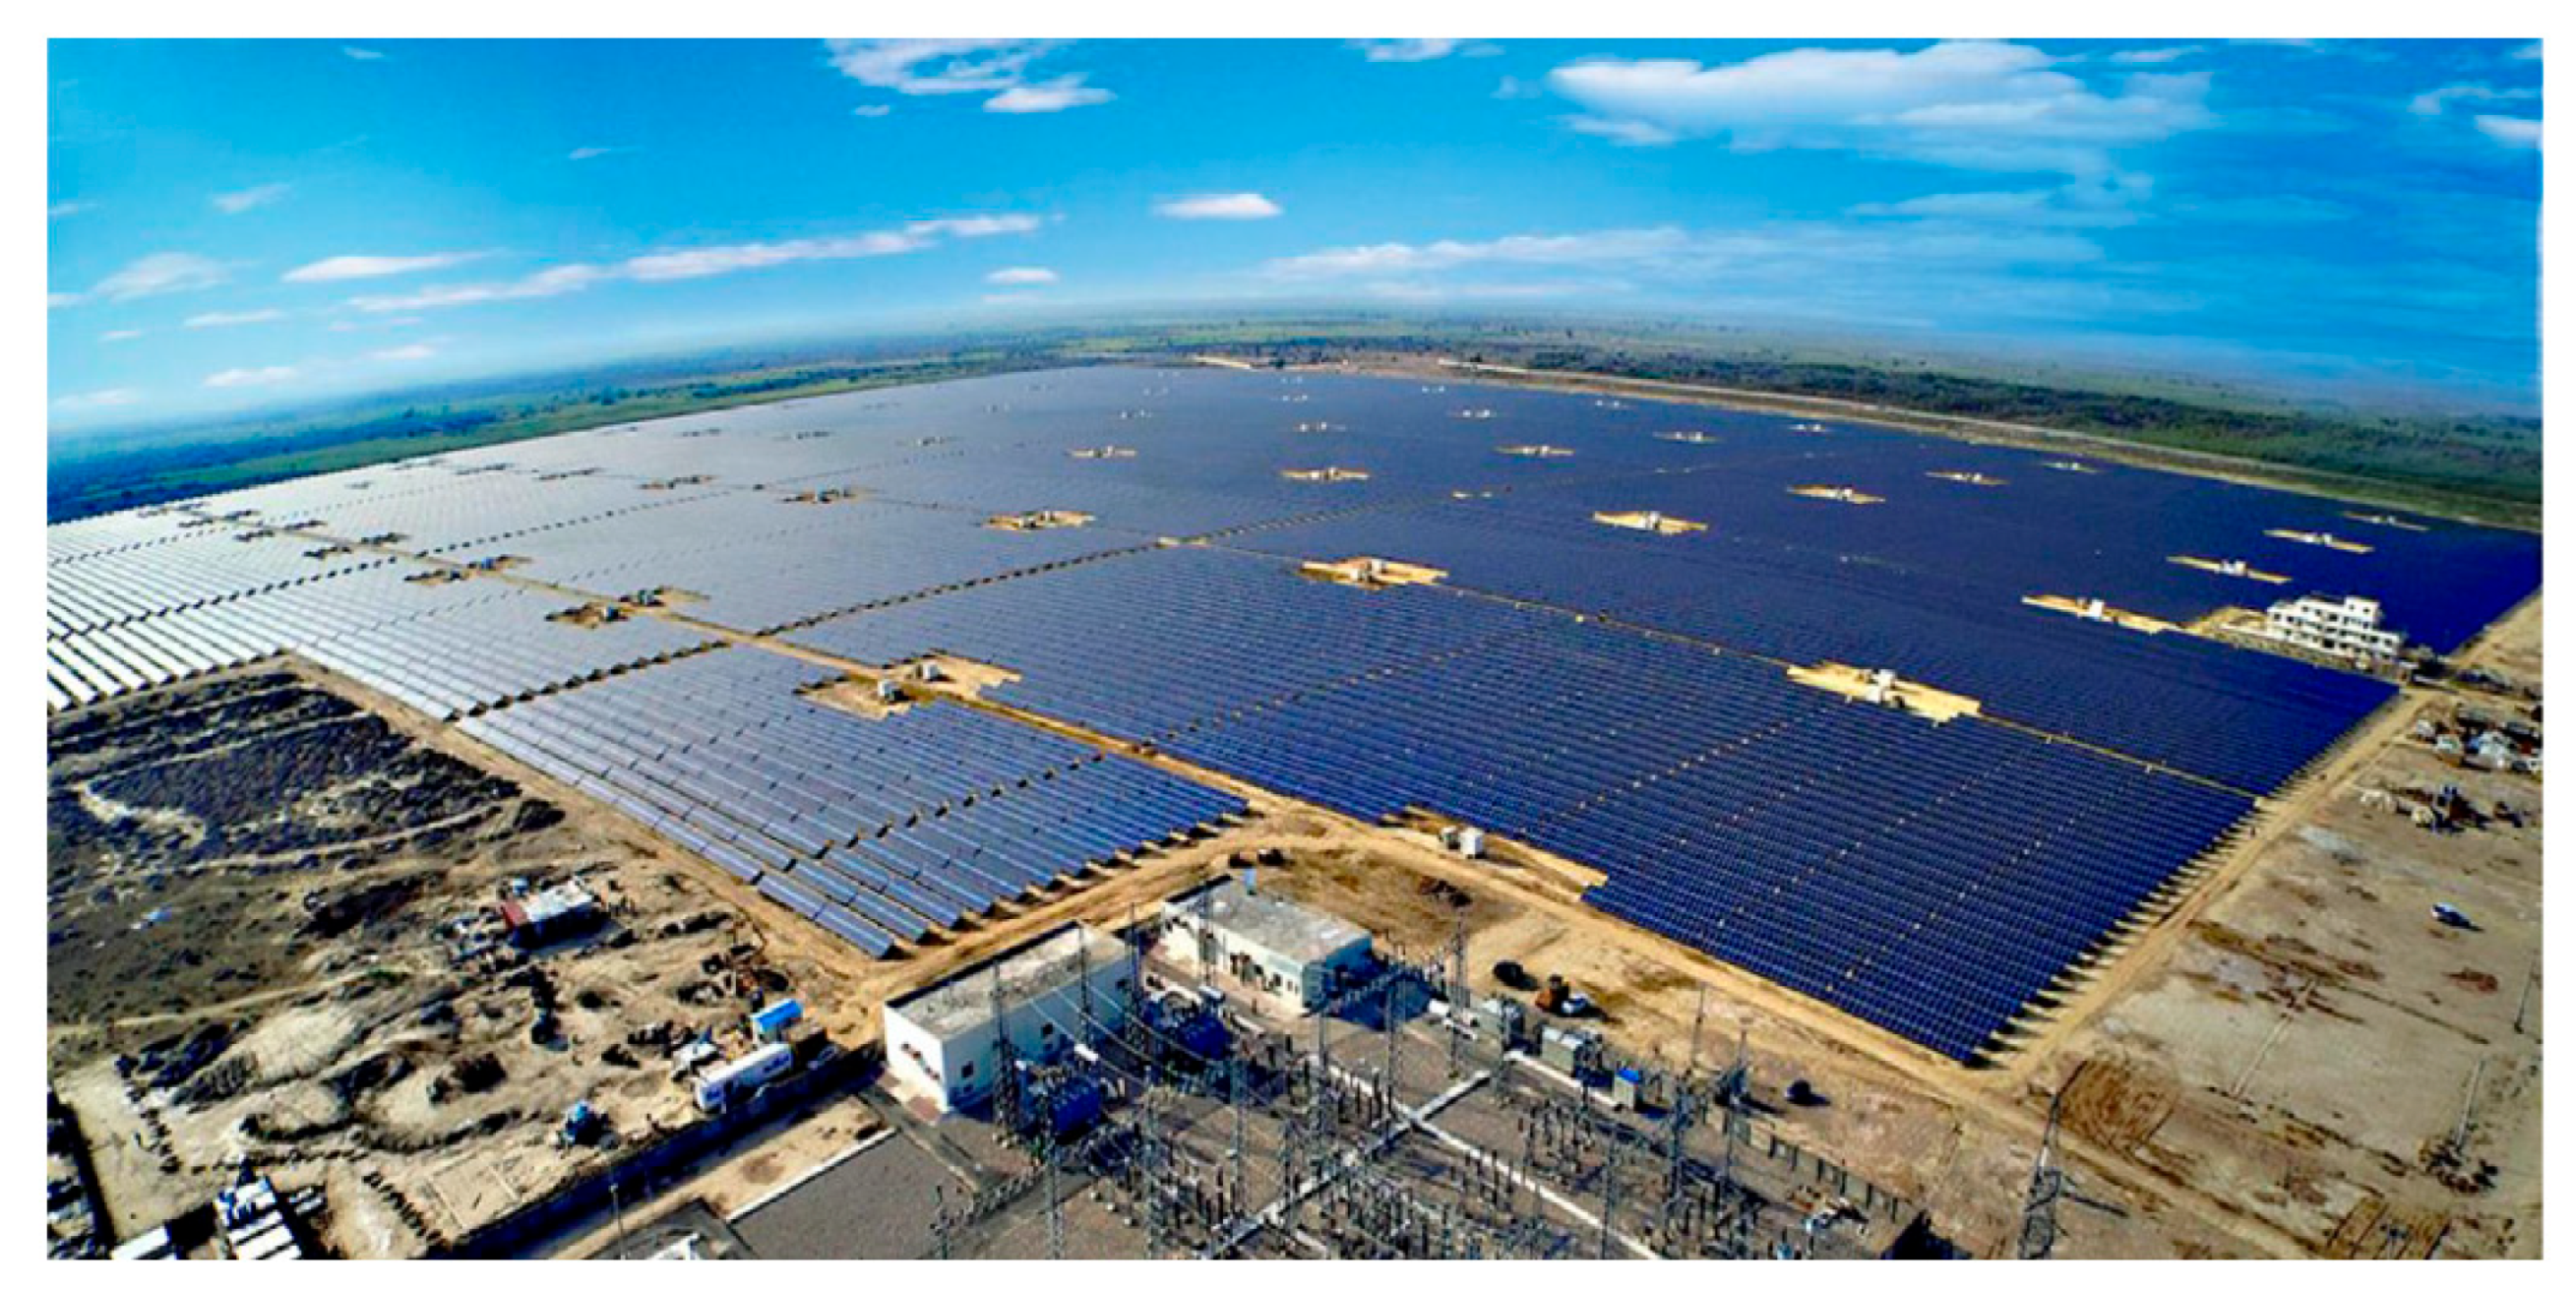
Quaid-e-Azam Solar Park is the first utility-scale solar power project and a significant move towards renewable energy integration in Pakistan. The project was successfully commissioned on 15 July 2015, as a 100 MWp solar PV plant, which is part of the initial plan of developing 1000 MW solar capacity. The plant covers 500 acres of desert terrain; it is quite near sea level, around 116,118 m, approximately located at the positions of 29.410 N and 71.670 E. It has excellent solar irradiance, with a yearly Global Horizontal Irradiance (GHI) value of approximately 1896.5 K W h / m 2 and a daily average of about 66.3   K W h / m 2 , which makes it a superior place to generate solar energy. Performance analysis demonstrates modules providing a maximum power of 262.83 W (255 W rated), an open-circuit voltage of 38.23 V, a fill factor of 76.37%, and a total efficiency of 17.82% percent. Not only will this solar park provide significant value to the clean energy mix of the country but it will also serve as a source of valuable real-time operational data that can be used to support advanced modeling, diagnosis, and forecasting tools. Figure 8 shows the aerial view of Quaid e Azam solar park 100 MWp, with their installed PV panels and other equipment.

4.1. JA 255-Watt Solar Module Description

JA 255-Watt photovoltaic (PV) modules are 255-Watt-rated solar panels extensively deployed in commercial and utility-scale installations due to their dependable performance. This module delivers consistent performance and output under varying conditions. The solar module’s energy production and longevity are guaranteed by using top-grade materials coupled with rigorous quality control processes, and the module’s durability is ensured. It has a maximum 255 W peak power output and tight power tolerance (0 to +5 W), guaranteeing consistent solar energy output. Table 5 illustrates the features of the JA 255 W solar module that is utilized as a testing module for measurement purposes.

4.2. I-V and P-V Characteristics of the JA 255 W Solar Panel Under Varying Temperature and Irradiance Conditions

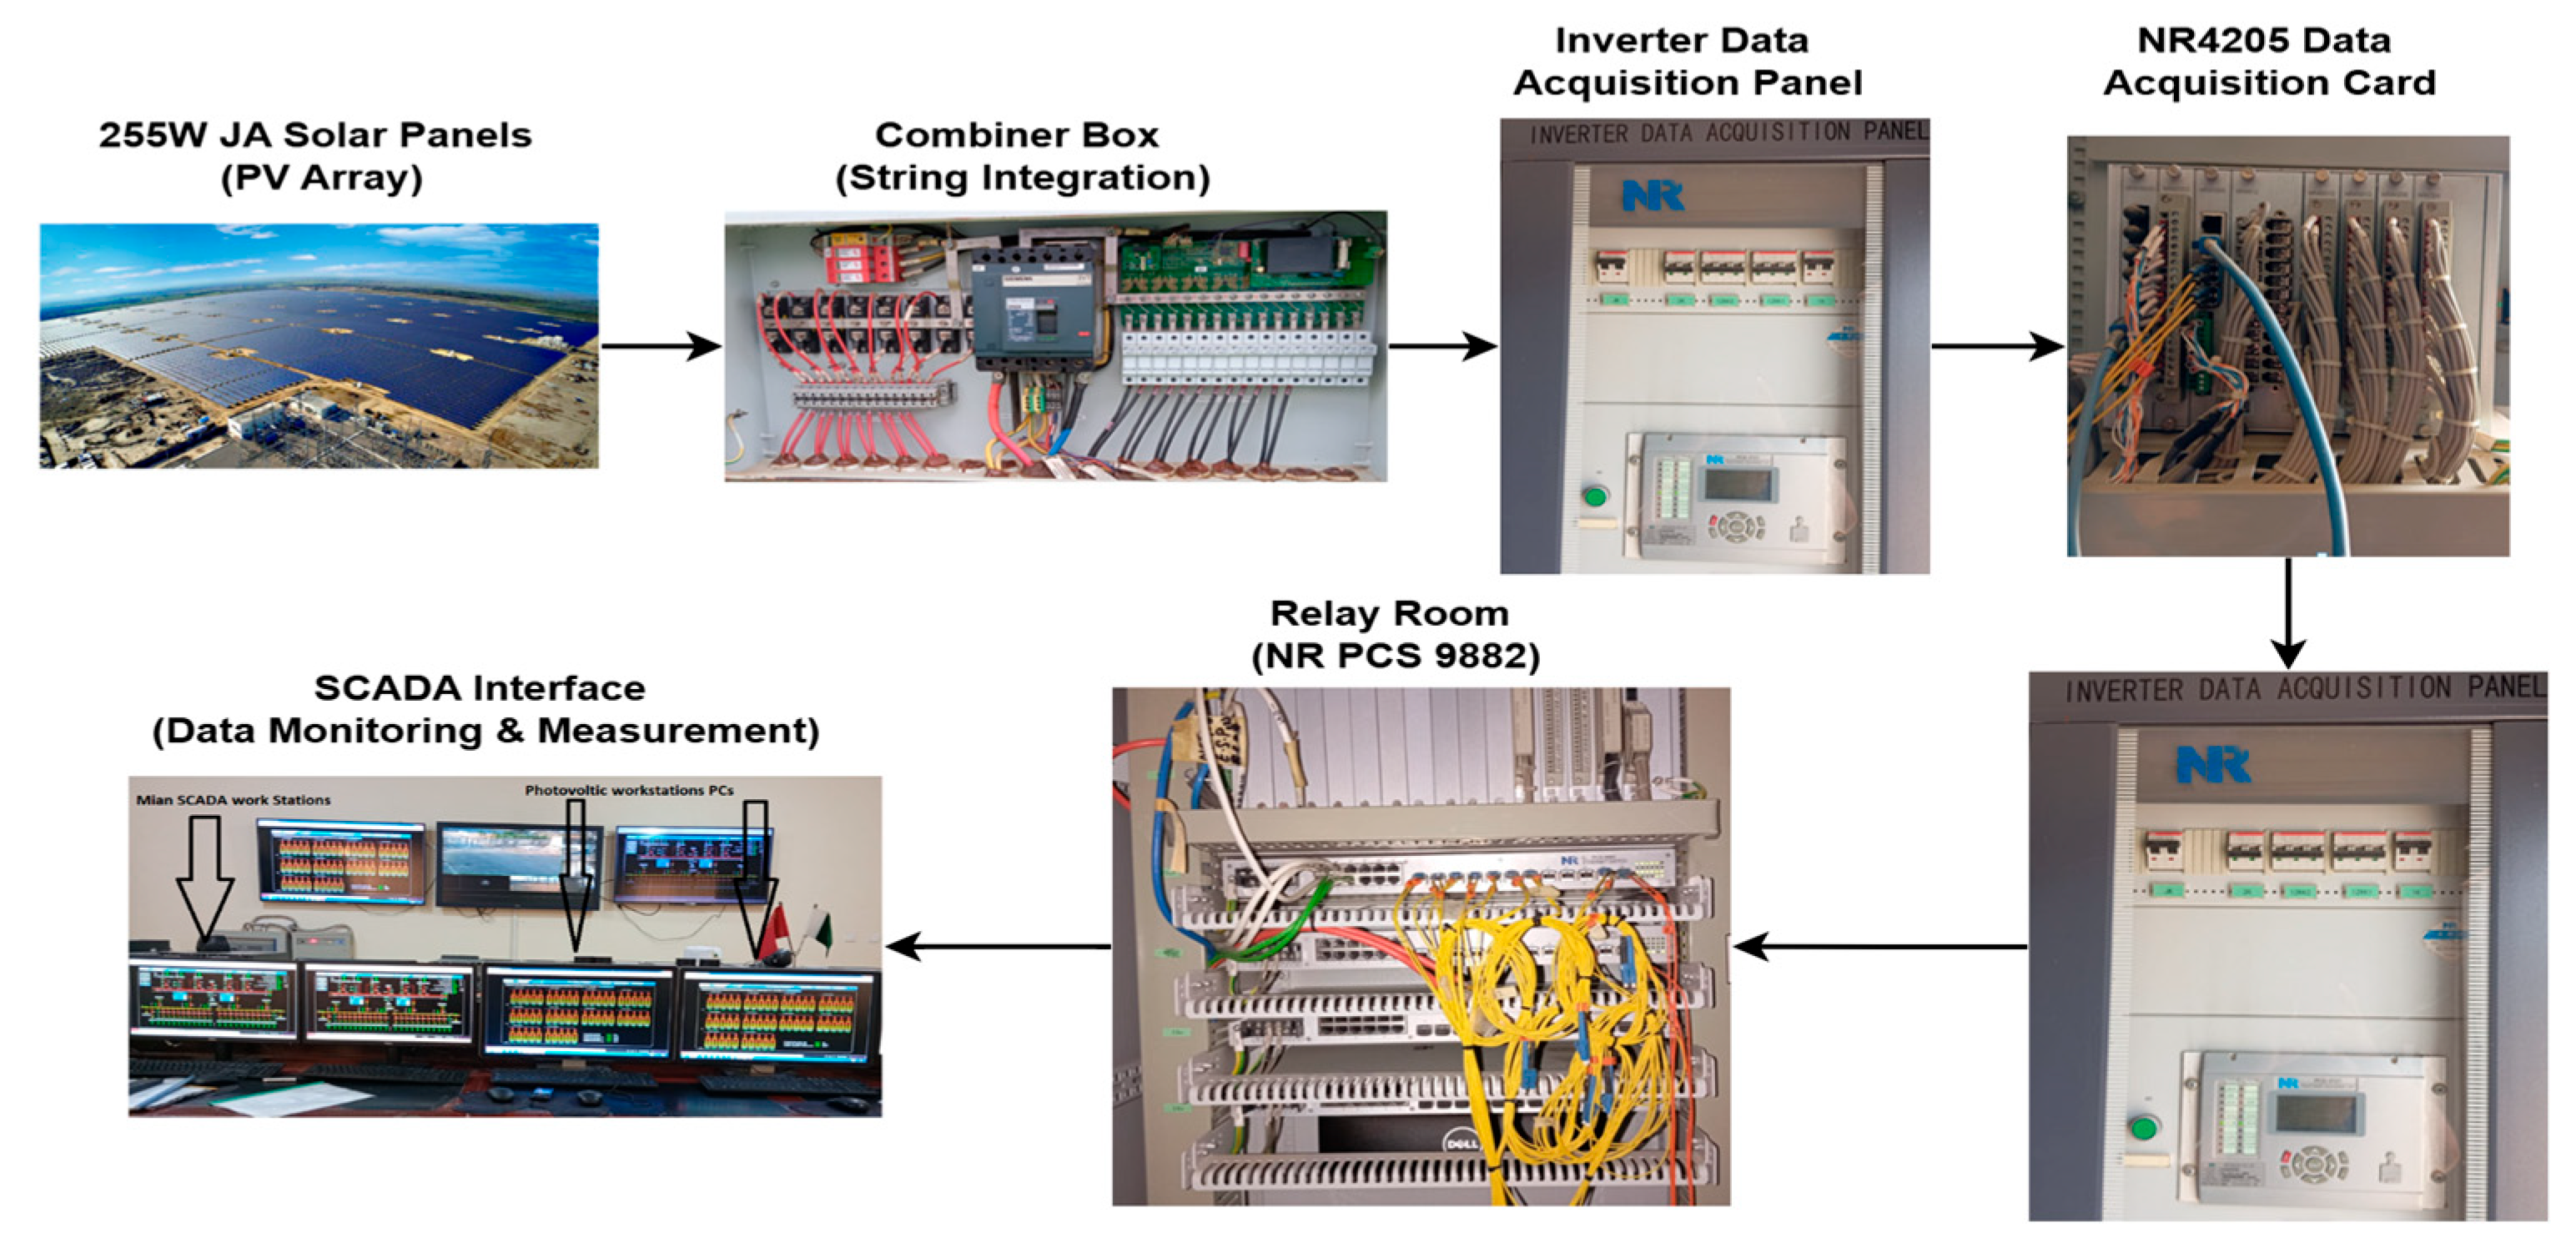
To fully understand the solar photovoltaic (PV) module’s (JA 255 W) performance, it is important to consider its operational characteristics concerning irradiance and temperature. The three figures consist of (a) the I-V and P-V curves of the solar module for five levels of irradiance, 1000 W/m2, 800 W/m2, 600 W/m2, 400 W/m2, and 200 W/m2; (b) the I-V curves at five different ambient temperatures, 70 °C, 55 °C, 40 °C, 25 °C, and 10 °C; and (c) the P-V curves for the same series of temperatures. This is because the amount of solar irradiance affects the number of photons available to the incident on the surface of the solar cell as well as the number of charge carriers that can be generated. The module hits its rated power of 255 W at 1000 W/m2, alongside P m a x being reached during the current peak throughout the voltage sweep. As irradiance reduces to 800 W/m2, 600 W/m2, 200 W/m2, O m a x , I o u t , and, therefore, P, power, also decreases. V o c , however, only drops marginally across the said levels of irradiance, demonstrating that voltage is not as dependent on the level of current as the level of current is on the level of irradiance. Figure 9 shows the performance of the JA 255 W solar panel under various conditions for the I-V, P-V, and I-V characteristics at different irradiance levels at various temperatures, reflecting the influence of temperature and irradiance on panel output. Figure 10 shows the block diagram of the monitoring and data acquisition architecture.

4.3. QASP PV Fault Detection Dataset

The QASP PV Fault Detection Dataset is created from operational data captured from the SCADA system of the Quaid-e-Azam Solar Power Plant (QASP), which is among the largest solar power plants in Pakistan. This dataset comprises JA 255 W polycrystalline PV modules as per the typical prevailing environmental conditions for precision in fault classification in PV systems. The main objective of this dataset is to improve the fault detection capabilities in PV systems using machine learning and deep learning models. The dataset encompasses seven PV fault types that contain varying complexities based on actual field data that are properly annotated from SCADA data and physical inspection data documented in maintenance logs provided by the power plant’s SCADA system.

4.4. QASP PV Fault Detection Variables (QPV-FDV) Dataset

In this paper, we utilize the QASP Solar Energy Variables (SEVs) to gather data from the 100 MW Quaid-e-Azam Solar Park (QASP), which comprises six key operational and environmental factors vital to the proper forecasting and performance analysis. The deep learning model utilizes these variables to be able to predict the output power of the inverter under different conditions in the environment, as well as in the system. In this dataset, the independent variables are:
  • DC Voltage ( V D C ): This is the fundamental parameter that shows the electrical potential difference of a PV module. Voltage fluctuations V D C give an idea of how modules behave in various environmental and operating conditions.
  • DC Current ( I D C ): This is the current generated by the solar modules as a result of the photovoltaic effect. Measurements I D C can be useful in determining the efficiency of power generation by modules in different conditions. Mathematically:
    I D C = P D C V D C
    I D C = I p h I 0 ( e q ( V D C + I R s ) n K T     1 )
  • Solar Irradiance ( G ): This is the rate of solar radiation reaching the surface of the solar PV module and is usually expressed in w / m 2 . It has a direct influence on the power generation of the PV system and total solar irradiance ( G ) is the sum of the direct normal irradiance, diffuse horizontal irradiance, and diffuse irradiance. Mathematically:
    G = G d + G b + G d i f
  • Module Temperature ( T ): This is the photovoltaic module operating temperature on the surface of a solar cell. In solar panels, the ambient temperature of the modules also has an influential effect on the energy conversion efficiency since voltage output tends to decrease at a higher temperature. Mathematically:
    T m o d = T a m b + G 800 ( N O C T 20 )
  • Performance Ratio ( P R ): The PR is a dimensionless metric of actual performance of a PV plant to its maximum potential output, accounting for losses due to temperature, shading, and inefficiencies. It is calculated as the ratio of actual output to the product of active area and reference irradiance.
    P R = E a c t u a l ( A G r e f )
  • Inverter Output Power ( P i n v ): The alternating current (AC) output of power is generated after the changeover of direct current (DC), and available electrical energy is transmitted to the grid.
    P i n v = η i n v P D C
The observation and recording of these variables is conducted through a SCADA system and weather monitoring stations placed in QASP, thus giving highly resolved information in real-time data used to create accurate models. Table 6 represents the summary of the QASP PV Fault Detection Dataset for a healthy different type of faulty conditions, their labels, and corresponding data points.

4.5. Data Acquisition (SCADA System) and Data Preprocessing Steps

Data for the QASP dataset is collected through a SCADA system provided by NR Engineering Co., Ltd. (Nanjing, China). The SCADA system comprises of industrial-grade Dell/HP workstations (e.g., DELL Precision 3660 or HP Z4 G4) equipped with 2.1 GHz Intel CPUs, 16 GB RAM, and 2 TB SATA drives. The SCADA setup ensures high-resolution and synchronized logging of electrical and environmental data. The initial step in the workflow involves cleaning the SCADA sensor data streams to accomplish by implementing moving average and median filters, which aid in noise mitigation and improving data smoothness. Simultaneously with solving the missing values problem, we implement the outliers as an iterative approach to protect consistency across the dataset and boost model performance. Scaling feature values were conducted in addition to normalizing the data. All feature values are rescaled to be between 0 and 1 using min–max normalization, which makes comparison across variables more effective. Furthermore, temperature and irradiance data were standardized by type of data, so they were set to a uniform distribution, which enables the models to learn better. Figure 10 shows the test process flow for PV system monitoring and data acquisition for measurement purposes.
Table 7 summarizes the ranked importance of features influencing photovoltaic (PV) system fault detection and diagnosis, in which irradiance and module temperature emerge as the most critical indicators, as they directly impact energy generation and thermal behavior. Electrical parameters such as DC current, DC voltage, and AC power output reflect system-level performance and fault manifestations. Inverter efficiency and reactive power further highlight the role of power electronics in maintaining reliability, while environmental factors like ambient temperature and wind speed provide contextual insights into system operating conditions.

4.6. Proposed Methodology of Hybrid DBN–LightGBM Model for PV Fault Diagnosis

The proposed methodology combines the feature extraction capabilities of Deep Belief Networks (DBN) and the powerful Light Gradient Boosting Machine (LightGBM) for effective photovoltaic (PV) system fault diagnostics. This hybrid architecture aims to reduce the complexity and variability of real PV data derived from the SCADA system of the Quaid-e-Azam Solar Power Plant (QASP), which has 255 W panels. The methodology begins by retrieving data from the QASP SCADA system that contains operational DC voltage, current, module temperature, irradiance, and inverter output data streams. After completing the preprocessing, DBN, with its constituent stacked RBMs, processes the data that is used to independently discover hidden patterns within PV datasets, which enables it to discover high-level abstract representations of the data’s details. The deep features extracted from those PV faults significantly improve the representation strength while retaining spatial and temporal correlations alongside critical interdependencies of multi-dimensional PV faults. The proposed approach provides high diagnostic accuracy and resilient performance against noise and other variations, enabling effective real-time fault diagnosis and proactive maintenance in large-scale solar farms. Figure 11 shows the Fault Diagnosis Framework for solar PV systems employing the proposed hybrid DBN and LightGBM architecture.

5. Results and Discussion

The temperature of modules rapidly rises to be a very important parameter to measure the health and performance of photovoltaic (PV) systems. In healthy conditions, the temperature is uniform and steady on the surface of the module. Nevertheless, faults like overcurrent can lead to excessive heating as a result of an excessive amount of current passing through and damage the module. Similarly, soiling faults result in inequalities of temperature distribution, and fault-like partial shedding shows a temperature swing because the panel is intermittently disconnected. Most severe, with localized and sharp temperature spikes, hot spot faults occur frequently as shading, cell misalignment, physical damage, etc. It is also necessary to monitor these thermal patterns to detect and perform effective maintenance of PV systems. Figure 12 shows the module temperature distribution graphs for various PV systems under healthy and faulty conditions.
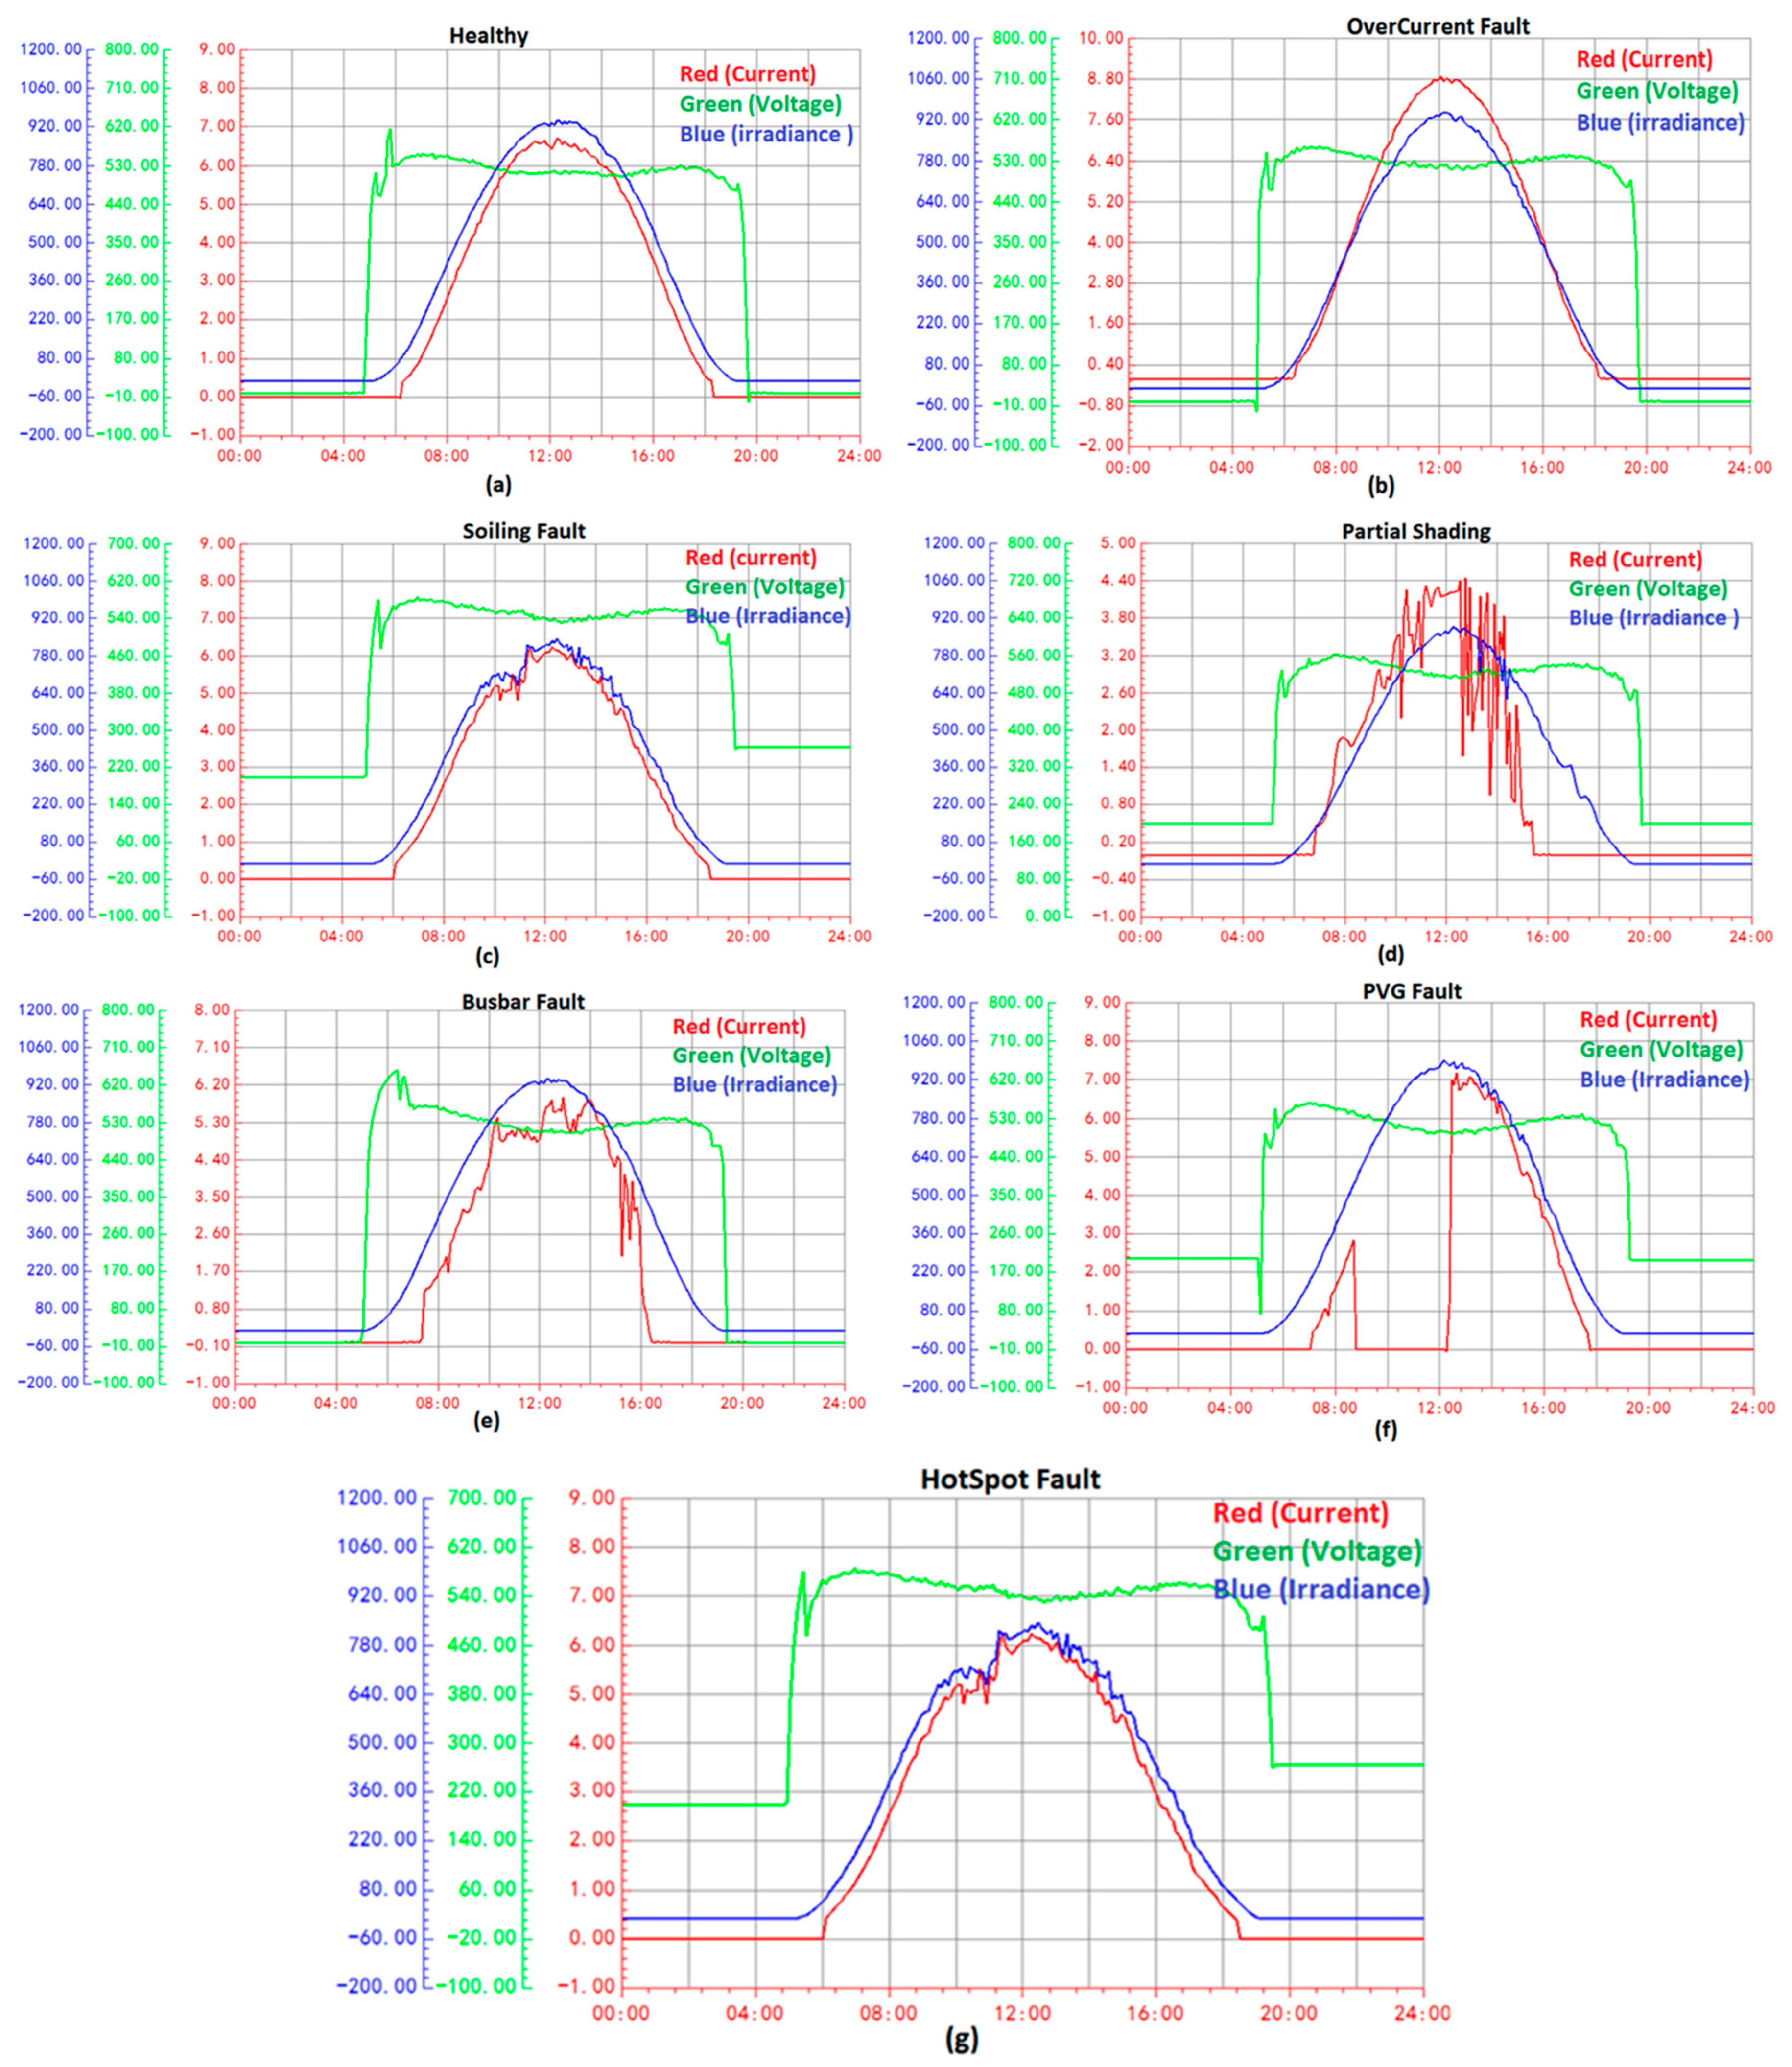
These 24 h graphical trends highlight the PV system’s response under both normal operating conditions and various fault-induced scenarios. The healthy condition confirms system stability, as irradiance and electrical output exhibit smooth, synchronized peak values. The open circuit fault displays a voltage drop, while soiling and shading faults show suppressed current. Busbar and hotspot faults also present irregular fluctuations, demonstrating their real-time diagnostic characteristics. Aligned with the proposed model’s requirements, these visual patterns reinforce how the hybrid DBN–LightGBM model can effectively learn, classify, and identify such anomalies based on predefined temporal patterns. These time-series signals serve as reference baselines for recognizing deviations under faulty conditions. Additionally, the datasets used to train and evaluate the model were systematically derived from both healthy and defined faulty operational states, ensuring accurate classification and intelligent multi-fault diagnostics. Figure 13a–g presents the current, voltage, and irradiance signals recorded by the SCADA system over a single day, capturing seven distinct states of photovoltaic (PV) modules: healthy, open circuit, overcurrent, soiling fault, partial shading, busbar fault, and hotspot fault.
The confusion matrix summarizes and illustrates the classification results for the model in all nine fault categories simultaneously. It captures the accurate categorization of fault types by the model, as the most predictive “labeled” outcomes identify with the actual “observed” labels. The high figures within the diagonal show the classification accuracy for every class to be highly precise, while the sparse off-diagonal values indicate that the misclassifications that do occur are not concentrated in any particular class. This demonstrates the model’s accuracy and dependability in navigating intricate fault scenarios with overlapping features [54]. The overall configuration of the confusion matrix supports the fact that a remarkable average testing accuracy of 98.21% was achieved, and validation of the proposed approach illustrated that it is effective in fault detection and classification. Figure 14 shows the outcomes of the confusion matrix and their corresponding ROC curves for PV fault classification using the proposed architecture, DBN–LightGBM.
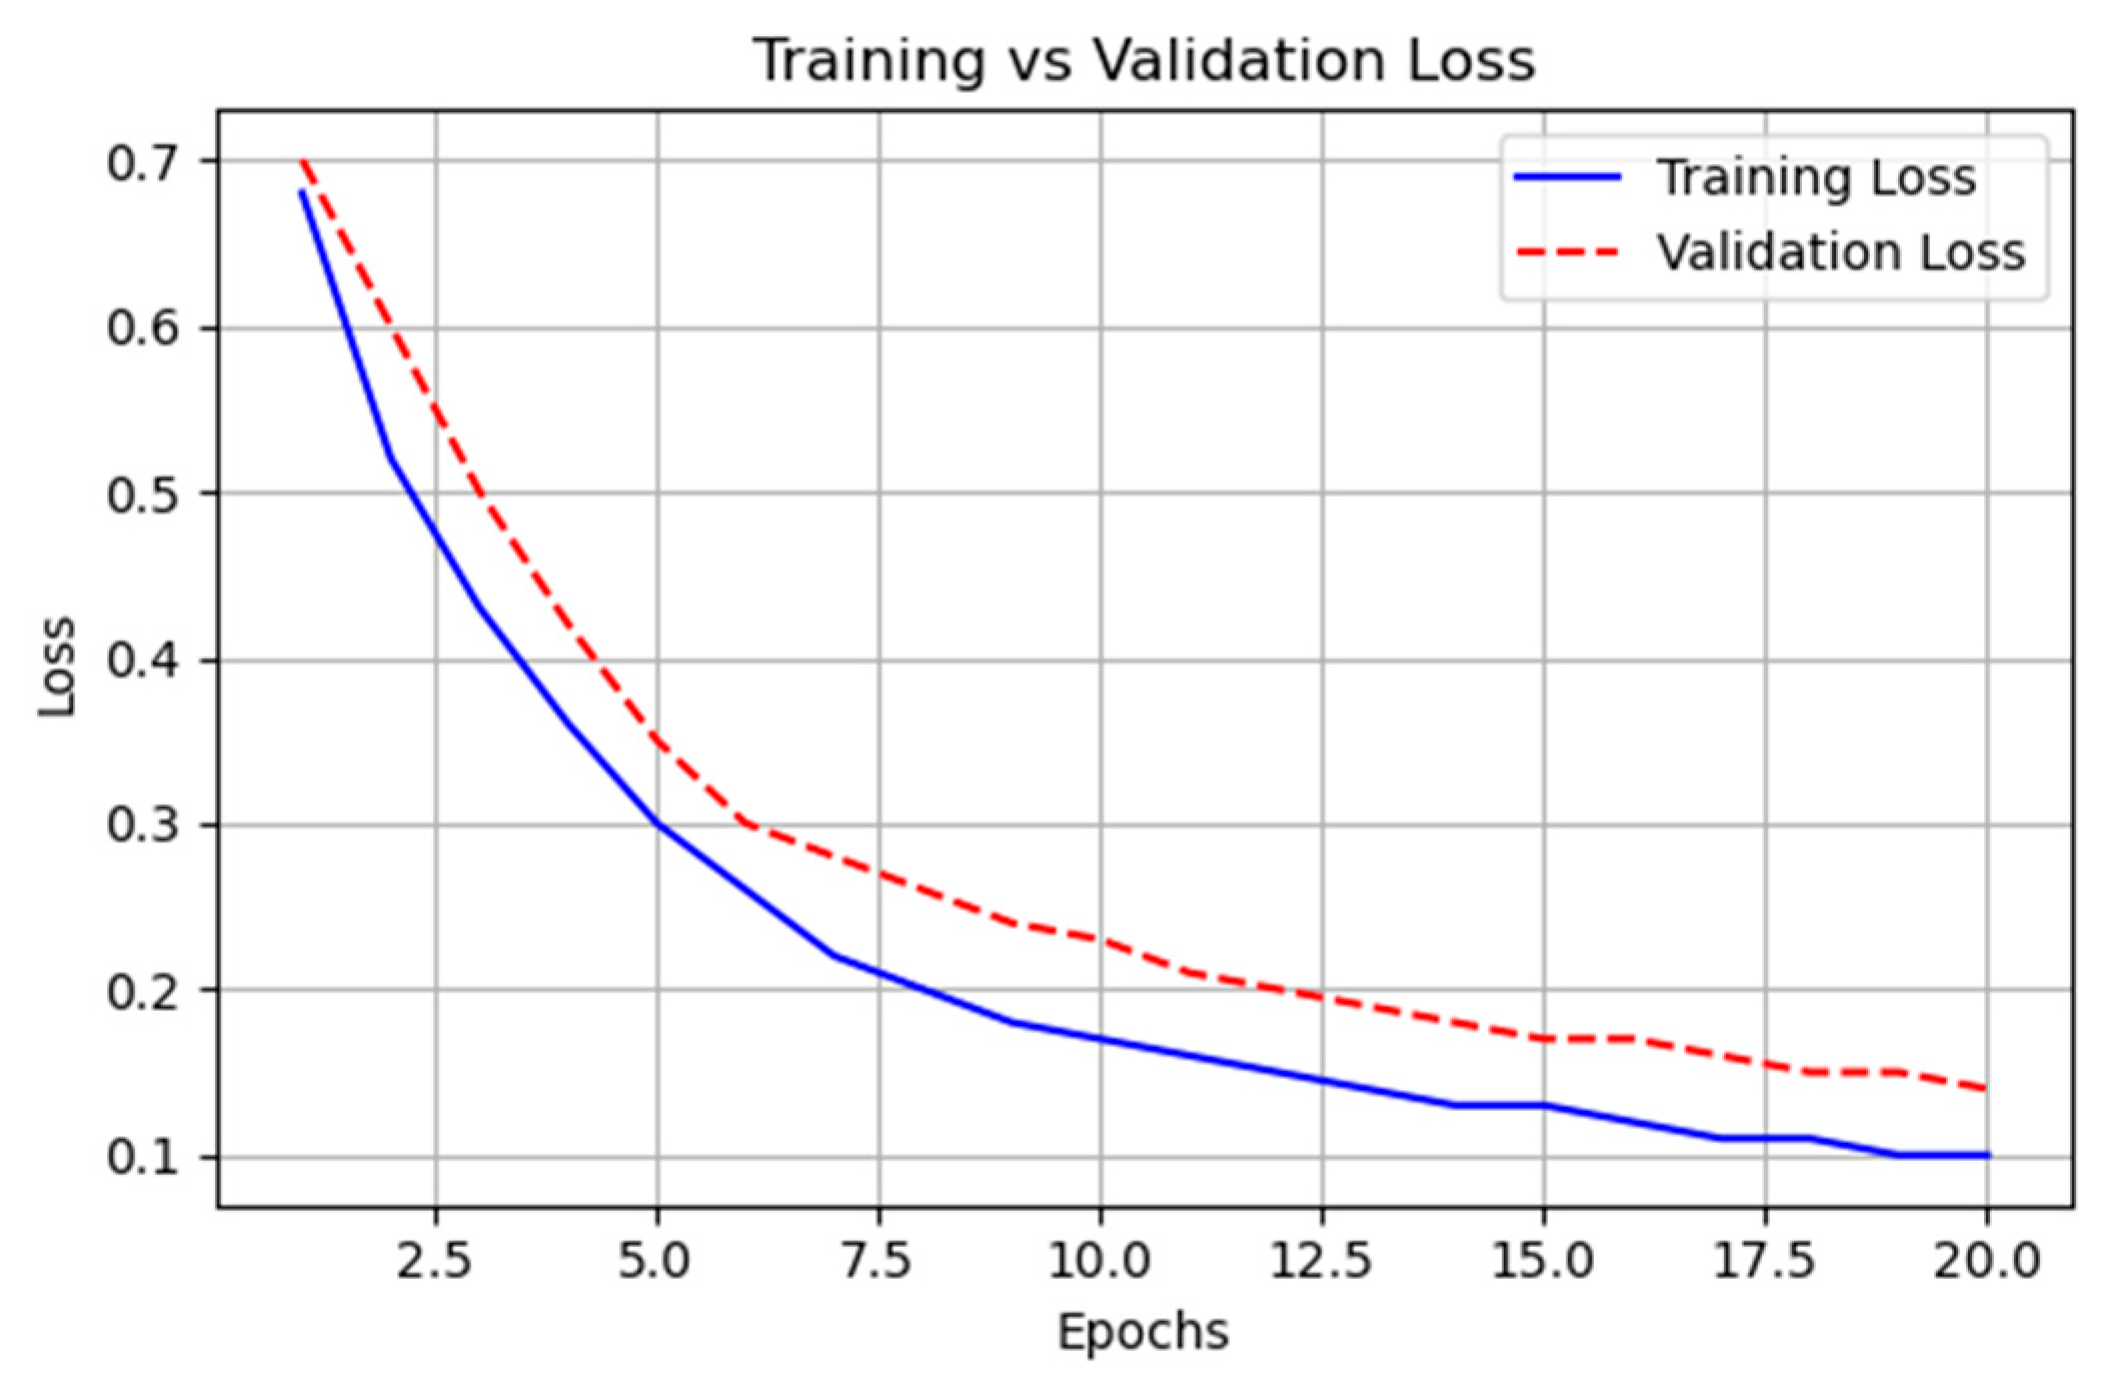
The study of loss metrics offers a comprehensive insight into the behavior of the model over time. Also noted is that the training loss diminishes as new epochs are reached, suggesting that the model is training appropriately concerning the data provided. At the same time, the validation loss also trends downward, closely matching the training loss, implying that overfitting is not present and that the model can generalize effectively to unseen data. The changes between training and validation losses of all epochs having a narrow margin indicate that the model is well-regularized and the system is properly balanced during training. All in all, these observations further confirm the confidence placed in the model, corroborating its capability to efficiently diagnose faults and classify multiple features from the dataset, besides accurately assessing indications [55]. Figure 15 shows the training loss vs. validation loss over epochs obtained by employing the proposed DBN–LightGBM for PV fault diagnostics.
The evaluation of the proposed model has been carried out by measuring accuracy, precision, recall, and F1 score for each class of fault encountered while evaluating the model. The evaluation shows that the model demonstrates reasonable and consistent performance in recognizing all fault categories, as well as the idle condition fault. Accuracy, which depicts the overall efficiency of the classifier, is consistent across all the classes, which indicates the model’s generalization ability across classes without underfitting. Precision indicates how correctly the model avoids false positive labels, and recall pertains to the true identification. Performance on both these measures being high indicates that preservation of both types of errors is low. The F1 score, which is the average of precision and recall, also affirms this to preserve the balance, which asserts the need to evaluate model performance under strong imbalance conditions when there is a critical need to reduce false positives and false negatives [56]. In general, the model demonstrates a high degree of classification accuracy for open circuits, bypass diode failures, shading effects, and other fault conditions. This shows that the proposed approach is appropriate for practical implementation in automated fault detection and diagnostic systems for photovoltaic and other electrical engineering applications, providing accuracy, stability, and reliability throughout varying operational conditions. Table 8 points out the performance evaluation metrics of the proposed model for each fault class employing the proposed architecture DBN–LightGBM.
Similarly, Table 9 provides a comprehensive comparison of several machine learning (ML), deep learning (DL), and hybrid techniques used in the literature for fault diagnosis and classification in photovoltaic (PV) systems. These are carefully selected intelligent algorithms evolved from conventional ML methods like support vector machines (SVM) and random forests (RF) to deep learning architectures such as convolutional neural networks (CNNs), long short-term memory (LSTM) networks, and hybrid models. The classification accuracy, alongside the advantages and disadvantages of particular techniques, is highlighted for each assigned technique. LSTM models are best suited for temporal PV datasets because of their time-series data processing capabilities; however, they are extremely tedious and complex to train. The precision of the hybrid model that combines the Deep Belief Network (DBN) with a Light Gradient Boosting Machine (LightGBM) achieves the best accuracy of 98.21%, outperforming DBN models DBN+GBM, DBN+XGBoost, and DBN+Catboost. This is due to the DBN’s hierarchical feature extraction with unsupervised pretraining and the classification capabilities of LightGBM, which is rapid, efficient, and generalized due to “overfitting” on unseen data. Each model compensates for the disadvantages induced by the other models to create a holistic model that optimizes accuracy, interpretability of results, and computational load.
Table 10 presents a comparative analysis of various models for photovoltaic (PV) fault diagnosis in terms of training time, inference speed, resource demand, and deployment feasibility. Deep learning models such as CNN, LSTM, and transformer-based approaches demonstrate strong performance but require high computational resources, limiting their edge deployment potential. Lightweight techniques like MiniROCKET + Ridge and CatBoost offer very fast inference and low resource demand, making them highly suitable for real-time and edge applications. The proposed DBN + LightGBM model achieves an optimal trade-off with moderate training requirements, very fast inference, and balanced resource utilization, ensuring high feasibility for SCADA-based edge deployment.

6. Conclusions and Future Work

This research examines a hybrid diagnostic framework designed to classify the abnormal conditions in photovoltaic (PV) modules. The model proposed in this research uses Deep Belief Networks (DBN) for hierarchical feature learning, and it is combined with the Light Gradient Boosting Machine (LightGBM) for classification. This model achieved the extraction of convoluted high-level features from raw PV data and assured accuracy and efficiency in the detection of fault types. When tested, the hybrid framework achieved an average accuracy of 98.21%, better than the standalone models. The normalized confusion matrix confirmed that the hybrid framework exhibits high performance when classifying straightforward and complex fault structures, showcasing the ability to adapt across diverse scenarios, a prerequisite for industrial deployment. The outstanding performance of the proposed model stems from its comprehensive data preprocessing pipeline, feature selection, and ensemble classification approach. Achieving better F1 score values for every fault category, these components impaired the overall precision and recall of the model. The combined feature of the DBN and LightGBM set supports their adaptability, which makes the framework a proposed intelligent PV fault diagnostic system. In general, the model marks important progress in PV monitoring. It provides an accurate and reliable diagnostic tool suitable for real-time use in large solar power plants. Further research may include logic optimization for better sensor data integration and improved responsiveness to changes in the environment.

Future Work

  • Implement the Wavelet Transform or Hilbert–Huang Transform to enhance time-series data preprocessing for extracting patterns focused on SCADA signal analysis.
  • Expand the fault dataset by capturing additional data streams under varying seasonal conditions, irradiance levels, and inverter loads to improve the accuracy of the hybrid DBN–LightGBM model.
  • Deploy real-time data processing frameworks and validate the proposed model against live SCADA data streams under diverse physical conditions.
  • Develop an integrated version of the model for deployment in diagnostic systems located at the inverter or plant controller level, optimizing the model for edge computing environments.
  • Explore cross-site or cross-plant model validation using transfer learning to assess model performance across multiple PV installations or geographic regions.
  • Establish benchmarks for diagnostic accuracy and computational efficiency by comparing the proposed approach with emerging ensemble and deep hybrid models, such as CNN-XGBoost and transformer-based classifiers.

Author Contributions

Conceptualization, M.A.K. and K.K.; methodology, K.K.; software, M.A.K.; validation, K.K., B.A. and M.U.N.; formal analysis, T.V.; investigation, A.K. and K.K.; resources, K.K.; data curation, M.A.K.; writing—original draft preparation, M.A.K. and K.K.; writing—review and editing, B.A.; visualization, B.A.; supervision, T.V. and A.K. All authors have read and agreed to the published version of the manuscript.

Funding

This research received no external funding.

Institutional Review Board Statement

Not applicable.

Informed Consent Statement

Not applicable.

Data Availability Statement

The original contributions presented in this study are included in the article. Further inquiries can be directed to the corresponding author.

Conflicts of Interest

Author K.K. was employed by the company Evecon OÜ. The remaining authors declare that the research was conducted in the absence of any commercial or financial relationships that could be construed as a potential conflict of interest.

References

  1. Mohamed Abd El Razik, A. The importance of solar energy projects in achieving sustainable development. Int. J. Adv. Res. Plan. Sustain. Dev. 2022, 5, 11–42. [Google Scholar] [CrossRef]
  2. Maka, A.O.; Alabid, J.M. Solar energy technology and its roles in sustainable development. Clean Energy 2022, 6, 476–483. [Google Scholar] [CrossRef]
  3. Hong, Y.Y.; Pula, R.A. Methods of photovoltaic fault detection and classification: A review. Energy Rep. 2022, 8, 5898–5929. [Google Scholar] [CrossRef]
  4. Mehmood, A.; Sher, H.A.; Murtaza, A.F.; Al-Haddad, K. Fault detection, classification and localization algorithm for photovoltaic array. IEEE Trans. Energy Convers. 2021, 36, 2945–2955. [Google Scholar] [CrossRef]
  5. Pimpalkar, R.; Sahu, A.; Patil, R.B.; Roy, A. A comprehensive review on failure modes and effect analysis of solar photovoltaic system. Mater. Today Proc. 2023, 77, 687–691. [Google Scholar] [CrossRef]
  6. Seghiour, A.; Ait Abbas, H.; Chouder, A.; Rabhi, A. Deep learning method based on autoencoder neural network applied to faults detection and diagnosis of photovoltaic system. Simul. Model. Pract. Theory 2023, 123, 102704. [Google Scholar] [CrossRef]
  7. Kaitouni, S.I.; AitAbdelmoula, I.; Es-sakali, N.; Mghazli, M.O.; Er-retby, H.; Zoubir, Z.; El Mansouri, F.; Ahachad, M.; Brigui, J. Implementing a Digital Twin-based fault detection and diagnosis approach for optimal operation and maintenance of urban distributed solar photovoltaics. Renew. Energy Focus 2024, 48, 100530. [Google Scholar] [CrossRef]
  8. Kandeal, A.W.; Elkadeem, M.R.; Thakur, A.K.; Abdelaziz, G.B.; Sathyamurthy, R.; Kabeel, A.E.; Yang, N.; Sharshir, S.W. Infrared thermography-based condition monitoring of solar photovoltaic systems: A mini review of recent advances. Sol. Energy 2021, 223, 33–43. [Google Scholar] [CrossRef]
  9. Umar, S.; Nawaz, M.U.; Qureshi, M.S. Deep learning approaches for crack detection in solar PV panels. Int. J. Adv. Eng. Technol. Innov. 2024, 1, 50–72. [Google Scholar]
  10. Abouobaida, H.; Abouelmahjoub, Y. New Diagnosis and Fault-Tolerant Control Strategy for Photovoltaic System. Int. J. Photoenergy 2021, 2021, 8075165. [Google Scholar] [CrossRef]
  11. Buffa, S.; Fouladfar, M.H.; Franchini, G.; Lozano Gabarre, I.; Andrés Chicote, M. Advanced control and fault detection strategies for district heating and cooling systems—A review. Appl. Sci. 2021, 11, 455. [Google Scholar] [CrossRef]
  12. Saberironaghi, A.; Ren, J.; El-Gindy, M. Defect detection methods for industrial products using deep learning techniques: A review. Algorithms 2023, 16, 95. [Google Scholar] [CrossRef]
  13. Alrifaey, M.; Lim, W.H.; Ang, C.K.; Natarajan, E.; Solihin, M.I.; Juhari, M.R.M.; Tiang, S.S. Hybrid deep learning model for fault detection and classification of grid-connected photovoltaic system. IEEE Access 2022, 10, 13852–13869. [Google Scholar] [CrossRef]
  14. Yousif, H.; Al-Milaji, Z. Fault detection from PV images using hybrid deep learning model. Sol. Energy 2024, 267, 112207. [Google Scholar]
  15. Qu, J.; Qian, Z.; Pei, Y.; Wei, L.; Zareipour, H.; Sun, Q. An unsupervised hourly weather status pattern recognition and blending fitting model for PV system fault detection. Appl. Energy 2022, 319, 119271. [Google Scholar] [CrossRef]
  16. Abubakar, A.; Jibril, M.M.; Almeida, C.F.; Gemignani, M.; Yahya, M.N.; Abba, S.I. A novel hybrid optimization approach for fault detection in photovoltaic arrays and inverters using AI and statistical learning techniques: A focus on sustainable environment. Processes 2023, 11, 2549. [Google Scholar] [CrossRef]
  17. Garud, K.S.; Jayaraj, S.; Lee, M.Y. A review on modeling of solar photovoltaic systems using artificial neural networks, fuzzy logic, genetic algorithm and hybrid models. Int. J. Energy Res. 2021, 45, 6–35. [Google Scholar]
  18. Chahine, K. Tree-Based Algorithms and Incremental Feature Optimization for Fault Detection and Diagnosis in Photovoltaic Systems. Eng 2025, 6, 20. [Google Scholar] [CrossRef]
  19. Berghout, T.; Benbouzid, M.; Bentrcia, T.; Ma, X.; Djurović, S.; Mouss, L.H. Machine learning-based condition monitoring for PV systems: State of the art and future prospects. Energies 2021, 14, 6316. [Google Scholar] [CrossRef]
  20. Mellit, A.; Kalogirou, S. Assessment of machine learning and ensemble methods for fault diagnosis of photovoltaic systems. Renew. Energy 2022, 184, 1074–1090. [Google Scholar] [CrossRef]
  21. Levent, İ.; Şahin, G.; Işık, G.; van Sark, W.G. Comparative Analysis of Advanced Machine Learning Regression Models with Advanced Artificial Intelligence Techniques to Predict Rooftop PV Solar Power Plant Efficiency Using Indoor Solar Panel Parameters. Appl. Sci. 2025, 15, 3320. [Google Scholar] [CrossRef]
  22. Nawaz, R.; Wadood, A.; Mehmood, K.K.; Bukhari, S.B.A.; Albalawi, H.; Alatwi, A.M.; Sajid, M. Gradient Boosting Feature Selection For Integrated Fault Diagnosis in Series-Compensated Transmission Lines. IEEE Access 2025, 13, 63640–63670. [Google Scholar] [CrossRef]
  23. Abdelsattar, M.; AbdelMoety, A.; Emad-Eldeen, A. Advanced machine learning techniques for predicting power generation and fault detection in solar photovoltaic systems. Neural Comput. Appl. 2025, 37, 8825–8844. [Google Scholar] [CrossRef]
  24. Suliman, F.; Anayi, F.; Packianather, M. Electrical faults analysis and detection in photovoltaic arrays based on machine learning classifiers. Sustainability 2024, 16, 1102. [Google Scholar] [CrossRef]
  25. Mansouri, M.; Trabelsi, M.; Nounou, H.; Nounou, M. Deep learning-based fault diagnosis of photovoltaic systems: A comprehensive review and enhancement prospects. IEEE Access 2021, 9, 126286–126306. [Google Scholar] [CrossRef]
  26. Veerasamy, V.; Wahab, N.I.A.; Othman, M.L.; Padmanaban, S.; Sekar, K.; Ramachandran, R.; Hizam, H.; Vinayagam, A.; Islam, M.Z. LSTM recurrent neural network classifier for high impedance fault detection in solar PV integrated power system. IEEE Access 2021, 9, 32672–32687. [Google Scholar] [CrossRef]
  27. Amiri, A.F.; Kichou, S.; Oudira, H.; Chouder, A.; Silvestre, S. Fault detection and diagnosis of a photovoltaic system based on deep learning using the combination of a convolutional neural network (cnn) and bidirectional gated recurrent unit (Bi-GRU). Sustainability 2024, 16, 1012. [Google Scholar] [CrossRef]
  28. Kumari, P.; Toshniwal, D. Long short term memory–convolutional neural network based deep hybrid approach for solar irradiance forecasting. Appl. Energy 2021, 295, 117061. [Google Scholar] [CrossRef]
  29. Yuan, Z.; Xiong, G.; Fu, X. Artificial neural network for fault diagnosis of solar photovoltaic systems: A survey. Energies 2022, 15, 8693. [Google Scholar] [CrossRef]
  30. Eldeghady, G.S.; Kamal, H.A.; Hassan, M.A.M. Fault diagnosis for PV system using a deep learning optimized via PSO heuristic combination technique. Electr. Eng. 2023, 105, 2287–2301. [Google Scholar] [CrossRef]
  31. Ghorbani, N.; Kasaeian, A.; Toopshekan, A.; Bahrami, L.; Maghami, A. Optimizing a hybrid wind-PV-battery system using GA-PSO and MOPSO for reducing cost and increasing reliability. Energy 2018, 154, 581–591. [Google Scholar] [CrossRef]
  32. Qian, Y.L.; Zhang, H.; Peng, D.G.; Huang, C.H. Fault diagnosis for generator unit based on RBF neural network optimized by GA-PSO. In Proceedings of the 2012 8th International Conference on Natural Computation, Chongqing, China, 29–31 May 2012; IEEE: New York, NY, USA, 2012; pp. 233–236. [Google Scholar]
  33. Karthikeyan, G.; Jagadeeshwaran, A. Enhancing solar energy generation: A comprehensive machine learning-based PV prediction and fault analysis system for real-time tracking and forecasting. Electr. Power Compon. Syst. 2024, 52, 1497–1512. [Google Scholar] [CrossRef]
  34. Leite, D.; Andrade, E.; Rativa, D.; Maciel, A.M. Fault Detection and Diagnosis in Industry 4.0: A Review on Challenges and Opportunities. Sensors 2024, 25, 60. [Google Scholar] [CrossRef]
  35. Aghaei, M.; Kolahi, M.; Nedaei, A.; Venkatesh, N.S.; Esmailifar, S.M.; Moradi Sizkouhi, A.M.; Aghamohammadi, A.; Oliveira, A.K.; Eskandari, A.; Parvin, P.; et al. Autonomous Intelligent Monitoring of Photovoltaic Systems: An In-Depth Multidisciplinary Review. Prog. Photovolt. Res. Appl. 2025, 33, 381–409. [Google Scholar] [CrossRef]
  36. Iqbal, S.; Hasan, S.M.; Ayaz, Y.; Din, E.U.; Waqas, A.; Sajid, M. Condition Monitoring of Photovoltaic Panels through Electrical Impedance Spectroscopy and Machine Learning Focusing on Temperature, Dust and Microcracks. IEEE Access 2025, 13, 53039–53052. [Google Scholar] [CrossRef]
  37. Sairam, S.; Seshadhri, S.; Marafioti, G.; Srinivasan, S.; Mathisen, G.; Bekiroglu, K. Edge-based Explainable Fault Detection Systems for photovoltaic panels on edge nodes. Renew. Energy 2022, 185, 1425–1440. [Google Scholar] [CrossRef]
  38. Noura, H.N.; Allal, Z.; Salman, O.; Chahine, K. Explainable artificial intelligence of tree-based algorithms for fault detection and diagnosis in grid-connected photovoltaic systems. Eng. Appl. Artif. Intell. 2025, 139, 109503. [Google Scholar] [CrossRef]
  39. Hassan, I.; Alhamrouni, I.; Younes, Z.; Azhan, N.H.; Mekhilef, S.; Seyedmahmoudian, M.; Stojcevski, A. Explainable deep learning model for grid connected photovoltaic system performance assessment for improving system relaibility. IEEE Access 2024, 12, 120729–120746. [Google Scholar] [CrossRef]
  40. Li, B.; Delpha, C.; Migan-Dubois, A.; Diallo, D. Fault diagnosis of photovoltaic panels using full I–V characteristics and machine learning techniques. Energy Convers. Manag. 2021, 248, 114785. [Google Scholar] [CrossRef]
  41. Wang, J.; Gao, D.; Zhu, S.; Wang, S.; Liu, H. Fault diagnosis method of photovoltaic array based on support vector machine. Energy Sources Part A Recovery Util. Environ. Eff. 2023, 45, 5380–5395. [Google Scholar] [CrossRef]
  42. Lu, X.; Lin, P.; Cheng, S.; Lin, Y.; Chen, Z.; Wu, L.; Zheng, Q. Fault diagnosis for photovoltaic array based on convolutional neural network and electrical time series graph. Energy Convers. Manag. 2019, 196, 950–965. [Google Scholar] [CrossRef]
  43. Ferlito, S.; Ippolito, S.; Santagata, C.; Schiattarella, P.; Di Francia, G. A Study on an IoT-Based SCADA System for Photovoltaic Utility Plants. Electronics 2024, 13, 2065. [Google Scholar] [CrossRef]
  44. Ahsan, L.; Baig, M.J.A.; Iqbal, M.T. Low-Cost, Open-Source, Emoncms-Based SCADA System for a Large Grid-Connected PV System. Sensors 2022, 22, 6733. [Google Scholar] [CrossRef]
  45. Qays, M.O.; Ahmed, M.M.; Parvez Mahmud, M.A.; Abu-Siada, A.; Muyeen, S.M.; Hossain, M.L.; Yasmin, F.; Rahman, M.M. Monitoring of renewable energy systems by IoT-aided SCADA system. Energy Sci. Eng. 2022, 10, 1874–1885. [Google Scholar] [CrossRef]
  46. Vodapally, S.N.; Ali, M.H. Overview of intelligent inverters and associated cybersecurity issues for a grid-connected solar photovoltaic system. Energies 2023, 16, 5904. [Google Scholar] [CrossRef]
  47. Hassan, Y.B.; Orabi, M.; Gaafar, M.A. Failures causes analysis of grid-tie photovoltaic inverters based on faults signatures analysis (FCA-B-FSA). Sol. Energy 2023, 262, 111831. [Google Scholar] [CrossRef]
  48. Song, R.; Wang, Z.; Guo, L.; Zhao, F.; Xu, Z. Deep belief networks (DBN) for financial time series analysis and market trends prediction. World J. Innov. Mod. Technol. 2024, 7, 1–10. [Google Scholar] [CrossRef]
  49. Wang, H.Y.; Chen, B.; Pan, D.; Lv, Z.A.; Huang, S.Q.; Khayatnezhad, M.; Jimenez, G. Optimal wind energy generation considering climatic variables by Deep Belief network (DBN) model based on modified coot optimization algorithm (MCOA). Sustain. Energy Technol. Assess. 2022, 53, 102744. [Google Scholar] [CrossRef]
  50. Zambra, M.; Testolin, A.; Zorzi, M. A developmental approach for training deep belief networks. Cogn. Comput. 2023, 15, 103–120. [Google Scholar] [CrossRef]
  51. Hartanto, A.D.; Kholik, Y.N.; Pristyanto, Y. Stock price time series data forecasting using the light gradient boosting machine (LightGBM) model. JOIV Int. J. Inform. Vis. 2023, 7, 2270–2279. [Google Scholar]
  52. Sivagamasundari, S.; Rayudu, M.S. IoT based solar panel fault and maintenance detection using decision tree with light gradient boosting. Meas. Sens. 2023, 27, 100726. [Google Scholar]
  53. Rajalakshmi, D.; Sudharson, K.; Suresh Kumar, A.; Vanitha, R. Advancing Fault Detection Efficiency in Wireless Power Transmission with Light GBM for Real-Time Detection Enhancement. Int. Res. J. Multidiscip. Technovation 2024, 6, 54–68. [Google Scholar] [CrossRef]
  54. Adhya, D.; Chatterjee, S.; Chakraborty, A.K. Performance assessment of selective machine learning techniques for improved PV array fault diagnosis. Sustain. Energy Grids Netw. 2022, 29, 100582. [Google Scholar] [CrossRef]
  55. Kellil, N.; Aissat, A.; Mellit, A. Fault diagnosis of photovoltaic modules using deep neural networks and infrared images under Algerian climatic conditions. Energy 2023, 263, 125902. [Google Scholar] [CrossRef]
  56. Joshua, S.R.; Yeon, A.N.; Park, S.; Kwon, K. A Hybrid Machine Learning Approach: Analyzing Energy Potential and Designing Solar Fault Detection for an AIoT-Based Solar–Hydrogen System in a University Setting. Appl. Sci. 2024, 14, 8573. [Google Scholar]
  57. Cai, X.; Wai, R.J. Intelligent DC arc-fault detection of solar PV power generation system via optimized VMD-based signal processing and PSO–SVM classifier. IEEE J. Photovolt. 2022, 12, 1058–1077. [Google Scholar]
  58. Syed, S.S.; Li, B.; Zheng, A. Detection and Classification of Physical and Electrical Fault in PV Array System by Random Forest-Based Approach. Int. J. Electr. Energy Power Syst. Eng. 2024, 7, 67–84. [Google Scholar] [CrossRef]
  59. Teta, A.; Korich, B.; Bakria, D.; Hadroug, N.; Rabehi, A.; Alsharef, M.; Bajaj, M.; Zaitsev, I.; Ghoneim, S.S. Fault detection and diagnosis of grid-connected photovoltaic systems using energy valley optimizer based lightweight CNN and wavelet transform. Sci. Rep. 2024, 14, 18907. [Google Scholar] [CrossRef] [PubMed]
  60. Prasshanth, C.V.; Venkatesh, N.; Sugumaran, V.; Aghaei, M. Enhancing photovoltaic module fault diagnosis: Leveraging unmanned aerial vehicles and autoencoders in machine learning. Sustain. Energy Technol. Assess. 2024, 64, 103674. [Google Scholar] [CrossRef]
  61. Hu, Z.; Xia, K.; Fan, Z.; Chang, K.; Wu, D. A novel switch open-circuit fault diagnostic method for three-phase inverter based on PSO-DBN. In Proceedings of the 2022 9th International Forum on Electrical Engineering and Automation (IFEEA), Zhuhai, China, 4–6 November 2022; IEEE: New York, NY, USA, 2022; pp. 802–806. [Google Scholar]
  62. Et-taleby, A.; Chaibi, Y.; Allouhi, A.; Boussetta, M.; Benslimane, M. A combined convolutional neural network model and support vector machine technique for fault detection and classification based on electroluminescence images of photovoltaic modules. Sustain. Energy Grids Netw. 2022, 32, 100946. [Google Scholar] [CrossRef]
  63. Alhanaf, A.S.; Farsadi, M.; Balik, H.H. Fault detection and classification in ring power system with DG penetration using hybrid CNN-LSTM. IEEE Access 2024, 12, 59953–59975. [Google Scholar] [CrossRef]
  64. Aslam, S.; Kumar, K.V.; Babu, T.A.; Rajesh, P. Hamiltonian deep neural network technique optimized with lyrebird optimization algorithm for detecting and classifying power quality disturbances in PV combined DC microgrids system. Environ. Dev. Sustain. 2025, 1–24. [Google Scholar] [CrossRef]
  65. Sridharan, N.V.; Sugumaran, V. Visual fault detection in photovoltaic modules using decision tree algorithms with deep learning features. Energy Sources Part A Recovery Util. Environ. Eff. 2025, 47, 2020379. [Google Scholar] [CrossRef]
  66. Kuo, R.J.; Xu, Z.X. Predictive maintenance for wire drawing machine using MiniRocket and GA-based ensemble method. Int. J. Adv. Manuf. Technol. 2024, 134, 1661–1676. [Google Scholar] [CrossRef]
  67. Zhang, X.; Yang, K.; Zheng, L. Transformer fault diagnosis method based on timesnet and informer. Actuators 2024, 13, 74. [Google Scholar] [CrossRef]
  68. Wang, Z.; Wang, C.; Ke, Q.; Zhang, B.; Wang, Y.; Zeng, S.; Kang, T.; Lan, T.; Liu, Z.; Liu, C. A fault diagnosis method based on TCN-LSTM-SE neural networks for distributed PV systems. In Proceedings of the 2024 IEEE 2nd International Conference on Sensors, Electronics and Computer Engineering (ICSECE), Jinzhou, China, 29–31 August 2024; IEEE: New York, NY, USA, 2024; pp. 183–189. [Google Scholar]
  69. Liu, B.; Sun, K.; Wang, X.; Zhao, J.; Hou, X. Fault diagnosis of photovoltaic strings by using machine learning-based stacking classifier. IET Renew. Power Gener. 2024, 18, 384–397. [Google Scholar] [CrossRef]
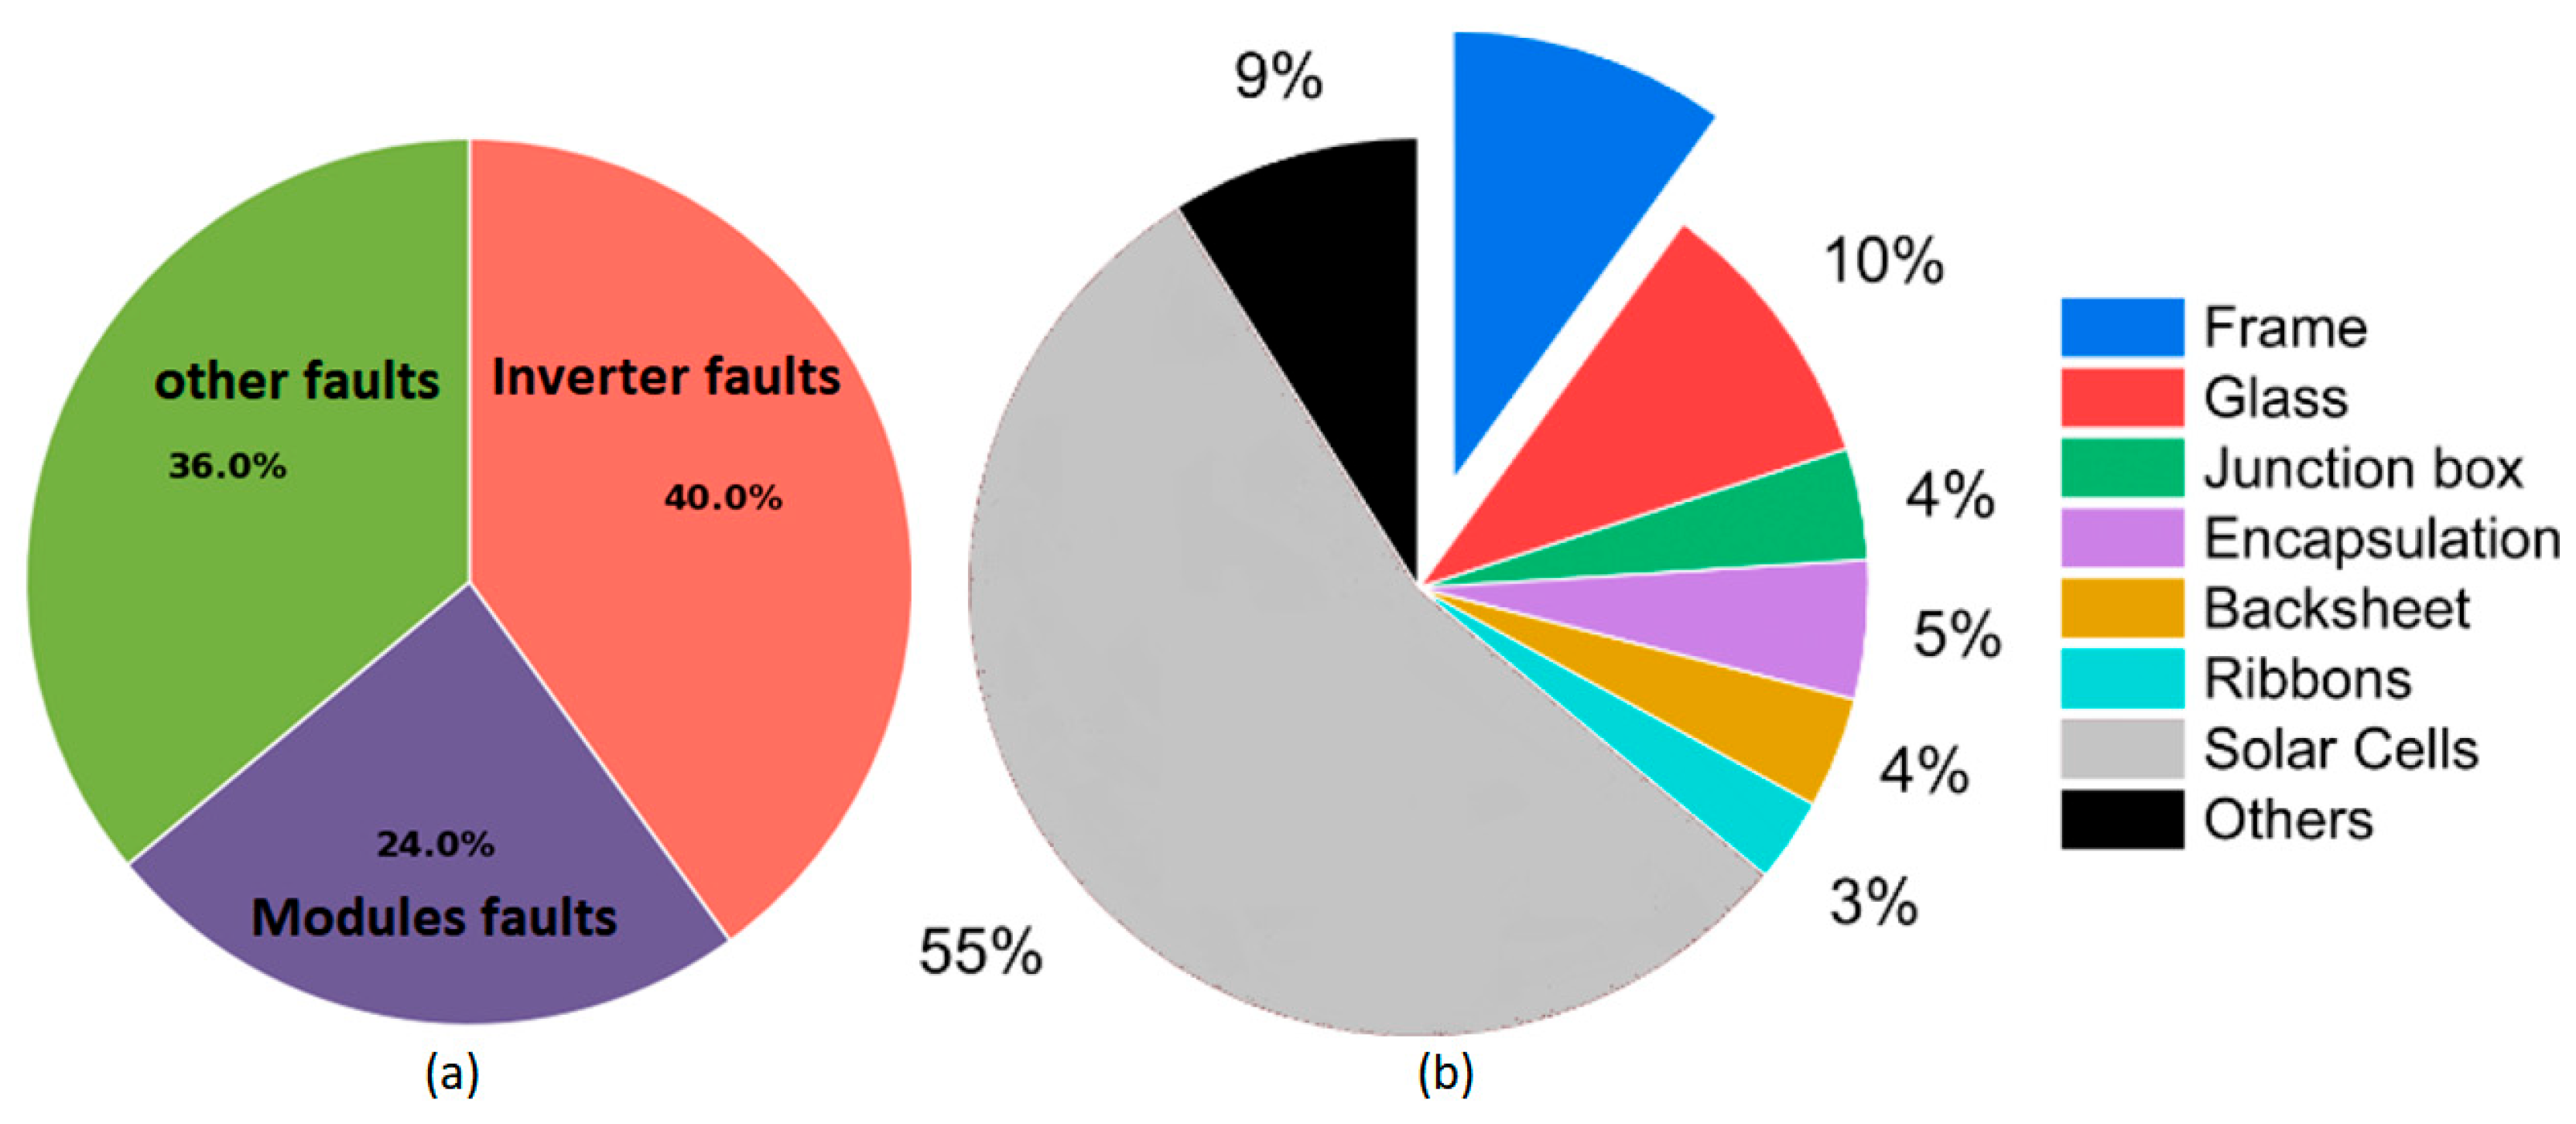
Figure 1. Distribution of failures in photovoltaic systems: (a) percentage distribution of failures across different subsystems (inverter, solar panel, and other failures); (b) percentage distribution of various PV module defects [5].
Electronics 14 03649 g001
Figure 2. Schematic diagram of a grid-tied solar power system with a battery storage system.
Electronics 14 03649 g002
Figure 3. A comprehensive categorization of faults in photovoltaic arrays: physical, environmental, and electrical failures.
Electronics 14 03649 g003
Figure 4. Hypothesis and variable structure model.
Electronics 14 03649 g004
Figure 5. Architectural workflow of the proposed A-DBN–LightGBM hybrid model featuring feedback-based feature refinement mechanism.
Electronics 14 03649 g005
Figure 6. Hybrid deep learning architecture: integration of Deep Belief Network (DBN) with LightGBM classifier.
Electronics 14 03649 g006
Figure 7. Architecture of an Adaptive Deep Belief Feature extractor for intelligent SCADA systems.
Electronics 14 03649 g007
Figure 8. A view of installed PV panels JA 255 W and other equipment at the QASP site.
Electronics 14 03649 g008
Figure 9. I-V and P-V characteristics of the JA 255 W solar panel under different conditions at STC (a) current–voltage characteristics under varying irradiance, (b) power–voltage characteristics under varying irradiance, and (c) current–voltage characteristics under varying temperatures.
Electronics 14 03649 g009
Figure 10. End-to-end data acquisition and monitoring architecture from PV array to SCADA interface for data monitoring and measurement.
Electronics 14 03649 g010
Figure 11. Proposed Fault Diagnosis Framework for solar PV systems employing DBN and LightGBM.
Electronics 14 03649 g011
Figure 12. Module temperature (°C) distribution graphs for various PV system conditions: (a) Healthy, (b) Over current, (c) Soiling Fault, (d) Partial Shedding, (e) Busbar Fault, (f) PVG Fault, and (g) Hot Spot Fault.
Electronics 14 03649 g012
Figure 13. Current (red), voltage (green), and irradiance (blue) profiles under various PV system conditions for: (a) healthy—stable behavior; (b) over current—high current peaks; (c) soiling—reduced current under normal irradiance; (d) partial shading—irregular current drops; (e) busbar fault—fluctuations in both current and voltage; (f) PVG fault—zero current with stable voltage and irradiance; (g) hotspot—sudden voltage/current drops during peak irradiance.
Electronics 14 03649 g013
Figure 14. (a): Confusion matrix; (b): ROC curve for PV fault classification using proposed architecture, Adaptive DBN–LightGBM.
Electronics 14 03649 g014
Figure 15. Training loss vs. validation loss over epochs.
Electronics 14 03649 g015
Table 1. Summary of Hybrid Models for PV Fault Detection.
Hybrid ModelFeature ExtractionClassifierKey StrengthsAccuracy (%)Macro-F1 (%)Computational EfficiencyDataset Used
CNN + SVM CNNSVMExcellent for image-based faults97.697.2High training cost, moderate inferenceQPV-FDV
LSTM + XGBoostLSTMXGBoostHandles sequential/time-series data97.997.5High training cost, slower inferenceQPV-FDV
Autoencoder + RF AutoencoderRFRobust anomaly detection, noise tolerance97.296.8ModerateQPV-FDV
PCA + GBMPCAGBMDimensionality reduction + boosting96.996.5Very efficientQPV-FDV
DBN + LightGBM (Proposed)DBNLightGBMHigh accuracy, fast training, interpretability98.2198.0Moderate training, fast inferenceQPV-FDV
Table 2. Capabilities of the proposed DBN–LightGBM hybrid framework.
Sr. No.CapabilityAssociated ComponentContribution of the Proposed ApproachBenefit for PV Fault DiagnosisComplexity Level
1Adaptability to Varying PV Fault PatternsDBNLearns hierarchical features adaptively for diverse and evolving PV fault signatures.Detects a wide range of fault modes without manual tuningModerate
2Enhanced Classification PerformanceDBN + LightGBMHybrid integration ensures superior accuracy and generalization over standalone models.Improves diagnostic reliability across fault conditionsHigh
3Robustness to Noisy and Non-Linear DataDBN + LightGBMDBN captures hidden dependencies; LightGBM manages noisy and irregular PV signals.Stable performance even under sensor noiseModerate
4Hybrid Deep–Shallow Learning SynergyDBN + LightGBMCombines representational strength of deep networks with efficient boosting.Achieves optimal trade-off between accuracy and speedHigh
5Improved Model TransparencyLightGBMProvides feature importance metrics for interpretability and engineering insights.Helps engineers understand the root causes of PV faultsLow
Table 3. Summary of recent hybrid models for PV fault diagnosis.
MethodologyFeature ExtractionClassificationAccuracyHighlightsYearReference
ResNet–XGBoostResNetXGBoost97.0%Combines deep ResNet features with powerful XGBoost classification.2023[23]
CNN–SVMCNNSVM93.5%Leverages CNN for spatial features and SVM for robust classification.2023[24]
Bi-LSTM–XGBoostBi-LSTMXGBoost94.9%Captures temporal patterns with Bi-LSTM and efficient boosting with XGBoost2023[25]
RNN–SVMRNNSVM92.1%Sequential learning of RNN with the generalizing power of SVM2023[26]
Hybrid PCA–XGBoostPCAXGBoost91.8%Dimensionality reduction using PCA followed by XGBoost classification2023[27]
ResNet + RFResNetRandom Forest96.9%Uses deep feature extraction with ensemble RF for high accuracy2023[28]
Autoencoder–SVMAutoencoderSVM92.5%Unsupervised feature learning via autoencoder, classified by SVM2023[29]
CNN–RF–XGBoostCNNRF + XGBoost96.4%A tri-level hybrid integrating deep and ensemble learners2024[30]
GRU–SVMGRUSVM93.2%Temporal modeling using GRU, paired with efficient SVM2024[31]
Dense Net–RFDense NetRandom Forest95.6%Dense connections for better feature reuse, classified by RF2024[32]
CNN–GBMCNNGradient Boosting95.1%Deep CNN features with a strong boosting-based classifier2024[33]
AE–RF hybridAutoencoderRandom Forest93.4%Combines unsupervised encoding with ensemble classification2024[34]
VGG16–XGBoostVGG16XGBoost97.2%Strong visual feature extractor with accurate boosting2024[35]
GRU–LightGBMGRULightGBM94.3%Sequential data modeling with fast and accurate LightGBM2024[36]
Hybrid CNN–RF modelCNNRandom Forest96.5%Merges convolutional features with RF ensemble for performance boost2025[37]
LSTM–CatBoost modelLSTMCatBoost95.8%Temporal modeling via LSTM and category-aware boosting with CatBoost2025[38]
LSTM–RF modelLSTMRandom Forest94.7%Long-term temporal learning with a robust ensemble classifier2025[39]
PCA + Gradient BoostingPrincipal Component Analysis (PCA)Gradient Boosting Machine97.3%Efficient feature reduction with powerful ensemble boosting2025[40]
CNN–LightGBMCNNLightGBM96.0%CNN-driven feature maps classified with fast LightGBM2025[41]
AE–CatBoostAutoencoderCatBoost94.8%Efficient representation learning with fast gradient boosting2025[42]
DBN–LightGBMDeep Belief NetworkLightGBM98.2%Deep feature learning with DBN and superior boosting via LightGBM2025Proposed work
Table 4. Optimized hyperparameters for DBN–LightGBM hybrid model in PV fault diagnosis.
HyperparameterDescriptionModel ComponentValue
learning_rateControls the speed of DBN weight updates; smaller values improve stability.DBN0.01
batch_sizeNumber of samples per iteration affects convergence stability.DBN64
n_hidden_layersNumber of RBM layers: deeper networks enhance representation.DBN3
hidden_unitsNeuron per hidden layer determines model capacity.DBN[128, 64, 32]
activation_functionEnables non-linear feature learning.DBNReLu
n_estimatorsTotal trees in boosting balances accuracy and speed.LightGBM200
learning_rateTree contribution per round; lower values improve generalization.LightGBM0.05
max_depthTree depth captures complexity but may overfit.LightGBM9
subsampleThe data fraction used per tree reduces overfitting risk.LightGBM0.8
eval_metricLoss function for optimization; suitable for multi-class tasks.LightGBMlog loss
Table 5. JA 255 W solar module electrical specifications.
ParameterSymbolValueUnit
Peak Power P m a x 255W
Open Circuit Voltage V o c 37.82V
Voltage at Maximum Power V m p 30.29V
Short Circuit Current I s c 8.98A
Current at Maximum Power I m p 8.42A
Power Tolerance0 to +5W
Table 6. Summary of QASP PV Fault Detection Dataset.
Sr. No.Fault TypeCause DescriptionData PointsLabel
1HealthyNormal operating conditions with no visible or electrical fault.19,945Healthy
2Open CircuitA break in the circuit path caused by disconnected wiring or cracked cell connections.19,782OC
3PVG FaultGrounding fault is where one or more conductors make contact with the earth.19,925PVG
4Partial ShadingCaused by clouds, dust, trees, or nearby structures blocking solar irradiance.20,101PS
5Busbar FaultCaused by micro-cracks or corrosion, interrupting current flow in busbars.19,832BBF
6Soiling FaultDue to dust, bird droppings, or pollution accumulating on the panel surface.19,793SF
7Hotspot FaultLocalized overheating due to cell damage or shading leads to reduced output.19,917HSF
Table 7. Feature importance ranking from LightGBM.
RankFeature NameImportance Score (%)Interpretation in PV Fault Context
1Irradiance18.7Strongly affects power generation; deviations often indicate shading or panel soiling.
2Module Temperature16.5High sensitivity to thermal faults, hotspots, and cooling inefficiencies.
3DC Current ( I d c )13.2Fluctuations reflect string-level mismatch or partial faults.
4DC Voltage ( V d c )12.8Drop in voltage indicates disconnection or bypass diode failures.
5AC Power Output11.3Direct measure of energy loss and overall system health.
6Inverter Efficiency8.9Critical for identifying inverter-related degradation.
7Ambient Temperature7.5External condition influencing the thermal behavior of modules.
8Reactive Power (Q)6.1Useful for capturing inverter imbalance and grid compliance issues.
9Frequency (Hz)3.0Stability indicator: variations may point to grid disturbances.
10Wind Speed2.0Secondary factor influencing cooling and structural stress.
Table 8. Performance evaluation metrics of the proposed model for each fault class, employing the proposed architecture DBN–LightGBM.
Fault ClassPCN (%)Accuracy (%)Precision (%)Recall (%)F1 Score (%)Specificity (%)Support
Healthy97.697.696.6692.694.5998.55983
Over current98.898.899.8299.3899.699.95935
PVG97.897.897.3197.3197.3198.65978
Partial Shading98.198.197.8596.8997.3698.96030
BBF98.098.097.895.9596.8698.75949
SF98.698.6100.099.7599.8899.85937
HSF99.699.5798.7899.4399.199.95975
Macro Avg98.0798.0698.3297.6197.9699.06-
Weighted Avg98.0698.0698.3397.6997.9599.02-
Table 9. Summary of previously used machine learning, deep learning, and hybrid models for fault diagnosis.
ReferenceModel TypeAchieved AccuracyProsConsKey AchievementsComputational Efficiency
[57]SVM92.5%Simple, fast, and effective for small datasetsLimited scalability, sensitive to feature selectionEffective for linearly separable fault classesVery fast training/inference on small datasets but scales poorly with large samples.
[58]Random Forest94.3%Handles high-dimensional data, robust to noiseProne to overfitting with small datasetsGood generalization for non-linear patternsModerate training speed, inference is efficient but memory-heavy for many trees.
[59]CNN96.8%Automatic feature extraction from raw signalsRequires large data, computationally heavyAccurate in identifying complex fault patternsHigh GPU demand, slow training; inference moderate
[60]LSTM97.2%Captures time dependencies, ideal for time seriesSlower training, overfitting risk with long sequencesStrong temporal learning for vibration-based signalsTraining slower due to sequential processing; inference is moderate
[61]DBN96.0%Layer-wise feature learning, unsupervised pretrainingComplex structure, slower convergenceGood hierarchical abstraction for feature representationsTraining time is high, inference moderate
[62]CNN + SVM97.6%Combines deep features with a simple classifierSVM still needs careful tuningThe hybrid improved both training time and accuracyTraining is costly (CNN), but inference is faster after SVM integration
[63]LSTM + RF98.0%Combines temporal features with ensemble predictionIncreased model complexityStrong for multivariate sequence inputTraining moderately slow; inference slower than single models
[64]CNN-LSTM Hybrid97.9%Learns both spatial and temporal dependenciesComputationally demanding, tuning complexityEffective in extracting spatiotemporal featuresVery high GPU demand for training, inference is slower than pure CNN/LSTM
[65]Inception Time98.0%Strong multivariate time-series classifier, captures multi-scale patternsRequires large training data, heavy model sizeState-of-the-art accuracy on industrial TS datasetsTraining is heavy but parallelizable; inference is fast once trained
[66]MiniROCKET + Ridge97.8%Very fast training, lightweight, high accuracyLimited interpretability, feature-based, not fully deepEfficient TS classification with competitive accuracyExtremely fast training and inference; CPU-friendly
[67]Transformer (TST/TimesNet)98.1%Captures long-range dependencies, flexible for sequence modelingRequires more data, computationally expensiveCutting-edge performance in time-series tasksTraining is very expensive; inference is slower than CNN/LSTM
[68]Temporal Conv. Network (TCN)97.6%Parallelizable, handles long sequences with dilated convolutionsRequires careful kernel/dilation tuningGood balance of accuracy and efficiencyFaster training than LSTM, inference is efficient
[69]CatBoost97.5%Handles categorical features, with less tuning than LightGBMSlightly slower training than LightGBMRobust gradient boosting with stable accuracyTraining moderate; inference efficient, CPU-friendly
ProposedDBN + LightGBM (Proposed)98.21%Efficient training, high precision, and interpretable via feature importanceSlightly increased preprocessing and model integrationOutperforms existing models in fault classification performanceBalanced training cost; inference is very fast due to LightGBM
Table 10. Computational cost, inference speed, and deployment feasibility of state-of-the-art models.
ReferenceModel TypeTraining Time (Relative)Inference Time per SampleMemory/Resource DemandDeployment Feasibility
[59]CNNHigh (~1.5 h)Moderate (~25 ms)High GPU requiredLimited (GPU needed)
[60]LSTMHigh (~1.2 h)Moderate (~30 ms)Moderate-HighFeasible with GPU/High CPU
[63]LSTM + RFVery High (~2.1 h)Slow (~35 ms)HighLimited, not edge-suitable
[64]CNN-LSTM HybridVery High (~1.5 h)Slow (~40 ms)Very High GPU demandLimited (GPU only)
[65]Inception TimeHigh (~1.8 h)Fast (~15 ms)High, parallelizableFeasible with GPU/Server
[66]MiniROCKET + RidgeVery Low (~10 min)Very Fast (~5 ms)Low, CPU-friendlyExcellent for Edge deployment
[67]Transformer (TST/TimesNet)Very High (~4 h)Slow (~30 ms)Very High (GPU clusters)Limited (Data center preferred)
[68]Temporal Conv. NetworkModerate (~1.5 h)Fast (~12 ms)ModerateGood balance; feasible with CPU/GPU
[69]CatBoostModerate (~45 min)Fast (~8 ms)Low-ModerateEdge/Server feasible
ProposedDBN + LightGBMModerate (~35 min)Very Fast (~12 ms)Moderate, CPU/GPUHighly feasible for SCADA edge deployment
Disclaimer/Publisher’s Note: The statements, opinions and data contained in all publications are solely those of the individual author(s) and contributor(s) and not of MDPI and/or the editor(s). MDPI and/or the editor(s) disclaim responsibility for any injury to people or property resulting from any ideas, methods, instructions or products referred to in the content.