Abstract
Energy is a vital component of life today, and providing reliable power access remains a significant global challenge, particularly in remote areas. In Egypt, several isolated regions, including parts of South Sinai, suffer from limited electricity access. This study presents an enhanced environmental and techno-economic modeling of an off-grid hybrid renewable energy microgrid (HREM) tailored for such regions. A proposed configuration combining photovoltaic (PV) panels, wind turbines (WTs), a converter (CONV), and battery energy storage is evaluated to meet the residential energy demand of an isolated community in South Sinai. Four feasible system models, PV/CONV/BAT, WT/CONV/BAT, PV/WT/CONV/BAT, and a standalone diesel generator, were simulated using hybrid optimization of multiple energy resources. The cost of energy was analyzed under different scenarios. The results show that the combination of a 1109 kW PV system, 16 × 25 kW WTs, 439 kW converter, and 353 batteries is the best configuration that leads to the lowest values of Net Present Cost (NPC) and Levelized Cost of Energy (COE), and zero unmet load, making it the most economically and environmentally viable configuration.
1. Introduction
In our world, energy is the most significant element in social life, encompassing production, transportation, family life, and other domains. However, the largest problem facing humanity is the production of energy [1]. When fossil fuels are used extensively to produce electricity, enormous volumes of greenhouse gases are released into the surrounding air, contributing to global warming [2]. Some of the harmful environmental effects of increasing fossil fuel production and use in many nations include air pollution, global warming, and increased health risks [3]. Renewable energy sources, such as solar and wind, have grown rapidly in the modern era due to their abundant nature, limitless potential, and ability to reduce greenhouse gas emissions [4]. Therefore, converting to renewable energy can help us achieve the twin objectives of providing dependable, timely, and economical energy delivery and reducing emissions of greenhouse gases, which will decrease the effects of climate change and extreme weather in the future [5]. There is an enormous opportunity for study and development due to some of the operational problems of the renewable energy system (RES), such as intermittency and volatility profiles [6]. The objective of optimizing the regulation, scale, and component selection of hybrid energy systems (HESs) is to provide society with an economical power source [7].
These days, microgrids (MGs) primarily rely on renewable energy sources to supply clean energy that is suitable for their dispersed structure. MGs aim to provide dependable, high-quality energy at a lower cost with reduced carbon emissions. It can function as an isolated system or as a connected system with the utility grid. In off-grid or stand-alone mode, MGs are mostly utilized in distant locations where the cost of installing utility lines is prohibitive because of environmental or topographical issues [8,9]. MG, as shown in Figure 1, is a low- or medium-voltage distribution network made up of several micro sources that function together as a single controlling module [10]. An energy management system is necessary in a microgrid to make the best possible use of these dispersed energy resources in a coordinated, intelligent, safe, and reliable manner [11]. Optimal sizing is the crucial factor in the design of hybrid renewable systems (HRSs), as it directly impacts both cost and performance. Proper sizing helps minimize the Loss of Power Supply Probability (LPSP), reduces unnecessary investment, and enhances the system’s reliability. By determining the optimal number of photovoltaic modules, wind turbines, batteries, and diesel generators, the system can operate more efficiently and sustainably [12].
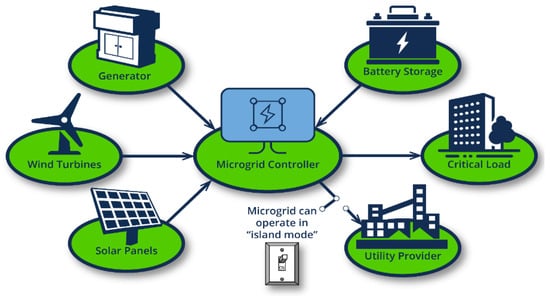
Figure 1.
Schematic configuration of a hybrid microgrid.
1.1. Literature Review
Numerous studies have been performed on MGs and HREMs that contain two or more renewable energy resources (RERs). For example, Haapanen et al. optimized a grid comprising PV, WT, BESS, and a diesel generator (DG) to meet the load requirements of a separated community in South India [13]. With the use of the HOMER software, an economical HREM configuration was achieved after the analysis. It was determined that there were four feasible configurations. These configurations were PV/DG/BESS, PV/BESS, PV/WT/BESS, and PV/WT/DG/BESS. Electricity appears to be at a lower cost in the configuration of PV/DG/BESS. The COE for PV/DG/BESS, PV/WT/DG/BESS, PV/BESS, and PV/WT/BESS is 0.4157 USD/kWh, 0.4382 USD/kWh, 0.6319 USD/kWh, and 0.6555 USD/kWh, respectively. The Net Present Cost (NPC), replacement costs, operating and maintenance costs, and fuel costs are to be more affordable in the PV/DG/ BESS configuration. Based on the outcomes, it was determined that a PV/DG/BESS was the most economical for that particular site. Rinaldi et al. [14] improved a hybrid PV/WT/DG/BAT/CONV microgrid for off-grid electricity in three isolated areas of Peru with varying climates. With the use of HOMER software, the best microgrid sizing (with the lowest “NPC”) was carried out for seven scenarios, taking into account factors including weather conditions, load demand, component cost, and fuel price. It was determined that the (PV/WT/DG) system was the most economical when considering NPC and COE ranges of about (USD 0.1466–0.2273 million) and (0.460–0.504 USD/kWh), respectively. Furthermore, the CO2 emissions varied from 2.7% to 9.9% of the emissions of the independent DG. Moreover, Eras-Almeida et al. [15] evaluated a hybrid renewable mini-grid (PV/WT/COV/BAT/DG) using HOMER software, considering the diverse energy needs of the Galapagos Islands. In conclusion, adding 18.25 MWp of PV and 20.68 MWh of BAT may increase the renewable energy (RE) share by 116.6% and reduce the COE by 40.9%. Furthermore, implementing energy-saving measures could result in a greater decrease in COE. Guiyu Zhang et al. [16] provide the best setup for a combination of renewable energy sources, including a photovoltaic system and a wind turbine, to provide the necessary electricity power for a medium-sized workshop in Ardabil, Iran, within the industrial sector. Hourly-based simulations take into account eight possible configurations (DG, DG/BAT, PV/DG/BAT, WT/DG/BAT, PV/WT/DG/BAT, PV/DG, WT/DG, and PV/WT/DG). The cost of energy is computed under several scenarios. The most suitable configuration leads to the lowest (COE) of 0.462 USD/kWh. This configuration consists of a 1 kW PV array, 2 WTs each of 3 kW, a 13 kW DG, a 6.13 kW converter, and 27 strings of (1 kW) lead-acid battery storage banks. Shezan et al. evaluated a WT/DG/CONV/BAT microgrid for a community in Malaysia with a daily demand of 115 kWh and a peak value of 11.2 kW, utilizing yoga, DigSILENT, and MATLAB software [17]. The reports show that the NPC and COE were lowered to USD 77,286 and 0.05/kWh respectively. The hybrid microgrid reduced NPC, COE, and CO2 emissions by 72%, 73.5%, and 82%, respectively. Mustafa Kamal1 and Imtiaz Ashraf [18] optimized the integration of solar, wind, the diesel generator, and battery systems to provide electrification for a remote region of Uttarakhand in India. Various scenarios are employed to test the efficacy of the optimization algorithm in developing the optimal strategy. Four examples of applying the particle swarm optimization technique to determine the optimal energy cost have been covered. The model recommends the ideal quantity of energy resources for dependable electrification of the region. The results show that the NPC of operating a microgrid in the grid-connected mode is USD 2,100,345.98, and the COE is USD 0.25/kWh, which is the lowest compared to other modes. For the best scenario, the irregularity of renewable sources is examined by altering 10–40% of the total production. The results show that 10% energy is the maximum amount of renewable energy that can be used. The authors in [19] evaluated a PV/DG/BAT/CONV system optimized by HOMER to meet the needs of a medical clinic. Additionally, the methods for managing excess power, such as FC/ELEZ/HT, were compared. The combination of 2.52 kW of PV, 2 kWh of BAT, 1.66 kW of CONV, and 2 kW of DG was the best design, with a COE of USD 0.105/kWh.
Moreover, Abdelkader Beyond and Ahmed Bauhaus [20] presented three possible configurations available for the tourist lodge on the White Headland in southwest Morocco: generator-batteries (GE-BATs), generator-photovoltaic batteries (GE–PV-BATs), and generator–wind power–photovoltaic batteries (GE–WP–PV-Bs). It is estimated that a few dozen people visit this location every day, and the analysis of the various hybrid electric energy convergence chains suggests that their needs may be met. The guest lodge’s energy usage is based on a commercial load profile, using about 170 kWh of power each day. The hybrid system was sized by evaluating the load profile limitations, such as day-to-day variability (DDR), hour-to-hour variability (HHR), and the operating reserve rate (ORR). The popularity procedure allowed the maximum limitations of the load profile constraint to be calculated variables, leading to a COE of USD 0.41/kWh and an NPC of USD 320,080.1. In addition, Mahmoud F. Elmorshedy et al. [21] studied an agricultural load with 240 kWh per day. The authors presented an integrated techno-economic design optimization framework that feeds a real-world case study for the appropriate design of a completely renewable energy system, including solar panels, wind turbines, and battery energy storage in Al-Sadat, Egypt. Homer Pro was utilized for evaluating the technical and economic viability of a set of energy configurations, as follows: PV/CONV (existing system) as the base-case, PV/CONV/BAT, WT/CONV/BAT, PV/WT/CONV /BAT, and isolated DG, in order to make fair assessments. The results show that the PV/WT/CONV/CONV system, which is entirely renewable, outperforms other options in meeting load demands. The suggested system successfully achieves a negligible ratio in both capacity shortfall and unserved load with only 0.098%, while acquiring the minimum NPC (USD 194,017) and COE (0.119 USD/kWh). Furthermore, a beneficial quantity of extra energy (61.7%) is acquired to supply extra deferable loads. Upma Singh and M. Rizwan [22] developed a cost-effective and ideal hybrid PV/biogas setup for generating electricity in rural common areas, such as primary schools, junior schools, and Panchayat Ghar buildings, in Sarai Jairam village, Uttar Pradesh, India. The data on solar irradiance for the study area and potential biomass were analyzed using the HOMER application. The HOMER study’s results were further enhanced by sensitivity analysis, which produced a solution that included the total (NPC) and (COE). The sensitivity analysis utilized sensitivity characteristics such as load variation, biomass potential, pricing, and solar irradiation. According to the NPC and COE, this analysis shows the system’s performance and demonstrates that it is both technically and financially feasible. With a capital cost of USD 8743, an NPC of USD 57,283, and a COE of 0.61 USD/kWh, the most economical alternative was determined to be a 5 kW PV array, 1.50 kW biogas generator, a 3.25 kW converter, and 30 batteries. Approximately 9698 kWh are produced annually by this hybrid renewable energy system, with an additional 965 kWh generated to create a grid-independent area.
In recent studies on hybrid microgrid systems, Muhammad Bhatti et al. [23] provide a thorough examination of the planning, development, and evaluation of a hybrid standalone microgrid for an industrial establishment located in Iraq, with coordinates of 36.51 and 43.99. A photovoltaic (PV) module, a generator, inverters, a battery energy storage system (BESS), and AC loads make up the system. The findings indicate that continuous backside irradiance maximizes bifacial power gain, which is a result of both increased ground albedo and ground clearance. The normalized production of monoracial power generation was a promising 4.53 kWh/kWp/day, a performance ratio of 0.815, and annual energy production projections of 84.31 MWh (P50), 79.57 MWh (P90), and 78.24 MWh (P95). This study is significant because it highlights the operational difficulties that arise during the winter months, when load fulfilment necessitates generator backup. Moreover, it has been demonstrated that the hybrid stand-alone microgrid has a beneficial impact on the environment, resulting in a reduction of approximately 1811.6 tons of CO2 emissions over 30 years. This demonstrates the microgrid’s positive impacts on sustainability and renewable energy initiatives. Alya Nurul Shafira et al. [24] studied a hybrid renewable energy (RE) system that is both economically viable and based on wind and solar power to complement the productive activities of Mahaleta village in eastern Indonesia. Conceptual ideas for supplying energy to the village’s commercial, industrial, residential, and community sectors were developed by this research. The investigation was conducted with the use of a techno-economic approach. The dryer and cold storage systems were evaluated to support complementary productive activities, and the hybrid system was designed using the Homer Pro optimization tool. The hybrid renewable energy system’s optimum design included 271.62 kW of solar photovoltaics, 80 kW of wind turbines, and a 1 MWh lead-acid battery. We discovered that only with a full grant incentive and an electricity rate of 0.0808 USD/kWh would the hybrid RE system be financially viable. However, with a drying cost of 0.082 USD/kg and a cold-storage cost of 0.035 USD/kg, all of the productive activity designs were financially viable. In [25], the authors illustrate a special utilization of the HOMER software for the multi-year energy, environmental, and financial assessment of a proposed freestanding renewable microgrid with several sources. A case study was conducted in a rural town in central Nigeria that is rapidly becoming more commercialized. The town’s average daily consumption is 23.028 MWh, and its average power demand is 975 kW. The best system for reducing the COE in HOMER was suggested to be the integration of 3 MW of flat plate photovoltaic (PV) arrays, 9 MW of concentrated solar thermal and small hydropower (SH, up to 200 kW), with a 2.5 MW converter and battery storage (200 strings) in the Oshin River. A diesel-based system was also modeled, and a multi-year analysis over 25 years reveals that the renewable microgrid’s Net Present Cost (NPC) of USD 55.7 million is significantly lower than the diesel microgrid’s USD 408 million, with COEs of 0.26 USD/kWh and 1.01 USD/kWh, respectively. Furthermore, the method decreased emissions by up to 7540 metric tons of CO2 each year. The study’s conclusions suggest that the proposed microgrid is a more economical, environmentally friendly, and long-term solution than diesel generators, making it a valuable consideration for comparable applications. Md. Feroz Ali et al. [26] examined the viability and effectiveness of a grid-connected hybrid power system that combines wind, biomass generators, and photovoltaics (PV) to feed a residential area of Pabna, Bangladesh, with electricity. The simulation generated six competing options with different combinations of energy sources. With aN NPC of USD 321,798.00, an annual operating cost of USD 6060.59, and the lowest coefficient of efficiency at USD 0.0232/kWh, the grid-connected PV–biomass generator system was the most economical of the configurations examined. The system’s straightforward 9.25 year payback period demonstrates its economic feasibility. The environmental advantages of this hybrid approach are further demonstrated by the fact that it drastically lowers CO2 emissions to 78,721 kg/year as opposed to 257,093 kg/year from a system that is only grid-connected.
In recent research, Hedra Saleeb et al. [27] established a microgrid to meet the load of the University of New Sohag in Sohag Al Gadida City, Egypt. The suitability of various distributed generating sources, including photovoltaic, battery, and hydrogen-based microgrids, is evaluated. Using MATLAB and HOMER for component sizing, a techno-economic analysis was carried out to optimize microgrid sizing. The result showed that this study has a payback period of 8–10 years and reduces costs by 20–30% over 20 years as compared to traditional grid supply. The simultaneous optimization of COE and loss of power supply probability (LPSP) ensures excellent reliability (LPSP ≤ 5%) and cost-effectiveness (COE: 0.005–0.015 USD/kWh). Moreover, Montri Ngao-det et al. [28] presented a study using Homer Pro software to systematically design and optimize a 100% renewable hybrid microgrid system for sustainable rural electrification in Khlong Ruea, Thailand. For a remote village of 306 people, the proposed system combines photovoltaic (PV) panels (20 kW), pico hydro (9.42 kW), and lithium-ion battery storage (264 kWh) to offer a dependable, affordable, and ecologically friendly energy solution. According to simulation results, the optimum design outperforms the current diesel–hydro system (NPC: USD 3,400,000, COE: 1.85 USD/kWh, 61.4% renewable) with an NPC of USD 362,687 and a COE of USD 0.19/kWh, featuring a 100% renewable proportion. Sensitivity analyses indicate that the system can accommodate load increases of 1% to 5%, although the growing battery capacity and costs underscore the necessity of incorporating a scalable design. Finally, Nikole Teran Uruchi et al. [29] evaluated the technological and financial viability of battery storage systems in an isolated solar-diesel microgrid in Tunui-Cachoeira, São Gabriel da Cachoeira (AM) district, Brazil. Three scenarios are evaluated using an energy balance methodology that is applied via the Homer Pro simulation platform: (i) with lead-acid batteries, (ii) with lithium-ion batteries, and (iii) without batteries. The primary findings showed the following: (i) with the lowest NPC (BRL 2.14 million), the minimum COE (BRL 1.99/kWh), the most significant renewable fraction (96.8%), and the highest solar energy use efficiency, the lead-acid battery scenario demonstrated the best techno-economic performance under the current circumstances. (ii) Depending on lower acquisition costs and/or longer lifespans, the lithium-ion battery scenario has been demonstrated to be both technically feasible and environmentally beneficial, particularly for future uses.
Table 1 provides a summary of recent research work on the design of independent hybrid renewable microgrid systems.

Table 1.
Modern studies on the design of hybrid renewable microgrid systems.
1.2. Contribution
- A feasibility analysis and optimal design for a standalone microgrid that runs solely on renewable energy sources for an urban community in South Sinai, Egypt.
- The main objectives are to reduce the Net Present Cost (NPC), lower the Cost of Energy (COE), and minimize emissions related to the use of diesel fuel.
- The PV/WT/CONV/BAT microgrid offered the best configuration with the lowest NPC and COE.
- Sensitivity analysis was performed across three key financial parameters: the PV capital cost, inflation rate, and discount rate to assess the economic robustness of the system under a range of monetary conditions.
1.3. Article Structure
Apart from the introduction and the literature review provided in Section 1, Section 2 introduces the methodology. Section 3 presents the explanation of the case study under investigation, including detailed modeling of all scenarios. Section 4 presents the findings of the simulation and optimization that were obtained. Section 5 then presents the cost analysis and study results. The conclusion of this work is summarized in Section 6.
2. Methodology
The primary goal of this study is to develop a hybrid system that can meet the load demand of Abo Geadaa village, located in South Sinai. Four models have been created utilizing the HOMER PRO optimizer v3.14.2 in order to meet this goal.
The National Renewable Energy Laboratory (NREL), USA, developed the micro power optimization program, HOMER, to evaluate grid-connected and off-grid power systems designs [30]. In HOMER, a wide range of resources is modeled, including PV arrays, WT, small hydropower, fuel cells, biomass, batteries, converters, and traditional generators. To utilize HOMER PRO, inputs describing available resources, component pricing, and technological possibilities are fed into the model. With these inputs, HOMER simulates various component combinations or system configurations, obtaining outcomes that represent a list of feasible configurations sorted by the net present cost. HOMER is a system simulator that performs calculations of energy balance for every one of the 8760 h in a year. It achieves this by calculating the energy moves to and from each system component and comparing the hourly thermal and electric demand to the hourly energy supply that the system can provide. Following the completion of the simulation and optimization phases and the input of all necessary data into HOMER, the outcomes of each plan, which include the initial capital cost ($), the operation cost ($/yr), the NPC ($), COE ($/kWh), and emissions produced (kg/yr), are calculated. Although, HOMER determines the optimal layout based on the minimum NPC [31,32,33].
2.1. Dispatch Strategy
In hybrid energy systems, two common control techniques are used. Two different control strategies can be represented as load following and cycle charging using the Homer software. When the “Load Following, LF” technique is used, the battery is charged by renewable energy sources rather than by generators. Under the “Cycle Charging” technique, the generators produce more energy than is required to power the load each time they turn on, and this extra energy is used to charge the battery group. Figure 2 shows the flowchart of control strategies. In the LF strategy, Figure 2a, renewable energy sources are primarily utilized to meet the load’s needs and to supply energy storage with surplus energy. If the State of Charge (SOC) level is insufficient, energy storage and renewable energy sources will cover the increase in load; otherwise, the generator will be activated and utilized. In this case, the DG is only run to meet the net load. In CC (Figure 2b), first, demand is met using renewable energy, which is also used to charge batteries with extra energy. Any increase in load is met by batteries and renewable energy (if the SOC level is not high enough); if not, a generator is used. In this case, the generator is used to both charge the batteries and meet the net load [34].
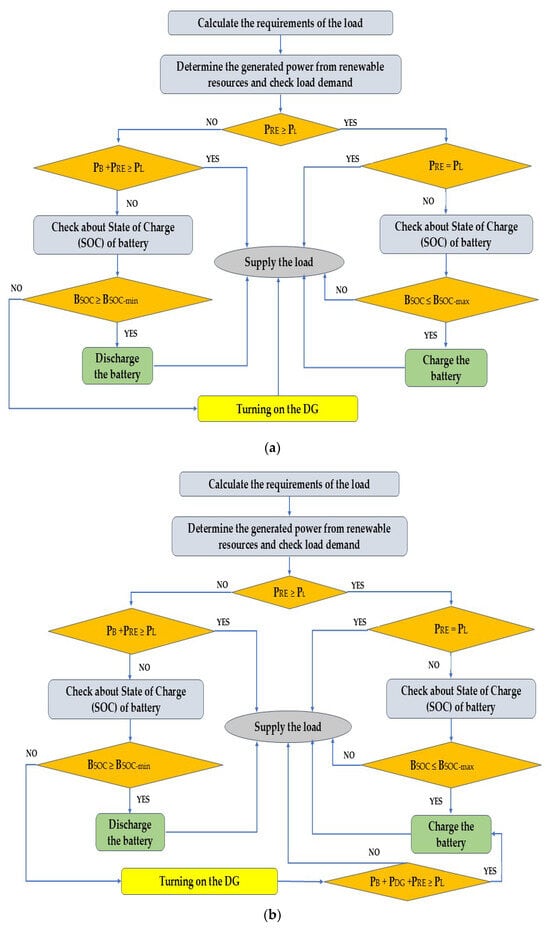
Figure 2.
Flow chart of dispatch strategies: (a) load following; (b) cycle charging.
2.2. Net Present Cost (NPC)
A component’s net present cost, also known as its life-cycle cost, is calculated by subtracting the salvage value from the total costs of installation and operation over the project’s lifetime. The costs that are included in the present value are capital, replacement, operating, and maintenance costs, as shown in Equation (1).
where Ccapital is the initial cost, Creplace is the replacement value, Cmaint is the maintenance cost, and Csalvage is the salvage value [35].
2.3. Levelized Cost of Energy (COE)
According to HOMER, the levelized cost of energy (COE) is the average cost per kWh of valuable electrical energy generated by the system. The COE is calculated by dividing the total annualized cost of electricity production by the total electric load served, as described in Equation (2).
where Cann,tot is the total annualized cost of the system ($/yr) and Eserved is the total electrical load served (kWh/yr) [35].
3. Case Study
The research study is located in the Abo Geadaa community in South Sinai, Egypt. The abundance of renewable energy was taken into consideration when selecting the site. According to NASA meteorological data, the location is located at a latitude of 29°20.9′ N and longitude of 33°19.5′ E [36]. Figure 3 displays the geographic view of the research location. As shown in Figure 4, this community comprises 25 houses, a mosque, a school, a sports club, a health unit, shops, an administrative building, a sewage treatment plant, and a water treatment plant.
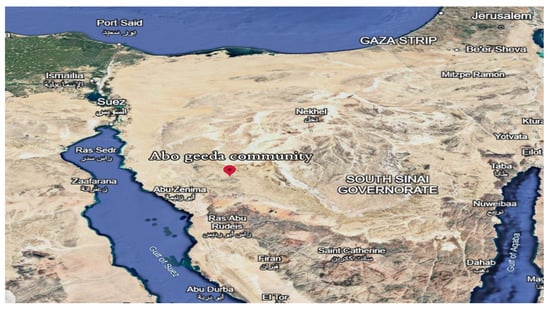
Figure 3.
Geographic location of the studied off-grid community in Sinai, Egypt. Coordinates and topography obtained from Google Earth (2025); accessed: February 2025.
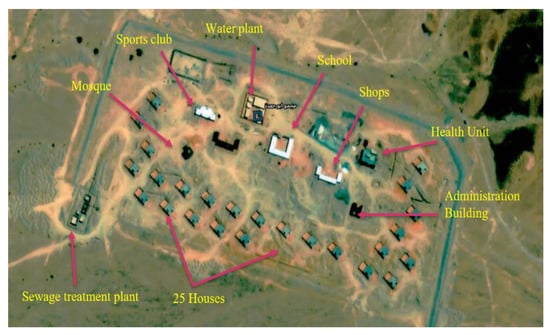
Figure 4.
Components of the Abo Geadaa community.
This community is powered by diesel generators, where the chamber of combustion of the engine is where the fuel mixture is created. At high pressure, the diesel generator is put into the combustion chamber, and following compression ignition, it is simultaneously injected and burned using the diffusion combustion process. Due to the unequal combination of diesel and air caused by this operating mode, local hypoxia or oxygen enrichment is unavoidable. Under high temperatures, diesel generators produce several types of exhaust emissions, as follows:
- Carbon dioxide (CO2) is created by burning materials that contain carbon. CO2 causes the greenhouse effect, which warms the Earth.
- Carbon monoxide (CO) that arises from diesel engines’ incomplete combustion. This gas will cause poisoning through a hemolytic response.
- Hydrocarbons (HCs) refer to the combination of carbon and hydrogen in general. The ground-level ozone, which is harmful to crops, ecosystems, and human health, is a precursor to unburned hydrocarbons.
- Particulate matter (PM) is made up of the components produced by the burning of sulfur in light oil fuel, as well as the fuel and lubricant residue left over after combustion. PM comprises microscopic particles that enter the deep lungs, causing respiratory and cardiovascular difficulties.
- Nitrogen oxides (NOXs) are a group of chemicals that include NO, N02, N20, N202, and others. When nitrogen and oxygen molecules combine at high temperatures, it is created. Nox emissions impact asthma and other respiratory diseases, while also contributing to the formation of smog and acid rain.
- Sulfur Dioxide (SO2) results from diesel fuel’s sulfur and causes respiratory issues and acid rain [37,38].
From all the above, it is urgent to replace generators with clean energy sources to preserve the environment and people’s health. Figure 5 shows the wind speed and the wind speed spectra for Egypt [39,40]. The site data have been studied for over 8760 h. According to the data, the case study area experiences year-round high levels of solar radiation and wind speed. Additionally, the area under study is appropriate for the installation of wind and photovoltaic power facilities.
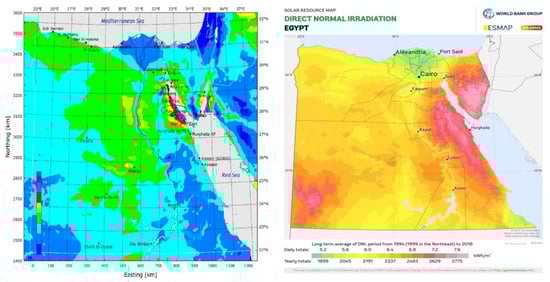
Figure 5.
Solar irradiance and annual average wind speed map of the location study. Sources: NASA Surface Meteorology and Solar Energy Data (2024) and NASA Prediction of Worldwide Energy Resources (POWER) Project (2023); accessed: February 2025.
Using historical weather data sets made available by NASA, the sun irradiance and wind speed profiles at the suggested site are shown in Figure 6 and Figure 7, respectively. It can be observed from Figure 6 that solar radiation increases from January until it reaches its highest level in June, after which it begins to decrease again each month, reaching its lowest level in December. The maximum radiation levels of the year occur in May, June, and July. Thankfully, the highest wind speed occurs in June, and the second-highest wind speed occurs in September. Consequently, it is anticipated that June will see high solar and wind power output. Based on the existing data, the average solar radiation is 5.6 kWh/m2/day, and the average wind speed is 5.99 m/s.
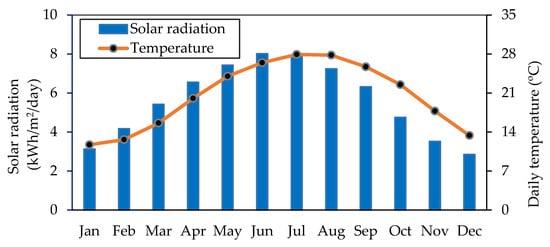
Figure 6.
Average solar radiation per month.
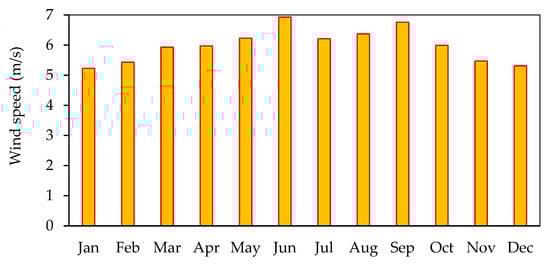
Figure 7.
Average wind speed per month.
3.1. Load Profile
The load profile was obtained from actual measured data recorded over a one year period, with an hourly resolution, to accurately represent the real energy consumption pattern of the studied community. The average community’s electric load is 4490 kWh/day, with a peak demand of 517 kW. The average load is 187 kW, with a load factor of 0.36. Figure 8 shows the average daily load profile of the area under study.
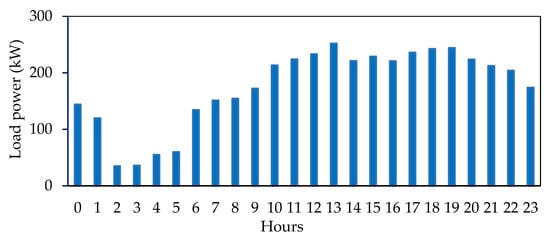
Figure 8.
Average daily load profile.
3.2. Hybrid Microgrid Grid Model Designing
Using a combination of several renewable and non-renewable resource components, four models have been created in HOMER PRO to perform the techno-economic analysis. The proposed models, which are to be designed, include batteries, converters, PV modules, wind turbines, and storage and backup power sources.
The four models that have to be designed are defined below, as follows:
- MG 1: It will contain a standalone diesel generator.
- MG 2: It will contain a PV module, a power converter, and a battery.
- MG 3: It will contain wind turbines, a power converter, and a battery.
- MG 4: It will contain a PV module, wind turbines, a power converter, and a battery.
Figure 9 demonstrates a representation of the suggested microgrid model.
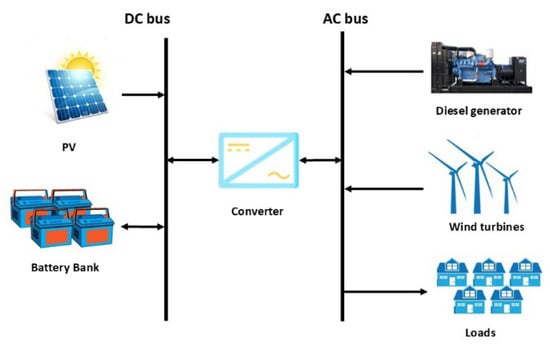
Figure 9.
A representation of the studied microgrid model.
3.3. Microgrid Components
The suggested system’s hybrid model is made up of various components. The capital cost (CAPEX) and operating cost (OPEX) in US dollars of all systems’ components are modified based on the latest reports of the International Renewable Energy Agency (IRENA) and the near-real costs in the literature [41,42]. All economic data, such as the inflation rate and the discount rate, are according to the Central Bank of Egypt (CBE) [43,44].
The cost data for each element of the suggested microgrid system, including capital, replacement, operating, maintenance, and fuel costs, are compiled in Table A1 in the Appendix A. These elements are covered in the section that follows:
3.3.1. PV Array
The Trina Duomax PEG14 flat plate is utilized in the suggested models. Its lifetime is around 25 years, and its efficiency is 16.3%. The rated capacity for each PV plate is 0.32 kW. The initial cost for a PV system is 758 USD/kW, and the replacement value is also considered to be 758 USD/kW. The operating and maintenance cost is USD 10.3 per year. The derating factor of the PV array is about 88%.
3.3.2. Wind Turbine
For the suggested models, the “Eocycle EO25 Class III” wind turbine is used, featuring a 23 m hub height. The capacity of this wind turbine is 25 kW. The capital cost for the wind turbine is 1160 USD/kW, while the replacement cost is also 1160 USD/kW, and the annual operating and maintenance cost is 20 USD/kW. The lifetime is about 20 years.
3.3.3. Battery Energy Storage
The battery used in the proposed models is a lithium-ion battery, specifically the Fortress Power LFP-10, with an estimated lifespan of approximately 10 years. The capital cost for the battery is USD 2736, while the replacement cost is also USD 2736, and the operating and maintenance cost is USD 136.80 per year. The nominal voltage is 48 V, while the nominal capacity is 9.6 kWh, and the round-trip efficiency is approximately 98%. The maximum charge current is about 100 amperes, and the maximum discharge current is also considered 100 amperes.
3.3.4. Converter
The Huawei SUN2000-150KTL-50 converter is used in the suggested models. Off-grid, the Huawei microgrid inverter utilizes an integrated design, combining the MPPT solar controller, battery charger, and bi-directional inverter into a single converter rated to 33 KVA. It functions as an inverter and a rectifier in both modes. The converter only operates in the inverter mode when wind and solar energy are unavailable; this kind of situation typically arises at night and during overcast weather. When sufficient renewable energy is available, the converter operates solely in rectifier mode, charging the battery. The converter’s efficiency is approximately 97%. The capital cost for the converter is 50 USD/kW and the replacement cost is also 50 USD/kW. The converter has a lifetime of about 15 years.
3.3.5. Diesel Generator
In MG 1, a generic generator is employed for simulation and design. The generator is optimized by Homer PRO based on its needs. The estimated lifetime duration is 20,000 h, with a minimum load ratio of 25%. The capital cost is 667 USD/kW, the replacement value is also 667 USD/kW, and the operating cost is USD 1.12 per operating hour. The price of fuel is USD 0.313 per liter [45].
The detailed technical specifications of the solar module, wind turbine, battery energy storage, converter, and diesel generator are listed in Table A2 in the Appendix A. It also contains technical details specific to each component, such as the rated power, rated voltage, longevity, and other relevant statistics.
4. Results
Using the Homer Pro, the simulation was run, and the best feasible system was found based on the NPC and COE. In each optimization cycle, the optimal values of the system variables (PV array size, WTs number, BAT capacity, DG size, and CONV rating) are optimized by decreasing the NPC. The load data, economic data, weather data, and optimization restrictions are all entered into the model during the optimization process. The process generated a list of feasible solutions ordered according to their economic performance once the NPC’s precision convergence was achieved and all possible configurations were evaluated.
4.1. Standalone DG
In this section, the full electrical load is provided by a 520 kW diesel generator. Due to its detrimental emissions, its environmental impact has caused serious worries. Quantities of these emissions are illustrated in Table 2. In this scenario, the NPC is USD 65.6 million, the COE is 3.31 USD/kWh, and the cost of fuel is 154,906 USD/year.
Table 2.
Quantities of emissions produced by the diesel generator.
4.2. PV/CONV/BAT
In this scenario, it is recommended to provide the load using a combination of batteries and PV panels. The PV panels’ primary contribution occurs during the day, while the battery banks power the load at night and in the shade. Additionally, when there is more solar energy than is needed for the load, the battery system has the capacity to store the excess energy. This system consists of 3688 kW PV panels, a 644 kW converter, and 489 batteries. In this scenario, the values of NPC and COE are USD 6.39 million and 0.323 USD/kWh, respectively.
4.3. WT/BAT/CONV
This system uses a wind generator in conjunction with a battery storage device. When there is a shortfall of energy from the wind resource, the battery bank is used to make up the difference by providing the load with the necessary power. However, when wind speeds are strong, there is a significant amount of wind energy, and the battery bank begins to charge. This system consists of 65 wind turbines, 687 batteries, and a 609 kW converter. The NPC and COE values are USD 6.9 million and 0.348 USD/kWh, respectively.
4.4. PV/WT/BAT/CONV
In this instance, the suggested system combines two renewable energy sources (WT&PV) to meet the load under investigation. Additionally, a battery bank can meet the need for energy storage when there is a need for more energy than the load. When there is a shortage of renewable energy sources, the load is supplied by the battery bank. This system consists of 1109 kW PV panels, 16 wind turbines, 353 batteries, and a 439 kW converter. The NPC of this scenario is USD 3.86 million, and the COE is 0.195 USD/kWh. Figure 10 shows the cash flow of the four models.
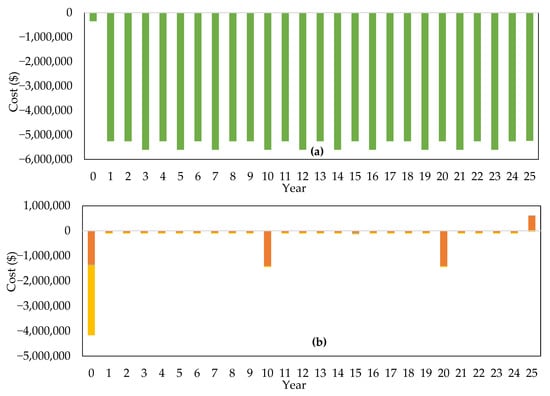
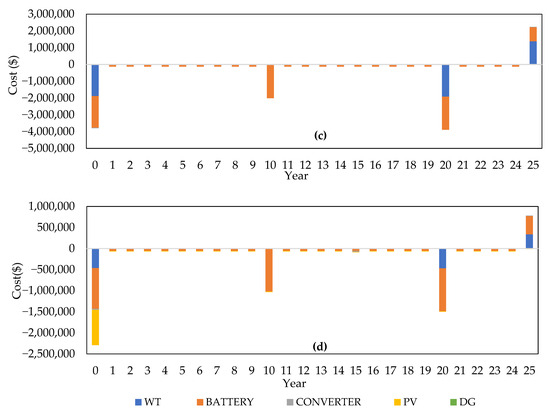
Figure 10.
Cash flow of the four models (a) DG, (b) PV/CONV/ BAT, (c) WT/CONV/ BAT, and (d) PV/WT/CONV/BAT.
5. Cost Analysis
Table 3 shows the optimization results of the four models. It provides the optimal capacities of all microgrid components for each model, including the PV capacities, wind turbine quantities, converter capacity, battery numbers, and generator capacity for MG 1. It also displays the NPC, COE, CAPEX, and OPEX for all models, as well as the fuel cost for MG 1. Figure 11 presents a comparison of outcomes from the various cost categories of the microgrids studied. It can be observed that the standalone DG has the lowest capital cost, at USD 0.347 million. Still, it also has the minimum value of salvage cost at USD 3515 and the highest value of operating cost at USD 61.7 million, in addition to fuel cost at USD 154,906 per year, and the amount of exhaust emissions produced during a year is 1,314,895 kg. It can be observed that all cost items indicate that the PV/CONV/BAT scenario has the highest capital cost value, at USD 4.2 million, and the WT/CONV/BAT scenario has the greatest values for replacement and salvage costs, at USD 2.1 million and USD 479,106.7, respectively. Finally, the PV/WT/CONV/BAT has the minimum values of replacement and operating cost with USD 0.92 million and USD 0.82 million, respectively. It also has the minimum values of NPC and COE, at USD 3.86 million and 0.195 USD/kWh, respectively, as shown in Figure 12. Conversely, the Standalone DG system has the highest values of NPC and COE, at USD 65.5 million and 3.31 USD/kWh, respectively. Therefore, the PV/WT/CONV/BAT system is the lowest-cost system among all configurations. Comparing the system’s techno-economic performance, the obtained COE (0.195 USD/kWh) and NPC (USD 3.86 million) with those reported in recent studies were conducted under similar climatic conditions and load classes. For example, O.A. Odetoye et al. [25] reported a COE of 0.26 USD/kWh and an NPC of USD 55.7 M for a PV–hydro–battery system in Nigeria using HOMER. Similarly, in Morocco, A. Beyoud et al. [20] found a COE of 0.41 USD/kWh. Meanwhile, M.M. Kamal et al. [18] obtained a COE of 0.25 USD/kWh for a hybrid system in India. These results place the present study’s COE and NPC within the lower range of reported values, confirming the cost competitiveness and technical feasibility of the proposed hybrid configuration under Sinai’s environmental and load conditions.
Table 3.
Optimization results of the studied models.
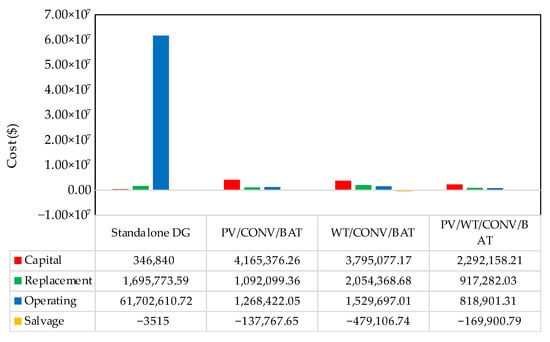
Figure 11.
Cost summary of the four evaluated models.
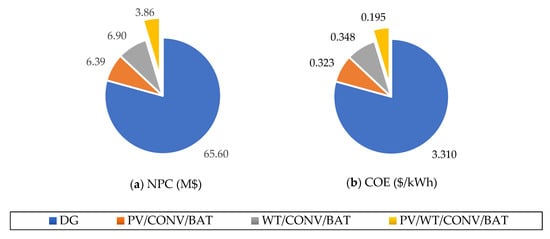
Figure 12.
Comparison of NPC and COE for the microgrid models investigated.
5.1. Reliability Analysis
Figure 13 illustrates the electric power profile of the PV/WT/CONV/BAT system during a three-day simulation period. It is evident that the system load is continuously and fully met through a coordinated contribution from all available energy sources, namely the PV, WT, and the batteries. These sources collectively ensure that the load receives stable and sufficient power throughout the entire duration. The lower part of the curve illustrates the battery’s charge and discharge behavior. When the combined power generation from the PV and WT sources exceeds the instantaneous load demand, the surplus energy is directed toward charging the battery, increasing its state of charge. Conversely, during periods when the generated power is insufficient to meet the load, the battery discharges, supplying the required energy to maintain system balance. This dynamic operation underscores the battery’s crucial role in mitigating power fluctuations, maintaining supply–demand equilibrium, and enhancing the overall reliability and stability of the hybrid energy system. Figure 14 shows the electric power profile of the PV/WT/CONV/BAT system during a three-day simulation period from 1 January to 3 January (winter days).
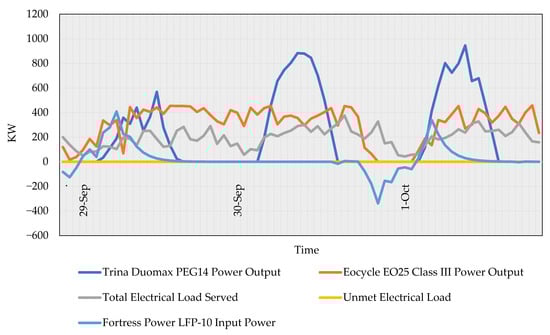
Figure 13.
Electric power profile in PV/WT/CONV/BAT MG.
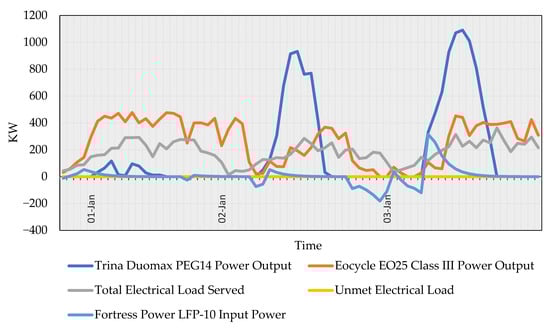
Figure 14.
Electric power profile in the PV/WT/CONV/BAT MG for the period from 1 January to 3 January (winter days).
Notably, the system achieves zero unmet load, confirming that the power demand is fully satisfied at all times.
5.2. Sensitivity Analysis
Figure 15 presents the sensitivity of both the NPC and COE to changes in three key financial parameters: the PV capital cost, inflation rate, and discount rate. When the inflation rate increased by 20%, the NPC rose from USD 3.86 million to USD 4.43 million (+14.8%). In contrast, reducing the inflation rate by 20% lowered the NPC to USD 3.44 million (−10.9%). However, the COE exhibited the opposite behavior: it decreased from 0.195 USD/kWh to 0.162 USD/kWh (−16.9%) as the inflation rate increased and then increased to 0.222 USD/kWh (+13.8%) when the inflation rate decreased.
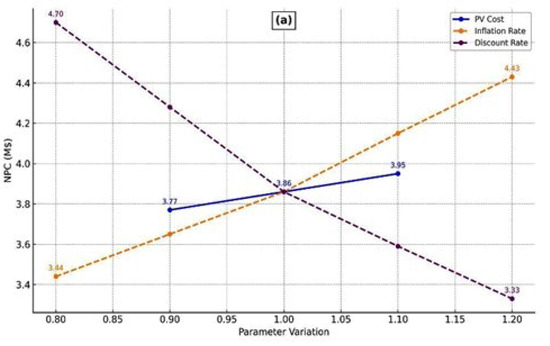
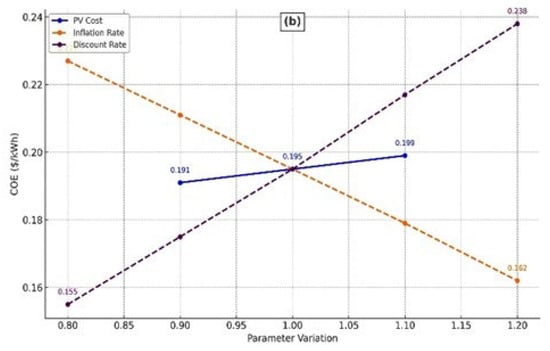
Figure 15.
Sensitivity analysis: (a) NPC; (b) COE.
Regarding the discount rate, a 20% increase resulted in a decrease in the NPC to USD 3.33 million (−13.7%), and the COE rose to 0.238 USD/kWh (+22.1%), while a 20% decrease in the discount rate raised the NPC to USD 4.70 million (+21.8%) and the COE decreased to 0.155 USD/kWh (−20.5%). A 10% increase in the PV capital cost resulted in a rise in the NPC to USD 3.95 million (+2.3%) and the COE to 0.199 USD/kWh (+2%). Conversely, a 10% reduction in the PV capital cost decreased the NPC to USD 3.77 million (−2.3%) and the COE to 0.191 USD/kWh (−2%). These findings indicate that, although the NPC and COE are interrelated, their responses to parameter variations, particularly the inflation rate and discount rate, are not always uniform. The COE exhibits higher sensitivity to changes in the discount rate and demonstrates inverse sensitivity to the inflation rate, likely due to their effects on future cash flows and the temporal profile of energy generation. The analysis highlights that both the inflation rate and discount rate exert a significant influence on the system’s financial performance. In contrast, the PV capital cost has a more moderate but still measurable impact. Overall, the system demonstrates economic robustness under a range of financial conditions.
6. Conclusions
In this study, a grid-independent HREM was proposed to satisfy the electricity demand of a remote community in South Sinai, Egypt. Four MG configurations —standalone DG, PV/CONV/BAT, WT/CONV/BAT, and PV/WT/CONV/BAT—were designed using HOMER software to electrify the community load, achieving a daily load of 4490 kWh with a peak demand of 517 kW.
The findings of the simulation, optimization, and parametric analysis are as follows:
- The Standalone DG system has the highest values of NPC and COE with USD 65.5 million and 3.31 USD/kWh, respectively. In addition to the fuel cost of USD 154,906 per year, the amount of exhaust emissions produced annually is 1,314,895 kg.
- The integration of 1109 kW for the PV panels, 16 wind turbines, 439 kW converter, and 353 batteries provides the most suitable techno-economic behavior in relation to others. This MG, PV/WT/CONV/BAT, has the lowest values of NPC and COE, at USD 3.86 million and 0.195 USD/kWh, respectively.
- The sensitivity results clearly demonstrate how financial parameters influence system economics. A 20% increase in the Inflation Rate raised the NPC by 14.8% but decreased the COE by 16.9%, showing an inverse relationship. Conversely, reducing the inflation rate led to a lower NPC and a higher COE. In the case of the Discount Rate, increasing it by 20% decreased the NPC (−13.7%), but raised the COE (+22.1%), while a 20% decrease raised the NPC and decreased the COE significantly. The PV Capital Cost, with a ±10% variation, resulted in modest changes in the NPC and COE (approximately ±2%).
In summary, the proposed hybrid renewable energy system demonstrates strong potential for delivering affordable, reliable, and sustainable electricity to remote and non-interconnected regions such as Sinai, Egypt. By integrating PV, wind, and battery storage, the system can enhance energy access and improve living standards for local communities. Nevertheless, several limitations should be acknowledged. The current analysis relies on specific assumptions regarding resource availability and load demand; hence, uncertainties in solar irradiance, wind speed data, and future demand variations may affect the system’s actual performance and economic viability. Moreover, the absence of demand-side management (DSM) strategies in the current design may limit potential improvements in energy efficiency and storage optimization. Future research should explore scalability to larger communities, integration with hydrogen-based storage, and scenarios involving partial or full grid connection to enhance flexibility and resilience. Overall, the proposed strategy offers a promising pathway toward achieving energy security and socioeconomic development in isolated areas.
Author Contributions
Conceptualization, R.S.A.A., M.H., A.F.B. and M.M.F.D.; Methodology, R.S.A.A. and M.H.; Software, M.H.; Validation, R.S.A.A., A.M., A.F.B., H.E.Z., H.H., M.L. and M.M.F.D.; Formal analysis, M.H.; Writing—original draft, R.S.A.A. and M.H.; Writing—review and editing, R.S.A.A., A.M., A.F.B., H.E.Z., H.H., M.L. and M.M.F.D.; Supervision, R.S.A.A., A.M. and A.F.B.; Project administration, M.L.; Funding acquisition, M.L. All authors have read and agreed to the published version of the manuscript.
Funding
This research received no external funding.
Data Availability Statement
The original contributions presented in this study are included in the article. Further inquiries can be directed to the corresponding author.
Acknowledgments
The authors acknowledge the support grant received from the Department of Electrical Engineering and Automation, Aalto University, Espoo, Finland.
Conflicts of Interest
The authors declare no conflicts of interest.
Appendix A
Table A1 provides a summary of the expenses associated with each component of the suggested microgrid system, including capital, operating and maintenance costs, replacement costs, and fuel costs. The characteristics of the solar module, wind turbine, battery energy storage, converter, and diesel generator are listed in Table A2. Furthermore, the technical details for each component are included in Table A2, which includes the rated power, rated voltage, longevity, and other specific information.
Table A1.
Cost data for the investigated microgrid elements.
Table A1.
Cost data for the investigated microgrid elements.
| Element | Capital Cost | Replacement Cost | Operating and Maintenance Cost | Fuel Cost |
|---|---|---|---|---|
| PV | 758 USD/kW | 758 USD/kW | 10.3 USD/kW/yr | - |
| WT | 1160 USD/kW | 1160 USD/kW | 20 USD/kW/yr | - |
| BAT | 2736 USD | USD 2736 | 136.8 USD/yr | - |
| CONV | 50 USD/kW | 50 USD/kW | 0 | - |
| DG | 667 USD/kW | 667 USD/kW | 1.12 USD/op.h/yr | 0.313 USD/L |
Table A2.
Complete technical details for microgrid elements.
Table A2.
Complete technical details for microgrid elements.
| Element | Specification | Value |
|---|---|---|
| PV | Rated power | 0.32 kW |
| Temperature coefficient | −0.410 °C | |
| Normal operating cell temperature | 44 °C | |
| Efficiency at STC | 16.3% | |
| Derating factor | 88% | |
| Lifetime | 25 years | |
| WT | Rated power | 25 kW |
| Hub height | 23 m | |
| Lifetime | 20 years | |
| Battery | Nominal voltage | 48 V |
| Nominal capacity | 9.6 kWh | |
| SOC limits | 5–100% | |
| Roundtrip efficiency | 98% | |
| Converter | Rated power | 33 KVA |
| Efficiency | 97% | |
| Relative capacity | 50% | |
| Lifetime | 15 years | |
| DG | Fuel curve slope | 0.236 L/h/kW |
| Fuel curve intercept | 9.25 L/h | |
| Lifetime | 20,000 h | |
| Minimum load ratio | 25% | |
| Carbon monoxide | 16.5 g/L fuel | |
| Nitrogen oxides | 15.5 g/L fuel | |
| Lower heating value | 43.2 MJ/kg | |
| Diesel fuel price | 0.313 USD/L | |
| Carbon percentage | 88% | |
| Sulfur percentage | 0.4% | |
| Unburned HC | 0.72 g/L of fuel | |
| Particulates | 0.1 g/L of fuel | |
| Fuel sulfur to PM | 2.2% | |
| Fuel density | 820 kg/m3 | |
| CHP heat recovery ratio | 0% |
References
- Ali, M.; Riaz, M.; Koondhar, M.A.; Akram, M.S.; Guerrero, J.M.; Vasquez, J.C.; Khan, B. Renewable energy sources-based hybrid microgrid system for off-grid electricity solution for rural communities. Energy Sci. Eng. 2023, 11, 3486–3499. [Google Scholar] [CrossRef]
- Sattar, M.; Azeem, F.; Memon, Z.; Zidan, H.; Baig, S. Feasibility Assessment of Rural Hybrid Microgrid Using Canal-Based Microhydel Resources: A Case Study of Renala Khurd Pakistan. Sustainability 2022, 14, 15417. [Google Scholar] [CrossRef]
- Hou, H.; Lu, W.; Liu, B.; Hassanein, Z.; Mahmood, H.; Khalid, S. Exploring the Role of Fossil Fuels and Renewable Energy in Determining Environmental Sustainability: Evidence from OECD Countries. Sustainability 2023, 15, 2048. [Google Scholar] [CrossRef]
- Amara, S.; Toumi, S.; Salah, C.B.; Saidi, A.S. Improvement of techno-economic optimal sizing of a hybrid off-grid micro-grid system. Energy 2021, 233, 121166. [Google Scholar] [CrossRef]
- Ellabban, O.; Abu-Rub, H.; Blaabjerg, F. Renewable energy resources: Current status, future prospects and their enabling technology. Renew. Sustain. Energy Rev. 2014, 39, 748–764. [Google Scholar] [CrossRef]
- Madhura, S.; Boddapati, V. Optimal sizing and assessment of a hybrid energy based AC microgrid. Mater Today Proc. 2022, 49, 326–332. [Google Scholar] [CrossRef]
- Subramanian, V.; Vairavasundaram, I.; Aljafari, B. Analysis of Optimal Load Management Using a Stand-Alone Hybrid AC/DC Microgrid System. Int. Trans. Electr. Energy Syst. 2023, 2023, 7519436. [Google Scholar] [CrossRef]
- Ewais, A.M.; El-Azab, R.; Adma, M.A.A. Stand-Alone Microgrid Energy Storage Schemes: Comparative Study. In Proceedings of the 2018 Twentieth International Middle East Power Systems Conference (MEPCON), Cairo, Egypt, 18–20 December 2018; pp. 564–569. [Google Scholar] [CrossRef]
- Mohammed, A.; Saif, O.; Abo-Adma, M.A.; Elazab, R. Multiobjective optimization for sizing and placing electric vehicle charging stations considering comprehensive uncertainties. Energy Inform. 2024, 7, 131. [Google Scholar] [CrossRef]
- Microgrid Controllers: Functions and Benefits|Mesa Solutions. Available online: https://247mesa.com/microgrid-controllers-functions-and-benefits (accessed on 15 September 2024).
- Zia, M.F.; Elbouchikhi, E.; Benbouzid, M. Microgrids energy management systems: A critical review on methods, solutions, and prospects. Appl. Energy 2018, 222, 1033–1055. [Google Scholar] [CrossRef]
- Mahmoud, F.S.; Diab, A.A.Z.; Ali, Z.M.; El-Sayed, A.H.M.; Alquthami, T.; Ahmed, M.; Ramadan, H.A. Optimal sizing of smart hybrid renewable energy system using different optimization algorithms. Energy Rep. 2022, 8, 4935–4956. [Google Scholar] [CrossRef]
- Kumar, N.M.; Chopra, S.S.; Chand, A.A.; Elavarasan, R.M.; Shafiullah, G.M. Hybrid renewable energy microgrid for a residential community: A techno-economic and environmental perspective in the context of the SDG7. Sustainability 2020, 12, 3944. [Google Scholar] [CrossRef]
- Rinaldi, F.; Moghaddampoor, F.; Najafi, B.; Marchesi, R. Economic feasibility analysis and optimization of hybrid renewable energy systems for rural electrification in Peru. Clean Technol. Environ. Policy 2021, 23, 731–748. [Google Scholar] [CrossRef]
- Eras-Almeida, A.A.; Egido-Aguilera, M.A.; Blechinger, P.; Berendes, S.; Caamaño, E.; García-Alcalde, E. Decarbonizing the Galapagos Islands: Techno-economic perspectives for the hybrid renewable mini-grid Baltra-Santa Cruz. Sustainability 2020, 12, 2282. [Google Scholar] [CrossRef]
- Zhang, G.; Xiao, C.; Razmjooy, N. Optimal operational strategy of hybrid PV/wind renewable energy system using homer: A case study. Int. J. Ambient. Energy 2020, 43, 3953–3966. [Google Scholar] [CrossRef]
- Shezan, S.A. Feasibility analysis of an islanded hybrid wind-diesel-battery microgrid with voltage and power response for offshore Islands. J. Clean Prod. 2021, 288, 125568. [Google Scholar] [CrossRef]
- Kamal, M.M.; Ashraf, I. Planning and Optimization of Hybrid Microgrid for Reliable Electrification of Rural Region. J. Inst. Eng. 2022, 103, 173–188. [Google Scholar] [CrossRef]
- Alsagri, A.S.; Alrobaian, A.A.; Nejlaoui, M. Techno-economic evaluation of an off-grid health clinic considering the current and future energy challenges: A rural case study. Renew Energy 2021, 169, 34–52. [Google Scholar] [CrossRef]
- Beyoud, A.; Bouhaouss, A. An investigation into the feasibility of a hybrid generator-photovoltaic-wind farm with variable load profile: Case of headland south-west of Morocco. Clean Energy 2022, 6, 484–495. [Google Scholar] [CrossRef]
- Elmorshedy, M.F.; Elkadeem, M.R.; Kotb, K.M.; Taha, I.B.M.; El-Nemr, M.K.; Kandeal, A.W.; Sharshir, S.W.; Almakhles, D.J.; Imam, S.M. Feasibility study and performance analysis of microgrid with 100% hybrid renewables for a real gricultural irrigation application. Sustain. Energy Technol. Assess. 2022, 53, 102746. [Google Scholar] [CrossRef]
- Singh, U.; Rizwan, M. A feasibility study and cost benefit analysis of an off-grid hybrid system for a rural area electrification. Sol. Compass 2022, 3–4, 100031. [Google Scholar] [CrossRef]
- Bhatti, M.Z.A.; Siddique, A.; Aslam, W.; Atiq, S. Design and Analysis of a Hybrid Stand-Alone Microgrid. Energies 2024, 17, 200. [Google Scholar] [CrossRef]
- Shafira, A.N.; Petrana, S.; Muthia, R.; Purwanto, W.W. Techno-economic analysis of a hybrid renewable energy system integrated with productive activities in an underdeveloped rural region of eastern Indonesia. Clean Energy 2023, 7, 1247–1267. [Google Scholar] [CrossRef]
- Odetoye, O.A.; Olulope, P.K.; Olanrewaju, O.M.; Alimi, A.O.; Igbinosa, O.G. Multi-year techno-economic assessment of proposed zero-emission hybrid community microgrid in Nigeria using HOMER. Heliyon 2023, 9, e19189. [Google Scholar] [CrossRef]
- Ali, M.F.; Hossain, M.A.; Julhash, M.M.; Ashikuzzaman, M.; Alam, M.S.; Sheikh, M.R.I. A Techno-Economic Analysis of a Hybrid Microgrid System in a Residential Area of Bangladesh: Optimizing Renewable Energy. Sustainability 2024, 16, 8051. [Google Scholar] [CrossRef]
- Saleeb, H.; El-Rifaie, A.M.; Sayed, K.; Accouche, O.; Mohamed, S.A.; Kassem, R. Optimal Sizing and Techno-Economic Feasibility of Hybrid Microgrid. Processes 2025, 13, 1209. [Google Scholar] [CrossRef]
- Ngao-det, M.; Thongpron, J.; Namin, A.; Patcharaprakiti, N.; Muangjai, W.; Somsak, T. Systematic Optimize and Cost-Effective Design of a 100% Renewable Microgrid Hybrid System for Sustainable Rural Electrification in Khlong Ruea, Thailand. Energies 2025, 18, 1628. [Google Scholar] [CrossRef]
- Uruchi, N.T.; Diaz, V.S.; Torres, N.N.S.; Maciel, J.N.; Ledesma, J.J.G.; Cavallari, M.R.; Gazziro, M.; Lago, T.G.S.D.; Junior, O.H.A. Techno-Economic Optimization of an Isolated Solar Microgrid: A Case Study in a Brazilian Amazon Community. Eng 2025, 6, 133. [Google Scholar] [CrossRef]
- Ajao, K.; Oladosu, O.; Popoola, O. Using HOMER power optimization software for cost benefit analysis of Hybrid-solar power generation relative to utility cost in Nigeria. Int. J. Res. Rev. Appl. Sci. 2011, 7, 96–102. [Google Scholar]
- Afif, B.; Chaker, A.; Benhamou, A. Sizing of optimal case of standalone hybrid power system using homer software. Int. Rev. Autom. Control. 2017, 10, 23–32. [Google Scholar] [CrossRef]
- Bahramara, S.; Moghaddam, M.P.; Haghifam, M.R. Optimal planning of hybrid renewable energy systems using HOMER: A review. Renew. Sustain. Energy Rev. 2016, 62, 609–620. [Google Scholar] [CrossRef]
- Alturki, A.A. Optimal design for a hybrid microgrid-hydrogen storage facility in Saudi Arabia. Energy Sustain. Soc. 2022, 12, 24. [Google Scholar] [CrossRef] [PubMed]
- Polat, S.; Sekerci, H. The Determination of Optimal Operating Condition for an Off-Grid Hybrid Renewable Energy Based Micro-Grid: A Case Study in Izmir, Turkey. Emit. Int. J. Eng. Technol. 2021, 9, 137–153. [Google Scholar] [CrossRef]
- Rashid, M.U.; Ullah, I.; Mehran, M.; Baharom, M.N.R.; Khan, F. Techno-Economic Analysis of Grid-Connected Hybrid Renewable Energy System for Remote Areas Electrification Using Homer Pro. J. Electr. Eng. Technol. 2022, 17, 981–997. [Google Scholar] [CrossRef]
- Google Earth. Available online: https://earth.google.com/web/search/33%cb%9a19.5%e2%80%99E++29%cb%9a+20.9%e2%80%99N/@29.3483333,33.325,518.23780996a,725.4173823d,35y,0h,0t,0r/data=CmMaNRIvGZabA18sWT1AIZmZmZmZqUBAKhszM8uaMTkuNeKAmUUgIDI5y5ogMjAuOeKAmU4YAiABIiYKJAlGlInnD2dEQBESmnJoXwk8QBnQxzEjP-1GQCEIOcrxOz40QEICCAE6AwoBMEICCABKDQj___________8BEAA (accessed on 6 February 2025).
- Types of Exhaust Emissions from Diesel Generators. Available online: https://www.dieselgeneratortech.com/news/types-of-exhaust-emissions-from-diesel-generators.html (accessed on 25 June 2025).
- Diesel Generator Emission Standards: A Comprehensive Guide. Available online: https://www.sustainablemaintainance.com/2023/01/diesel-generator-emission-standards.html (accessed on 25 June 2025).
- Wind Speed Map for Egypt at 24.5 m Above Ground Level. Download Scientific Diagram. Available online: https://www.researchgate.net/figure/Wind-speed-map-for-Egypt-at-245-m-above-ground-level-42_fig3_368974043 (accessed on 21 November 2024).
- Global Solar Atlas. Available online: https://globalsolaratlas.info/download/egypt (accessed on 6 February 2025).
- Al-Orabi, A.M.; Osman, M.G.; Sedhom, B.E. Analysis of the economic and technological viability of producing green hydrogen with renewable energy sources in a variety of climates to reduce CO2 emissions: A case study in Egypt. Appl. Energy 2023, 338, 120958. [Google Scholar] [CrossRef]
- IRENA—International Renewable Energy Agency. Available online: https://www.irena.org/ (accessed on 29 December 2024).
- Home. Available online: https://www.cbe.org.eg/en (accessed on 15 June 2025).
- Discount Rates. Available online: https://www.cbe.org.eg/en/economic-research/statistics/discount-rates (accessed on 15 June 2025).
- Egypt Energy Prices. Available online: https://www.globalpetrolprices.com/Egypt/ (accessed on 15 June 2025).
Disclaimer/Publisher’s Note: The statements, opinions and data contained in all publications are solely those of the individual author(s) and contributor(s) and not of MDPI and/or the editor(s). MDPI and/or the editor(s) disclaim responsibility for any injury to people or property resulting from any ideas, methods, instructions or products referred to in the content. |
© 2025 by the authors. Licensee MDPI, Basel, Switzerland. This article is an open access article distributed under the terms and conditions of the Creative Commons Attribution (CC BY) license (https://creativecommons.org/licenses/by/4.0/).