Article

Design and Measurements of an Electrothermal Filter Using CMOS Technology †

Department of Microelectronics and Computer Science, Faculty of Electrical, Electronic, Computer and Control Engineering, Lodz University of Technology, 90-924 Łódź, Poland
*
Author to whom correspondence should be addressed.
This article is a revised and expanded version of our paper, which was presented at the 30th International Conference on Mixed Design of Integrated Circuits and System (MIXDES), Kraków, Poland, 29–30 June 2023.
Electronics 2025, 14(17), 3355; https://doi.org/10.3390/electronics14173355 (registering DOI)
Submission received: 15 July 2025 / Revised: 14 August 2025 / Accepted: 21 August 2025 / Published: 23 August 2025
(This article belongs to the Special Issue Mixed Design of Integrated Circuits and Systems)

Abstract

Electronic circuits and systems often require continuous monitoring of their temperature. For most sensors, voltage is the temperature-sensitive parameter; however, electrothermal filters are one of a few exceptions, for which signal frequency or phase is the measure of temperature. Such filters are an essential part of temperature sensors, based on the measurement of material thermal diffusivity, in which the input signal of the filter is a square wave. However, the phase shift introduced by the filter depends on the signal frequency. Thus, the authors decided to explore this dependence in more detail by measuring filter response to sinusoidal input signals. The investigations presented in this paper were carried out for an electrothermal filter designed and manufactured in an ASIC using 3 µm CMOS technology. The obtained measurement results confirmed the hypothesis that both the gain and the phase shift in the filter strongly depend on the input signal frequency. Accurate data on the thermal impedance of filters is crucial for the optimization of their performance.

1. Introduction

Integrated circuits and microprocessors manufactured using the latest technologies are currently the core of most electronic systems [1,2,3]. Considering that temperature is one of the most important factors influencing electronic system operation and reliability [4], thermal simulations are now an indispensable stage of the design process [5,6]. Moreover, in many applications, temperature monitoring should be carried out also in real time in order to protect systems from malfunction or destruction [7]. Different kinds of sensors can be used to measure circuit temperature, including simple thermistors [8], thermocouples [9], p-n diodes [10], bipolar transistors [11] or more sophisticated sensors such as Proportional-To-Absolute-Temperature (PTAT) sensors [12,13,14]. In all these sensors, voltage is used as the temperature-sensitive parameter.
In contrast, in the electrothermal filter (ETF) considered in this paper, the signal frequency or its phase is the measure of temperature. ETFs can be manufactured using the standard CMOS technologies, which are usually cheaper because they do not require any modifications of technological processes [15,16,17]. An electrothermal filter consists of a heater and a temperature sensor. Usually, the heater is a simple diffusion resistor, whereas the temperature sensor can consist of a thermopile made up of p+-diffusion/aluminum thermocouples, which do not require any biasing. Increasing the number of thermocouples placed at the same distance from the heater increases the sensor signal magnitude and does not affect the phase shift [18]. Typically, ETFs are used in temperature sensors based on the thermal diffusivity measurement. Then, they are placed in frequency-locked loops of temperature-to-frequency converters. The square wave signal is provided to the ETF heater by a voltage-controlled oscillator, and its temperature-dependent output signal from the thermopile is digitized by a sigma-delta Analog-to-Digital Converter (ADC) [19].
Electrothermal filters and their applications have been developed for over a decade by the research group led by Makinwa from the Delft University of Technology in the Netherlands. Possibly the first practical realization of an ETF manufactured using 0.7 μm CMOS technology was presented in [20]. Then, the original design was optimized for rectangular [19] and circular geometries [21]. The objective of the optimization was to determine the best locations of thermopile hot and cold junctions for the signal frequency of 100 kHz. The circuit layout was further optimized in order to minimize the influence of lithographic process inaccuracies [22]. An overview of existing ETF practical realizations in different technologies is provided in [23]. The authors of [24] presented the final compact low-power version of the ETF-based temperature sensor developed for System-on-Chip thermal monitoring purposes manufactured using 40 nm CMOS technology. Another version of the sensor, discussed in [25], compares the output signals of two ETFs measuring the diffusivity of silicon and silicon oxide, which has lower temperature sensitivity. Owing to this solution, it was possible to eliminate the need for an external frequency reference.
Considering that the ETF heaters in such sensors are driven by a square wave containing multiple spectral components and that the phase shift introduced by the filter depends on the signal frequency, the authors decided to explore this dependence in more detail by measuring the ETF response to sinusoidal input signals. The investigations presented in this paper were carried out for an electrothermal filter designed and manufactured in an ASIC using 3 µm CMOS technology. The following section of this paper introduces the ETF principles of operation and its design. Next, the results of measurements and tests of the manufactured device are presented. Finally, the major conclusions are provided, and the possible future tasks are outlined. This paper follows on from earlier conference papers [26,27] and the journal article presenting the PTAT sensor manufactured with the same ASIC [14].

2. Electrothermal Filter

2.1. Principles of Operation

Electrothermal filters, also known as temperature-to-frequency converters, could be an interesting alternative to other temperature sensors because they are fairly insensitive to technological process parameter spread [23]. The principle of their operation is relatively simple. As already mentioned, they consist of a diffusion resistor heater and a temperature sensor in the form of a thermopile with its respective hot and cold junctions that are equally distant from the heater [21]. A sinusoidal signal of frequency f applied to the heater diffuses through the substrate and reaches the sensor with a certain delay. The phase shift between the heater and sensor signals φ is proportional to the distance from the resistor to the thermopile d. Then, for a substrate with the thermal diffusivity α, one can write the following relation [25]:
φ   ~   d   π   f / α  
Considering that the dependence of silicon substrate thermal diffusivity α on the absolute temperature T is known [28], temperature values can be determined using the ETF, since for a given signal frequency, the phase shift depends on the circuit temperature. The heater signal is delayed and attenuated as it diffuses through the substrate, so the ETF can be regarded as a filter with temperature-dependent characteristics, the phase shift in which depends on temperature [25].

2.2. Practical Realization

The ETF investigated in this paper is part of a larger Application-Specific Integrated Circuit (ASIC) designed in full-custom mode and containing several other designs. This integrated circuit was manufactured using apparently obsolete 3 μm CMOS 5 V technology with one polysilicon and two metal layers [29]. Such cheap maskless technologies use direct wafer writing, and they are still maintained and developed because they allow fast prototyping and verification of various design concepts by academic centers or small private companies [30,31,32].
The layout of the entire ASIC is presented in Figure 1a. The dimensions of the silicon die are 2080 μm × 2160 μm. The ASIC was mounted in the ceramic DIL 40 package, shown in Figure 1b, whose lid could be open, rendering possible infrared measurements of circuit temperature. The microscopic photograph of the bonded silicon die taken with the lid removed is visible in Figure 1c. The location of the electrothermal filter, which is the main interest in this paper, is indicated in the figures with yellow boxes.
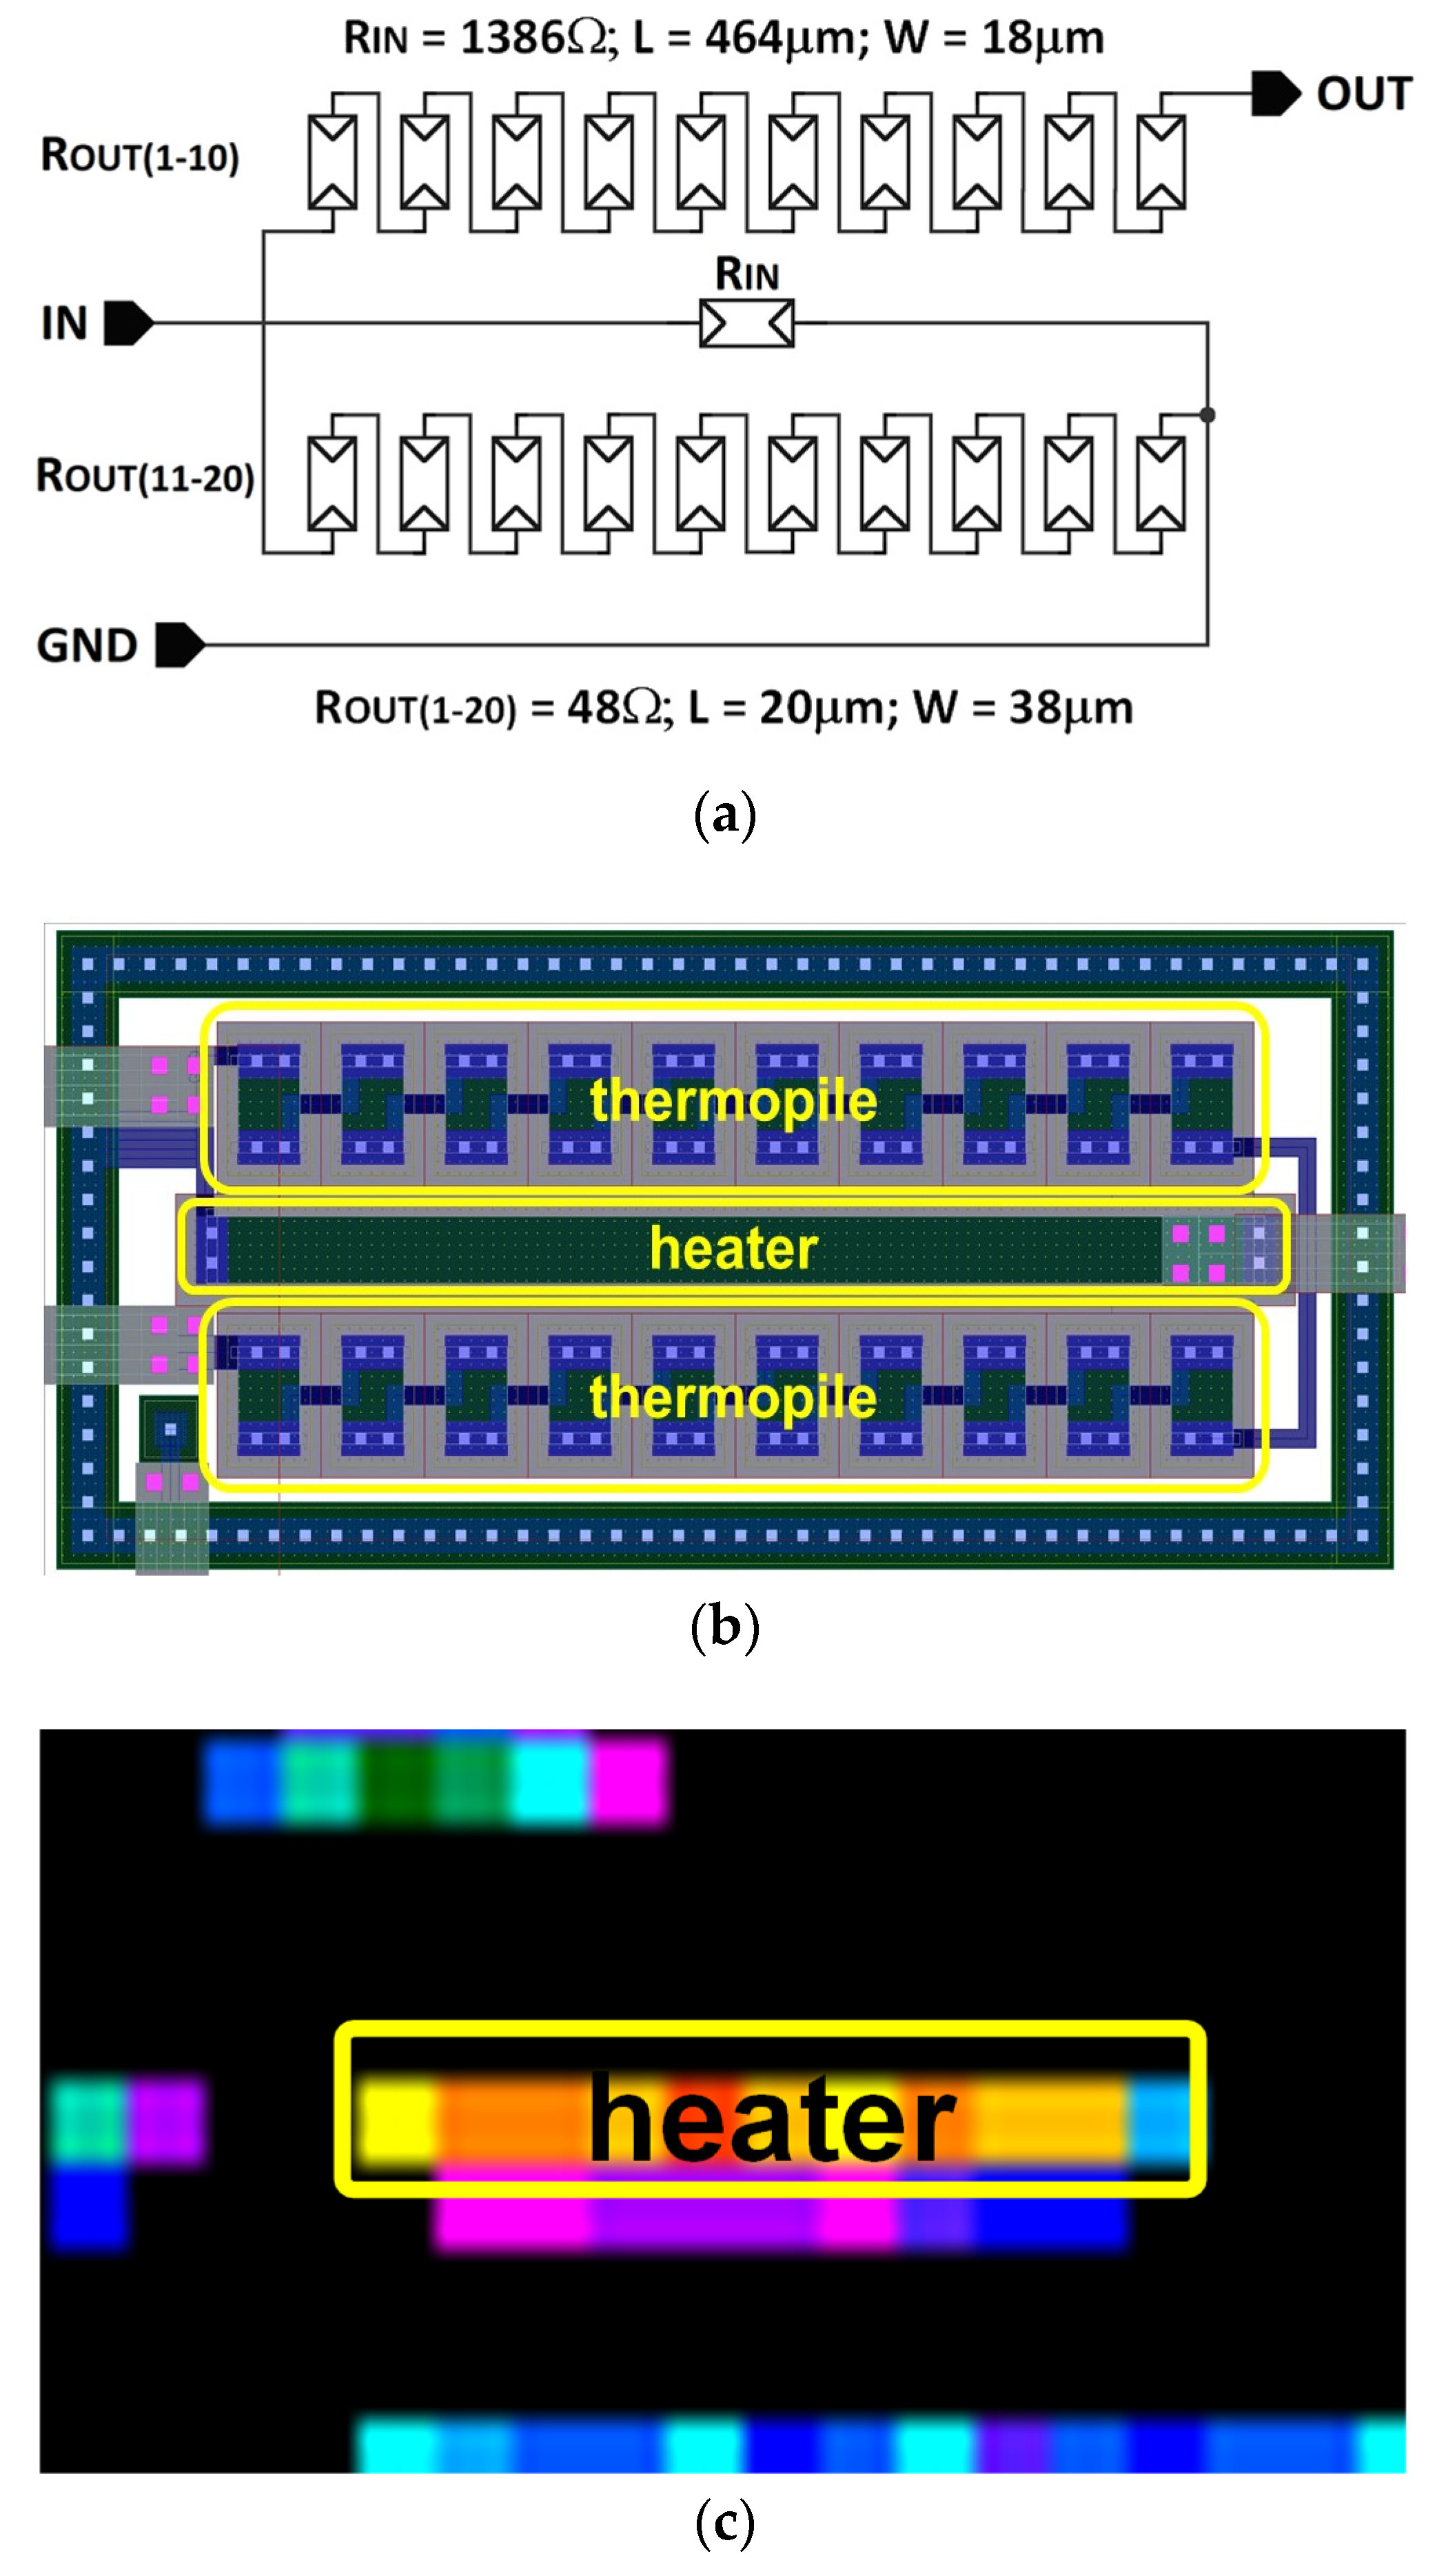
The designed ETF, the schematics of which are presented in Figure 2a, consists of a diffusion resistor heater, visible in the top left corner of the figure, with a nominal resistance of around 1386 Ω, and a sensor thermopile composed of 20 p+-diffusion/aluminum thermocouples connected in series. The resistance of each 20 μm × 38 μm resistor in the thermocouples is 48 Ω; hence, the expected total nominal resistance of the thermopile is 960 Ω. These resistor values should render possible the effective heating of the ETF and, at the same time, reasonably high sensitivity of the thermopile. Similar values of the heater and the thermopile resistances were also used in the original designs, e.g., those presented in [18,20], which were previously discussed in the Introduction.
The ETF is in the bottom right corner in the ASIC layout, and it is placed within the 560 μm × 135 μm n-well pictured in Figure 2b. The resistor heater has dimensions of 464 μm × 18 μm, and the sensor is located along both sides of the heater. In order to ensure the same heat diffusion time for each thermocouple, their hot and cold junctions are equally distant from the heater edges, by 18 μm and 42 μm, respectively. Both the heater and the thermopile are directly connected to package pins, so that they can be individually powered and read-out.

2.3. Preliminary Tests

Initially, the resistor heating capabilities were confirmed by infrared measurements. After removing the package lid, the thermographic images of silicon die surface temperature were recorded using the Inframetrics SC 1000 infrared camera equipped with a microscopic lens. The magnified image of the region around the heater recorded for the heating resistor current of 3.6 mA is shown in Figure 2c. The resistor is visible as the horizontal strip of pixels, indicated by the frame, which corresponds to locations of noticeably higher temperature. The precise measurement of resistor temperature was not possible here because the width of the heater was comparable with the lens resolution and the infrared radiation wavelength.

3. Measurement Results

Firstly, the circuit was calibrated in a Binder MKF 115 temperature chamber [33], visible in Figure 3a, within the temperature range of −40 °C ÷ +150 °C with a step of 5 °C. First, the ASIC was placed in the chamber, cooled to −40 °C, and then maintained at this temperature for 20 min. Next, the temperature was ramped up to +150 °C, and temperature measurements were taken during the heating process. Owing to the slow rate of temperature increase of less than 1 °C/min, it was possible to ensure minimal differences in temperature between the surrounding ambient environment and the measured ASIC. Moreover, in order to further minimize this difference, measurements were taken with the package lid removed and the silicon die exposed directly to the environment, as shown in Figure 3b. Removing the lid accelerated the attainment of a thermal steady state after each change in the preset temperature and significantly reduced the measurement time without affecting the measurement results.
The designed integrated circuit was manufactured in a batch consisting of 10 different specimens, but one of them was damaged mechanically. Thus, the above-described calibration procedure was repeated only for the nine remaining samples. The calibration results obtained for these ASICs are presented in Figure 4a using different colors and markers. The heating resistor is denoted in the figure by R_heat, whereas the sensing thermopile of the ETF is denoted by R_sens. The differences in the resistor values among the ASICs result from the technological parameter spread. As can be seen, at a temperature of 20 °C, the heater resistance varies from 1350 Ω to 1420 Ω, and the sensor resistance falls in the range between 940 Ω and 980 Ω; thus, the accuracy of the manufactured resistor values due to the technological parameter spread is around ±3%. Additionally, the measurement results were fitted with the first-order polynomials, demonstrating that both resistance values increase linearly with temperature, and the relative changes are around 12% per 100 K, with the coefficients of determination R2 values higher than 0.995. Thus, both devices can be effectively used for sensing the ASIC temperature during its operation. Since the spread of technological parameters is fairly low, the following analyses will be presented for the averaged sensor characteristics.
The next step in the experiments was to practically assess the heating resistor’s ability to increase the ASIC temperature. During these measurements, the voltage across the resistor was gradually increased until the power supply value was reached, and both heater and sensor resistance values were measured. The variation in resistance as a function of dissipated power is presented in Figure 4b. As can be seen, when the power value exceeds around 20 μW, the increase in resistance due to the change in temperature and the self-heating effect is observed. Thus, the resistor can be effectively used as a heating element in the electrothermal filter. However, when this resistor is used as a sensor, its biasing current should be kept sufficiently low.
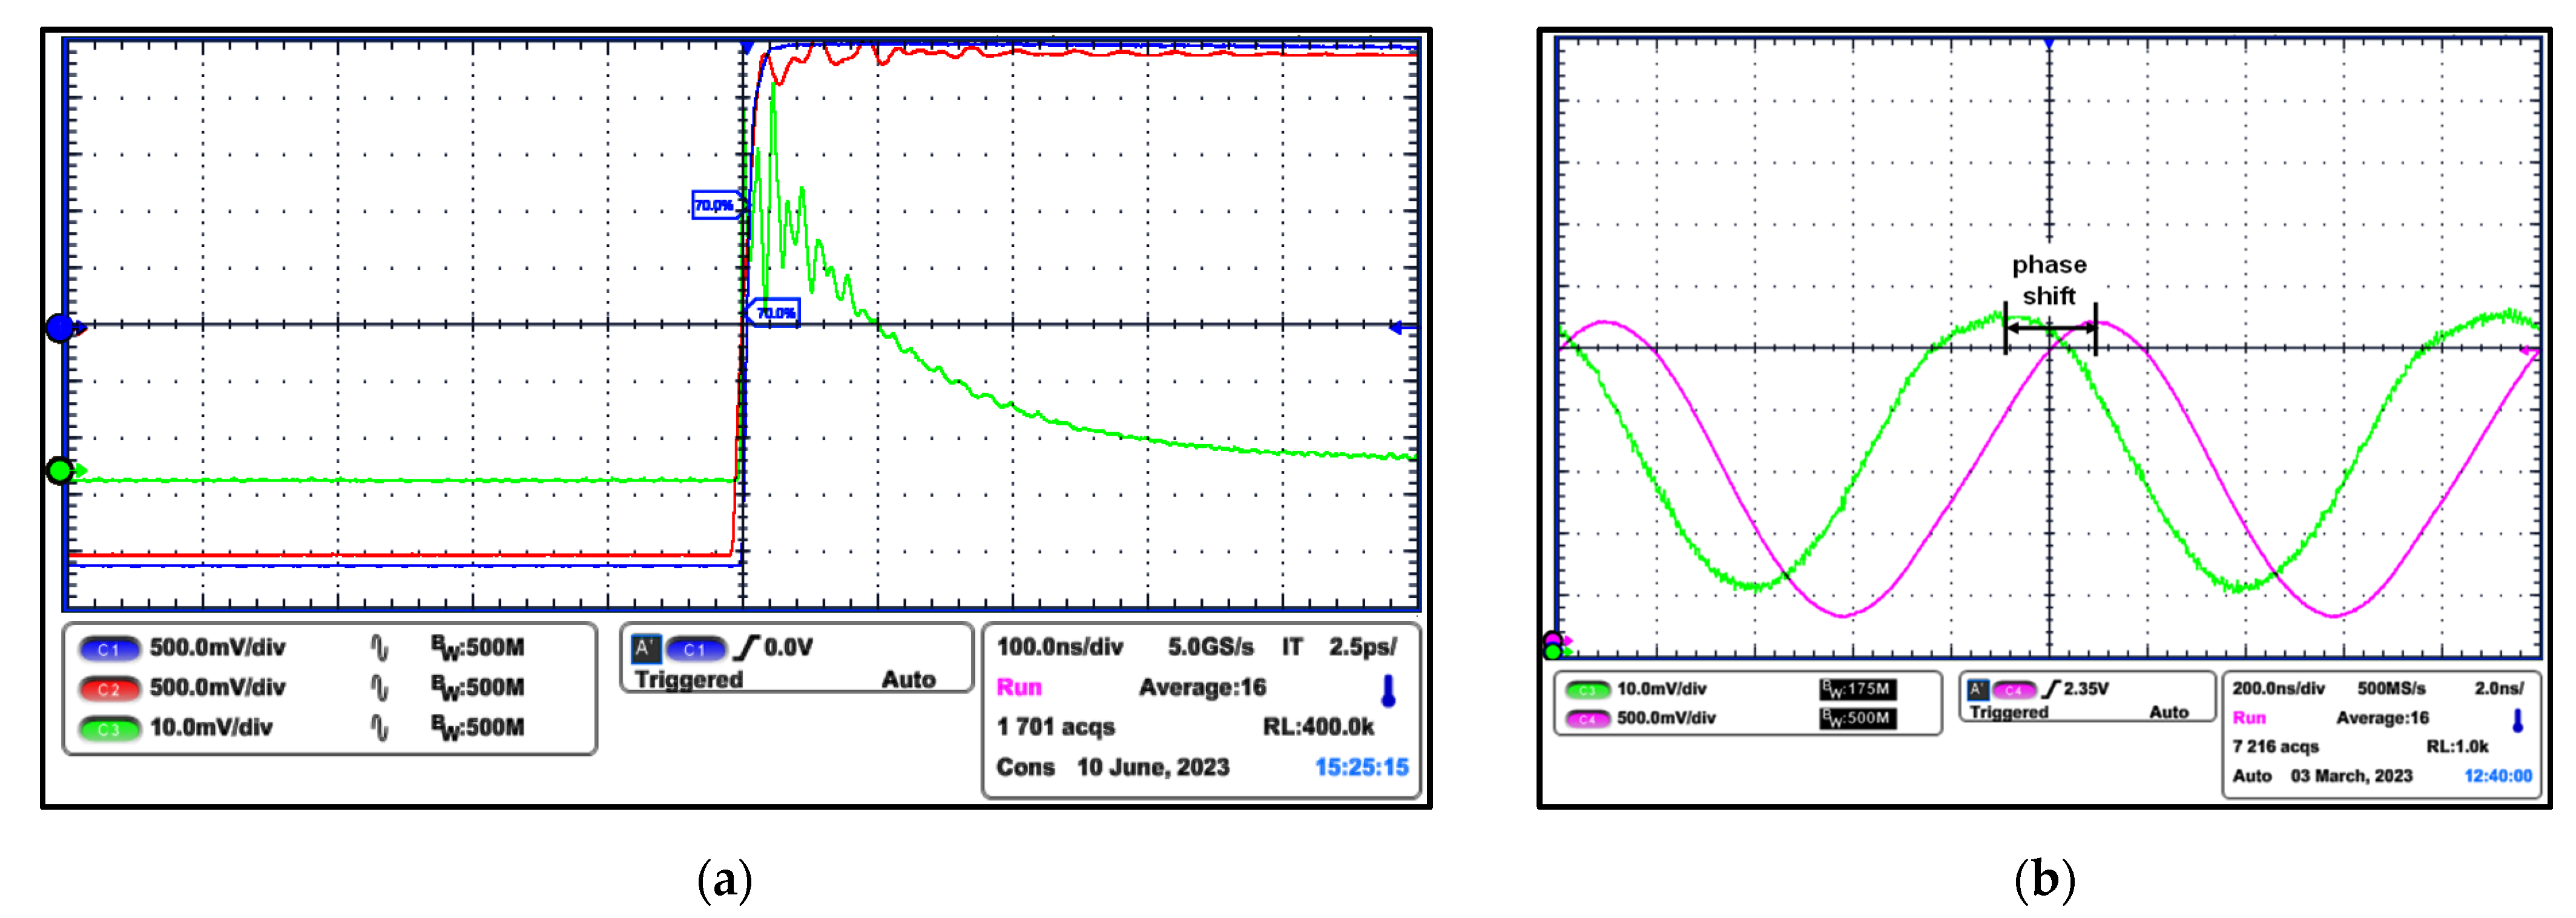
Then, the dynamic behavior of the ETF was investigated. These measurements were carried out using the Tektronix DPO5054 oscilloscope [34]. First, as shown in Figure 5a, the response to the voltage step excitation was measured by applying the power supply voltage to the resistor heater (yellow curve) and recording the thermopile sensor response (magenta curve). Considering that the amplitude of the thermopile output signal is significantly attenuated, different scales were used on the vertical axis for the measurement channels, i.e., 500 mV/div for the heater and 10 mV/div for the sensor. As can be seen, the thermopile voltage initially tracks the excitation and then exponentially decays over approximately 600 ns, indicating the high-pass behavior of the ETF.
Considering that in different applications the electrothermal filter should operate with sinusoidal signals, the frequency characteristics of the ETF were investigated in detail. During these tests, the input signal, which consisted of the DC component equal to half of the power supply voltage superimposed with a sinusoidal signal of variable frequency, was provided to the heating resistor, and then the voltage response of the sensing thermopile was measured. Figure 5b presents an example of the sensor response (magenta line) compared with the input signal (green line) at a frequency of 1 MHz. The measurement channels have different sensitivity values, identical to those in Figure 5a, so that both sinusoidal curves have comparable height. Moreover, the phase shift between the measured signals is indicated in the figure. As can be seen, the output signal is significantly attenuated and visibly delayed.
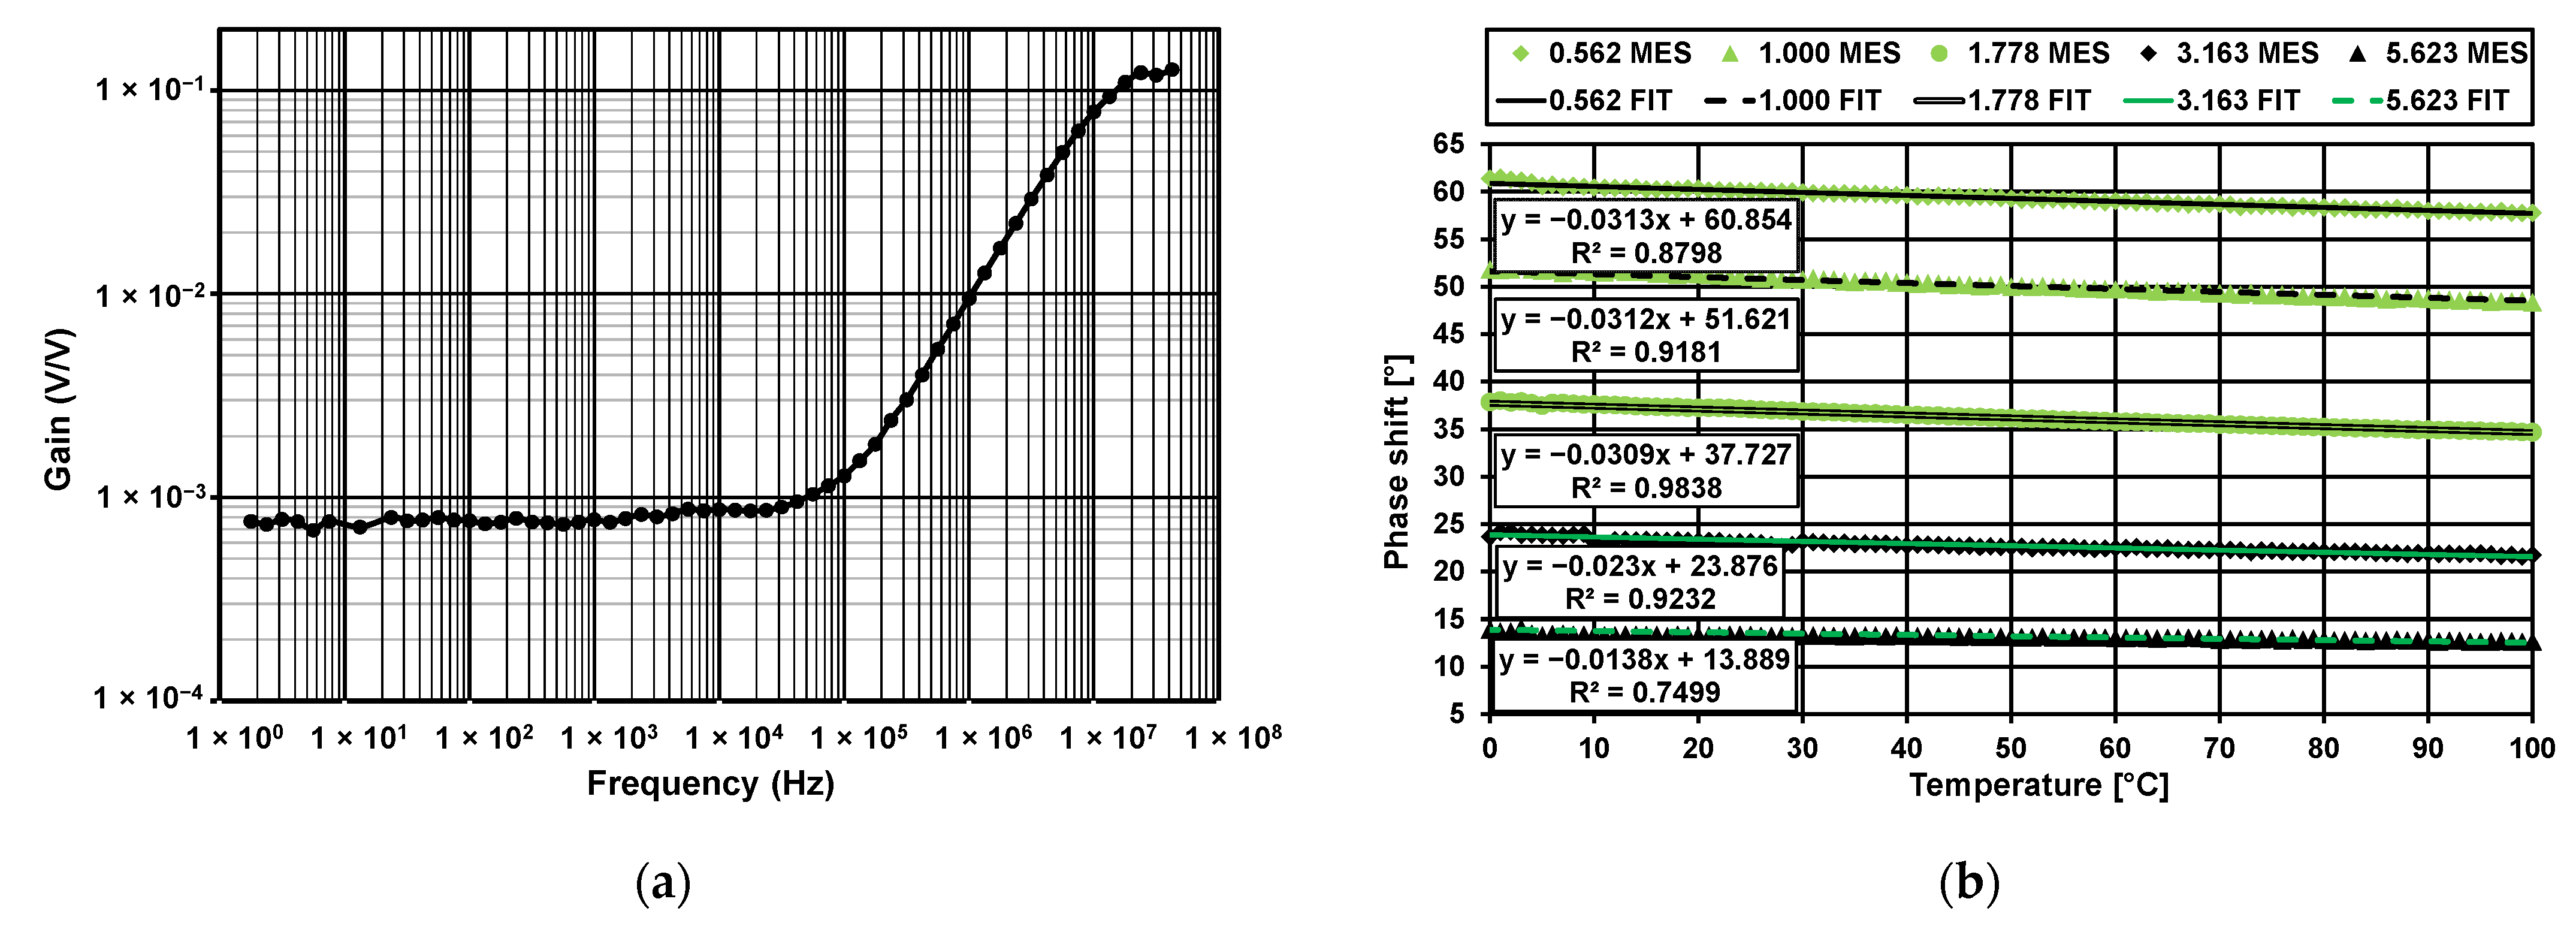
This issue was investigated in more detail by measuring the amplitude and frequency characteristics of the ETF. Indeed, the amplitude characteristic of the thermopile sensor, shown in Figure 6a, is frequency dependent, and for low frequencies, the gain is very small. Then, at a frequency of around 30 kHz, the amplitude of the response increases rapidly and eventually saturates at around 20 MHz just over the value of 0.1 V/V, which confirms the earlier observed high-pass behavior of the device.
The phase shift dependence on temperature between the input heating resistor signal and the sensor thermopile output was measured for different frequency values, focusing on the gain transition region, between 500 kHz and 5 MHz. The measurement results obtained for five frequency values are plotted using different markers in Figure 6b. Additionally, these results were fitted with a first-order polynomial, represented by the lines. The linear equations resulting from this fitting and the coefficients of determination R2 are also presented in the figure. Moreover, selected data concerning the dependence of gain and sensitivity are provided in Table 1.
As can be seen, the gain increases with frequency, but then the sensitivity of the phase shift to temperature decreases. The sensitivity characteristics are fairly linear, with a determination coefficient value over 0.9 in the gain transition region between 1 MHz and 3 MHz. The use of higher frequency signals would render the phase shift insensitive to temperature. In contrast, the low gain values at low frequencies might adversely affect the measurement accuracy because of the limited dynamic input range of ADCs used in the measurement equipment.

4. Conclusions

This paper presents an electrothermal filter designed and manufactured entirely using CMOS technology. Such circuits might constitute an interesting alternative to other types of temperature sensors, such as thermocouples or ring oscillators, because they are inherently independent from the range of manufacturing process parameters. The presented measurement results prove that the manufactured devices operate properly, and, after calibration, they could be employed for circuit temperature monitoring purposes. They can also be used as phase references for thermal diffusivity sensors.
The circuit operation has been tested for various input signal frequencies in a wide range of temperature values. The main finding of the paper is that both the filter gain and the phase shift depend on temperature. Thus, in order to optimize ETF performance, the thermal impedance of the filter should be accurately determined; however, its value is difficult calculate analytically. The ETF layout optimization method presented in [21] and [35] was carried out using simplified analytical models based on thermal impedance theory, assuming that the heat generated by the heater diffuses in a semi-infinite medium at the source frequency of 100 kHz.
Further research should focus on determining the actual thermal impedance of the ETF. According to the principles of the Network Identification by Deconvolution (NID) method [36], this could be realized by recording ETF thermal responses to power unit step functions. Then, the recorded curves can be further processed by computing the spectral density of thermal resistances and the Bode plots of thermal impedances. The main goal of these analyses would be to determine the optimal input signal frequency, ensuring the maximal temperature sensitivity of the phase shift.

Author Contributions

Conceptualization, M.J. (Marcin Janicki) and M.J. (Mariusz Jankowski); methodology, M.S. and M.J. (Mariusz Jankowski); validation, M.S. and M.J. (Mariusz Jankowski); formal analysis, M.S. and M.J. (Mariusz Jankowski); investigation, M.J. (Mariusz Jankowski); visualization, M.J. (Mariusz Jankowski); writing—original draft preparation, M.J. (Marcin Janicki); writing—review and editing, M.S. and M.J. (Mariusz Jankowski). All authors have read and agreed to the published version of the manuscript.

Funding

This research received no external funding.

Data Availability Statement

The data presented in this study to support the conclusions can be made available by the authors on request.

Acknowledgments

The authors would like to extend their gratitude to the Łukasiewicz Research Network—Institute of Microelectronics and Photonics (formerly Institute of Electron Technology) in Warsaw, Poland, where the investigated ASIC was manufactured.

Conflicts of Interest

The authors declare no conflicts of interest.

References

  1. Krishnamoorthy, R.; Krishnan, K.; Chokkalingam, B.; Padmanaban, S.; Leonowicz, Z.; Holm-Nielsen, J.B.; Mitolo, M. Systematic Approach for State-of-the-Art Architectures and System-on-Chip Selection for Heterogeneous IoT Applications. IEEE Access 2021, 9, 25594–25622. [Google Scholar] [CrossRef]
  2. Sallehuddin, N.M.; Muhamad, M.; Hussin, H.; Halim, A.K.; Wahab, Y.A. Trade-offs and Optimization: Low Power Approaches for Area, Power Consumption, and Performance in Microprocessor Design. In Proceedings of the IEEE Regional Symposium on Micro and Nanoelectronics (RSM), Langkawi, Malaysia, 28–30 August 2023; pp. 102–105. [Google Scholar] [CrossRef]
  3. Peña-Fernández, M.; Verdasco, B.; Entrena, L.; Lindoso, A. Soft-Error Detection and Execution Observation for ARM Microprocessors. IEEE Trans. Nucl. Sci. 2025, 72, 1504–1512. [Google Scholar] [CrossRef]
  4. Hill, I.; Chanawala, P.; Singh, R.; Sheikholeslam, S.A.; Ivanov, A. CMOS Reliability From Past to Future: A Survey of Requirements, Trends, and Prediction Methods. IEEE Trans. Device Mater. Reliab. 2022, 22, 1–18. [Google Scholar] [CrossRef]
  5. Lasance, C. Ten years of BCI compact thermal modelling of electronic parts: A review. Heat Transf. Eng. 2007, 29, 149–168. [Google Scholar] [CrossRef]
  6. Szekely, V. Thermal monitoring of microelectronic structures. Microelectron. J. 1994, 25, 157–170. [Google Scholar] [CrossRef]
  7. Oshita, T.; Shor, J.; Duarte, D.E.; Kornfeld, A.; Zilberman, D. Compact BJT-based thermal sensor for processor applications in a 14 nm tri-gate CMOS process. IEEE J. Solid-State Circuits 2015, 50, 799–807. [Google Scholar] [CrossRef]
  8. Liu, Y.; Liu, Y.; Zhang, W.; Zhang, J. The Study of Temperature Calibration Method for NTC Thermistor. In Proceedings of the 4th IEEE International Conference on Frontiers of Sensors Technologies (ICFST), Shanghai, China, 6–9 November 2020; pp. 50–53. [Google Scholar] [CrossRef]
  9. Ganwani, M.; Shaikh, B.; Sinha, S. Design and Investigation of MEMS-Based Thermopile Detector Arrays for Infrared Sensing Applications. In Proceedings of the IEEE Applied Sensing Conference (APSCON), Goa, India, 22–24 January 2024; pp. 1–4. [Google Scholar] [CrossRef]
  10. Elamaran, D.; Suzuki, Y.; Satoh, H.; Banerjee, A.; Hiromoto, N.; Inokawa, H. Performance Comparison of SOI-Based Temperature Sensors for Room-Temperature Terahertz Antenna-Coupled Bolometers: MOSFET, PN Junction Diode and Resistor. Micromachines 2020, 11, 718. [Google Scholar] [CrossRef] [PubMed]
  11. Shor, J.S.; Luria, K. Miniaturized BJT-based thermal sensor for microprocessors in 32- and 22-nm technologies. IEEE J. Solid-State Circuits 2013, 48, 2860–2867. [Google Scholar] [CrossRef]
  12. Rossi, C.; Aguirre, P. Ultra-low Power CMOS Cells for Temperature Sensors. In Proceedings of the SBCCI, Florianopolis, Brazil, 4–7 September 2005. [Google Scholar]
  13. Lee, T.J.; Tu, K.H. Wide Dynamic Range Temperature Sensor Using High Sensitivity PTAT Current Generator. In Proceedings of the 19th International SoC Design Conference, Gangneung-si, Republic of Korea, 19–22 October 2022; pp. 17–18. [Google Scholar] [CrossRef]
  14. Szermer, M.; Jankowski, M.; Janicki, M. Design, Fabrication, and Characterization of a PTAT Sensor Using CMOS Technology. Electronics 2024, 13, 429. [Google Scholar] [CrossRef]
  15. Bhargava, C.; Khanal, G.M. Basic CMOS VLSI Design. In Basic VLSI Design Technology: Technical Questions and Solutions; River Publishers: Gistrup, Denmark, 2020; pp. 113–152. [Google Scholar]
  16. Jacob Baker, R. CMOS Circuit Design, Layout, and Simulation, 4th ed.; Wiley-IEEE Press: Hoboken, NJ, USA, 2019; ISBN 978-1-119-48151-5. [Google Scholar]
  17. Meijer, G.C.; Wang, G.; Fruett, F. Temperature Sensors and Voltage References Implemented in CMOS Technology. IEEE Sens. J. 2001, 1, 225–234. [Google Scholar] [CrossRef]
  18. Makinwa, K.A.A.; Snoeij, M.F. A CMOS temperature-to-frequency converter with an inaccuracy of less than ±0.5 °C (3σ) from −40 °C to 105 °C. IEEE J. Solid-State Circuits 2006, 41, 2992–2997. [Google Scholar] [CrossRef]
  19. Zhang, C.; Makinwa, K.A.A. Interface electronics for a CMOS electrothermal frequency-locked-loop. IEEE J. Solid-State Circuits 2008, 43, 1603–1608. [Google Scholar] [CrossRef]
  20. Makinwa, K.A.; Witte, J.F. A temperature sensor based on a thermal oscillator. In Proceedings of the IEEE Sensors, Irvine, CA, USA, 30 October–3 November 2005; pp. 1149–1152. [Google Scholar] [CrossRef]
  21. Xia, S.; Makinwa, K.A. Design of an Optimized Electrothermal Filter for a Temperature-to-Frequency Converter. In Proceedings of the IEEE Sensors, Atlanta, GA, USA, 28–31 October 2007; pp. 1255–1258. [Google Scholar] [CrossRef]
  22. Kashmiri, S.M.; Xia, S.; Makinwa, K.A.A. A Temperature-to-Digital Converter Based on an Optimized Electrothermal Filter. In Proceedings of the 34th European Solid-State Circuits Conference ESSCIRC, Edinburgh, UK, 15–19 September 2008; pp. 74–77. [Google Scholar] [CrossRef]
  23. Vroonhoven, C.; van Makinwa, K.A. Thermal diffusivity sensing: A new temperature sensing paradigm. In Proceedings of the IEEE Custom Integrated Circuits Conference (CICC), San Jose, CA, USA, 19–21 September 2011. [Google Scholar] [CrossRef]
  24. Sönmez, U.; Sebastiano, F.; Makinwa, K.A. Compact Thermal-Diffusivity-Based Temperature Sensors in 40-nm CMOS for SoC Thermal Monitoring. IEEE J. Solid-State Circuits 2017, 52, 834–843. [Google Scholar] [CrossRef]
  25. Pedalà, L.; Sönmez, U.; Sebastiano, F.; Makinwa, K.A.; Nagaraj, K.; Park, J. An Oxide Electrothermal Filter in Standard CMOS. In Proceedings of the IEEE Sensors, Orlando, FL, USA, 30 October–3 November 2016; pp. 1–3. [Google Scholar] [CrossRef]
  26. Janicki, M.; Jankowski, M.; Szermer, M. Preliminary Characterization of An Electro-Thermal Converter. In Proceedings of the 30th International Conference on Mixed Design of Integrated Circuits and System (MIXDES), Kraków, Poland, 29–30 June 2023; pp. 160–163. [Google Scholar] [CrossRef]
  27. Jankowski, M.; Szermer, M. Simulation, Measurements and Analysis of the CMOS Temperature Sensor. In Proceedings of the 31st International Conference on Mixed Design of Integrated Circuits and System (MIXDES), Gdansk, Poland, 27–28 June 2024; pp. 138–143. [Google Scholar] [CrossRef]
  28. Turkes, P. An Ion-implanted Resistor as Thermal Transient Sensor for the Determination of the Thermal Diffusivity in Silicon. Phys. Stat. Sol. A 1983, 75, 519–523. [Google Scholar] [CrossRef]
  29. Łukasiewicz—Instytut Mikroelektroniki i Fotoniki, Warszawa, Poland. Available online: https://imif.lukasiewicz.gov.pl (accessed on 14 July 2025).
  30. Kosuge, A.; Sumi, H.; Shimamoto, N.; Ochiai, Y.; Inoue, Y.; Amano, H.; Mogami, T.; Mita, Y.; Ikeda, M.; Kuroda, T. Agile-X: A Structured-ASIC Created With a Mask-Less Lithography System Enabling Low-Cost and Agile Chip Fabrication. IEEE Trans. Very Large Scale Integr. (VLSI) Syst. 2025, 33, 746–756. [Google Scholar] [CrossRef]
  31. Petrou, L.; Georgiou, J. An ASIC Architecture With Inter-Chip Networking for Individual Control of Adaptive-Metamaterial Cells. IEEE Access 2022, 10, 80234–80248. [Google Scholar] [CrossRef]
  32. Sayal, A.; Ajay, P.; McDermott, M.W.; Sreenivasan, S.V.; Kulkarni, J.P. M2A2: Microscale Modular Assembled ASICs for High-Mix, Low-Volume, Heterogeneously Integrated Designs. IEEE Trans. Comput.-Aided Des. Integr. Circuits Syst. 2020, 39, 4760–4776. [Google Scholar] [CrossRef]
  33. Binder GmbH—Drying and Heating Chambers, Tuttlingen, Germany. Available online: https://www.binder-world.com (accessed on 14 July 2025).
  34. Test Equipment Solutions Ltd., Langley, UK. Available online: https://www.testequipmenthq.com/datasheets/TEKTRONIX-DPO5054-Datasheet.pdf (accessed on 25 July 2025).
  35. Gnidzińska, K.; Napieralski, A.; De Mey, G. Theoretical Investigation on Electrothermal Filters. In Proceedings of the 16th International Conference Mixed Design of Integrated Circuits & Systems MIXDES, Lodz, Poland, 25–27 June 2009; pp. 381–384. [Google Scholar]
  36. Szekely, V. Identification of RC networks by deconvolution: Chances and limits. IEEE Trans. Circuits Syst. I Fundam. Theory Appl. 1998, 45, 244–258. [Google Scholar] [CrossRef]
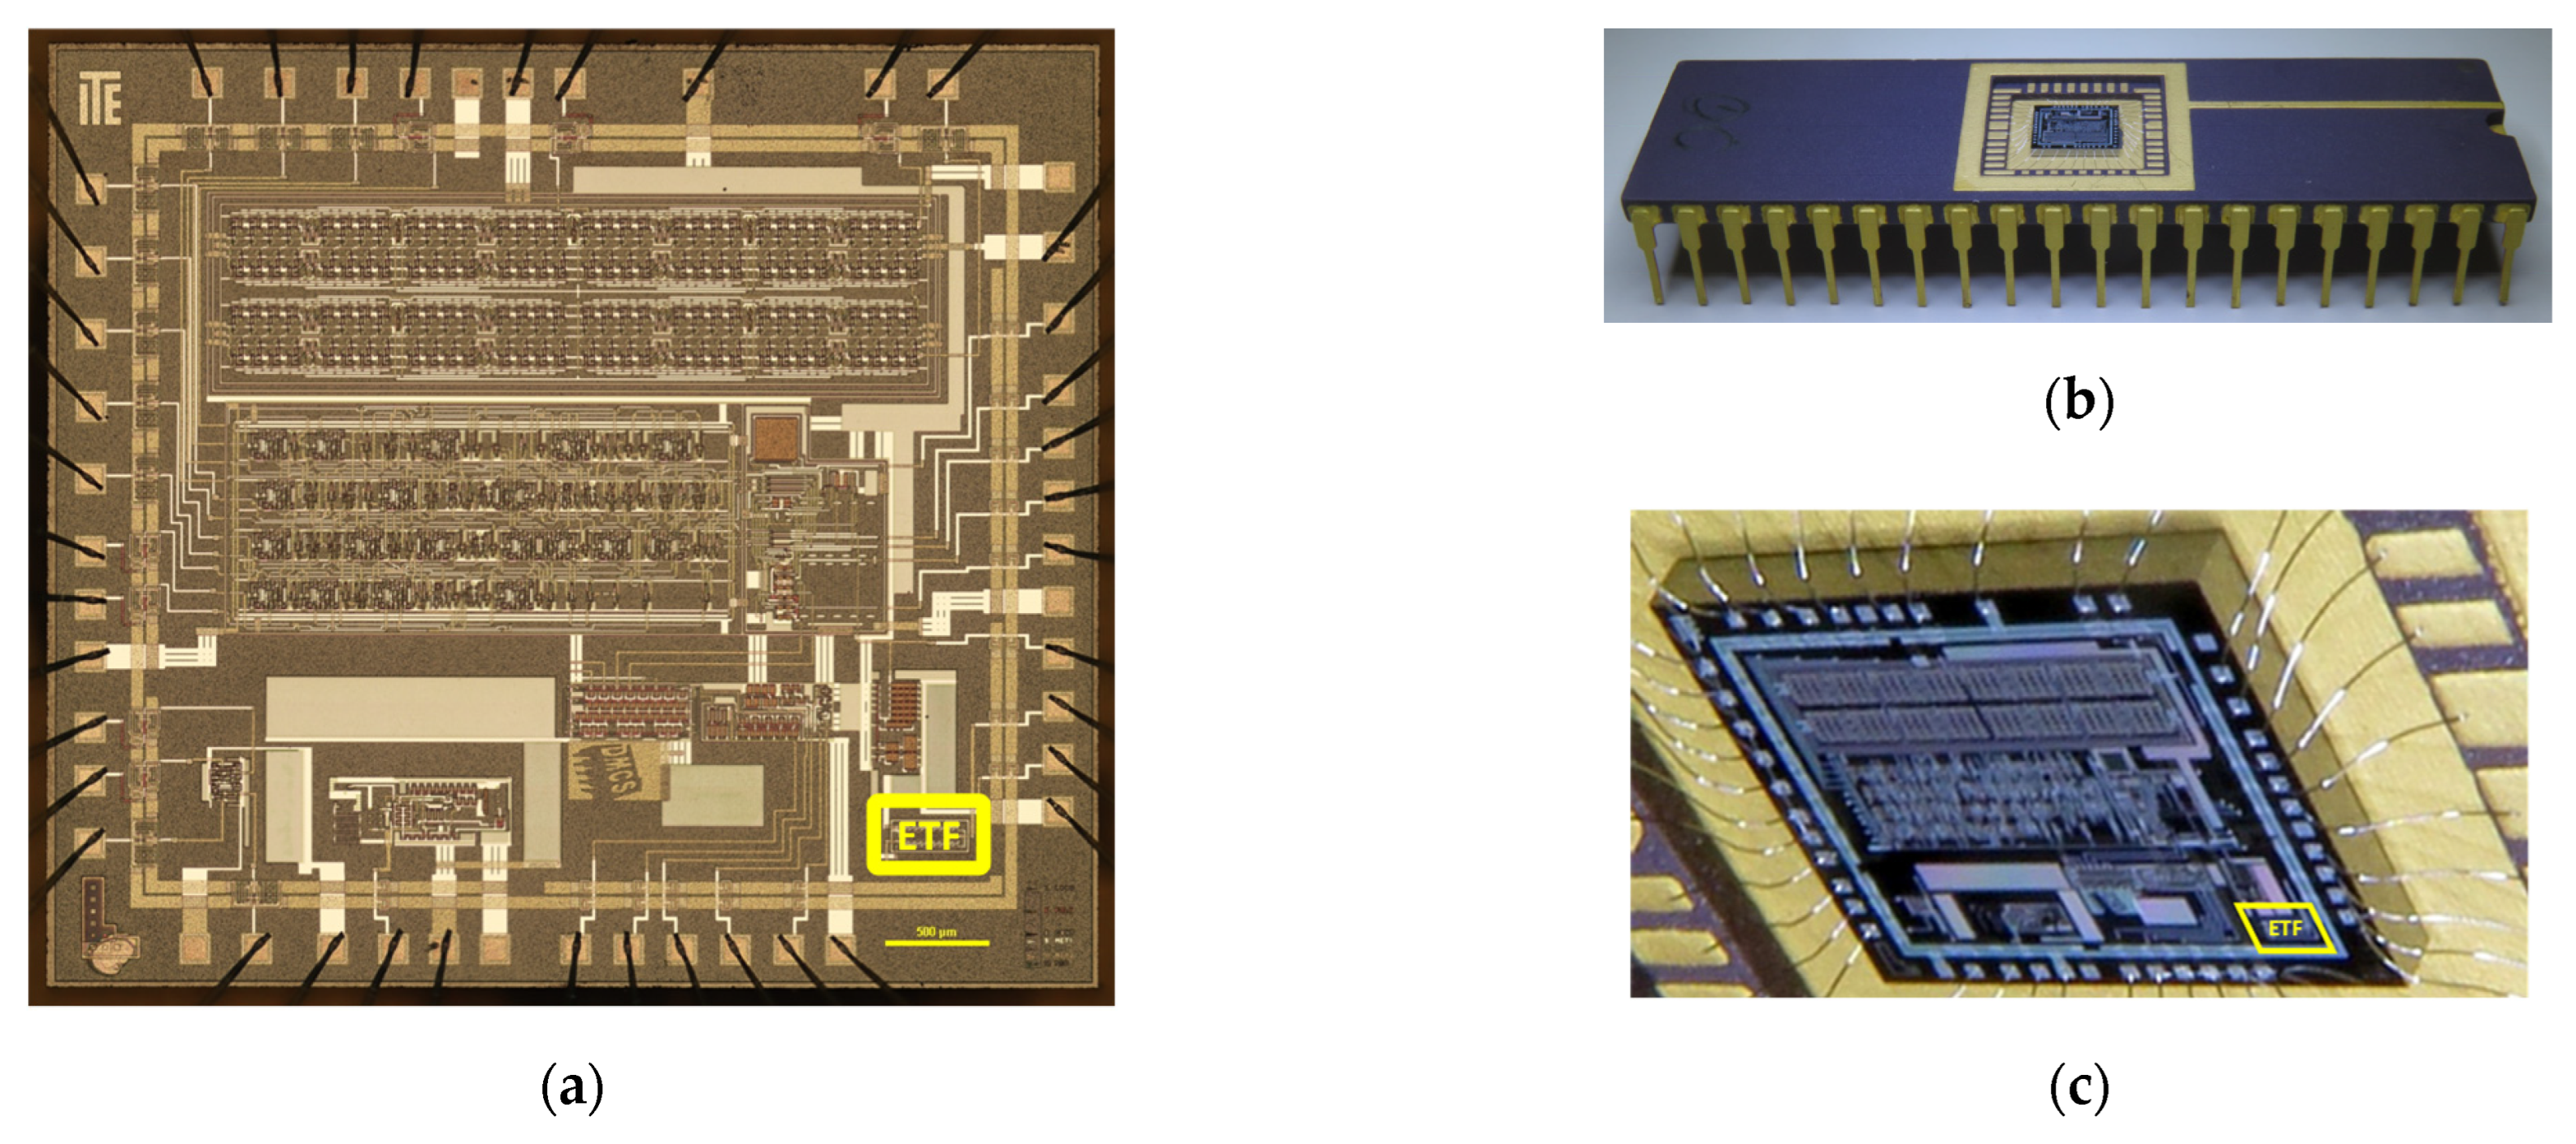
Figure 1. Photos of the manufactured ASIC with the indicated location of the electrothermal filter: (a) circuit layout; (b) ASIC in the DIL package; (c) zoomed-in view of the packaged chip.
Electronics 14 03355 g001
Figure 2. Electrothermal filter: (a) electrical schematics; (b) circuit layout; (c) microscopic infrared image with the heating resistor.
Electronics 14 03355 g002
Figure 3. PTAT sensor temperature calibration: (a) general view of the climate chamber; (b) the ASIC in the chamber with the lid removed.
Electronics 14 03355 g003
Figure 4. Results of temperature calibration: (a) heater and thermopile sensor resistance dependence on temperature; (b) dependence of heater and sensor resistance on dissipated power.
Electronics 14 03355 g004
Figure 5. Dynamic responses of the electrothermal filter: (a) response to voltage step excitation; (b) response to sinusoidal excitation of 1 MHz.
Electronics 14 03355 g005
Figure 6. Measured electrothermal filter characteristics: (a) amplitude characteristics; (b) phase shift dependence on temperature for different frequencies.
Electronics 14 03355 g006
Table 1. Data concerning the dependencies of measured gain and sensitivity on signal frequency.
Frequency
[MHz]
Gain
[mV/V]
Sensitivity
[deg/K]
0.5625.9870.0313
1.00010.6920.0312
1.77817.4530.0309
3.16326.2420.0230
5.62333.2100.0138
10.00036.6550.0025
Disclaimer/Publisher’s Note: The statements, opinions and data contained in all publications are solely those of the individual author(s) and contributor(s) and not of MDPI and/or the editor(s). MDPI and/or the editor(s) disclaim responsibility for any injury to people or property resulting from any ideas, methods, instructions or products referred to in the content.