Article

Potential of LiDAR and Hyperspectral Sensing for Overcoming Challenges in Current Maritime Ballast Tank Corrosion Inspection

1
Batten College of Engineering & Technology, Old Dominion University, Norfolk, VA 23529, USA
2
Mainbrace Solutions, Virginia Beach, VA 23455, USA
*
Author to whom correspondence should be addressed.
Electronics 2025, 14(15), 3065; https://doi.org/10.3390/electronics14153065 (registering DOI)
Submission received: 13 May 2025 / Revised: 29 July 2025 / Accepted: 29 July 2025 / Published: 31 July 2025

Abstract

Corrosion in maritime ballast tanks is a major driver of maintenance costs and operational risks for maritime assets. Inspections are hampered by complex geometries, hazardous conditions, and the limitations of conventional methods, particularly visual assessment, which struggles with subjectivity, accessibility, and early detection, especially under coatings. This paper critically examines these challenges and explores the potential of Light Detection and Ranging (LiDAR) and Hyperspectral Imaging (HSI) to form the basis of improved inspection approaches. We discuss LiDAR’s utility for accurate 3D mapping and providing a spatial framework and HSI’s potential for objective material identification and surface characterization based on spectral signatures along a wavelength range of 400-1000nm (visible and near infrared). Preliminary findings from laboratory tests are presented, demonstrating the basic feasibility of HSI for differentiating surface conditions (corrosion, coatings, bare metal) and relative coating thickness, alongside LiDAR’s capability for detailed geometric capture. Although these results do not represent a deployable system, they highlight how LiDAR and HSI could address key limitations of current practices and suggest promising directions for future research into integrated sensor-based corrosion assessment strategies.

1. Introduction

Corrosion represents a persistent and costly threat to the structural integrity and operational safety of metallic infrastructure worldwide. Annual expenditures related to corrosion mitigation and repair reach staggering figures, estimated at approximately USD 300 billion in the United States alone, equating to 3–4% of the Gross Domestic Product (GDP) for many nations [1]. This makes corrosion a primary driver of deterioration, particularly in demanding environments such as the maritime sector [2]. The timely detection and effective management of corrosion are therefore paramount for ensuring the longevity, safety, and economic viability of critical assets [3,4].
Maritime ballast tanks exemplify a particularly challenging environment for corrosion management. These internal structures are crucial for vessel stability but are often characterized by complex geometries, limited accessibility, and prolonged exposure to corrosive elements like seawater, potentially exacerbated by microorganisms within the ballast water [5,6,7,8]. Consequently, the economic lifespan of modern vessels is often dictated by the condition of their ballast tanks. Protective coatings serve as the primary defense but introduce their own inspection complexities, sometimes masking underlying issues or visually resembling corrosion products, hindering accurate assessment [9,10].
Current systems for corrosion detection and maritime tank mapping predominantly rely on traditional inspection methods, including manual visual inspections, ultrasonic testing, and magnetic flux leakage methods. Each of these techniques plays a crucial role in managing the structural integrity of maritime assets, yet they often fall short under challenging conditions typical of maritime environments.
Visual inspections are widely used due to their straightforward implementation and immediate results. However, they are subjective, dependent on the inspector’s expertise and the environmental conditions, and often fail to identify early-stage corrosion, especially if hidden under coatings or in inaccessible areas. Ultrasonic testing (UT) is employed to measure material thickness and detect internal defects by sending ultrasonic waves through materials [11,12,13]. While effective in detecting subsurface corrosion, UT can be time-consuming and requires direct contact with the material, making it less feasible for areas with complex geometries or significant surface coatings [2]. Magnetic flux leakage (MFL) detects corrosion by analyzing variations in magnetic fields due to metal loss. It is non-destructive and efficient for large areas but limited by surface conditions and requires post-processing to interpret results accurately. The inefficiency of these methods is underscored by estimates suggesting they mitigate only 15–35% of corrosion-related costs, highlighting a significant gap in effective condition monitoring [14,15].
Red coatings have been historically used because red lead primers have been one of the best anti-corrosive pigments. High contrast colors also make it easier to see whether something is fully coated or not. Not all boats use red coatings, but they are common to find and can cause confusion for methods that rely on visual inspection [16].
The maritime industry is increasingly seeking automated and non-invasive techniques to overcome these limitations. The expectations now encompass data-driven mapping, comprehensive mapping of internal structures to provide a digital twin of maritime tanks, enhancing the precision and record-keeping of inspections. There is a heightened demand for early detection methods that can identify corrosion before significant damage occurs, alongside predictive analytics capable of forecasting deterioration trends based on historical data. Enhancements in unmanned aerial vehicles (UAVs), robotics, and sensor technologies aim to reduce human exposure to hazardous environments and increase inspection frequencies, thereby improving data accuracy and operational safety [10].
In the field of agriculture, HSI has been used extensively for precision farming, allowing for the identification of disease outbreaks, estimation of crop biomass, and mapping of soil properties. By providing a non-invasive means to monitor large areas, HSI enables farmers to optimize resource use and enhance productivity [17,18].
HSI has also found applications in the mining industry, where it aids in the exploration and mapping of mineral resources. By detecting distinct spectral features of different minerals, HSI facilitates efficient resource estimation and expedition planning, reducing the time and cost associated with traditional exploration techniques [19,20].
In civil infrastructure inspection, HSI is used to detect material degradation and structural defects such as cracks, delaminations, and moisture intrusion in buildings and bridges. Its ability to penetrate surface layers provides a comprehensive view of the structural health, supporting maintenance planning and lifecycle management of critical assets [21,22].
These applications underscore the potential of HSI to transform inspection and monitoring practices in myriad domains by offering a data-rich comprehensive view of the target environment. In this context, the integration of HSI with other sensor technologies, such as LiDAR and UAV systems, is particularly promising for advanced automated inspection solutions in industries that demand high precision and reliability. Table 1 presents some of the main challenges of drone implementations in maritime applications.
In saltwater environments, corrosion of metallic structures such as maritime ballast tanks commonly occurs through electrochemical reactions. Saline solutions enable accelerated oxidation, leading to the formation of various corrosion products. Iron corrosion, for instance, typically results in the formation of iron oxides and hydroxides, such as hematite ( F e 2 O 3 ) , magnetite ( F e 3 O 4 ) , and goethite F e O ( O H ) . These compounds exhibit distinct absorption features in the visible to near infrared (VNIR) spectrum, which spreads from 400 nm to 1000 nm wavelengths [23].
Hyperspectral imaging (HSI) is particularly suited for detecting these spectral features, which arise due to electronic transitions and vibrational overtones related to the presence of metal oxides. For example, hematite shows diagnostic spectral signatures around the 550 nm region due to electron transitions, while hydroxide compounds like goethite have absorption features extending into the near-infrared region. This capability allows HSI to potentially differentiate between intact coatings, bare metal, and various stages of corrosion, providing crucial early-detection advantages over traditional visual methods [24]. By examining these spectral differences, HSI can offer a more objective and comprehensive corrosion assessment than conventional techniques.
Addressing these shortcomings necessitates exploring alternatives, non-intrusive technologies capable of providing more objective and comprehensive data. Light detection and ranging (LiDAR) and hyperspectral imaging (HSI) are promising sensor technologies whose capabilities for enhancing tank inspections [25,26]. LiDAR offers the potential for rapid precise 3D mapping of complex internal structures, providing detailed geometric data that can aid navigation, document structural conditions, and potentially identify large-scale anomalies [27,28]. HSI, by analyzing the spectral reflectance across numerous wavelengths inside the 400–1000 nm range, holds potential for objective material identification, allowing differentiation between coated regions, steel plates, and various corrosion products, possibly enabling the detection of early-stage chemical changes even before visual manifestation [29,30,31].
The motivation of this manuscript is to enable an initial practical exploration of the sensor technologies. These initial tests will allow us to showcase how these technologies could work with the maritime tank environment that is being presented and the main limitations that would have to be solved in order to achieve this. We aim to demonstrate the potential that a sensor fusion method could have in an application that is actively looking for a more efficient, non-destructive, and automated solution.
The contribution of this paper is to present a case study that examines the limitations inherent in conventional corrosion inspection methods, specifically within the demanding context of maritime ballast tanks. Drawing upon preliminary investigations using LiDAR and HSI, we explore the potential of these technologies to address the aforementioned shortcomings. Rather than presenting a fully validated methodology, our aim is to use this case study to highlight the feasibility of these sensors for specific inspection tasks—such as surface mapping and coating differentiation—and to propose a potential direction for future research towards developing more robust, efficient, and data-rich corrosion assessment strategies for these critical maritime assets.
Even though these technologies are not new, we believe there is potential in fusing these existing sensor techniques as a solution for tank mapping and simultaneous corrosion detection and control. This arises in a field that is actively looking for a solution and upgraded method as the rewards for making this process more efficient are significant.
Main Objectives:
  • Identify Shortcomings: highlight the limitations and challenges inherent in current inspection methods for detecting corrosion in maritime ballast tanks.
  • Showcase Technology Potential: provide preliminary evidence and practical scenarios that illustrate how HSI, LiDAR, and RGB sensors, when used in tandem, could effectively address these gaps.
  • Lay Groundwork for Future Research:employ this manuscript as a platform to initiate more focused and technical research, encouraging further exploration and development of integrated inspection methods.
This paper is organized as follows: Section 2 discusses the lab settings and procedures that were used throughout this research as well as the reasoning behind the choice of each sensor technology. Section 3 describes the results from the data process, lab testing, and some initial observations. Section 4 details the final evaluation of the diverse sensor technologies and the concluding remarks of the paper itself.

2. Materials and Methods

This section details the sensors and materials utilized in our preliminary investigations exploring the potential of LiDAR and hyperspectral sensing for enhanced corrosion assessment in maritime ballast tanks. The methods described were employed to evaluate the basic feasibility of these technologies for tasks relevant to corrosion detection and characterization.

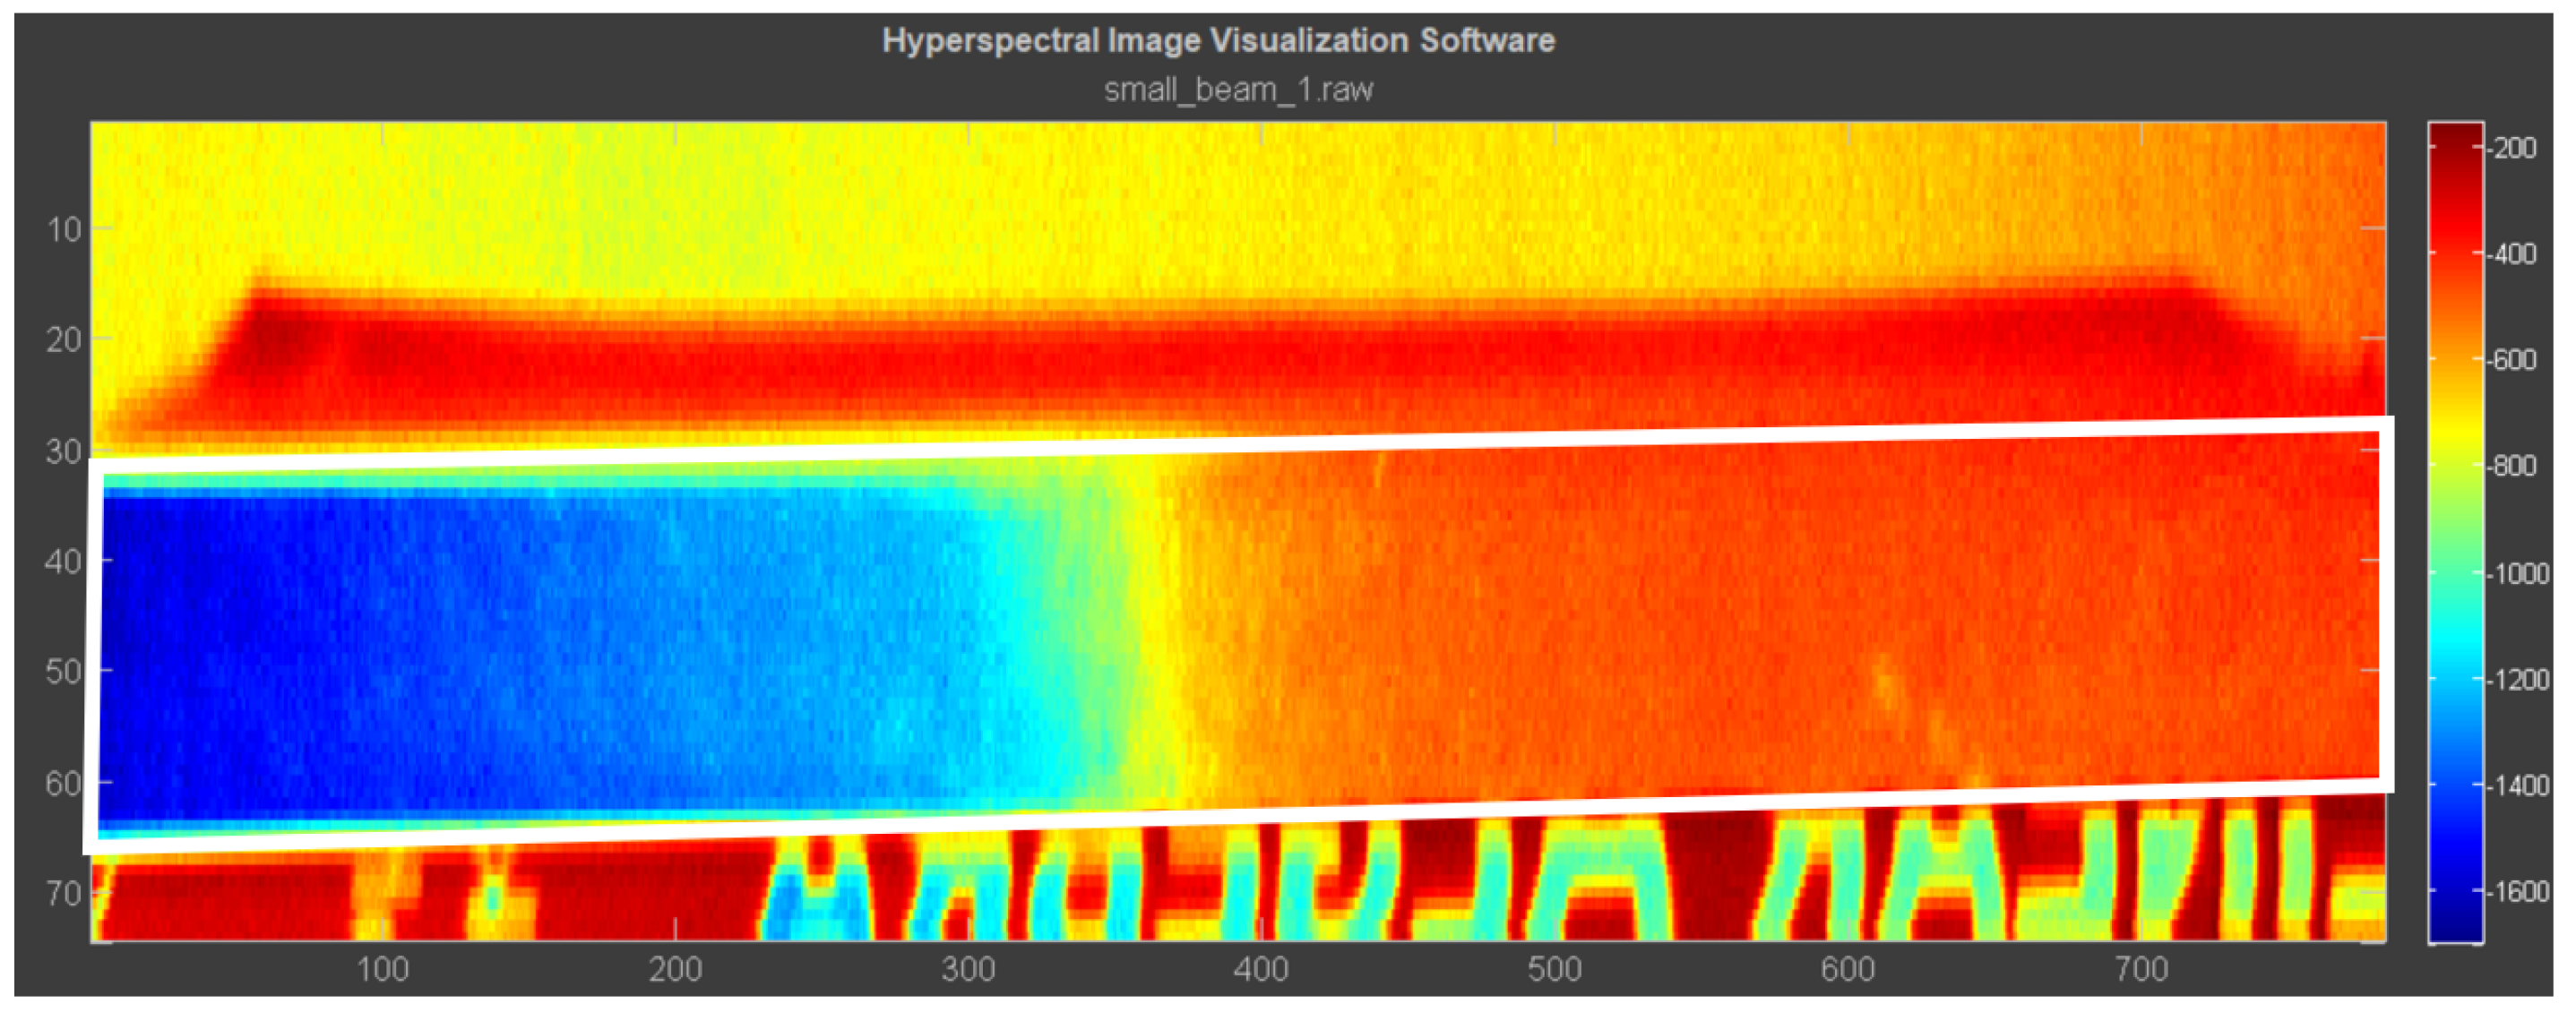
2.1. Hyperspectral Camera for Material Characterization

Hyperspectral imaging (HSI) was investigated due to its potential to identify materials based on their unique spectral signatures, offering a possible route to detecting early-stage corrosion or differentiating between coatings and corrosion products, phenomena often invisible or ambiguous to standard visual inspection [32,33].

2.1.1. Sensor Specifications

The experiments utilized an MSV 101L VNIR spectral camera (Middleton Spectral Vision, WI, USA), sensitive in the 400–1000 nm wavelength range through 580 spectral channels at 7 nm spectral resolution. This linescan (push-broom) camera captures up to 75 frames per second with 780 spatial pixels per line and operates via power over ethernet (PoE). Data acquisition and initial visualization were managed using the manufacturer’s proprietary software, which allowed us to control the camera through a live-feed of spectral signatures and image. A VNIR Standard C-Mount Lens (23 mm, f/1.4, 380–1000 nm, 12 mm image) was used with the camera as well.

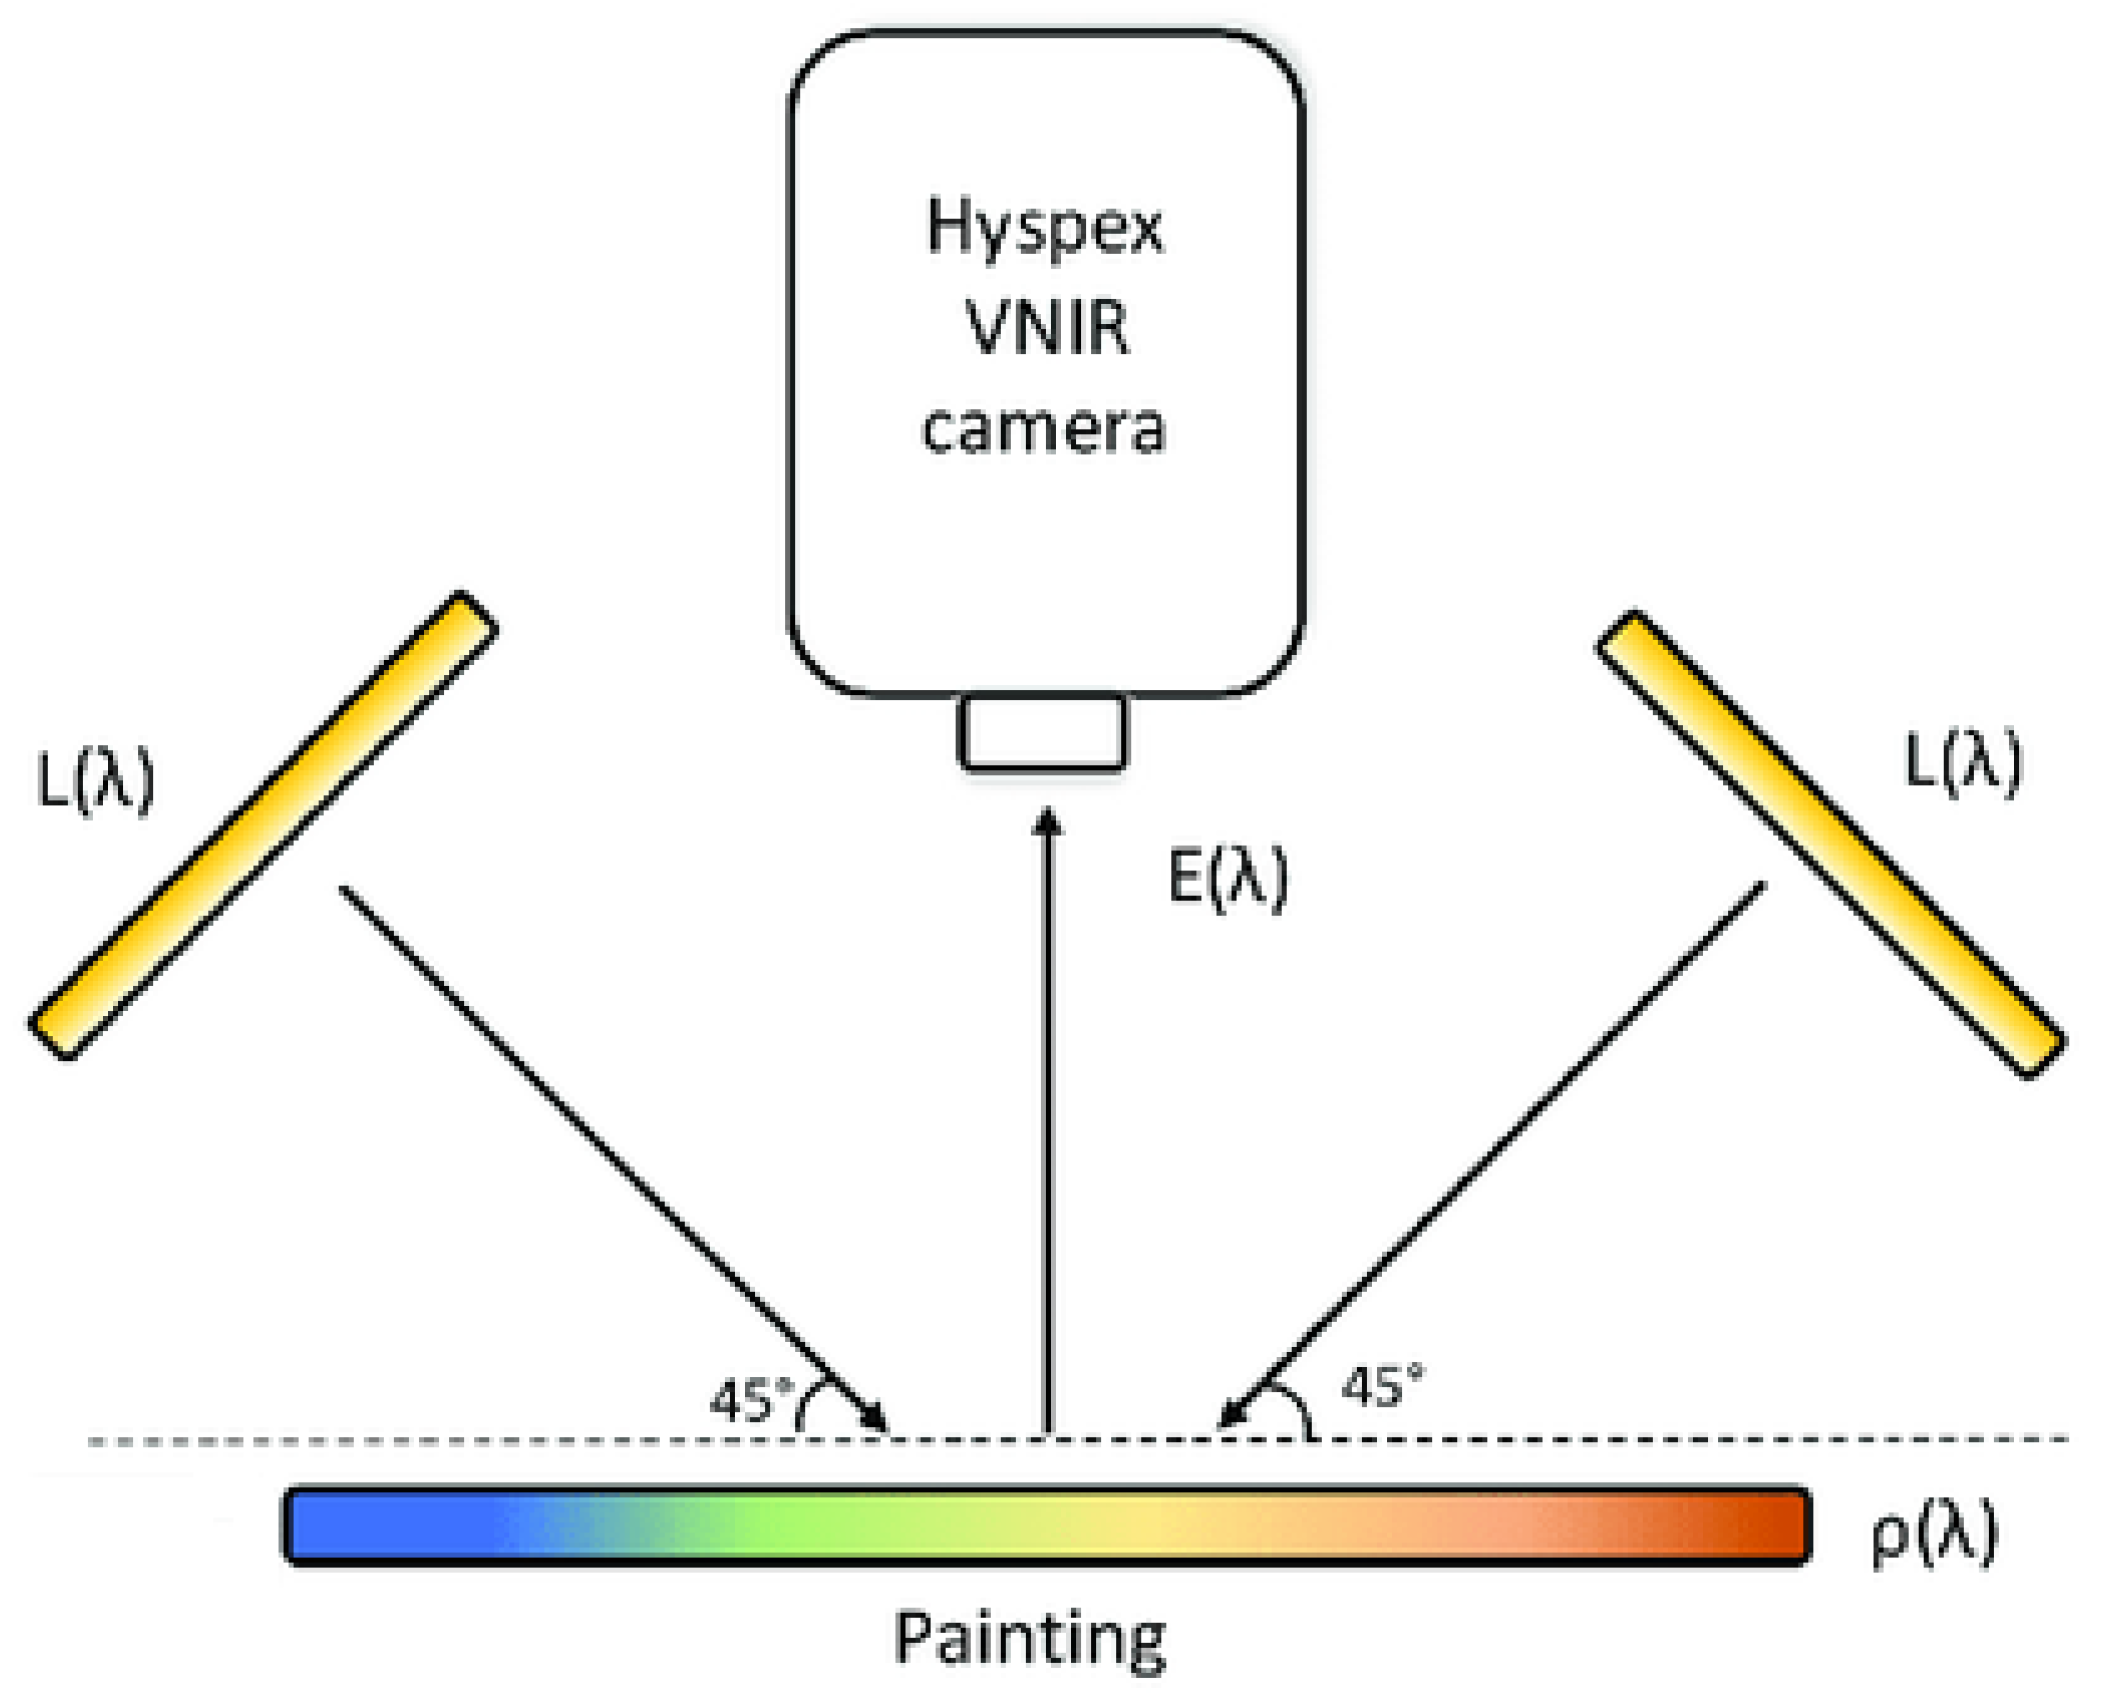
2.1.2. Experimental Setup

For controlled laboratory tests, as shown in Figure 1, the hyperspectral camera was mounted on a tripod allowing controlled vertical movement relative to the samples. Two halogen lamps provided illumination, positioned at approximately 45 degrees to the sample surface to minimize specular reflections and shadows. This setup simulated a basic scanning scenario to acquire spectral data from sample surfaces. A black/white reference grid image was used for correction in a post-processing stage to correct for any reflectance scaling issues; all of the readings were taken in a single instance with the same layout to avoid any differences that could arise from hardware setup.

2.1.3. Data Acquisition Approach

The push-broom scanning method inherent to the MSV 101L requires relative motion between the sensor and the target. In our lab setup, the camera was moved vertically while capturing data line by line. For potential field deployment on a mobile platform like a UAV, this motion would be provided by the platform’s movement. The acquired hyperspectral data cubes contain rich spectral information for each spatial pixel, forming the basis for subsequent analysis aimed at identifying material differences.
Data acquisition was conducted in a single session to control variables such as lighting and sample setup, thus minimizing inter-sample variability. Each session commenced with the collection of a black and white grid reference to correct for any illumination inconsistencies. This reference grid helped standardize the reflectance across samples by correcting for uniformity in the light source and camera sensitivity.
The proprietary software used provides robust control over the camera’s operation, ensuring consistent data acquisition practices. Although this software facilitates real-time adjustments and initial validation of data quality, it does not alter the raw spectral data, preserving its integrity. Notably, this setup allows for easy replication with open-source tools like Spectral Python 0.21 (SPy), which supports similar data processing features. Within SPy, functions for spectral correction and analysis mirror those in the proprietary system, ensuring that results remain consistent across software platforms.
For future studies, incorporating more refined control and calibration techniques, such as automated lighting adjustment and enhanced sample standoff measurement, could improve data precision and reliability. The use of specific software for data correction and analysis would further support the reproducibility of findings and strengthen conclusions drawn from spectral data analysis.

2.1.4. Rationale for Investigation

The primary motivation for exploring HSI is its potential ability to detect subtle chemical changes associated with nascent corrosion before significant visual degradation occurs. Furthermore, its capacity to differentiate materials based on spectral properties could potentially overcome ambiguities between coatings, rust, and contaminants and might offer a non-contact method for assessing coating integrity or thickness variations. Investigating these capabilities, even preliminarily, helps assess HSI’s suitability for future more complex inspection systems.

2.2. Samples for Testing

To evaluate the hyperspectral sensor’s ability to distinguish different surface conditions relevant to corrosion, various metal samples were prepared and acquired:
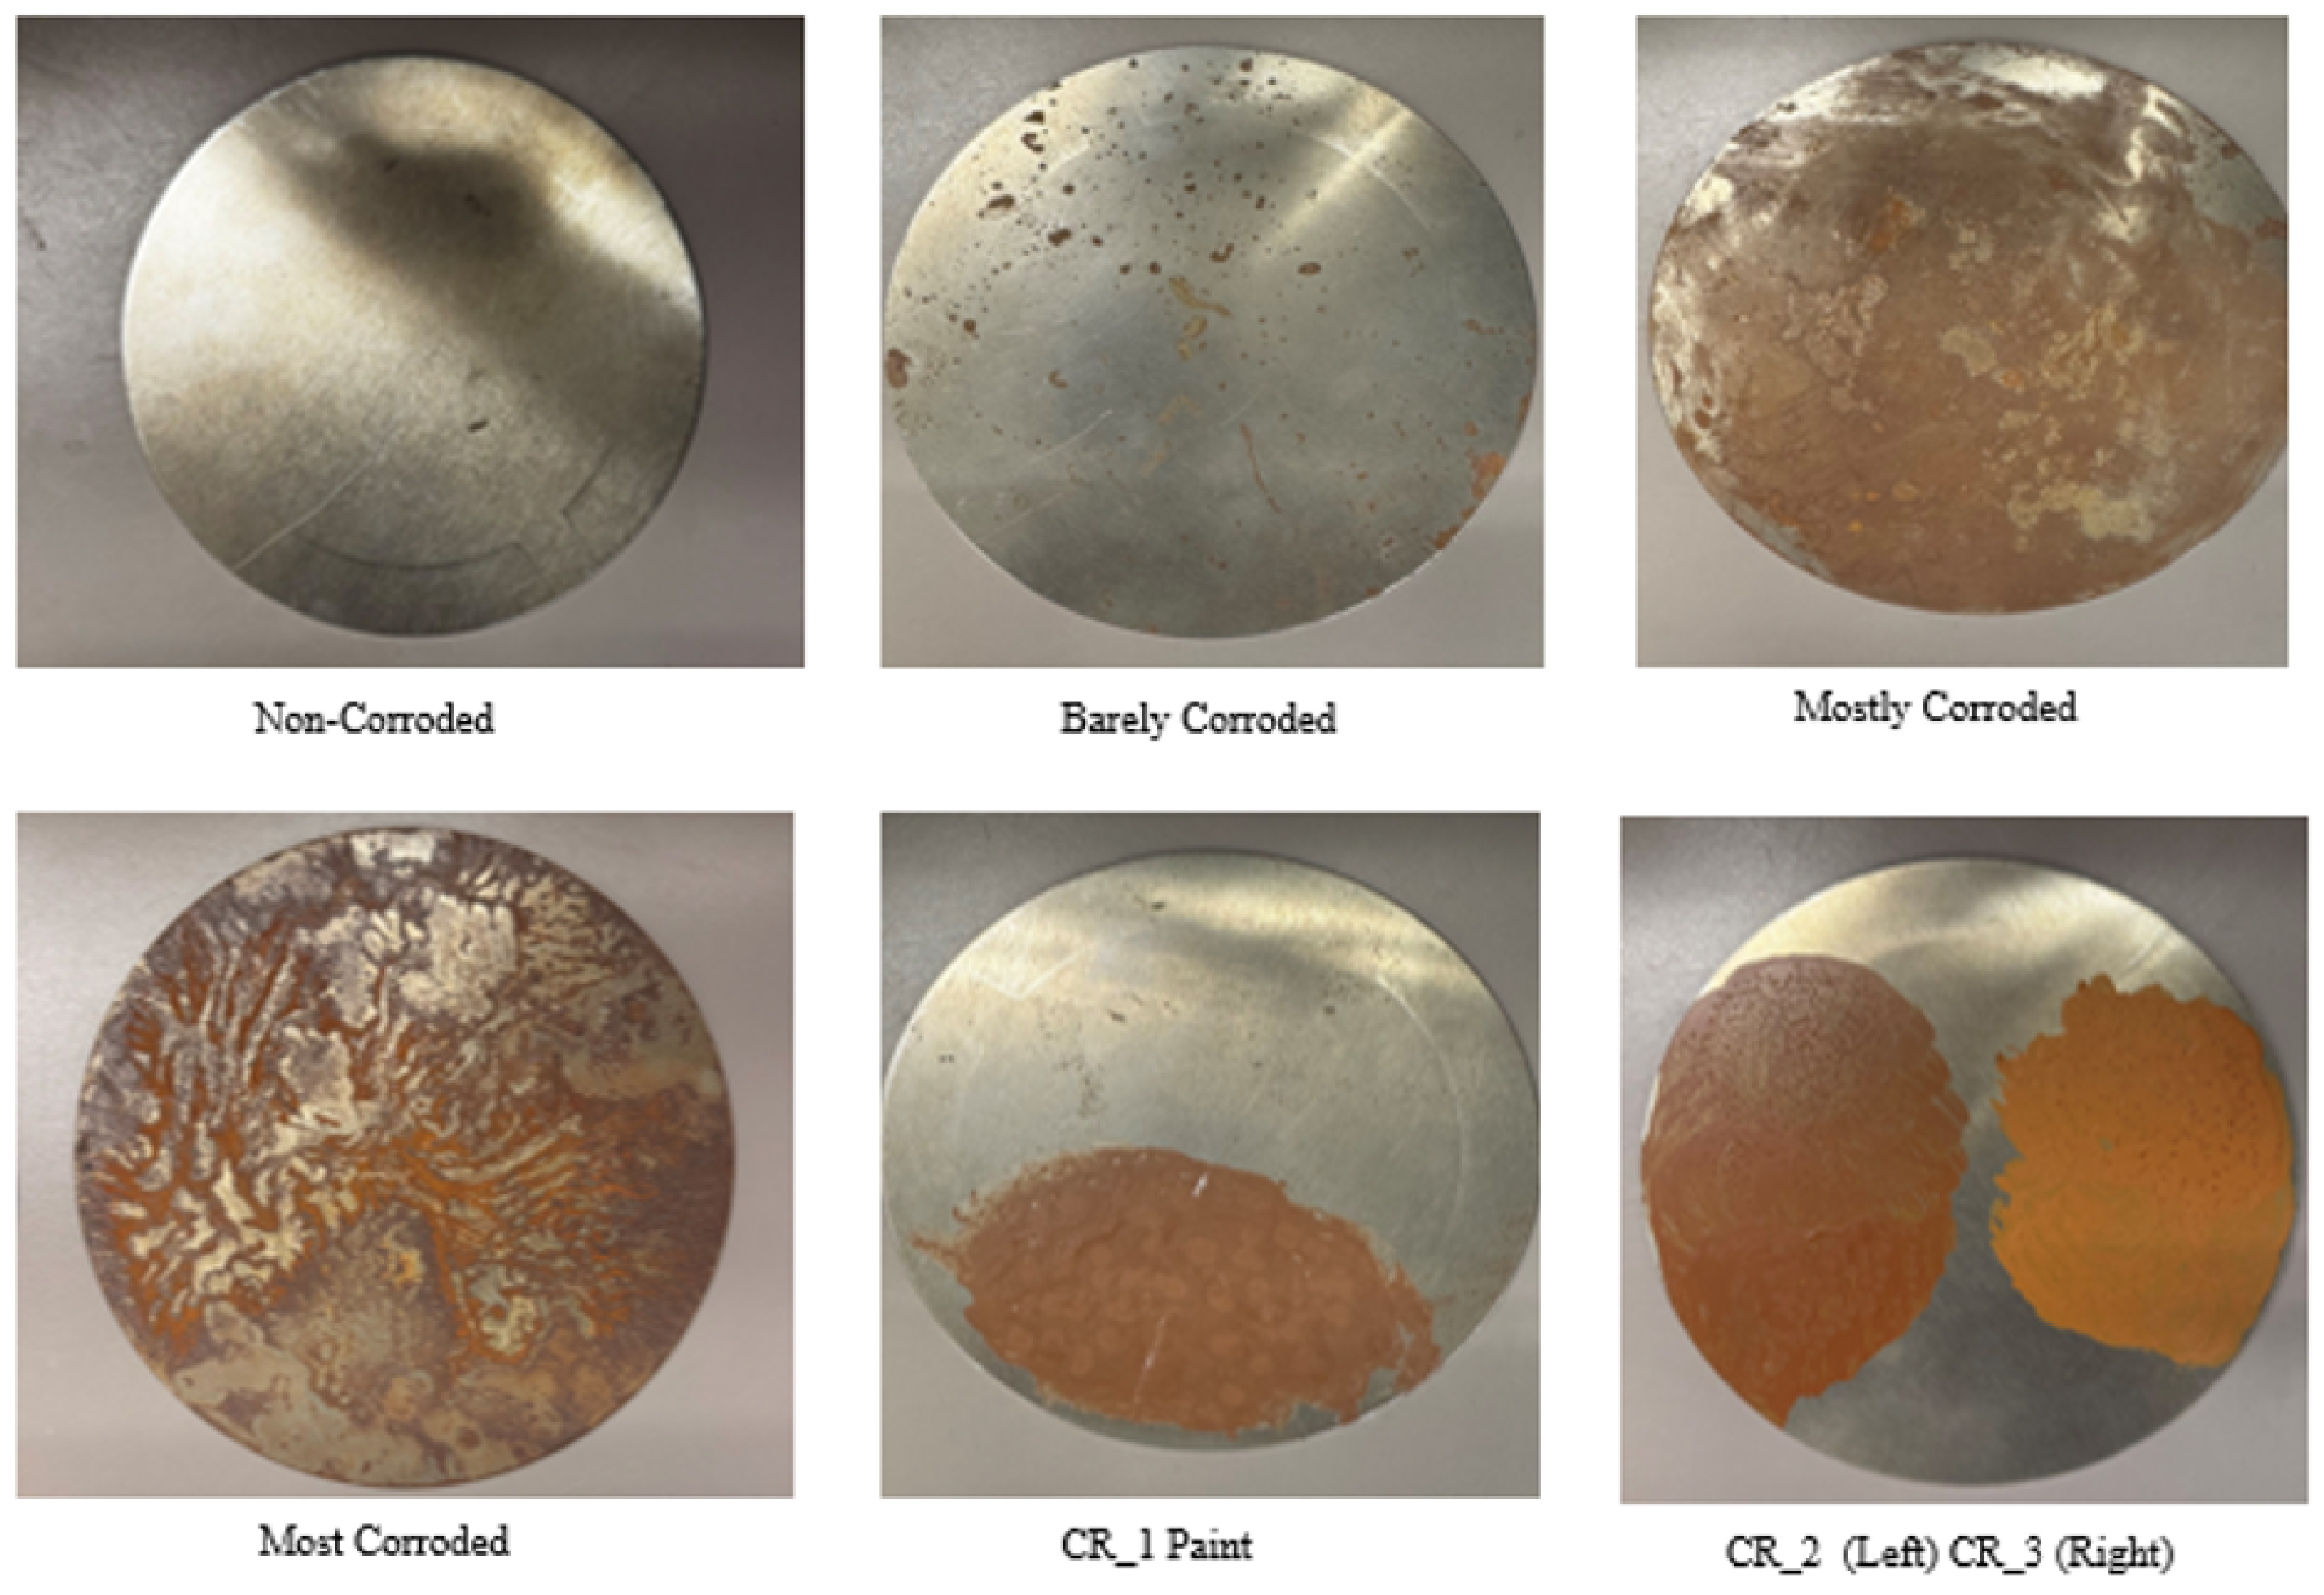
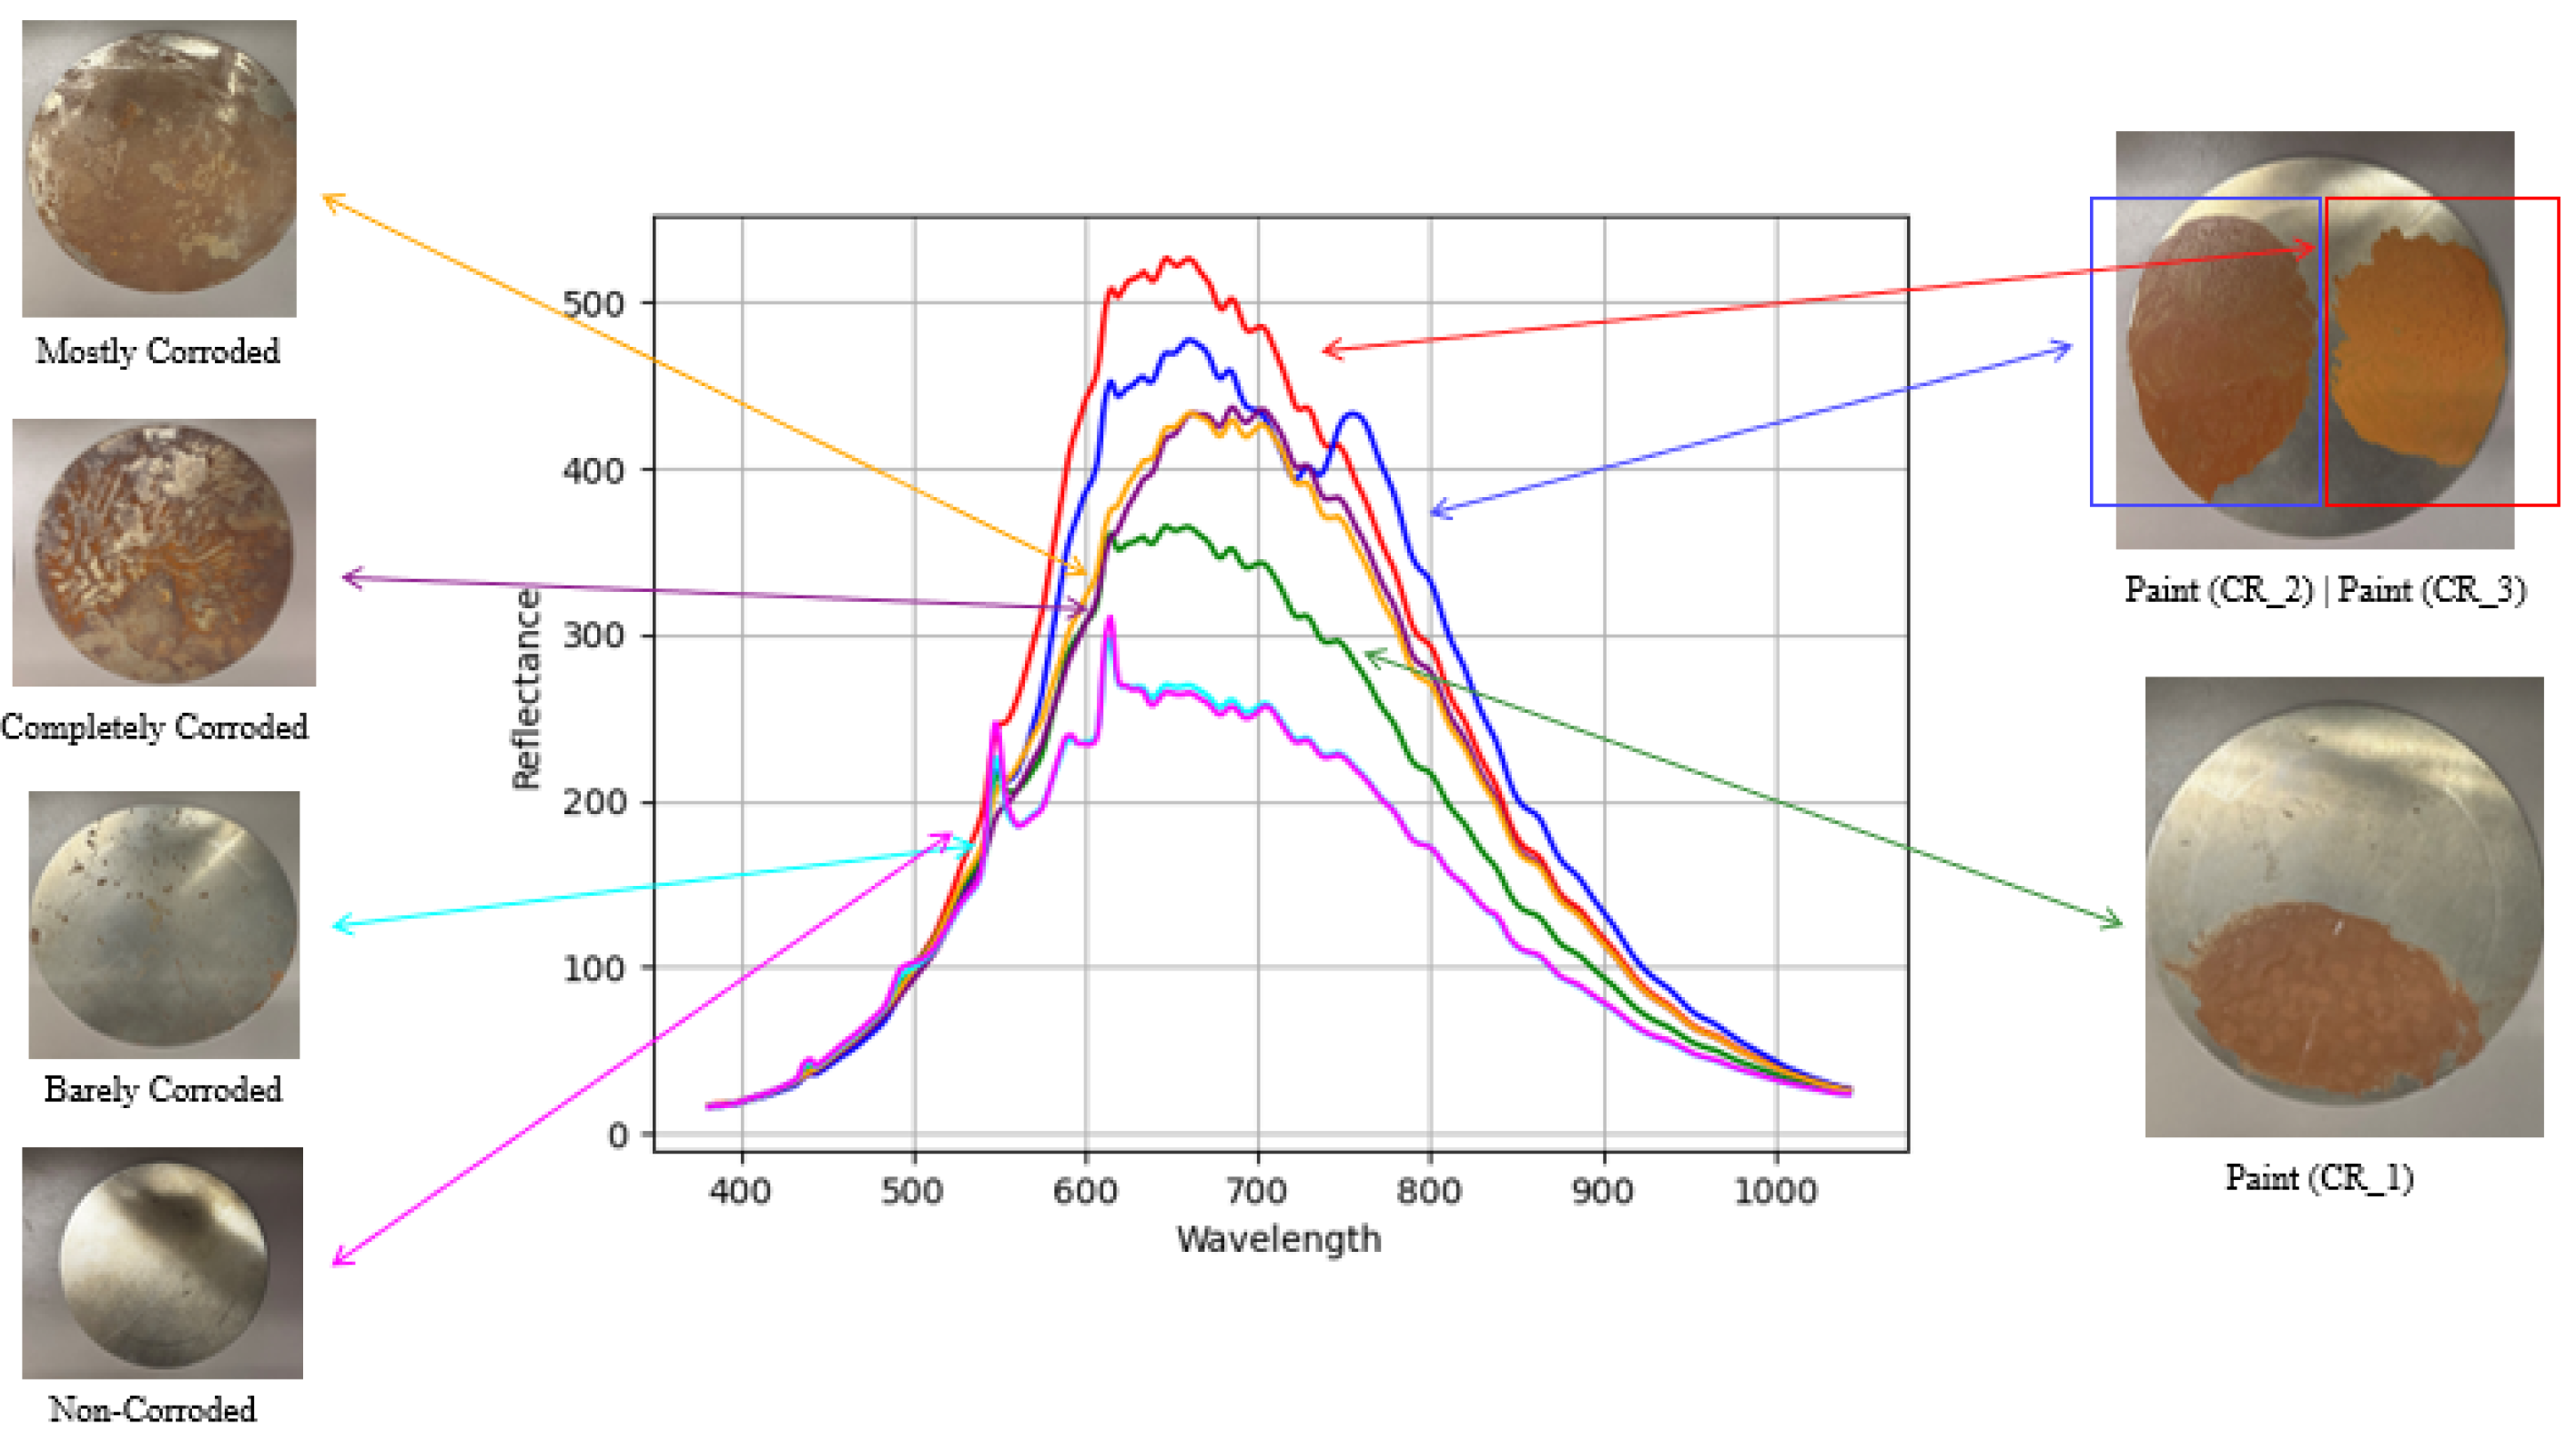
  • Circular steel sheets were artificially corroded using saltwater exposure for varying durations to create samples with visually distinct levels of surface rust (see Figure 2).
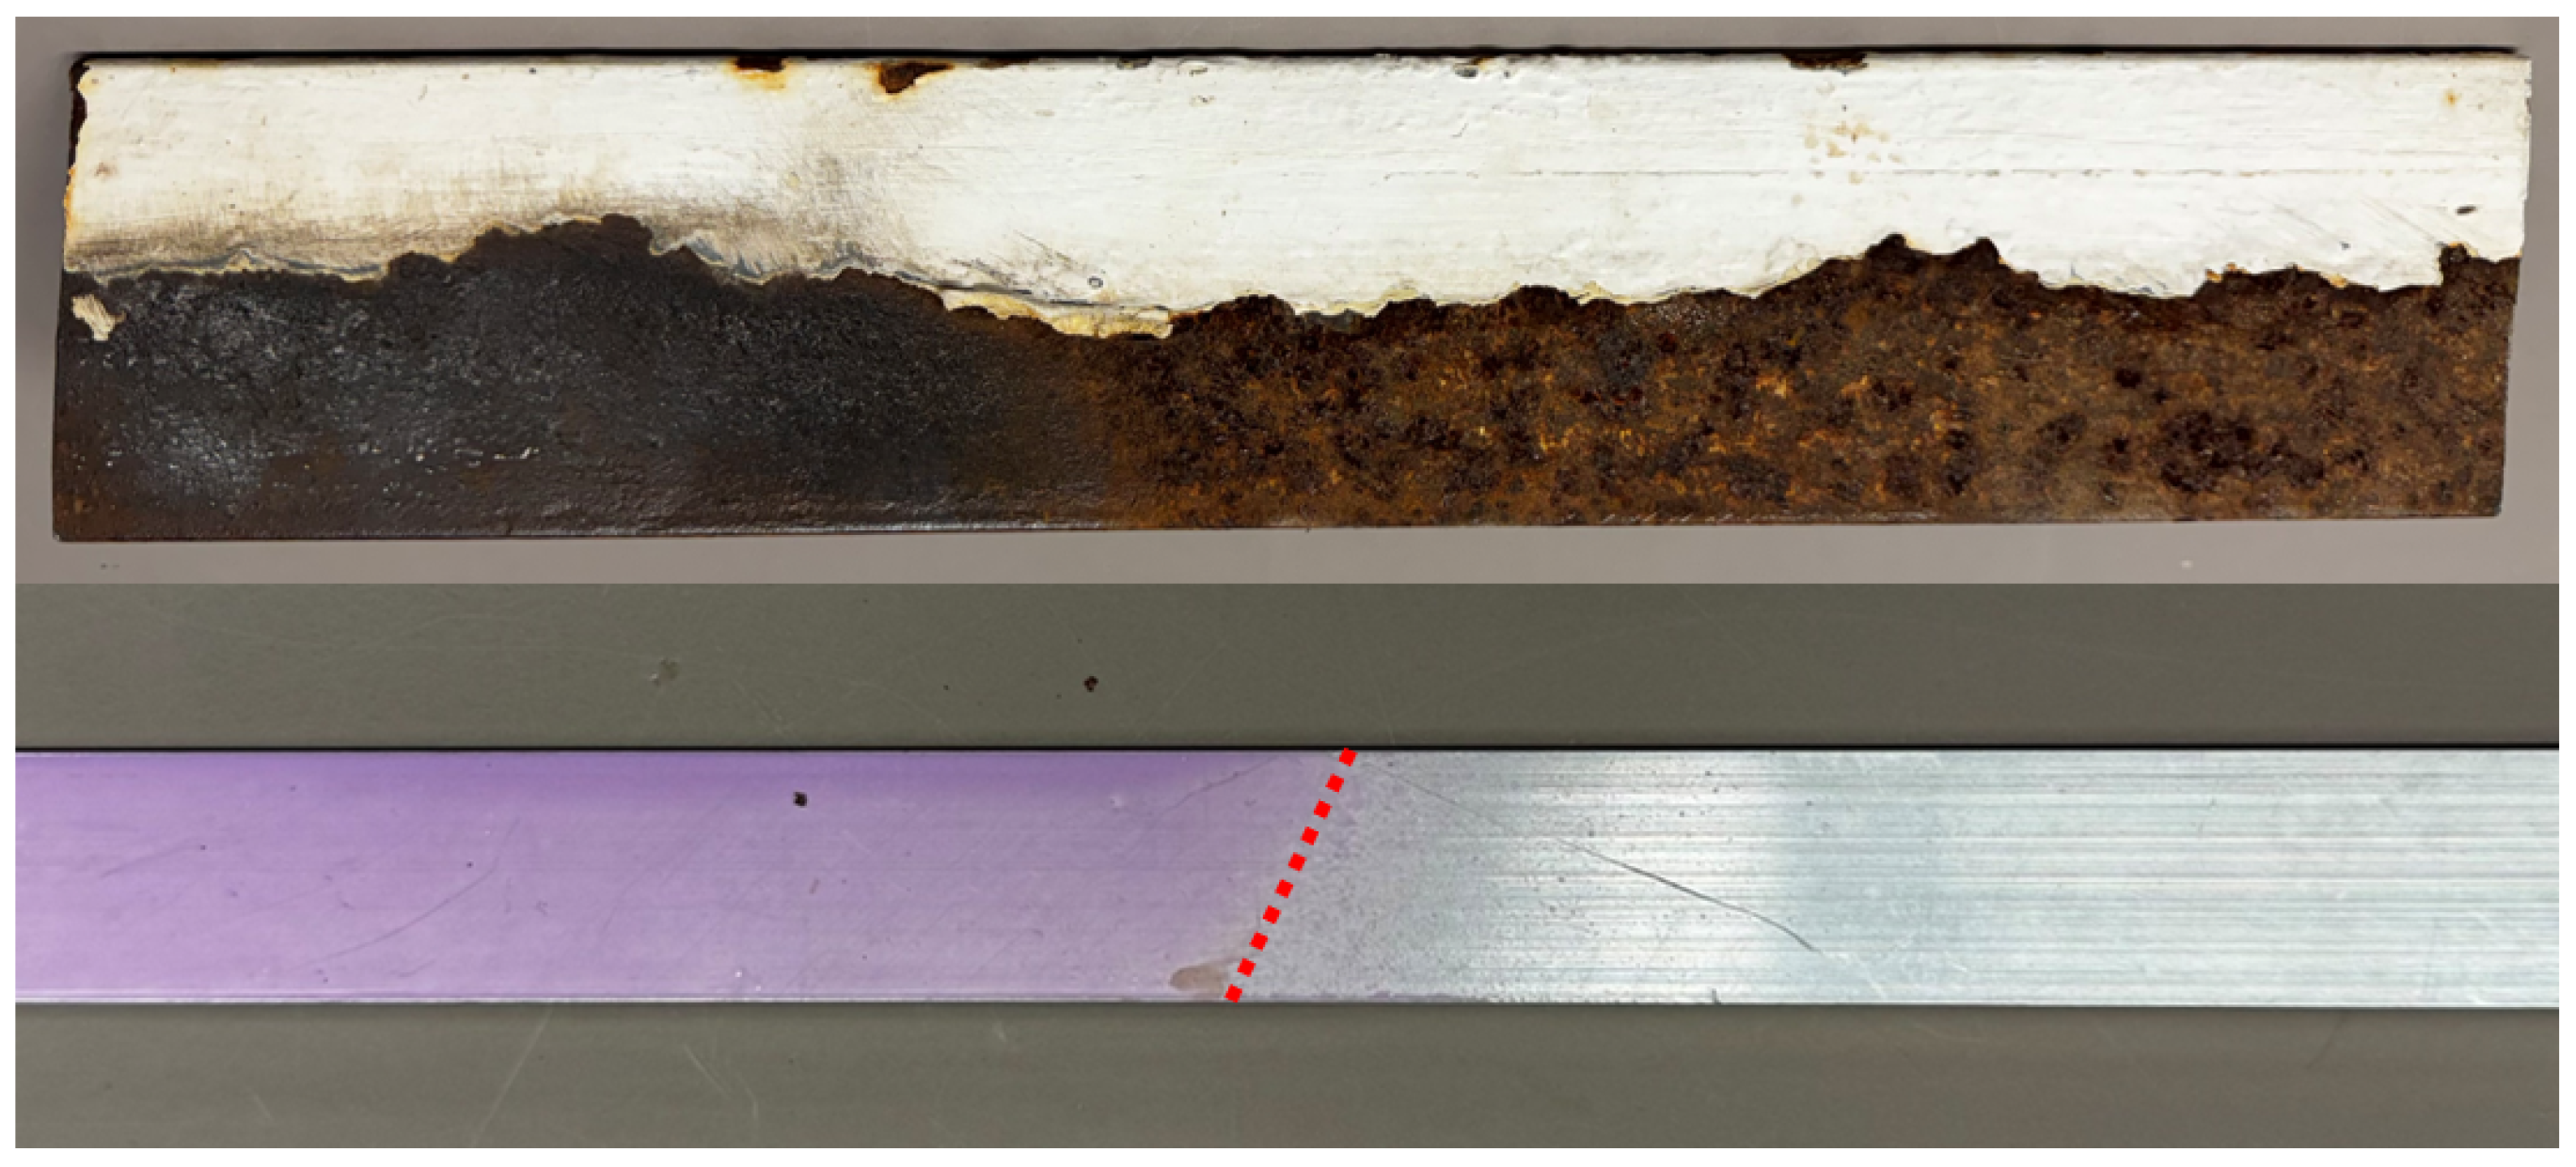
  • Steel beams exhibiting naturally occurring corrosion, varying levels of residual coating, and areas of bare metal were sourced from scrapyards. These provided non-homogeneous surfaces characteristic of real-world scenarios (see Figure 3).
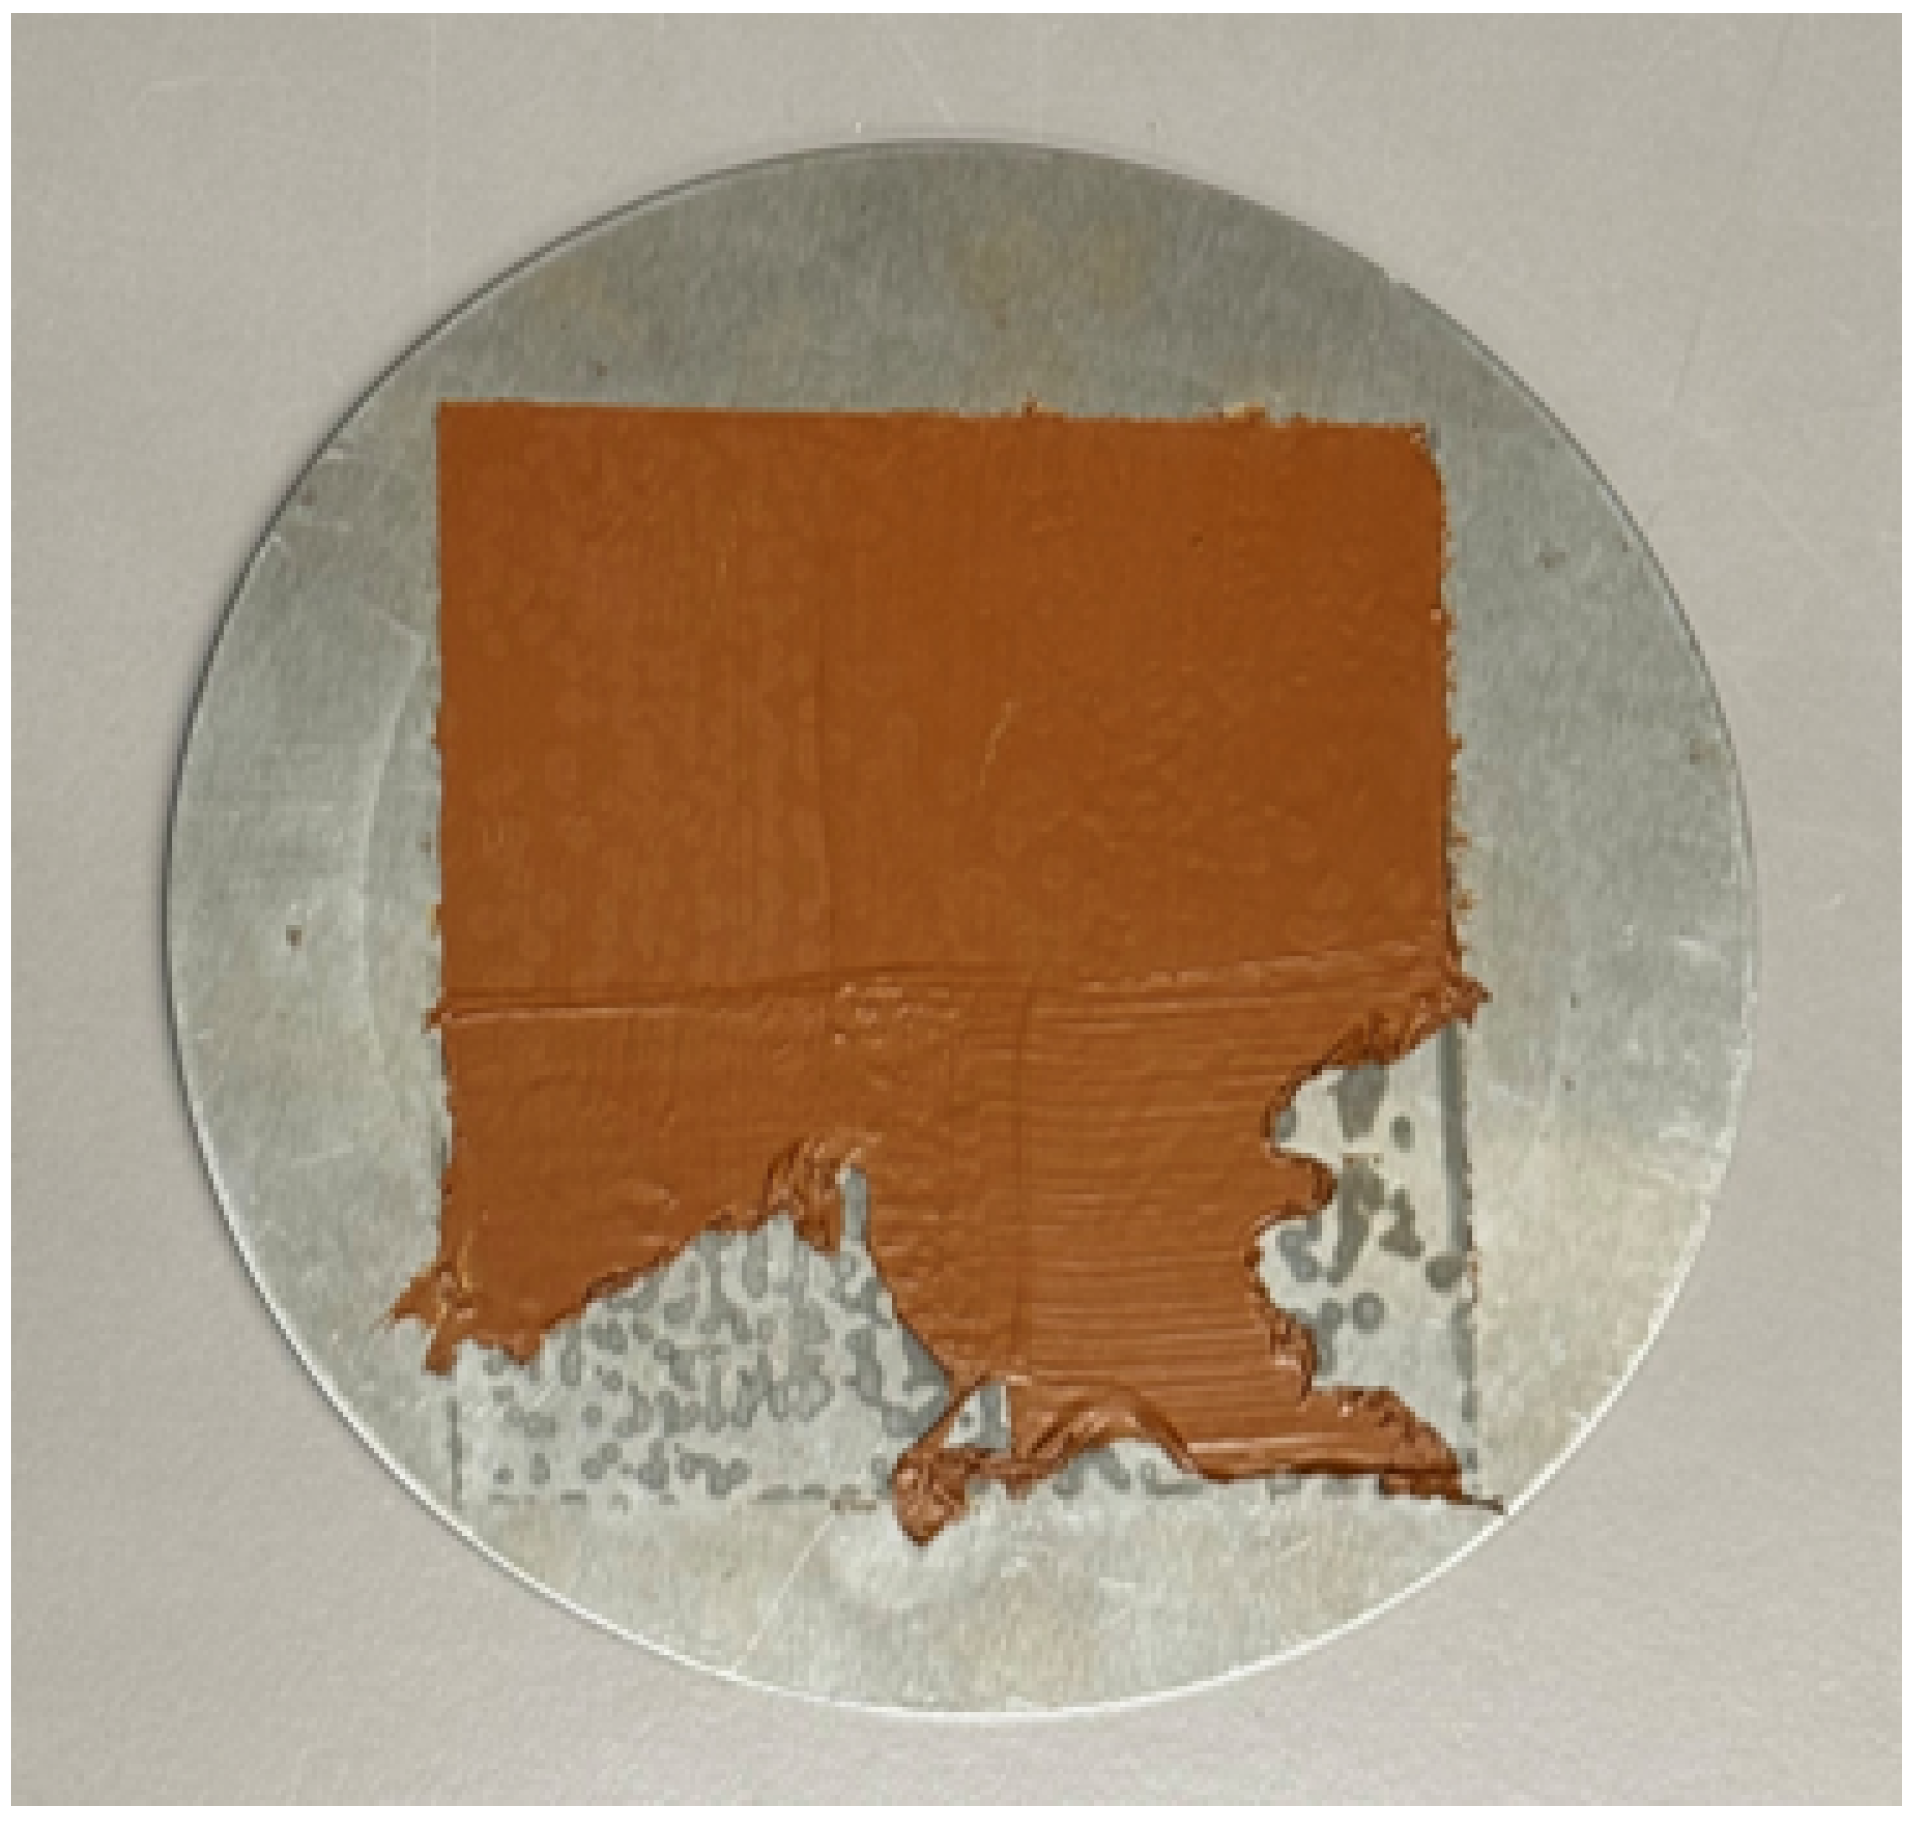
  • A steel plate was prepared with varying numbers of paint layers applied using commercially available spray paint to test the ability to differentiate coating thicknesses (see Figure 4). Coating layers were controlled and recorded; for this purpose, paint was chosen due to its similarity in thickness with commercial maritime coatings and color-matched to the existing steel plate corrosion samples. Coating layers were measured to be the same thickness.
  • An aluminum piece was also coated with varying paint thicknesses for comparative analysis (see Figure 3).
The selection aimed to include variations in corrosion type and severity, coating presence and thickness, and substrate material to challenge the sensor’s differentiation capabilities.

2.3. Methodology for Preliminary Coating Assessment Experiments

One specific objective of the preliminary tests was to assess the hyperspectral sensor’s capability to differentiate varying coating thicknesses, a factor relevant to protective layer integrity. Using the laboratory setup described in Section 2.1, samples with varying paint layers (as detailed in Section 2.2) were scanned. The VNIR sensor (400–1000 nm) was positioned approximately 20 cm from the sample surface under consistent halogen illumination. Scans were repeated to ensure consistency. The resulting hyperspectral data cubes were processed using Middleton’s Spectral software to extract and compare reflectance spectra from regions with different known numbers of coating layers. The analysis focused on identifying statistically significant differences in spectral reflectance, particularly within wavelength ranges previously suggested as relevant for coating analysis, while acknowledging that optimal wavelengths for thickness determination may lie outside our camera’s range (e.g., shortwave infrared (SWIR) range around 1000–1400 nm [31]).
This experiment aimed to provide initial evidence regarding the feasibility of using VNIR HSI for relative coating assessment. Although we lacked the resources to run an experiment that could draw statistically significant results, we present a proof of concept to prove that a VNIR hyperspectral sensor could be used to infer coating thickness differences and therefor coating integrity in a future application.

2.4. LiDAR Sensor for Spatial Mapping

LiDAR technology was considered for its established ability to rapidly generate precise dense 3D point clouds of environments. In the context of ballast tank inspection, LiDAR data holds significant potential for the following:
  • Geometric Mapping: Creating accurate 3D models of the complex internal tank structure, essential for understanding the environment and documenting its condition.
  • Navigation Aid: Providing spatial awareness for a mobile platform (like a UAV), potentially enabling autonomous or semi-autonomous navigation in the confined GPS-denied environment [34].
  • Data Integration Framework: Serving as a common 3D reference frame onto which data from other sensors (like HSI or RGB cameras) can be accurately georeferenced and fused, creating comprehensive multi-modal maps [35].
  • Anomaly Detection: While not primary for fine corrosion detection, the high-resolution geometric data might reveal large-scale deformations, buckling, or significant build-up indicative of structural issues or severe corrosion requiring further investigation [28].

Sensor Considerations

For this exploratory work, we leveraged experience with existing UAV-integrated LiDAR systems (such as the sensor on the Flyability Elios 3) [36]. While specific LiDAR units were not independently benchmarked within this study, the focus was on the type of data produced and its potential utility. Requirements for a suitable sensor in a future system would include adequate resolution, accuracy, range for typical tank dimensions, and robustness, potentially favoring solid-state or compact scanners developed for autonomous applications. The generated point cloud data used for visualization and preliminary analysis in this work were pre-processed using the open-source software CloudCompare which allowed for visualization, scaling, segmenting, decimating, and other basic manipulations [37].

3. Results

The following sections present the preliminary findings from laboratory experiments and data analysis designed to explore the potential of hyperspectral imaging (HSI) and LiDAR for corrosion-related assessments. These results illustrate the basic capabilities of the sensors under controlled conditions and with representative data.

3.1. Hyperspectral Differentiation of Surface Conditions

Experiments were conducted using the VNIR hyperspectral camera (400–1000 nm) to assess its ability to distinguish between various surface conditions relevant to tank interiors, including coated metal, uncoated metal, corroded areas, and variations in coating thickness.
Analysis of a steel beam sample exhibiting corrosion and coated areas is shown in Figure 5. The hyperspectral data, visualized here as a heatmap within the 690–840 nm range, suggests distinct spectral differences between the surface types. The coated areas exhibited higher reflectance compared to the corroded regions within this spectral window. Reflectance value intensities from different locations were compared using heatmaps to determine how light reflected from several surface types, this difference is what will in the future allow us to discern between different samples. Consequently this test not only gave information on the test samples but also on how useful certain wavelength ranges are.
Similar differentiation capabilities were observed on an aluminum sample partially coated with paint (Figure 6). The hyperspectral data clearly distinguished the painted areas from the bare aluminum substrate based on their reflectance values (where red meant higher reflectance and blue meant lower reflectance values) and shapes in the VNIR range and exhibited a gradient change in reflectance where the coating quantity (layers) changed progressively. This suggests HSI’s potential for objectively differentiating key surface types found in tanks.
Additionally a sample was prepared, where paint was developed in accordance to specific corrosion color data gathered through commercially available color scanners. As seen in Figure 7, the average spectral plots and values of the different paint and corrosion colors differed, showing once again that even when the RGB values are similar (which could confuse visual inspectors), HSI is able to distinguish between coated and corroded materials. For this graph, spectral signatures are recorded for smaller sections of corrosion or paint, instead of single pixels, in order to avoid any outliers and noise.
To specifically investigate the potential for assessing the coating thickness, a steel plate was prepared with sections having one, two, and three layers of commercially available paint. Hyperspectral scans were performed, and the data were analyzed. Figure 8 displays a reflectance heatmap focused on the 690–840 nm range. Visual inspection of the heatmap and analysis of the underlying spectral data indicated discernible differences in reflectance intensity corresponding to the areas with one, two, and three layers of paint. Average reflectance values across wavelength ranges were used to create the heatmap for smoother visualization; all the wavelengths in said range are capable of distinguishing the coating layers by themselves to some extent. While these results are preliminary and obtained with a VNIR sensor (not necessarily the optimal range for quantitative thickness measurement, which often favors SWIR wavelengths [31]), they demonstrate the potential feasibility of using hyperspectral data to detect relative variations in coating thickness non-intrusively. In a practical application, such capability could potentially allow comparison of scanned areas against a reference reflectance signature from the known intact coating to identify areas of thinning or degradation.
Overall, these initial HSI results, while conducted under laboratory conditions, support the potential of the technology to differentiate between corroded, coated, and bare metal surfaces and even detect relative differences in coating layers. This capability could be valuable for objective surface characterization in future inspection systems.

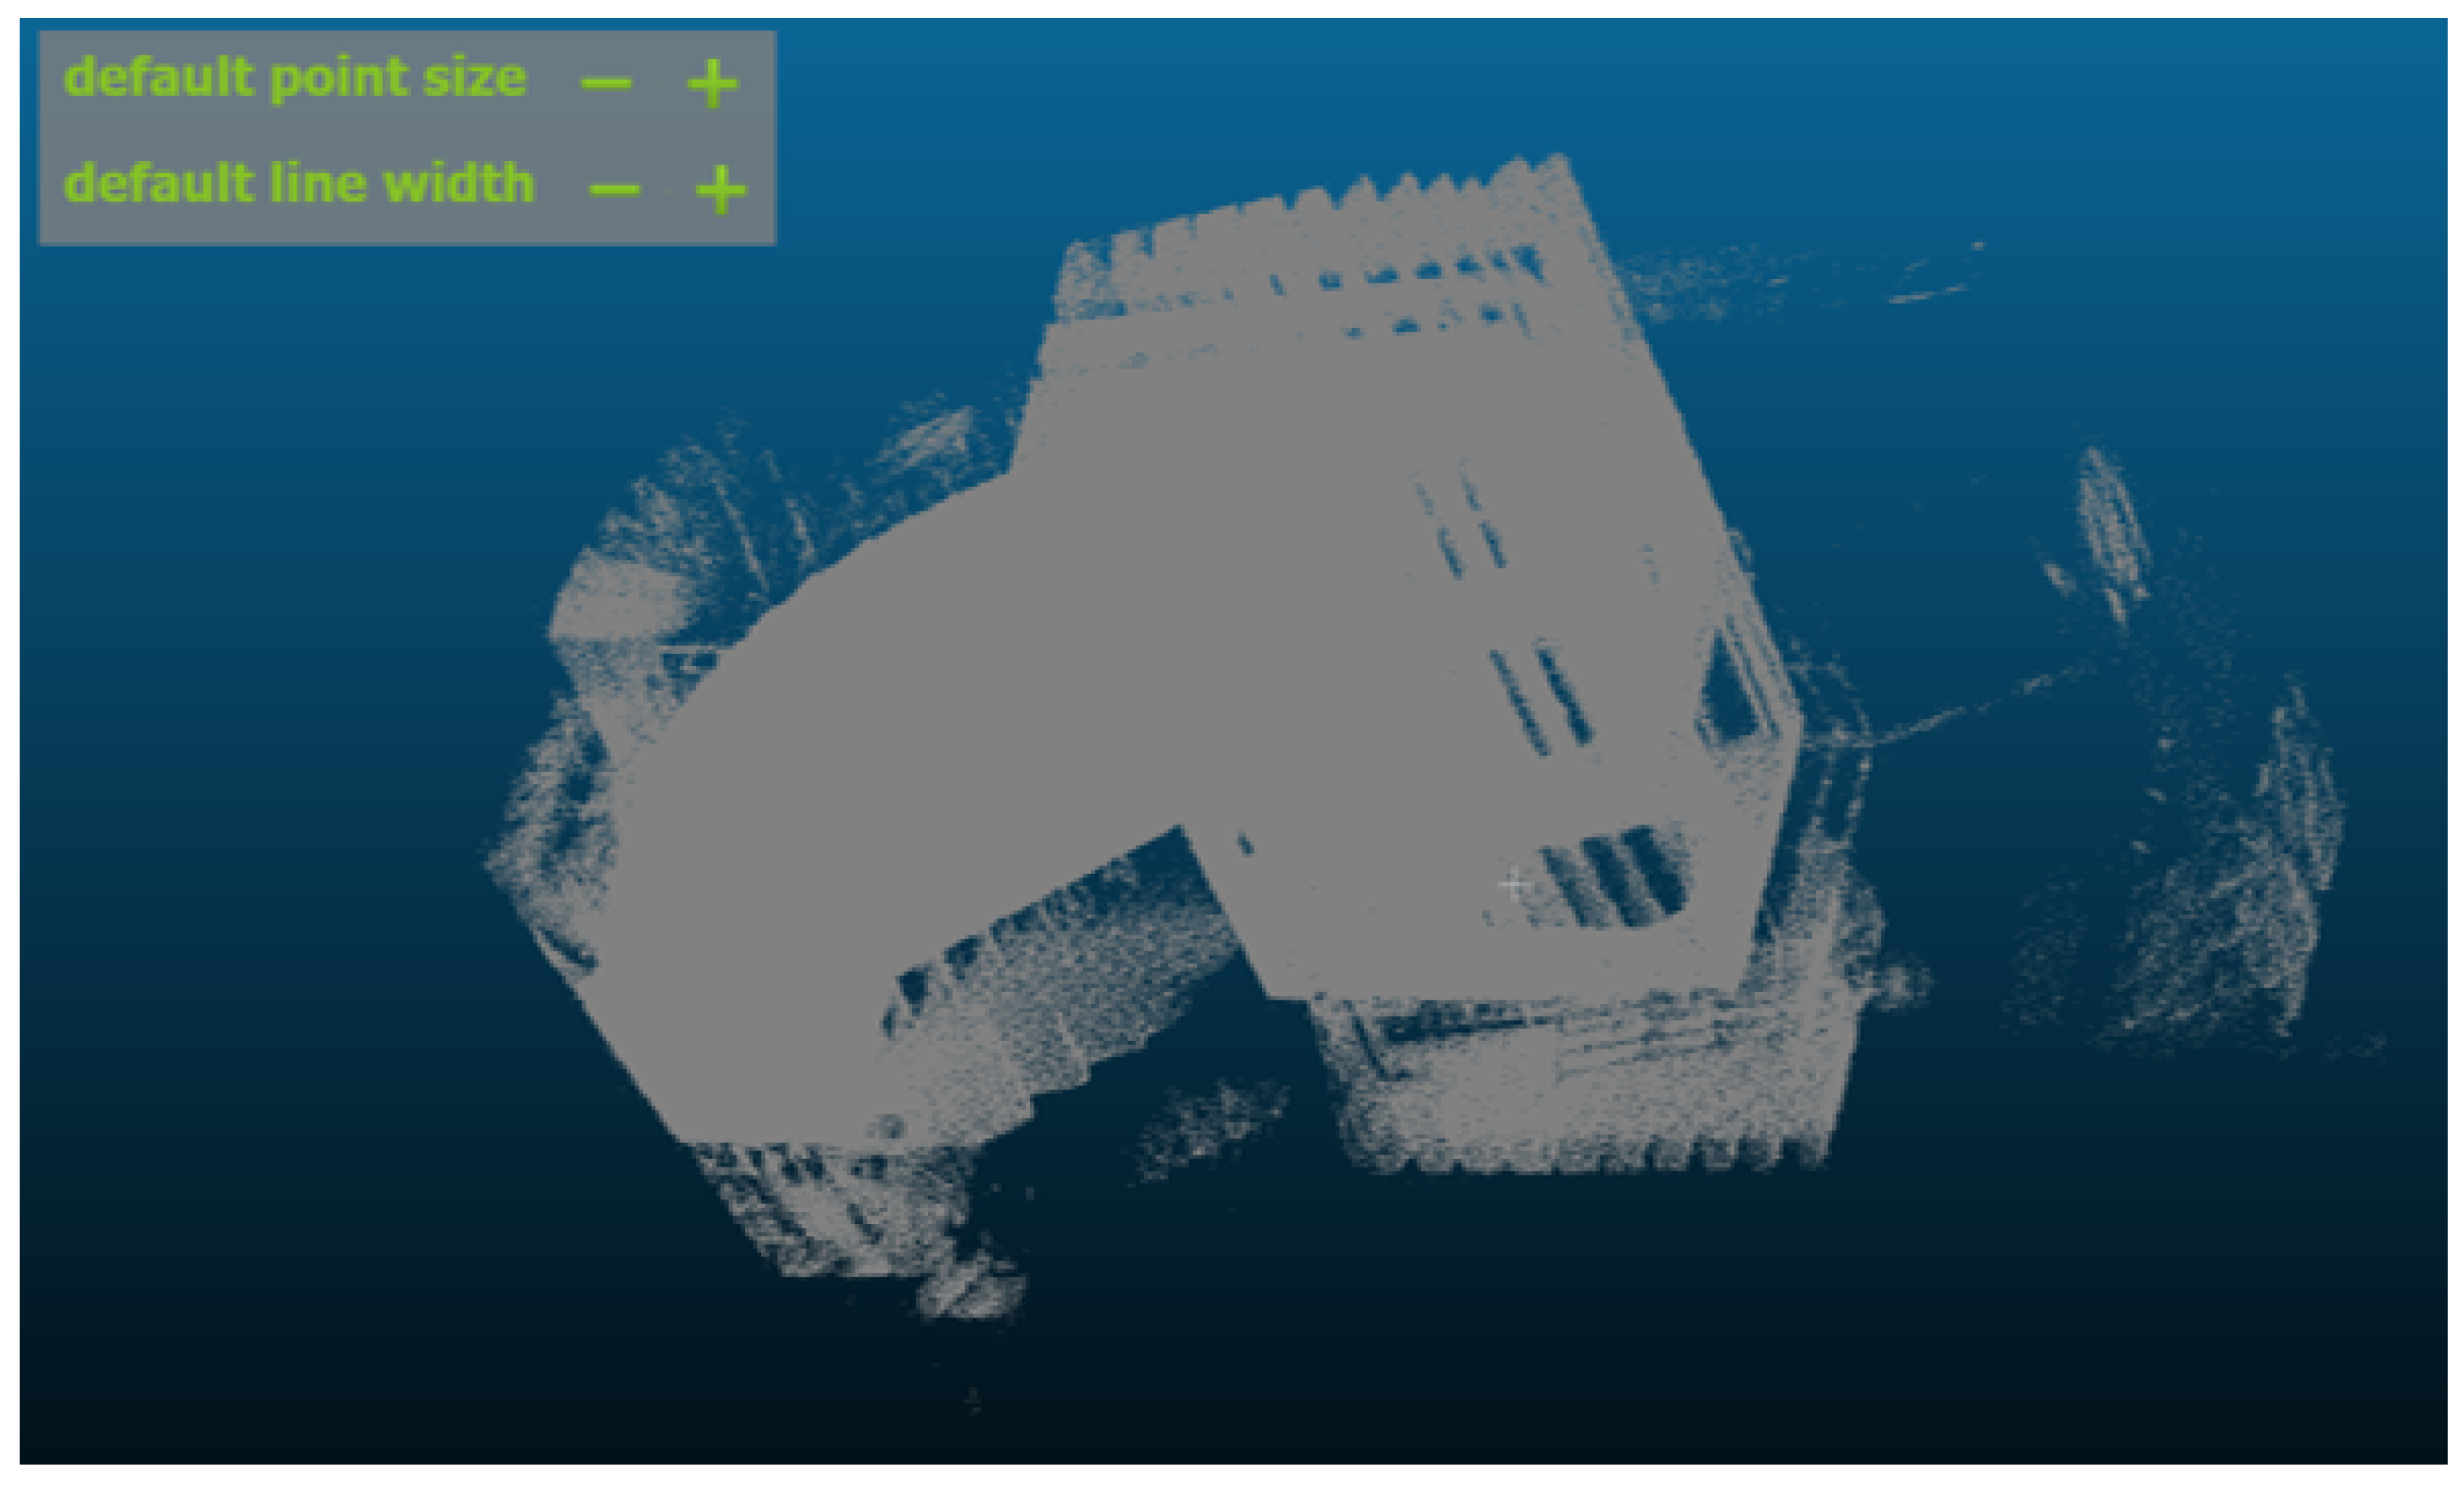
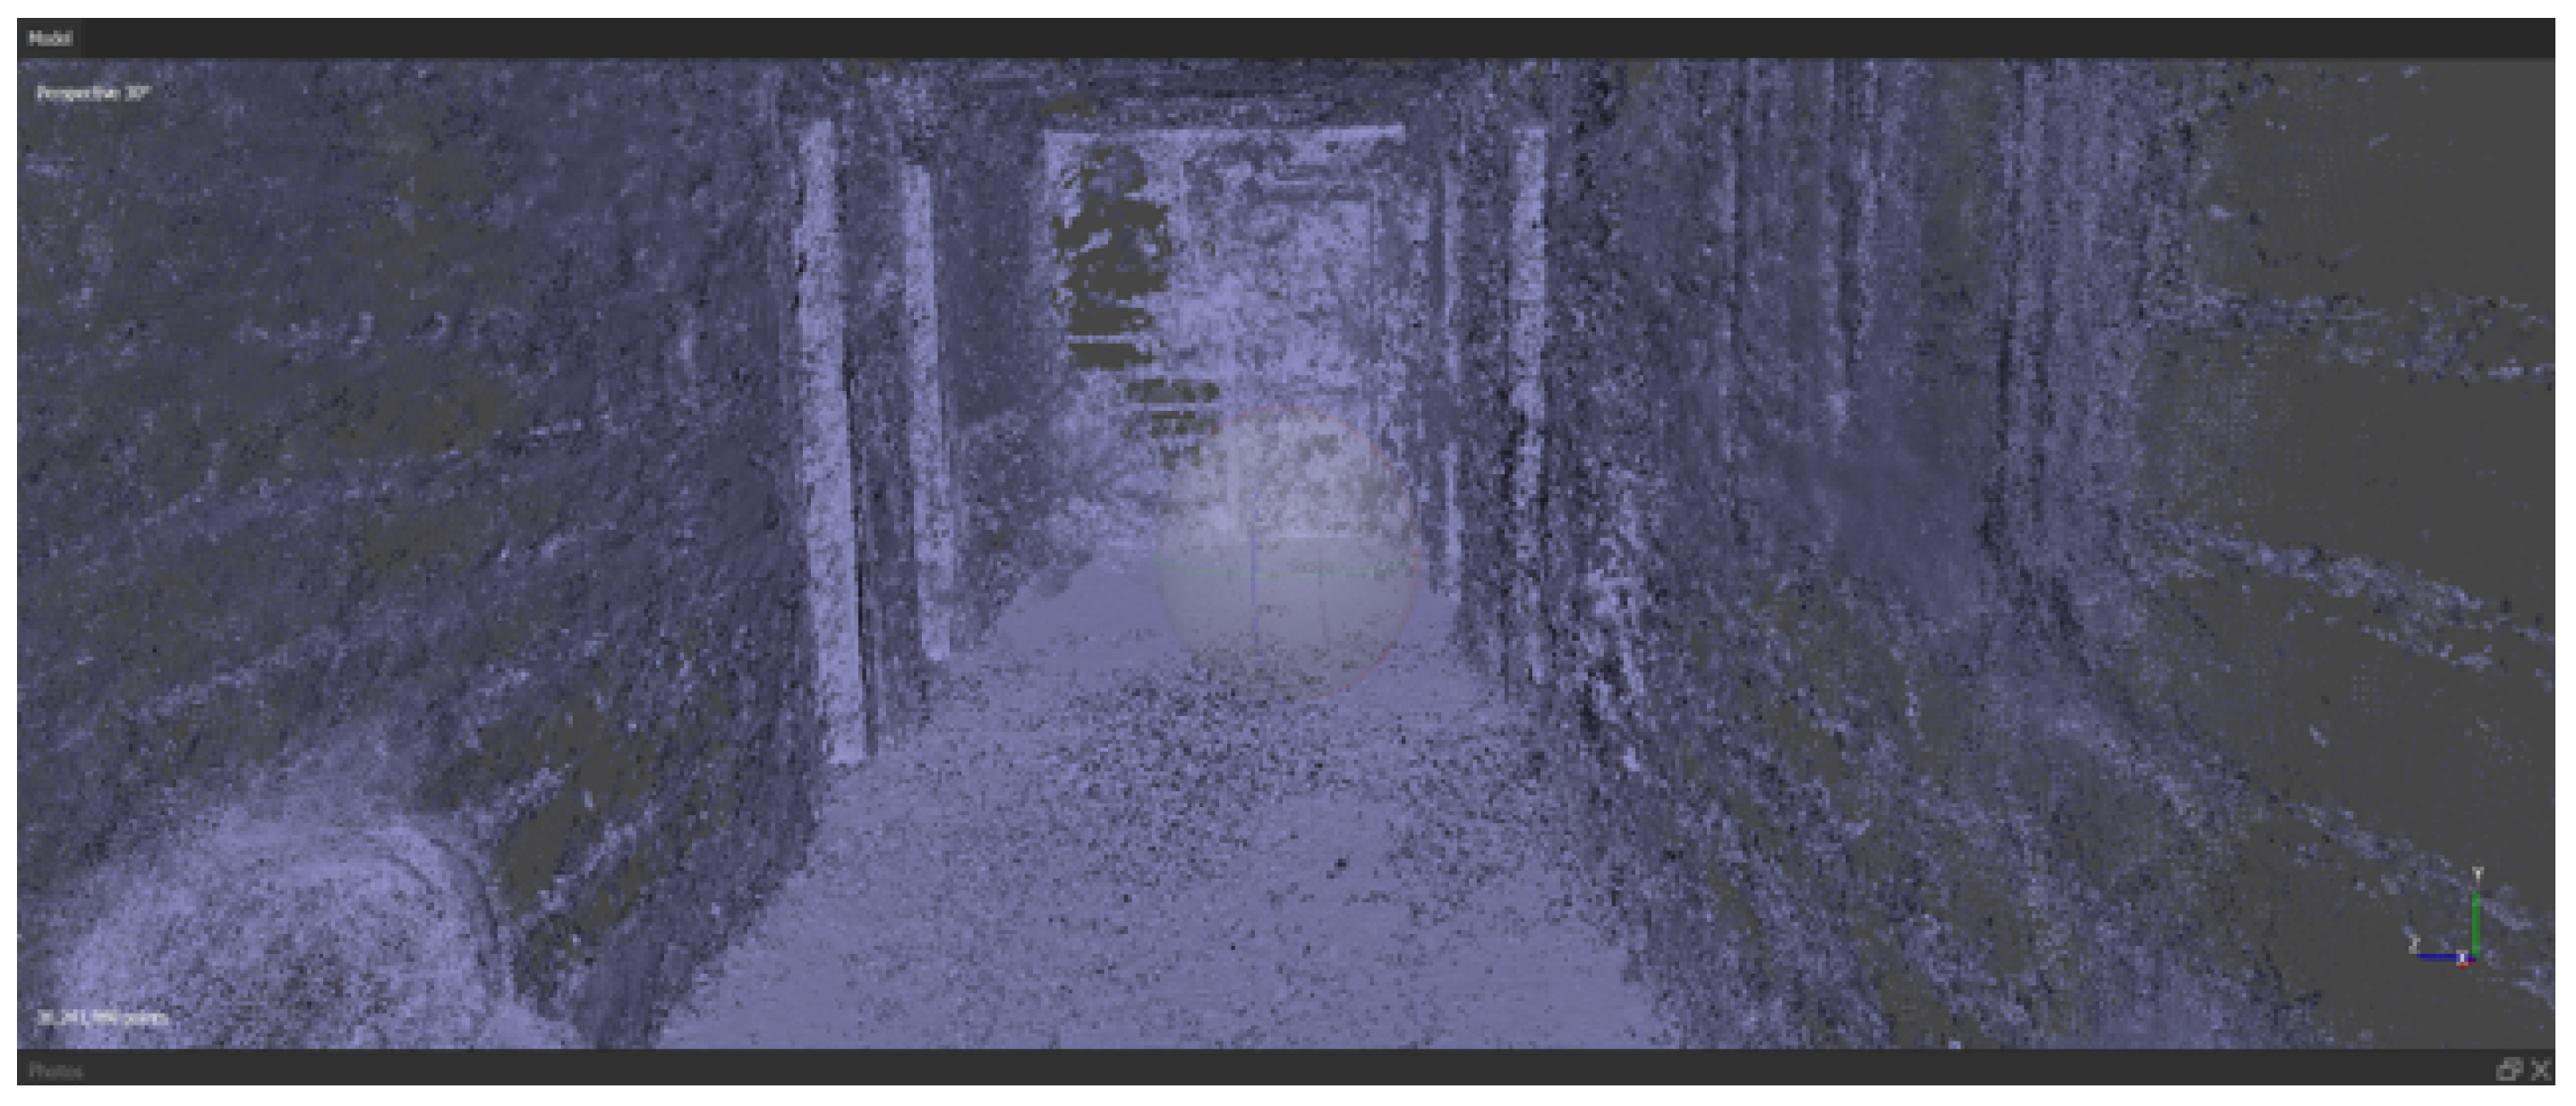
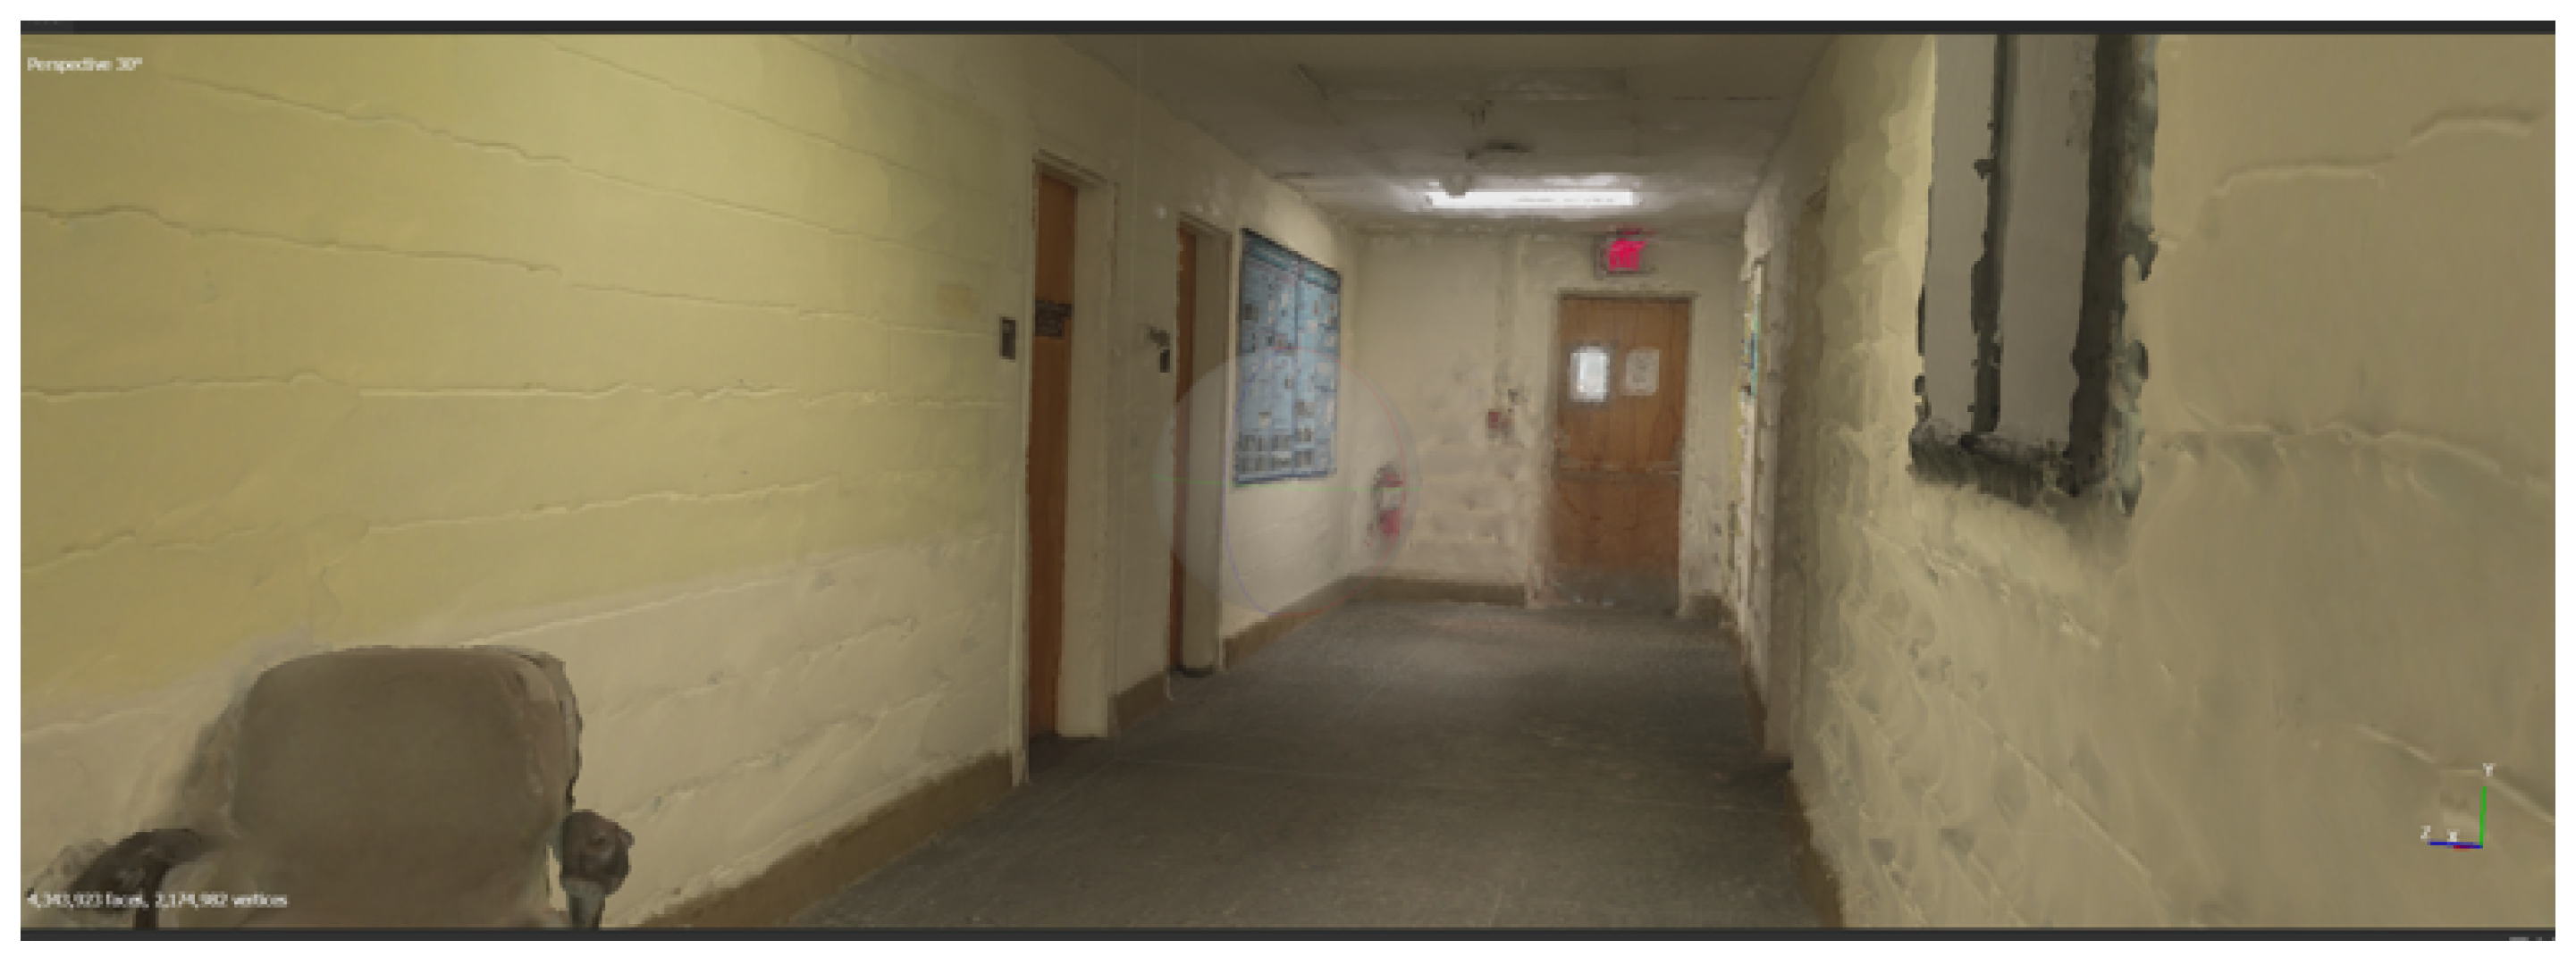
3.2. LiDAR-Based 3D Mapping and Data Framework

The potential utility of LiDAR for generating accurate spatial data relevant to tank inspection was evaluated using point cloud data acquired from representative environments and processed with CloudCompare software.
Figure 9 and Figure 10 present an example of a raw 3D point cloud generated by a LiDAR sensor within a confined space, simulating a section of a tank interior. This point cloud was obtained by mounting a LiDAR sensor along an rgb camera in a tripod which was then carried through the hallway; shaking and abrupt movement was performed to simulate an irregular flightpath and small collisions. The data accurately captured the complex geometry of the structural elements. This result demonstrates the fundamental capability of LiDAR to create detailed digital twins of such environments, which is essential for documentation, measurement, and providing the spatial context needed for navigating an inspection platform (e.g., UAV) and accurately locating findings from other sensors.
Furthermore, Figure 11 illustrates the potential for integrating LiDAR data with other sensor modalities. Here, the geometrically accurate LiDAR point cloud has been colorized and meshed using data from a co-located RGB camera. This fusion provides intuitive visual context to the 3D structure, aiding interpretation. This result highlights the role of LiDAR in providing a robust spatial framework onto which other data layers (RGB, potentially HSI) can be overlaid, enabling the creation of comprehensive multi-modal representations of the inspected asset. Such integrated datasets are crucial for thorough analysis and informed decision-making.
These examples underscore the feasibility of employing LiDAR to generate the high-fidelity spatial information necessary for advanced tank inspection approaches, serving both mapping and data integration purposes. Although the combination of LiDAR and RGB sensors is not new, we wanted to showcase the potential that this technology has for tank mapping and for acting as a bridge between spatial and textural properties.

4. Discussion

The primary objective of this work was to critically evaluate the limitations of current corrosion inspection methods, particularly visual assessment within the challenging environment of maritime ballast tanks and to explore the potential of LiDAR and hyperspectral sensing as technologies that could form the basis of improved future strategies. The results presented, while preliminary and based on laboratory experiments or illustrative data, provide initial insights into the feasibility of these sensors for specific relevant tasks. It is important to emphasize that these findings do not constitute a fully developed or validated inspection methodology; rather, they serve to highlight potential capabilities and inform future research directions.
Current reliance on visual inspection for ballast tanks suffers from significant drawbacks, including subjectivity, dependence on favorable lighting, difficulties in accessing all surfaces within complex geometries, and, often, the inability to detect corrosion until it is well-established or to reliably assess conditions beneath coatings. These limitations contribute to the high costs and potential risks associated with undetected or late-detected corrosion.
Our preliminary hyperspectral results (Figure 5, Figure 6, Figure 7 and Figure 8) suggest the potential of HSI to address some of these issues. The demonstrated ability to differentiate between corroded, coated, and bare metal surfaces based on objective spectral signatures, even under controlled conditions, points towards a possible means of reducing the subjectivity inherent in visual calls. Furthermore, the sensitivity observed in detecting relative differences in paint layers (Figure 8), while requiring significant further investigation and likely optimization with different spectral ranges (e.g., SWIR), hints at the potential for non-contact assessment of coating integrity—a critical factor in corrosion prevention that is difficult to gauge visually. The core value proposition of HSI explored here lies in its potential to provide objective material-specific information that could complement and eventually surpass simple visual assessment.
Complementing the material-specific potential of HSI, the LiDAR results (Figure 9, Figure 10 and Figure 11) reinforce its established capability for high-fidelity 3D mapping. Capturing the intricate geometry of tank interiors accurately is fundamental for addressing accessibility limitations. A detailed 3D map serves multiple potential purposes: comprehensive documentation, precise localization of findings, a basis for systematic inspection planning (potentially automated), and the essential framework for fusing data from multiple sensors. The colorized point cloud (Figure 11) explicitly illustrates this data fusion potential, combining geometric accuracy with visual context. Deployed via a suitable UAV, LiDAR could enable systematic coverage of areas inaccessible or time-consuming for human inspectors.

4.1. Deployment Platform Considerations: UAV

Deploying these sensors within the confined and complex environment of a maritime ballast tank necessitates a mobile platform. An unmanned aerial vehicle (UAV or drone) presents a compelling option due to its potential for accessing hard-to-reach areas, agility, and the possibility of future automation [38,39].

4.1.1. Platform Requirements

Selecting or designing a suitable UAV platform involves balancing several critical factors:
  • Stability and Motion Control: HSI sensors require stable controlled motion to capture accurate spectral data without distortions caused by drone vibrations and movements. LiDAR and RGB sensors could probably work in a less sophisticated platform. However, advanced stabilization systems, such as gimbals, are crucial for maintaining data quality within the system as a whole [40].
  • Environmental Conditions: The harsh conditions of maritime environments, including high humidity and salt spray, can impact sensor performance and longevity, necessitating robust protective measures [41].
  • Data Volume and Processing: HSI generates large volumes of data, presenting challenges for real-time onboard processing and efficient data transmission [42].
  • Power Consumption: The significant power requirements of HSI sensors can reduce the total flight time and operational efficiency, highlighting the importance of power management strategies [43].
  • Integration with Other Sensors: Seamless integration with other sensors, such as LiDAR and RGB cameras, is essential for effective data fusion but requires precise synchronization [44].
  • Distance and Field of View: Maintaining a consistent distance and field of view from surfaces is critical for accurate data collection, especially in confined spaces like ballast tanks [45].
  • Lighting Conditions: Ensuring adequate and consistent lighting is essential for capturing high-quality hyperspectral data, particularly in low-light conditions typical of tank interiors [46].
Maritime tanks have spaces of limited access and poor visibility; thus, the drone has to be agile but also safe. A caged system ensures that the drone can tolerate minor collisions but also protects the tank from rogue drone parts in case of a major collision. Easy recovery of the drone is paramount when working with such limited spaces.
Our experience with platforms like the Flyability Elios 3 [36] and Headwall UAV [47] confirms the value of caged designs and integrated LiDAR for navigating confined spaces and damage control but also highlights the payload limitations of current compact collision-tolerant drones when considering the addition of a typical hyperspectral sensor [32]. This suggests that either advancements in sensor miniaturization or the development of purpose-built UAV platforms may be necessary for a fully integrated system [48].

4.1.2. Operational Approach and Automation Potential

Initial feasibility testing and system development would likely involve manual piloting of the UAV, allowing operators to focus on data quality and sensor performance in specific areas of interest. However, the proposed sensor setup, particularly the inclusion of LiDAR, paves the way for future automation. LiDAR data are fundamental to simultaneous localization and mapping (SLAM) algorithms, which enable a drone to build a map of an unknown environment while simultaneously tracking its own location within that map. This capability is crucial for autonomous navigation in GPS-denied environments like ballast tanks. Once a 3D map is generated (potentially during an initial LiDAR-only scan), path planning algorithms could be employed to calculate optimal trajectories for comprehensive surface coverage with the HSI and RGB sensors, potentially focusing on areas flagged during the initial mapping or based on prior knowledge [49,50]. While full autonomy presents significant challenges (sensor fusion, real-time processing, decision making), the use of LiDAR provides the foundational spatial awareness required, making autonomous or semi-autonomous operation a viable and highly desirable future research direction for improving inspection efficiency, repeatability, and safety.
Bridging the gap between these demonstrated potentials and a practical robust inspection system requires addressing significant challenges. The HSI results were obtained under controlled laboratory lighting and proximity; performance in variable, potentially low-light tank environments, with greater sensor–target distances needs thorough investigation. Robust algorithms are required to reliably classify diverse corrosion types, severities, and coating conditions from spectral data amidst real-world variability (e.g., contaminants, moisture). While LiDAR mapping is more mature, deploying and navigating a UAV carrying the combined payload (especially a potentially bulky HSI sensor) within confined, complex, and possibly hazardous tank environments remains a non-trivial engineering challenge. Effective sensor fusion techniques and real-time data processing for autonomous navigation (leveraging SLAM capabilities enabled by LiDAR) also require substantial development and validation.
Therefore, while the individual sensor capabilities explored here show promise for overcoming specific limitations of traditional methods, this work primarily underscores the potential direction for future efforts. Significant further research and development are necessary, including the following:
  • Conducting field trials within actual ballast tanks to assess sensor performance under realistic environmental conditions.
  • Developing and validating robust data processing and machine learning algorithms for automated classification and analysis of fused LiDAR and HSI data.
  • Addressing the engineering challenges of integrating the required sensor suite onto a UAV platform suitable for confined space operations (balancing payload, agility, endurance, and safety).
  • Establishing a reliable workflow for hyperspectral data acquisition that is applicable to diverse environments.
  • Performing quantitative comparisons against established non-destructive methods (NDT) methods to benchmark the performance of any proposed system.
In conclusion, the results presented in this study underscore the significant limitations of current visual inspection practices in maritime ballast tank assessments and demonstrate the potential impact of integrating LiDAR and hyperspectral imaging (HSI) technologies. Our preliminary investigations reveal that HSI offers a robust approach for objective material differentiation, capable of detecting early signs of corrosion through its spectral analysis capabilities. Meanwhile, LiDAR provides highly precise spatial mapping, creating detailed 3D models of complex tank geometries that aid in effective navigation and condition documentation. Together, these technologies form a synergetic toolset for developing advanced automated inspection frameworks, addressing both surface condition assessments and structural mapping.
Through this article, we have showcased specific scenarios where LiDAR and HSI can be applied in tandem to overcome the challenges posed by traditional methods. The insights gained here lay a promising groundwork for future research, aiming to refine these technologies into a seamless field-deployable system for maritime applications. We propose that further development in integrating sensor data, combined with ongoing advancements in UAV technologies and automated data analysis, could lead to a more comprehensive, efficient, and reliable corrosion management strategy that not only enhances safety and operational efficiency but also anticipates the evolving needs of the maritime industry.

Author Contributions

Writing—Original draft, S.P.E.; Writing—review and editing, S.P.E. and J.J.; supervision, C.-H.C. and S.K.; Data-acquisition, R.L. All authors have read and agreed to the published version of the manuscript.

Funding

This research recieved no external funding.

Data Availability Statement

The original contributions presented in this study are included in the article. Further inquiries can be directed to the corresponding author.

Conflicts of Interest

Author Richard Lebel was employed by the company Mainbrace Solutions. The remaining authors declare that the research was conducted in the absence of any commercial or financial relationships that could be construed as a potential conflict of interest.

References

  1. Moore, J.D., III. Long-term corrosion processes of iron and steel shipwrecks in the marine environment: A review of current knowledge. J. Marit. Archaeol. 2015, 10, 191–204. [Google Scholar] [CrossRef]
  2. Almadhoun, R.; Taha, T.; Seneviratne, L.; Dias, J.; Cai, G. A survey on inspecting structures using robotic systems. Int. J. Adv. Robot. Syst. 2016, 13, 1729881416663664. [Google Scholar] [CrossRef]
  3. Hung, M.L.; Gucunski, N.; Dana, K.; Seong-Hoon, K. Development of an autonomous bridge deck inspection robotic system. J. Field Robot. 2017, 34, 1489–1504. [Google Scholar] [CrossRef]
  4. Gudze, M.T.; Melchers, R.E. Operational based corrosion analysis in naval ships. Corros. Sci. 2008, 50, 3296–3307. [Google Scholar] [CrossRef]
  5. Qi, Z.; Eames, I.; Greig, A. Flushing ballast tanks. Ocean Eng. 2014, 89, 157–172. [Google Scholar] [CrossRef]
  6. Lakshmi, E.; Priya, M.; Achari, V.S. An overview on the treatment of ballast water in ships. Ocean Coast. Manag. 2021, 199, 105296. [Google Scholar] [CrossRef]
  7. David, M. Vessels and Ballast Water. In Global Maritime Transport and Ballast Water Management; Invading Nature—Springer Series in Invasion Ecology; David, M., Gollasch, S., Eds.; Springer: Dordrecht, The Netherlands, 2015; Volume 8. [Google Scholar]
  8. Paik, J.K.; Thayamballi, A.K.; Park, Y.I.; Hwang, J.S. A time-dependent corrosion wastage model for seawater ballast tank structures of ships. Corros. Sci. 2004, 46, 471–486. [Google Scholar] [CrossRef]
  9. Wang, Y.; Li, B.; Chen, L.; Jiang, Z. Region segmentation based radiographic detection of defects for gas turbine blades. In Proceedings of the 2015 IEEE International Conference on Mechatronics and Automation (ICMA), Beijing, China, 2–5 August 2015. [Google Scholar]
  10. Kaess, M.; Hover, F.S.; Leonard, J.J.; Teixeira, P.V. Underwater inspection using sonar-based volumetric submaps. In Proceedings of the 2016 IEEE/RSJ International Conference on Intelligent Robots and Systems (IROS), Daejeon, Republic of Korea, 9–14 October 2016. [Google Scholar]
  11. Ok, D. The Effects of Corrosions and Fatigue Induced Cracks on Strength Degradation in Ageing Ships. Ph.D. Thesis, Newcastle University, Newcastle, UK, 2006. [Google Scholar]
  12. Agarwala, V.S.; Reed, P.L.; Ahmad, S. Corrosion Detection and Monitoring—A Review. In Proceedings of the CORROSION 2000 Conference, Orlando, FL, USA, 26–31 March 2000; Available online: https://onepetro.org/NACECORR/proceedings-pdf/CORR00/All-CORR00/NACE-00271/1915423/nace-00271.pdf (accessed on 15 September 2024).
  13. Kerf, T.D.; Gestels, A.; Janssens, K.; Scheuders, P.; Steenackers, G.; Vanlanduit, S. Quantitative detection of corrosion minerals in carbon steel using shortwave infrared hyperspectral imaging. RSC Adv. 2022, 12, 32775–32783. [Google Scholar] [CrossRef]
  14. Koch, G. 1—Cost of corrosion. In Trends in Oil and Gas Corrosion Research and Technologies; El-Sherik, A., Ed.; Woodhead Publishing Series in Energy; Woodhead Publishing: Cambridge, UK, 2017; pp. 3–30. [Google Scholar]
  15. Brogaard, R.Y.; Andersen, R.E.; Kovac, L.; Zajaczkowski, M.; Boukas, E. Towards an Autonomous, Visual Inspection-aware 3D Exploration and Mapping System for Water Ballast Tanks of Marine Vessels. In Proceedings of the 2021 IEEE International Conference on Imaging Systems and Techniques (IST), Kaohsiung, Taiwan, 24–26 August 2021; pp. 1–6. [Google Scholar]
  16. Veleva, L. Protective Coatings and Inorganic Anti-Corrosive Pigments (Chapter 28). In ASTM MNL; ASTM: West Conshohocken, PA, USA, 2012; Volume 122. [Google Scholar]
  17. Mulla, D.J. Twenty-five years of remote sensing in precision agriculture: Key advances and remaining knowledge gaps. Biosyst. Eng. 2013, 114, 358–371. [Google Scholar] [CrossRef]
  18. Lang, M.; Forkuor, G.; Kuemmerle, T. Mapping South African savannah with hyperspectral data and machine learning. Remote Sens. 2019, 11, 1245. [Google Scholar]
  19. Kruse, F.A. Mapping surface mineralogy using imaging spectrometry. Geomorphology 2012, 137, 41–56. [Google Scholar] [CrossRef]
  20. VanDerMeer, F.; de Jong, S.M. Imaging spectrometry for local seismic hazard assessment in mining. Int. J. Appl. Earth Obs. Geoinf. 2012, 14, 95–104. [Google Scholar]
  21. Clark, M.R.; McCann, D.M.; Forde, M.C. Applications of remote sensing techniques to civil and structural engineering. Surv. Eng. 2004, 32, 201–210. [Google Scholar]
  22. Del Pozo, S.; Herrero-Pascual, J.; Felipe-García, B.; Hernández-López, D.; Rodríguez-Gonzálvez, P.; González-Aguilera, D. Multispectral Radiometric Analysis of Façades to Detect Pathologies from Active and Passive Remote Sensing. Remote Sens. 2016, 8, 80. [Google Scholar] [CrossRef]
  23. Schwertmann, U.; Cornell, R.M. Iron Oxides in the Laboratory: Preparation and Characterization; Wiley-VCH: Weinheim, Germany, 1998. [Google Scholar]
  24. Hunt, G.R. Spectral properties of rocks and related materials—A short course. In Economics and the Reflectance Spectra of Minerals, Presented at the Geological Society of America Meeting, Washington, DC, USA, 29–31 October 1971; CRC Press: Boca Raton, FL, USA, 1971. [Google Scholar]
  25. Hu, J.Y.; Zhang, S.S.; Chen, E.; Li, W.G. A review on corrosion detection and protection of existing reinforced concrete (RC) structures. Constr. Build. Mater. 2022, 325, 126718. [Google Scholar] [CrossRef]
  26. Naik, D.; Sakid, H.U.; Kiran, R.; Sun, X. Hyperspectral Imaging for the Elimination of Visual Ambiguity in Corrosion Detection and Identification of Corrosion Sources. Struct. Health Monit. 2022, 21, 1678–1693. [Google Scholar]
  27. Lattanzi, D.; Miller, G. Review of robotic infrastructure inspection systems. J. Infrastruct. Syst. 2017, 23, 04017004. [Google Scholar] [CrossRef]
  28. Sharma, V.B. Automatic Identification of Deformations in Buildings and Pipelines Using 3D Point Cloud Data for Structural Health Monitoring with LiDAR Technology. Ph.D. Thesis, Rajiv Gandhi Institute of Petroleum Technology, Amethi, India, 2023. [Google Scholar]
  29. Bhargava, A.; Sachdeva, A.; Sharma, K.; Alsharif, M.H.; Uthansakul, P.; Uthansakul, M. Hyperspectral imaging and its applications: A review. Heliyon 2024, 10, e33208. [Google Scholar] [CrossRef] [PubMed]
  30. Noomen, M. Hyperspectral Reflectance of Vegetation Affected by Underground Hydrocarbon Gas Seepage; Wageningen University and Research: Wageningen, The Netherlands, 2007. [Google Scholar]
  31. Dingemans, L.M.; Papadakis, V.M.; Liu, P.; Adam, A.J.L.; Groves, R.M. Quantitative Coating Thickness Determination Using a Coefficient-Independent Hyperspectral Scattering Model. J. Eur. Opt. Soc.-Rapid Publ. 2017, 13, 40. [Google Scholar] [CrossRef]
  32. Thomas, D.; Gündel, M. Hyperspectral imaging systems for corrosion detection from remotely operated vehicles. ce/Papers 2023, 6, 934–938. [Google Scholar] [CrossRef]
  33. Zabalza, J.; Murray, P.; Bennett, S.; Campbell, A.J.; Marshall, S.; Ren, J. Hyperspectral Imaging Based Corrosion Detection in Nuclear Packages. IEEE Sens. J. 2023, 23, 25607–25617. [Google Scholar] [CrossRef]
  34. Rodríguez-Gonzálvez, P.; Fernández-Palacios, B.J.; Muñoz-Nieto, A.L.; Arias, P.; González-Aguilera, D. Mobile lidar system: New possibilities for the documentation and dissemination of large cultural heritage sites. Remote Sens. 2017, 9, 189. [Google Scholar] [CrossRef]
  35. Buckley, S.J.; Kurz, T.H.; Howell, J.A.; Schneider, D. Terrestrial lidar and hyperspectral data fusion products for geological outcrop analysis. Comput. Geosci. 2013, 54, 249–258. [Google Scholar] [CrossRef]
  36. Flyability. ELIOS 3—Digitizing the Inaccessible. Available online: https://www.flyability.com/elios-3 (accessed on 31 October 2024).
  37. CloudCompare: 3D Point Cloud and Mesh Processing Software. Available online: https://www.cloudcompare.org/ (accessed on 1 November 2023).
  38. Ayamga, M.; Akaba, S.; Nyaaba, A.A. Multifaceted applicability of drones: A review. Technol. Forecast. Soc. Change 2021, 167, 120677. [Google Scholar] [CrossRef]
  39. Menendez, E.; Victores, G.V.; Montero, R.; Martinez, S.; Balaguer, C. Tunnel structural inspection and assessment using an autonomous robotic system. Autom. Constr. 2018, 87, 117–126. [Google Scholar] [CrossRef]
  40. Kopačková, V.; Alfoldi, T.T.; Yilmaz-Onen, F. UAV-based hyperspectral sensing of soil washes. Remote Sens. 2018, 10, 1428. [Google Scholar]
  41. Harwin, S.; Lucieer, A. Assessing the accuracy of georeferenced point clouds produced via multi-view stereopsis from unmanned aerial vehicle (UAV) imagery. Remote Sens. 2012, 4, 1573–1599. [Google Scholar] [CrossRef]
  42. Gašparović, M.; Zrinjski, M.; Galić, I.; Balenović, I. The Cost-Effectiveness of Hyperspectral and LIDAR Data on Pre-Harvest Volume Estimation of Riparian Forests. Remote Sens. 2016, 8, 638. [Google Scholar]
  43. Burkart, A.; Hecht, V.L.; Kraska, T.; Rascher, U.; Aigner, J. A novel UAV-based ultra-light weighting frame for hyperspectral field measurements. Comput. Electron. Agric. 2015, 119, 195–209. [Google Scholar]
  44. Aasen, H.; Bolten, A. Multi-temporal high-resolution imaging spectroscopy with hyperspectral 2D framework: An approach for plant phenotyping. Remote Sens. Environ. 2018, 206, 212–222. [Google Scholar]
  45. Turner, D.; Lucieer, A.; Malenovský, Z.; King, D.H.; Robinson, S.A. Assessment of Antarctic moss health from multi-sensor UAV imagery. Sensors 2014, 14, 7692–7710. [Google Scholar]
  46. Zhang, C.; Kovacs, J.M. The application of small unmanned aerial systems for precision agriculture: A review. Precis. Agric. 2012, 13, 693–712. [Google Scholar] [CrossRef]
  47. Headwall. Nano HP (400–1000 nm) Hyperspectral Imaging Package HyperSpectral Imaging Package. Available online: https://headwallphotonics.com/products/remote-sensing/nano-hp-400-1000nm-hyperspectral-imaging-package (accessed on 31 October 2024).
  48. Fabris, A.; Kirchgeorg, S.; Mintchev, S. A Soft Drone with Multi-modal Mobility for the Exploration of Confined Spaces. In Proceedings of the 2021 IEEE International Symposium on Safety, Security, and Rescue Robotics (SSRR), New York City, NY, USA, 25–27 October 2021; pp. 48–54. [Google Scholar]
  49. Puente-Castro, A.; Rivero, D.; Pazos, A.; Fernandez-Blanco, E. A review of artificial intelligence applied to path planning in UAV swarms. Neural Comput. Appl. 2022, 34, 153–170. [Google Scholar] [CrossRef]
  50. Conte, C.; de Alteris, G.; Lo Moriello, R.S.; Accardo, D.; Rufino, G. Drone Trajectory Segmentation for Real-Time and Adaptive Time-of-Flight Prediction. Drones 2021, 5, 62. [Google Scholar] [CrossRef]
Figure 1. Diagram that shows a basic hyperspectral imaging setup using a tripod/mount and two halogen lamps as light source.
Electronics 14 03065 g001
Figure 2. Circular steel plates that were used as samples for in lab testing. They were corroded by being exposed to water during different lengths of time. CR_1, CR_2, and CR_3 are used as arbitrary labels for the different paints used.
Electronics 14 03065 g002
Figure 3. Steel (top) beam that has only partial coating remaining (white). Aluminum (bottom) beam that is partially coated with purple paint.
Electronics 14 03065 g003
Figure 4. Circular steel sample that has had different number of layers of coating applied.
Electronics 14 03065 g004
Figure 5. Hyperspectral analysis (heatmap overlay, 690–840 nm range shown for contrast) of a steel beam sample. Distinct spectral responses are visually suggested between the regions.
Electronics 14 03065 g005
Figure 6. Hyperspectral analysis of an aluminum sample with air-sprayed paint. Clear distinction between coated and uncoated areas is visible in the hyperspectral representation (520–675 nm). This corresponds to the bottom RGB picture in Figure 3.
Electronics 14 03065 g006
Figure 7. Graph of mean spectra of small areas taken from several steel plate samples that have been corroded in lab. Samples are taken from Figure 2.
Electronics 14 03065 g007
Figure 8. Hyperspectral analysis (heatmap, 690–840 nm range) of a steel sample with one, two, and three layers of paint. Differences in reflectance corresponding to the number of layers are suggested. RGB image is on the right for reference.
Electronics 14 03065 g008
Figure 9. Example LiDAR point cloud of a confined structural environment. Ballast tank and surrounding structures gathered with LiDAR mounted on UAV.
Electronics 14 03065 g009
Figure 10. Example LiDAR point cloud of a confined space (e.g., hallway). A LiDAR sensor mounted on tripod moved through a hallway.
Electronics 14 03065 g010
Figure 11. Example of a 3D mesh obtained from the integration of accurate LiDAR readings and RGB visual sensor, which illustrates the potential for multi-sensor data fusion, using LiDAR as the geometric backbone.
Electronics 14 03065 g011
Table 1. Challenges and limitations of using drones in maritime tank inspections.
ChallengeDescription
Confined SpacesDrones must navigate tight enclosed environments that limit maneuverability and increase the risk of collisions. GPS signal reception is often poor, complicating navigation.
Lighting ConditionsPoor lighting affects visual data acquisition, necessitating onboard lighting systems, which increase power consumption. Reflective surfaces can create shadows and glare.
Environmental ConditionsHigh humidity and saltwater can impact drone operation and sensor functionality, requiring protective measures for electronic components.
Sensor IntegrationIntegrating multiple sensors (e.g., LiDAR, HSI, Visual RGB) requires careful calibration and synchronization for accurate data fusion, with constraints on payload capacity.
Data ProcessingHigh-resolution sensors generate large data volumes, necessitating robust onboard processing or efficient transmission for post-processing.
Autonomy and ControlReal-time data processing for navigation and obstacle avoidance is complex. Autonomous systems require sophisticated algorithms.
Power ManagementHigh power requirements reduce flight duration, necessitating energy-efficient designs and potential solutions for battery swapping or recharging.
Communication ConstraintsSignal loss is possible in metallic environments. Reliable communication systems are needed to maintain control and data links.
Collision AvoidanceAdvanced systems are needed for real-time collision avoidance. Sensors must reliably detect obstacles in cluttered environments.
Maintenance and ReliabilityHarsh conditions demand regular maintenance. Reliability is crucial to prevent system failures during inspections.
Data Security and PrivacyEnsuring compliance with data privacy laws and securing sensitive data collected during operations is necessary.
Training and Human FactorsOperators require specialized training for effective drone use, particularly in manual or semi-automated modes.
Disclaimer/Publisher’s Note: The statements, opinions and data contained in all publications are solely those of the individual author(s) and contributor(s) and not of MDPI and/or the editor(s). MDPI and/or the editor(s) disclaim responsibility for any injury to people or property resulting from any ideas, methods, instructions or products referred to in the content.

