1. Introduction
Volcanic activity has not only shaped extensive surface landforms but has also created distinctive subsurface features, most notably lava tubes. The formation process of lava tubes can be summarized as follows: the outer surface of the lava channel cools faster, forming a hard shell. Then, the remaining lava flows out of the tube, leaving a void, which forms the lava tube [
1]. These structures are commonly found in major basaltic volcanic regions, including Hawaii, Iceland, Australia, and the Wudalianchi volcanic group in Northeast China. In recent years, with advancements in planetary exploration technology, research on the Moon and Mars has expanded from the surface to the subsurface. Numerous lava tube-like formations have been identified on these planets, deepening our understanding of extraterrestrial geology.
The formation of lava tubes on the Moon is similar to that on Earth, primarily due to the flow and cooling of low-viscosity basaltic lava. However, the Moon’s unique environmental conditions introduce notable differences. For example, the Moon’s gravitational acceleration is only about one-sixth that of Earth, allowing lava tubes to maintain structural stability over larger spans. The Gravity Recovery and Mapping Mission (GRAIL) orbiter’s detection of the Moon’s shallow gravity revealed that the diameter of lunar lava tubes can reach hundreds or even thousands of meters, significantly larger than those on Earth [
2]. Radar sounding data from lunar orbiters have revealed internal structures of the lunar maria, demonstrating the value of subsurface electronics-based sensors in extraterrestrial settings [
3]. Due to the huge size of the lunar internal lava tubes, they provides great potential for space utilization and expansion for the construction of bases in the lunar interior, giving it great natural advantages. The thick basaltic roof can shield against cosmic radiation and micrometeorite impacts, while also providing thermally stable and secure environments. Furthermore, the absence of atmospheric and hydrological erosion on the Moon has allowed these structures to remain well-preserved over geological timescales. However, subsequent magmatic activities, tectonic changes, or impact events may affect the shape of these tubes [
4]. The lava tubes may collapse due to lunar earthquakes or meteorite impacts, creating “skylights” that expose the interior. Through these skylights, the existence of underground lava tubes on the Moon can be revealed, allowing for further exploration and study of their internal structures. Lava tubes offer important site for future lunar bases and provide opportunities for multidisciplinary research on lunar bases.
Given their potential as lunar bases and geological archives, lava tubes have been widely studied through mechanical modeling. Many researchers have employed finite element analysis (FEA) to evaluate the structural stability of these features, often adopting idealized cross-sectional geometries such as semi-ellipses or circles. Blair et al. studied a semi-ellipse with a width-to-height ratio (the ratio of the longitudinal length to the transverse span) of 3:1, concluding that, without considering regional tectonic influences, a lava tube buried 50 m below the lunar surface can remain stable over a width of up to 3.5 km [
2]. Modiriasari et al. further investigated semi-ellipses and semicircles with width-to-height ratios of 3:2, 1:1, and 2:3, based on Blair’s findings, confirming Blair’s results. They found that a lava tube with a width of 4 km is stable when the roof thickness of 50 m, and the higher the top thickness, the more stable it becomes, and the greater the aspect ratio, the more stable it is [
5]. Similarly, Theinat et al. studied elliptical shapes with a width-to-height ratio of 3:2 and concluded that when the roof thickness exceeds 100 m, a 1000 m wide lava tube is likely to be stable [
6]. Marcin Chwała et al. also analyzed the cross-sections of lava tubes with width-to-height ratios of 1:1, 2:3, 1:2, 1:3, and 1:4, confirming the findings of earlier researchers [
7].
Despite these insights, most existing studies rely on simplified and idealized geometries that fail to accurately represent the natural irregularities of real lava tubes. Although such models offer computational efficiency and theoretical tractability, they fail to capture the geometric complexity of naturally formed tubes, including local bulges, indentations, and asymmetries [
6]. These irregularities can significantly alter stress distribution and deformation patterns, potentially leading to localized buckling or collapse, which idealized analyses would miss. As a result, simulations based on ideal models are likely to underestimate or misrepresent the mechanical behavior of real lava tubes under external loads.
To address the limitations of traditional idealized models in assessing lava tube stability, this study proposes a comprehensive methodology based on real-scene data and structural simulation. The main innovations are as follows:
The study introduces a novel approach that combines high-precision 3D modeling based on the ground point cloud data with the finite element analysis, addressing the geometric errors and mechanical simulation inaccuracies that can arise from idealized models.
The study systematically evaluated the structural behavior of lava tubes with real cross-sectional geometries, explored the effect of aspect ratio, and assessed the impact of geometric irregularities on mechanical stability.
Unlike previous studies, this research addressed the limitations of earlier idealized models by using real-scene 3D modeling and finite element analysis. It employed real-world 3D simulations to depict the structural conditions of lava tube sections under different surface pressures, achieving a breakthrough in high-precision and highly realistic lava tube modeling.
Additionally, the study utilized the shape features of these sections for automatic recognition and classification, providing real-world geological environment experimental and model data support for extraterrestrial planetary missions.
Section 1 of this paper introduces the background and significance of lava tube research.
Section 2 reviews exploration methods and mechanical analysis studies. The study area and data collection are described in
Section 3.
Section 4 explains modeling and analysis methods. Results are presented and discussed, highlighting key influencing factors in
Section 5. Finally,
Section 6 examines deviations from ideal models and the broader implications of the findings.
4. Methods
4.1. Point Cloud Processing and Cross-Section Extraction
The methodology of this study consists of three main stages: data processing, modeling, and finite element analysis. The CPU used for data processing this time was a 12th Gen Intel(R) Core(TM) i7-12700H 2.30 GHz, an NVIDIA GeForce RTX 3070 Laptop GPU, and 32 GB of RAM. The process began with raw point cloud data acquisition, followed by preprocessing steps such as noise filtering and registration to improve data quality. The preprocessed data underwent voxelization to standardize the spatial resolution, after which the central axis of the lava tube was extracted to guide subsequent cross-sectional slicing. These cross-sections served as the basis for geometrical modeling. In the modeling stage, local coordinate systems were established for each section, and linear fitting techniques were applied to derive geometric parameters. These fitted profiles were then used to reconstruct a three-dimensional model of the lava tube. Finally, in the analysis stage, the model was subjected to mechanical simulation to evaluate structural deformation and equivalent stress under surface loading conditions. The deformation behavior was further analyzed in relation to geometric and environmental factors, including depth, roundness, and applied pressure. This integrated workflow enables a more accurate and realistic assessment of lava tube stability, particularly under extraterrestrial conditions. The technical approach is illustrated in
Figure 2.
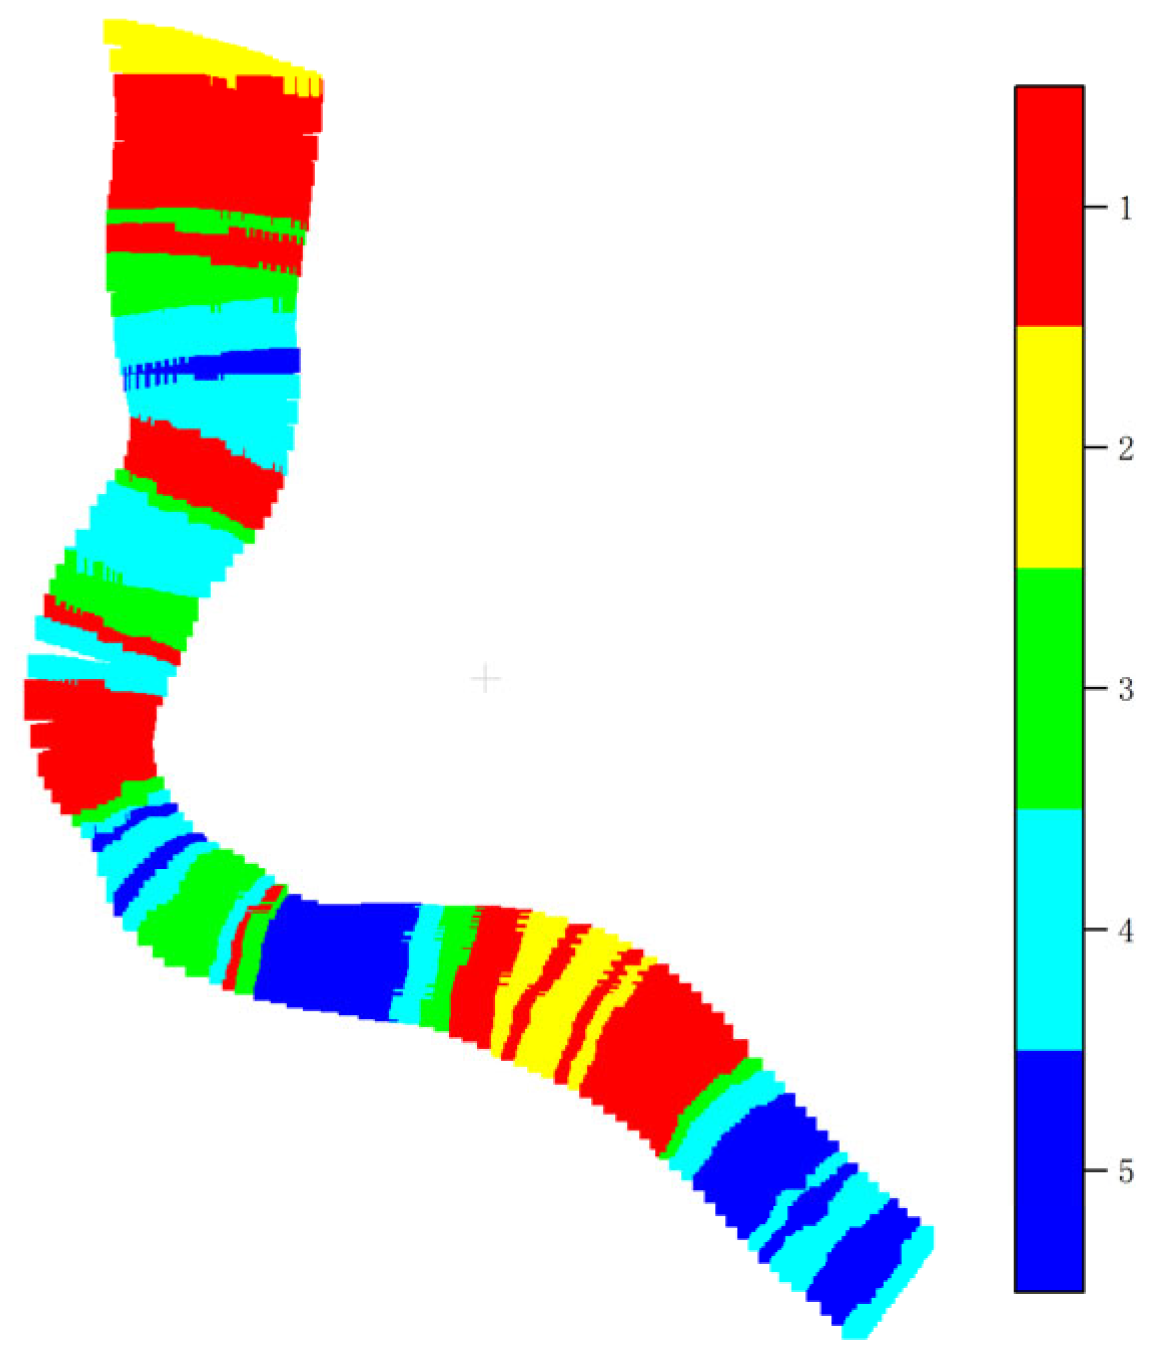
In this study, we assessed the engineering stability of different tunnels and mines and conducted safety assessments. The size of lunar lava tubes is much larger than that of lava tubes on Earth, and modeling them as a whole would result in an excessive amount of data, making efficient calculations difficult. Moreover, modeling as a whole cannot accurately identify the weak structures of the lava tubes. Therefore, in this study, we created cross-sectional templates with different safety standards.
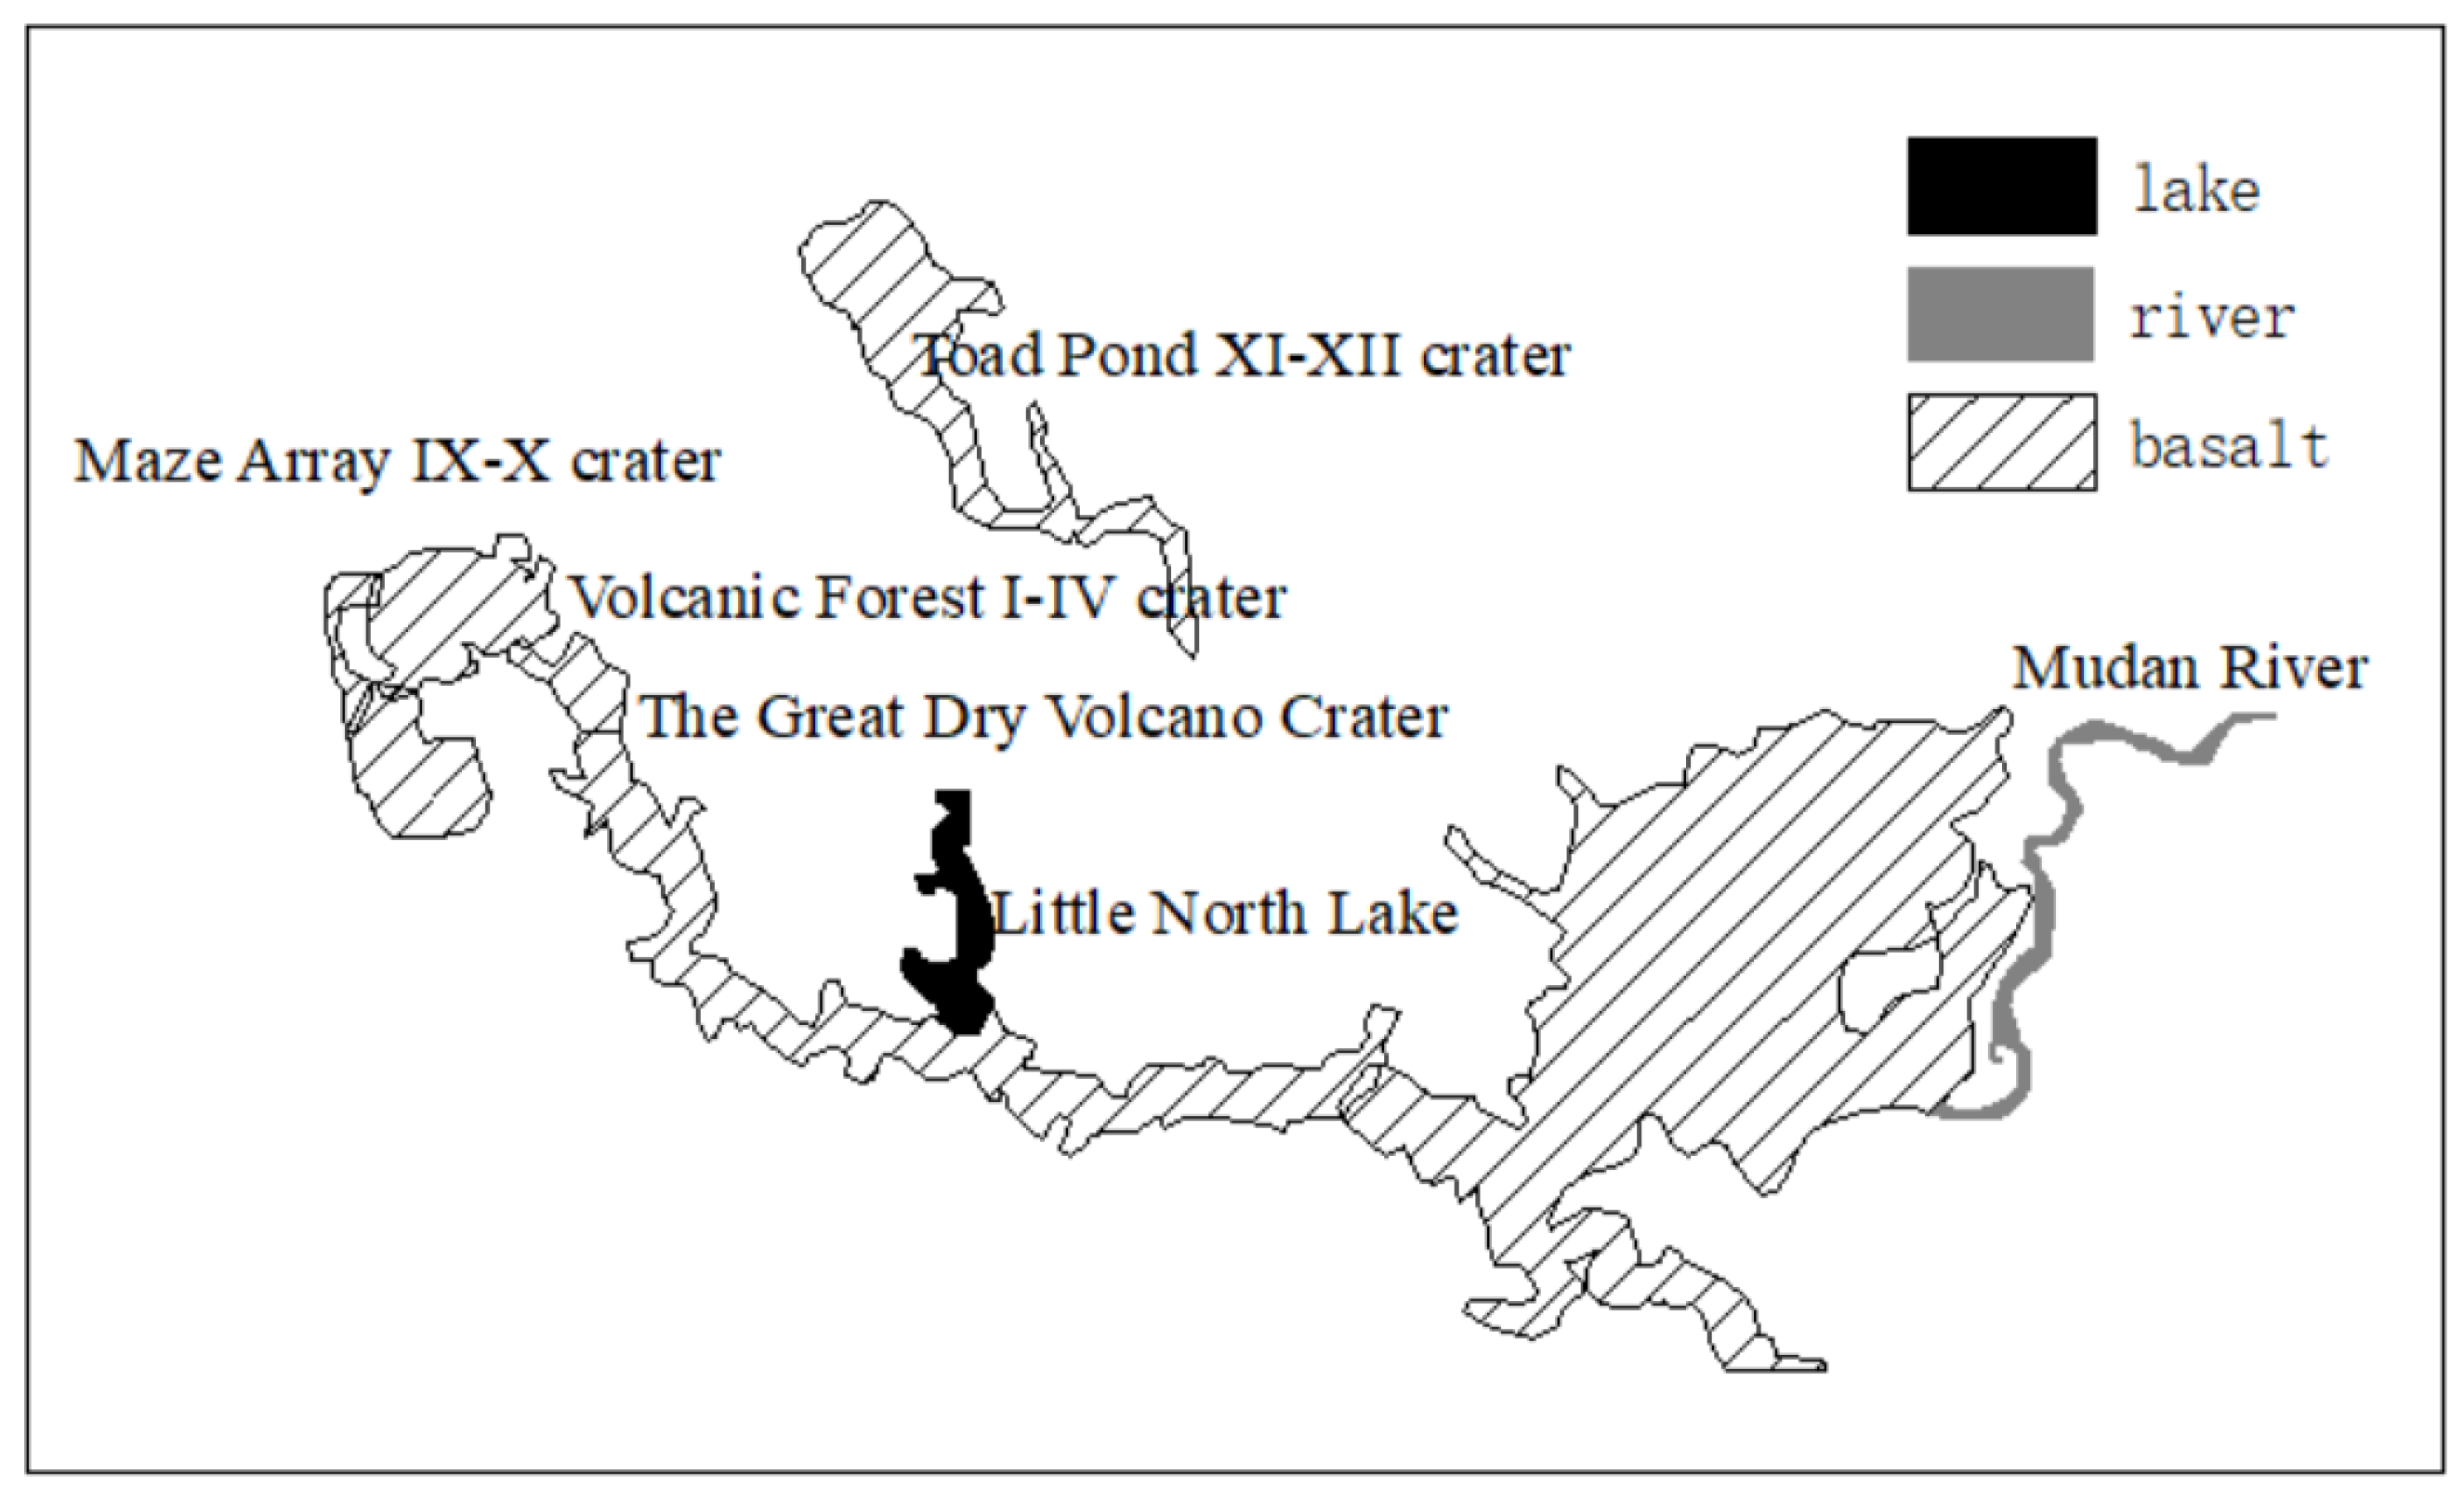
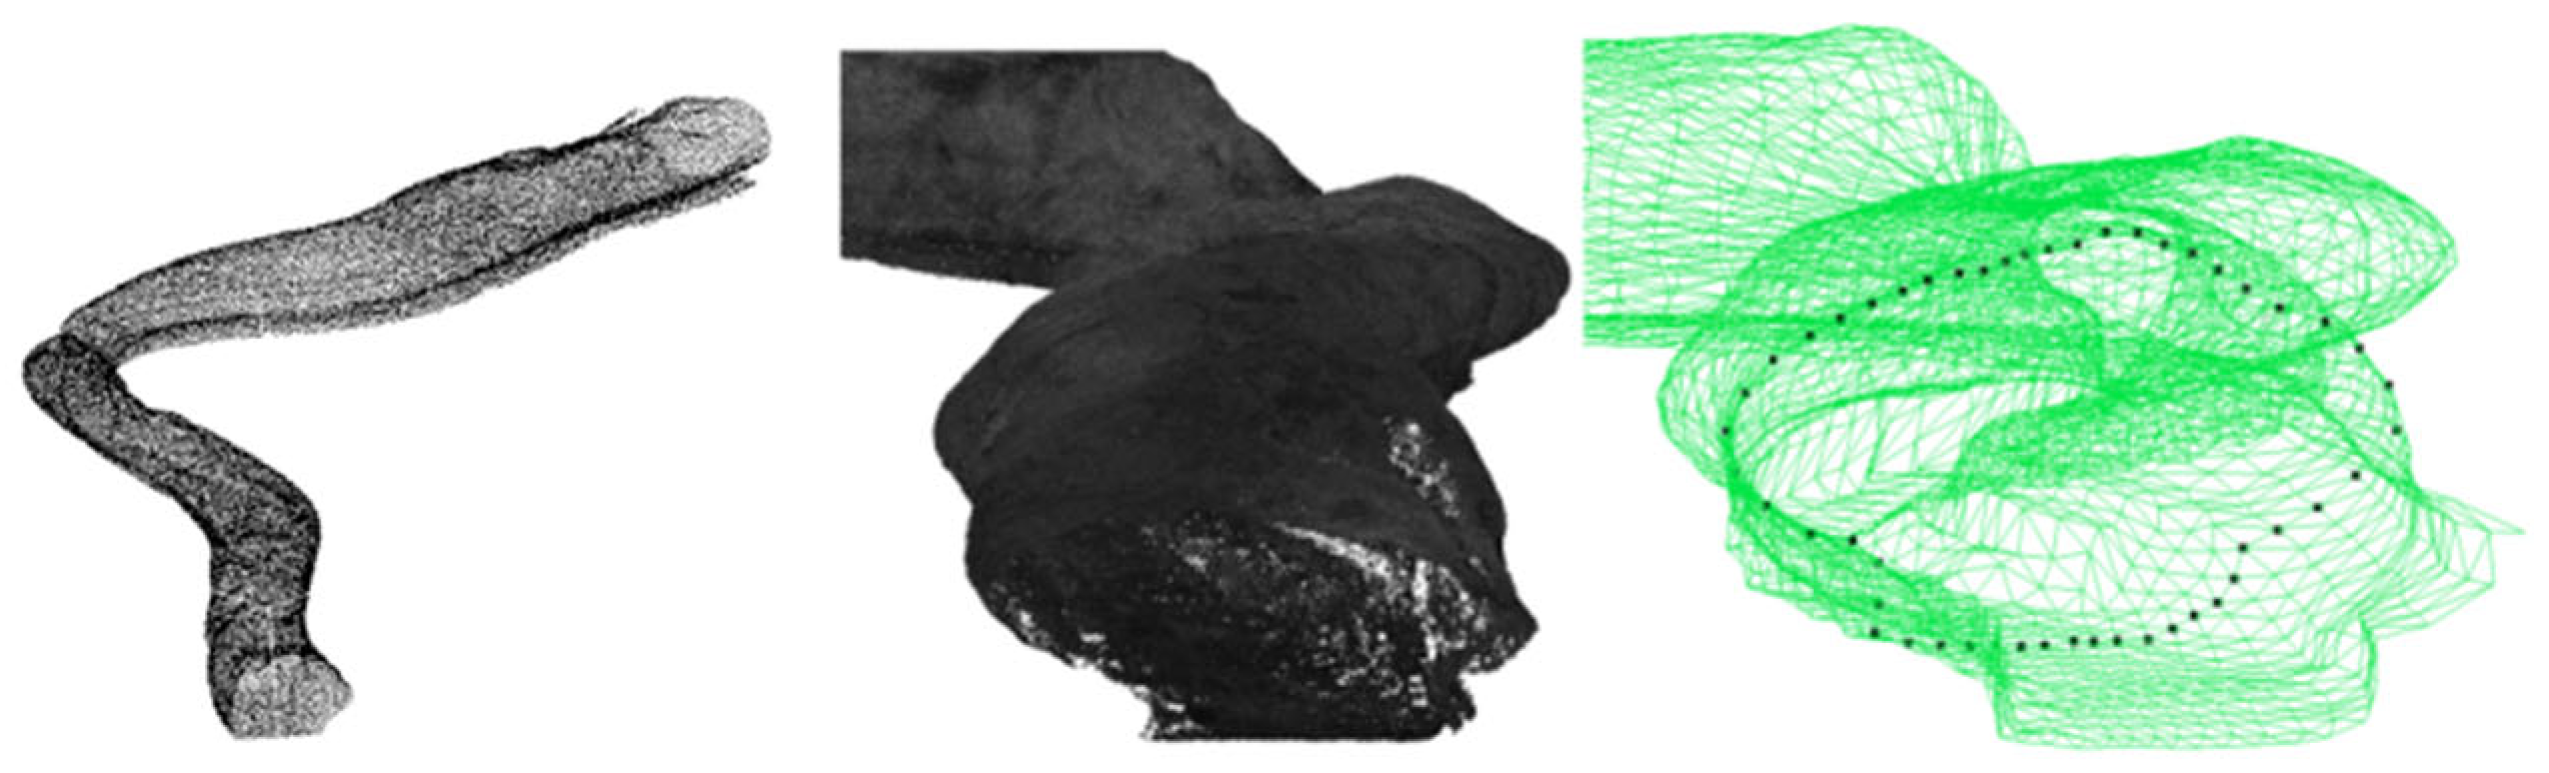
The primary objective of this study was to analyze the cross-sections of lava tubes, which involves extracting point cloud data from the original point cloud data of the lava tubes. We reconstructed a 3D model using the point cloud data collected from the Mir Lake lava cave. The collected data underwent preprocessing steps, including registration and noise reduction, to minimize interference from debris within the lava tubes. Next, the point cloud data of the lava cave was voxelized to maintain data quality while preserving the details of the internal point cloud data and reducing the number of invalid points. Subsequently, the data was segmented using the CSF algorithm and manual segmentation methods, followed by filtering with pass-through filtering technology.
Next, we needed to extract the central axis of the point cloud. We used an algorithm based on L1-MedialSkeleton to simplify the three-dimensional point set representing the shape of the lava tube into a one-dimensional cluster center set. During the process of extracting the axis, we sampled the point cloud using Huang’s method [
36], as follows:
During the fixed-search-radius center iteration process, when the distance between cluster centers in two consecutive iterations is less than the set threshold, convergence is considered to have been reached (i.e., the center point is identified as final). At the same time, the PCA algorithm was introduced to determine the linear features, and the position of each point is as follows:
We used this clustering algorithm to obtain the central line of the lava cave, obtain the axis points, and arrange them into an ordered set of points.
Based on the centerline, cross-sections of the lava tubes were extracted at regular intervals, and these sections were used to fill the voxels using interpolation methods. To ensure the model’s simplicity and completeness, only these cross-sections were used to construct a three-dimensional Delaunay triangulation, forming the three-dimensional model of the lava cave.
For this study, we selected conventional lava tubes on Earth, which are generally smaller than those on the moon. Using a larger interval would result in too little data for subsequent processing, and the selected cross-sections might be special, failing to reflect the overall pattern. Thus, the interval for the cross-sections in this study was set to 0.5 m, ensuring a sufficient data volume while maintaining some differences between adjacent cross-sections. Subsequently, the extracted cross-sections of the lava tubes were divided into different groups. By analyzing the overall structural stability of these cross-sections, this study obtained the overall safety assessment results of the lava tubes. The methods for processing point cloud data and extracting cross-sections are specifically taken from Qiao Yang et al.’s study [
37].
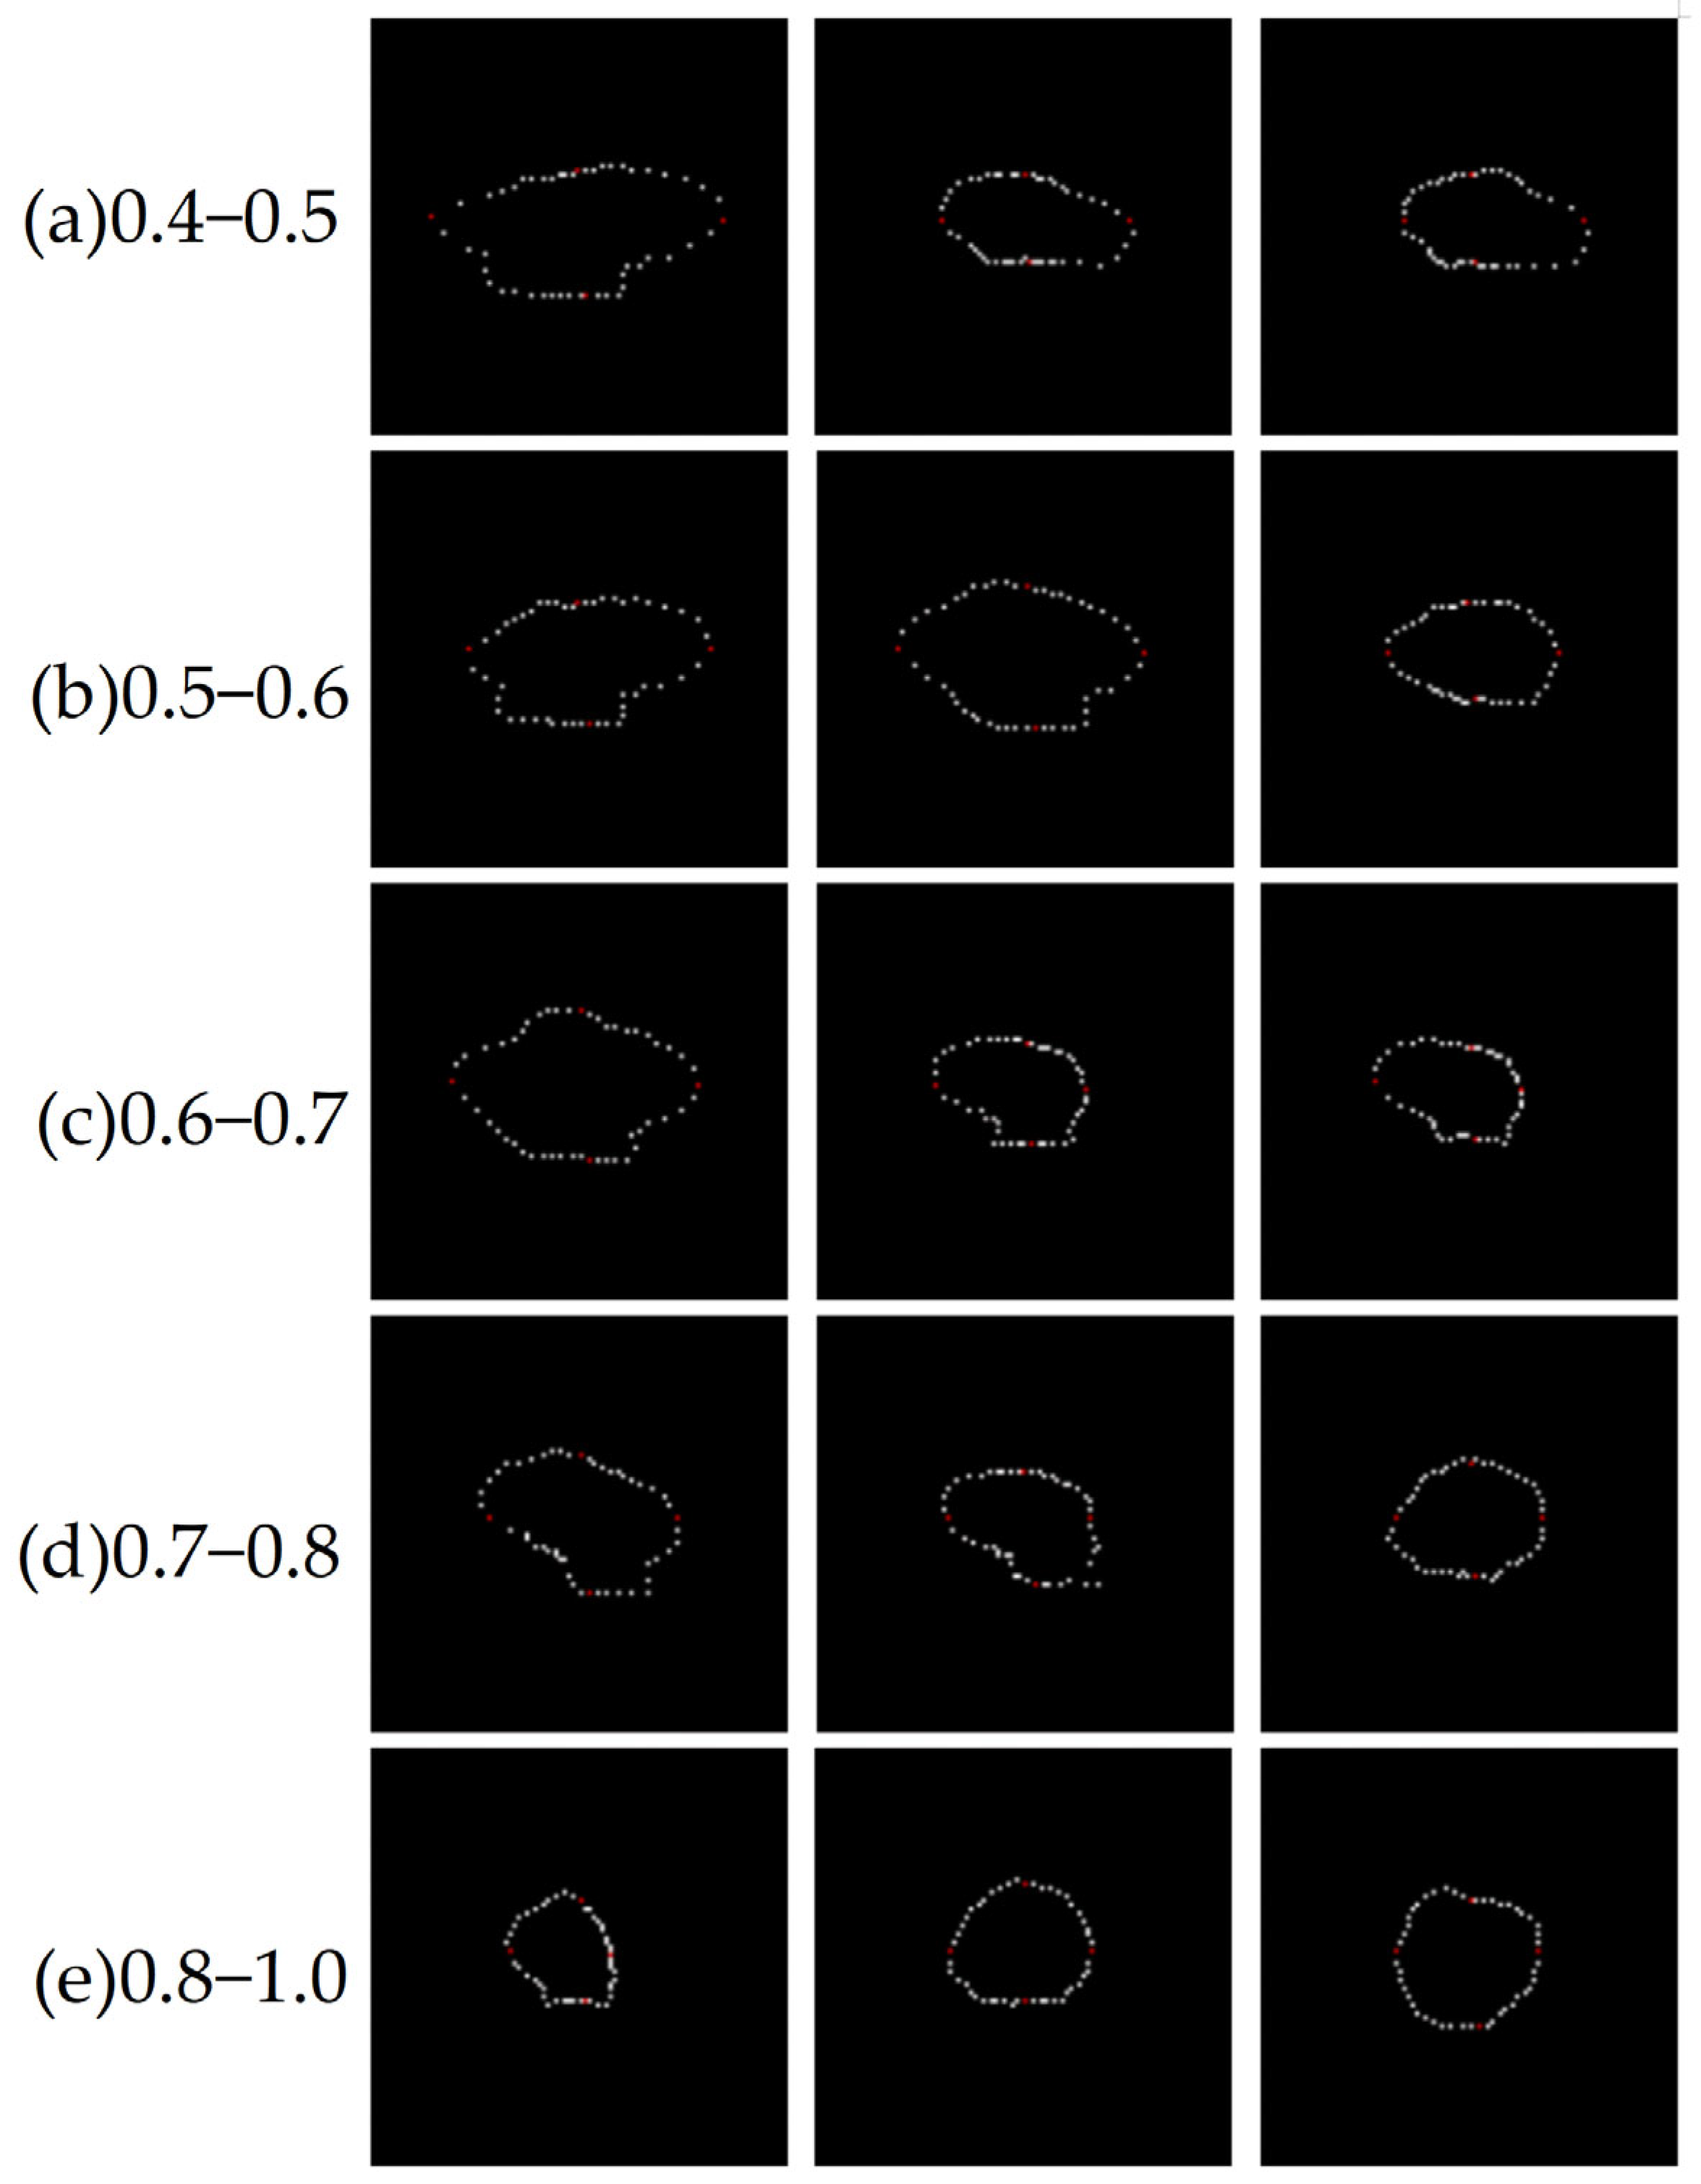
In this study, the aspect ratio is the ratio of the height of the lava tube to the distance between the rock walls on both sides, usually less than 1. Due to various factors, tunnels are typically excavated with an aspect ratio of 0.4 to 0.7. In contrast, lava tubes, which form naturally, have a wider range of aspect ratios due to the lack of human influence. The data for lava tubes used in this study has an aspect ratio ranging from 0.4 to 1.0. Since most lava tube cross-sections are nearly circular and have a relatively high aspect ratio, detailed classification is necessary to distinguish between different types of cross-sections. Therefore, high-length-to-width-ratio cross-sections were divided into finer segments, with each segment being 0.1 wide. All cross-sections were classified based on whether their aspect ratio was below 0.5, 0.5–0.6, 0.6–0.7, 0.7–0.8, or above 0.8, with the ratio increasing by 0.1 from 0.5 to 0.8. Cross-sections above 0.8 were grouped together due to their small number and minimal numerical differences. This study used the aspect ratio for structural classification, and different ratios can significantly affect the structural forces of lava tubes. In arch-like structures, the aspect ratio is a key geometric factor that determines the internal force distribution within the arch. The classification method ensures that all cross-sections in the data are covered, with a relatively even distribution of cross-sections across different categories, reducing similar cases among different categories and ensuring that cross-sections within the same category have similar structural characteristics.
4.2. Three-Dimensional Model Construction
This study focused on underground lava tubes, categorizing cross-sectional point cloud data based on their aspect ratio. From each category, a typical cross-section was selected based on its morphological similarity to the average shape within the group and its data completeness. This approach ensured that the selected models reflected the most common geometric configurations within the dataset while avoiding outliers or highly irregular shapes that could skew the results. The analysis was conducted using a method to create realistic 3D models, which can more intuitively illustrate the structural changes and deformation of lava tubes under force. For this study, SOLIDWORKS software was used to construct 3D models of lava tubes and the ground for each cross-section. The software version of solidworks was SOLIDWORKS(R) Premium 2024 SP5.0. Finite element analysis was performed on the models established in each category to quickly identify the weakest points of the lava tube structure. This software can create simple 3D models of ordinary mechanical parts and is compatible with various mechanical analysis software tools, enabling the analysis of more complex part structures. Since cross-sectional point cloud data represents a two-dimensional plane and cannot depict three-dimensional structures, and considering the need to study ground forces, the key aspects to consider in this modeling are as follows:
- (1)
Convert the two-dimensional section into a three-dimensional section model.
- (2)
Convert the point cloud data into a section model that can support finite element analysis.
- (3)
The section model not only contains the section structure of the lava tube but also can be connected with the surface, which can reflect the change in the internal structure of the lava tube when the surface is stressed.
The cross-sectional point cloud, which is a projection of two-dimensional points onto a plane, has three-dimensional coordinates but cannot be directly modeled into a pipeline-like structure. Direct modeling of the two-dimensional point cloud only results in a two-dimensional surface, not the tubular structure of a lava tube. Simply increasing the thickness of the surface to create a three-dimensional object for analysis does not adequately represent the impact of ground forces on the cross-sectional structure. Therefore, this study employed a rectangular model with the middle part of the lava tube hollowed out, using linear fitting to reconstruct the true shape of the lava tube cross-section based on the cross-sectional point cloud. A three-dimensional model with a certain width and a hollow middle part of the ground was established based on the actual measured height of the pipeline above ground. This model was then used to simulate the structural conditions of the real lava tube after it has been subjected to forces.
The specific modeling process is illustrated in
Figure 3. The procedure began with importing the necessary cross-sectional point cloud data, followed by the establishment of a coordinate system directly on the data. Linear fitting was then applied to define the cross-sectional geometry. Next, the positional relationship between the cross-section and the rock layers and the ground was determined on the plane of the cross-section, and the outer shape of the model was constructed. Based on this, a complete three-dimensional structure was generated, with lava tube channels excluded to finalize the real-scene 3D model.
When modeling, after importing the section point cloud data, it was necessary to establish the coordinate system and calculate the three-dimensional direction of the point cloud. Taking the center of mass of the point cloud as the coordinate origin, the formula for calculating the center of mass of the point cloud is as follows:
Using this formula, the origin of the coordinate system could be determined. Then, two points were selected in the point cloud to define two axes (X, Y, or Z), respectively, so as to determine the direction of the three axes. The establishment of the coordinate system could determine the relative orientation of the section to the ground, providing a basis for subsequent modeling and mechanical analysis.
This study then used linear fitting to simulate the boundary section of the lava tube. The extracted point cloud from the original data served as the boundary points for the section. A spline curve fitting method could be used to connect these points based on the point cloud data, thereby determining the shape of the section. NURBS is a non-uniform rational B-spline, which is a modeling method for curved objects. The formula for fitting the NURBS curve to the boundary of the lava tube is as follows:
It is important to note that when determining the shape curve of the section at the connection boundary points, the complexity of the section shape could lead to varying degrees of fitting for different curve formulas. When closing the curve, different suitable curve formulas could be chosen to fit as closely as possible to the boundary points, accurately reproducing the section shape. A more accurate section shape could lead to more precise final analysis results.
It should be noted that when using solidworks software to create an outer profile model on the outside of the lava tube to establish the relationship between the underground lava tube and the ground, it is necessary to establish a new plane to construct the outer contour plane, so that the outer profile plane and the profile point cloud are established in the same plane, so as to determine the values between the ground and the lava tube.
When building the model, it is necessary to determine the directional relationship between the lava tube and the ground, so as to ensure that the ground position is the top surface of the model. In the subsequent analysis of the effect of depth on the amount of deformation, the shape of the model can be changed by changing the distance from the ground to the lava tube, so as to achieve the effect of different depths on the same lava tube. In this process, we extracted multiple cross-sections from different locations along the lava tube and independently modeled the same cross-section at different depths to reflect the impact of depth.
After the outer contour shape was determined, the width of the fixed section model was fixed, and the three-dimensional model containing the section shape was generated. In the three-dimensional model, the section shape was removed to form a hollow real section model.
After the model was established, the accuracy of the model and the section point cloud was evaluated to confirm the error between the model and the real lava tube section. The final model error is shown in
Table 2. The spatial resolution of the raw point cloud reaches up to 0.1 μm. In real-world field applications, factors such as instrument noise, surface reflectivity, and environmental disturbances can reduce effective resolution. Therefore, during the modeling process, we applied a filtering and averaging strategy to ensure that the final surface geometry reflects realistic and reliable accuracy.
4.3. Finite Element Analysis
Currently, the study of lava tube structures still faces many limitations. For instance, due to various uncertainties such as the formation causes and locations of different lava tubes, it is difficult to determine the actual rock properties that constitute these tubes. It is also not possible to summarize the overall structural properties of lava tubes based on a single rock property. The mechanical properties of lava tube rocks significantly influence their structural stability, and obtaining samples from each lava tube is necessary for an accurate determination of its structure. This study has only established a simple three-dimensional model with a single rock property for the cross-sections of classified lava tubes. In the research, this study used the static structure function of ANSYS software for finite element analysis. The software version of ANSYS is 2022R1 and the file version is 22.1.0.20211111419. ANSYS software can perform relatively intuitive and visual mechanical analysis of the model. Due to hardware limitations, excessively high mesh accuracy will result in prolonged runtime during the process of assessing the impact of depth on deformation due to model size issues, and may exceed the equipment’s processing capacity. To facilitate comparison among results, this study adopts a uniform mesh accuracy of 0.5 m. To prevent the model from sliding, the bottom of the lava tube cross-section model was set as a fixed support. The walls of the lava tube caves are formed by the cooling of magma flow and are composed of basalt. Due to the differences in the formation process, various parameters of basalt vary significantly. This study selected dense, low-porosity basalt properties for research, and the specific mechanical properties of the basalt used in the model are listed in
Table 3.
The mechanical properties of lunar basalt remain poorly constrained due to limited in situ sampling. The mechanical properties of lunar basalt remain poorly constrained due to limited in situ sampling. This study adopts dense terrestrial basalt as a representative material. While this choice introduces simplification, it serves as a reasonable baseline. Lunar basalt may have higher porosity and lower cohesion due to environmental conditions such as thermal fatigue and micrometeoroid bombardment, potentially reducing its load-bearing capacity [
38]. Once direct measurements become available, the proposed framework can be recalibrated to reflect true lunar rock behavior. Therefore, this study provides a foundational evaluation, with results serving as an upper-bound estimate for structural stability.
Research on tunnels and other engineering projects shows that as the aspect ratio decreases, the settlement of the surrounding rock’s arch and the surface settlement increase, while horizontal convergence decreases. This indicates that the flat structure weakens the tunnel’s ability to support vertical loads but enhances the resistance of the tunnel arch and walls to the horizontal convergence of the surrounding rock towards the interior of the tunnel. Tensile stress in the surrounding rock of the tunnel is mainly distributed above the tunnel and in the invert, while compressive stress is concentrated in the arch wall and the arch foot. As the aspect ratio decreases, the risk of tensile failure in the surrounding rock above the tunnel increases, and the area where compressive stress is concentrated at the arch foot and arch wall increases, making the surrounding rock at these points more susceptible to shear failure under compressive stress [
39]. The aspect ratio and cross-sectional shape of underground tunnels jointly determine the structural stability of the lava tube, and these two factors also influence each other, making it difficult to distinguish between them completely. This study classified different lava tube cross-sections based on their aspect ratio, primarily investigating the impact of the aspect ratio on the structural forces of the lava tube, and pointed out that other factors such as shape and depth may affect the regular changes in the structure of the lava tube.
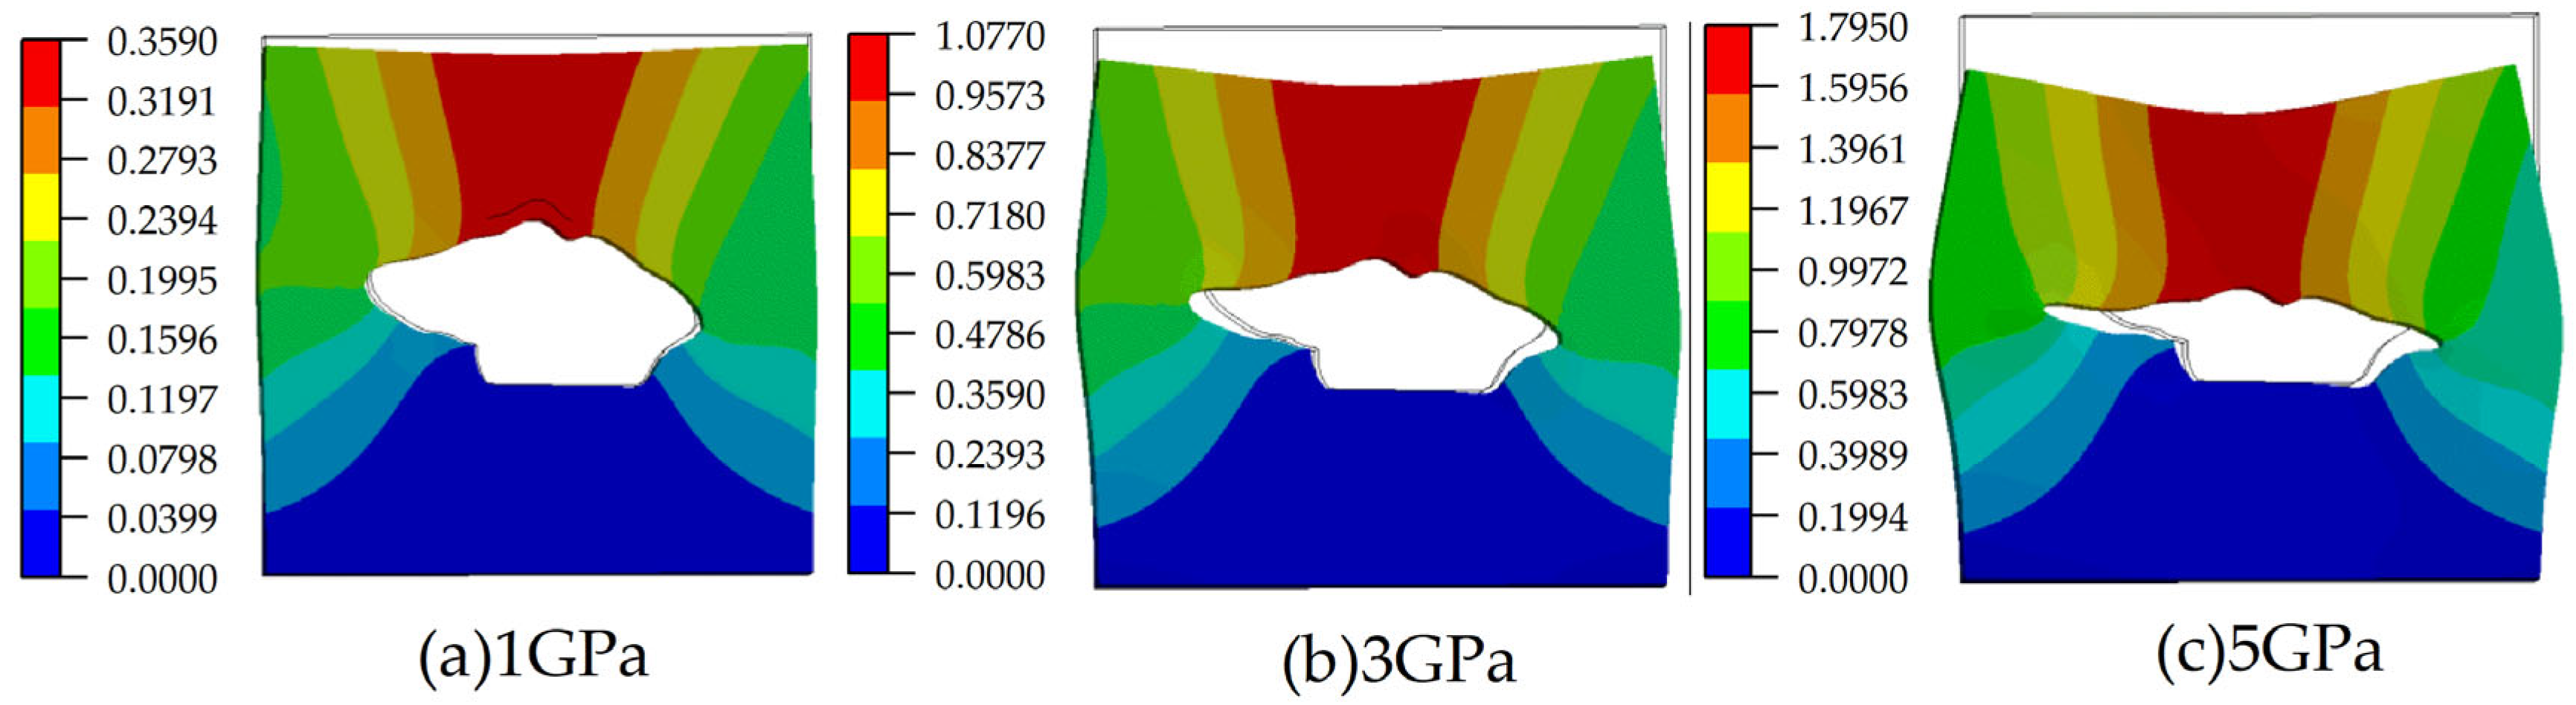
This study primarily investigates the impact of meteorite impacts on lava tube structures, with the model’s primary force being the surface force. The research indicates that the instantaneous impact pressure caused by meteorite impacts ranges from several GPa to hundreds of GPa, depending on the meteorite’s impact speed and its mineral content, mass, density, and other properties [
40]. Although real impact events involve highly dynamic loading with pressure–time curves characterized by rapid rise and decay, another studies have shown that peak transient pressures can reach the order of several gigapascals depending on impactor size, velocity, and target material properties [
41,
42]. This study did not consider the meteorite’s physical attributes but only performed a simple analysis on the cross-sectional model under basic mechanical conditions. In structural analysis, it is common to use an equivalent static pressure to approximate the peak stress region generated during such impacts [
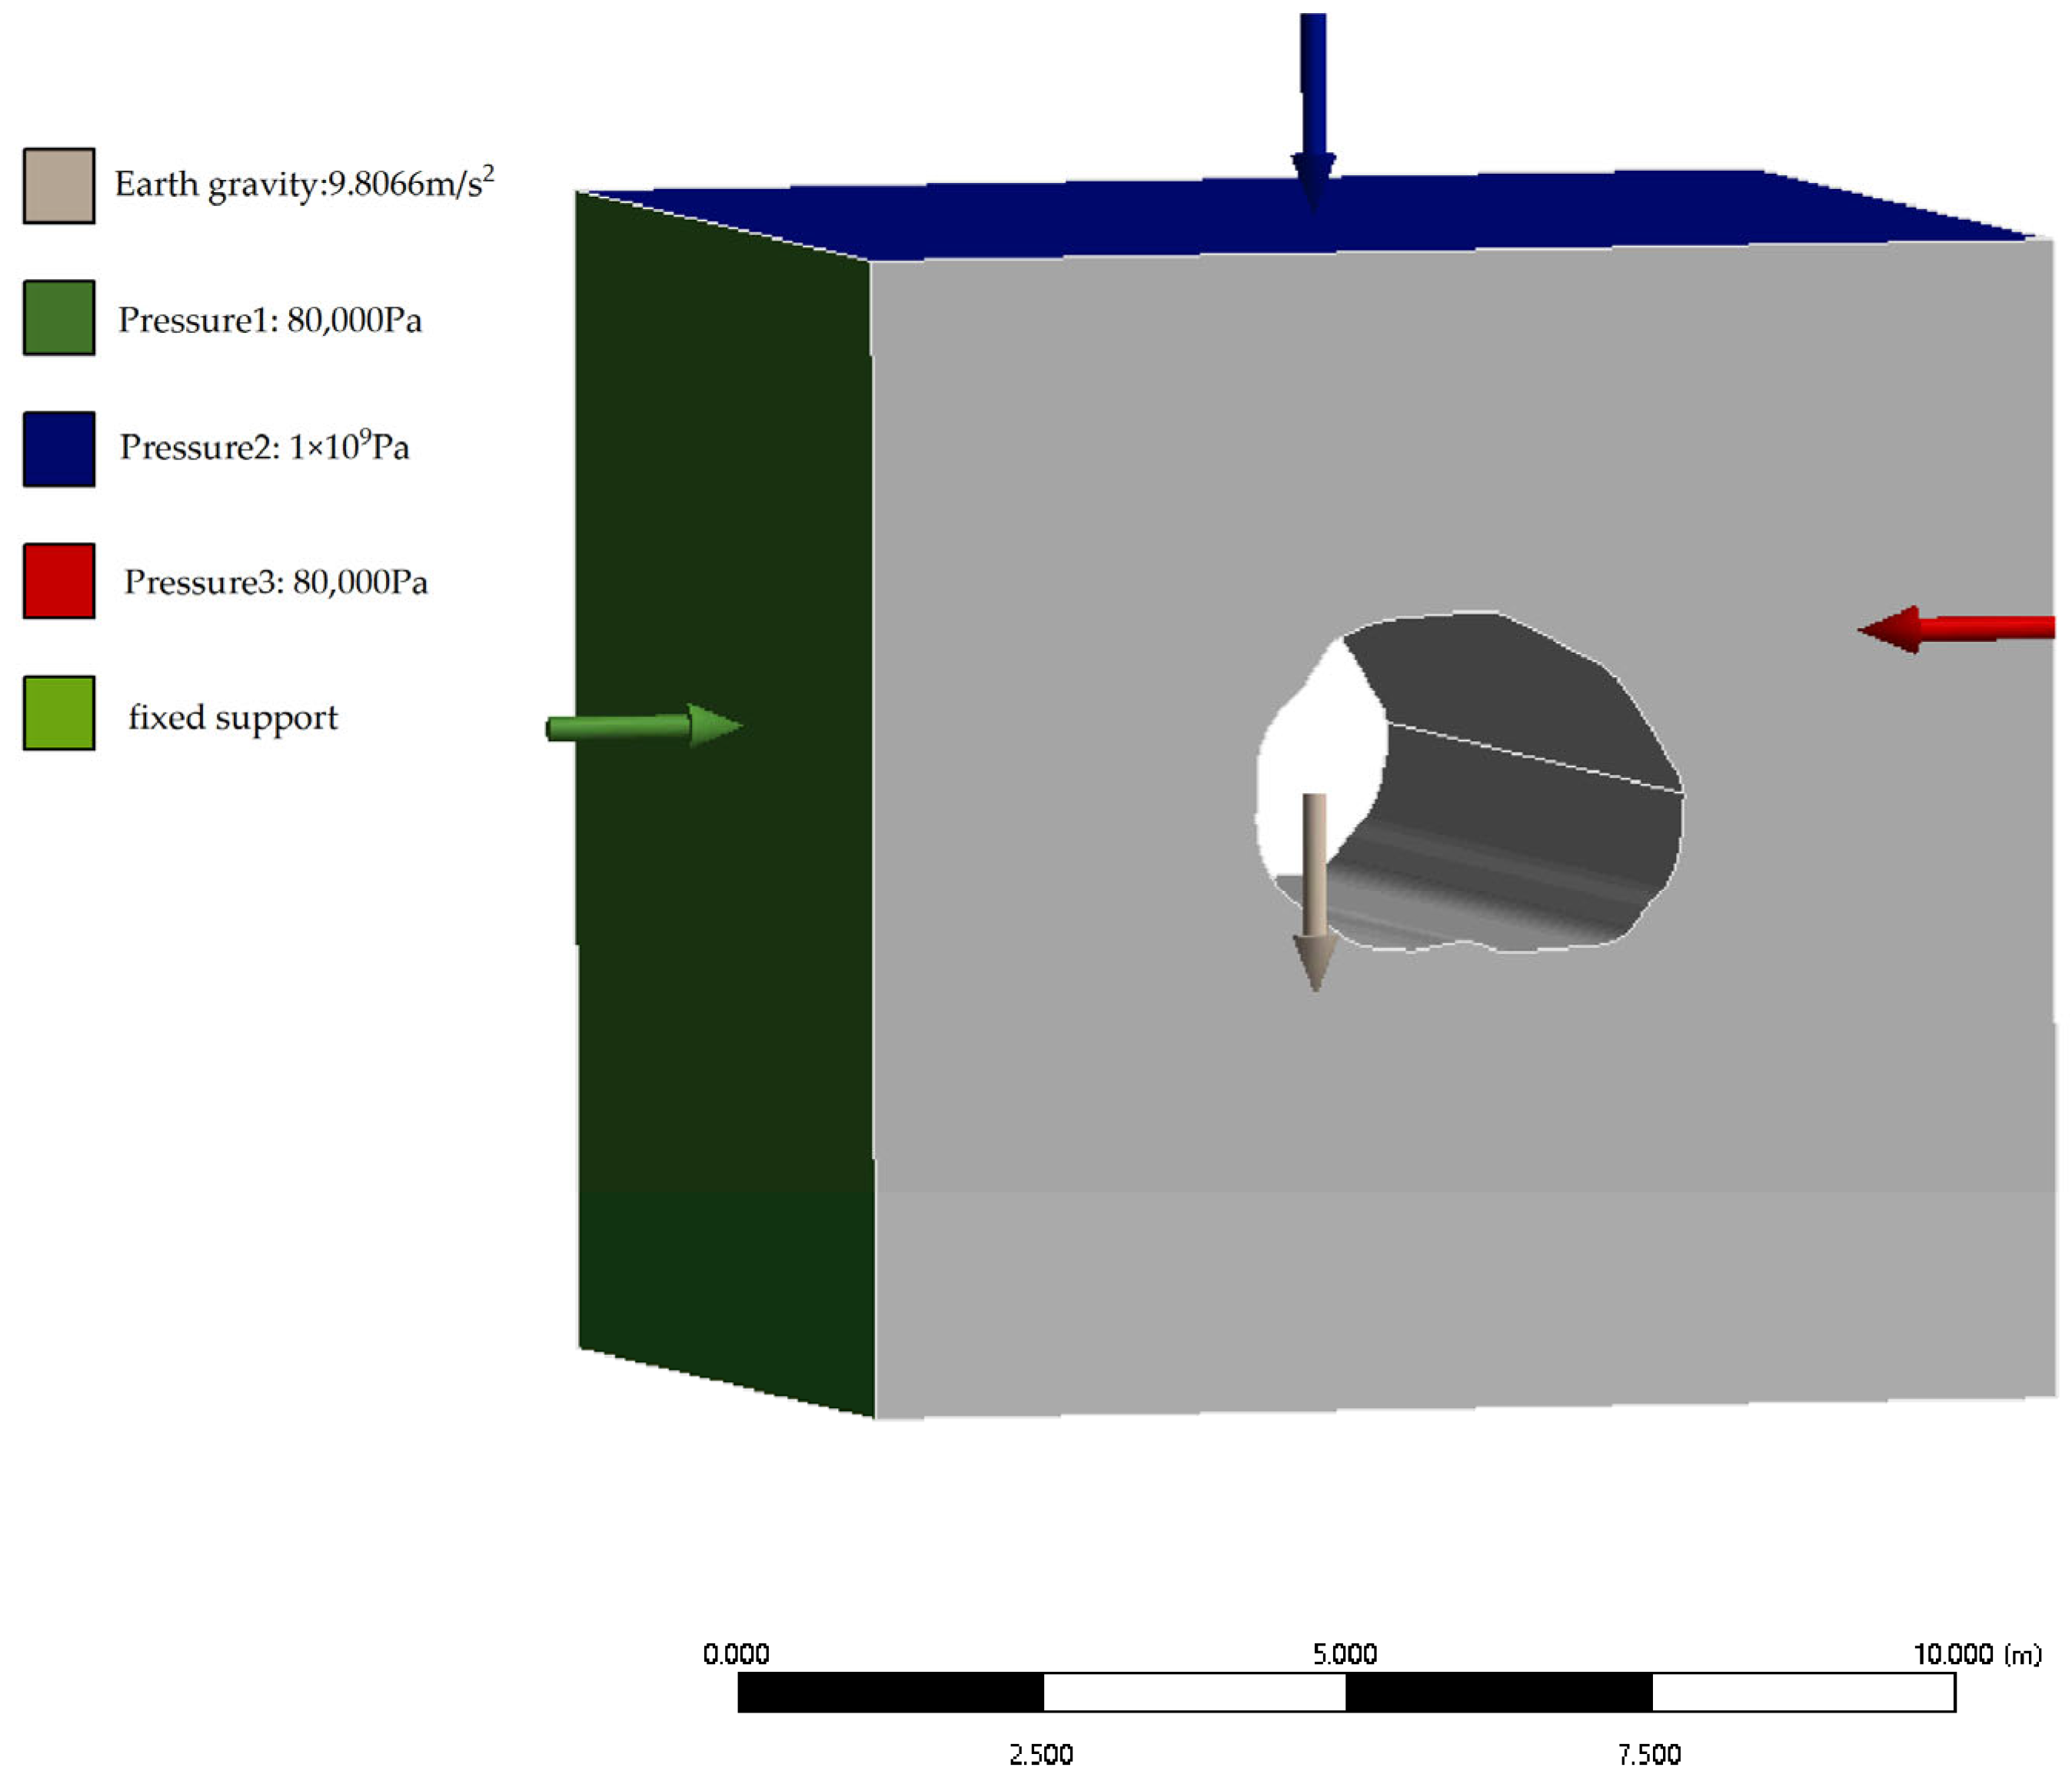
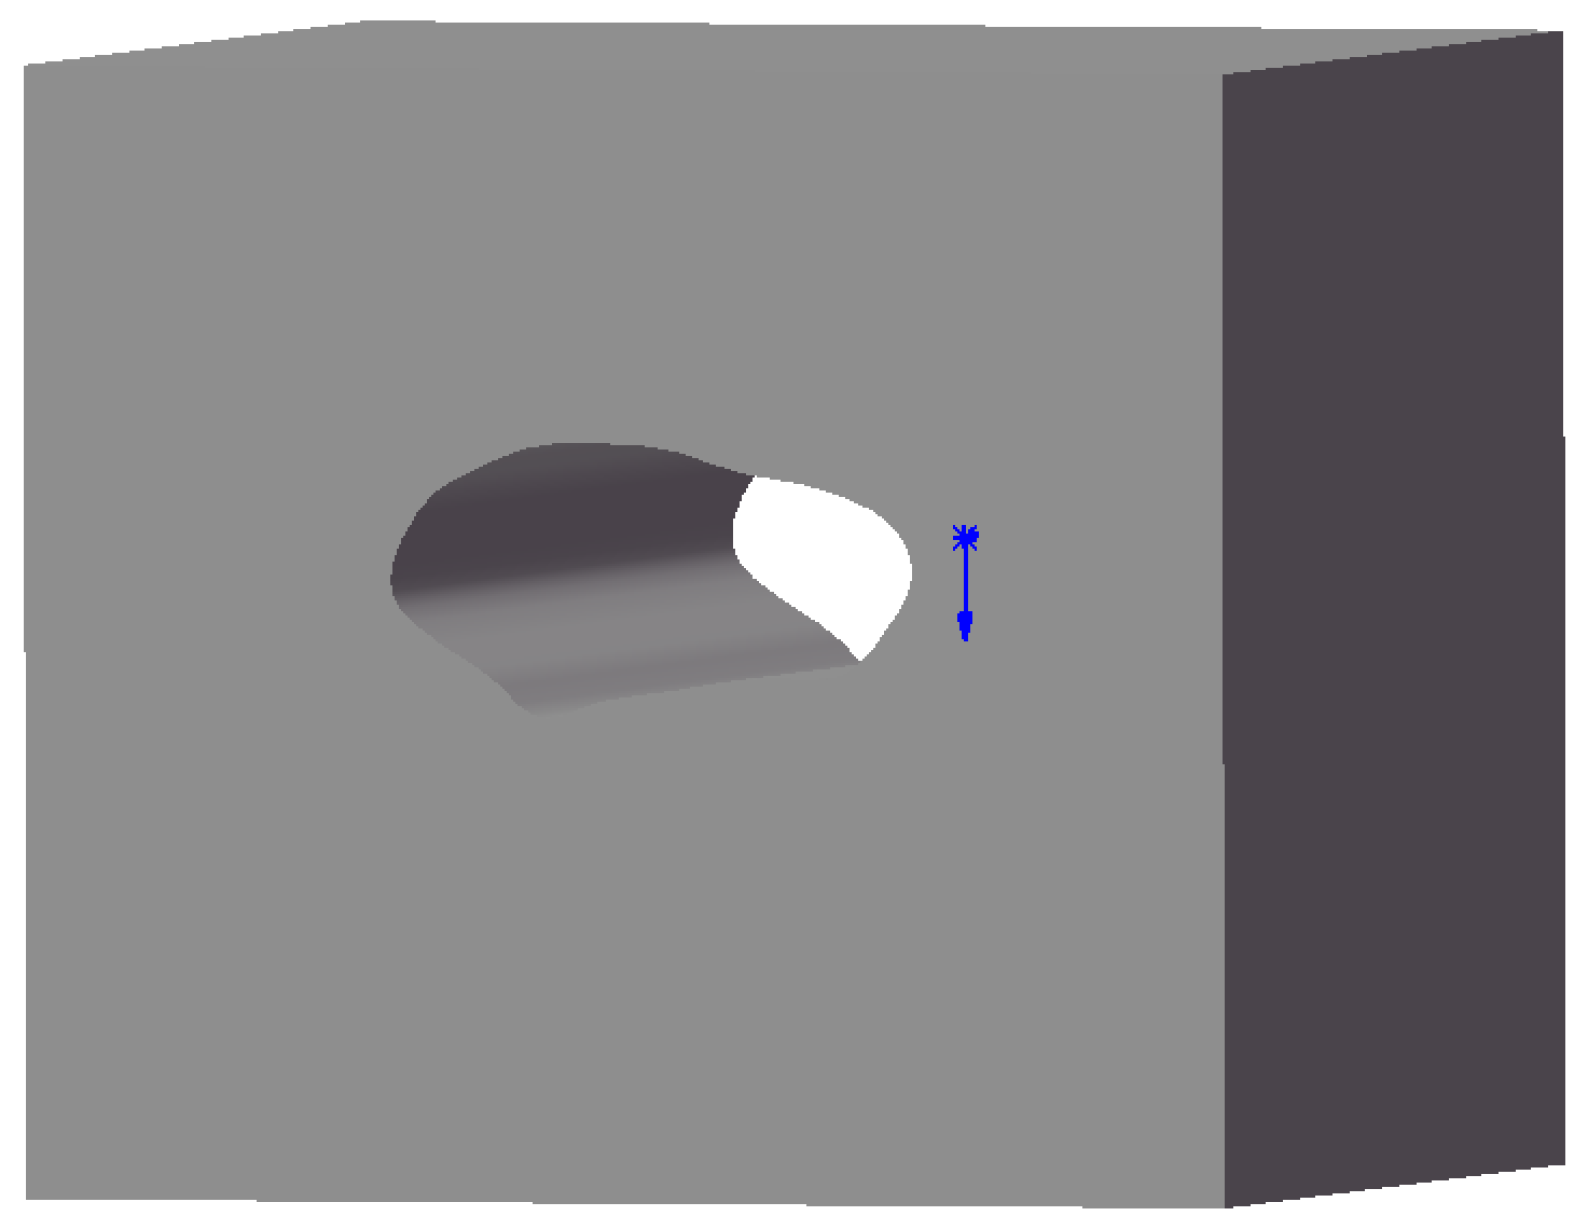
43]. Therefore, the ground was subjected to downward pressure to simulate the force from meteorite impacts. Given the small size of the lava tubes and their location in shallow layers, using excessive impact forces could cause significant deformation in the model, leading to ineffective data collection and unvaluable conclusions during simulation and analysis. Thus, this experiment applied a 1 GPa force to the ground to simulate the impact force experienced by extremely small meteorites or the upper surface of lava tubes at the edge of meteorite impacts, thereby studying the impact on lava tube structures. The value of 1 GPa was selected as a conservative but physically reasonable estimate to examine structural response under extreme but plausible loading scenarios. Since lava tubes are underground, the static rock pressure and structural stress from surrounding rock formations must also be considered. The formula for the pressure of the overlying rock layer on the lava tube is as follows:
Using this formula to estimate the compressive force exerted by the surrounding rock layers on the lava tube, σ represents the pressure of the rock layer, γ denotes the unit weight of the rock, with igneous rocks typically ranging from 25 to 30 kN/m
3, and h is the thickness of the rock layer. The calculation showed that the pressure of the overlying rock layer is approximately 90 kPa. This force was relatively small compared to the simulated meteorite impact pressure and had a minimal effect on the experimental results, so it was not considered in this experiment. The lateral pressure of the rock is about 0.5 to 1.5 times that of the overlying rock layer. In this study, a numerical value of 80 kPa was applied to both sides of the model to simulate the lateral pressure of the rock on the lava tube, thereby simulating the horizontal lateral pressure’s effect on the lava tube. Additionally, the influence of Earth’s gravity was included in the model to simulate real-world conditions. The bottom of the model is a fixed support to prevent the model from shifting. The specific force distribution in the model is shown in
Figure 4.
After simulating the effects of these forces on the lava tube, the deformation and stress distribution were analyzed to understand how different parts of the lava tube structure would respond to surface impacts. The stability of the lava tube’s structure and its overall distribution were assessed through the deformation measurements.
6. Discussion
6.1. The Effect of Real Geometric Shape on Stability
The simulation results by Modiriasari et al. [
5] using idealized models suggest that the deformation of lava tube structures increases as the aspect ratio decreases. However, the findings of the present study deviate from those results, as well as from the optimal aspect ratio range of 0.4–0.7 commonly used in underground tunnel excavation. Additionally, our results differ from those reported by Marcin Chwała et al. [
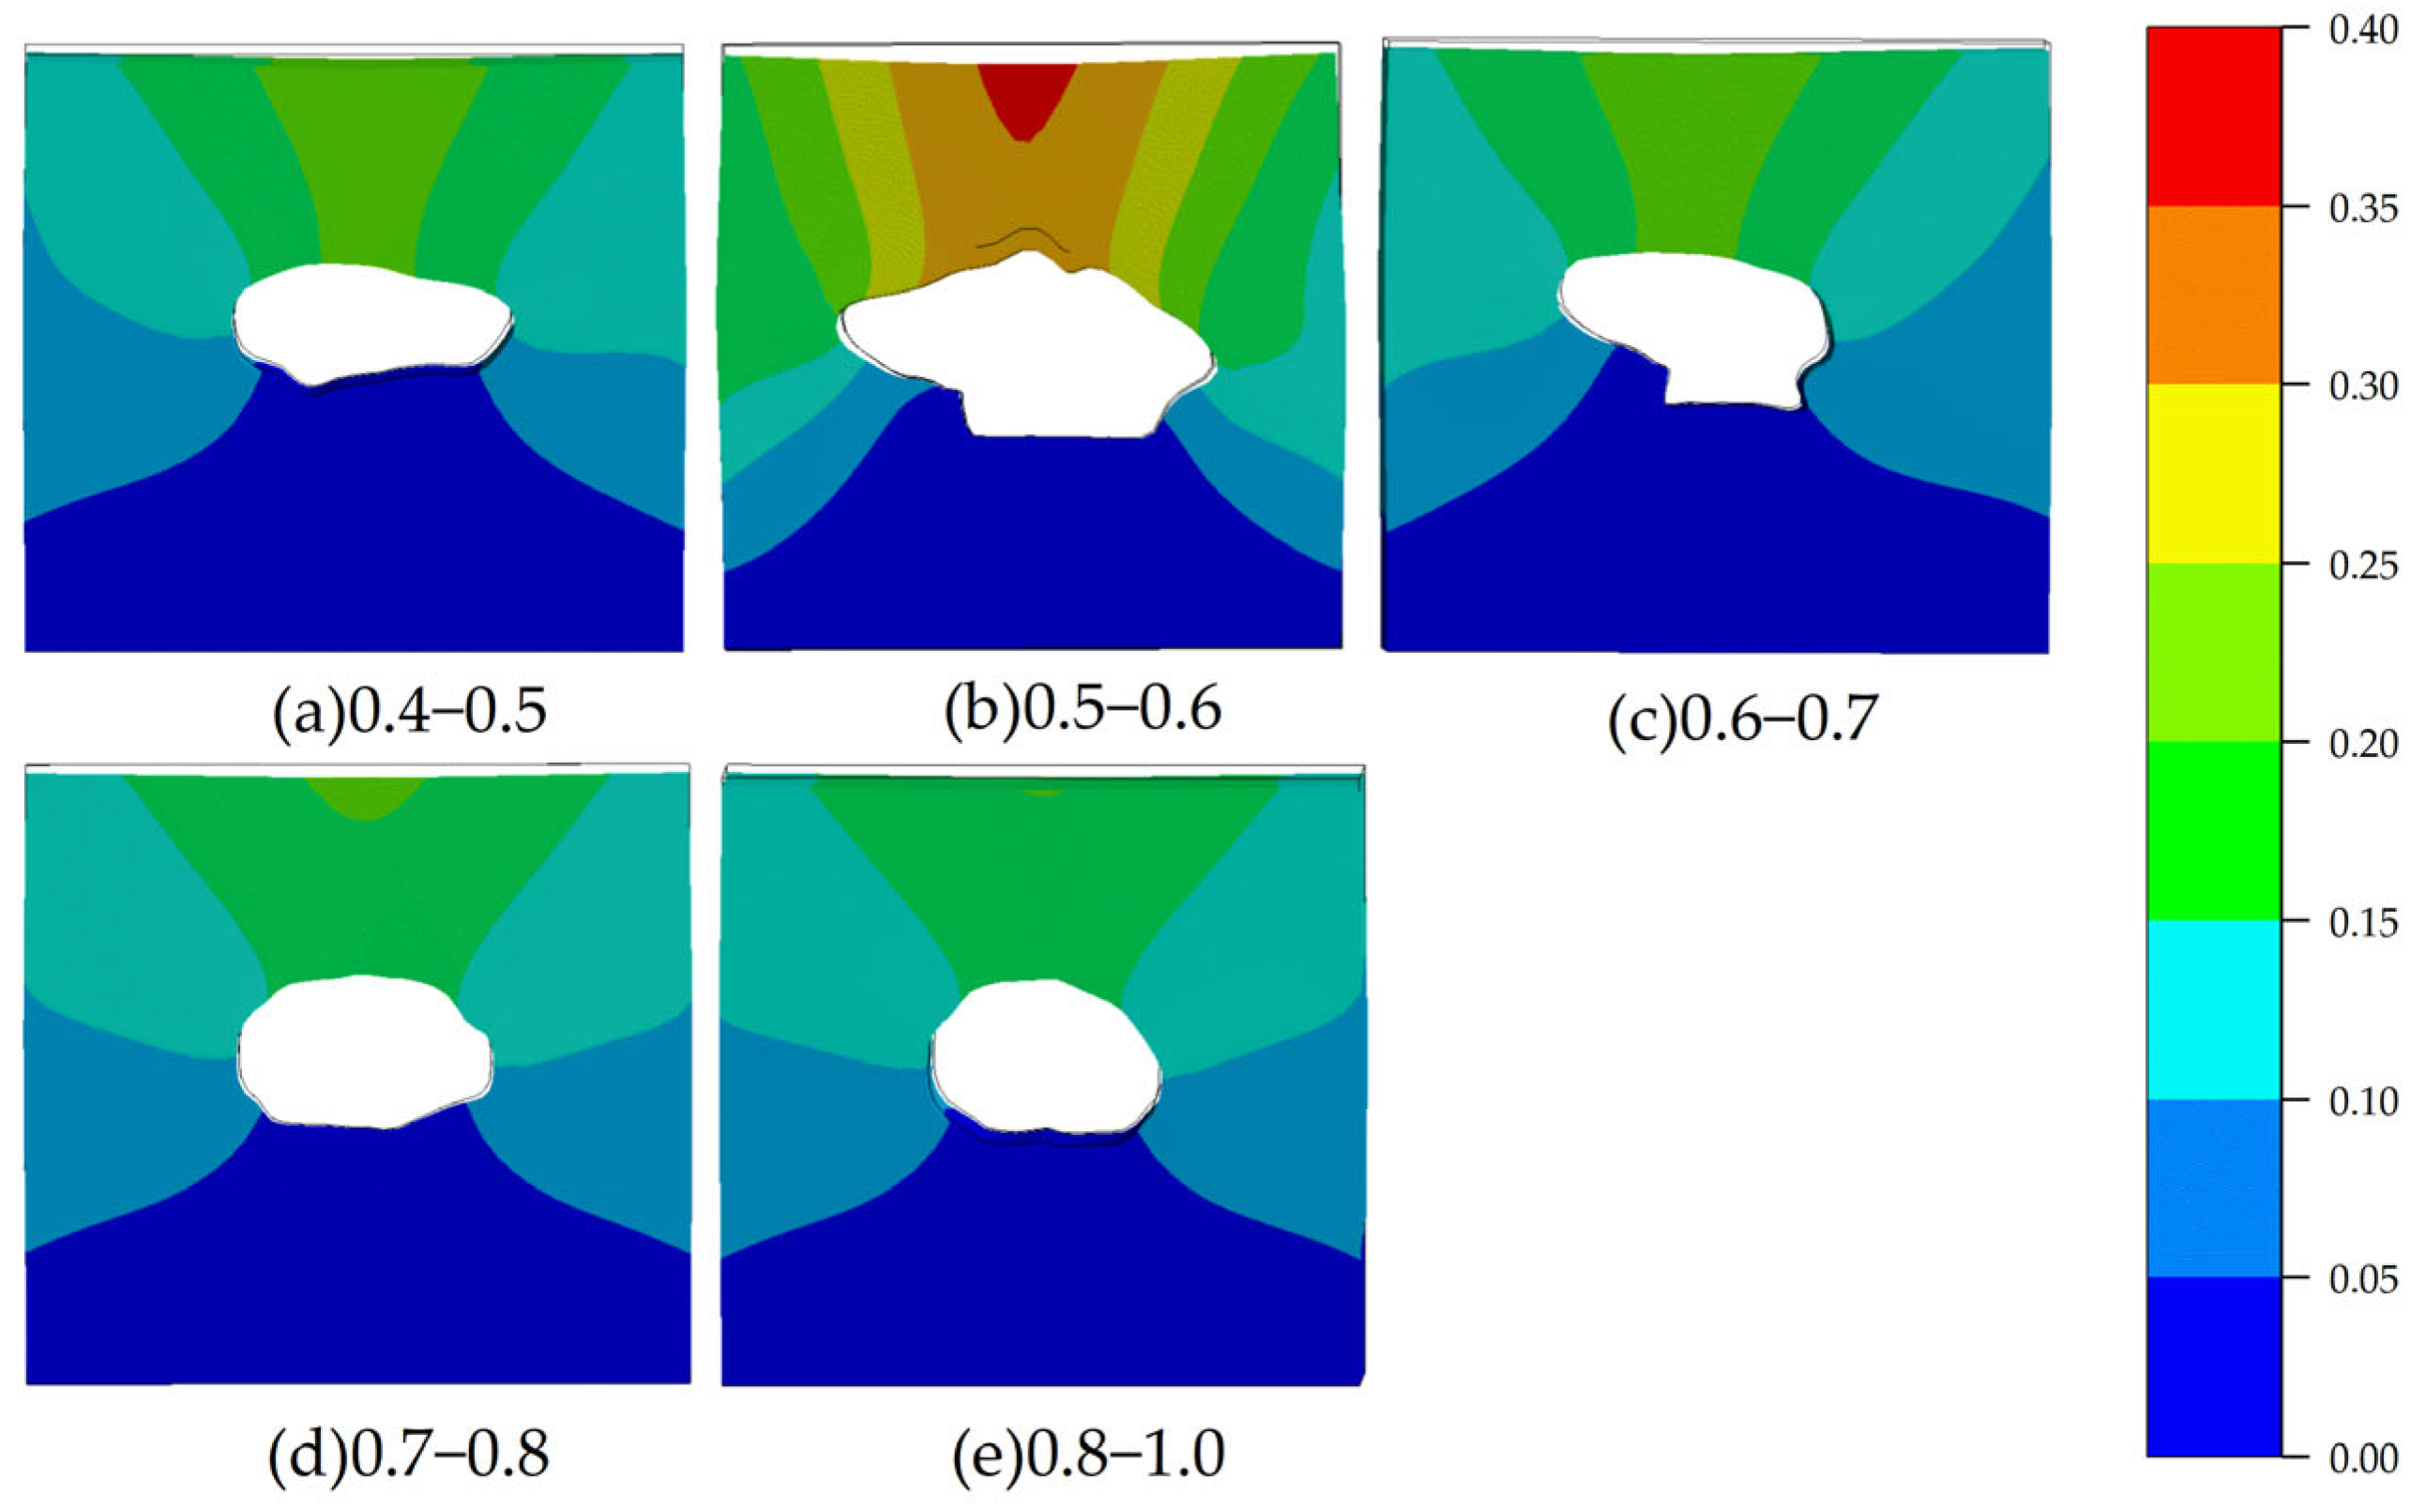
7], who also employed idealized geometries. In contrast, this study finds that lava tubes exhibit the greatest deformation when the aspect ratio falls between 0.5 and 0.6.
Upon comparison with other tunnel models, several reasons emerge for this discrepancy. First, this study uses the actual cross-sectional morphology of a lava tube, which has a substantial influence on structural behavior. Certain irregular or complex shapes can significantly alter stress distribution and deformation characteristics, requiring special consideration. Unlike the idealized semi-elliptical or circular models used by Blair [
2], Modiriasari [
5], and Theinat [
6], this study simulates a nearly circular but irregular cross-section based on real-world morphology, resulting in behavior not observed in ideal models.
When the aspect ratio is less than 0.5, the span of the lava tube increases. However, due to the natural formation of lava tubes, such configurations are associated with taller cave walls and smaller curvature, resembling vertically oriented structures. These provide greater structural support, making them more resistant to surface pressure. In contrast, at an aspect ratio between 0.5 and 0.6, the walls tend to exhibit central bulges and higher curvature, which reduce load-bearing capacity, making the structure more susceptible to folding and deformation. When the aspect ratio exceeds 0.6, the cross-sectional geometry becomes more regular and resembles a semi-ellipse, providing enhanced support and allowing the structure to better withstand external forces.
Furthermore, the nature of the loading conditions in this study differs fundamentally from those in conventional tunnel analyses, such as those by Marcin Chwała et al. [
7]. This study focuses on simulating the instantaneous surface pressure generated by meteorite impacts, which primarily affects the top of the lava tube. In contrast, tunnel design typically considers sustained internal pressure from surrounding rock or fluids, which acts omnidirectionally. These differing loading environments result in different structural response patterns and explain the variation in aspect ratio associated with maximum deformation.
Through the comparison of idealized and real-shape models, this study confirms that the generalized conclusions derived from ideal models may not fully apply to real-world lava tubes due to environmental and geometric complexities. The use of real-shape models reveals nuanced structural behaviors that are otherwise overlooked, providing a more accurate basis for evaluating stability under extraterrestrial conditions. Compared to conventional approaches based on simplified geometries and uniform loading conditions, the methodology employed in this study demonstrates superior performance in capturing the authentic mechanical response of lava tubes. By integrating real morphological data into finite element simulations and replicating impact-driven surface loads reflective of extraterrestrial environments, this approach enables more realistic and precise stability assessments. It not only identifies critical deformation zones with greater fidelity but also accounts for stress responses absent in idealized models, thereby offering enhanced applicability for mission planning, lunar habitat placement, and long-term structural risk evaluations in planetary exploration.
6.2. Verification of Universal Laws
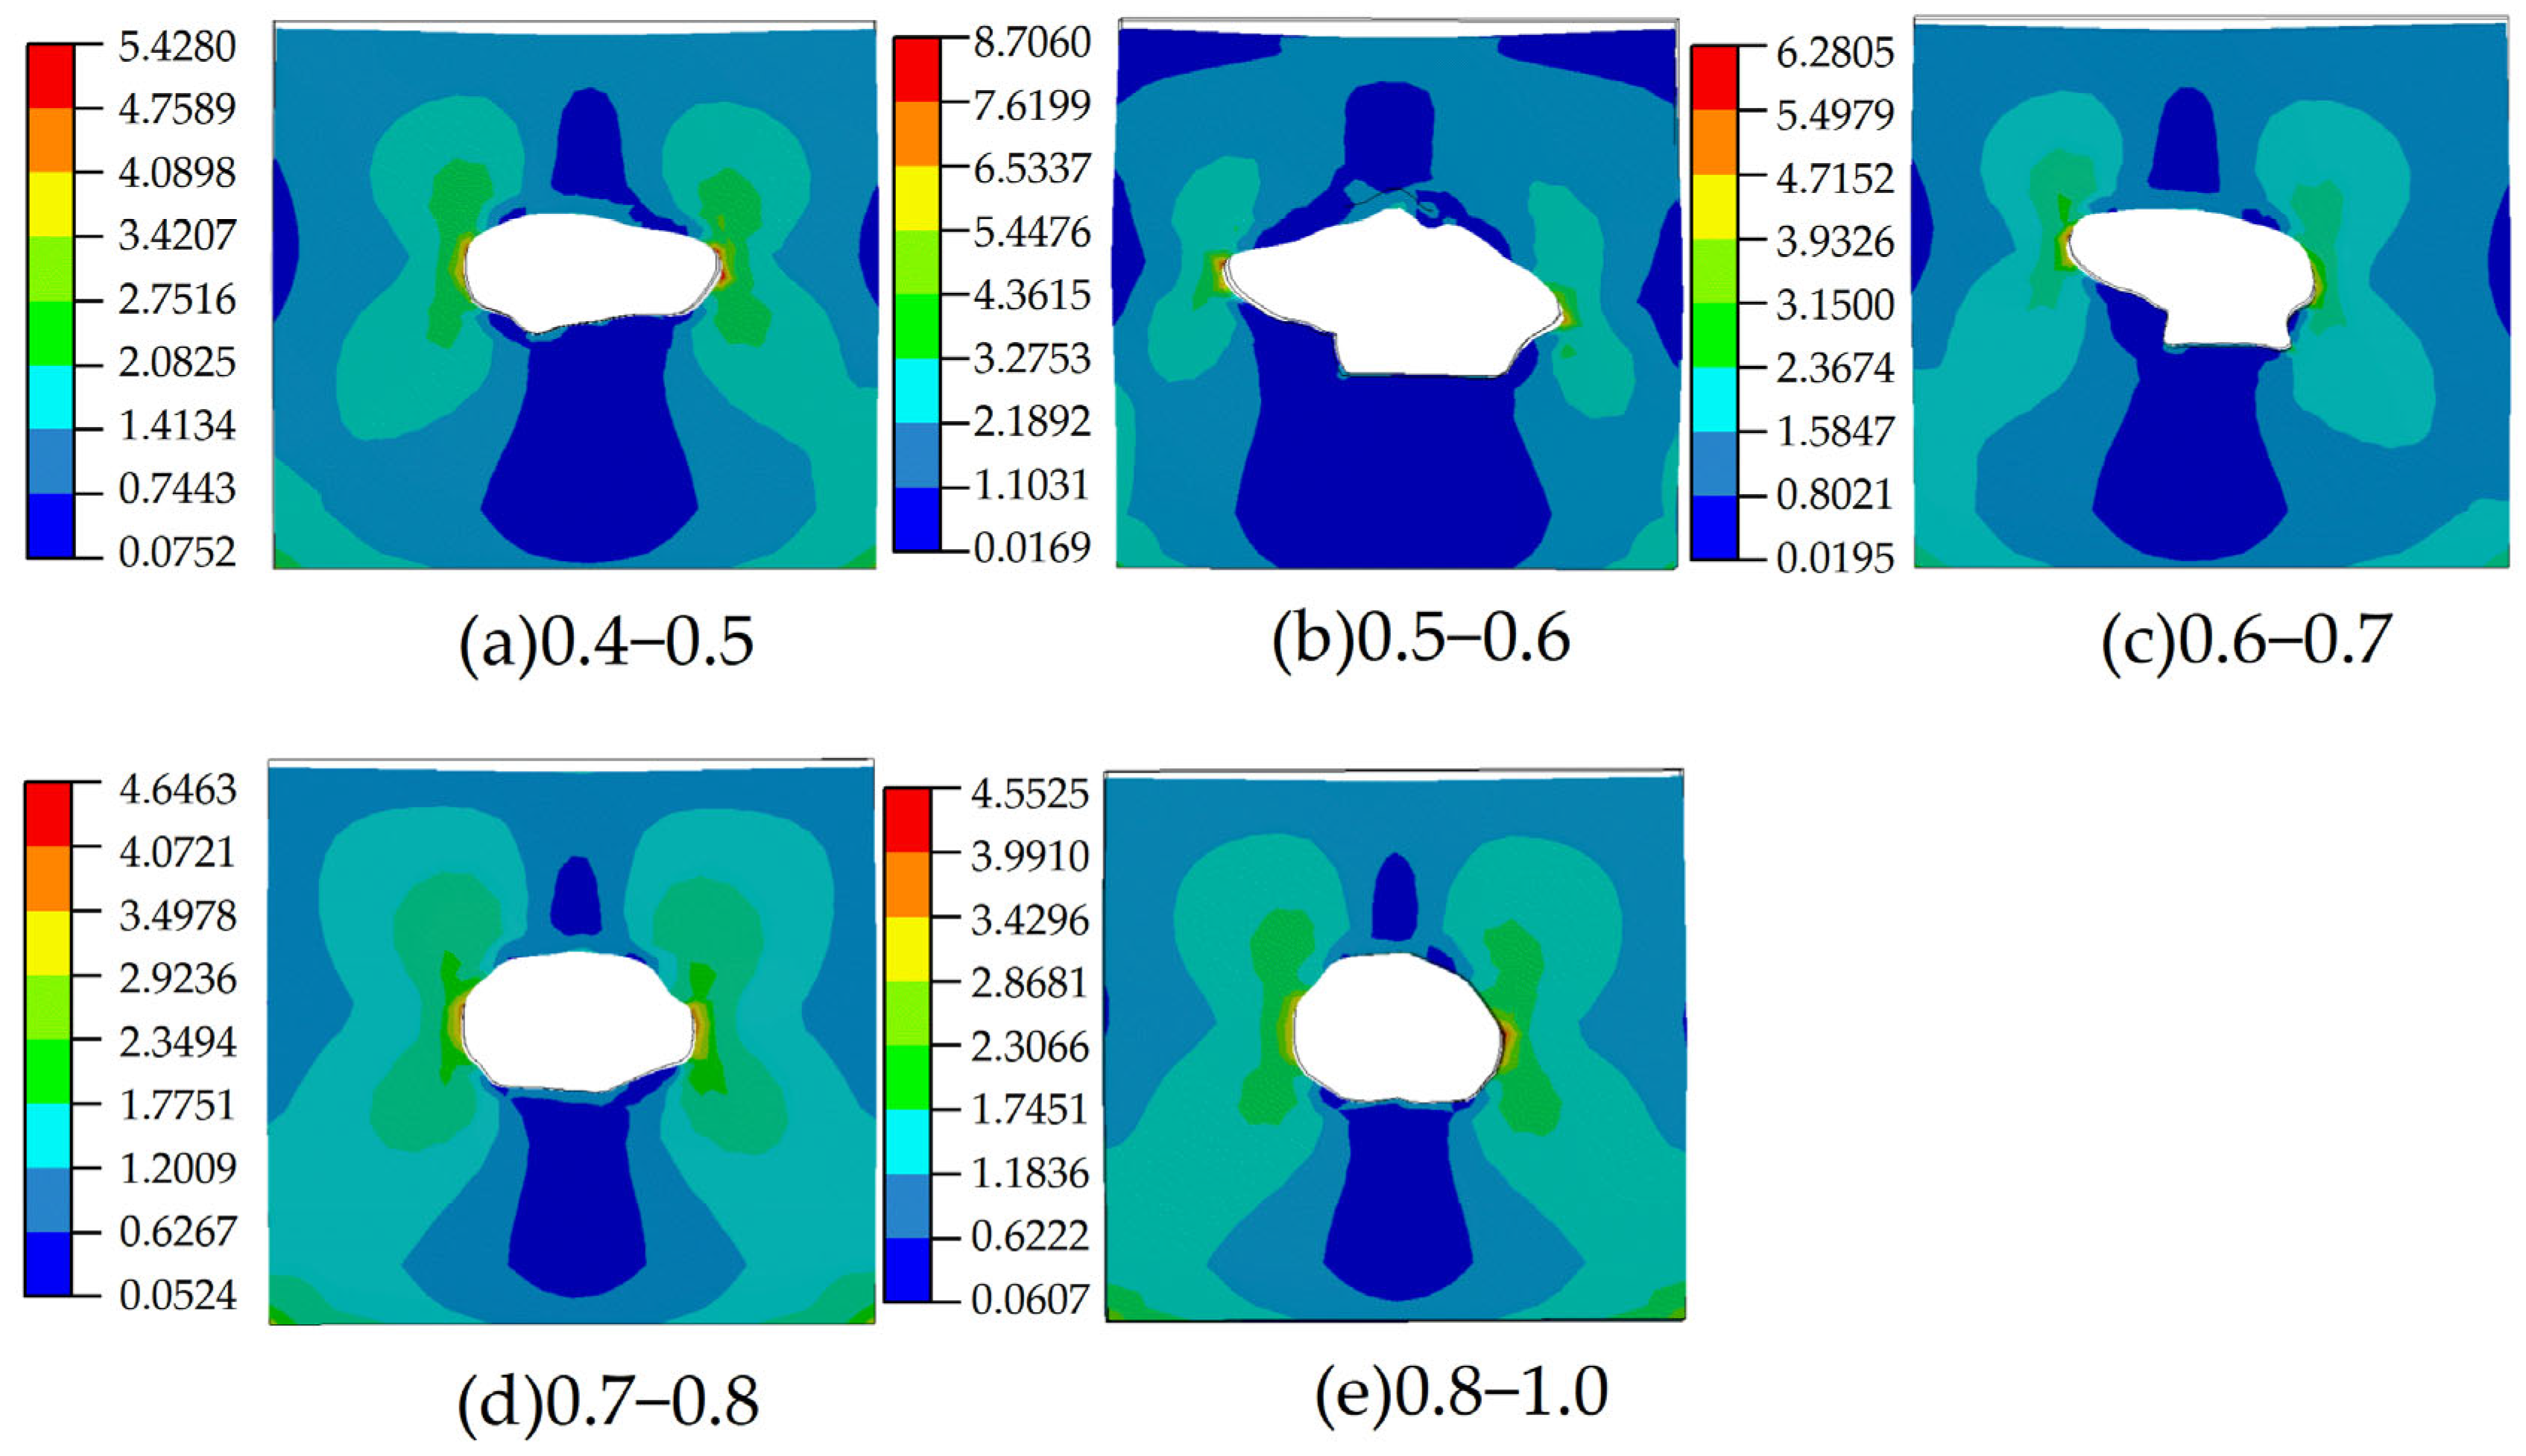
This study validates the generalized structural stability laws proposed in previous research by applying real-shape models of lava tubes. The results confirm that the aspect ratio of lava tubes is a critical geometric factor influencing their structural performance. As the aspect ratio increases, deformation and equivalent stress decrease significantly, indicating enhanced structural stability.
In particular, when the aspect ratio exceeds 0.8, the lava tube structure shows a clear reduction in deformation and a more balanced stress distribution. These results are in strong agreement with earlier studies based on idealized semi-elliptical or circular cross-sections, supporting the general conclusion that higher aspect ratios lead to improved load-bearing capacity and lower risk of collapse.
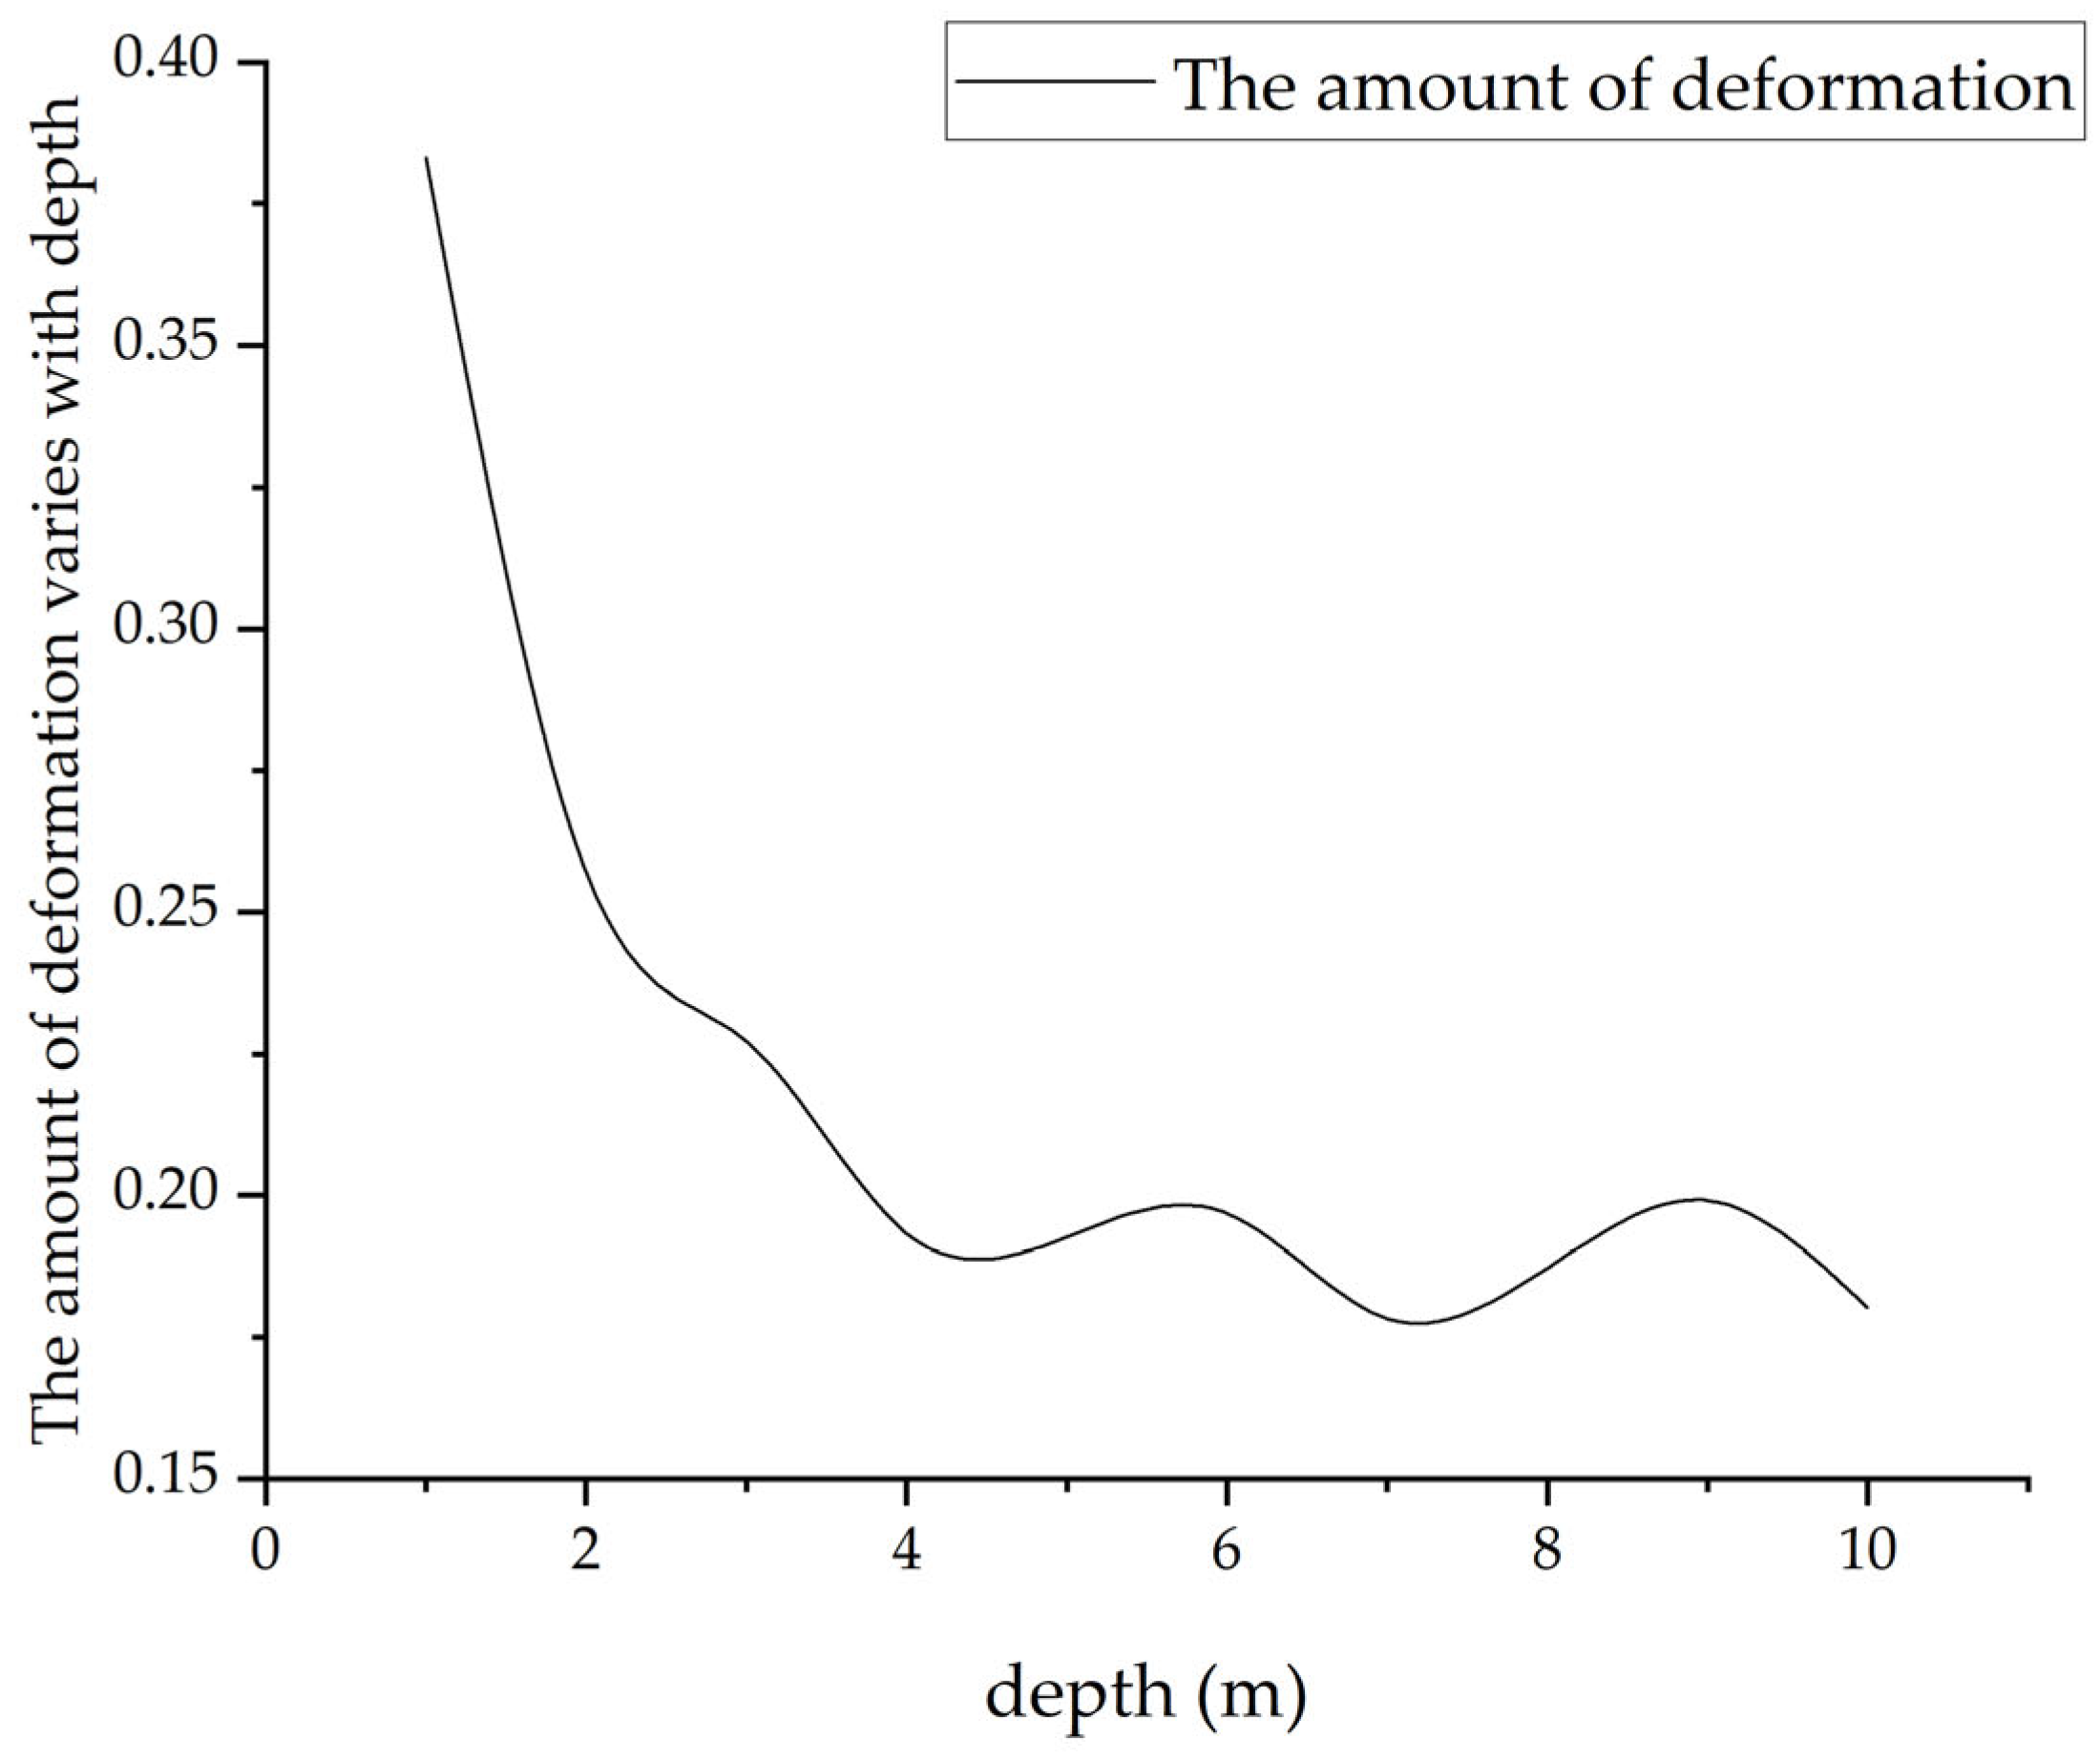
Moreover, this study reinforces the importance of additional morphological factors, especially burial depth and cross-sectional roundness, in determining structural behavior. Lava tubes located in deeper strata demonstrate greater resistance to external loads, as the overburden provides additional confinement and shielding. Similarly, lava tubes with more circular cross-sections exhibit stronger mechanical integrity, owing to uniform curvature and improved stress dispersion along the tube walls.
Overall, the findings of this study confirm and strengthen the universal principles of lava tube stability proposed in earlier theoretical models. The combined influence of high aspect ratio, greater depth, and higher roundness contributes to a structurally robust configuration, making such lava tubes ideal candidates for future scientific research and potential base construction on the Moon.
6.3. Applications and Implications
This study examines the structural stability of real-world 3D models of lava tubes on Earth. To better assess the feasibility and safety of lunar lava tube structures in future lunar base construction, the study compares the structural stability of Earth and the Moon. Observations of the lunar tectonic features suggest that lunar lava tubes may have larger cross-sections and longer extension distances, with a structural span potentially reaching hundreds of meters. Thus, while lunar lava tubes share similarities in structure with Earth, they are more extensive on a scale, and their structural stability requires different mechanical requirements.
Secondly, the moon’s gravity is only 1.62 m/s2, about one-sixth that of Earth. The low-gravity environment on the moon significantly reduces the gravitational force on the rock layers at the top of lava tubes, which enhances their structural stability. However, this low-gravity environment also makes the moon more sensitive to earthquakes and external impacts. Although lava tubes on the moon are not affected by the atmosphere or water and undergo minimal changes during formation, the temperature difference between day and night can exceed 270 °C, and thermal expansion and contraction may cause long-term fatigue damage to the structure of lava tubes. Therefore, when using this research method to analyze the moon model, thermal stress analysis can be included to simulate the cyclic thermal loads caused by the day-night temperature difference.
Regarding material properties, the lava tubes on Earth are primarily composed of basalt, which typically has a compressive strength ranging from 100 to 300 MPa, an elastic modulus of about 50 to 100 GPa, and a Poisson’s ratio of approximately 0.2 to 0.3. However, data on basalt samples from lunar lava tubes is limited, lacking sufficient test data. The basalt on the Moon may have micro-cracks due to environmental factors, leading to higher porosity, which introduces significant uncertainty in its actual mechanical properties. To accurately simulate these conditions, it is necessary to conduct actual sampling of the studied lava tubes on the Moon to obtain rock data.
Although the formation mechanisms and basic structural forms of lunar and Earth-based lava tubes are highly similar, environmental factors such as gravity, thermal conditions, material properties, and external disturbances still lead to significant differences. Using this research method for modeling, it is convenient to incorporate these influencing factors into the model, leading to more accurate lava tube structure characteristics and enabling a deeper analysis of the lunar lava tube structure. The data from this study can serve as a preliminary theoretical foundation and numerical reference for future research on lunar lava tubes.
These structural results also provide implications for electronic sensor deployment. For instance, areas with lower deformation and stress concentrations—such as sections with higher aspect ratios and deeper burial—are more suitable for installing instruments like GPR or seismometers, due to their enhanced mechanical stability and lower vibration levels. In contrast, vulnerable sections may require shock-resistant mounting or additional shielding to ensure sensor integrity under dynamic loading conditions.
This method is of great significance for future lunar and Martian exploration. By constructing a realistic 3D model, it helps to accurately reconstruct the internal geometry of lava tubes, leading to deeper insights into their structure. Additionally, this method can simulate the structural stability of lava tubes under various environmental conditions, allowing us to assess whether they can remain stable over long periods in the face of external factors. Using this method, this study can more accurately determine whether lava tubes can serve as natural shelters, which is crucial for selecting sites for future space habitats. This method confirms that the internal structure of lava tubes is stable and capable of withstanding ground pressure, highlighting their significant research value and providing valuable references for future studies on lava tubes on Mars and the Moon. If this method is used for exploration, and if lava tubes are found to have long-term stability, they could be considered as natural research spaces, reducing the costs associated with artificial exploration and construction. The data obtained from this method can also serve as a basis for designing stable structures for extraterrestrial construction, providing a data foundation for such projects. This method is not only important for deep space exploration but also has significant reference value in the fields of seismology and volcanology. By constructing a realistic 3D model using this method, it can effectively simulate the propagation of seismic waves, aiding in understanding how underground anomalies affect seismic waves. This method can also be used to simulate the stress and strain conditions around lava tubes under seismic activity, thereby predicting potential earthquake fault zones and displacement scenarios, which is crucial for assessing earthquake risks. As a product of volcanic activity, studying the internal structure of lava tubes can help infer the state of lava flow and the formation process, which in turn can predict the scale and direction of volcanic activity. Through finite element analysis, the disturbance and damage caused by magma re-entering old lava tube systems can be simulated, helping to determine whether a volcano in a specific area has the risk of resurgence, thus enhancing early warning systems for volcanic eruptions.
6.4. Limitations of the Study
Although this study presents a novel method for assessing lava tube structural stability based on high-fidelity realistic 3D modeling, several limitations remain. The analysis was conducted under the assumption of uniform rock properties. Due to the unavailability of detailed mineralogical and mechanical data for each cross-section, especially for extraterrestrial environments such as the Moon, this study applied a single set of parameters based on dense basalt. In reality, the heterogeneity of rock mass, the presence of microfractures, and variations in porosity could significantly affect structural responses. Although the present analysis focuses on isolating geometric effects, future studies should incorporate layered or spatially heterogeneous material models to more accurately reflect the mechanical behavior of extraterrestrial lava tubes under extreme conditions.
Furthermore, the simulation of meteorite impacts via static pressure (1–6 GPa) represents a simplification that neglects the dynamic nature of such events. While this is a reasonable first-order approximation, the actual dynamic nature of such impacts involves complex wave propagation and time-dependent material responses, which are not captured in static simulations. The modeling approach used a fixed geometry of the overlying rock and surface boundary conditions. The interaction between the lava tube and surrounding geological strata—especially in cases where the topography or rock thickness varies—could alter the deformation and stress distribution significantly. The chosen method was selected to isolate the geometric influence on structural stability under simplified extreme loading conditions. A more refined model including stratigraphic variation and seismic responses would provide a more comprehensive assessment of stability. Future work will incorporate dynamic impact modeling using transient or explicit solvers (e.g., ANSYS Autodyn or LS-DYNA) to better simulate energy transfer, shockwave propagation, and failure evolution over time.
Additionally, thermal stresses resulting from lunar surface temperature extremes were not included. On the Moon, thermal expansion and contraction due to a >270 °C diurnal cycle could cause fatigue or long-term weakening of lava tube walls, this is an important factor to be considered in future studies. To account for this, future models will incorporate thermal–mechanical coupling, including heat transfer simulations and cyclic thermal loading. This will help quantify the effect of repeated expansion and contraction on structural durability and inform reinforcement strategies for long-term lunar habitation.
This study focused solely on small lava tubes with relatively shallow burial depths. The conclusions, while valuable, may not fully capture the behavior of large-scale lava tubes with complex branching systems or deeper structural settings such as those expected on the Moon or Mars. Therefore, further research involving multiscale modeling and deep-tube analogs is necessary to validate the broader applicability of the results. While this study investigates relatively small and shallow lava tubes on Earth, the methodology developed herein can be extended to analyze larger and deeper lava tubes, such as those potentially found on the Moon or Mars. The geometric and mechanical principles—particularly the influence of aspect ratio, depth, and cross-sectional shape—remain relevant across scales. Furthermore, the lunar environment offers lower gravity, which may enhance structural stability, especially in deep-buried tubes. Future work will focus on adapting the model parameters and scaling the framework to simulate large-span structures under extraterrestrial gravity and thermal conditions.
In addition to the general limitations discussed, several quantifiable uncertainties should be acknowledged. Alignment errors during registration, surface noise, and occlusions in areas such as overhangs or collapsed zones may introduce local deviations ranging from 1 cm to 3 cm. These geometric inaccuracies could affect the precision of the extracted cross-sections and introduce minor shifts in the fitted contours, ultimately influencing the local distribution of stress in the finite element results. Second, in the modeling process, assumptions such as material homogeneity, isotropy, and perfect bonding between the lava tube and surrounding rock were adopted to simplify simulation. Future studies should incorporate uncertainty quantification strategies such as mesh sensitivity analysis, probabilistic material assignment, and error propagation tracking from point cloud to simulation output to enhance model reliability.
6.5. Future Research Direction
Future studies should aim to improve the fidelity of both input parameters and modeling approaches. First, incorporating real mineralogical data—especially from in situ lunar or Martian samples—would allow for more accurate simulations of mechanical behavior. If sampling from lunar skylights becomes feasible in future missions, such data should be integrated into model parameterization. Thermal–mechanical coupling models should be introduced to simulate stress variations under cyclical heating and cooling conditions, particularly relevant for lunar environments.
This study employs static mechanical loading to approximate the effects of meteorite impacts on lava tube structures. We recognize that real impacts are inherently dynamic, involving transient loads, stress waves, and potentially shock-induced fracturing. However, due to the lack of reliable high-strain-rate material properties and the significant computational cost of full dynamic simulations, static loading provides a tractable and informative first-order approach. The observed deformation trends and stress concentration zones offer valuable insight into structural vulnerability. Future work will incorporate dynamic solvers to simulate realistic impact scenarios, enabling more accurate assessments of lunar lava tube performance under extreme events. The inclusion of time-dependent thermal fatigue analysis will be vital in assessing long-term stability for potential lunar bases. Expanding the current method to include dynamic impact simulations (e.g., using explicit dynamic solvers) will help better capture the actual response of lava tubes to meteorite strikes. Coupling seismic wave propagation with structural deformation can also reveal potential failure modes and propagation of damage zones. Artificial intelligence and machine learning techniques can be employed to classify and predict high-risk segments of lava tubes by learning from thousands of cross-sectional features. These predictive models could be trained using extensive Earth-based datasets and then applied to extraplanetary cases.
Finally, this realistic 3D modeling method holds promising applications in volcanology and seismology. For example, it could be used to study stress redistribution around lava tubes during volcanic reactivation, or to assess rupture risk in fault zones intersecting subsurface cavities. The method could also be adapted to simulate ground motion amplification effects in underground lava tube systems during earthquakes, providing a valuable tool for hazard risk assessment.
Through these enhancements, future research can better support the structural evaluation of lava tubes for planetary exploration, base construction, and geohazard mitigation.
7. Summary
This study investigates the structural stability of lava tubes through high-precision, real-scene 3D modeling and finite element analysis based on terrestrial point cloud data. The method addresses the limitations of traditional idealized models by capturing the complex geometries of naturally formed lava tubes and simulating their response to surface loading. By classifying cross-sections according to their aspect ratios and reconstructing corresponding 3D models, the analysis offers new insights into how geometric variation influences mechanical behavior.
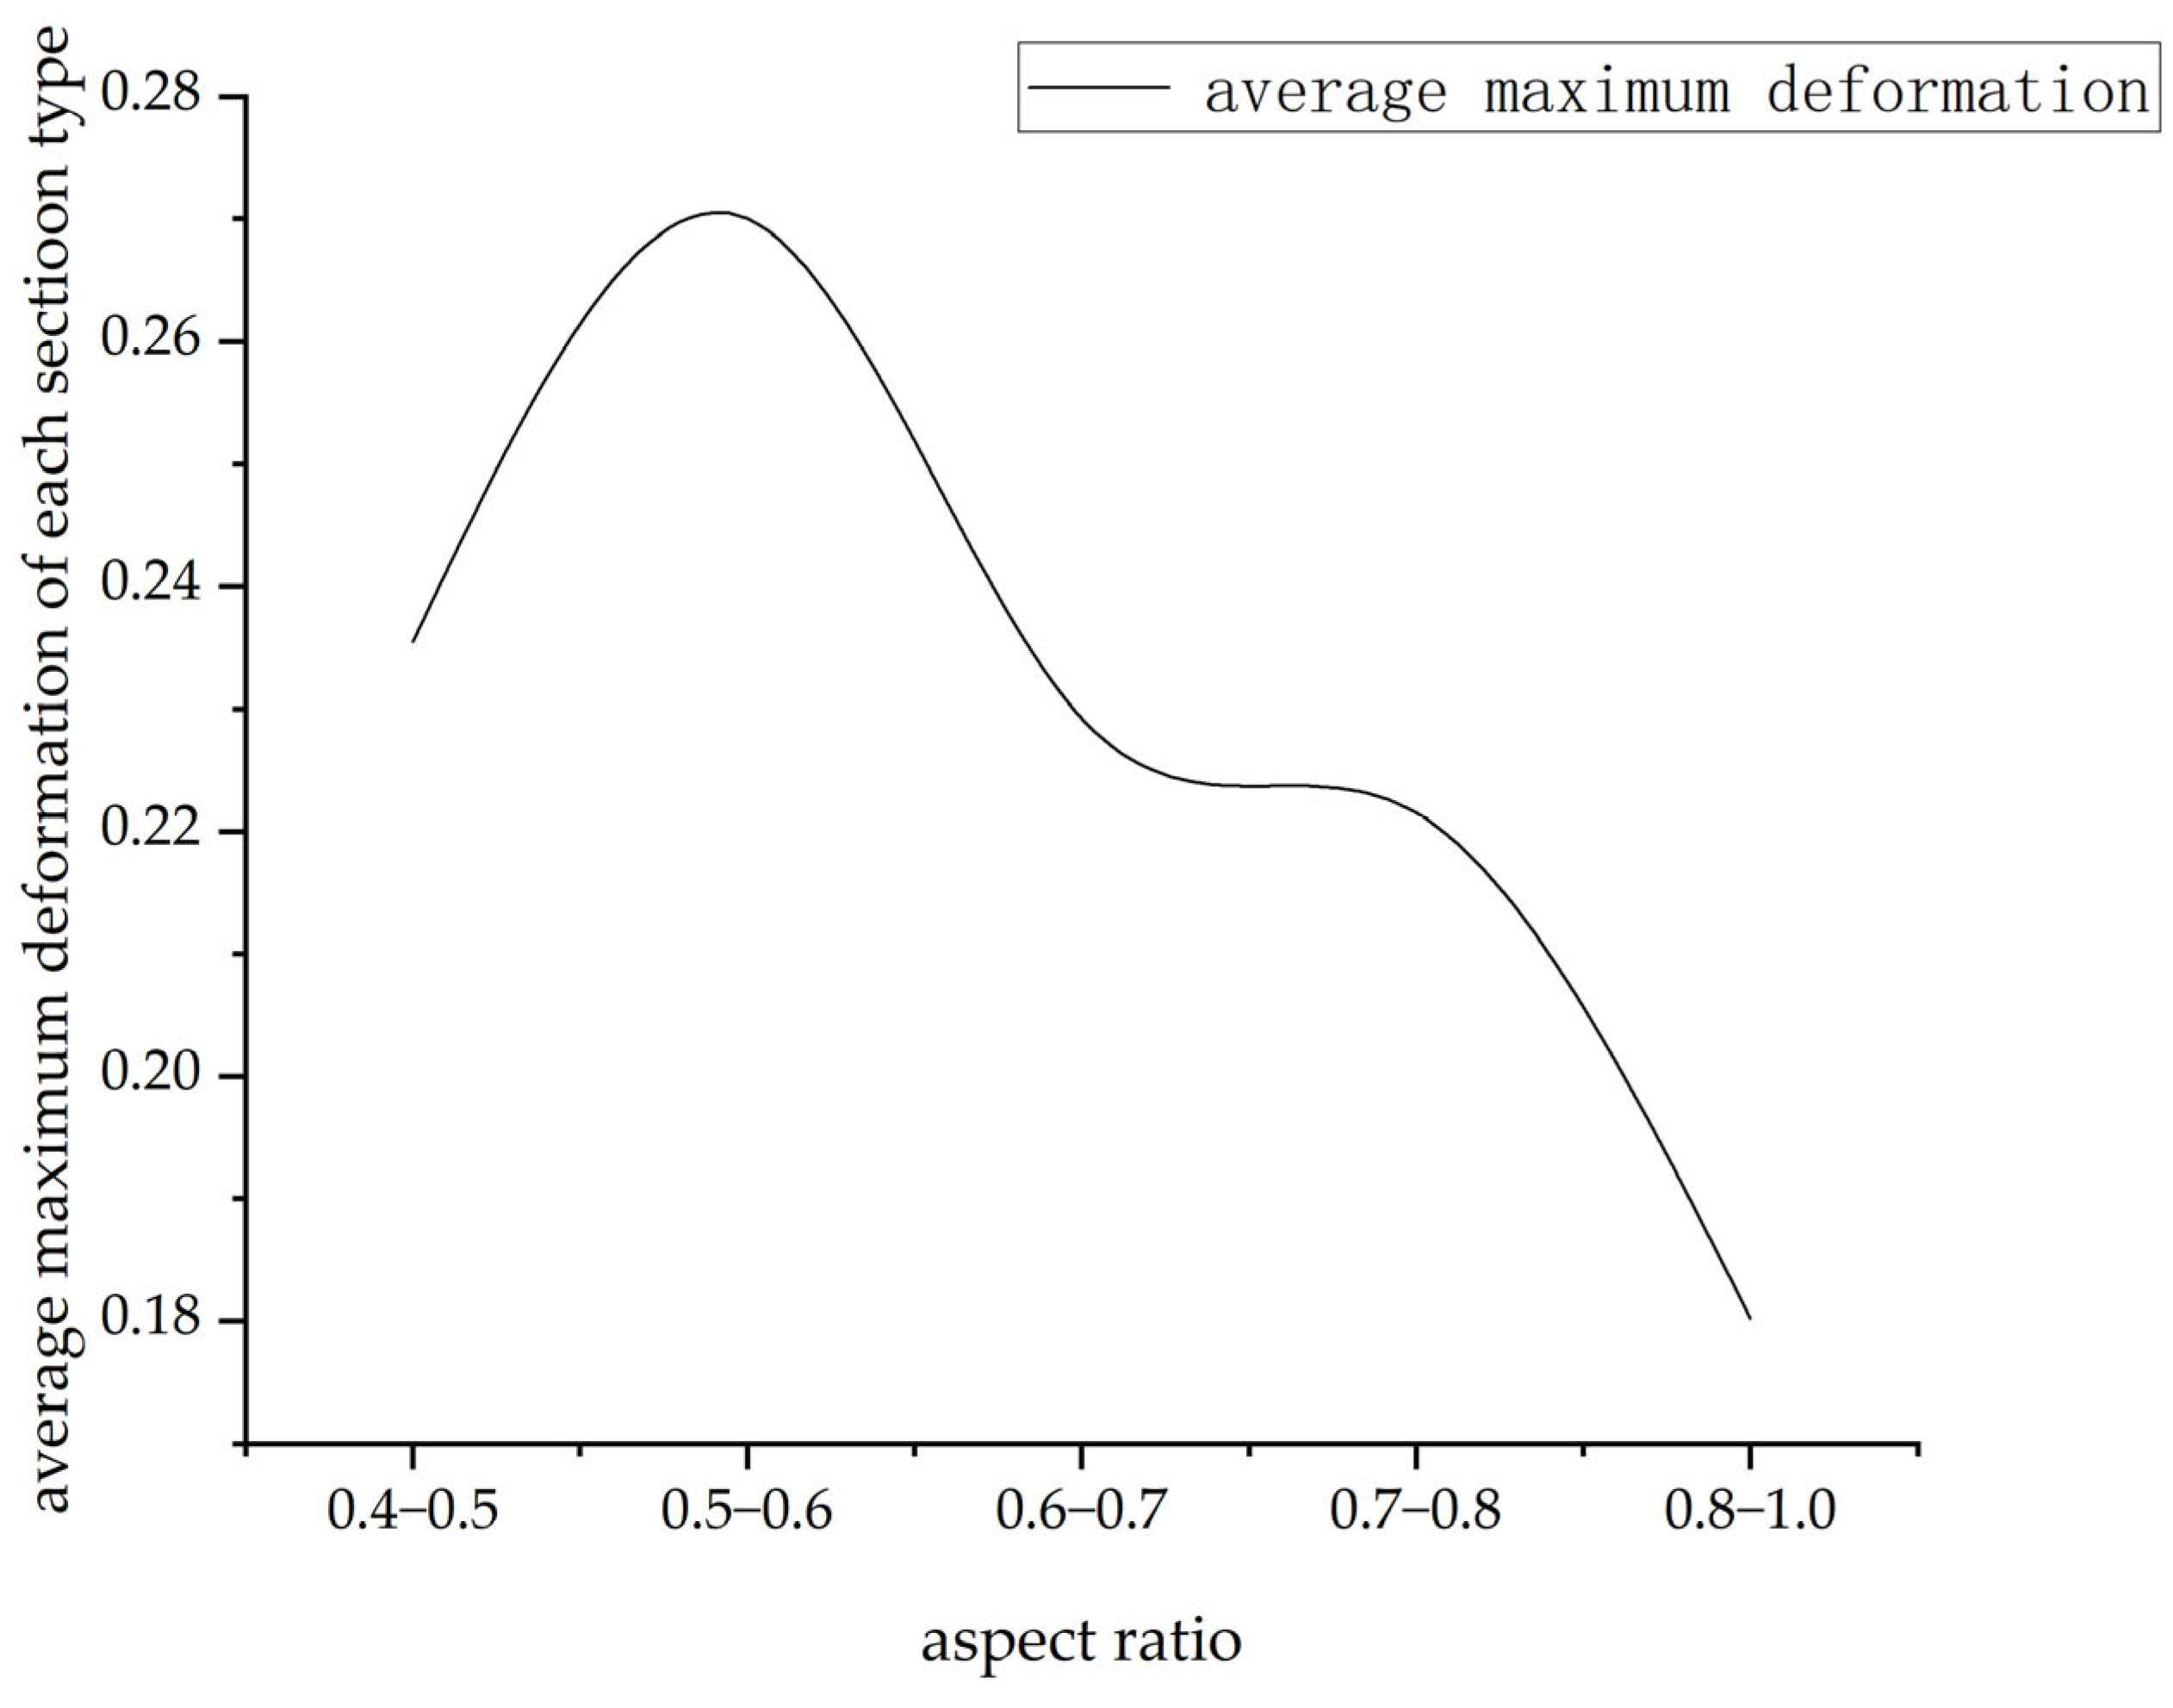
The results demonstrate that structural stability is not a linear function of aspect ratio. While higher aspect ratios generally correspond to reduced deformation and stress, the range between 0.5 and 0.6 exhibits unexpectedly high deformation, indicating that this category of cross-sections may be particularly vulnerable. This non-intuitive behavior cannot be captured by simplified elliptical or circular models, underscoring the necessity of incorporating real morphological data into structural assessments.
Additionally, the analysis confirms that burial depth plays a significant role in enhancing stability, as deeper lava tubes are less affected by surface pressures due to the protective effect of overlying rock. Cross-sectional roundness also contributes to mechanical integrity, with near-circular geometries showing reduced deformation and more favorable stress distributions.
The modeling approach used in this study, while focused on small and shallow lava tubes on Earth, provides a scalable framework applicable to the analysis of larger and deeper structures such as those found on the Moon or Mars. Despite current limitations—such as the assumption of uniform terrestrial basalt properties and static loading conditions—the methodology is adaptable to future scenarios involving dynamic impacts, thermal cycling, and varying material parameters. The observed trends and critical structural zones identified here can inform reinforcement strategies and help guide the selection of safe and stable regions for extraterrestrial base construction.
In conclusion, this study demonstrates that integrating real-scene 3D modeling with finite element analysis significantly improves the accuracy and reliability of structural stability evaluations. The proposed framework not only enhances the understanding of lava tube behavior under extraterrestrial conditions but also serves as a valuable reference for mission planning, structural safety assessments, and the long-term utilization of subsurface cavities in planetary environments.


