1. Introduction
Industrial Artificial Intelligence (IAI) [
1,
2,
3] is rapidly enabling a new form of smart manufacturing, driven by concurrent trends: improved ability to communicate effectively with human operators, the potential to carry out instructions with high precision, and the ability to continuously fine-tune behavior through data-driven learning. As factories adopt smarter, more autonomous systems, the integration of AI technologies into production lines offers transformative potential for productivity, quality assurance, and cost reduction.
Although enabled by AI, IAI differs in several fundamental ways that demand tailored design and deployment strategies. First, IAI systems are often customized for narrow, domain-specific tasks rather than broad applications. For example, instead of using off-the-shelf object detection models designed for general use, IAI systems typically involve fine-tuned anomaly detection models specialized to the unique characteristics of the products being manufactured, and optimized for the environment in which they will run (lighting, surrounding, pacing, etc.). This specialization results in context-specific model variants that perform better in the target setting, yet might under-perform in other contexts.
Second, IAI systems integrate with the Industrial Internet of Things (IIoT) [
4,
5,
6] whereas consumer-facing AI applications largely rely on human inputs and associated data, such as location tracking. IAI inputs may include cameras, microphones, vibration sensors, lidar, and a diversity of other technologies used both for continuously monitoring the physical environment and for assessing fabricated objects. Many shop floors produce a wide range of products, hence this heterogeneous network of sensors forms a real-time data fabric, enabling AI systems to respond dynamically to changes in production workloads as well as to operating conditions.
Third, industrial environments impose strict performance constraints. IAI applications often operate under real time pressure, matching the processing speeds of physical systems such as conveyor belts and robotic arms. Latency beyond acceptable thresholds can lead to bottlenecks, production delays, or even safety risks. For this reason, guaranteeing low and predictable end-to-end latency—spanning data capture, transmission, processing, and action—is a critical requirement for IAI systems. In contrast, while human-centric AI often has query-response timing constraints, it is unusual for today’s human-centric applications to dynamically query or track the environment. Of course, this may change, and IAI will have lessons to share with human-centric AI if and when that occurs.
In this paper, we explore the design and deployment of a VAD system in a smart manufacturing environment, developed in collaboration with Siemens as a R&D prototype. Our specific focus is on meeting the dual objectives of high detection accuracy and strict latency guarantees in scenarios drawn from Siemens automation customers in settings such as automobile manufacturing and domestic consumables packaging. This class of VAD applications must operate within a tight latency budget to remain synchronized with the speed of the assembly line.
Our VAD prototype is designed to run on an on-premise edge cloud infrastructure: a collection of GPU-equipped, high-performance servers co-located with the factory floor. This edge cloud acts as the computational brain of the smart factory, directly interfacing with the IIoT devices. Cameras mounted along the conveyor belts stream high-resolution video to the edge servers, where AI models analyze the footage in real time. Upon detecting anomalies, the system generates actionable commands that are immediately relayed to downstream devices, such as robotic arms or sorting mechanisms.
Our system achieves low-latency performance through a series of optimizations. First, we utilize InfiniBand-enabled data interconnects to reduce data transfer times between sensors, actuators, and edge servers. InfiniBand’s support for Remote Direct Memory Access (RDMA) and fiber-optic links provides high bandwidth and low communication latency, which are critical for handling large video data streams in real time.
Second, we benchmark and evaluate multiple VAD models to select a time-efficient architecture that also meets accuracy requirements. This step involves careful trade-off analysis between inference speed and detection precision, especially in light of the limited compute time available per frame.
Finally, we integrate our system with Cascade and Derecho. Cacade is a high-performance RDMA-enabled object storage system optimized for AI workloads, while Derecho is an RDMA-optimized communication library offering high speed point-to-point communication, multicast and fault-tolerance. This mixture enables us to create AI pipelines that can perform fast and reliable storage, retrieval-augmented tasks that include both access to data and model artifacts and RAG-style document search (useful when interacting with human operators). AI pipelines can lose a great deal of time on high-speed stage-to-stage handoffs, but the Cascade/Derecho framework ensure ultra-low delays, which proves to be important for minimizing overall latency.
The remainder of this paper is organized as follows: In
Section 2, we describe the shop floor environment and system requirements.
Section 3 reviews related work in networking, infrastructure, and anomaly detection models. In
Section 4, we present the system architecture, followed by details on model design and our approach to performance evaluation in
Section 5. We conclude with a comprehensive system evaluation in
Section 6.
2. Smart Factory Setup and Service Requirements
To demonstrate the practical integration of IAI in a smart manufacturing environment, we focus on a defect detection station deployed on an assembly line. At this station, products on a conveyor belt and pass through an inspection zone equipped with high-resolution cameras. Each camera captures a short video clip as the product passes (the conveyor does not pause). These video streams are then analyzed by dedicated visual anomaly detection models. If a defect is detected, a processing device (which could be a robotic arm, an air jet, etc.) is triggered and will take appropriate actions, such as removing the faulty item or redirecting it for further inspection.
We focus on a representative deployment scenario involving four identical inspection stations, each designed for a different stage in the production of a car component. These stations share the same software architecture, IAI components, and performance requirements. Thus, we study one of these stations in detail without loss of generality.
The setting we constructed is representative of an actual smart factory, but operates in a testbed that enables us to reproducibly control conditions. Our testbed uses the same cameras and computing hardware deployed in actual production lines, with corresponding camera frame rates, resolutions, data generation rates, and all software deployed in our testbed must satisfy realistic operational constraints, including latency bounds and anomaly detection accuracy requirements drawn from real-world deployments.
At each inspection station, eight fixed cameras are positioned around the inspection zone to capture multi-perspective video footage. An item will be visible to a particular camera for an 1 s period; a new item arrives every 3 s. The entire processing workflow—including video data transmission, anomaly detection, and sending response back—must be completed within 3 s per product. Each camera video is approximately 12 MiB, leading to a total input of 96 MiB per product cycle.
The application imposes significant computational demands. Each video streamed from the eight cameras must be analyzed by a dedicated anomaly detection model. To maximize accuracy, the associated models are first fine-tuned on camera-specific datasets to optimize accuracy from various angles under the real lighting conditions (including shadows, backgrounds) arising in deployment settings. This approach leads to high model diversity and increased resource consumption. To support such workloads, the system requires powerful computation accelerators (e.g., GPUs) and sufficient memory and storage to host and serve multiple models concurrently.
To meet these dual demands—ultra-low latency and high computational throughput—we introduce a compact edge cloud infrastructure directly into the shop floor. The edge cloud consists of two high-performance servers, each equipped with an A6000 GPU (Nvidia Corporation, Santa Clara, CA, USA) and large local storage capacity. These servers are interconnected with the cameras and actuators via InfiniBand-enabled fiber switches, ensuring high-bandwidth, low-latency communication for real-time video processing and actuation.
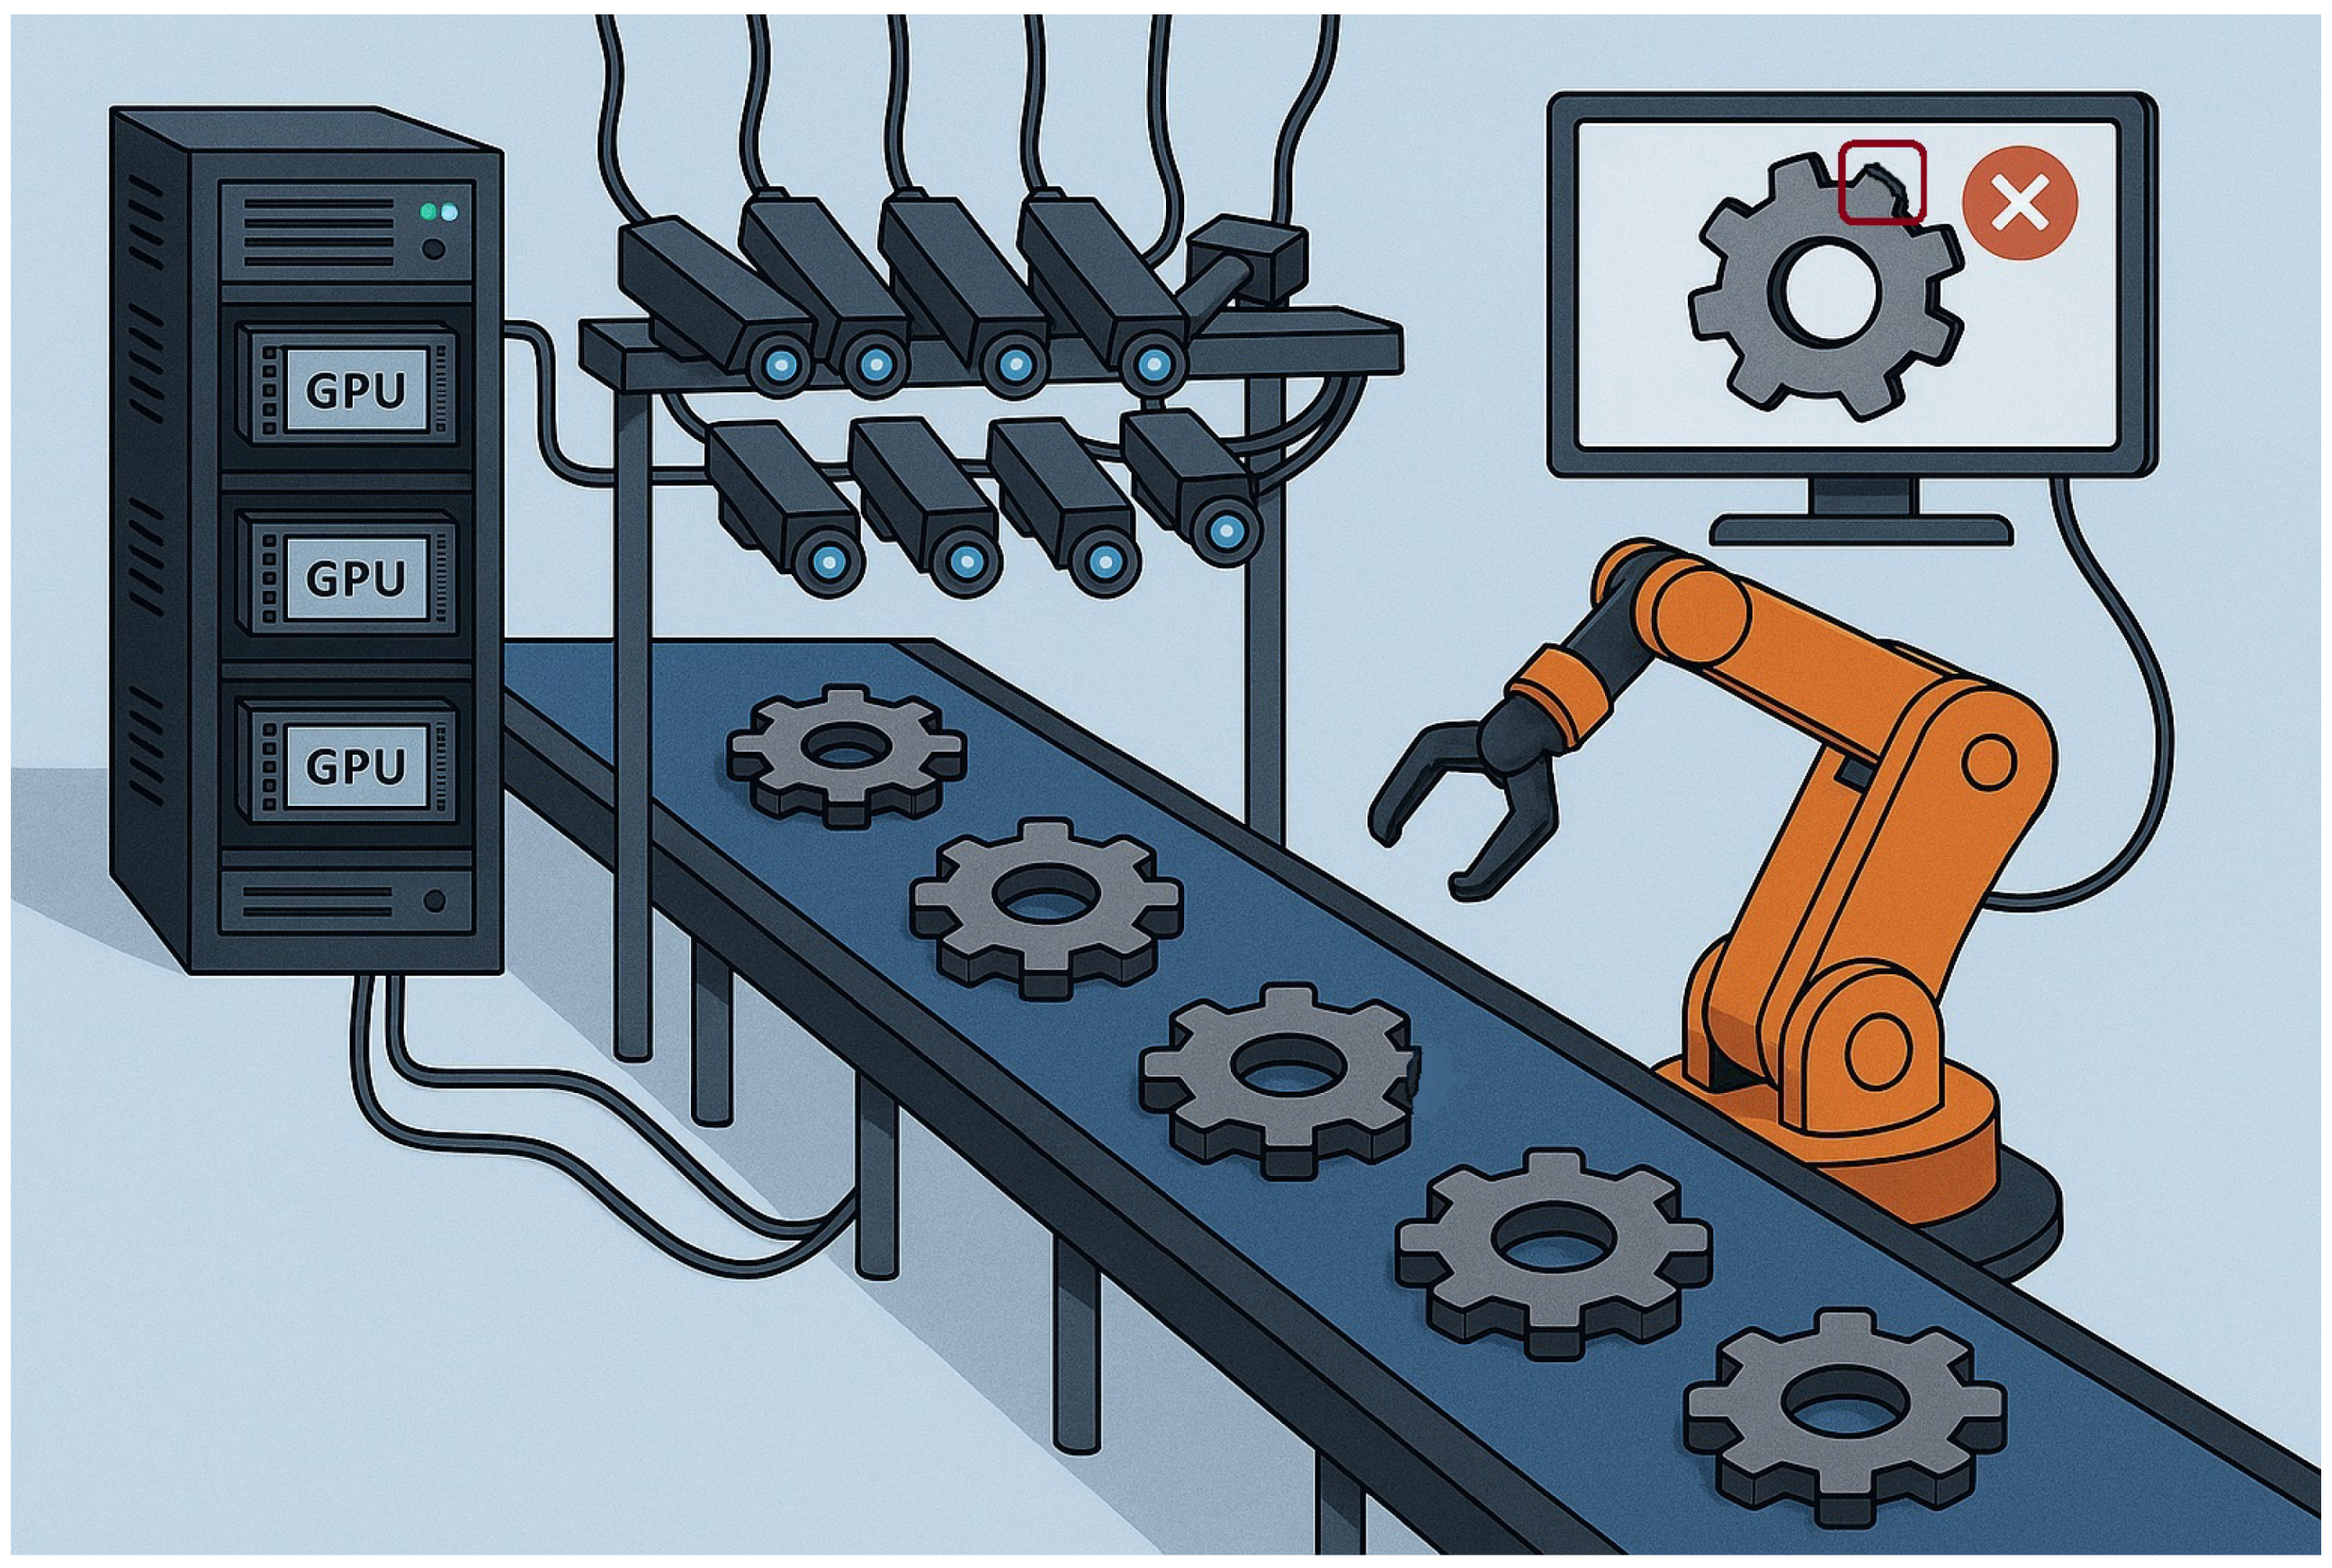
Figure 1 provides an overview of the deployed architecture, highlighting the components involved and their interconnections within the edge cloud environment.
3. Background Work
This section provides an overview of the technical foundations underlying our system design, focusing on high-performance data interconnects and AI infrastructure, as well as visual anomaly detection models in smart manufacturing.
3.1. High-Speed Data Connection
Our choice of Infiniband (historically, a high-performance computing technology) requires some justification, because the technology brings cost beyond that of standard optical Ethernet (which we also employ). InfiniBand [
7] is a high-throughput, low-latency networking technology; although it originated in HPC settings, it is now increasingly important for AI compute. Infiniband supports RDMA and achieves higher bandwidth, lower latency and (importantly) extremely low data loss rates, avoiding the “sawtooth” performance standard for traditional TCP stacks on Ethernet. This predictability matters data-intensive tasks like AI-based video analytics, where minimizing data transmission overhead is critical for system responsiveness.
Infiniband RDMA is the foundational technology underlying the popular Collective Communications Library (CCL), including AllReduce [
8], a cornerstone of modern machine-learning packages and central to ML training. But RDMA is of value throughout our solution. The technology enables memory-to-memory data transfer between devices without involving the CPU: one machine can directly copy into and read from memory on other machines, with appropriate permissions. By bypassing the kernel stack and avoiding the need for a remote process to receive a request and respond to it, RDMA significantly reduces data transmission latency and CPU overhead. In contrast, traditional Ethernet communication involves multiple data copies between application, kernel, and network buffer layers, incurring high latency and reducing throughput. In our setting, RDMA is especially important because the video streams from our cameras generate such high data rates: we need high resolution images for tasks such as crack detection in metal parts, yet can’t pause to wait for the data files to be copied from machine to machine using standard remote-copy tools.
While the performance gains are substantial, the use of InfiniBand comes with added hardware costs. InfiniBand-enabled switches can cost between $5000–$15,000 depending on port count and speed. Each server must also be equipped with RDMA-compatible NICs (e.g., Mellanox ConnectX series), which typically cost $500–$1200 per unit. Fiber transceivers and cabling further add to the deployment expense. These costs are justified in environments where performance, precision, and reliability are mission-critical.
Although the work reported here opts for InfiniBand RDMA, it may be feasible to migrate to less costly RDMA over Converged Ethernet (RoCE) [
9] in the future. Unlike InfiniBand, which uses a dedicated fiber-optic connections, RoCE shares standard Ethernet networks with TCP/IP, reducing costs but potentially increasing message loss and retransmission, a phenomenon likely to harm latency.
3.2. AI Data Infrastructure
To complement the low-latency network stack, our system employs Cascade and Derecho: two closely-related high-performance RDMA-enabled data infrastructures, developed by Cornell University [
10,
11]. Cascade is designed to maximize the performance of distributed AI storage by leveraging RDMA and reduce the excessive copying and single-threaded congestion seen in many Python v3.10.12 runtimes; Derecho accelerates communication such as stage-to-stage handoffs. Both systems use additional optimizations, such as dynamic (opportunistic) batching, but a detailed discussion of these internal design features is outside of our present scope.
One of Cascade’s strengths lies in its support for multi-stage machine learning workflows, where multiple AI models can operate in parallel or in a pipeline configuration. This modularity enables flexible and efficient orchestration of inference tasks. For instance, a detection model may first flag an abnormality, which is then passed to a classification model for further analysis. Rather than forcing the developer to build a single AI that includes all of these tasks and runs as a large monolithic job, Cascade enables the creation of distributed implementations in which the components are built separately, then configured into a data flow graph declaratively, minimizing code complexity while ensuring consistent low-latency performance.
While several systems exist for distributed machine learning inference, Cascade fills a unique niche. General-purpose serving frameworks such as NVIDIA’s Dynamo [
12] and Triton [
13] offer strong support for distributed inference, but they are primarily optimized for cloud deployment and do not natively support RDMA. DeepSpeed [
14] focuses on large-scale model training and lacks optimized inference features. Systems like Ray Serve [
15], Clipper [
16], AlpaServe [
17], and Nexus [
18] provide flexible, distributed ML inference capabilities with varying degrees of scheduling and fault-tolerance optimizations. Ray Serve, in particular, is comparable to Cascade in terms of support for complex inference pipelines and shows high throughput under optimal configuration. However, Cascade consistently delivers lower and more stable latency due to its native RDMA support and optimizations tailored to edge-cloud settings (In our evaluations, we show that while Ray Serve can match Cascade’s throughput, measured in terms of total event rates per second when properly tuned, Cascade achieves sharply lower per-event latency and more predictable overall performance out-of-the-box).
3.3. VAD System
In smart manufacturing, VAD plays a central role in automated quality control. These models analyze images or video frames to identify deviations from specifications that may indicate product defects. For example, a visual anomaly detection model deployed at a car assembly line might detect improperly mounted components or surface deformations, in real time. The timely identification of such defects helps prevent defective items from progressing further in the production process, thereby reducing waste and improving overall product quality.
Currently, there is no standardized benchmark for system-level studies that evaluate end-to-end latency of a VAD system in real-world manufacturing settings, primarily due to the wide variation in industrial deployment environments, as pointed out in [
19,
20]. Nonetheless, individual research efforts have reported latency figures for specially designed models under lab conditions. For instance, recent methods like FastFlow [
21] and DRAEM [
22] achieve inference times around 30–50 ms per image, meeting the typical latency threshold for real-time industrial inspection, which is often considered to be under 100 ms per frame. However, these results generally reflect only the model inference time and do not account for the full pipeline, including data transfer, preprocessing and integration with manufacturing workflows, leaving a gap between academic benchmarks and practical deployment needs. There are also ongoing efforts, like IM-IAD [
23], to create a dataset for industrial image anomaly detection tasks.
To maximize generality, instead of using the specially-designed models, industrial researchers often use fine-tuned derivatives of general-purpose object detection models, such as YOLO [
24], DINO [
25], or DETR [
26] for VAD. These models are maintained and updated timely and their efficacy can be easily compared using widely available datasets. Fine-tuning enables these models to adapt to specific product features and defect types encountered in a particular manufacturing setup and also improves their handling of lighting conditions, background clutter, object occlusions and other pragmatics. However, this process introduces a trade-off between model accuracy and inference latency. While larger models generally offer better detection accuracy, they also demand more computation time, which directly affects the overall processing latency. In real-time systems like ours, inference time accounts for the majority of total data processing latency, making it a critical bottleneck to optimize.
Moreover, off-the-shelf models rarely perform optimally out-of-the-box and must be fine-tuned using task-specific datasets. The effectiveness of this fine-tuning is heavily dependent on the quality and quantity of the training data. However, collecting large-scale, labeled datasets in manufacturing settings is often expensive and time-consuming. To overcome this limitation, practitioners frequently use data augmentation techniques such as geometric transformations, contrast adjustments, or synthetic data generation [
27,
28]. These methods increase data diversity and improve model generalization, especially when annotated samples are scarce.
4. Architecture and Implementation
This section presents the software architecture and implementation of our IAI system for anomaly detection in a smart manufacturing setting. We begin with an overview of the system’s data flow, followed by detailed explanations of algorithmic choices and model selection. Finally, we explore performance optimizations that enable our application to meet the stringent latency and accuracy requirements discussed earlier.
4.1. System Data Flow
The software design directly mirrors the physical deployment of the inspection station that we saw in
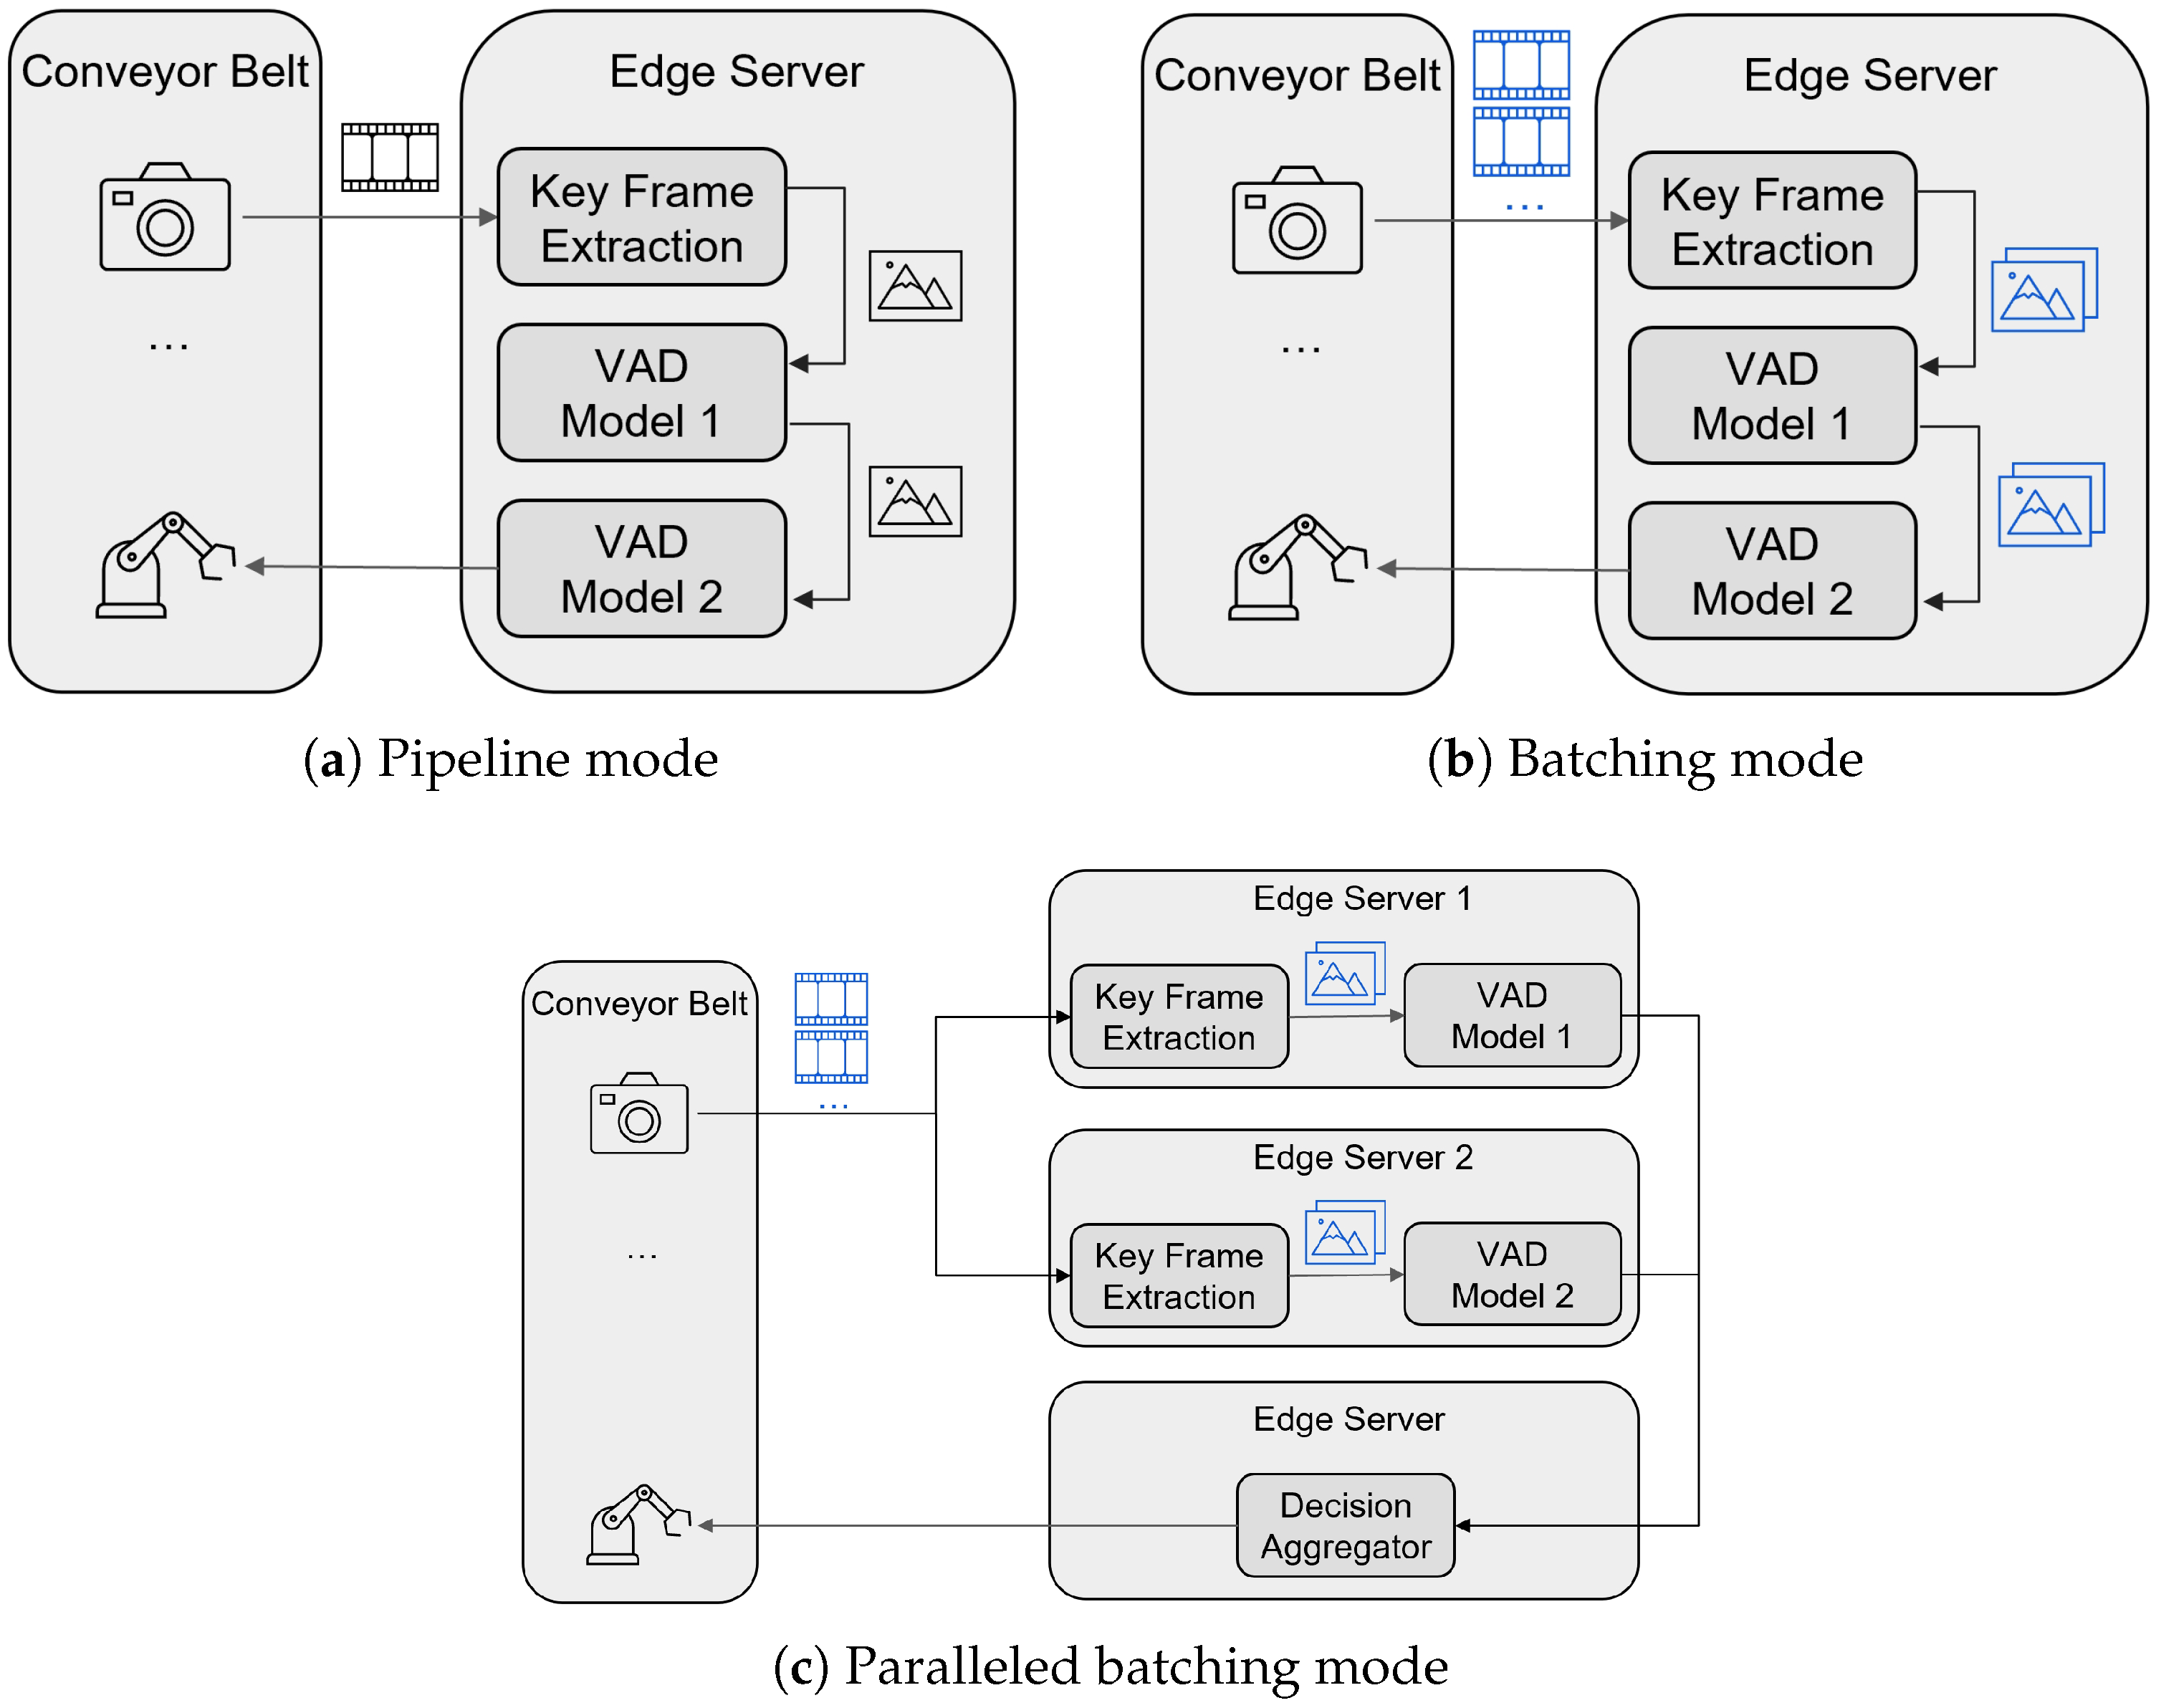
Figure 1. Our cameras are smart enough to stream video only when an object is present. Upon receiving a 1-s video stream upload, as shown in
Figure 2a, the inspection application first invokes the Key Frame Extraction Module. The goal of this module is to extract three representative frames that provide the clearest view of the object under inspection. Since the video spans the entire time the object is in view—including periods when it is partially out of frame or poorly visible—the module filters out partial images, retaining only the frames showing the complete product.
Next, the extracted key frames are forwarded to two VAD models, each specialized in identifying distinct types of defects, such as cracks or holes. Prior to deployment, these models are fine-tuned to deliver high detection accuracy while remaining computationally efficient. If an anomaly is detected in any frame, the IAI service generates an instruction for the actuator to take appropriate action, such as removing or flagging the defective item. Otherwise, the item continues on the conveyor line without interruption. One could easily modify this step to invoke other AIs, for example to interpret X-Ray or ultrasound data, multispectral imaging data, or other data modalities.
4.2. Key Frame Extraction: Algorithm Selection
We considered two approaches for implementing the key frame extraction module: one based on deep neural networks (DNNs) and the other on traditional computer vision techniques.
4.2.1. DNN-Based Method
In the DNN-based method, we leverage YOLOv5-small, a widely-used object detection model [
29], to identify the presence and location of the object within each frame. For every candidate frame, YOLO draws a bounding box around detected objects. We compute the distance between the bounding box center and the image center, selecting the frame with the minimum distance as the base frame. This ensures a head-on, central view of the object.
The camera in our setting has a frame rate of 60 FPS. Suppose that there are N frames in the video, to reduce time spent in key frame extraction, we constrain the search of the base frame to the frames close to the middle of the video, namely the frames through , forming a 800 ms searching span. Two additional frames, spaced ±200 ms (i.e., ±12 frames), are also selected, following Siemens’ guidelines to approximate multi-angle snapshots commonly used in image-based inspection systems. The result is a compact set of three representative frames per video.
While accurate and efficient, this approach is computationally expensive and it requires GPU to complete the task in time. We will quantify our finding in
Section 6, where we will call this GPU Solution.
4.2.2. Traditional Computer Vision Method
The alternative method relies on a lightweight, traditional computer vision pipeline. We define a Region of Interest (ROI) centered in the image and convert each frame to grayscale. We then compute the average pixel intensity in the ROI and identify the frame where brightness variation between consecutive frames is greatest. This variation indicates that an object has entered the ROI. The choice of ROI size is critical: if the ROI is too small, moving objects may pass undetected; if too large, objects remain within the ROI across multiple frames, resulting in minimal frame-to-frame variation. In our experimental setup, an ROI size of pixels was empirically determined to provide the highest base frame detection success rate.
Once the base frame is identified, the two adjacent frames spaced ±200 ms are similarly selected. This approach is a cost-effective alternative to the DNN-based solution. Yet, it has two major drawbacks. First, it introduces a much longer latency than the previous solution. Also, it is less robust: reflections or non-target objects may trigger false positives, and the algorithm cannot distinguish between desired and undesired objects. These trade-offs are further evaluated in the results. In
Section 6, we will call this CPU Solution.
4.3. VAD Model Selection and Fine-Tuning
After key frame extraction, each frame is analyzed by two fine-tuned VAD models. These models are derived from general-purpose object detectors and specialized for distinct defect types.
As described in
Section 5, our fine-tuning dataset consists of 160 videos of varying lengths that simulate the assembly process of mechanical components, such as assembling bolts, washers, and nuts. Among these, 30% depict successful assemblies, while the remaining 70% contain known anomalies, including missing components, incorrect parts, or incomplete task execution. From these videos, we extract approximately 30–40 frames per video, resulting in a dataset of around 4000 images. Each image is labeled as either normal or anomalous based on the status of the corresponding video. The dataset is then split into training (80%), validation (10%), and testing (10%) sets. We use this dataset to fine-tune our VAD models.
We evaluate three candidate architectures as base models: YOLO, DINO, and DETR, which are the base models for top performers on the widely-used image datasets for object detection, i.e., COCO [
30], Pascal VOC [
31] and OID [
32]. The selection is guided by three key criteria:
Training Data Requirements: High-accuracy IAI applications often require domain-specific datasets, which are expensive and time-consuming to collect and label. For instance, datasets of surface cracks on car door panels are not publicly available and must be curated in-house with expert supervision.
Training and Inference Efficiency: Frequent model retraining or fine-tuning, especially with evolving product lines, discourages the use of complex models with high training costs.
Real-Time Performance: The system must meet strict latency constraints, with inference time contributing a significant share. Simpler models, if sufficiently accurate, are often preferable in time-critical settings.
Based on these considerations, we select the model with the trade-off between accuracy, training cost, and inference speed. In practice, the most complex models do not necessarily outperform simpler ones when fine-tuned with limited datasets. Therefore, our strategy favors modular, lightweight models that can be easily re-trained for different production stages.
4.4. System Optimization
To further improve latency and resource efficiency, we introduce two software-level optimizations: batching and parallelism.
4.4.1. Batching
Batching is a widely adopted technique for accelerating DNN inference by maximizing GPU throughput [
33]. Instead of immediately dispatching incoming frames, we accumulate images in a dedicated batching area within the Cascade data store. Under steady loaded conditions, each time eight images have been collected a Cascade User-Defined Logic (UDL) function triggers and sends the batch to the VAD models, as illustrated in
Figure 2b. However, there are many conditions in which we might not receive all eight images simultaneously. To avoid excessive delay, we monitor the maximum wait time of each image in the batching queue. If any image exceeds 500 ms in waiting time, the batch is flushed regardless of size. This ensures that latency guarantees are respected even if the system is lightly loaded.
4.4.2. Parallelism
Since the two VAD models operate independently, we exploit task-level parallelism by decoupling the monolithic IAI service into two microservices, each responsible for one model, as shown in
Figure 2c. Each microservice is deployed as a UDL in Cascade and runs on separate edge servers, ensuring ample GPU resources.
Input frames are duplicated and dispatched to both services concurrently. The outputs are collected by a third UDL, the aggregation module, which applies a logical AND operation to combine the results. This modularization reduces the end-to-end inference time despite minor overheads from data duplication and result aggregation.
The UDL-based microservice architecture makes this decomposition straightforward: what was previously a single sequential call is now split into two independent triggers operating on disjoint memory regions within Cascade. The final aggregator UDL is lightweight and co-located with one of the VAD microservices to minimize data transfer overhead.
4.5. Summary
The design of our IAI software architecture strikes a deliberate balance between accuracy, efficiency, and responsiveness. It is also designed to be easily customized or extended: often, developers of new applications prefer to select a reasonable demonstration application and then modify it to serve their needs. By carefully choosing models that perform well at the targetted speeds, applying optimizations such as batching and parallelism, and leveraging edge cloud infrastructure and RDMA-accelerated storage, we are able to meet the demands of real-time anomaly detection on the factory floor. In
Section 6, we present a comprehensive evaluation of our system’s performance under realistic workloads.
5. Materials and Methods
The effectiveness of any IAI service is tightly coupled with the quality and relevance of its training data. However, publicly available datasets for visual anomaly detection in manufacturing are extremely limited. This section discusses the reasons behind this scarcity, describes the dataset we developed to address it, and provides information about where our data and implementation can be accessed.
5.1. Dataset Availability Challenges
Two primary factors hinder the open sharing of high-quality datasets in industrial contexts. First, IAI services are often tailored to highly specific manufacturing scenarios. From our earlier example, detecting surface cracks on car panels depends heavily on precise conditions such as the model of the car, the lighting environment, camera angles, object orientation, and the design of the conveyor system. As a result, a dataset proven effective in one setup may offer limited utility in a different context, reducing its generalizability and broader value.
Second, the creation of high-quality datasets typically requires domain expertise. Unlike generic computer vision tasks that can be outsourced to crowdsourcing platforms like Amazon Mechanical Turk, identifying subtle defects in industrial components demands deep knowledge of manufacturing tolerances and failure modes. Consequently, dataset labeling must often be performed in-house by trained professionals, making the data both costly and proprietary. These factors contribute to the classification of such datasets as valuable intellectual property, rarely shared beyond the organizations that produce them.
5.2. Simulated Dataset for Evaluation
For the work reported here, we opted for a balance. Our system was created as a R&D protocol, but we undertook a highly detailed evaluation using a synthetic data set we created to mimic real use cases without triggering IP concerns.
Accordingly, we configured our solution for use in a testbed setting that involves mechanical parts moving along a conveyor belt and being recorded by a camera array. Care was taken to align the data acquisition setup with real-world shop floor specifications, including camera resolution, frame rate, and object motion profiles. This minimizes the simulation-to-reality gap and provides a meaningful benchmark for evaluating VAD models.
5.3. Collaborator-Specific Fine-Tuning
Following deployment, our collaborators at Siemens fine-tuned the IAI service using their own proprietary dataset, collected from their production lines. This dataset reflects the specific products, equipment, and operating conditions present in their manufacturing environment. Although non-disclosure agreements preclude the release of this proprietary dataset, our publicly available dataset serves as a representative proxy for evaluating general system capabilities.
5.4. Source Code and Reproducibility
To further support open research and development, we have made our full implementation publicly available at:
https://github.com/Derecho-Project/SmartManufacture.git, accessed on 10 May 2025. This repository includes source code for the key frame extraction module, the VAD service pipeline, and system orchestration components, as well as configuration files for deploying the system in a simulated environment.
All third-party dependencies used in our system—such as object detection models (YOLO, DETR, DINO), the Cascade edge cloud framework, and model training toolkits—are publicly available and documented in the repository.
5.5. Test Environment
We conducted our experiments by running in a Docker containers on two identical servers representative of edge-hosted compute environments. Each server is equipped with dual Intel Xeon Gold 6242 processors, 192 GB of memory, and an NVIDIA Tesla T4 GPU, 16 GB vRAM.
5.6. Use of Generative AI Tools
We note that
Figure 1 was created using GPT-4o from ChatGPT; the corresponding prompt is included in the
Appendix A.
6. Results
In this section, we quantify the key design choices described previously. The hardware configuration used for testing is detailed in
Section 5.5.
6.1. Key Frame Extraction
As discussed in
Section 4, we have implemented two methods for detecting the key frame in a video: a DNN-based approach requiring GPU acceleration, and a computer vision (CV) algorithm optimized for CPU execution. To evaluate their performance, we conducted tests on 100 videos, repeating each test three times. For effectiveness assessment, we manually inspected the 300 extracted key frames to verify that they clearly captured the target objects.
The evaluation results are summarized in
Table 1. The DNN-based method demonstrates significantly lower latency, completing the task in 487.2 ms on average. Of this time, 470 ms is attributed to data preparation (including loading the video and extracting 49 middle frames), 15.3 ms to data transfer to the GPU, and only 1.9 ms to model inference.
In contrast, the CPU-based method takes 1220 ms, with 570 ms used for data preparation (loading the video and writing the three selected frames) and 650 ms for frame selection calculations.
As for the effectiveness, both approaches have captured high-quality images that pass our manual examination.
6.2. VAD Model Selection
We have evaluated the efficiency and effectiveness of four VAD models: DETR, DINO, YOLOv5-small (YOLO-5s), and YOLOv8-small (YOLO-8s). Our primary focus is on three aspects: the time required to fine-tune each model, the inference latency, and the detection accuracy.
To assess training efficiency, each model was fine-tuned over 30 epochs. For inference performance, we measured latency using a batch size of 8. The results of these experiments are summarized in
Table 2.
In terms of accuracy, all four models achieved a mean Average Precision (mAP) of 99–99.5% at 50% IoU (mAP@50), indicating that they are comparably effective for our industrial use case.
As shown in the results, YOLO-5s and YOLO-8s demonstrate comparable efficiency in both training and inference. In our implementation, we select YOLO-5s due to its slightly shorter inference time, which better aligns with the strict latency constraints of our system.
6.3. Itemized System Performance
There are several configurable parameters that impact the performance of machine learning model deployments on shared infrastructure. Given the fan-out and aggregation execution pattern, two techniques that significantly improve performance on Cascade are batching and parallel processing.
With the testing environment specified in
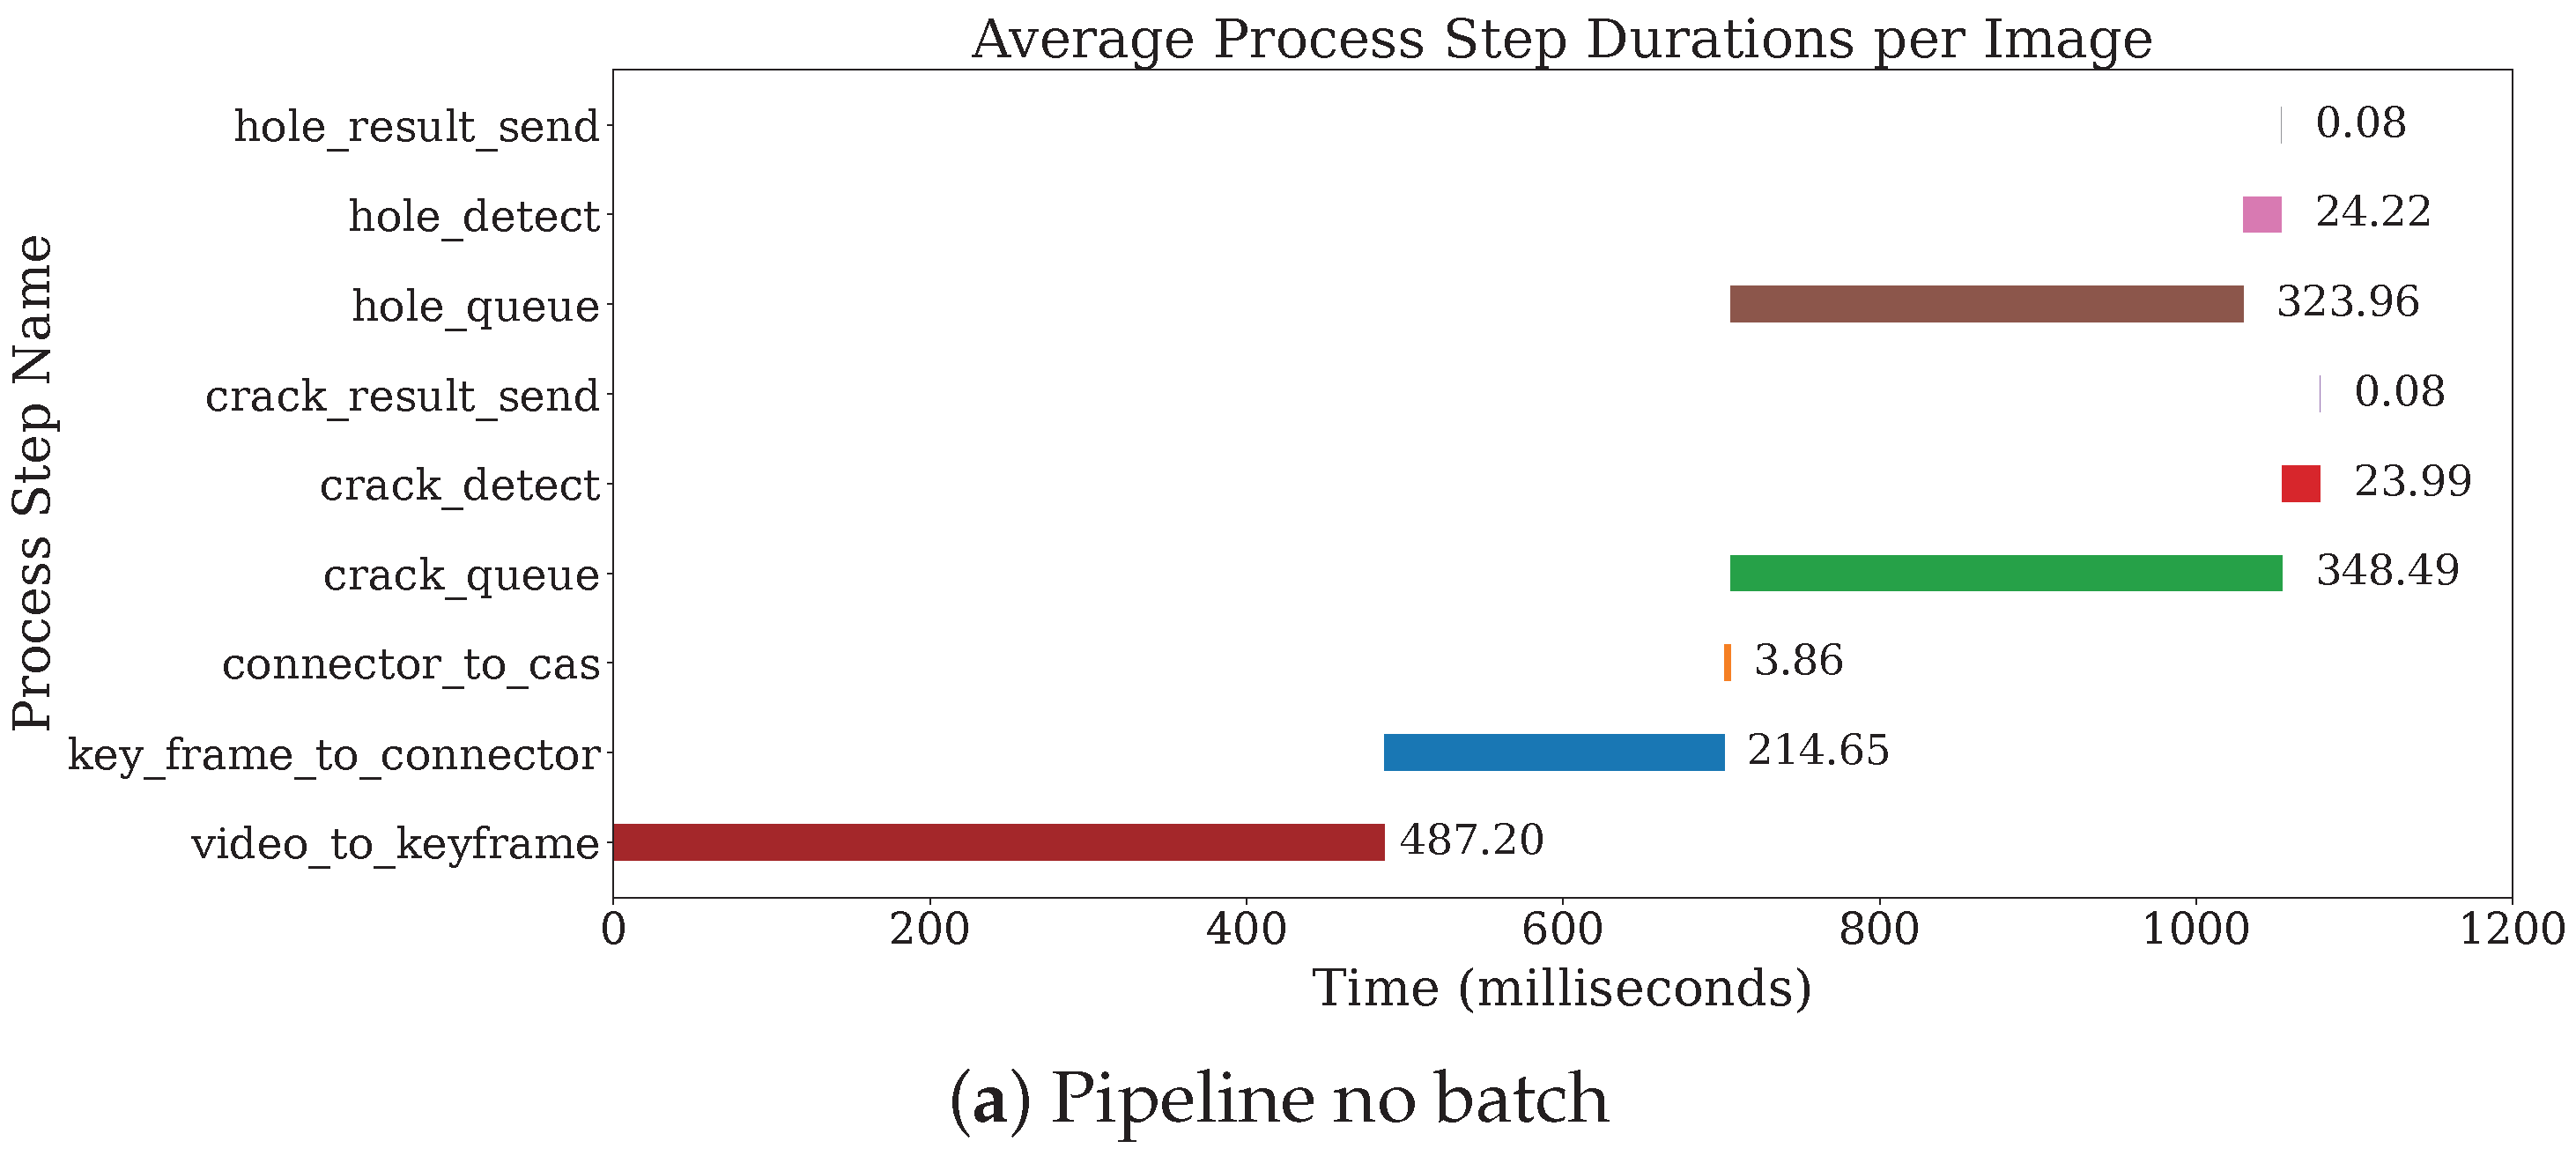
Section 5.5, we have evaluated the end-to-end latency of processing each object when deployed in three different ways. Each input image is processed by two YOLO models—one for crack detection and one for hole detection. As demonstrated in
Figure 2, we evaluated three batching deployment strategies:
Pipeline mode no batching: As described in
Figure 2a, in this setting, both models are placed in the same User Defined Logic (UDL) block, which sequentially runs the crack detection model followed by the hole detection model.
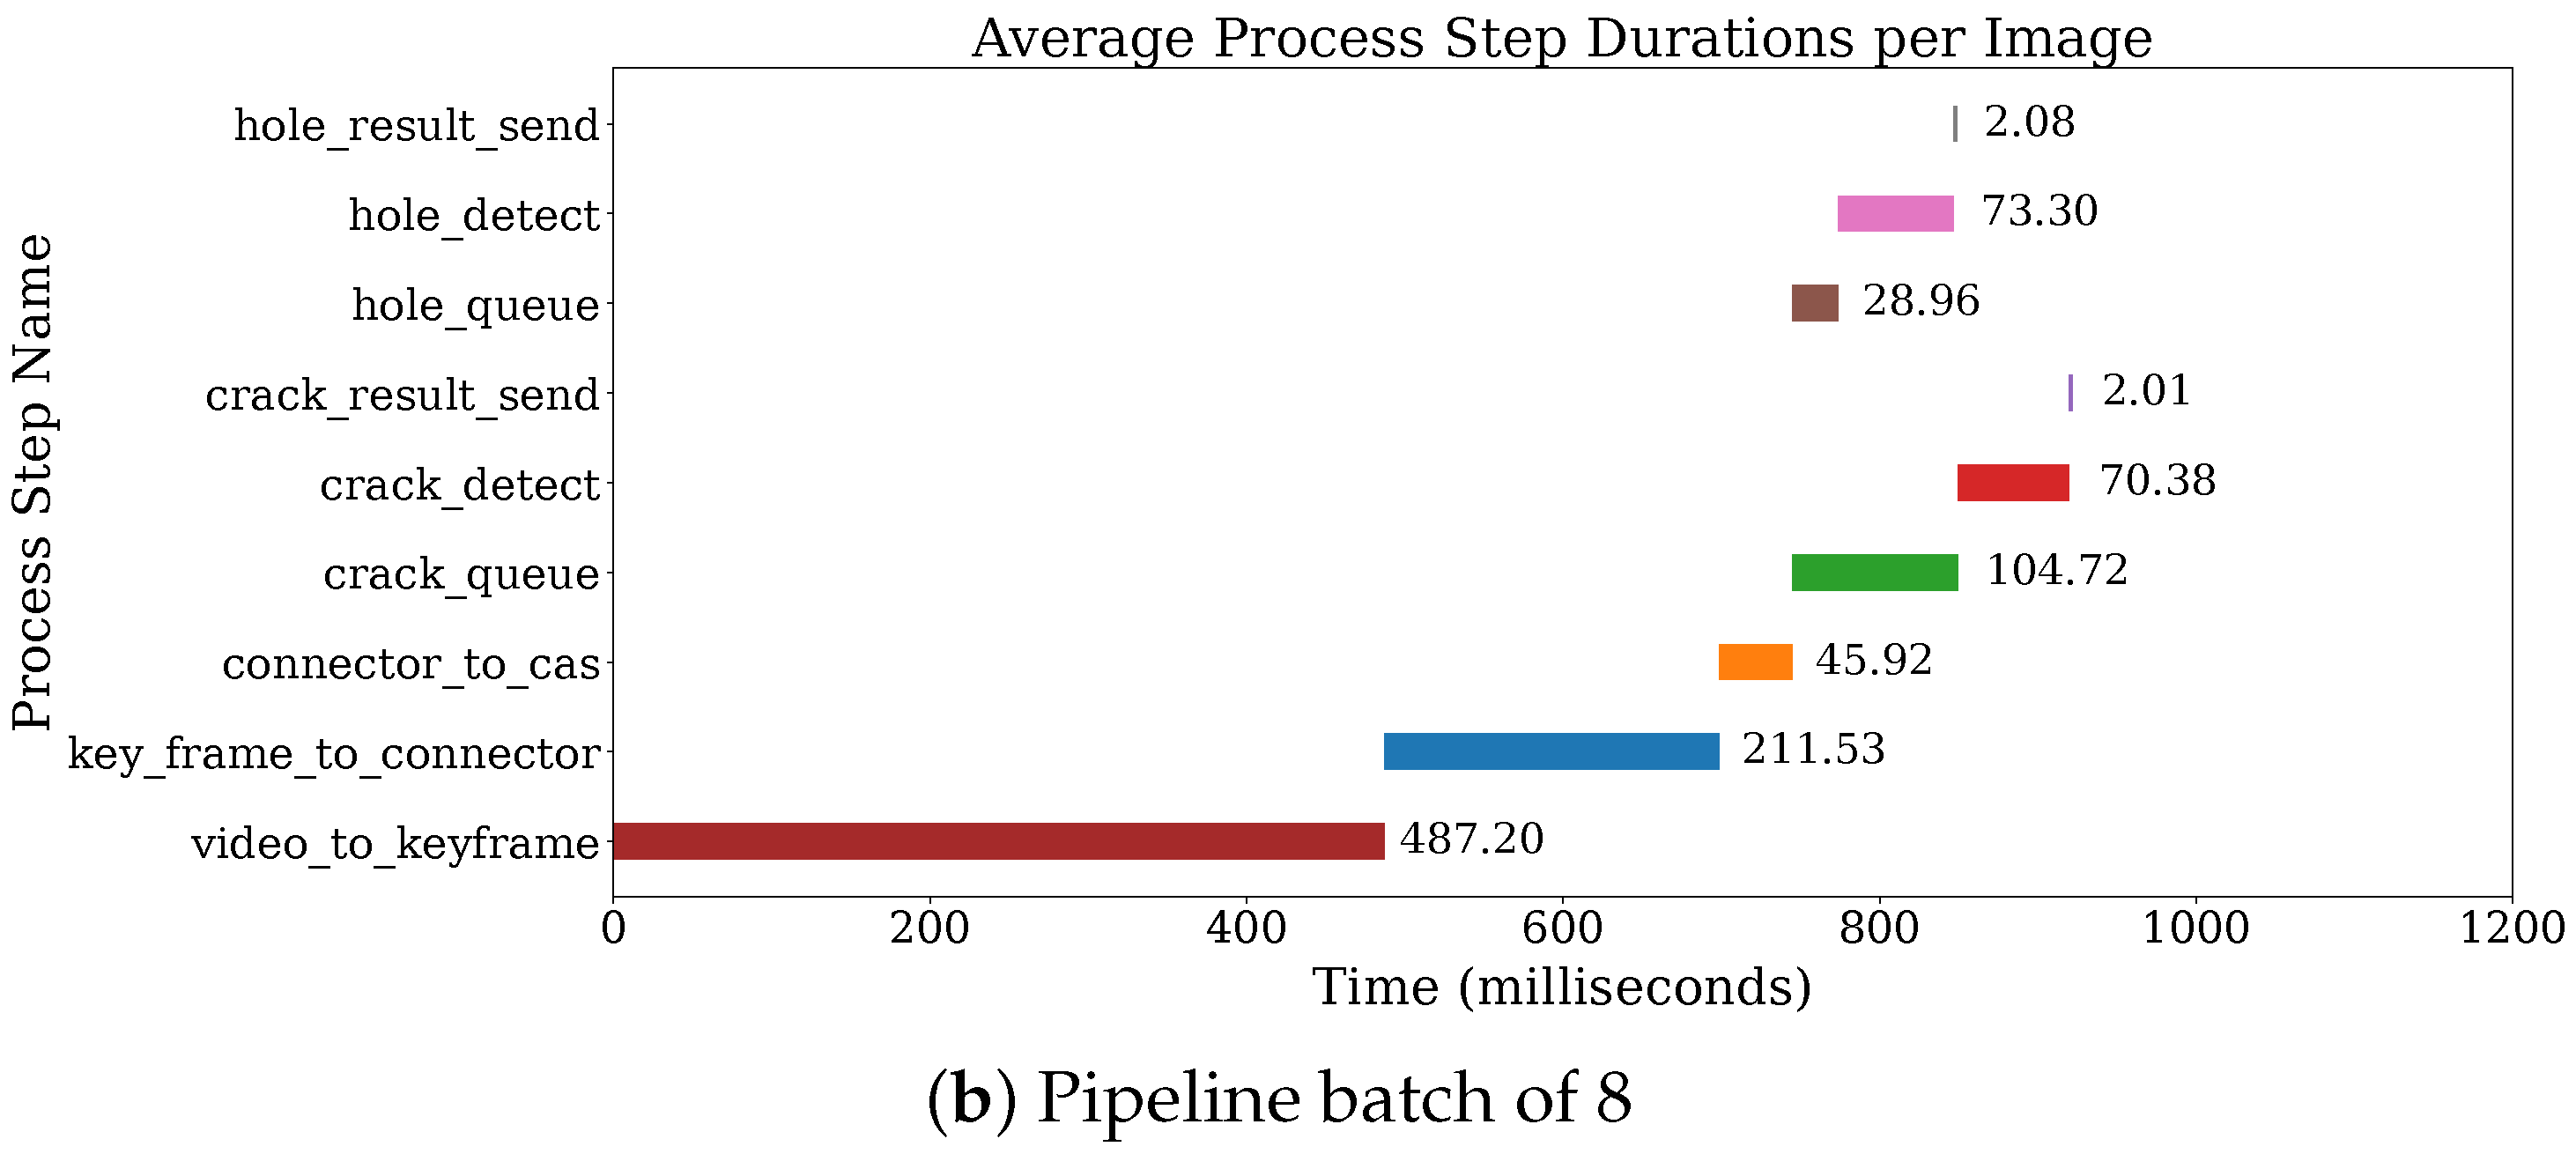
Pipeline mode batch of 8:
Figure 2b, both models are placed in the same User Defined Logic (UDL) block, which sequentially runs the crack detection model followed by the hole detection model, and at each step there is a batch of 8 images processing.
Parallel mode batch of 8: As illustrated in
Figure 2c, this setting allows the two models to execute concurrently for the same input. This setup was tested with a batch size of 8, we named it parallel_batch_8 in the plot.
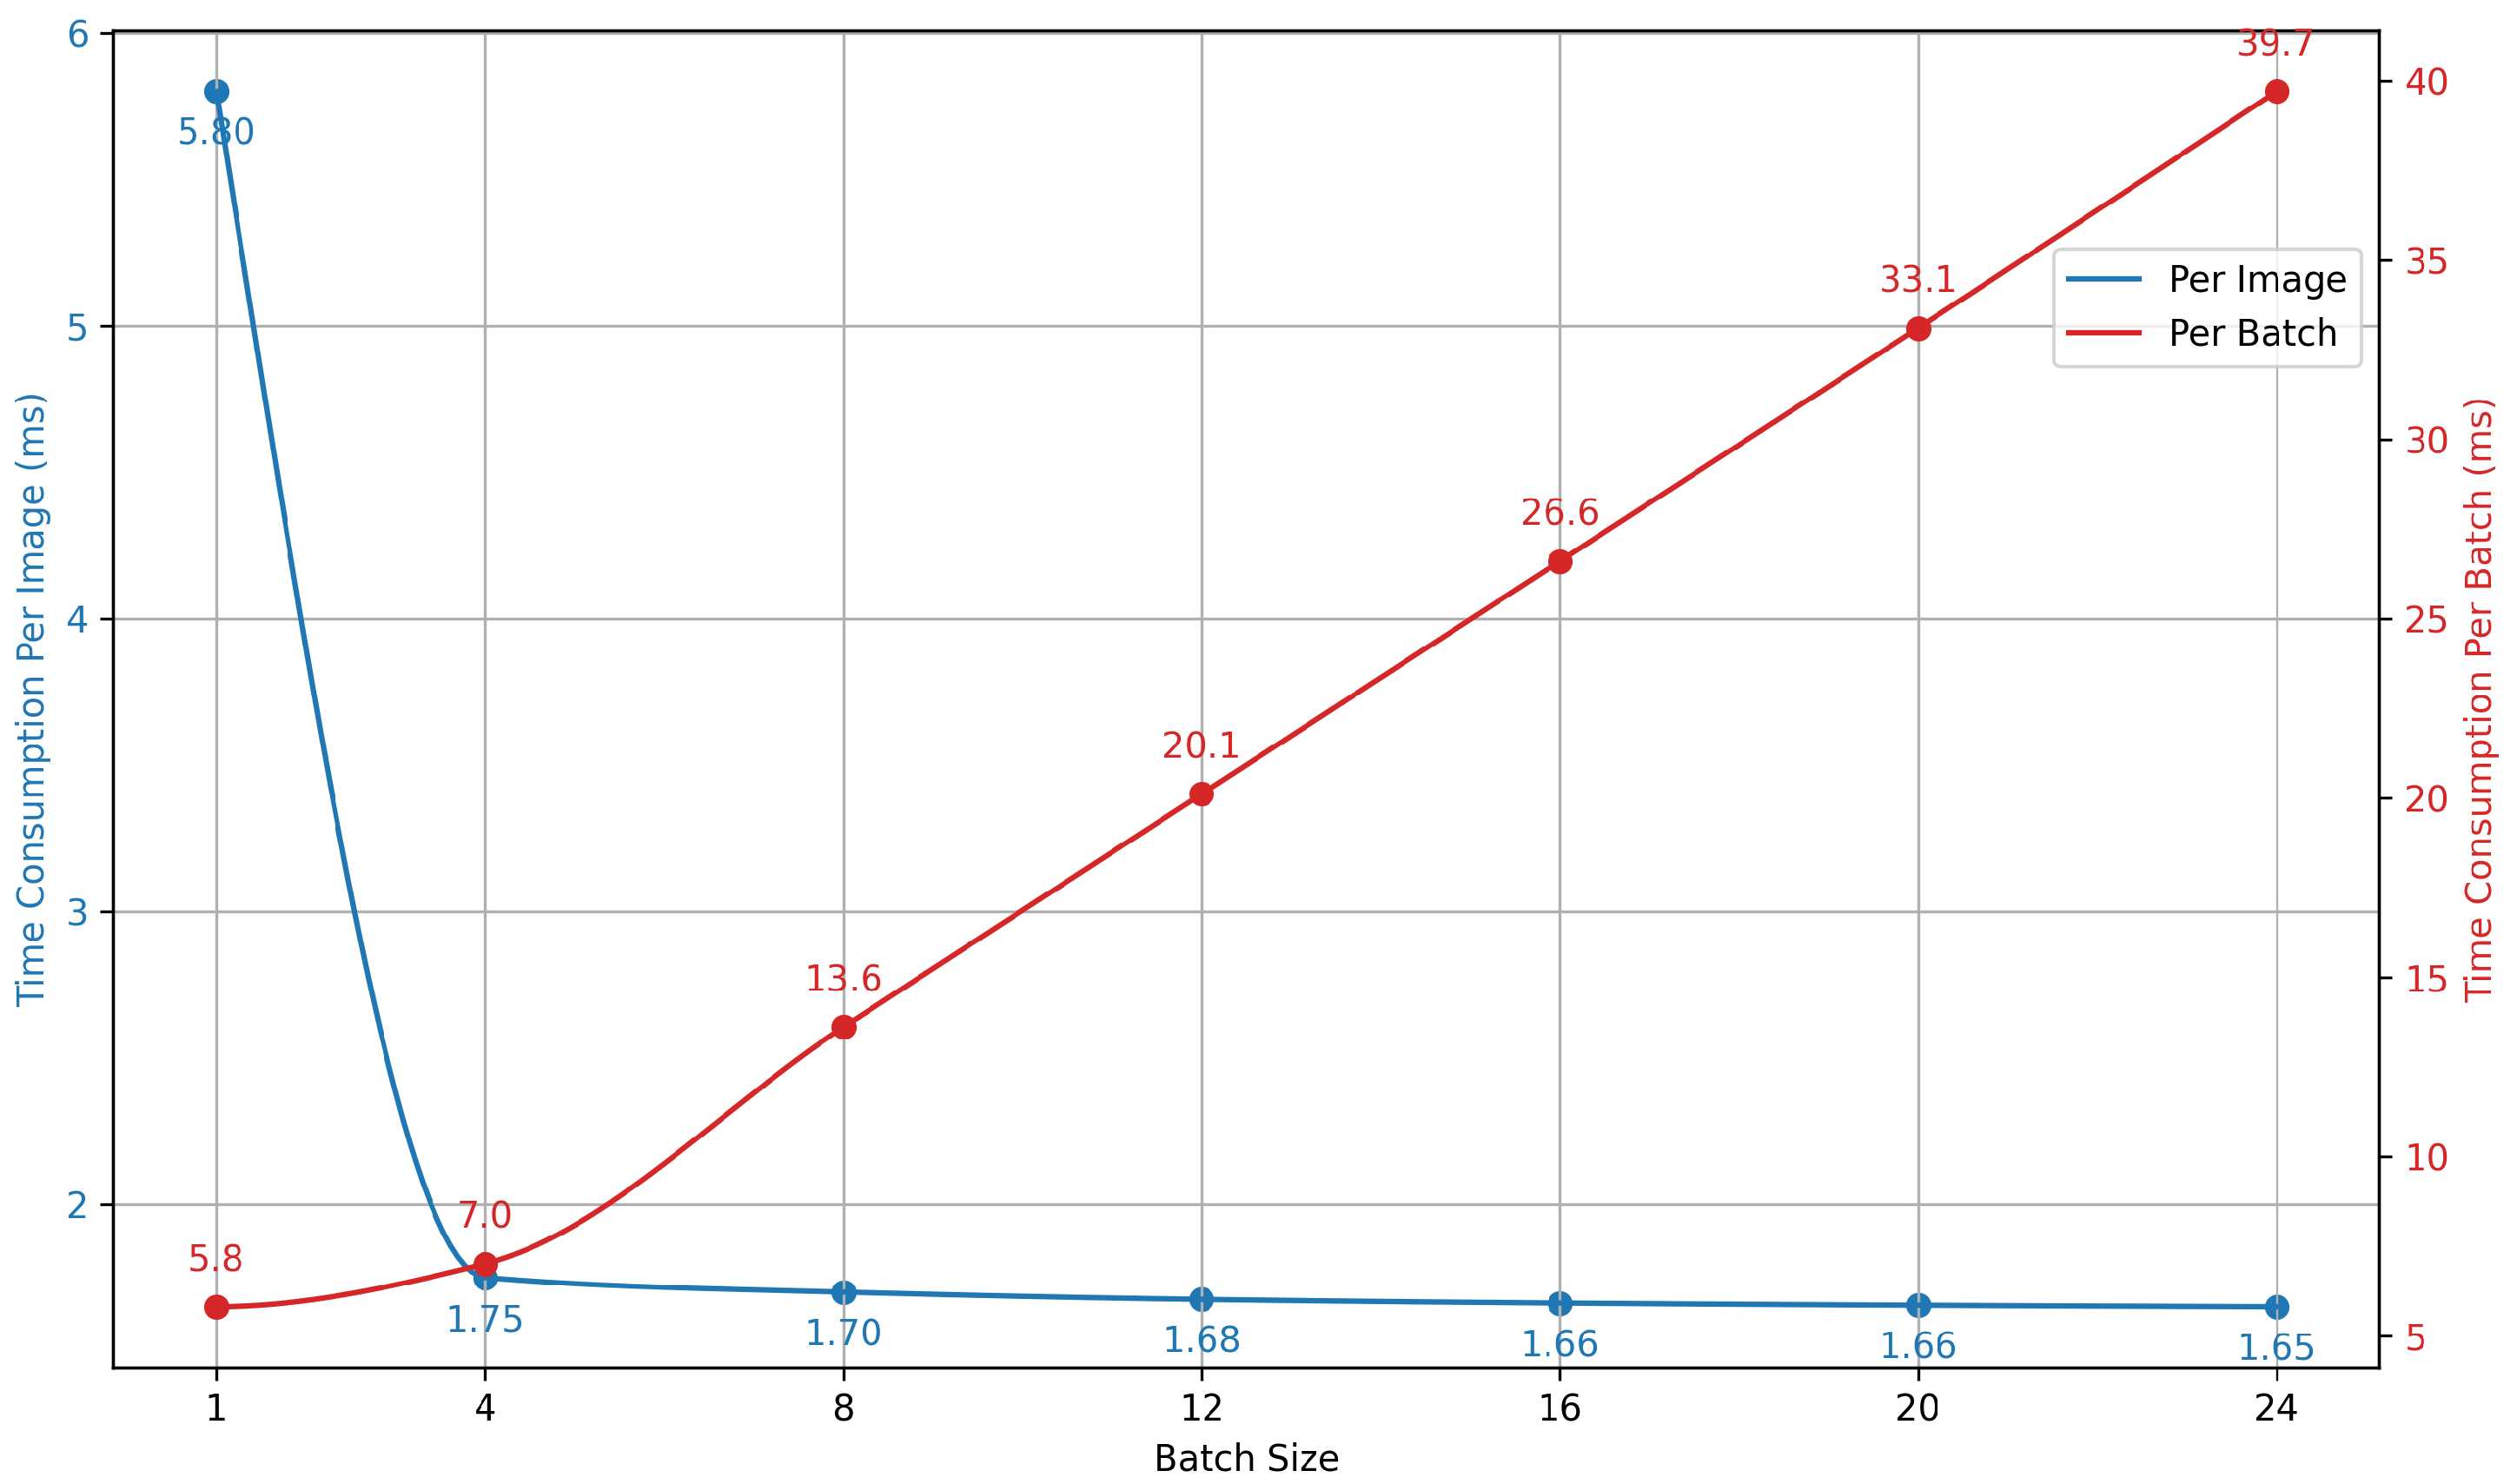
First, we examine the impact of batch size on the processing time of the VAD models. Specifically, we conduct experiments using the fine-tuned YOLOv5-small model for crack detection, measuring the total runtime—including both data loading and inference. The results are presented in
Figure 3. In practice, we set the batch size to eight for two main reasons. First, the per-image latency shows minimal improvement beyond a batch size of four, indicating that a batch size of eight is near-optimal. Second, the system’s workload pattern—eight image requests arriving every three seconds—naturally facilitates the formation of batches of eight. This batching reduces the queuing delay for later-arriving images, thereby lowering the overall end-to-end latency.
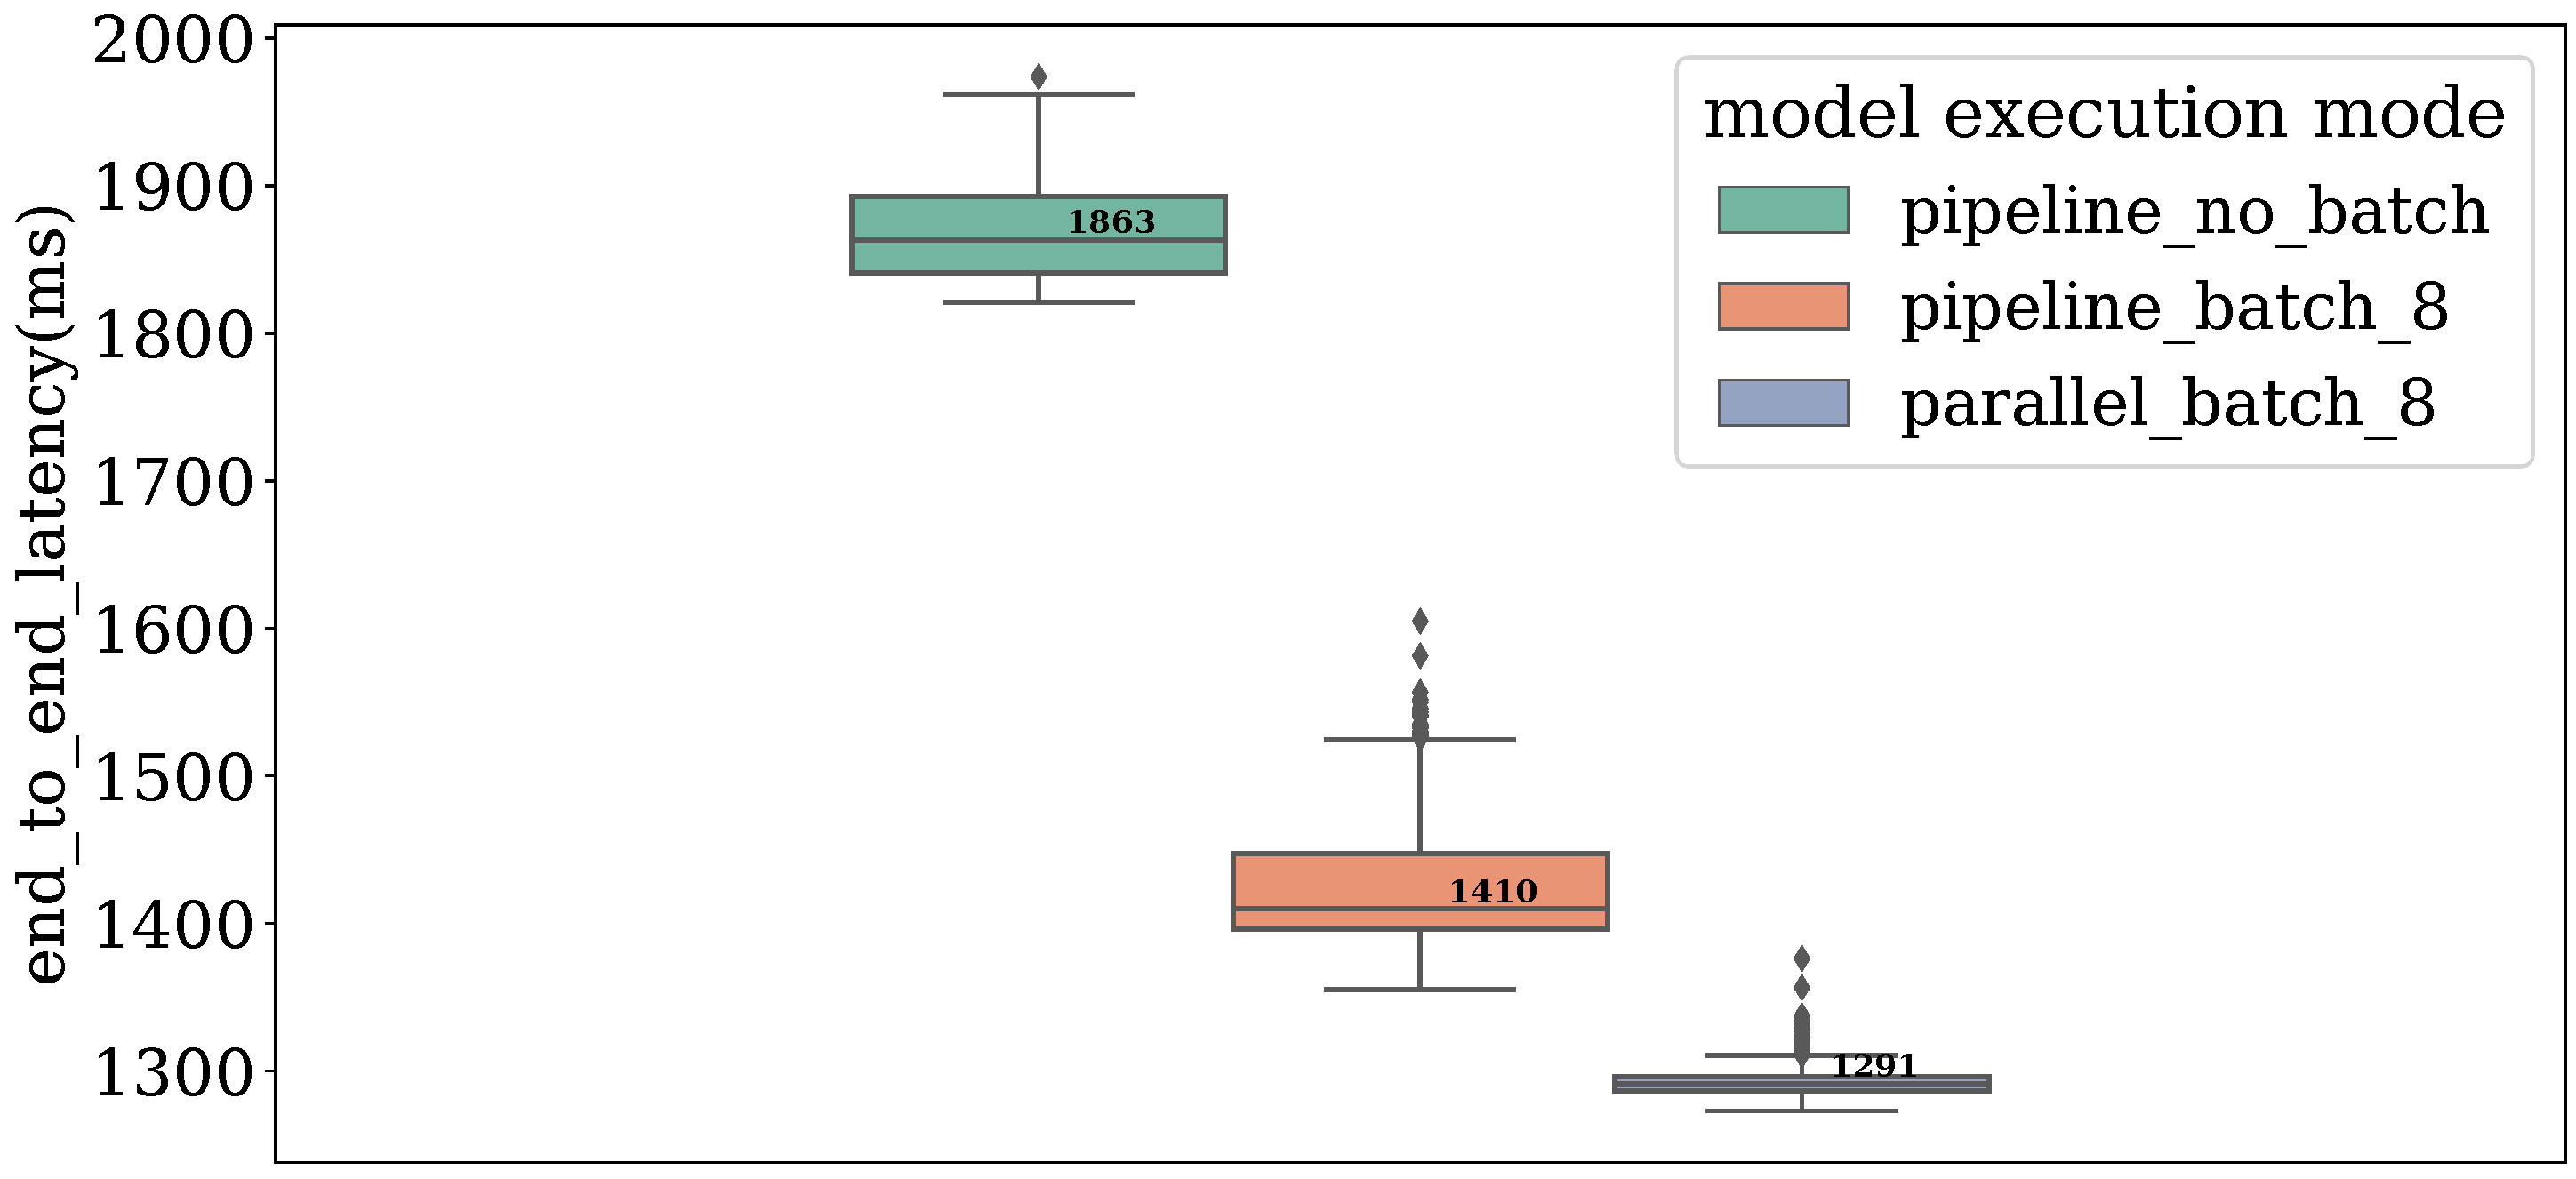
After selecting the batch size, we further evaluate the effectiveness of our optimization schemes, with results shown in
Figure 4. The end-to-end latency measured spans from key frame extraction to decision formation in the final aggregation module.
As evident from the results, all deployment configurations—leveraging the high-speed network and Cascade datastore—meet the latency requirement of 3 s. Moreover, introducing our optimizations reduces latency from 1863 ms to 1291 ms, a 30.7% improvement. Overall, these enhancements optimize the latency upper bound by 57%.
It is also worth noting that switching key frame extraction from a GPU-based solution to a CPU-based one results in latency ranging from 2023.8 ms to 2595.8 ms, which still remains within the acceptable time frame.
7. Future Work
We envision extending our IAI service along four key directions: human-in-the-loop collaboration, multimodality, adaptive learning, and large-scale deployment.
First, rather than replacing human operators, our goal is to develop a human-assistive IAI system that augments human capabilities and reduces workload. For example, a system might flag increasing defect rates and assist the shop-floor operator in identifying the root cause (perhaps, a defective lot of sheet metal stock), enabling rapid response to problems and reducing recurring defects. Realizing such functionality will involve challenges in both information retrieval and multi-modal summarization, as the system must effectively synthesize insights from video data and model outputs into human-understandable formats.
We recognize that multimodal data integration is essential for enhancing IAI services, as visual inspection alone is often insufficient for comprehensive quality assessment. In many manufacturing scenarios, complementary modalities such as X-ray and ultrasound imaging are commonly employed to reveal subsurface or internal defects. Incorporating these additional data sources will require advanced reasoning capabilities within the IAI system to effectively correlate information across modalities and generate holistic, accurate assessments.
Then, we aim to make the system adaptive through human feedback. By incorporating reinforcement learning techniques, the IAI service can learn from operator corrections—such as identifying false positives or false negatives—and gradually improve its detection performance. This approach would enable a deployed system to evolve alongside changing production conditions, addressing issues of data drift and maintaining accuracy over time.
Finally, we plan to scale the system to support deployment across hundreds of inspection stations, each potentially utilizing distinct VAD models. Achieving this goal poses system-level challenges, because it would require deploying Cascade into a multi-tenancy configuration in which a larger cluster is shared across a great many workflows with diverse data arrival rates, diverse tasks, much larger numbers of specialized models, etc.
8. Conclusions
In this paper, we presented a complete design and implementation of an IAI service for real-time VAD on a smart shop floor. Our academic/product collaboration enabled an effort that accurately replicates shop-floor conditions, hardware, and production scenarios. The example studied in depth uses a synthetic data set, but is representative of the tasks, latency and accuracy expectations encountered in industrial settings.
We began by introducing the system architecture and the data flow among major software components. We then discussed our software implementation in detail, and explored optimization opportunities of batching and parallel computing. Through systematic evaluation, we have shown that our optimized solution is viable for industrial deployment. It can complete all the tasks with the same efficacy while only taking 43% of the latency, a result that would be considered a very tight bound in our target setting.


 ,
, 
