1. Introduction
The representation of diverse visual experiences from the real world through image rendering poses a significant challenge within the realm of visual technology. High Dynamic Range (HDR) images, whether synthetically generated or captured from reality, transcend the traditional limitations of media in presenting visual content [
1,
2]. However, the conventional mediums, i.e., low dynamic range (LDR) displays, fail to fully convey the inherent luminous intensity of HDR imagery, resulting in a diminished portrayal characterized by a loss of brilliance and depth [
3].
Beyond its luminosity, HDR imagery enhances user experiences by offering prominent highlights and intricate details across varying brightness levels. This quality is further augmented through the integration of Wide Colour Gamut (WCG) images, expanding the colour spectrum and augmenting visual precision [
4].
In the sphere of video HDR/WCG frameworks, prevalent encoding standards such as hybrid log-gamma (HLG) and perceptual quantization (PQ) delineated in ITU-R BT.2100-2 share fundamental attributes like matching primaries and white points [
5]. However, their divergent transfer functions set them apart, with PQ serving as an absolute colourimetric display-referred encoding and HLG accommodating dual interpretations within the same standard, reflecting scene light and display light.
Addressing the challenge of presenting transformed HLG/PQ images on Standard Dynamic Range (SDR) displays is the focal point of HDR tone mapping (TM). Throughout historical evolution, an array of TM methods or operators has emerged [
6,
7,
8], complicating a comprehensive understanding of their respective advantages and limitations. Considering this, the International Telecommunication Union (ITU) proposed three different methods to convert HDR to SDR in their recommendation ITU-R BT.2446-0 [
9]. Hence, there is a need for a systematic comparison of these methods.
Before diving into the literature on the evaluation of the TM operators, it is essential to shed some light on the key works related to the characteristics of HDR and HDR TM. E. Reinhard, in his work [
7], mentioned key concepts related to HDR, describing the acquisition of HDR images and display devices, then described the human visual system and HDR TM. Similarly, in [
10], the authors offered an extensive overview of HDR methods and technologies. They introduced the fundamental concepts that underlay the perception of HDR imagery, serving as both an entry point into the subject and a comprehensive examination of the state of the art in HDR imaging at the time. The topics covered included capturing HDR content with cameras and generating it through computer graphics methods, encoding and compressing HDR images and video, TM for showcasing HDR content on SDR displays, and reverse TM for adapting older content for presentation on HDR displays. These different display technologies supported HDR ranges, and lastly, image and video quality metrics tailored for HDR content assessment. In [
11], the authors presented TM algorithms and demonstrated good results for TM.
The evaluation of TM operators has been a prevalent topic in the literature. One notable study by V. Cadik and colleagues [
12] delved into the assessment of 14 tone-mapping operators. They used perceptual attributes like brightness and contrast while also exploring the relationships between these attributes.
Another significant work by Eilertsen et al. [
13] conducted pair comparison experiments specifically focused on finding the most suitable TM operator for HDR videos. Their evaluation criteria centred on identifying artefacts and assessing colour renditions.
Furthermore, Ferradans et al. [
14] carried out subjective experiments to analyze various TM operators. Their evaluation criteria included visual adaptation and contrast perception.
Chan et al. [
15] introduced the idea of gain maps, which are the ratios of the HDR images to the SDR images. These are in the logarithmic base. Gain maps provide an image-dependent means of mapping between HDR and SDR, bidirectionally and with controls to interpolate between HDR and SDR depending on the available luminance of the output display.
Despite the vast literature on HDR, there is still a need for the evaluation of the content dependencies of the conversion methods. Also, there is still the requirement to evaluate the best weights using gain maps generated using HDR and SDR images.
This project endeavours to convert HDR images into HLG-transformed images and subsequently apply three distinct TM methods, as outlined in ITU-R BT.2446-0 [
9], to encode the images into ITU-R BT.709 [
16]. Following this, a subjective experiment will be conducted to select the most effective TM method. Subsequent stages will involve the generation of gain maps and further subjective experimentation.
In summary, the project objectives encompass the following:
Implementation of three methods to convert HDR to SDR.
Identification of the optimal conversion method that upholds image quality, retains details, and preserves the artistic integrity of the original HDR content when viewed on SDR displays.
Examination of content dependency of the transforms.
Calculating and applying gain maps to control the interpolation between HDR and SDR depending on the available luminance of the output display.
The rest of the paper is organized as follows:
Section 2 presents a detailed description of the methods used in this study. Then,
Section 3 explains the experimental setup, followed by
Section 4, which presents the experimental results and discussion.
Section 5 concludes the study.
2. Methodology
This section briefly describes each methodology used in this study. Initially, HDR images obtained from the database [
17] were converted to an HLG signal using the transformation described in [
4]. After transforming HDR images to HLG images, the biggest challenge was to display these signals on an SDR display. For this, three different HDR-to-SDR conversion methods described in [
9] were used, and all the images were encoded to BT.709 colourimetry. Then, a subjective experiment was conducted to choose the best conversion method, and gain maps were calculated.
As described below, there are two ways to convert the input signal to HLG.
2.1. Display-Referred HLG Workflow
The display-referred HLG signal is converted to the HLG signal. Initially, the inverse EOTF, described in [
4], is applied to obtain the display-referred HLG file. To display this HLG signal on the HLG display, the EOTF, as described in [
4], is applied.
2.2. Scene-Referred HLG Workflow
The scene-referred HLG signal is converted to the HLG signal. Initially, the HLG OETF, described in [
4], is applied to obtain the scene-referred HLG file. To display this HLG signal on the HLG display, the EOTF, described in [
4], is applied.
2.3. HDR-to-SDR Conversion
After the HLG conversion, three HDR-to-SDR conversion methods, i.e., A, B, and C, described in [
9], were applied.
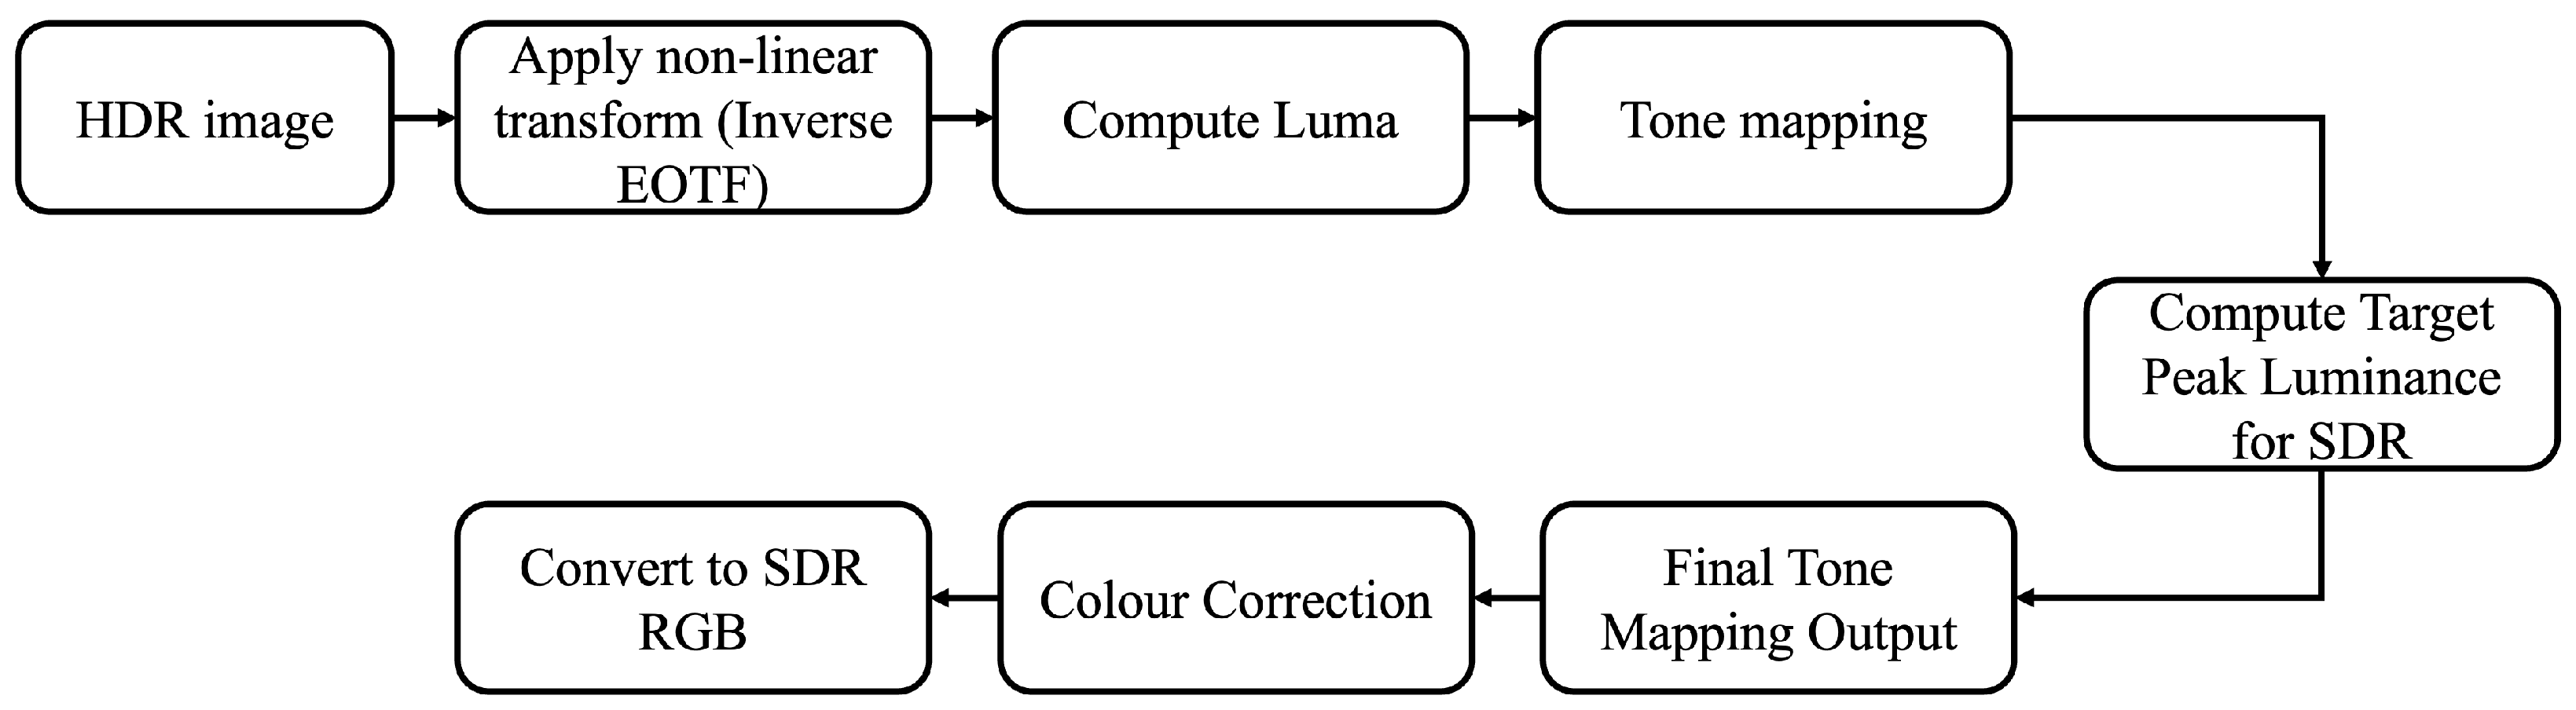
2.3.1. Method A
An HDR signal in the RGB colour space, conforming to the colourimetry outlined in Recommendation ITU-R BT.2100 [
5] and assumed to be generated at 1000 cd/m
2, can undergo tone mapping to convert it into SDR luma values
. This process involves several steps: first, the signal is converted into a perceptually linear space; next, a knee function is applied within this perceptual domain; finally, the signal is transformed back into the gamma domain.
Changes in the overall brightness of an image displayed can influence how colours are perceived due to the relationship between human colour perception and brightness. This alteration can impact saturation, as exemplified by the Hunt effect. To ensure consistency in colour perception before and after tone mapping, a correction process is necessary. This correction utilizes the HDR
signal along with the luma signals
and
. Implemented on an SDR signal, this correction and subsequent reconstruction of a colour signal result in an SDR signal specified in the
colour space. This output can either be directly displayed or converted to RGB using Recommendation ITU-R BT.2020. Detailed information for the colour correction process is available in [
9]. The flow diagram of Method A is shown in
Figure 1.
2.3.2. Method B
In this method, initially, the HLG signal is passed from HLG EOTF to obtain the SDR display light, and then the RGB of Recommendation BT.2100 is converted to XYZ, which is converted to
colour space. After this conversion, the tone mapping is applied to
to obtain
, which is passed to the colour mapping block, whereas
are directly given as another input to the colour mapping block. This block performs gamut volume compression to BT.709 volume, and the resulting Yu′v′ is converted back to XYZ to obtain the SDR display light. This SDR display light is further passed from the inverse BT.1886 EOTF [
18] with a peak luminance of 100 cd/m
2 to obtain an SDR BT.709 signal. The flow diagram of this method is shown in
Figure 2, and further detailed information can be obtained from [
9].
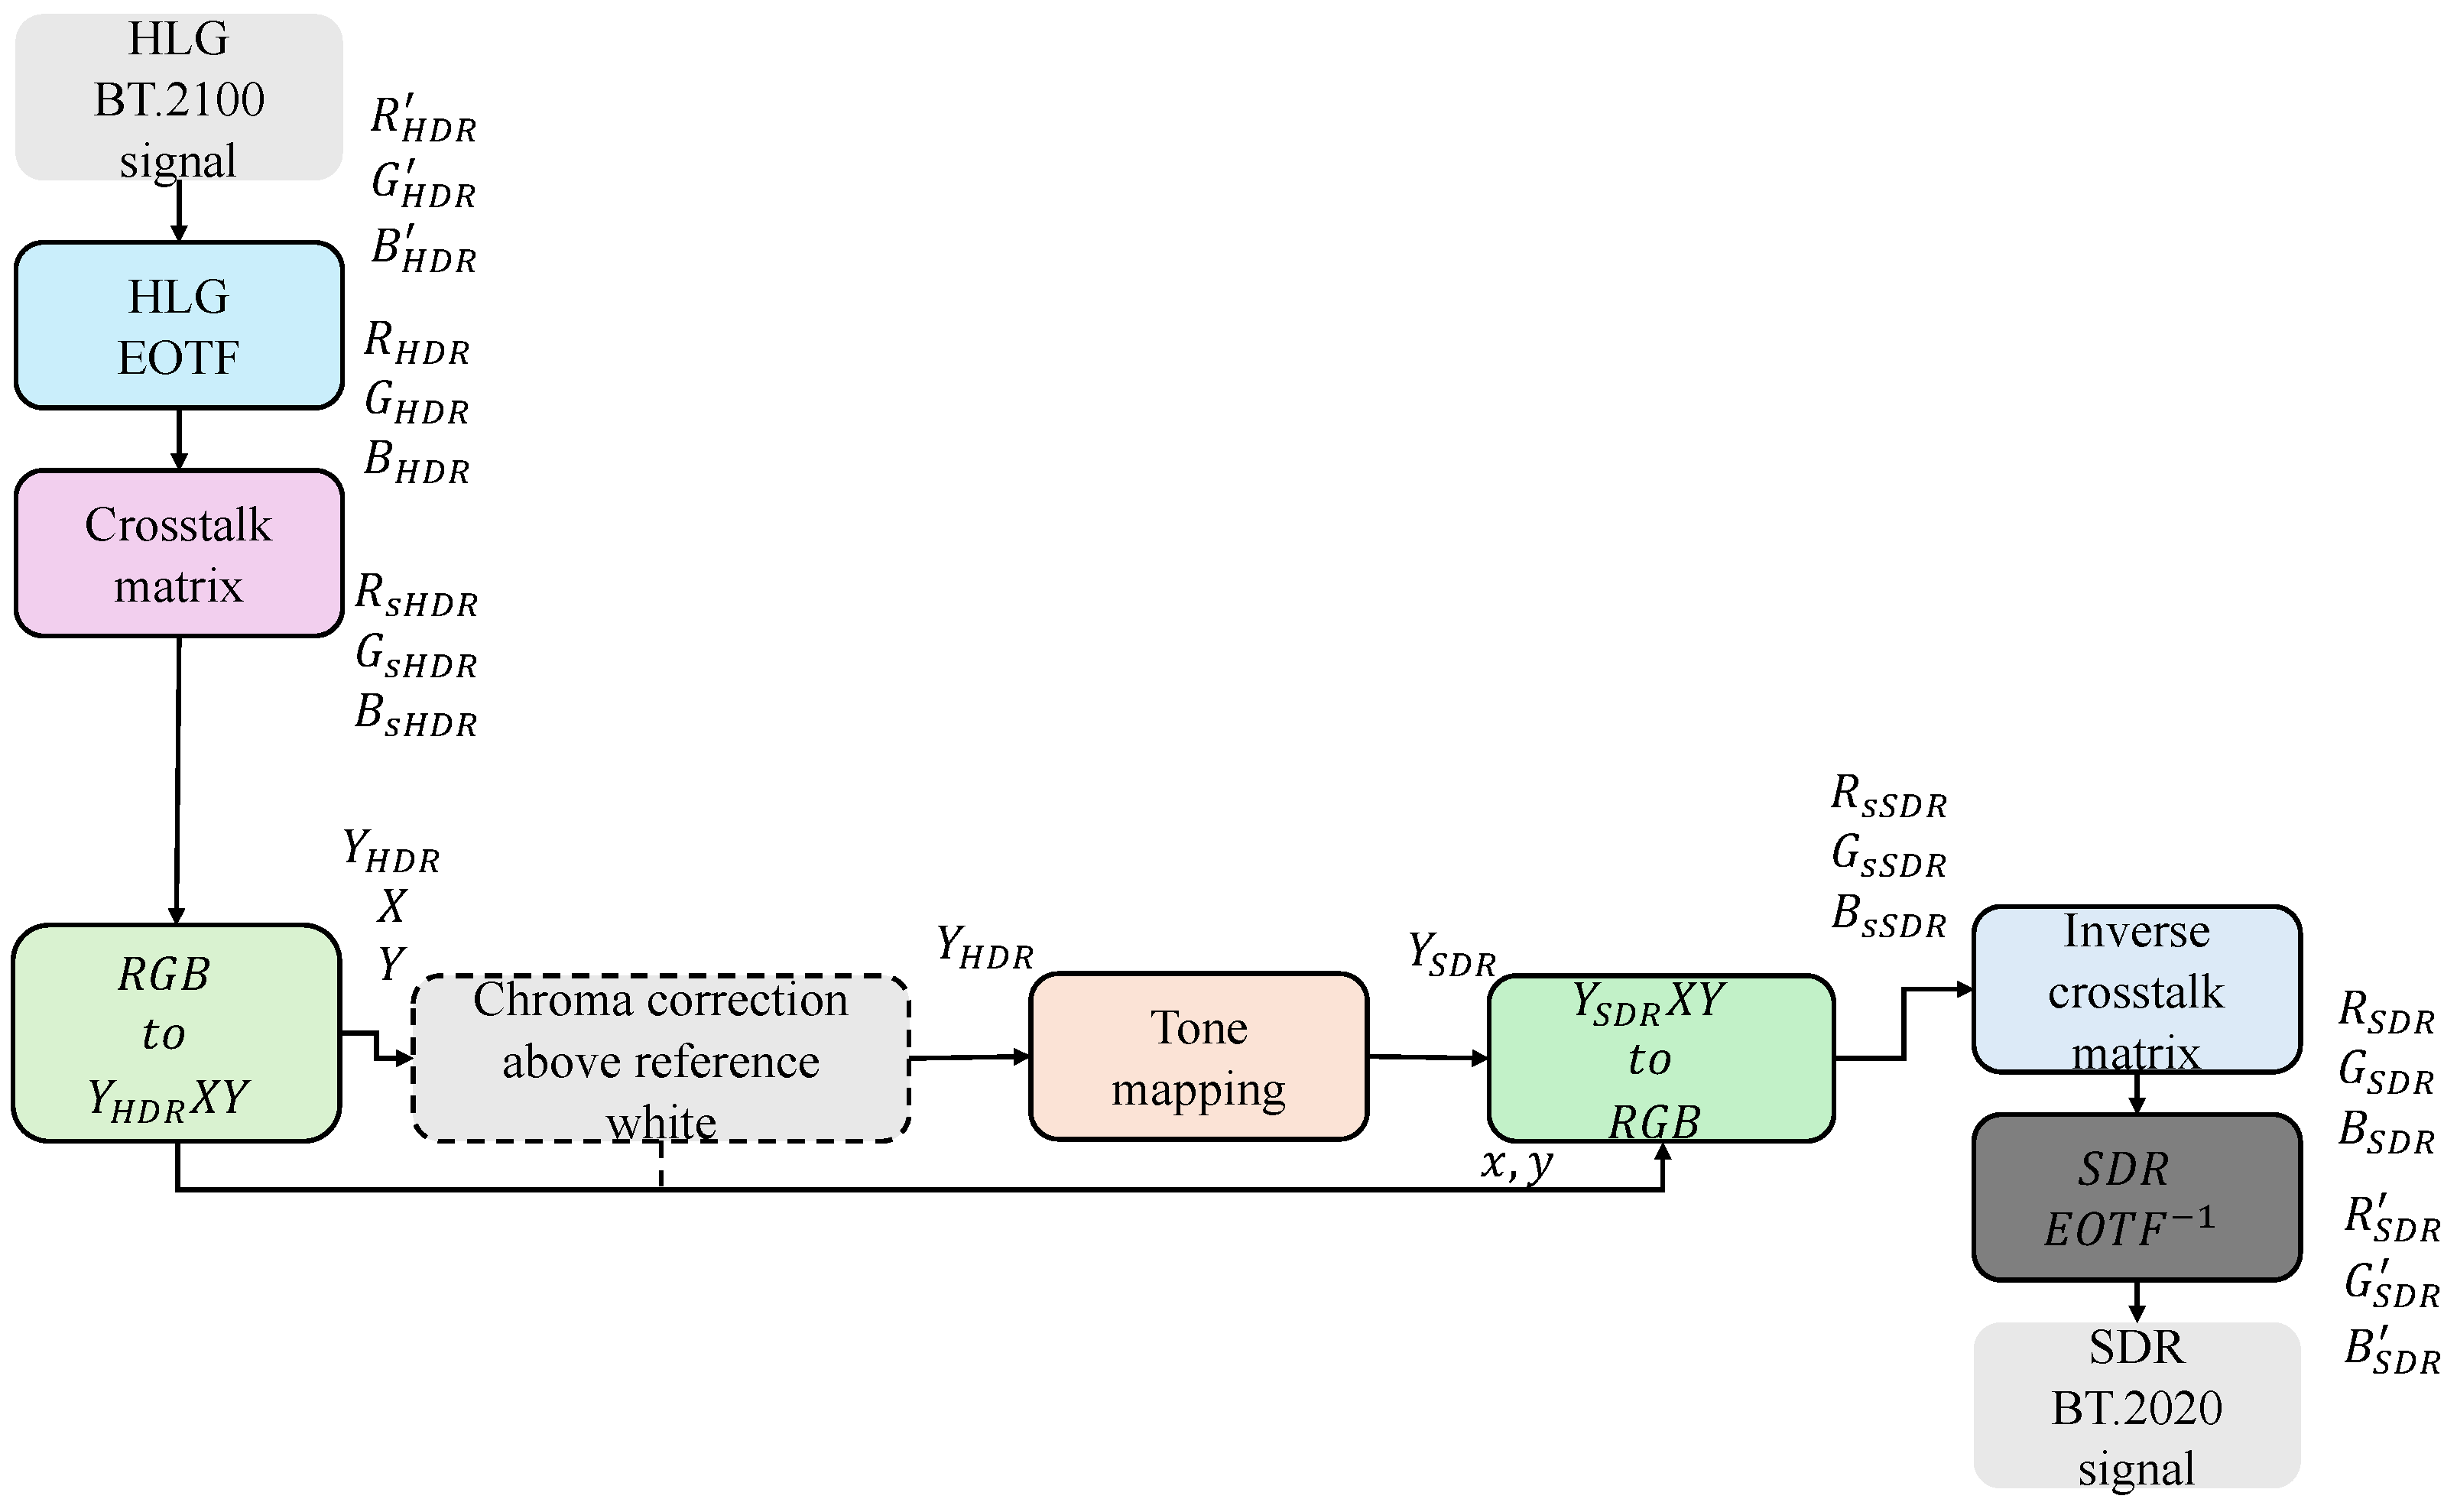
2.3.3. Method C
In this method, the HLG BT.2100 signal is given as input to the HLG EOTF, which yields the non-linear RGB of HDR. Then, the cross-talk matrix is applied to obtain the standard RGB of HDR. These RGBs are converted to
after that, chroma correction above reference white is applied to obtain
, and then tone mapping is applied to obtain
. After tone mapping,
is converted to the sRGB of SDR, and the inverse cross-talk matrix is applied to obtain non-linear RGB, followed by the inverse EOTF to obtain a linear SDR BT.2020 signal [
19]. This signal was further converted to a BT.709 signal for displaying on an SDR display of the lab. All these steps are shown in the flow diagram in
Figure 3 and are described in detail in [
9].
2.4. Gain Map Calculation
Gain maps can be calculated using Equation (
1), as proposed in [
15]:
where
denotes the pixel values of the High Dynamic Range image.
denotes the pixel values of the Standard Dynamic Range image.
is a small positive constant added to the HDR image to ensure numerical stability and avoid division by zero.
is a small positive constant added to the SDR image for the same purpose.
is the base-2 logarithm function, used to express the ratio in log space.
This formulation stabilizes the gain map computation, especially in low-intensity regions, and is useful for HDR-to-SDR mapping tasks.
2.5. Steps to Calculate Gain Maps
In the plenary session on “Embedded Gain Maps for Adaptive Display of High Dynamic Range Images” by Eric Chan and Paul M. Hubel [
15], the researchers demonstrated the steps to find gain maps if the SDR and HDR renditions are known. Gain maps can be quotient gain maps, which are calculated by dividing HDR images by SDR, as these can be logarithmic-based. These gain maps are basically calculated in the linear colour space with gamma encoding of 1.0, and the formula is presented in Equation (
1). These gain maps can be encoded in the header of the file as specified by the researchers from Apple in ISO/WD 21496-1 [
20]. To calculate gain maps, we used HDR images of the dataset and corresponding SDR images calculated using Method C. After finding gain maps, the minimum and maximum were calculated based on the minimum and maximum, normalization was performed, then gamma was applied, and the output was stored in the image. In our dataset, HDR images are stored in 16-bit floating point format, SDR images in 8-bit per channel, and gain maps in 16-bit floating point. The flow diagram to calculate the gain map and its metadata is shown in
Figure 4.
2.6. First Subjective Experiment
After the HDR-to-SDR conversion, the next step was to choose the best conversion method through a psycho-visual experiment in which the null reference-based categorical judgment method based on the Torgerson method described in [
21] was used.
The observers were asked to rate each image based on pleasantness, naturalness, detail, colour saturation, and overall quality. The most important attributes were pleasantness and naturalness. The rating was from zero to five, which means there were six categories. Zero was considered to be the worst, while five was the best.
For this experiment, MATLAB 2023b App Designer was used to create software that turned the interpolation or resizing off while displaying encoded SDR images.
2.7. Second Subjective Experiment
The relationship between HDR and SDR, according to a plenary on “Embedded Gain Maps for Adaptive Display of High Dynamic Range Images” by Eric Chan and Paul M. Hubel [
15], is
where
HDR is the HDR rendition of the image;
SDR is the SDR rendition of the image;
G is the gain map;
w is the waiting parameter, which is from 0 to 1.
For the second subjective experiment, another MATLAB application was designed so that observers could vary the output rendition of the image to either or depending on the value of w. As the experiment was conducted on an SDR display, it was more related to finding the optimal w value in which all the details were visible in a visually pleasing manner. This experiment also tells us whether the w value is content-dependent or not.
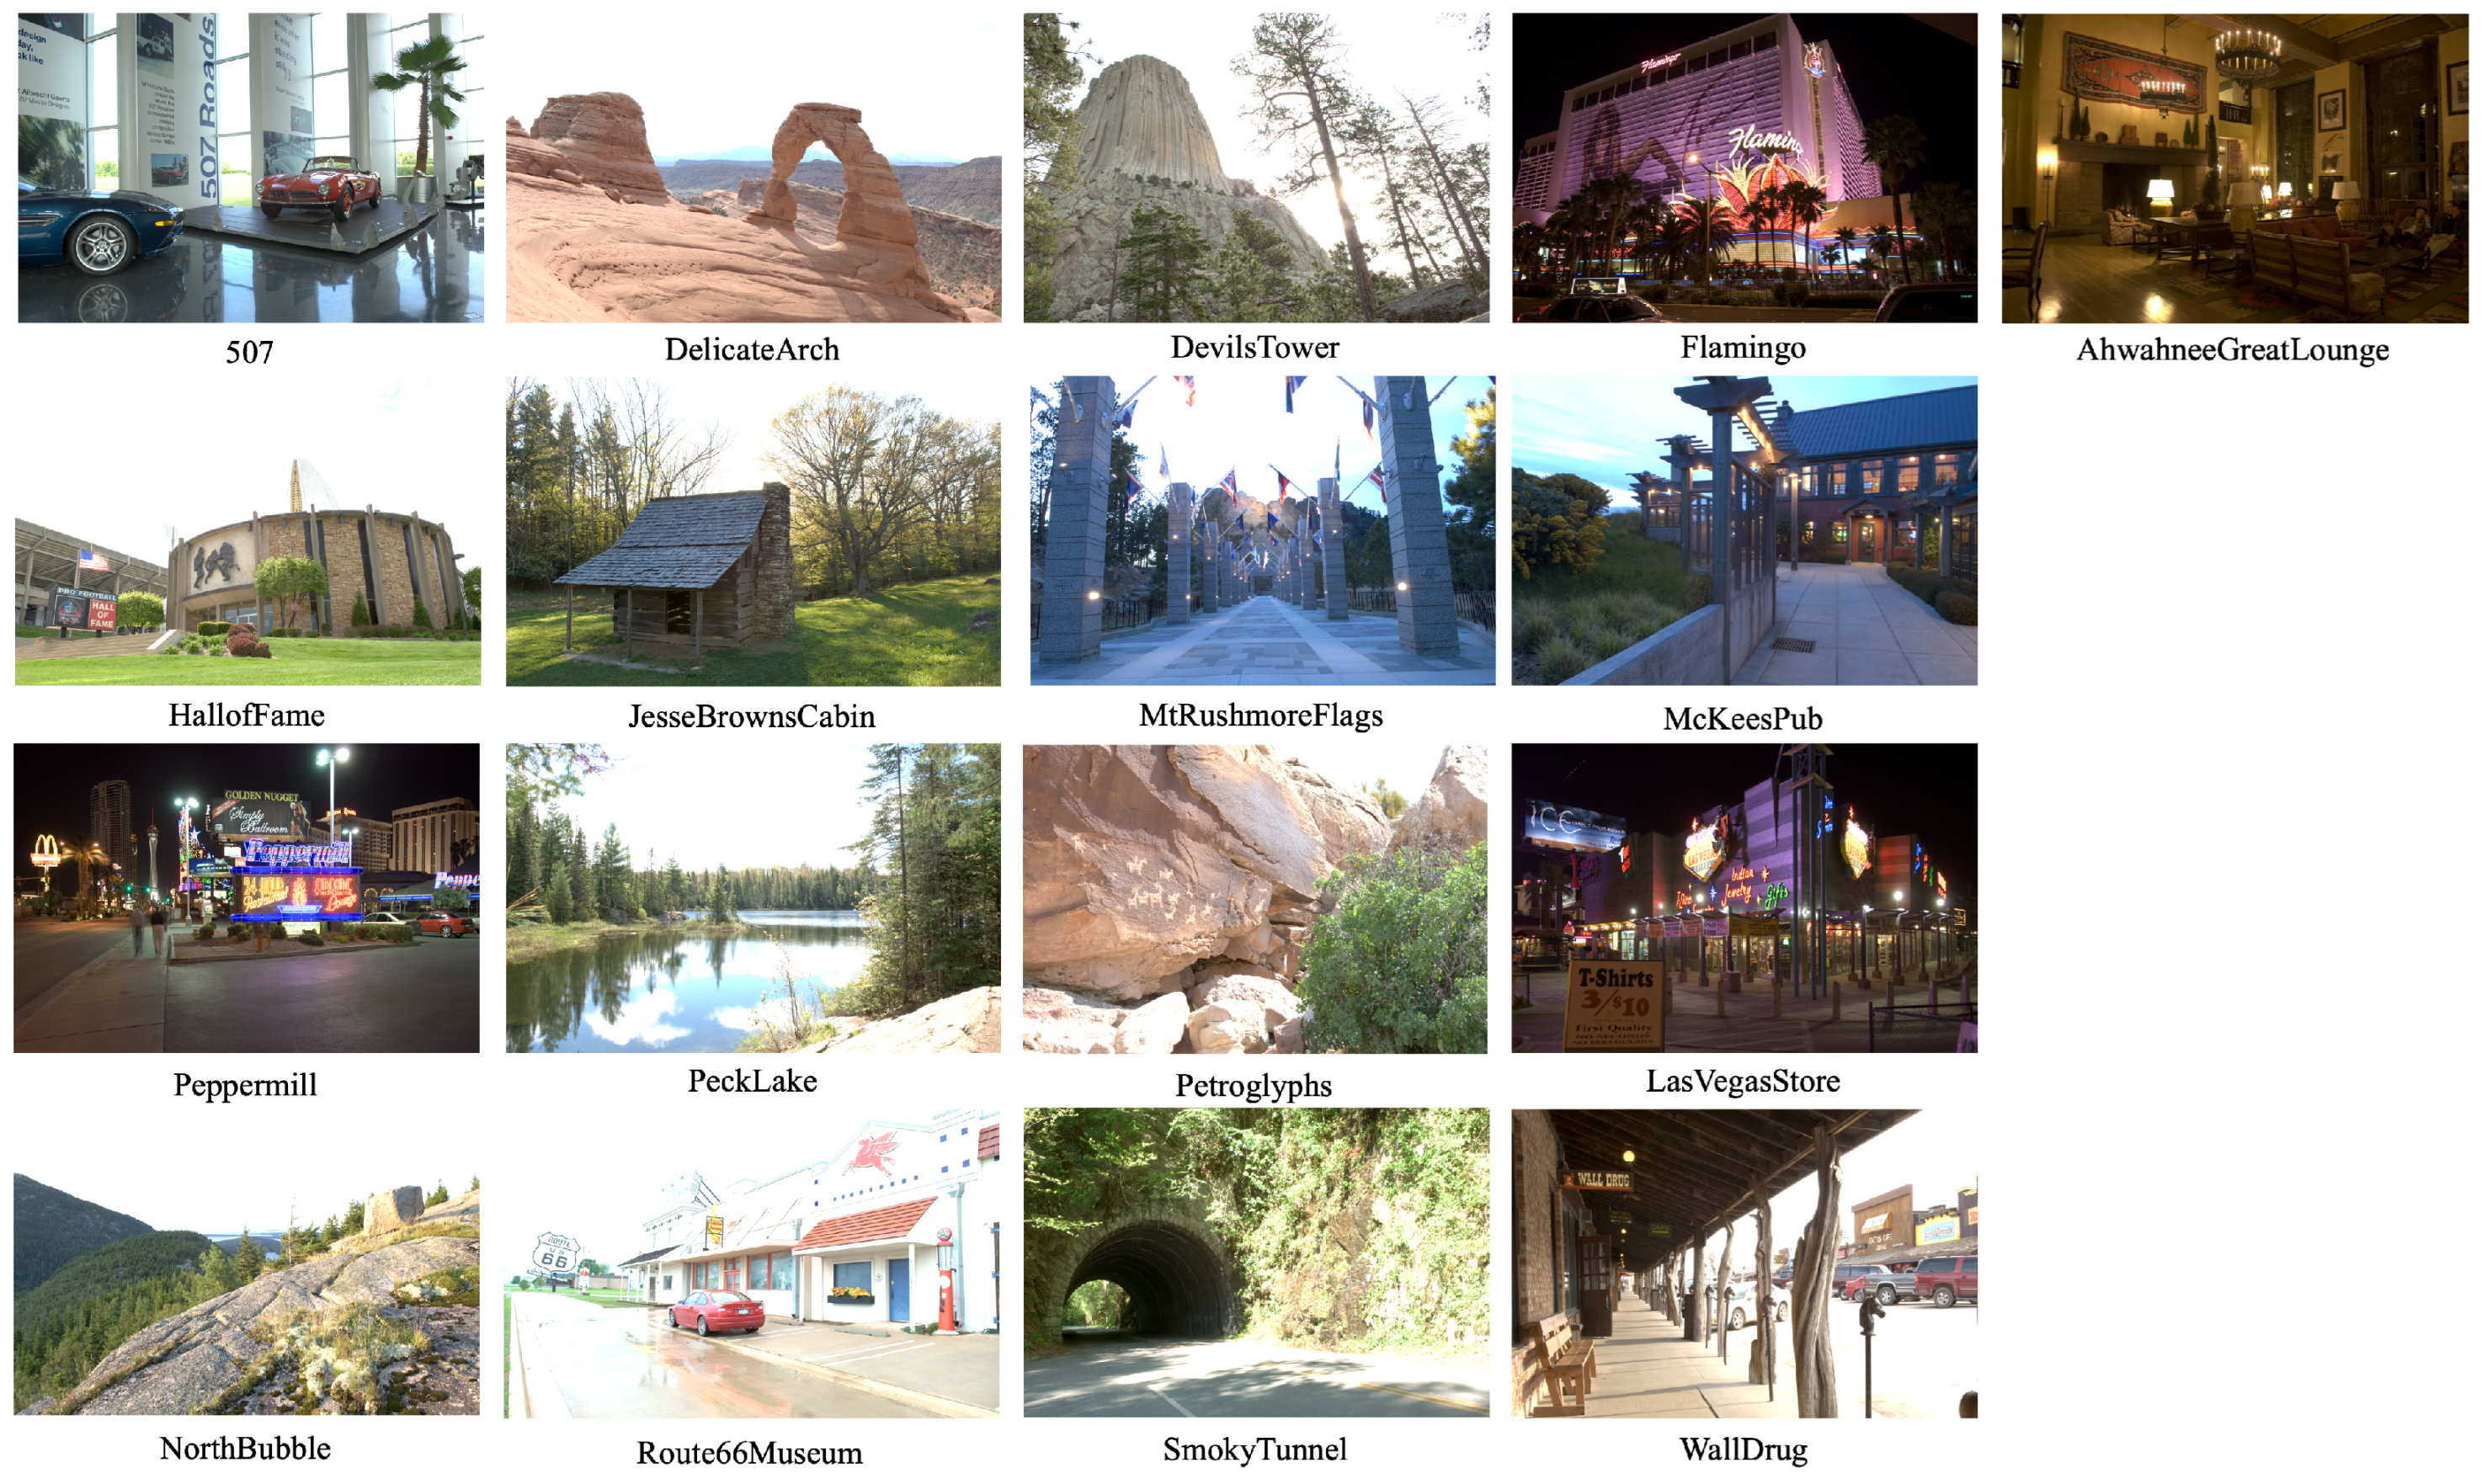
3. Experimental Setup
This section discusses the experimental setup. Initially, 17 HDR images were selected from the database [
17]. These images are shown in
Figure 5.
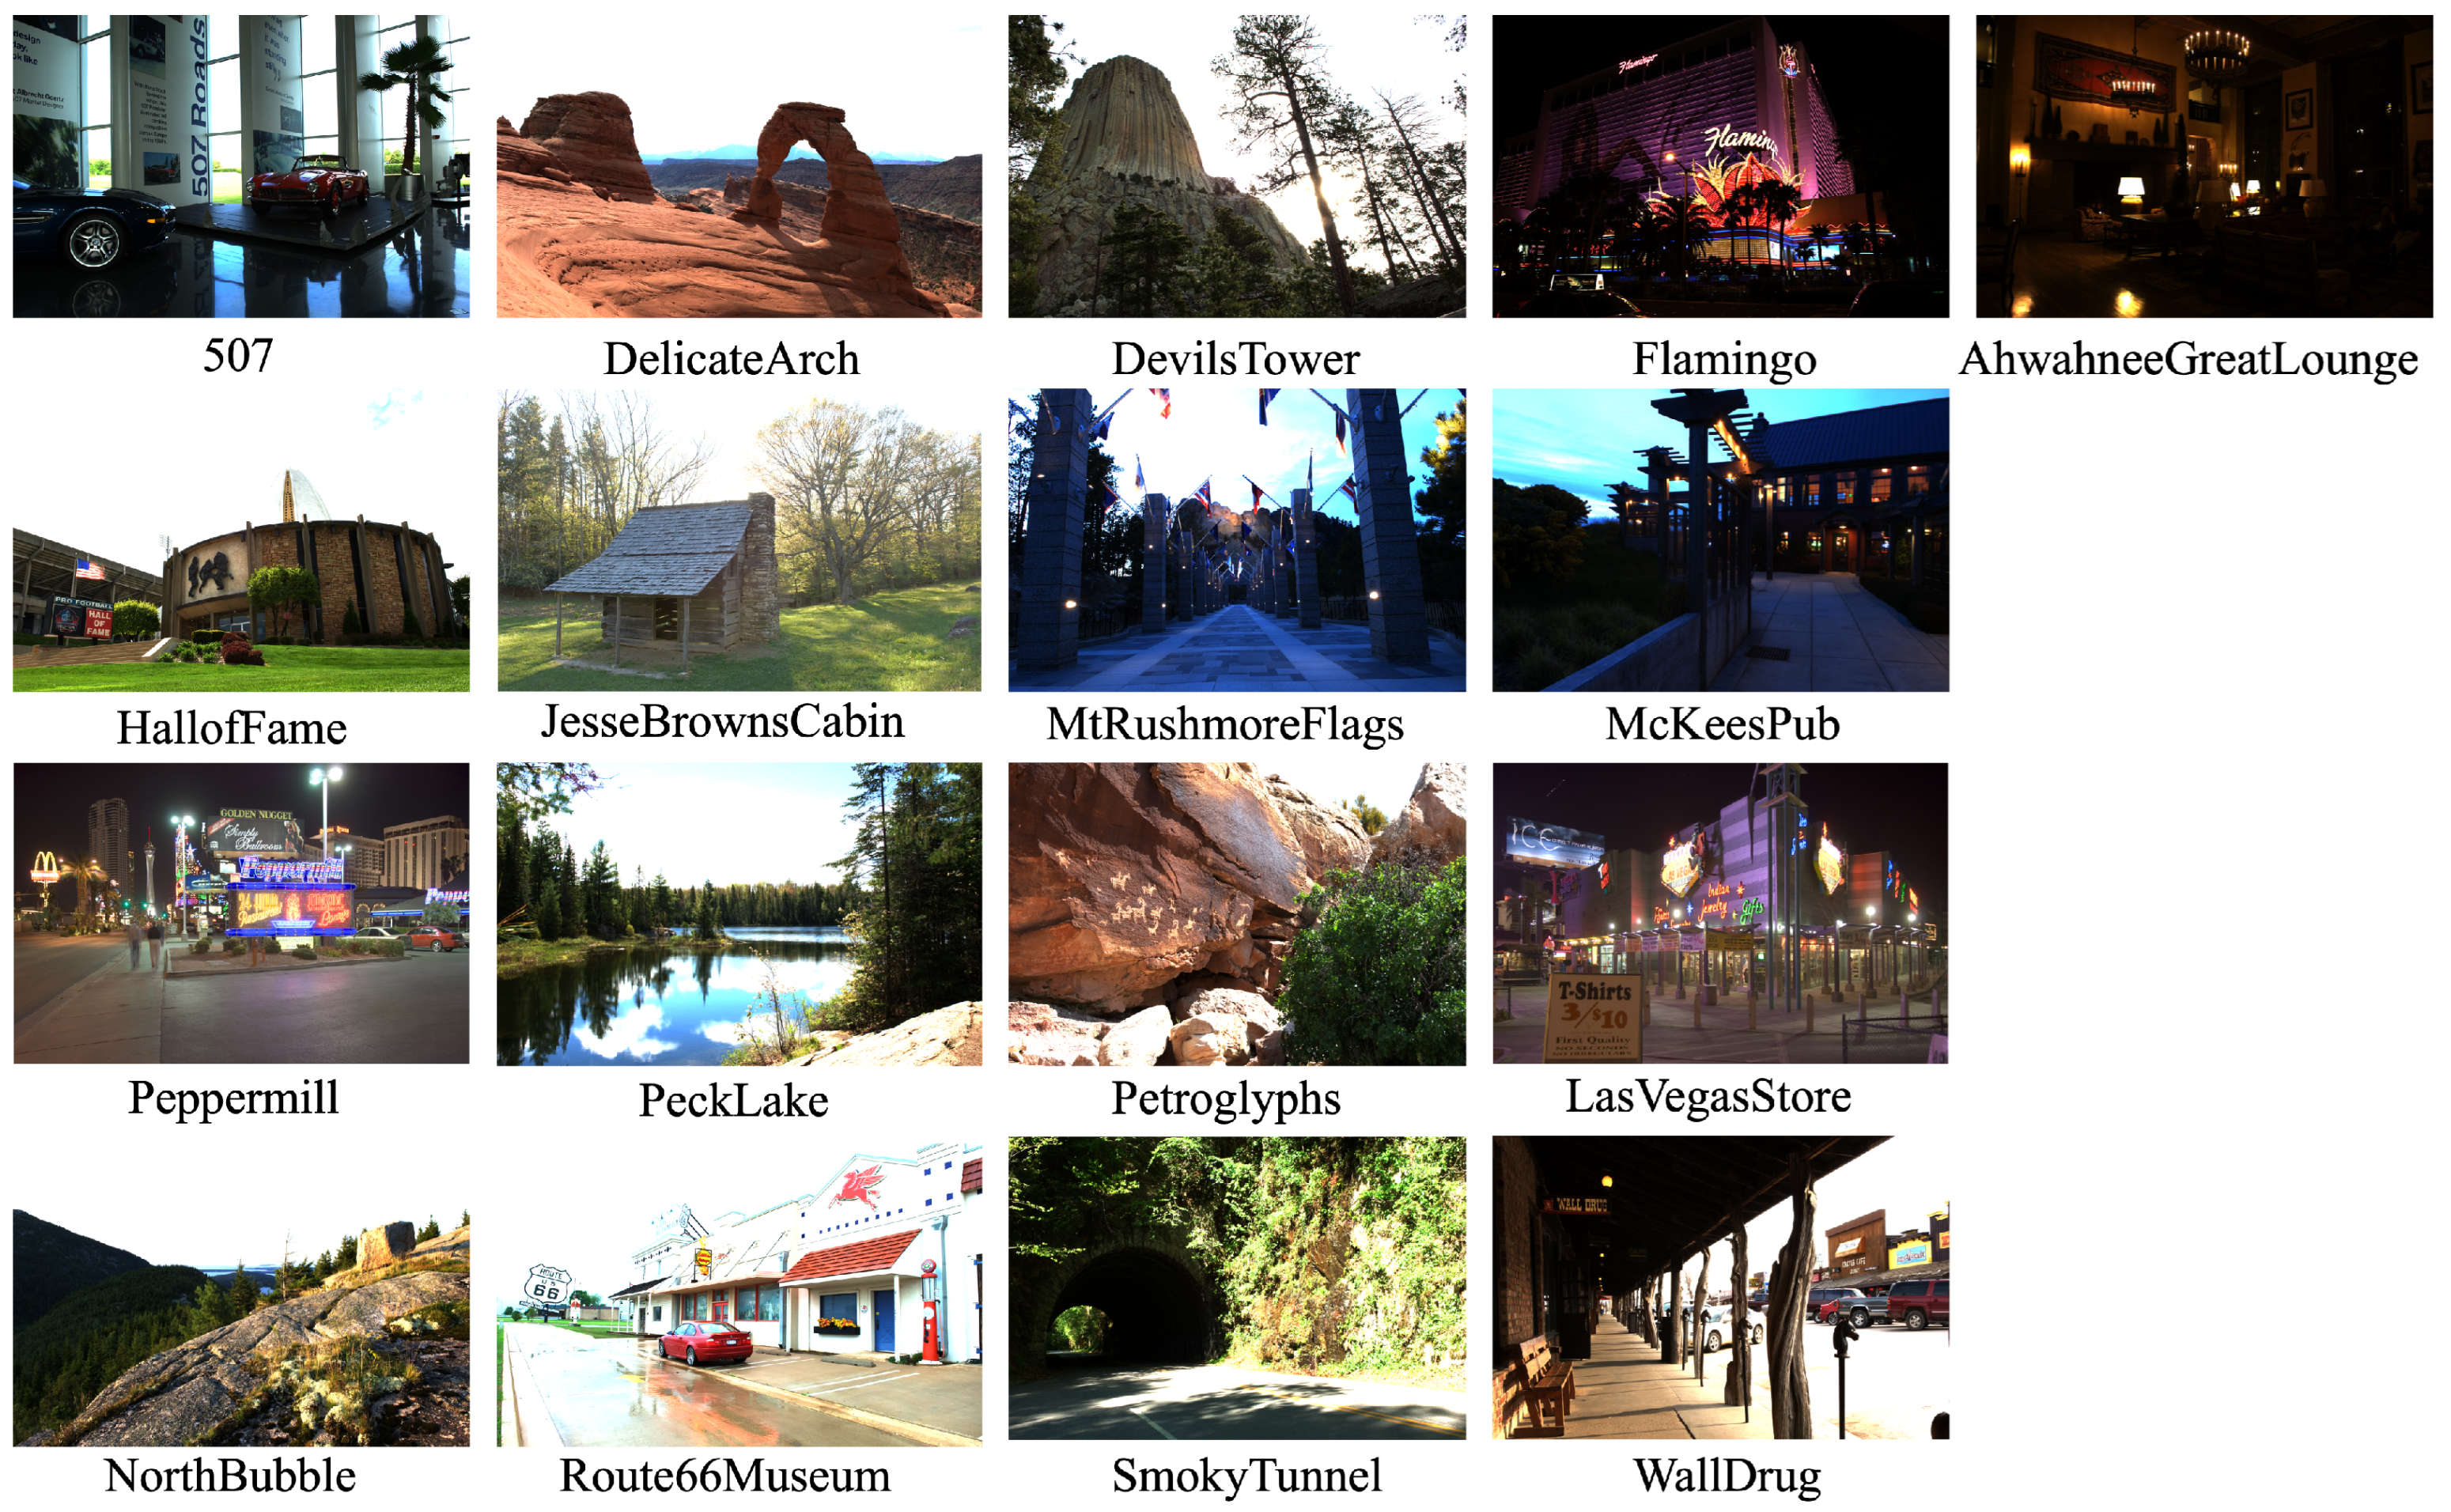
After the selection of images, all the images were encoded to SDR following ITU-R BT.709 and using three methods described in ITU-R BT.2446-0. The images converted using Method C are shown in
Figure 6.
After encoding, the BenQ SW321C SDR display was calibrated using an i1Profiler and colourimeter (Display Pro). The measured luminance was 99 cd/m
2, whereas the measured temperature (i.e., colour temperature of the display) was 6484 K. According to [
22], the displays with luminance 100 cd/m
2 are referred to as SDR.
The experiments were conducted in a controlled environment and the display was placed in a dark room with no ambient light. There were 24 observers who participated in the first experiment, whereas in the second experiment, the number of observers was 20. All the observers had normal colour vision. Among all the observers, there was diversity: one observer was an expert, while the rest of the observers were either naive or had limited knowledge about the task.
Some images were repeated during the experiments to find the intra-observer repeatability.
4. Results and Discussion
4.1. Experimental Protocol
Two psycho-physical experiments were conducted to evaluate tone mapping (TM) methods for HDR-to-SDR conversion. The first experiment aimed to compare three TM methods—Method A, B, and C—based on subjective ratings. Five perceptual attributes were considered: pleasantness, naturalness, detail preservation, colour saturation, and overall image quality. Each attribute was rated on a 6-point Likert scale (0 to 5), where 0 indicates very poor and 5 indicates exceptional quality.
In each trial, observers were shown the same source image rendered with all three TM methods. The images were presented in randomized order for each participant to eliminate position or method-order bias. Importantly, the identity of the methods was anonymized (i.e., participants did not know which image corresponded to Method A, B, or C). Participants were given clear definitions of each attribute and instructed to judge each aspect independently using the full scale. Several images were repeated during the session to assess intra-observer consistency.
4.2. Inter- and Intra-Observer Variability
To validate consistency, inter-observer and intra-observer variability were computed.
Table 1 presents standard deviations for each attribute and method.
Low intra-observer variability across all methods confirms that participants were consistent in their ratings. The moderate inter-observer variability, particularly for naturalness and overall quality, reflects inherent subjectivity, which is expected in perceptual experiments.
The confidence intervals for each rating were calculated using Student’s t-distribution:
where
is the mean,
is the standard deviation, and
n is the number of observers.
To assess rating agreement, an ANOVA test and intraclass correlation coefficient (ICC) were computed following the method in [
23]. The average ICC values across attributes exceeded 0.5, suggesting moderate to good reliability.
4.3. Performance Evaluation of TM Methods
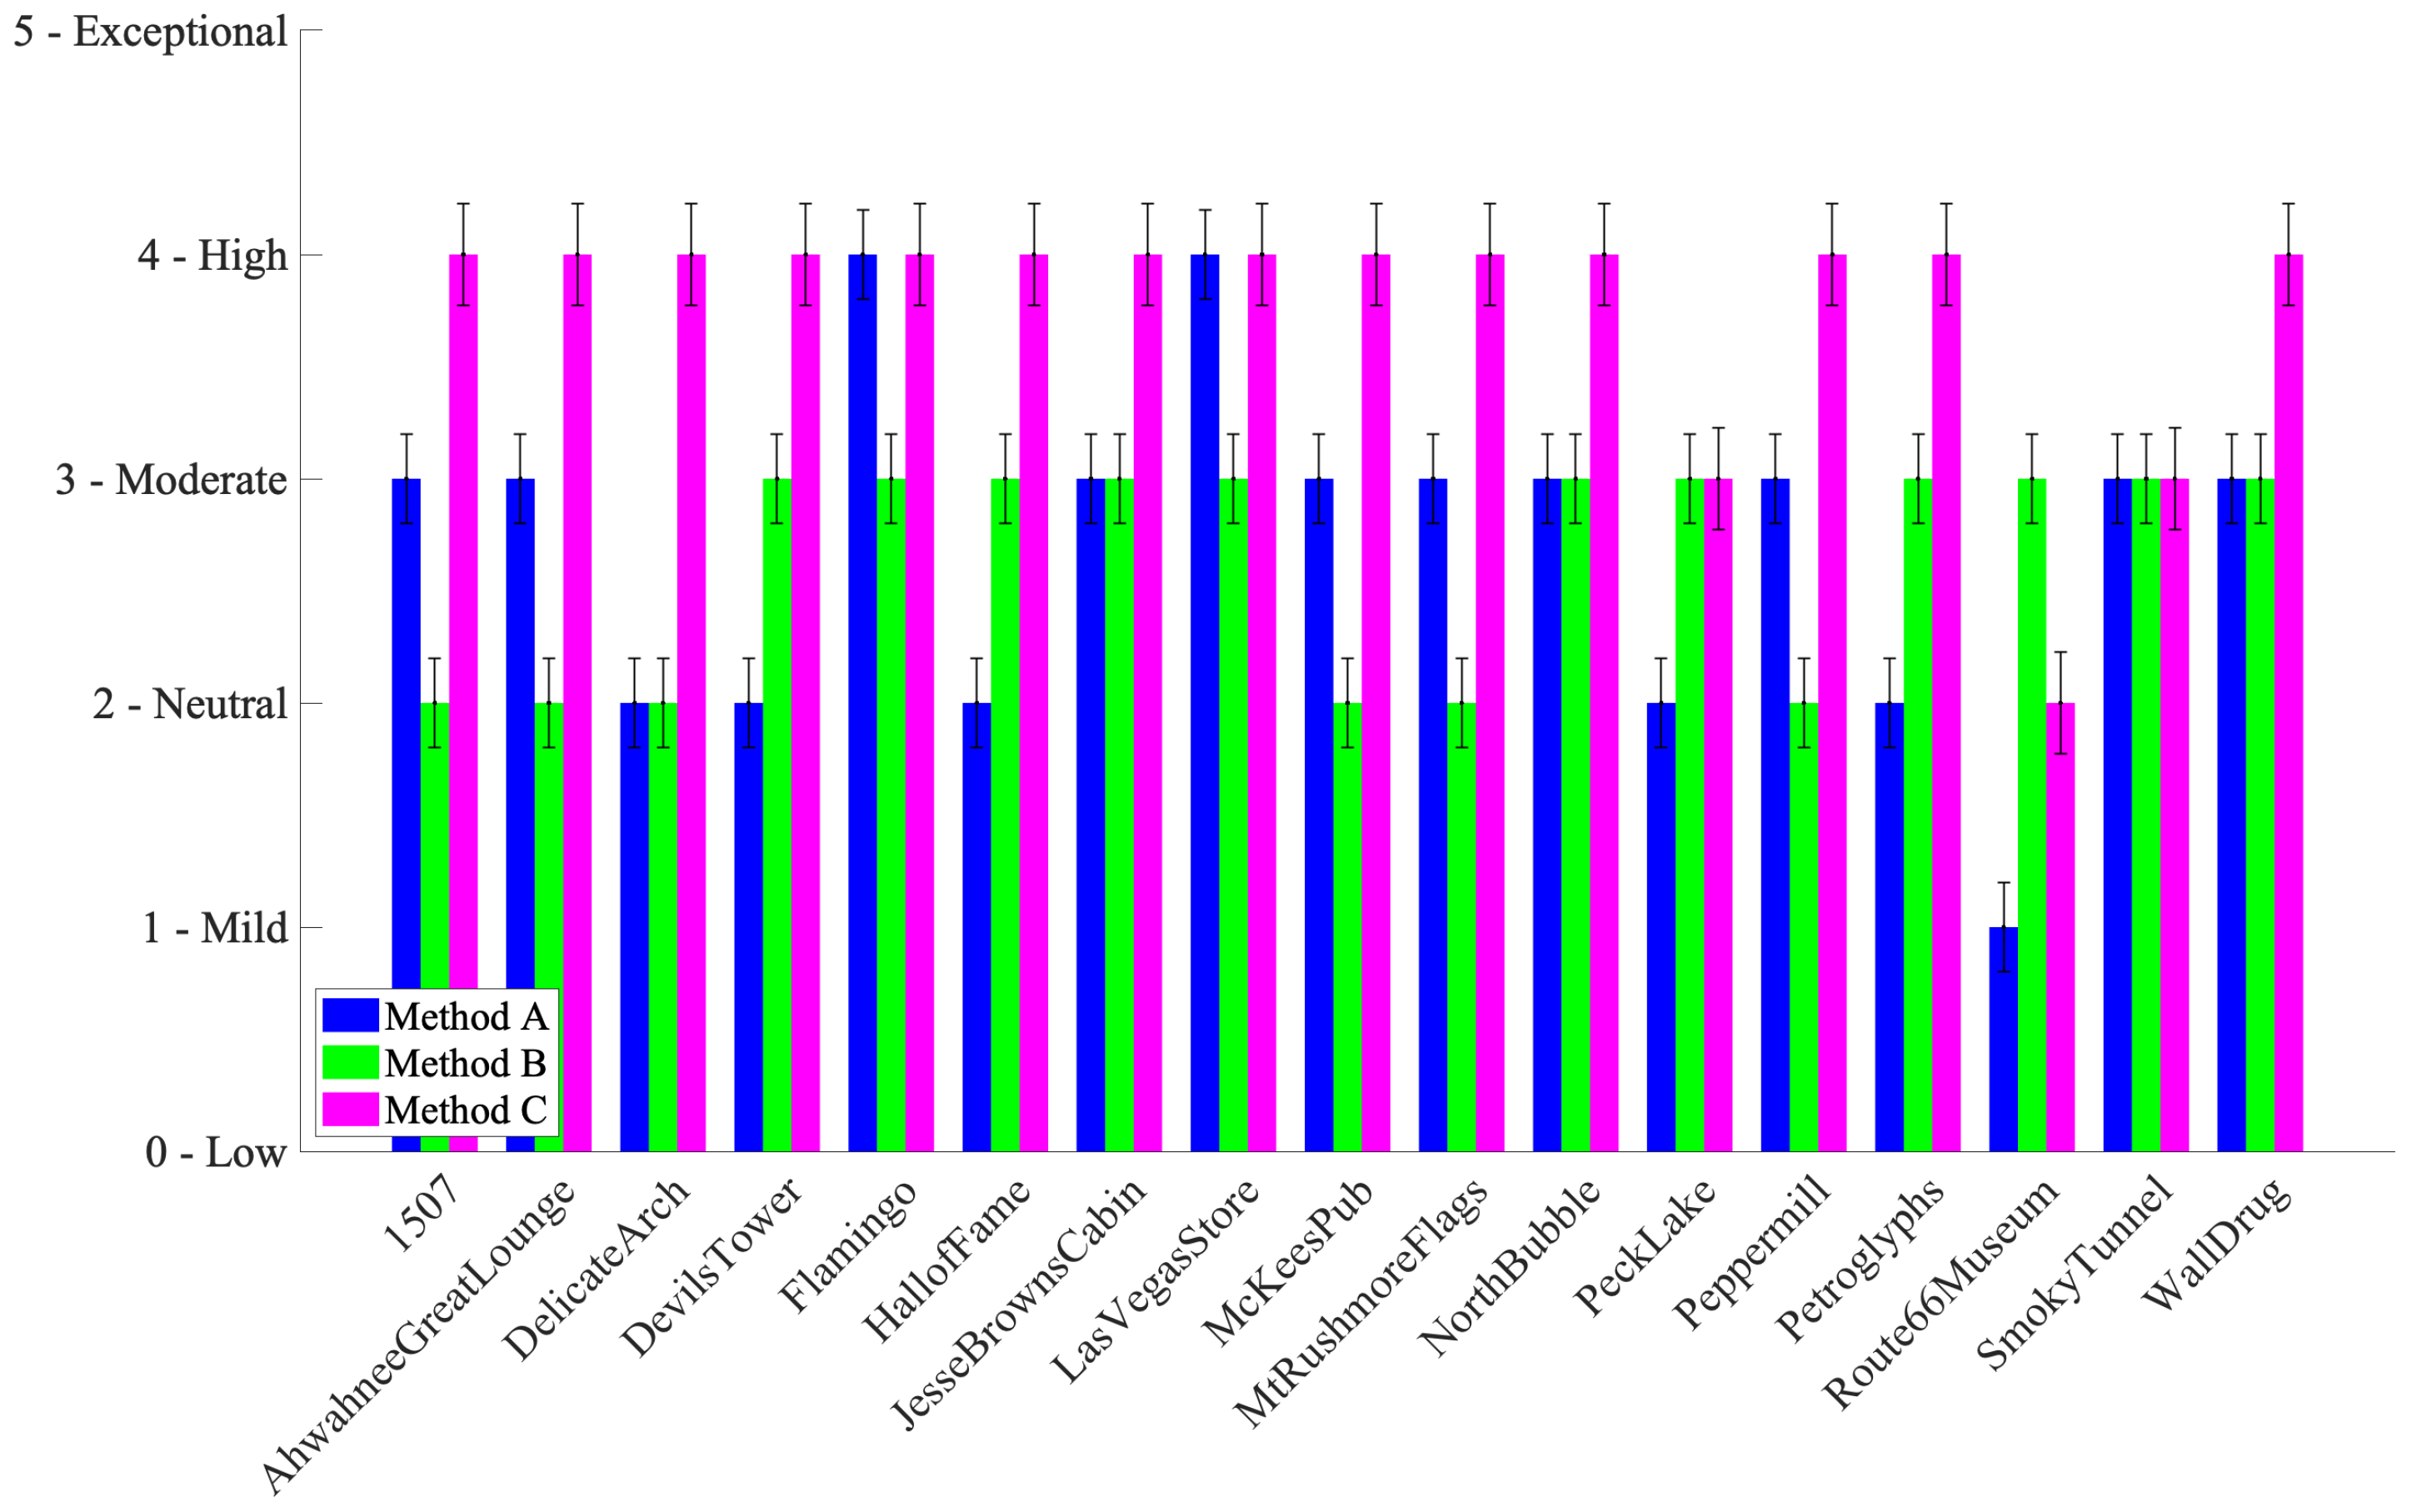
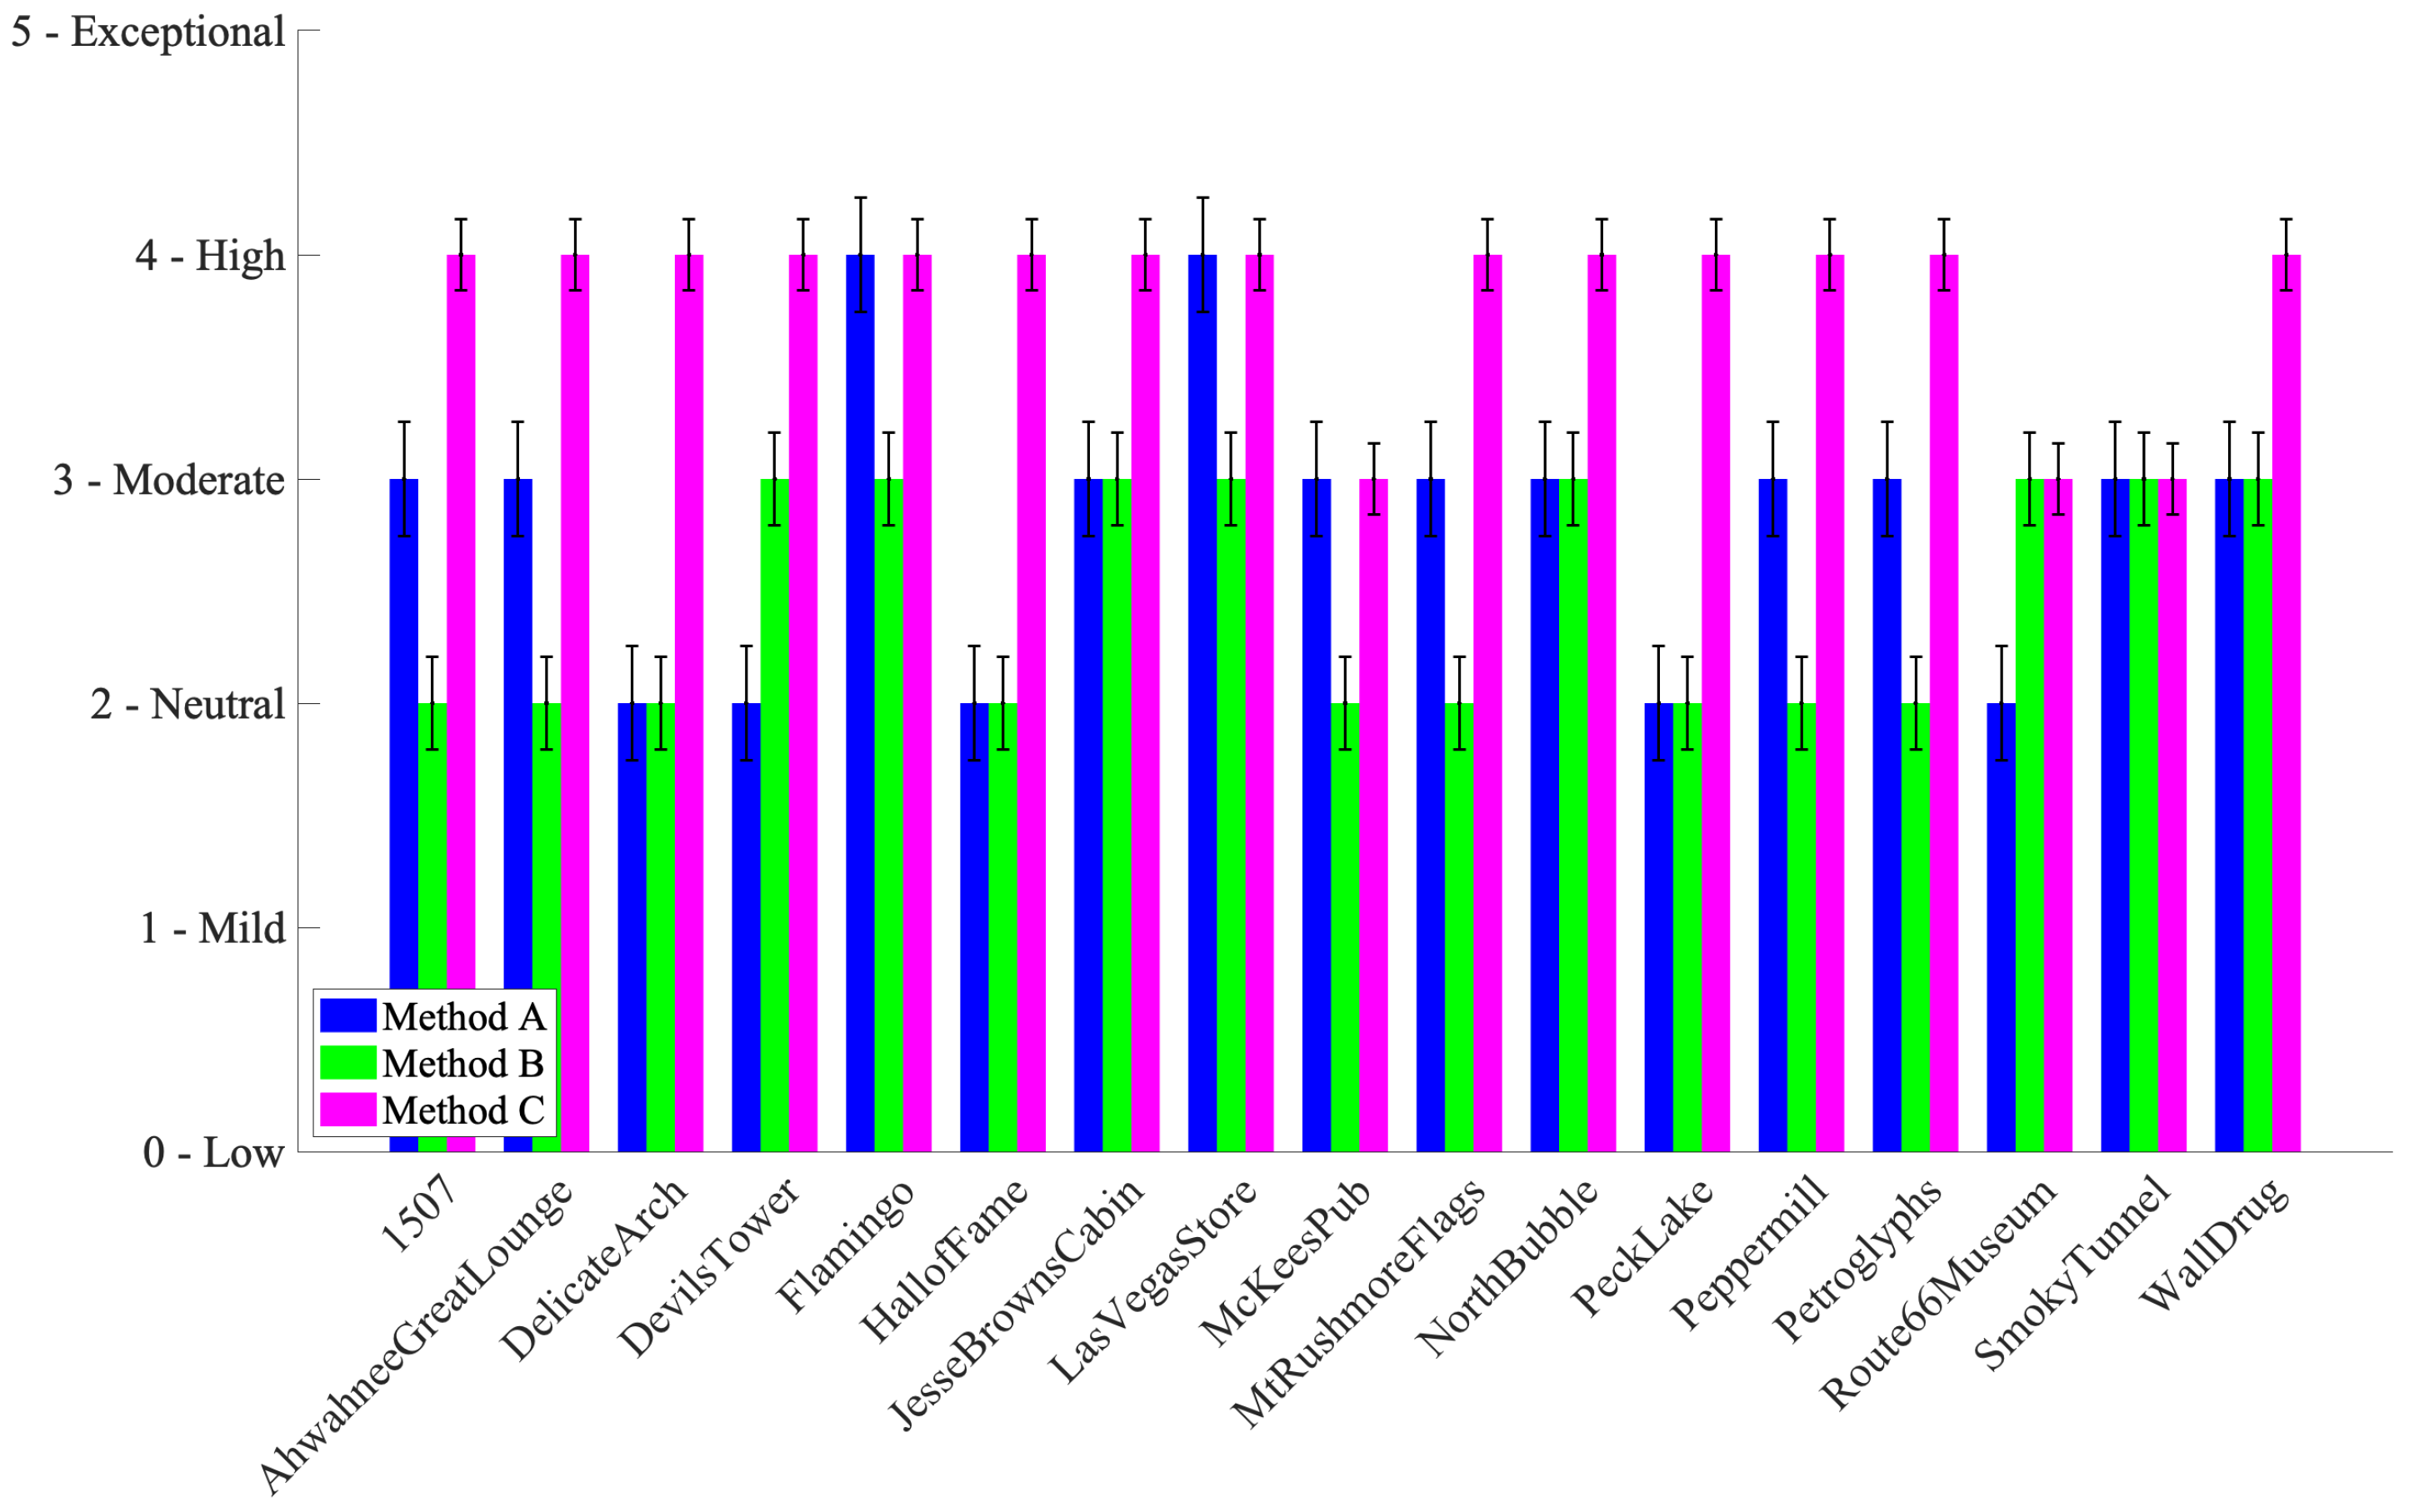
Figure 7 shows the ratings for pleasantness. Method C was generally rated highest, especially in low-light scenes, such as “Night” or “Indoor” categories. Method B occasionally matched or outperformed C in brighter scenes but was overall less consistent.
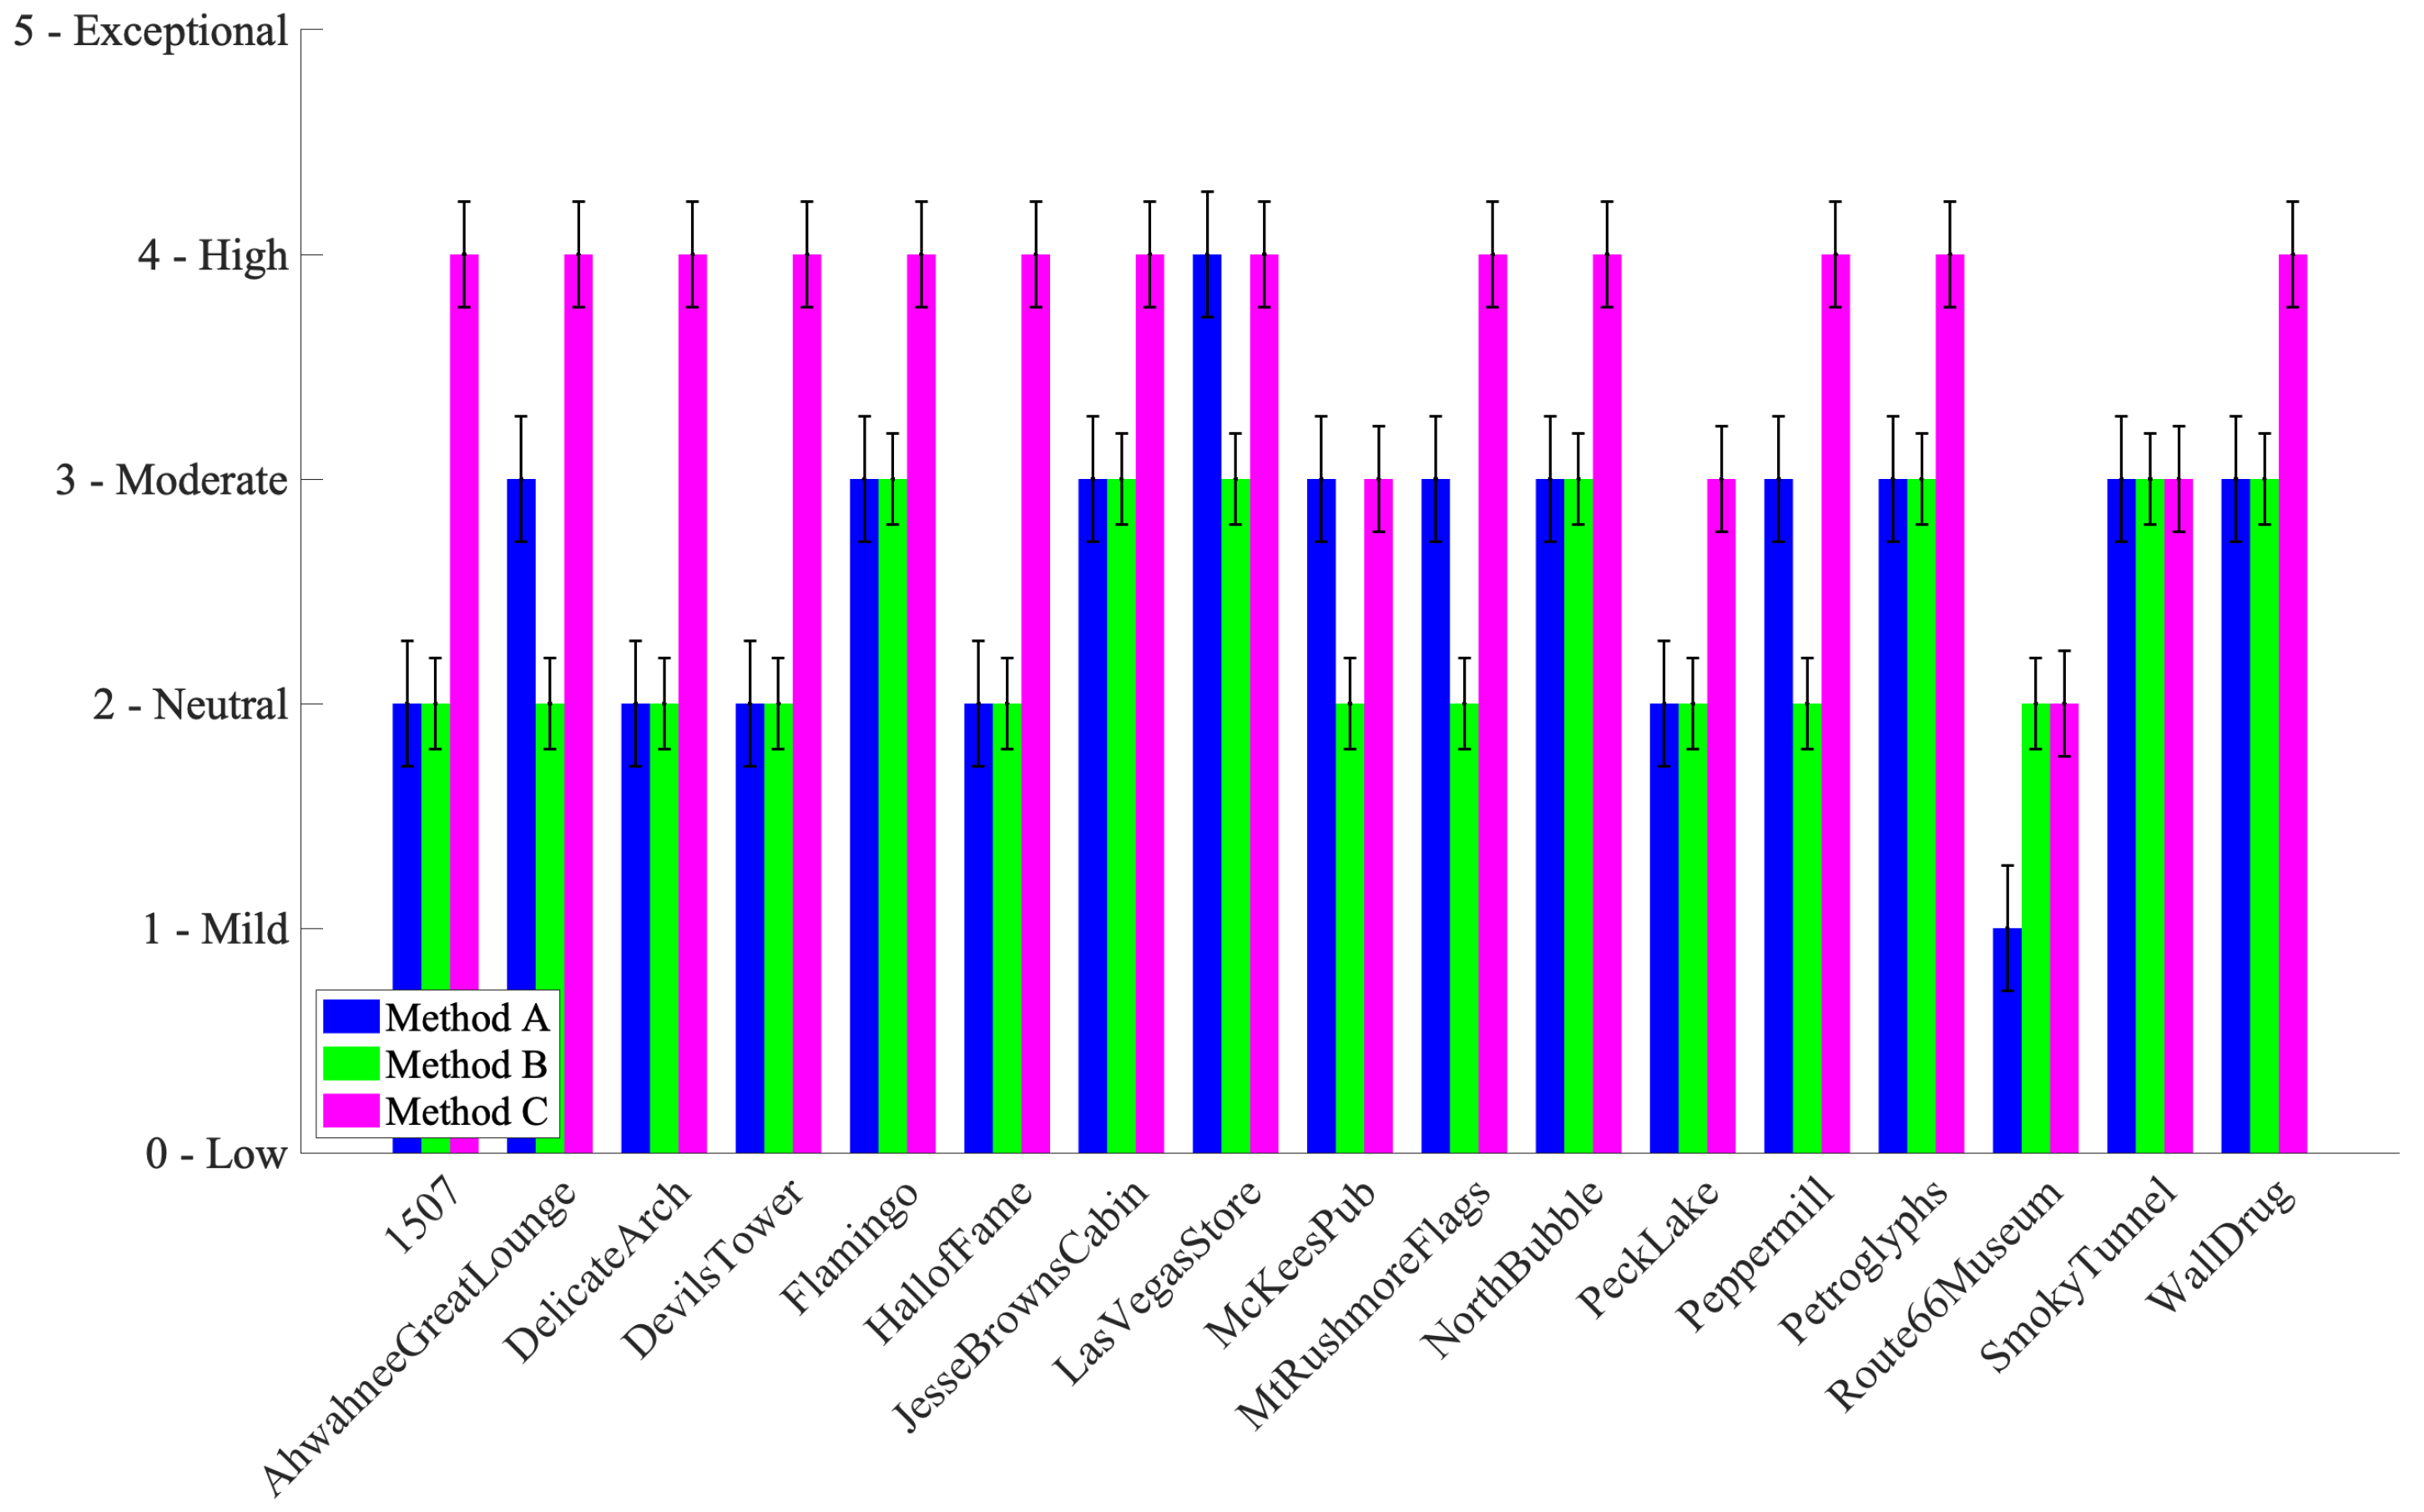
Figure 8 shows that Method C also led in naturalness, although its ratings dropped slightly for overexposed scenes such as “Route66Museum” and “SmokyTunnel”.
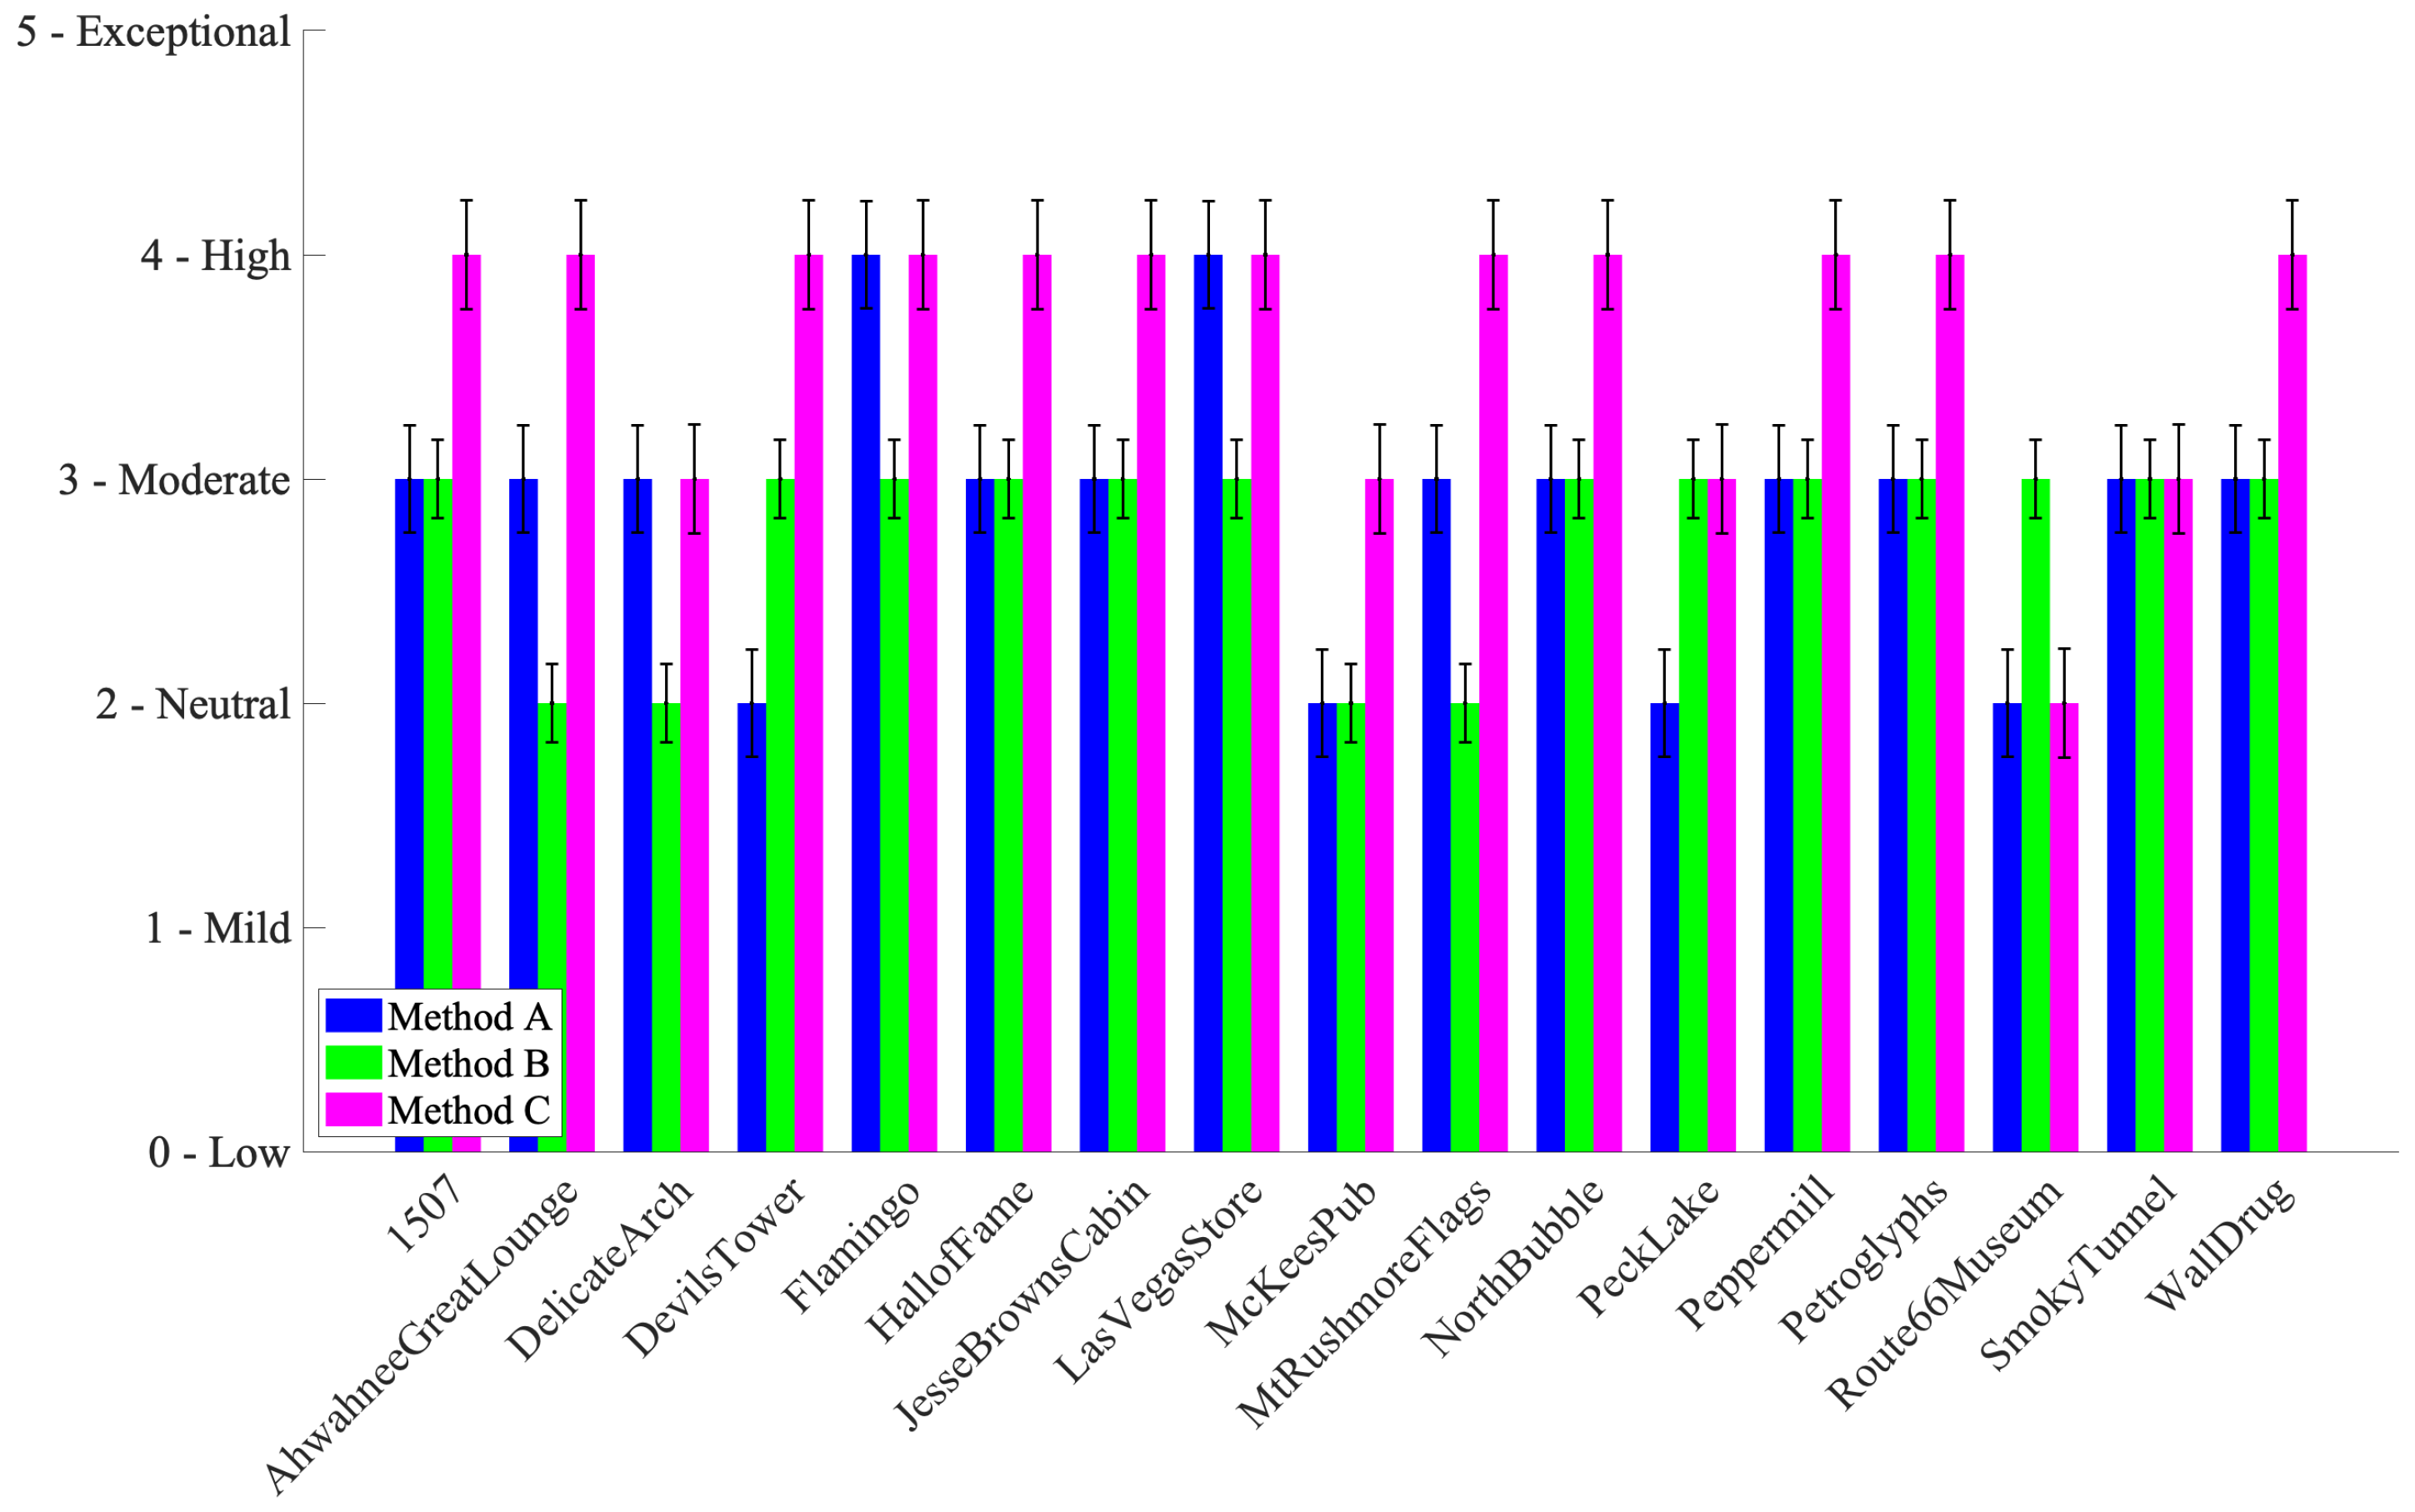
As shown in
Figure 9, Method C was rated best for detail preservation across most content types, except in high-brightness cases like “Route66Museum”.
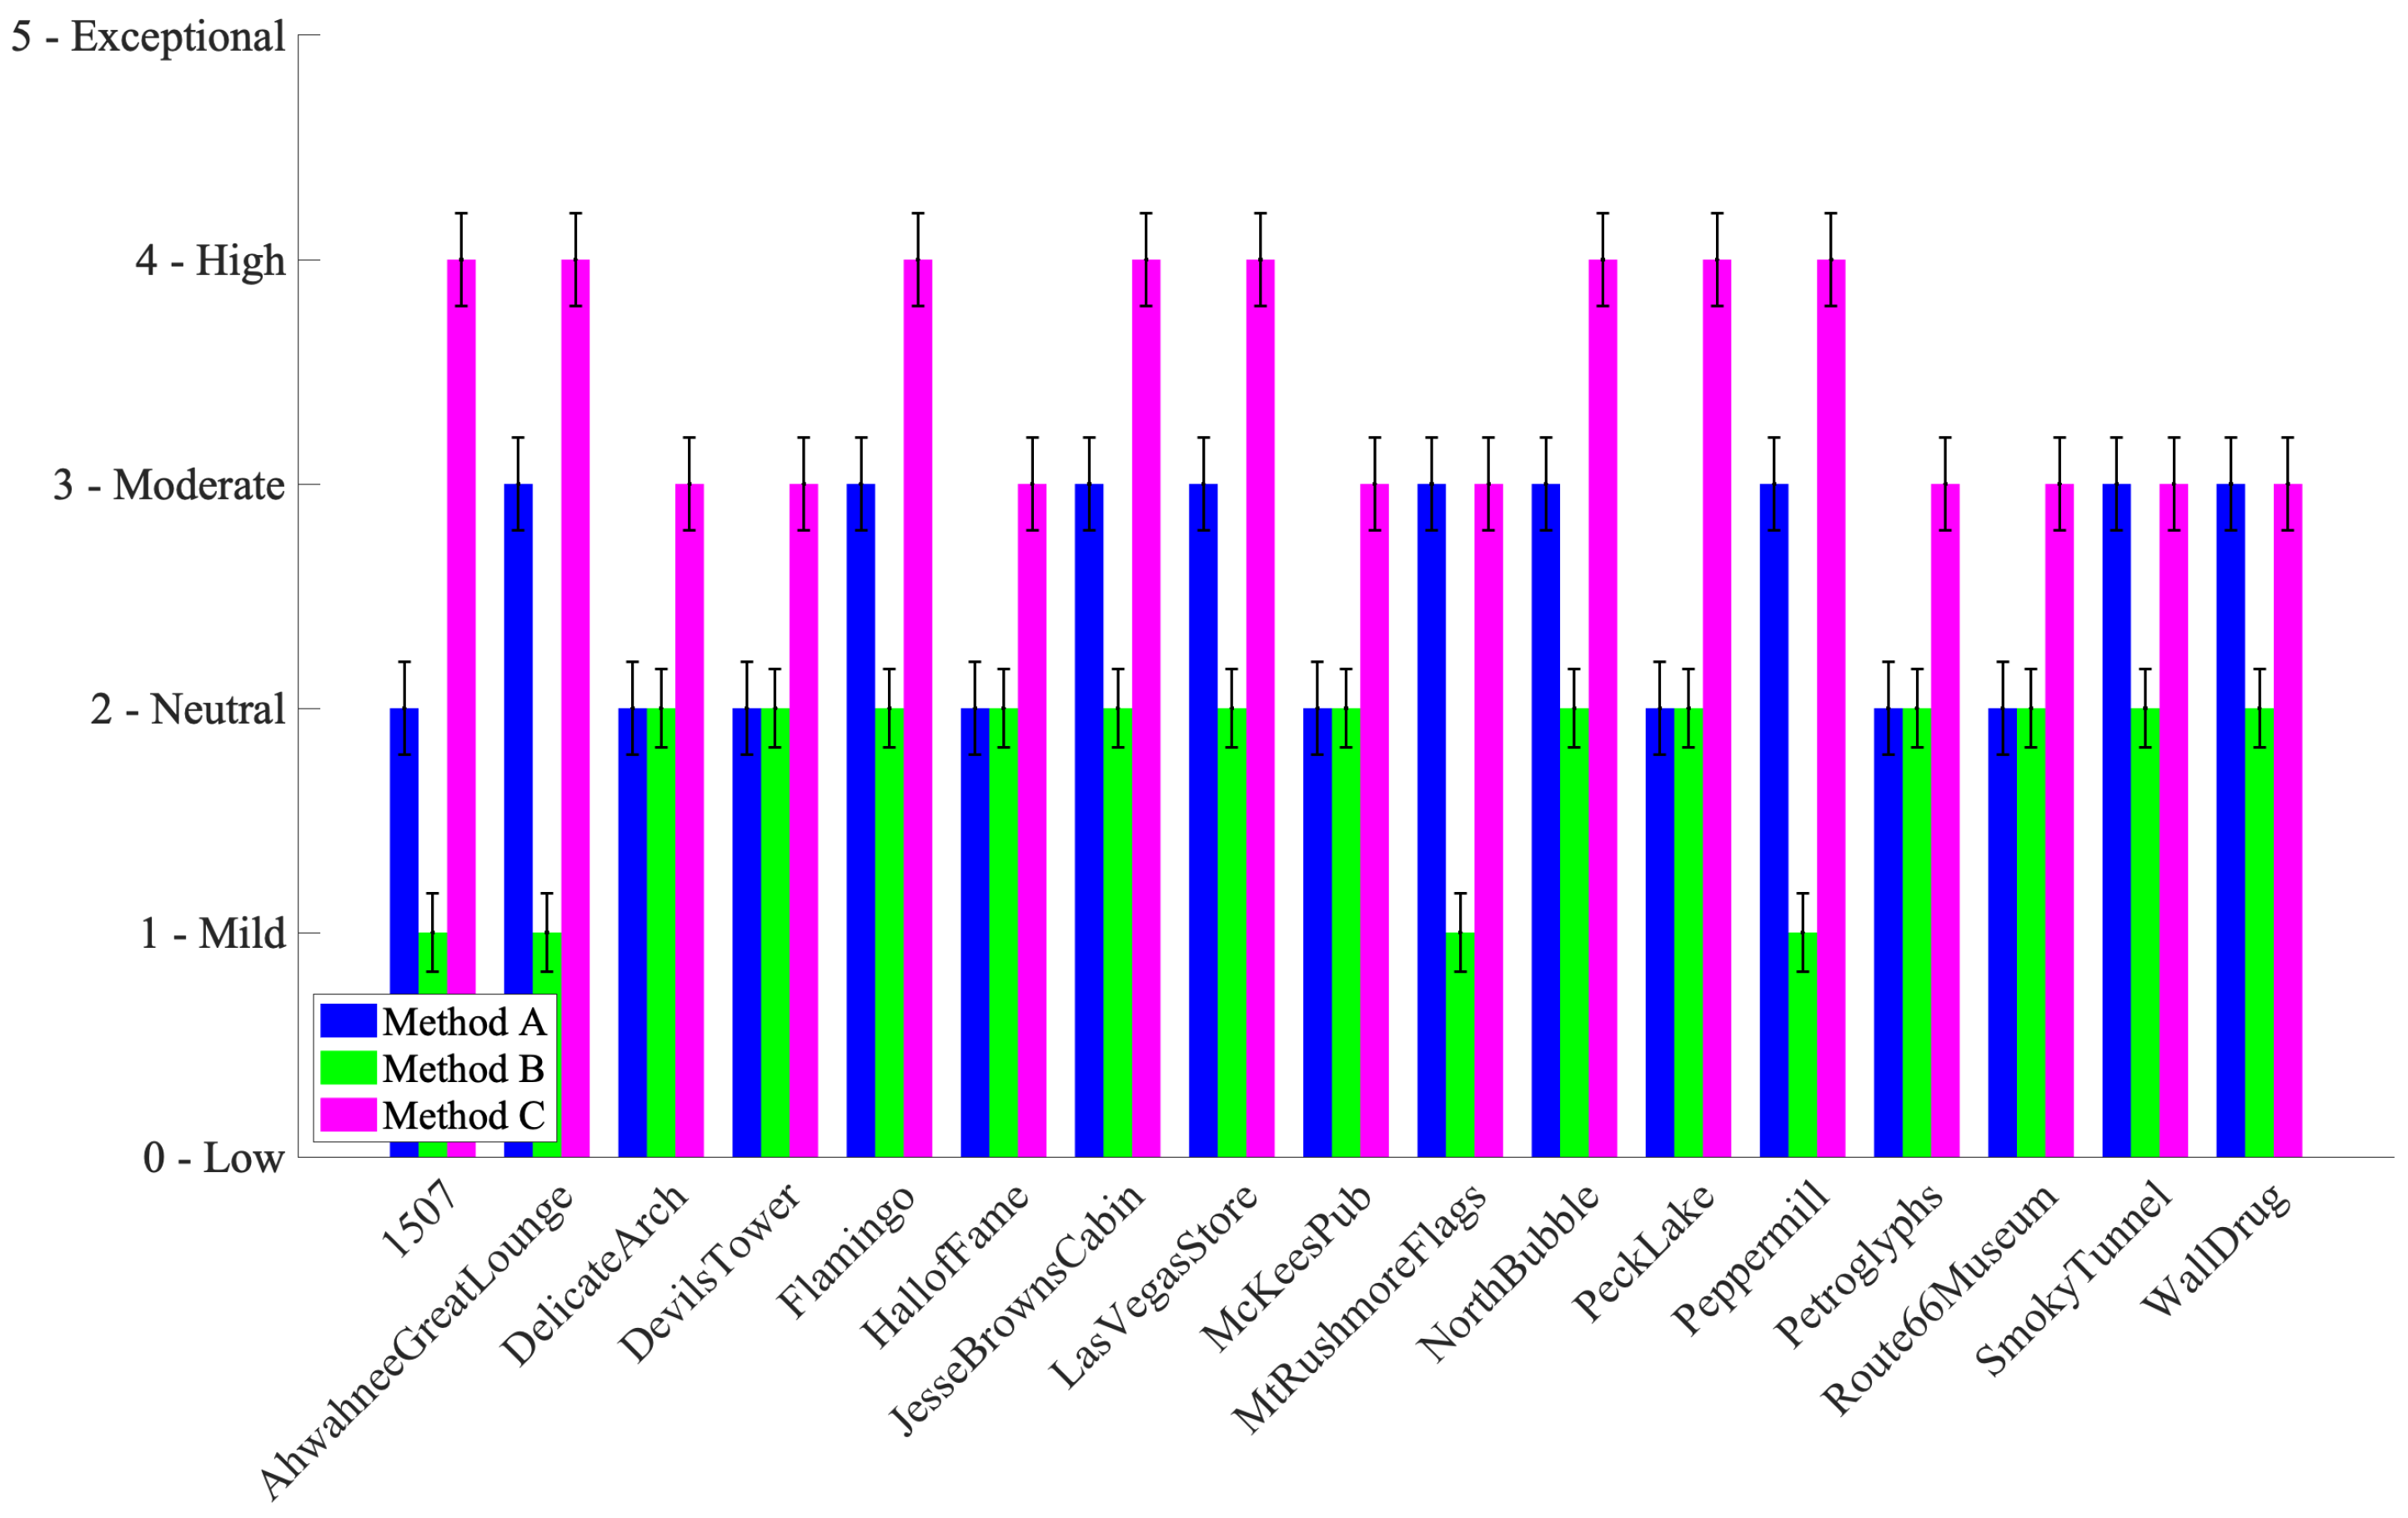
Figure 10 presents colour saturation ratings, again favoring Method C, which retained vibrancy without unnatural oversaturation.
Figure 11 summarizes overall quality. Method C consistently scored highest, confirming its overall advantage in visual rendering across diverse content.
The consistent superior performance of Method C is likely due to its use of cross-talk and inverse cross-talk matrices, as defined in ITU-R BT.2446. Unlike Method A (knee function) and Method B (gamut mapping), Method C avoids compression, preserving both luminance and chromatic detail more effectively. This was particularly noticeable in scenes with complex lighting.
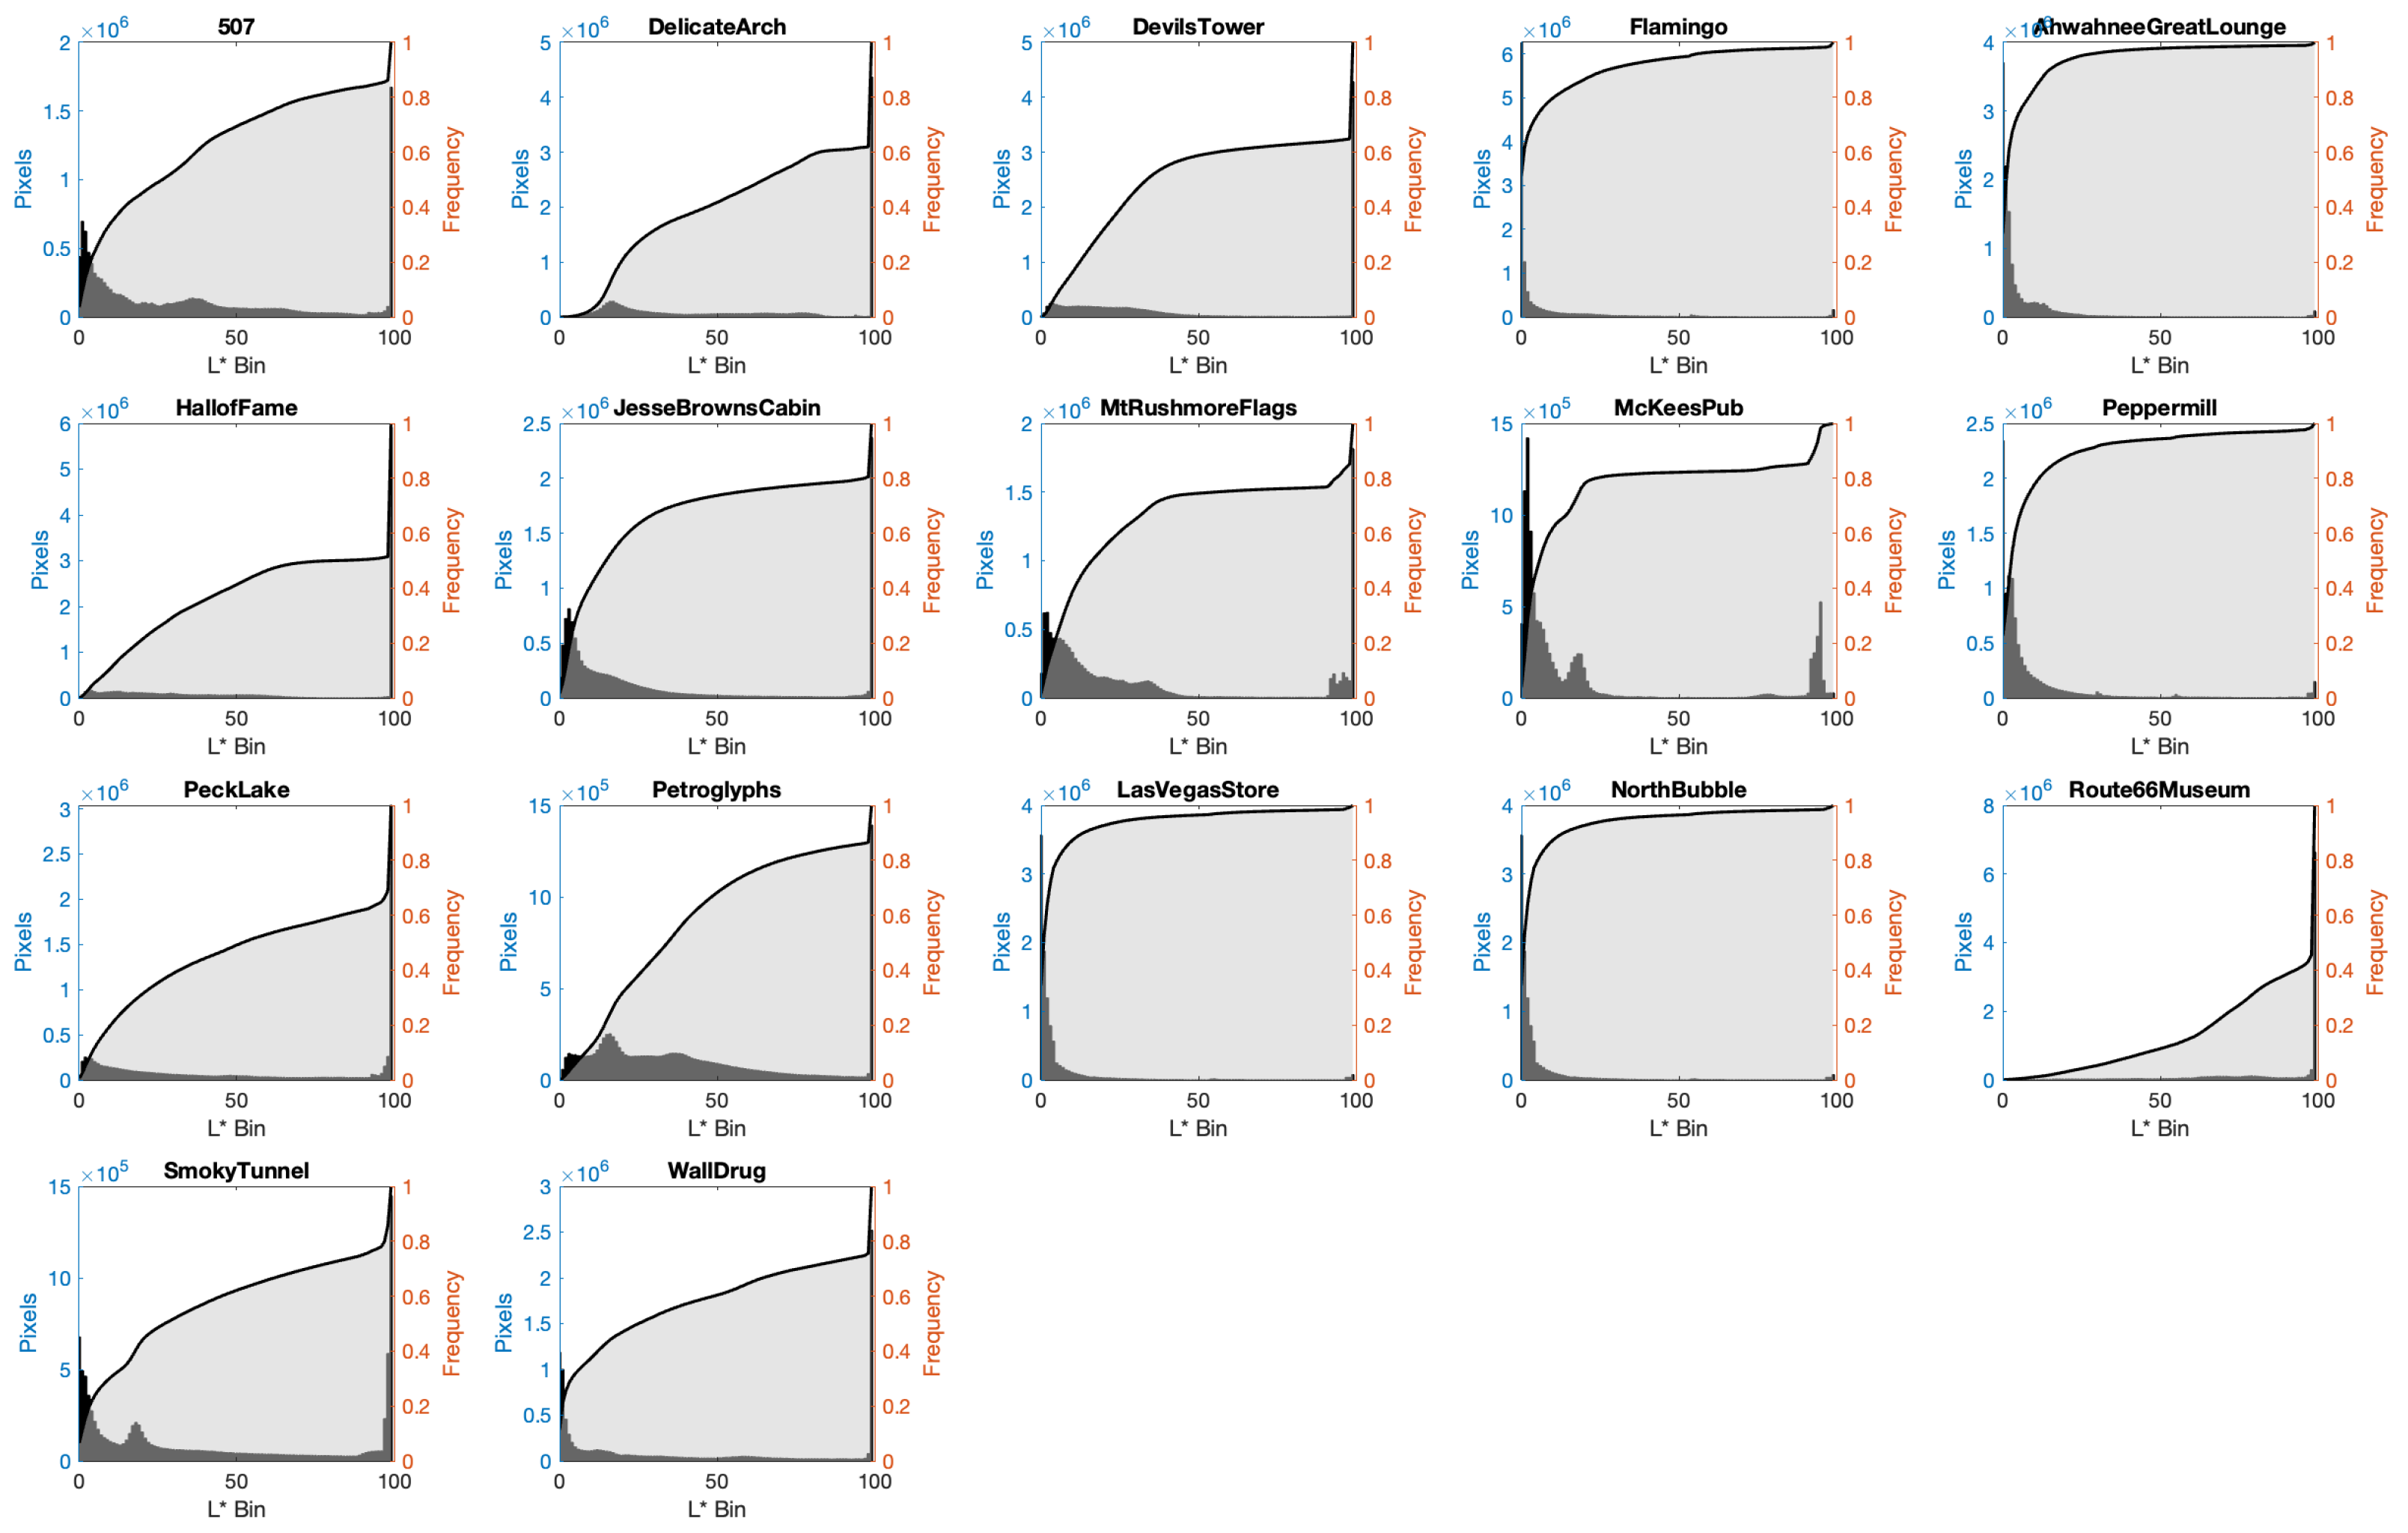
4.4. Image Content Dependency
These results underscore that tone mapping performance is content-dependent. In night scenes, Method C performed best, while in high-exposure daylight scenes, performance varied. This aligns with earlier findings on image-dependent tone mapping behavior, as discussed by Braun and Fairchild [
24].
To visualize this dependency,
Figure 12 shows lightness histograms and cumulative histograms of selected images, highlighting significant variation in luminance distribution across the dataset.
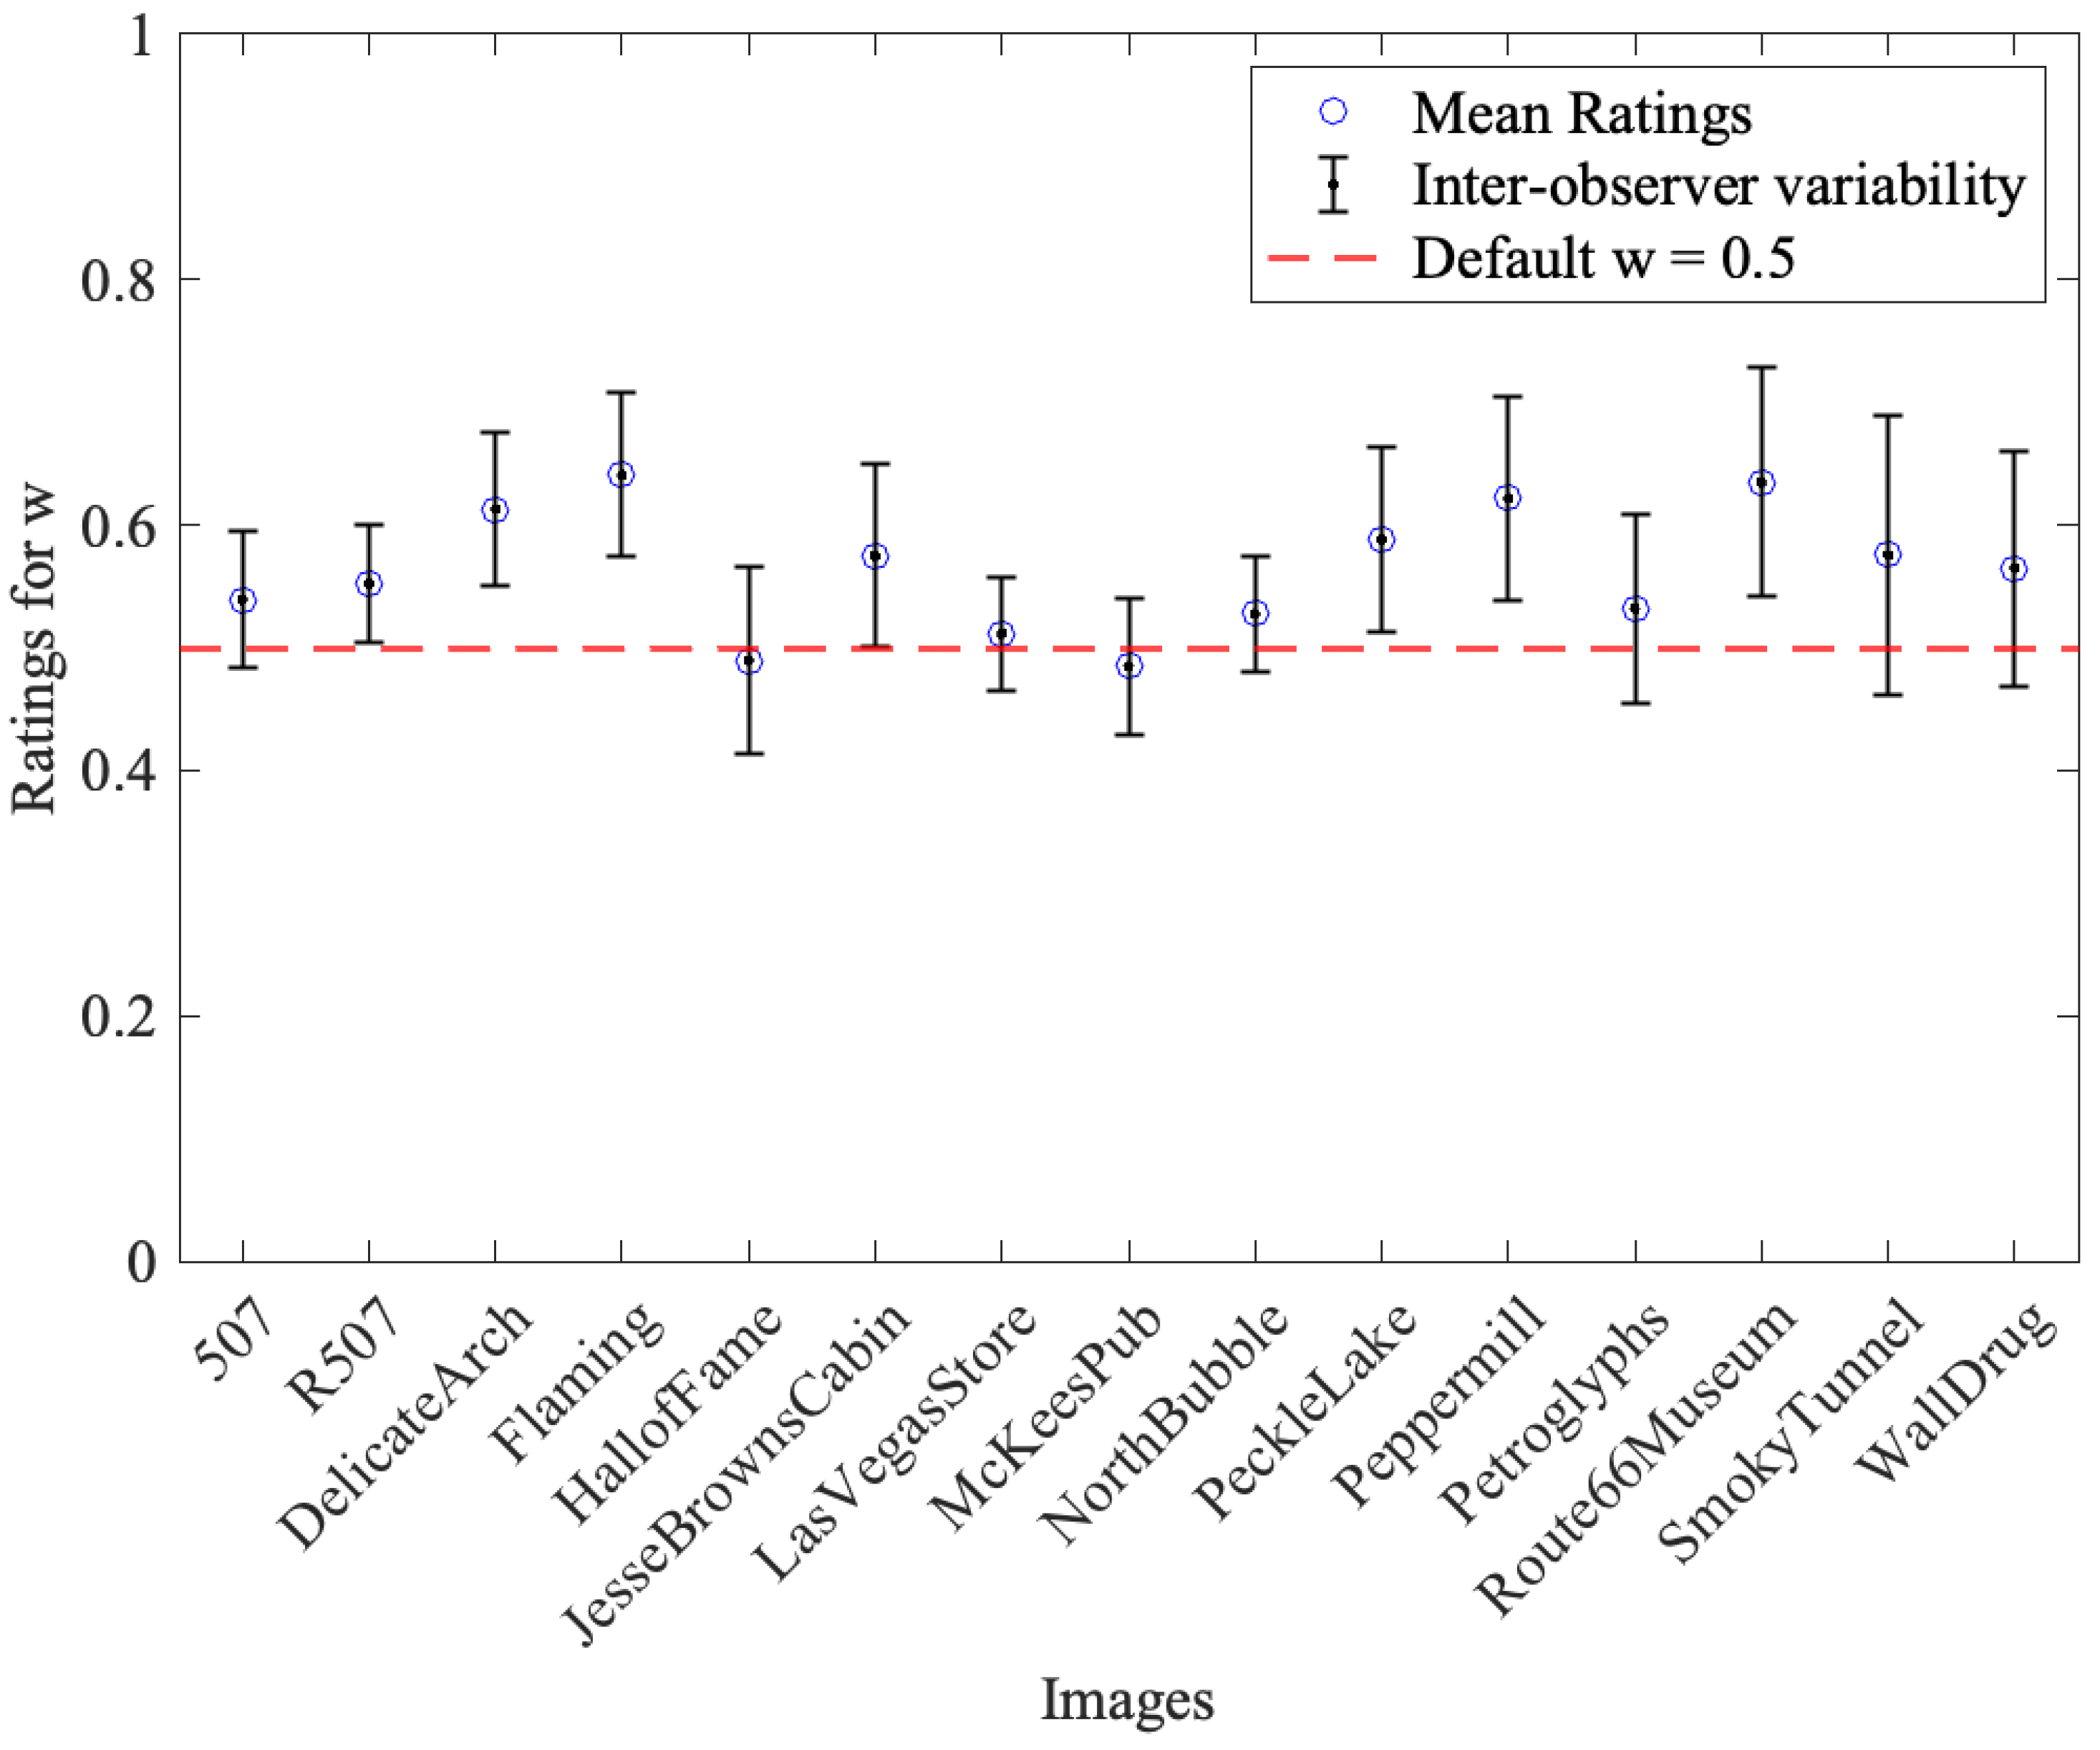
4.5. Gain Map Optimization Experiment
Based on the first experiment, Method C was selected for further enhancement using gain maps. All SDR images processed with Method C are shown in
Figure 6. These images and their HDR counterparts were used in a second experiment where observers were asked to tune the gain map weighting parameter
w for optimal appearance on SDR displays.
Observers were shown images at a default
and asked to adjust this value to what they found visually most appealing. Results are shown in
Figure 13.
The tuning of w was strongly influenced by image content and luminance distribution. Results were consistent across devices and observers, confirming the need for adaptive gain map strategies. This experiment demonstrates that even within a fixed tone mapping pipeline, perceptual quality can be improved by fine-tuning gain parameters based on content.
4.6. Summary of Findings
Across all five evaluation criteria, Method C outperformed the alternatives, particularly in complex lighting scenarios. The results also highlighted the importance of image content in TM effectiveness. The second experiment confirmed that perceptual tuning using gain maps—specifically via parameter w—can improve SDR rendering quality in a content-aware manner.
5. Conclusions
This study evaluated three tone mapping (TM) methods—referred to as Method A, B, and C as specified in ITU-R BT.2100—for HDR-to-SDR conversion using subjective assessments based on pleasantness, naturalness, detail preservation, colour saturation, and overall image quality.
The results consistently showed that Method C outperformed Methods A and B across most evaluation criteria. Unlike Methods A and B, Method C utilizes cross-talk and inverse cross-talk matrices without compression, which helped preserve visual detail and colour consistency more effectively. However, the experiment also revealed that performance is highly content-dependent: images with darker or more complex lighting conditions favored Method C significantly, while certain high-exposure images reduced its advantage.
Additionally, lightness histograms and cumulative curves confirmed the impact of image content on perceived quality. A second experiment further demonstrated that gain maps can improve perceptual quality on SDR displays. Observers adjusted the gain map weighting parameter (w) depending on the content, and their preferences were consistent even across calibrated displays, emphasizing the role of adaptive tuning.
In summary, the findings support Method C as the most effective TM strategy among the three evaluated, particularly when combined with gain map optimization. These results contribute to advancing HDR content adaptation for SDR displays, offering practical guidelines for achieving both fidelity and visual appeal across diverse viewing environments.


