1. Introduction
Studying motion sickness is vital due to its widespread impact on daily life. It is not just a matter of discomfort; motion sickness can lead to a decrease in productivity and overall well-being. In contexts like travel, tourism, and even emerging virtual reality applications, understanding and mitigating motion sickness can significantly enhance user experience.
Furthermore, as transportation technology evolves, ensuring passenger comfort becomes as crucial as safety. Focusing on motion sickness in the vehicle environment is increasingly important, especially as cars transform into entertainment and work spaces with the advent of autonomous vehicles. In such scenarios, passengers will engage more with in-vehicle media, increasing the likelihood of motion sickness. With the increasing prevalence of in-vehicle media displays, motion sickness induced by these media environments has become a critical issue, driving research efforts to develop effective mitigation strategies [
1,
2,
3,
4]. Research in this area is not only about improving comfort but also about ensuring that future transportation technologies are accessible and usable for everyone, regardless of their susceptibility to motion sickness.
Existing approaches in virtual reality (VR) environments generally aim to minimize the discordance between a user’s visual perception and the vestibular system’s response, reducing VR-induced motion sickness. This theoretical foundation has informed numerous studies, with most focusing on visual perception techniques, such as limiting motion-sensitive peripheral vision through methods like field of view (FOV) adjustment and Foveated Rendering [
5,
6]. Additional methods include Independent Visual Background (IVB) techniques and Visual Guides that direct the user’s gaze [
7,
8,
9,
10,
11,
12].
Previous studies have shown that motion sickness (MS) in visual environments is closely related to optical flow, particularly in fixed-base simulators. For instance, Nooij et al. [
13] found that vection induced by angular optical flow is a primary contributor to MS, supporting theories of sensory conflict and eye movement. Conversely, Shahal et al. [
14] reported that visual display parameters such as brightness and contrast did not significantly affect MS in a passively flown simulator.
Despite these findings, it remains unclear how motion-synchronized adjustments to these parameters—rather than static levels—might impact MS in a real-time vehicle context. Therefore, this study investigates whether dynamically adjusting brightness and field of view (FOV) in response to vehicular movement can provide a novel method of reducing MS in rear-seat passengers. Prior studies have examined FOV effects across the entire field of vision to reduce motion sickness in VR, typically adjusting FOV based on user movement. However, our study presents a distinct approach, applying the FOV effect exclusively to the display to alleviate motion sickness in a simulated in-vehicle VR environment. Unlike user-driven FOV adjustments, our method adapts to simulated vehicle movements, dynamically responding to changes in acceleration and angular velocity.
This study proposes a motion sickness mitigation method for in-vehicle media viewing by dynamically adjusting FOV on the in-vehicle display according to vehicle movement. We employ a motion simulator to simulate real vehicle vibrations, enhancing the sense of presence and reducing discrepancies between visual perception and vestibular response. Through this approach, we aim to assess the effects of brightness adjustment and FOV on motion sickness in VR-based in-vehicle media environments.
A preliminary version of this work was presented in a previous conference paper [
15], which introduced the core idea of using dynamic FOV adjustments for motion sickness mitigation in in-vehicle environments. This journal article complements the prior work by elaborating on experimental methodology, providing extended analysis, and offering a more comprehensive interpretation of the results.
The structure of this paper is as follows:
Section 2 introduces related studies on motion sickness and visual adjustment in VR and in-vehicle contexts.
Section 3 outlines the experimental methods, including test conditions, participants, and questionnaires.
Section 4 details the motion-based FOV and brightness adjustment algorithms.
Section 5 presents the results of the pilot, main, and secondary experiments, and
Section 6 concludes with a summary and future research directions.
2. Related Research
As in-vehicle media display environments become increasingly widespread, practical and widely applicable solutions for reducing motion sickness remain limited. Our study addresses this gap by targeting motion sickness mitigation in in-vehicle media viewing environments, drawing on the commonly accepted theory that motion sickness arises from mismatches between visual perception and vestibular signals. A commonly used method for reducing motion sickness is to limit the field of view (FOV). Although a wider FOV enhances realism, it also amplifies the sensation of vection, which can significantly contribute to motion sickness. By reducing visual input through physical restriction of the FOV, the vection illusion can be diminished, thereby alleviating sensory conflict. Research by Fernandes and Feiner [
7] demonstrates that dynamic field of view (FOV) adjustments can reduce motion sickness in stationary viewers experiencing visually induced motion. Additionally, preliminary experiments by Lim [
8] show that masking peripheral vision to narrow FOV can positively impact motion sickness reduction. Lim’s study, however, was confined to stationary settings without physical motion, thus overlooking vestibular-induced motion sickness and presence-related factors. To address these limitations, we employ a motion simulator that synchronizes with virtual vehicle movements to replicate real-world conditions more accurately. This simulator allows us to engage the vestibular system directly, hypothesizing that reducing motion sickness by narrowing FOV on the in-vehicle display in response to vehicle dynamics will prove effective.
Further, while our research examines VR environments simulating real vehicular conditions, we have also reviewed the literature on motion sickness in actual vehicular contexts [
16,
17,
18,
19]. Vehicular motion sickness, similar to VR motion sickness in terms of vestibular–visual mismatch, arises oppositely: it occurs when the user’s body moves but lacks corresponding visual cues, as seen in passenger motion sickness where drivers generally remain unaffected due to aligned visual–vestibular feedback. Shi et al. [
18] experimented with dynamic FOV in a vehicular racing scenario, highlighting that continuous, intense motion caused frequent FOV fluctuations, resulting in adverse effects. These findings indicate that vehicle or scenario types significantly impact motion sickness outcomes. Our research, in contrast, focuses on typical vehicular settings rather than racing scenarios, where FOV restrictions adjust dynamically to vehicle deceleration, acceleration, and rotational shifts, leading to less frequent FOV adjustments. Thus, our approach avoids the disruption of normal viewing while managing motion sickness symptoms. By dynamically controlling visual effects within the display—limiting visual interference with media content—we ensure realism through motion simulator synchronization with virtual vehicle movements.
Previous studies have primarily applied FOV limitation uniformly across the entire field of view and have typically synchronized such adjustments with the user’s head movement. However, these studies did not consider vestibular stimuli induced by the motion of a vehicle. Furthermore, the existing literature has largely focused on drivers, overlooking the fact that back-seat passengers, who are often not facing forward, are more susceptible to motion sickness. Few studies have specifically addressed this issue.
To reflect real-world usage scenarios, the experiment was designed with participants seated in the rear of a vehicle, engaging directly with in-vehicle displays—conditions under which motion sickness is frequently reported. This study tests two methods for reducing motion sickness in in-vehicle environments: dynamic FOV restriction and brightness adjustment. Although FOV reduction can reduce motion sickness, it risks reducing immersion, potentially diminishing media content quality. To counteract this, we adjust transparency in FOV reduction to maintain content clarity. Additionally, brightness adjustments consider Chattha et al.’s findings [
4,
5] that darkness may increase stress and motion sickness. By evaluating both FOV and brightness adjustments, we aim to optimize in-vehicle display settings for enhanced comfort and reduced motion sickness in future media viewing applications.
3. Experimental Methods
In line with the objective of mitigating motion sickness in real-world vehicle environments, it is essential to validate the effectiveness of reduction techniques under realistic conditions. However, the inherent variability and unpredictability of real environments make it difficult to ensure consistency and accuracy in experimentation.
To address these limitations, numerous studies have adopted virtual reality (VR) to replicate real-world scenarios. VR enables controlled, repeatable, and safe simulations, even in situations where conducting experiments in real vehicles may be impractical or impossible. In our study, we constructed a VR environment that closely mimics real driving conditions. In addition, motion stimuli were designed to be synchronized with virtual vehicle movement in order to emulate vestibular stimulation.
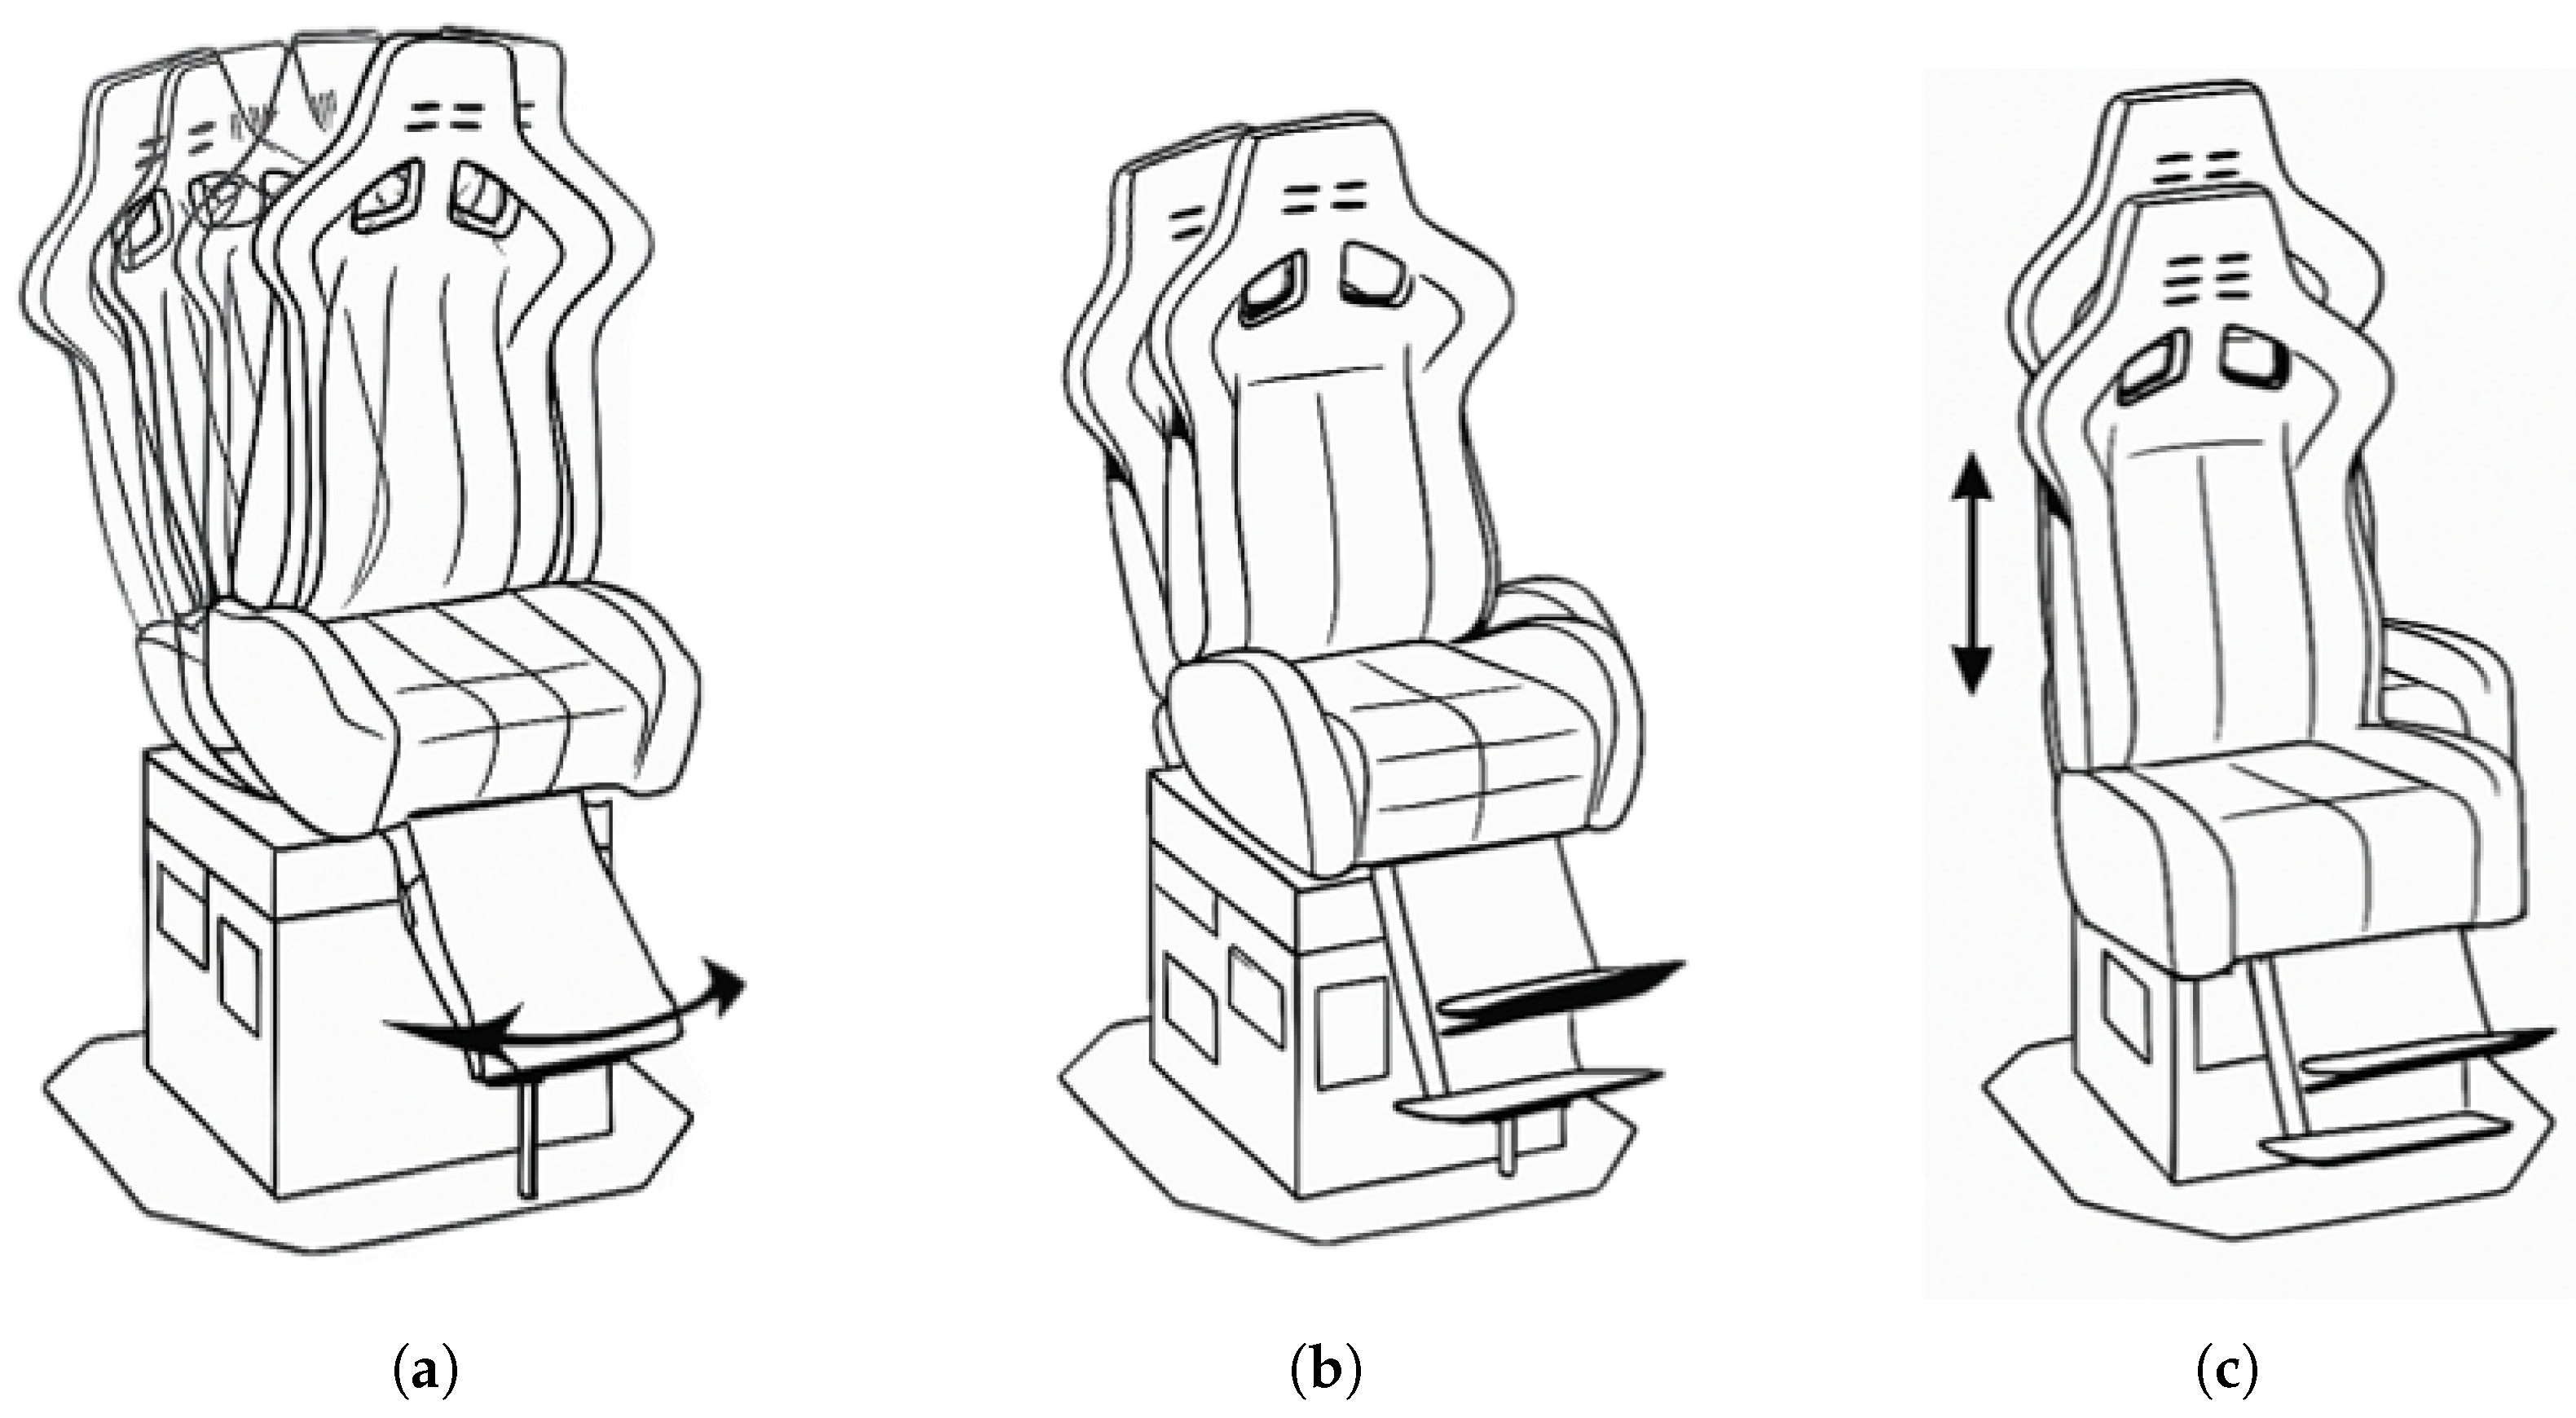
Figure 1 illustrates the basic operation of the motion simulator used for synchronization, which operates along three axes: roll, pitch, and heave. To simulate the vestibular stimulation experienced in real vehicles, the motion simulator was configured to respond only to changes in acceleration. By comparing the current and previous acceleration values, the system determines whether the vehicle is moving at a constant speed—indicated when the two values are equal. In actual driving scenarios, passengers feel a momentary shift in body posture when movement begins or when speed changes occur. As the vehicle continues to move at a constant velocity, the body gradually returns to a neutral position from its initial tilted state. Similarly, the motion simulator replicates this response by tilting according to the direction and intensity of the vehicle’s acceleration at the onset of motion. As the motion continues and the difference between the current and previous acceleration diminishes, the simulator gradually returns from its tilted position to the neutral posture.
Within this environment, similar to real-world contexts, changes in the external surroundings, user motion, and display dynamics interact in complex ways (
Figure 2). To build such a simulation, we modeled not only the vehicle’s exterior and interior but also the media environment. Among various parameters that can be used to adapt motion sickness reduction techniques to vehicle movement, angular velocity and acceleration are particularly relevant, as they strongly stimulate the vestibular system. Therefore, this study primarily focuses on reducing the vection illusion by targeting fluctuations in angular velocity and acceleration.
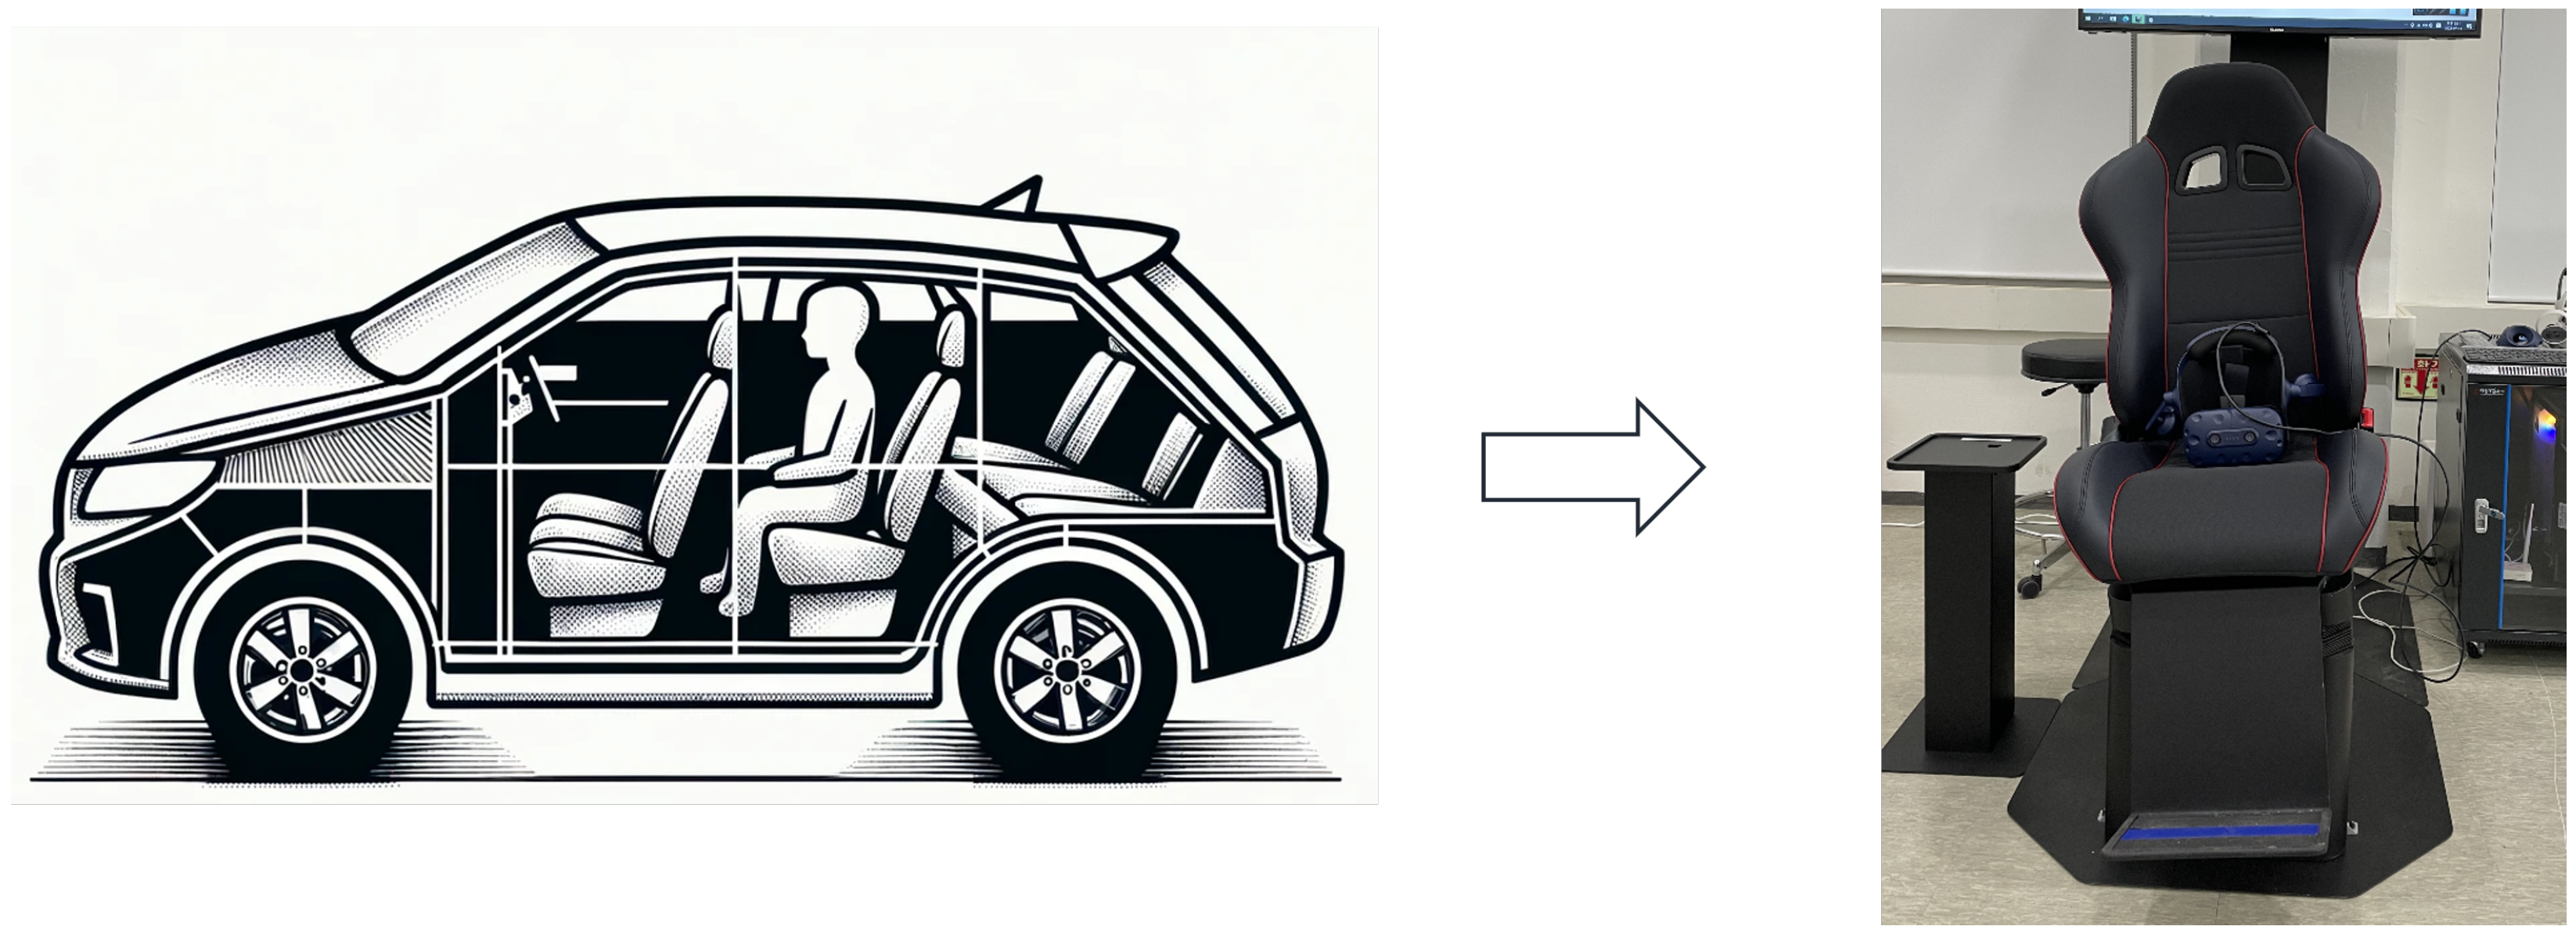
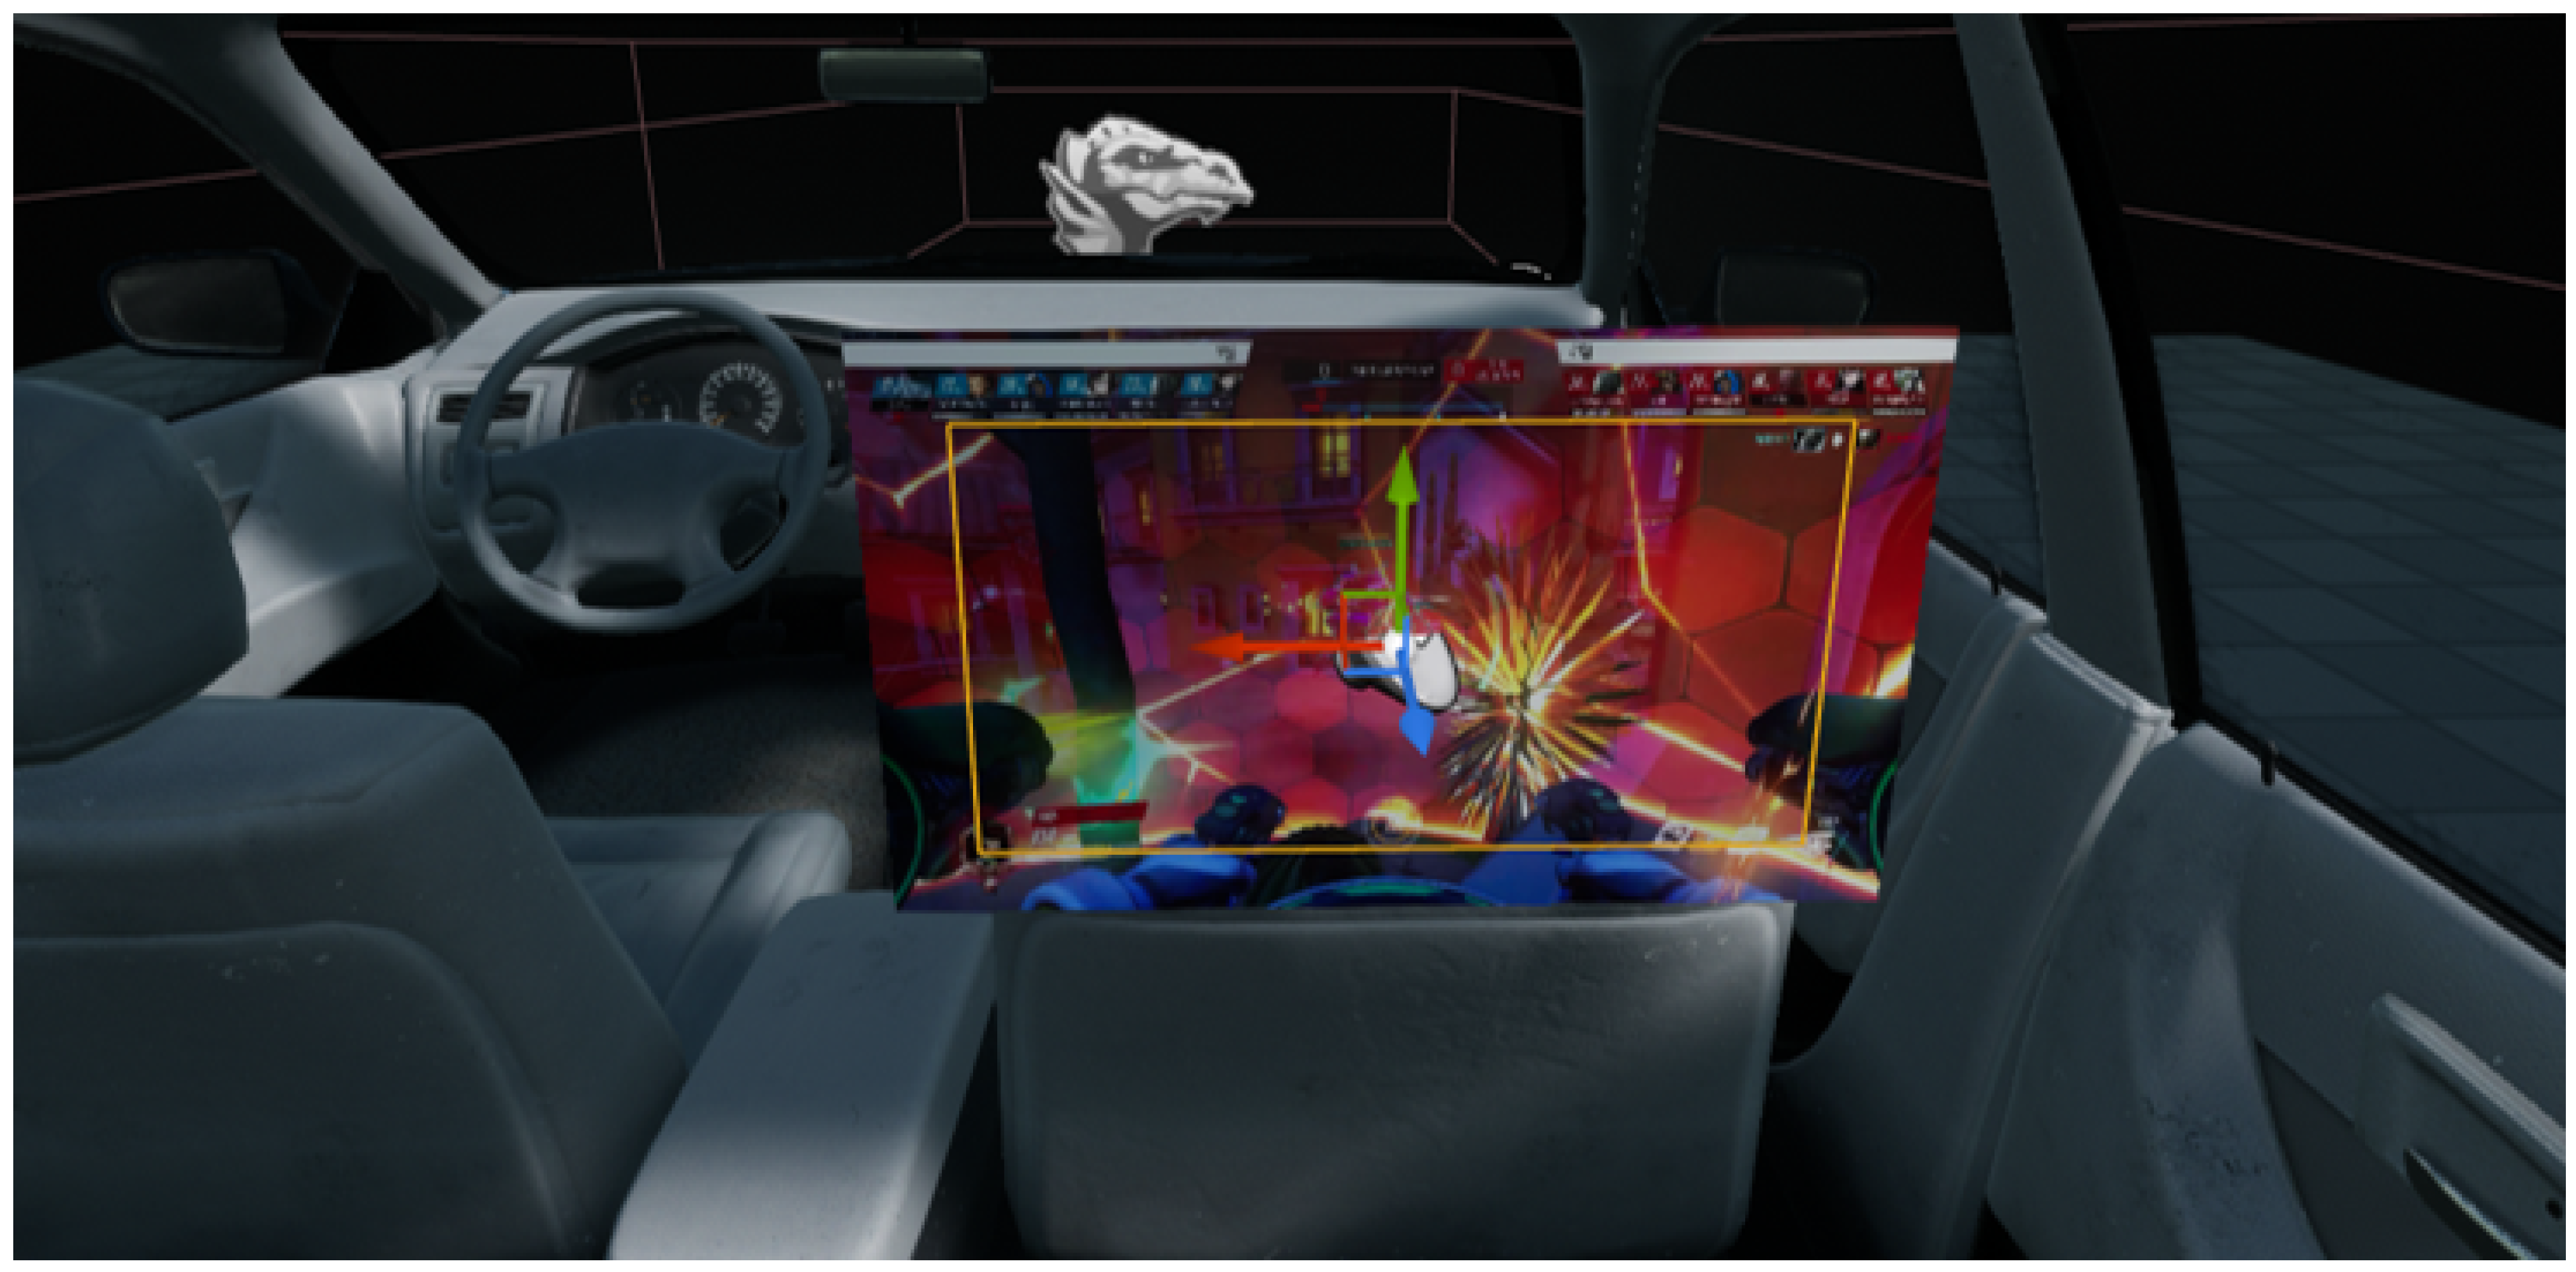
In the experiments conducted for this study, motion sickness levels were measured by applying three different cases to the in-vehicle display. Participants were seated in a one-person motion simulator wearing a Head-Mounted Display (HMD). In the virtual environment, participants were seated in a fixed position corresponding to the rear seat of a vehicle and were instructed to maintain visual fixation on the in-vehicle display throughout each trial (
Figure 3). The virtual vehicle interior and exterior environments were implemented using Unreal Engine 4.27. The motion output was generated using the internal dynamics engine of the motion simulator, based on the maximum tilt configuration of
degrees. Although participants primarily focused on the display content, the peripheral motion of the virtual environment could be perceived through the front-facing windshield and the right-side window. This setup allowed participants to receive partial peripheral visual motion cues during the task. The experimental setup utilized an HTC VIVE and a one-person motion simulator connected to a PC.
3.1. Experimental Case
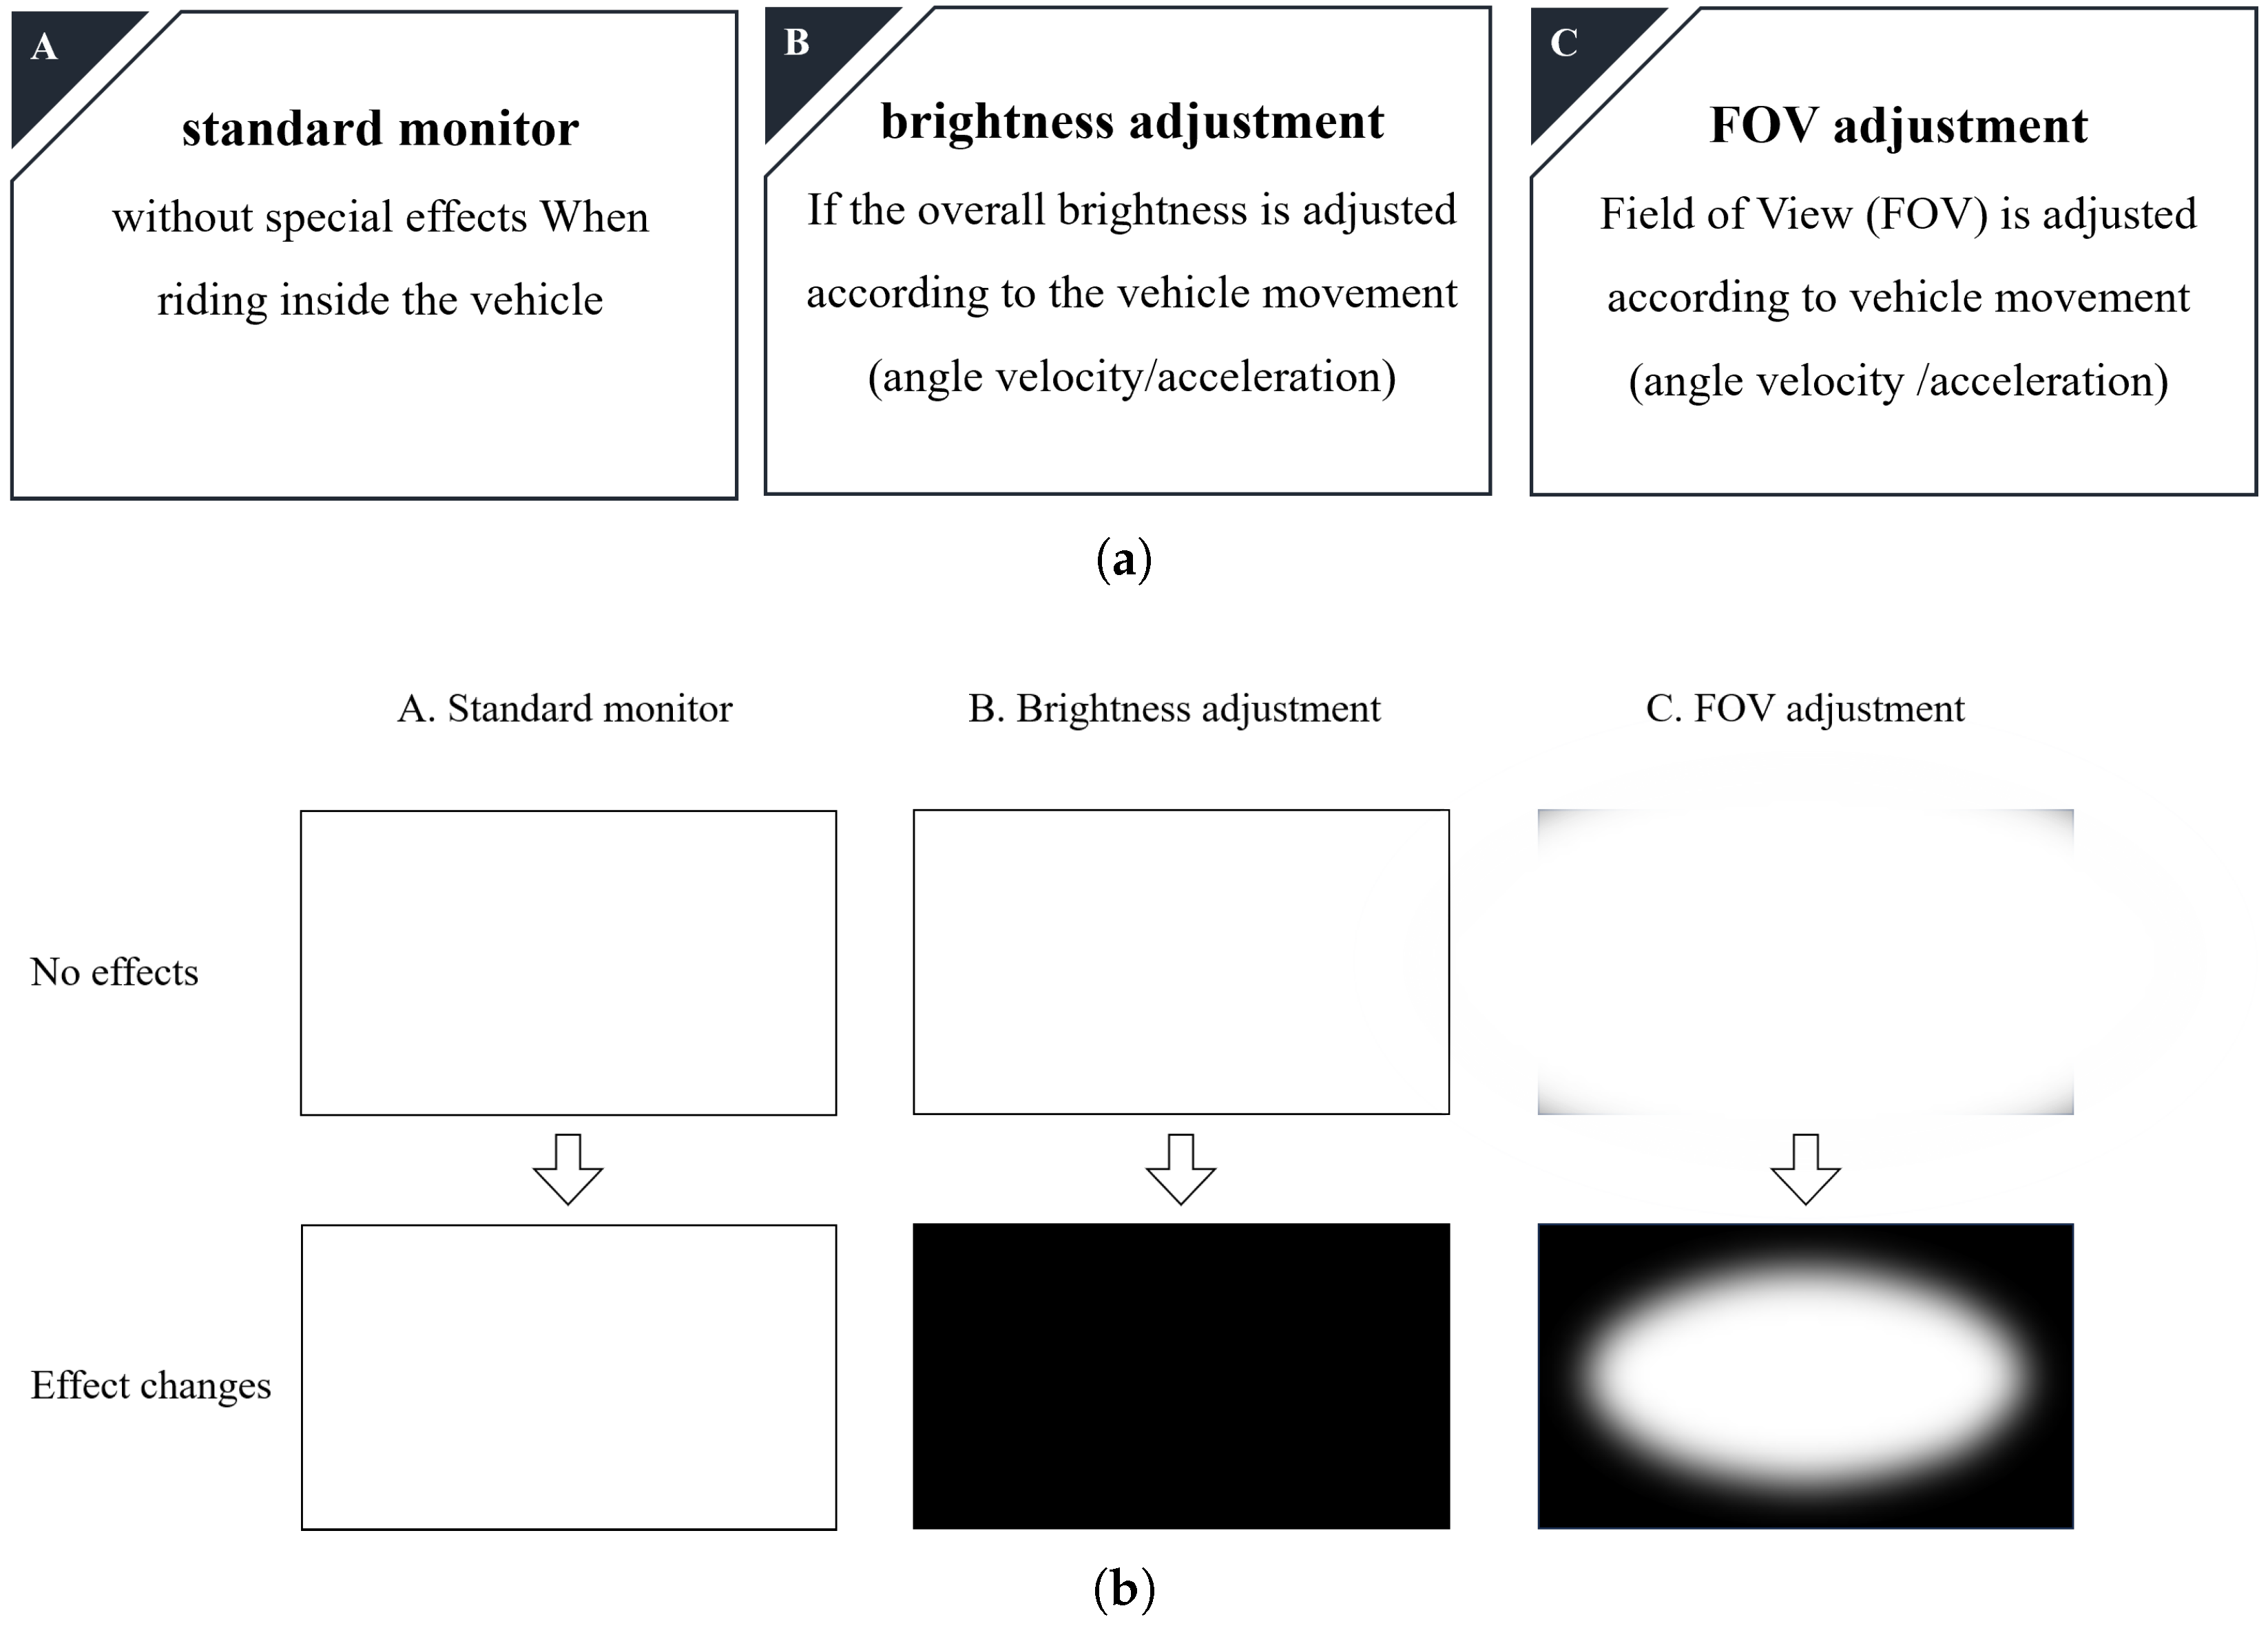
Three media viewing methods were applied in this study (
Figure 4).
The conditions were as follows:
Standard display with no visual effects;
Display with brightness adjustment based on vehicle motion;
Display with field of view (FOV) adjustment based on vehicle motion.
The first condition involved standard media playback without any special effects, simulating a basic in-vehicle viewing scenario with a standard monitor. In the second condition, brightness adjustments were applied to the in-vehicle display, dynamically adjusting according to the vehicle’s angular movements. The third condition employed field of view (FOV) adjustments on the display, where the FOV was modified based on the vehicle’s angular movements.
3.2. Experimental Procedure
To minimize any sequence effects on the results, the order of cases was randomized. Each participant completed all three experimental cases in a single day, with this process repeated over three consecutive days. The procedure was as follows. On the first day, participants completed the Motion Sickness Susceptibility Questionnaire (MSSQ) and received detailed instructions about the experiment. Each case was conducted for 10 min, followed by a 15 min rest period that included time for participants to complete questionnaires, thereby minimizing carryover effects between cases. Motion sickness and immersion levels were measured using the Simulator Sickness Questionnaire (SSQ) and the Presence Questionnaire (PQ), administered after each case. An overview of this experimental procedure is illustrated in
Figure 5.
3.3. The Questionnaires Used in the Experiment
Throughout this experiment, each participant completed three types of questionnaires: the MSSQ-Short (Motion Sickness Susceptibility Questionnaire-Short) by Golding JF [
20], the SSQ-Table (Simulation Sickness Questionnaire-Table) by Kennedy [
21], and the PQ-Table (Presence Questionnaire-Table) by Witmer & Singer [
22].
The MSSQ-Short and SSQ-Table questionnaires use an 8-point response scale ranging from 0 to 7, while the PQ-Table uses a 7-point response scale ranging from 0 to 6. The MSSQ-Short, administered on the first day before the experiment began, assesses aspects such as general motion sickness susceptibility, motion sickness before age 12, and experiences over the past 10 years, using the 8-point response scale. The use of MSSQ-Short helps identify individual differences in motion sickness susceptibility prior to the experiment, which can influence how participants experience simulator sickness during the trials [
23]. The SSQ-Table includes 16 items to measure motion sickness symptoms, with the 8-point response scale indicating the following: 0 (no symptoms), 2 (slight), 4 (moderate), and 7 (severe). The PQ-Table, consisting of 22 statements, evaluates immersion using a 7-point response scale.
4. Algorithms
The algorithm for motion sickness mitigation is applied primarily during moments of discrepancy between vestibular and visual signals, particularly when the vestibular system responds to vehicle movements. The conditions for applying motion sickness mitigation align with instances when the vestibular system detects movement.
The criteria for adjusting visual effects to reduce motion sickness are based on two key factors: angular velocity and acceleration. For acceleration, the direction—not the magnitude—is the critical aspect, with adjustments applied whenever acceleration occurs. Regarding angular motion, the primary trigger is the initial change in angular velocity (i.e., angular acceleration), as the vestibular system responds only to acceleration, and sustained angular velocity becomes perceptually negligible over time. Adjustments are thus applied based on the duration of continuous changes in angular velocity rather than the magnitude, influencing FOV and brightness modifications.
This study includes three experiments: a pilot experiment focused solely on angular velocity, the main experiment, and a secondary experiment, considering both angular velocity and acceleration. The primary emphasis is placed on significant changes in angular velocity, with minimal changes in acceleration considered secondary.
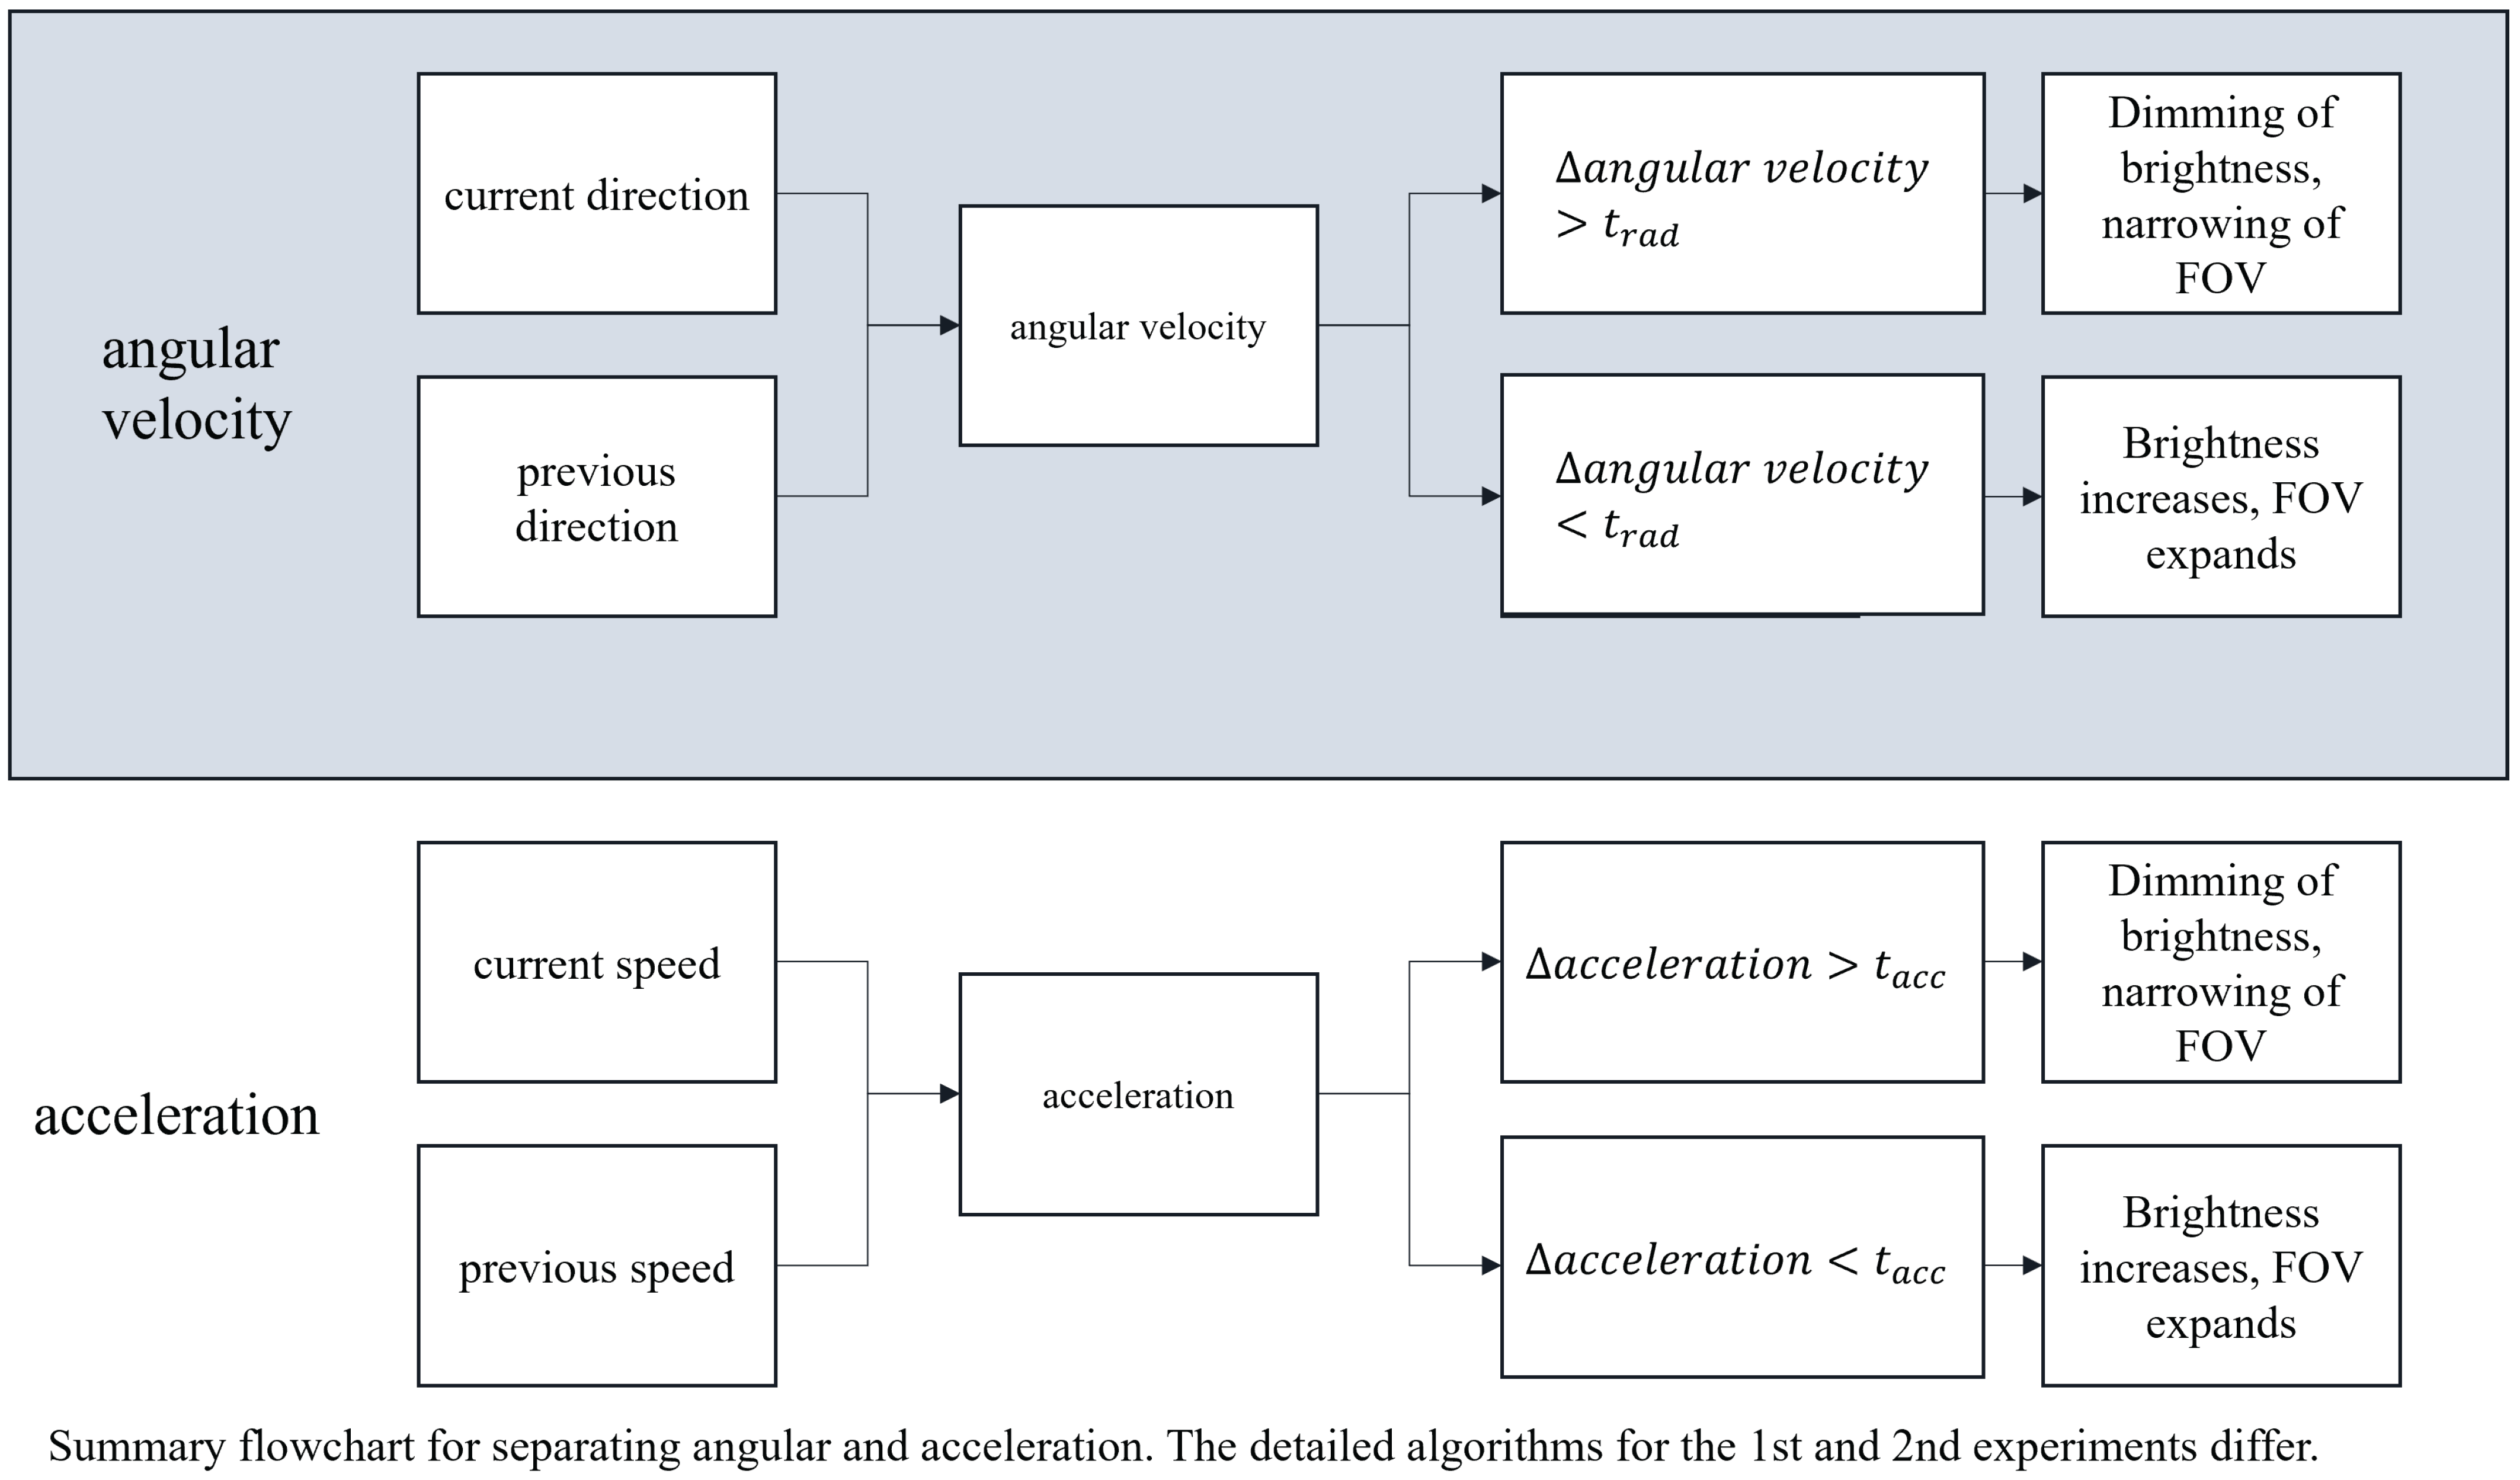
Figure 6 depicts the overarching algorithm where these adjustments are implemented, summarizing the conditional logic used to trigger brightness and FOV changes based on angular and linear motion. When rapid visual adjustments are applied based on angular changes per unit time due to vehicle movements, they can potentially induce dizziness. To address this, we developed a method that adjusts FOV and brightness according to the duration of visual changes. Two distinct calculation methods were used for both angular velocity and acceleration.
4.1. Visual Adjustment Criteria Based on Motion Changes
4.1.1. Application of Effects Based on Angular Velocity Changes
The formula for changes in angular velocity is shown in Equation (
1):
In Equation (
1), the first calculation determines the effect of narrowing the FOV and dimming the brightness when
, based on the inner product calculation
, which represents the 3-axis angular velocity in the vehicle’s heading direction,
. Conversely, when
, the effect is applied to widen the FOV and increase brightness. The second calculation interprets
as the 3-axis acceleration,
. In this context, the effect is to narrow the FOV and dim the brightness if
, and to widen the FOV and increase brightness if
. Here,
t is a threshold used to account for numerical error.
4.1.2. Application of Effects Based on Acceleration Changes
The effects based on acceleration changes are applied at regular intervals, calculated at the same time intervals as angular velocity. The formula for acceleration changes is shown in Equation (
2):
In Equation (
2), the first calculation applies the effect of narrowing the FOV and dimming the brightness when
, where the current position is denoted as
and
represents the velocity
. Conversely, when
, the effect is applied to widen the FOV and increase brightness. The second calculation considers
, applying the effect of narrowing the FOV and dimming the brightness when
, and widening the FOV and brightening the screen when
. Note that the thresholds
t for angular velocity and acceleration are distinct and separate.
4.2. Application of Effects and Algorithm Flowcharts
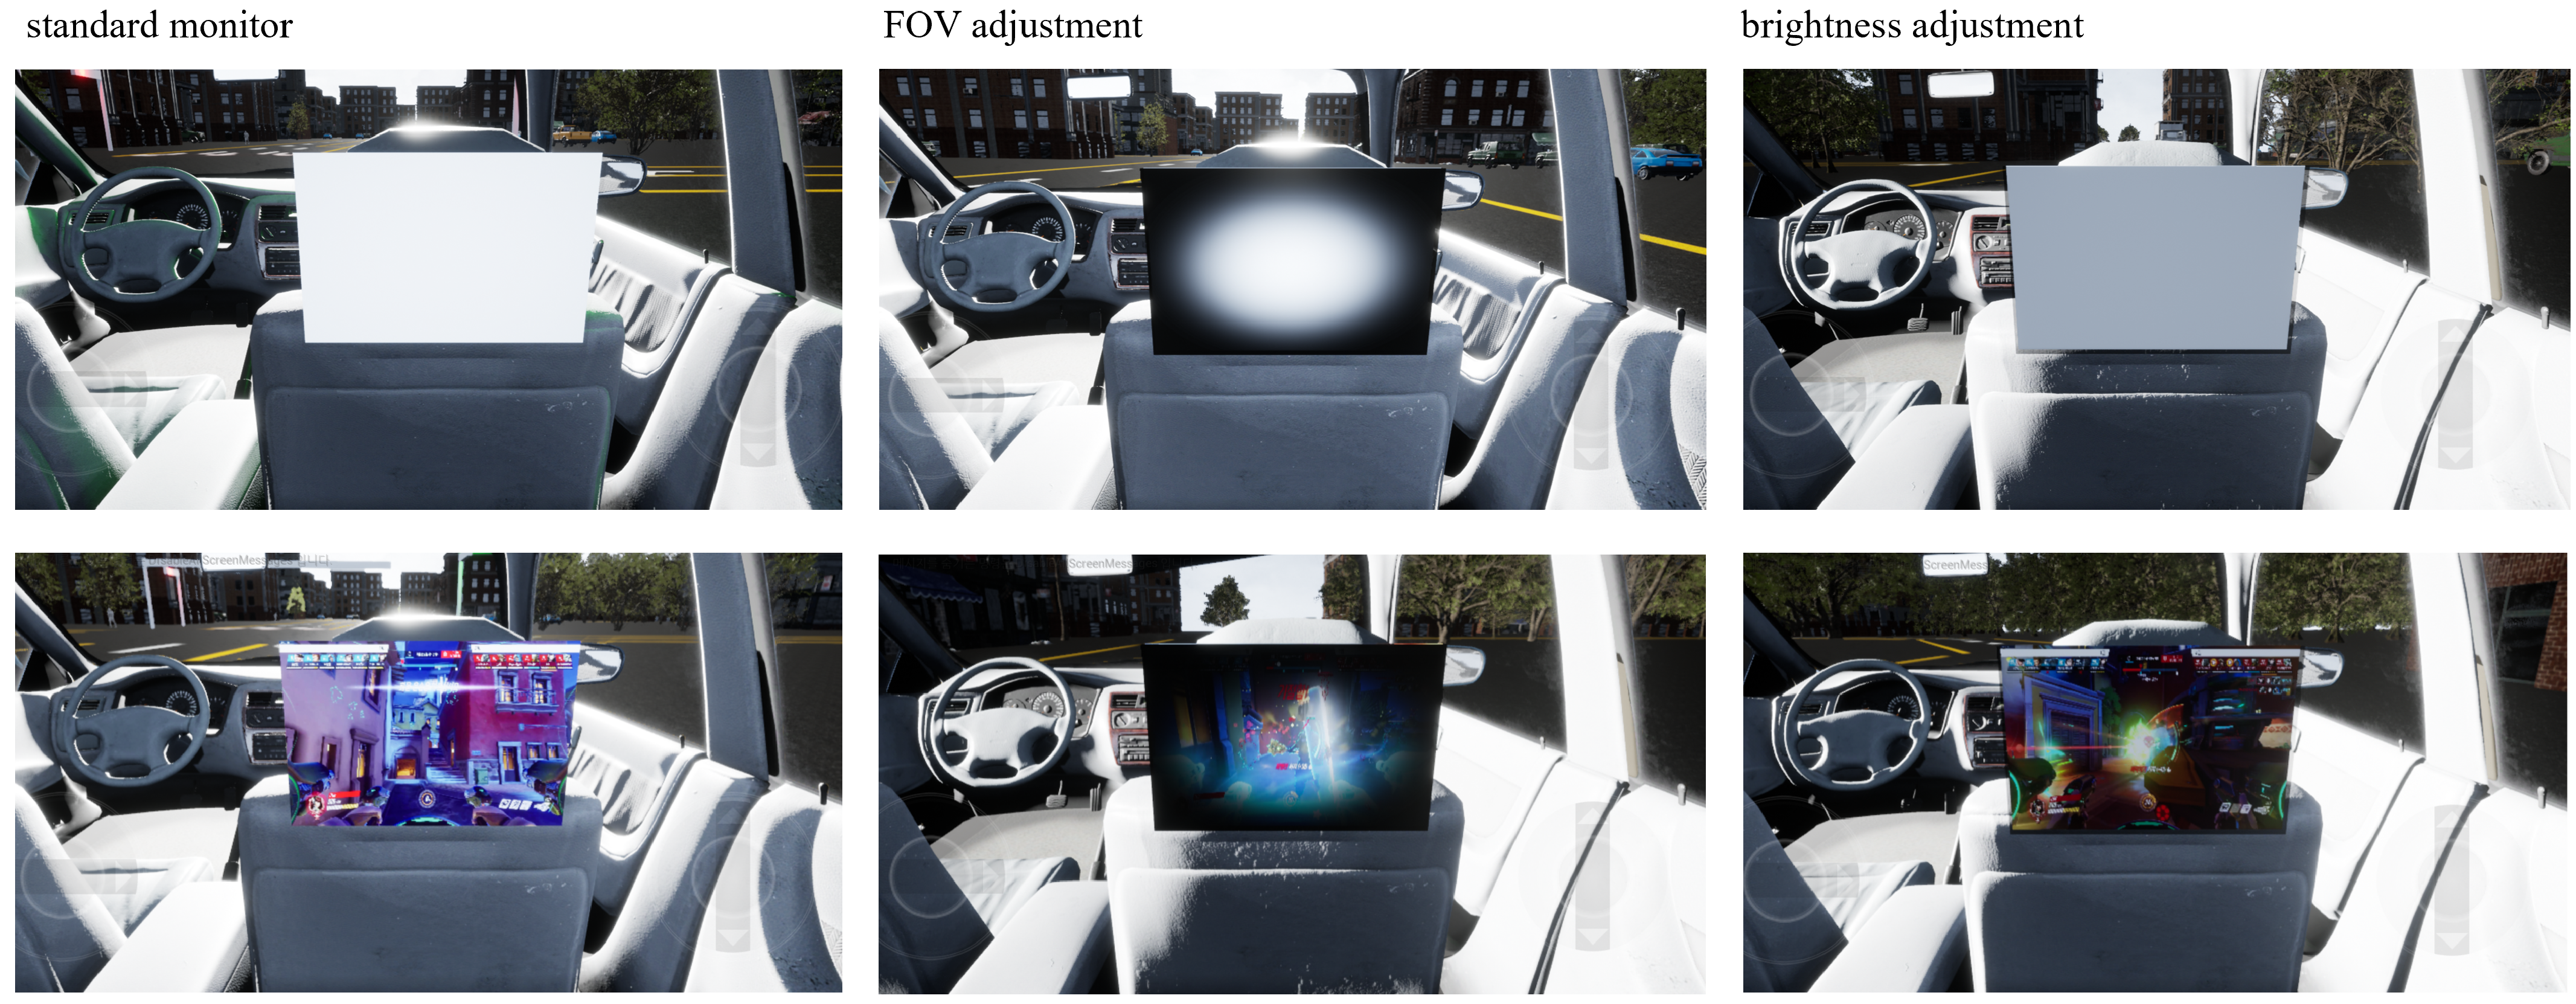
Figure 7 illustrates the effects applied based on the computed equations for angular velocity and acceleration. From left to right, it shows the effects of a standard monitor with no changes, FOV adjustments, and brightness adjustments. The top row provides an intuitive visualization of how these effects are applied, while the bottom row displays the video content used in the actual experiments.
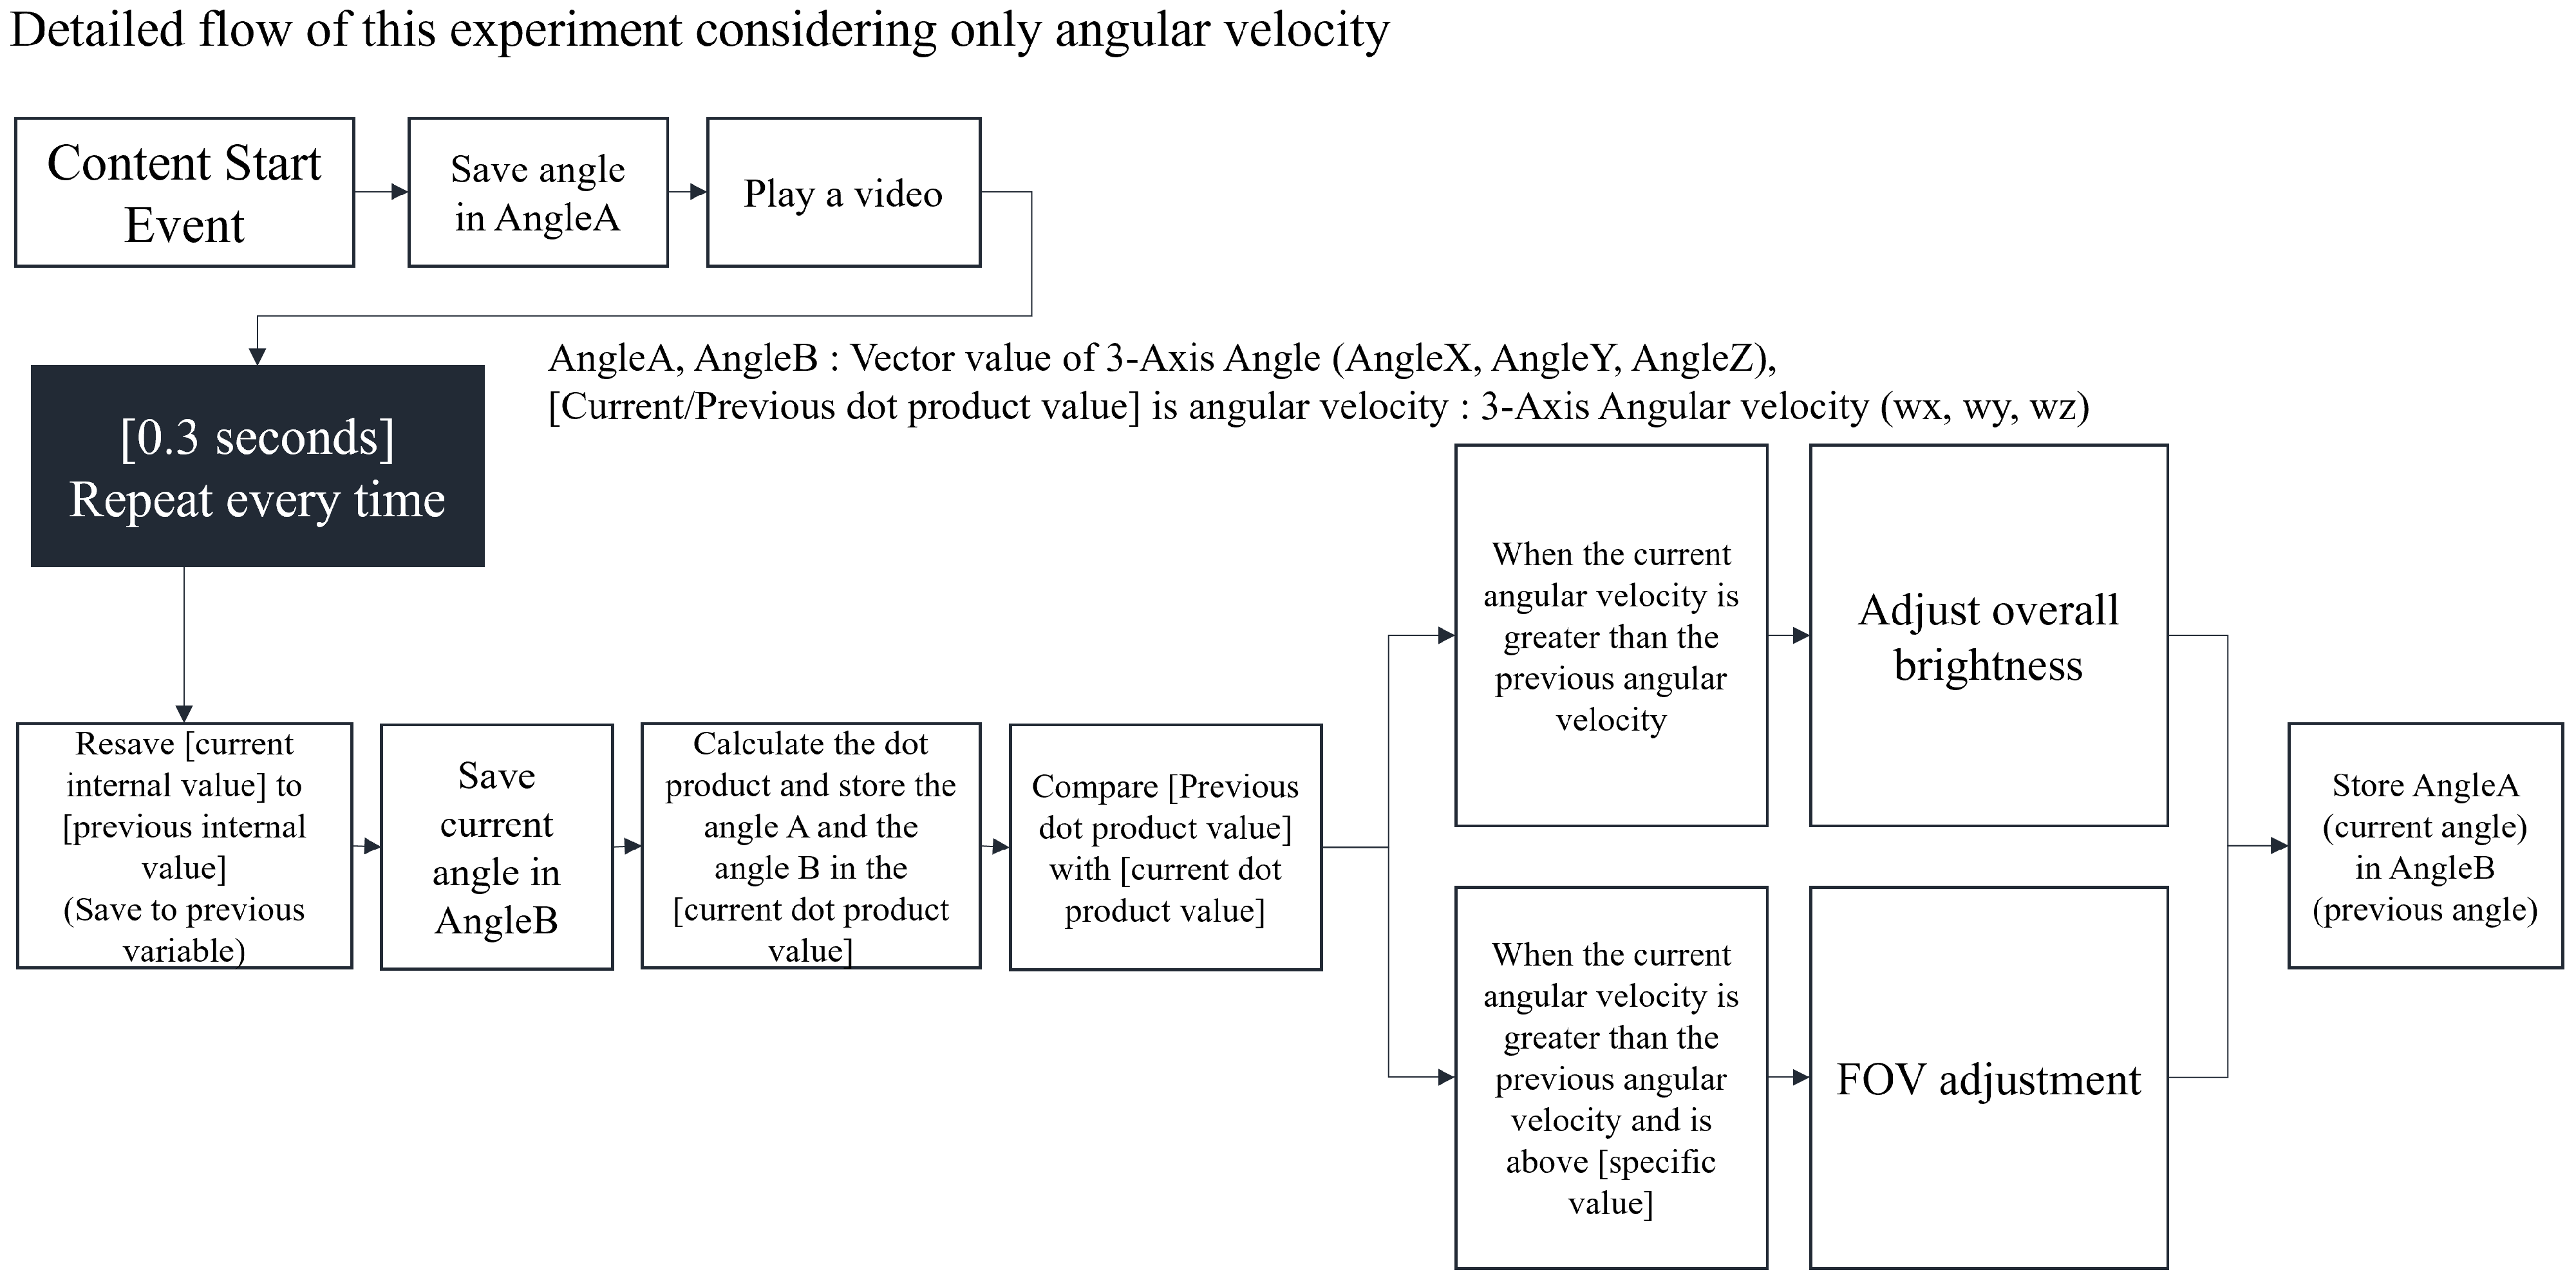
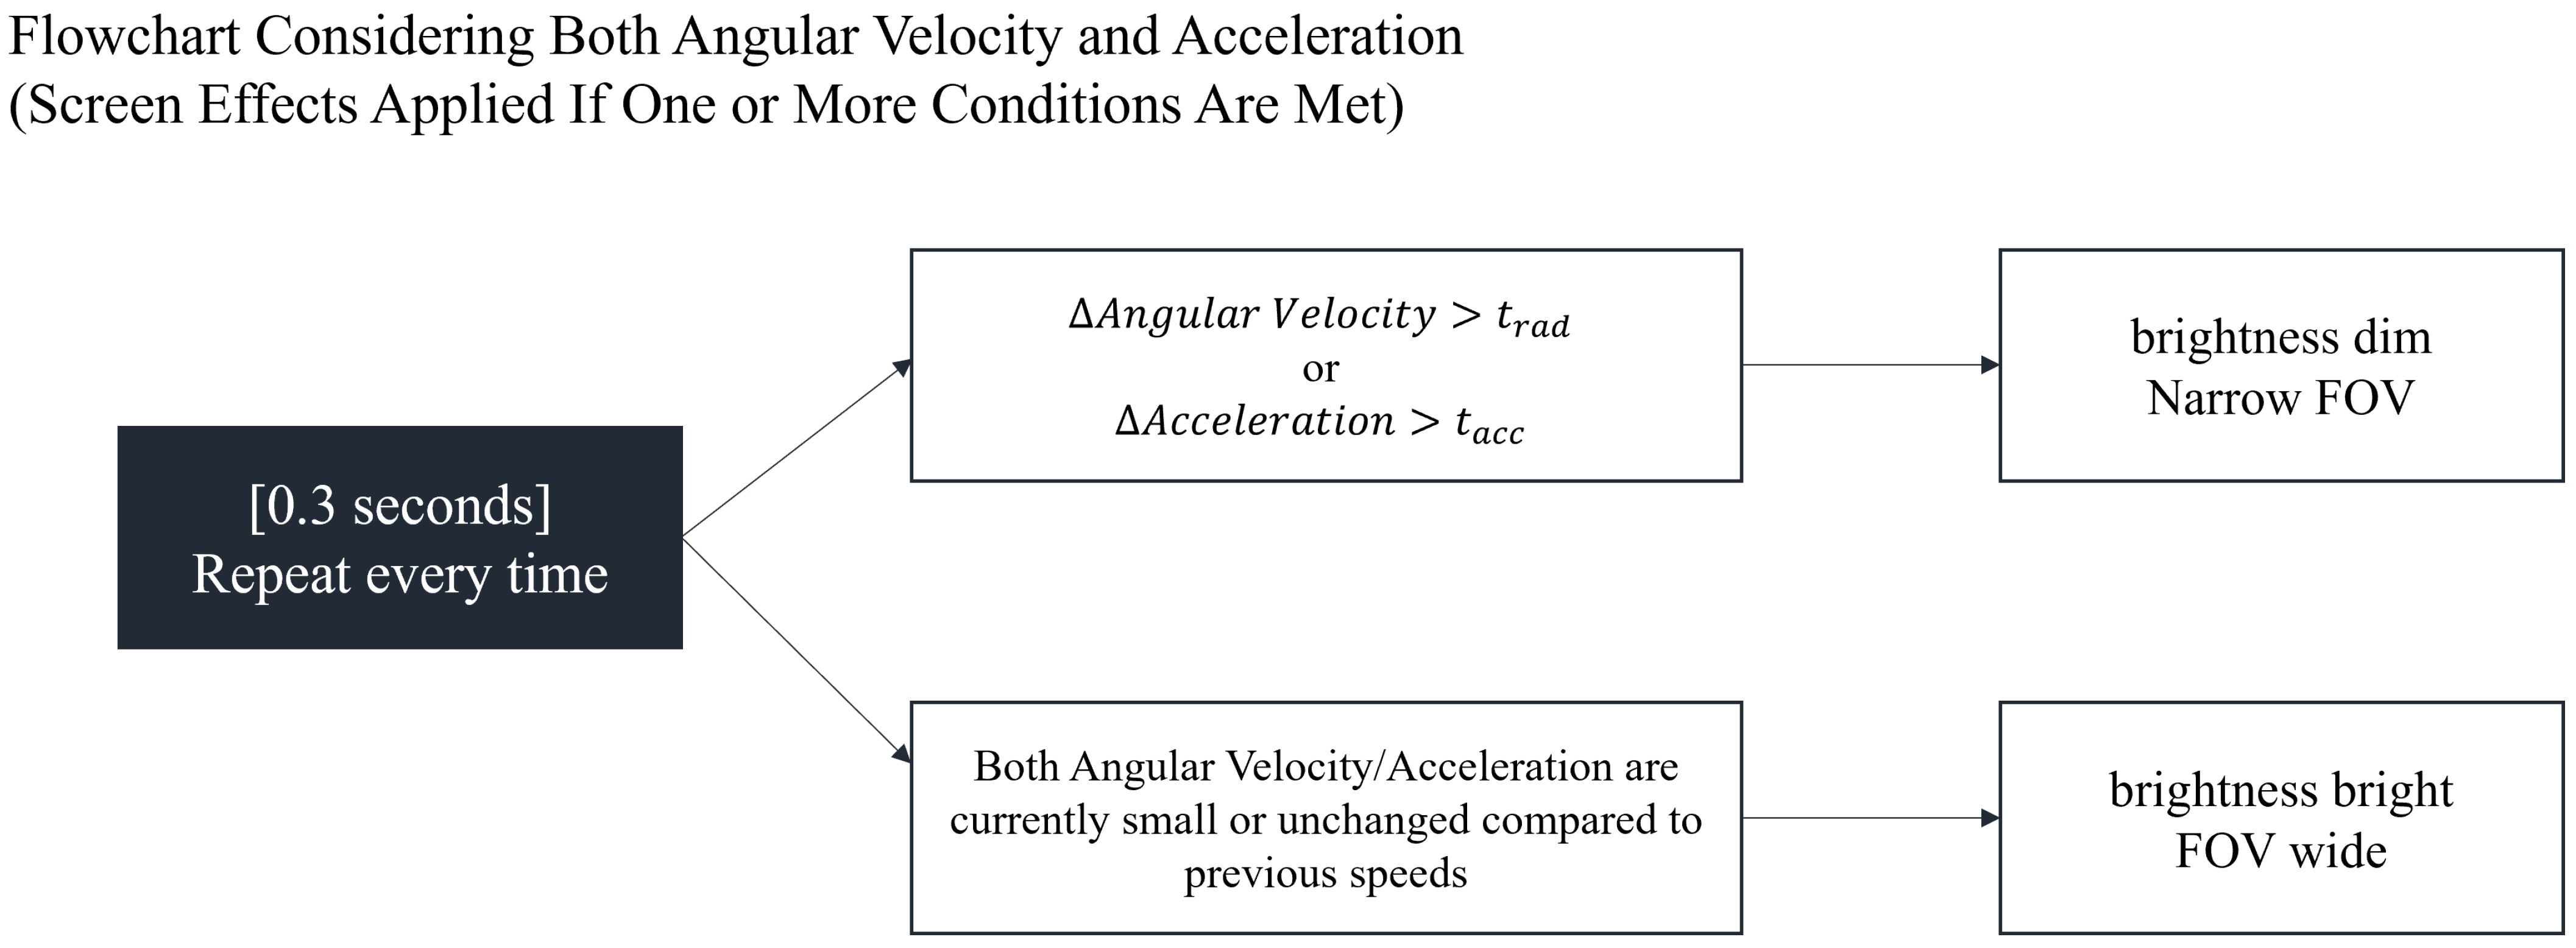
Figure 8 and
Figure 9 present the flowcharts of the algorithms used in the pilot, main, and secondary experiments. In
Figure 8, the pilot and main experiments utilize only angular velocity to dynamically adjust brightness and FOV according to changes in the vehicle’s angular velocity. Angular velocity is calculated every 0.3 s for an angle, ‘
’, using a vector variable that dynamically changes in response to the vehicle’s direction. Changes in angular velocity are measured at regular intervals during this process. The figure outlines the repeated angle tracking, dot product computation, and threshold comparisons used to determine visual adjustments.
Figure 9 displays the algorithm for the secondary experiment, which considers both angular velocity and acceleration. If one or more values exceed the threshold for either angular velocity or acceleration, screen effects are applied, similar to the procedures in the earlier experiments.
5. Results
5.1. Adjustments Based on Pilot Test
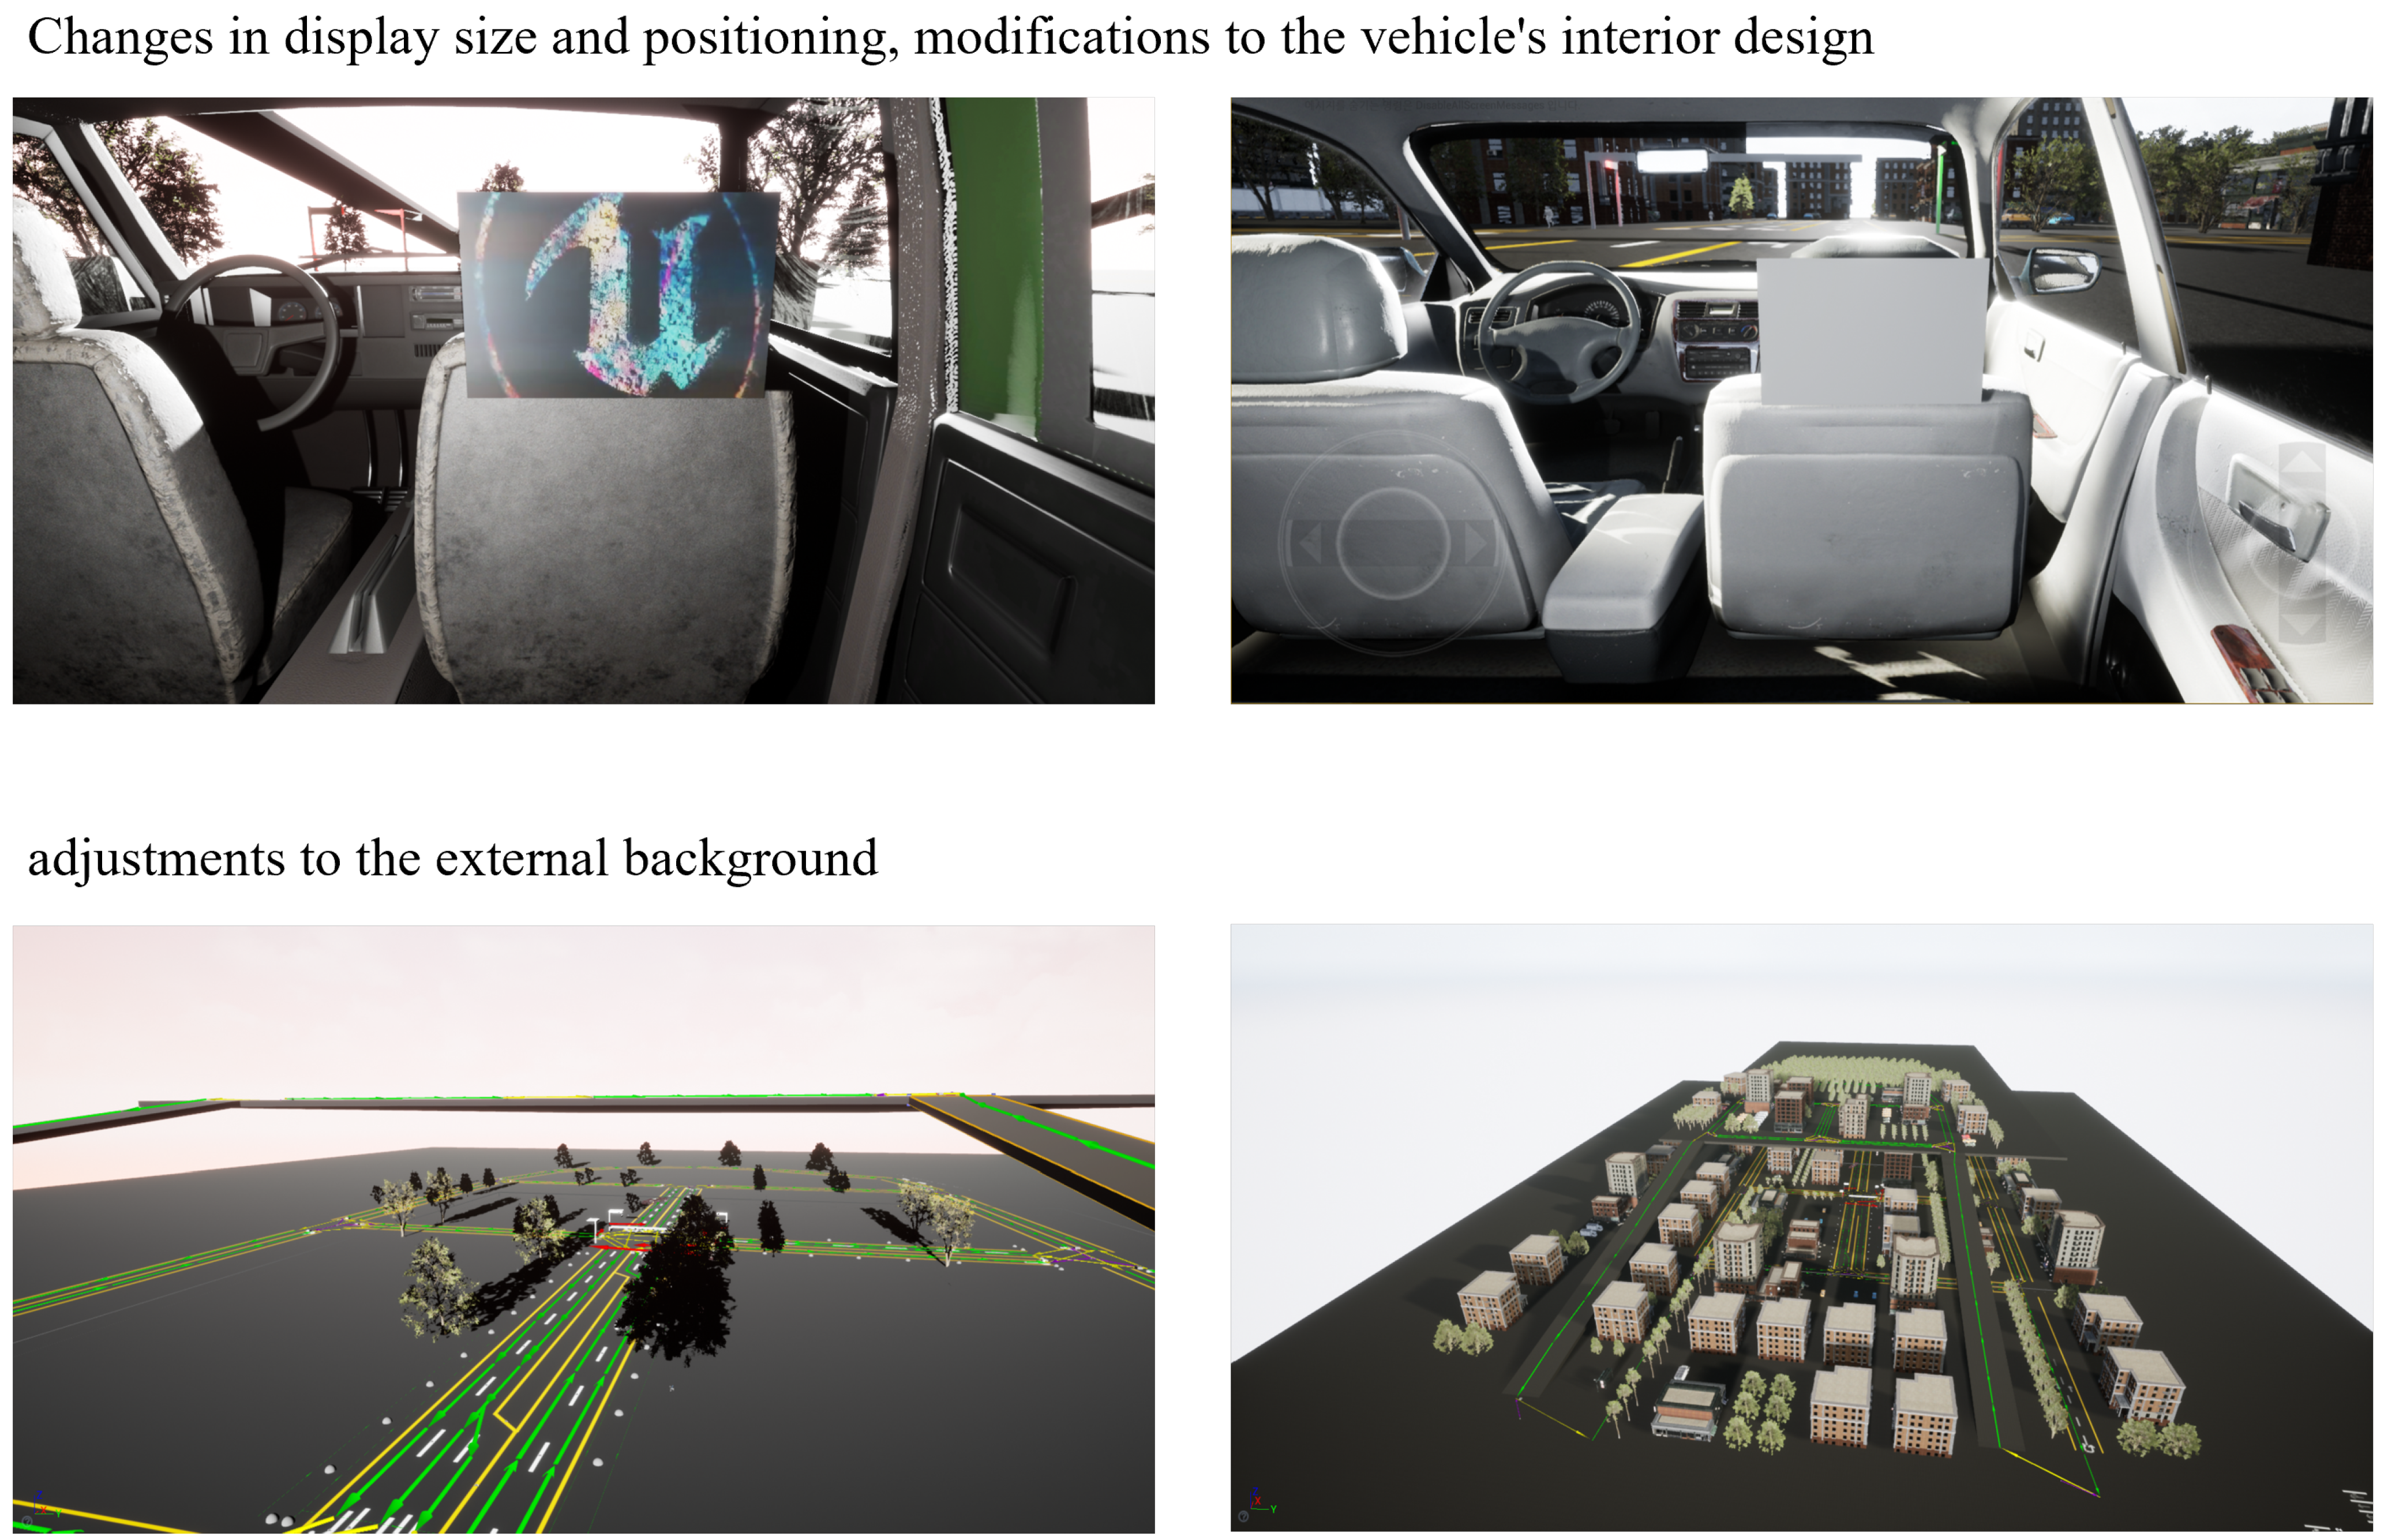
Based on insights from the pilot test conducted prior to the main experiment, several adjustments were made to enhance the experimental setup. These changes included extending the experiment duration from 5 to 10 min, modifying video content to induce stronger motion sickness, and providing written instructions to assist participants with questionnaire completion. Additionally, improvements were made to enhance immersion by enhancing the exterior background visible through the vehicle’s windows and improving the interior design of the vehicle.
Figure 10 shows the content environment during the pilot experiment (left) and the enhanced environment for the main experiment (right).
5.2. Main Experiment Results
5.2.1. Motion Sickness Analysis (SSQ Results)
The main experiment was conducted over a period of 10 weeks with 40 participants (20 males, 18 females, 2 dropouts; average age = 25.37 years).
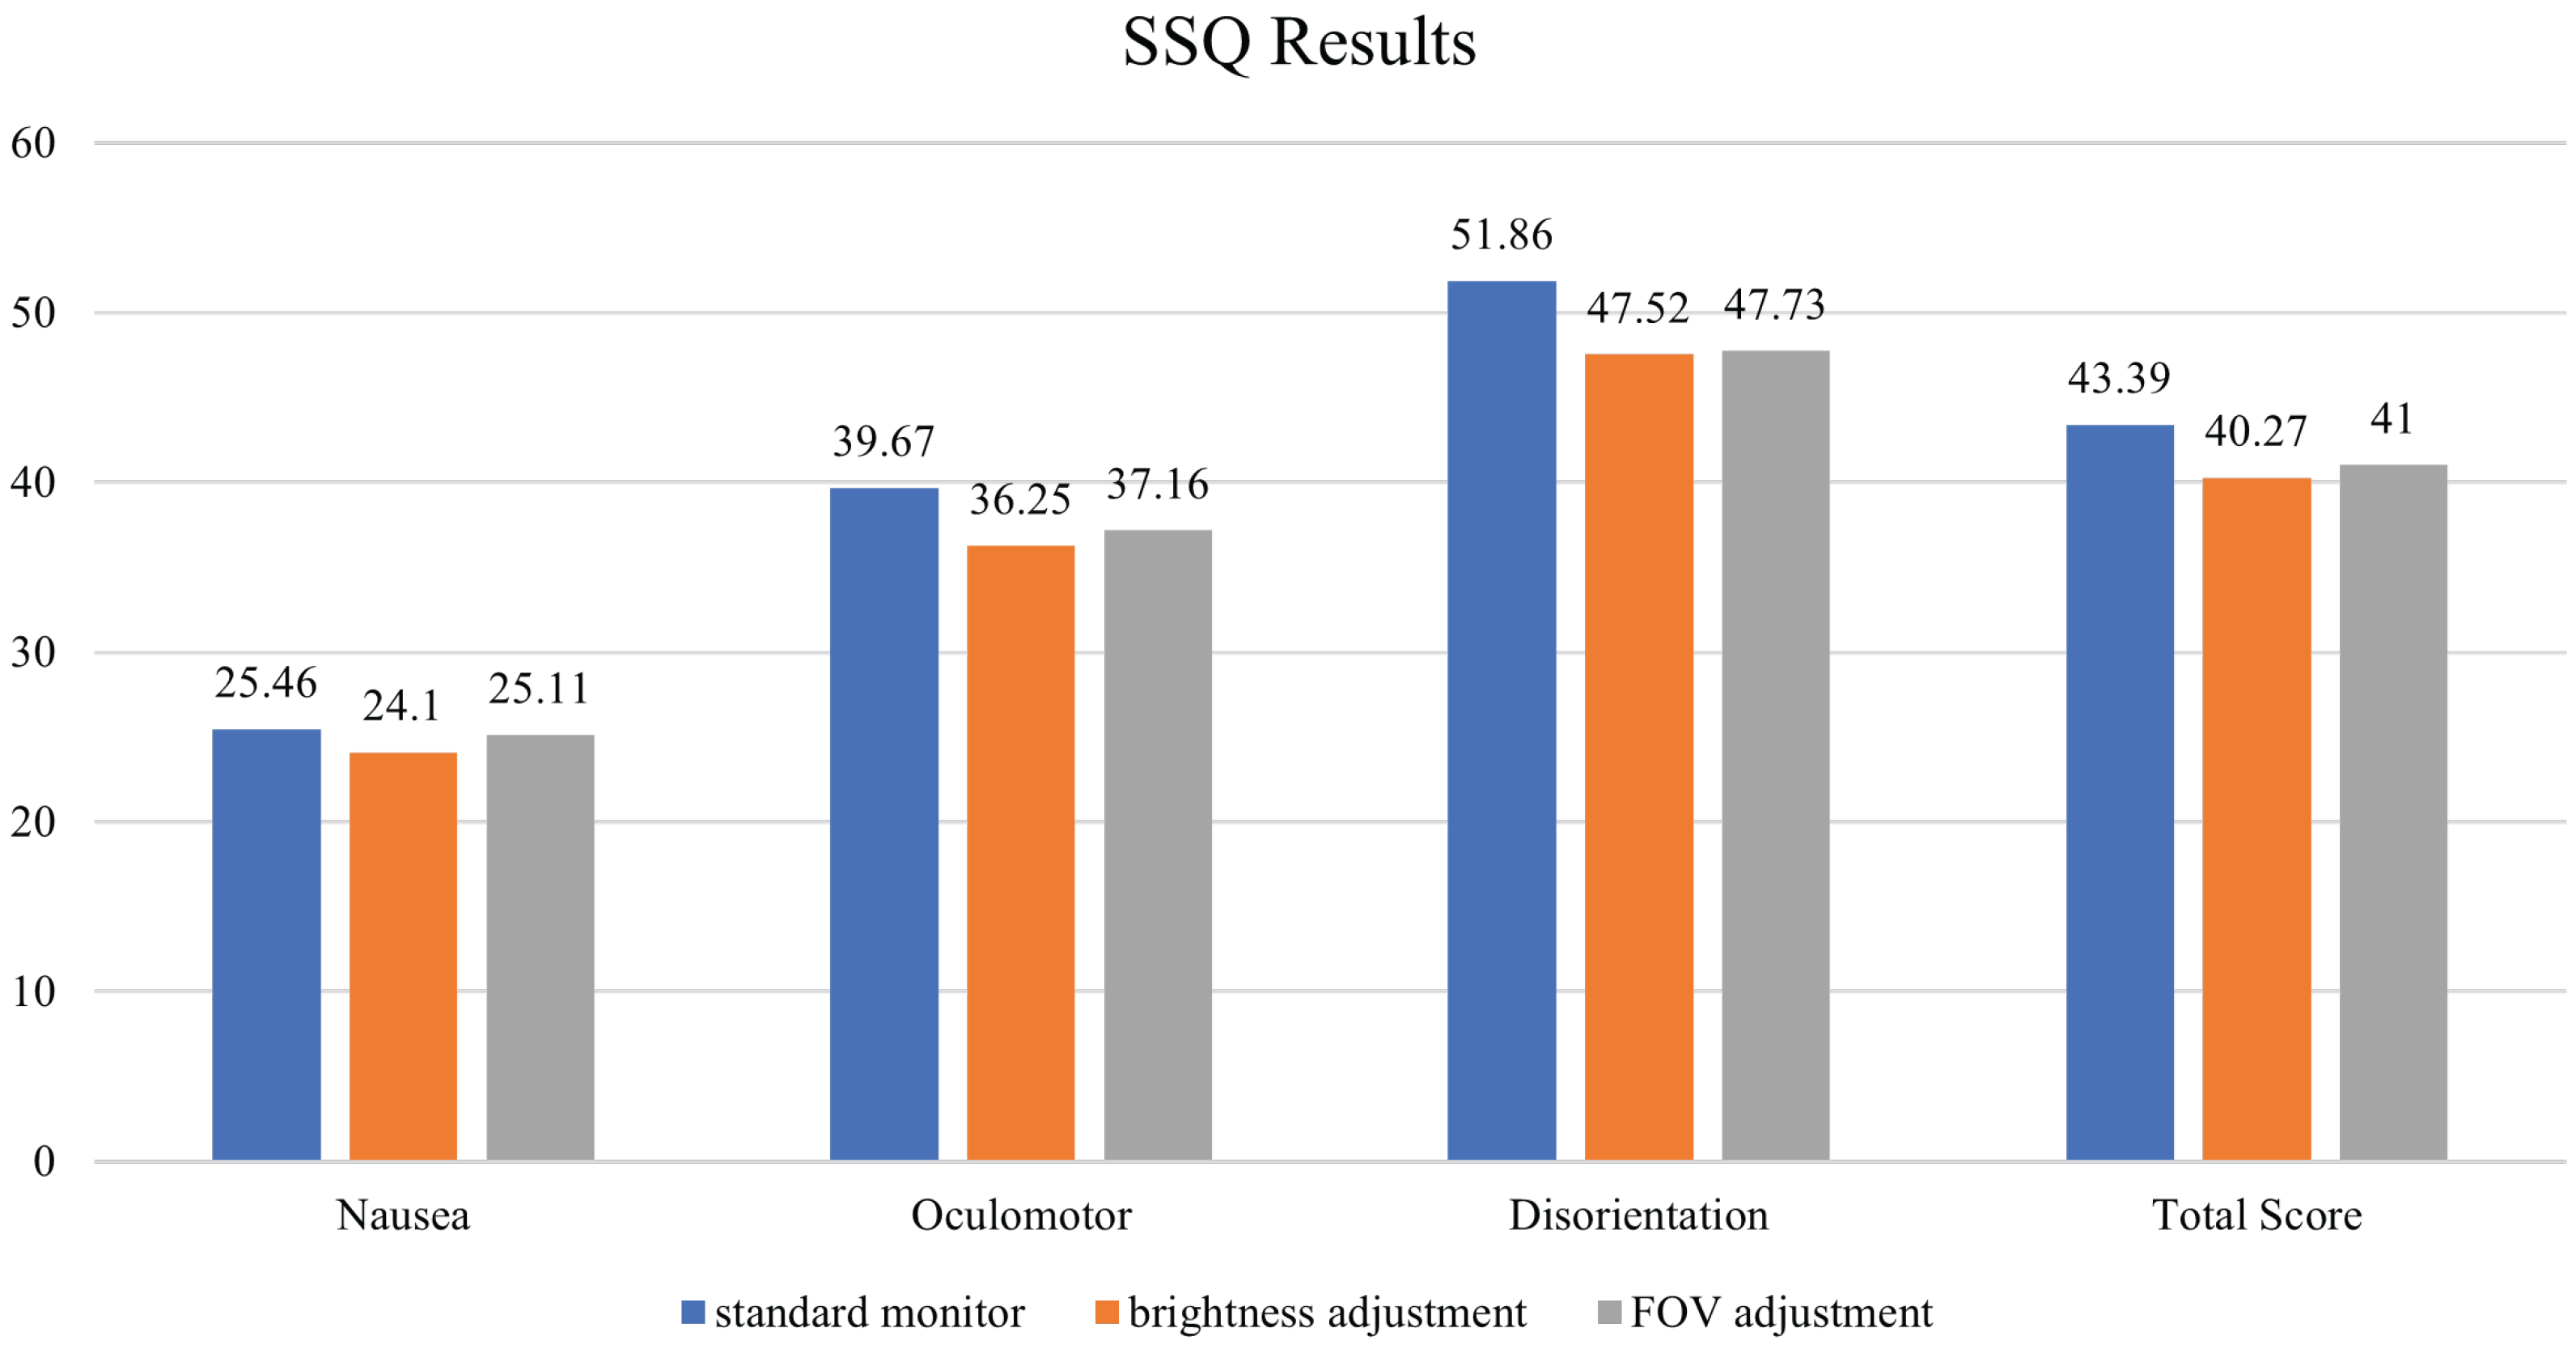
When analyzing the SSQ results over three days, it was observed that monitors with brightness and FOV adjustments consistently produced lower levels of motion sickness across different categories compared to the standard monitor with no effects (
Figure 11 and
Table 1). Specifically, motion sickness levels in categories such as Nausea (related to general motion sickness), Oculomotor (related to eye movement impairment), and Disorientation (related to loss of spatial orientation) were all lower for monitors with brightness and FOV adjustments. An overall analysis of the SSQ results showed that monitors with these adjustments led to reduced motion sickness levels across these categories, with approximately a 10% reduction in Oculomotor and Disorientation-related symptoms and an overall reduction in motion sickness of 5–10%.
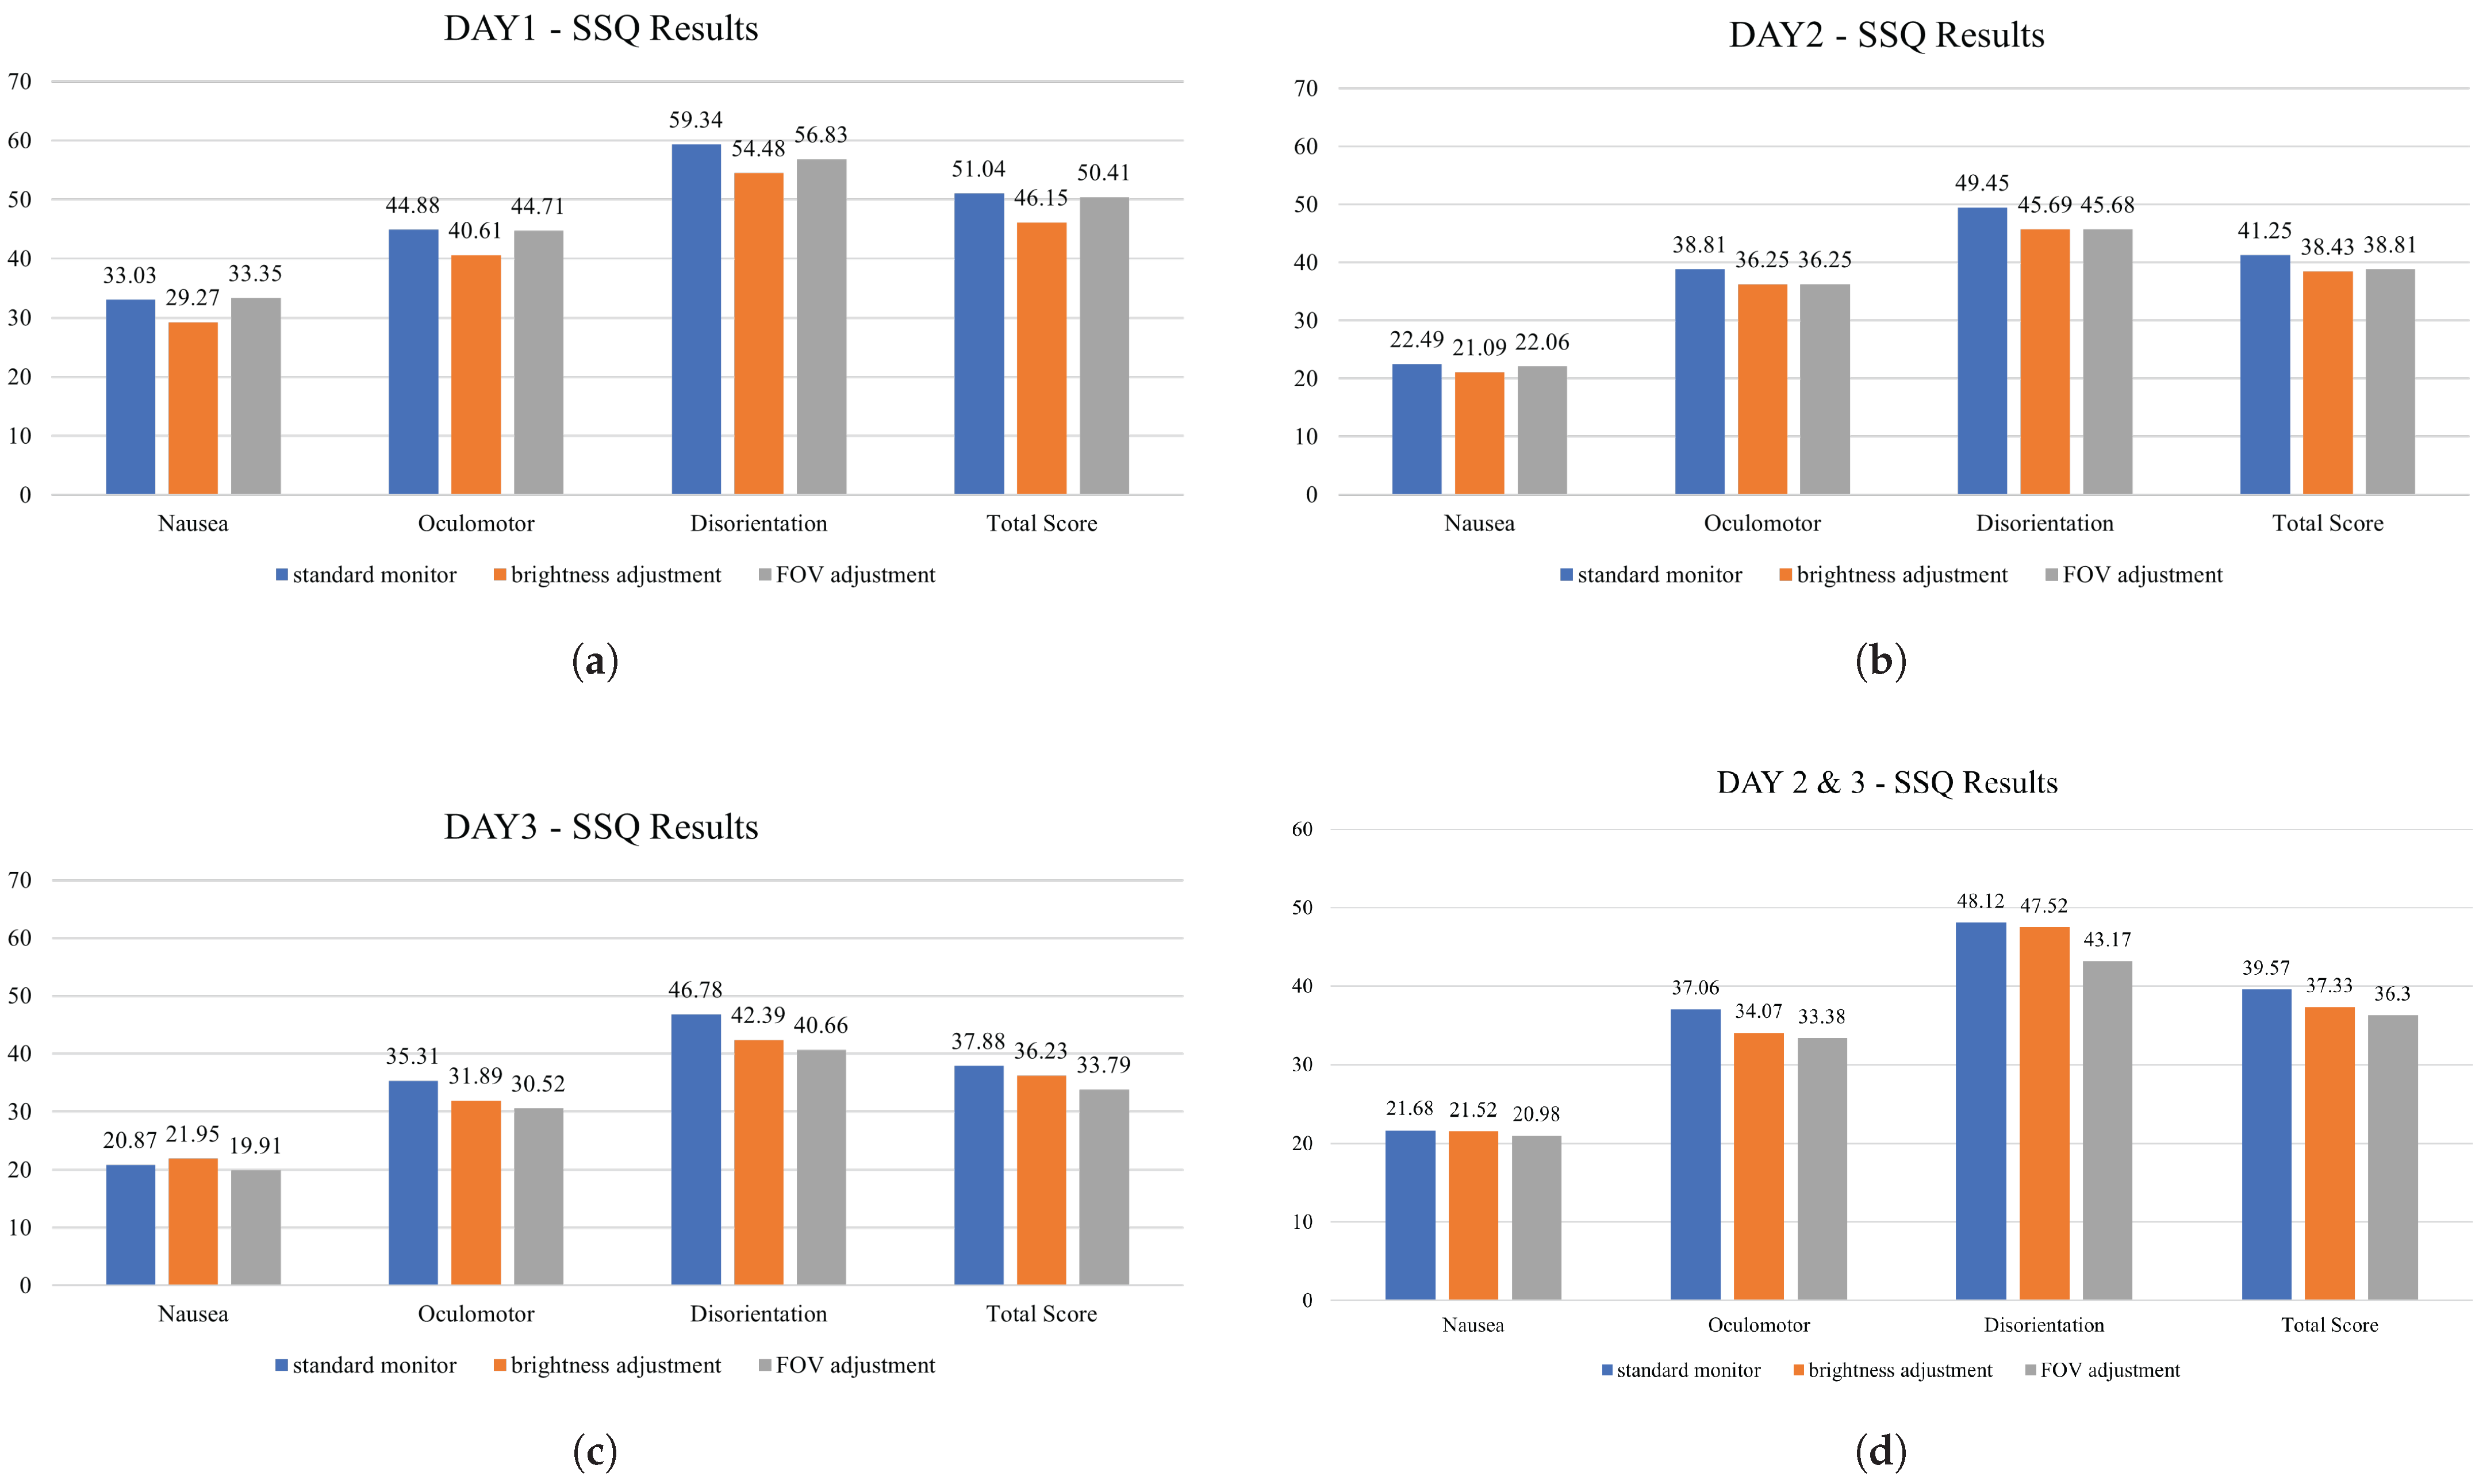
Participants showed relatively higher motion sickness scores on Day 1, but their responses stabilized on Days 2 and 3, indicating a possible adaptation effect [
24]. To minimize the impact of such time-dependent variability and ensure clearer condition-based comparisons, the analysis was focused on data from the latter two days (
Figure 12).
For the ANOVA analysis, data from Day 1 were excluded to account for adaptation effects and potential data contamination. Additionally, due to large individual differences in participants’ motion sickness responses, normalization was applied to the means of Day 2 and Day 3 data. The normalization formula used Equation (
3), where
x represents the motion sickness score for a given condition and
A is the average score of the three conditions for each participant. Here,
d denotes the difference between the maximum score among the three conditions and the average
A. Equation (
3) was applied to normalize each participant’s score relative to their own response range across the three test conditions. This normalization highlights the participant’s deviation from their personal mean response. This normalization approach allows for individual response tendencies to be accounted for, enabling fair comparisons across participants. This approach was chosen to provide a consistent scale of comparison across participants in the absence of broader data distributions, as each participant was exposed to only three experimental cases. This normalization method allows us to interpret how strongly each experimental condition influenced motion sickness relative to the participant’s baseline.
A value closer to 1 indicates the most sickness-inducing condition, while values below zero indicate conditions that caused less discomfort than average. This enables a meaningful comparison even when each participant experiences only a small number of discrete test cases.
After conducting ANOVA on the normalized data, the results showed that the p-values for Oculomotor and Disorientation were below 0.05, indicating statistically significant differences. Specifically, FOV adjustment led to a significant reduction in motion sickness for Oculomotor compared to the standard monitor. Additionally, the “Total” metric, which combines Nausea, Oculomotor, and Disorientation, exhibited a significant difference with a confidence level of 96%. While Nausea levels showed a decrease with the adjusted monitor compared to the standard, statistical significance was not confirmed due to high individual variability. Nevertheless, motion sickness decreased by 20% compared to baseline, with reductions of over 50% observed in the Oculomotor and Disorientation categories.
To improve result accuracy, data from four participants with variability exceeding 20 (out of 38 participants) were excluded, leading to a reanalysis with 34 normalized datasets. Following this adjustment,
p-values decreased further, enhancing the statistical significance of the findings (
Table 2). Further statistical details are available in the supplementary ANOVA output (
Figure A1).
For Nausea, although some difference was observed, it was not statistically significant. In contrast, the reduction in Oculomotor symptoms became more pronounced. These results suggest that when data from participants with high variability is excluded, the reduction in motion sickness is statistically significant with over 99% confidence, highlighting the effectiveness of brightness and FOV adjustments.
5.2.2. Immersion Analysis (PQ Results)
In the case of PQ results, immersion levels were similar between the standard monitor with no effects and the monitor with applied effects, indicating that the brightness and FOV adjustments did not significantly impact the overall immersion experience.
5.3. Secondary Experiment Results
The second experiment, conducted in a modified environment with larger display sizes (
Figure 13) and taking both angular velocity and acceleration into account, involved five participants (two males, three females; average age = 27.4 years).
Although statistical testing was limited due to the small sample size (n = 5), SSQ score patterns were reviewed across the three days to observe consistent trends in motion sickness under modified display conditions. Day 1 data were excluded due to potential contamination during the initial adaptation process, similar to the approach used in the main experiment. After excluding Day 1, the analysis of the remaining data revealed that monitors with FOV adjustments consistently resulted in lower levels of motion sickness across categories such as Nausea, Oculomotor-related motion sickness, and Disorientation-related motion sickness (
Figure 14).
On the other hand, when adjusting the monitor’s brightness, an increase in motion sickness was observed. This increase may be attributed to the larger screen size compared to the first main experiment, as participants likely perceived a higher intensity of light. It is believed that the larger display heightened participants’ sensitivity to visual effects, potentially making them more susceptible to motion sickness than in the initial primary experiment.
Overall, the SSQ results showed that monitors adjusted for both brightness and FOV had lower average motion sickness levels than monitors with no effects. The FOV-adjusted monitor, in particular, showed a more substantial reduction in motion sickness. Additionally, monitors with applied effects demonstrated higher levels of immersion than those with no effects, with FOV-adjusted monitors displaying slightly higher immersion than monitors with increased brightness. However, it should be noted that while these differences in immersion were noticeable, they may not be statistically significant.
5.4. Implications of Immersion and Visual Adjustments
We initially anticipated a significant increase in immersion for monitors with applied effects compared to those without. However, the analysis of the PQ results from both experiments revealed only a slight numerical increase in immersion for monitors with applied effects, with no substantial difference overall.
From a different perspective, monitors without effects and those with brightness and FOV adjustments exhibited similar levels of immersion. This suggests that adjusting transparency during brightness and FOV adjustments may have minimized any potential interference with immersion. Interviews with participants further confirmed that they were largely unaware of the visual effects, indicating a positive outcome. In summary, although reducing FOV can potentially diminish the viewing experience by limiting visual information, the adjustment of FOV transparency helped to alleviate this drawback, partially preserving the immersive experience.
6. Discussion
In this study, we investigated methods to alleviate motion sickness within an in-vehicle media viewing environment by conducting a series of experiments using a virtual reality (VR) simulation. We specifically focused on a display positioned in the rear seat of a virtual vehicle, where dynamic adjustments to brightness and field of view (FOV) were made based on the vehicle’s varying accelerations and angular velocities to closely mimic real-world conditions.
We anticipated that the causes of motion sickness in VR would similarly apply to motion sickness induced during media viewing inside a vehicle. We developed a VR environment that accurately represented a vehicle interior to test these adjustments before applying them to an actual in-vehicle display. This approach aimed to achieve realistic and significant effects comparable to those in real-world scenarios.
Across three rounds of experiments, we found that brightness adjustments alone did not consistently reduce motion sickness, especially when both acceleration and rotation were considered. However, when FOV adjustments were applied in response to changes in both rotation and acceleration, participants experienced a reduction in motion sickness. Statistical analysis using ANOVA on the normalized data indicated that FOV adjustments could reduce motion sickness by up to 40%, yielding significant results.
Unlike previous studies that primarily targeted the entire field of view for motion sickness mitigation within VR environments, our research focused on implementing these adjustments solely on the in-vehicle display. This approach allowed us to adapt motion sickness reduction techniques specifically to vehicle dynamics, especially changes in angular acceleration, rather than user-driven movement, making it a unique contribution to the field.
For future studies involving motion simulators, we recommend establishing more detailed movement cases based on specific angle and rotation patterns, accounting for the modified chair’s strength to enhance realism. This would help simulate actual vehicle movements more accurately, thereby improving the interaction between motion simulators and VR environments. Additionally, future research should examine the impact of various media content types on visually induced motion sickness symptoms. It is also worth exploring whether alternative motion sickness reduction techniques in VR—beyond FOV and brightness adjustments—could offer comparable or complementary benefits in an in-vehicle media environment.
In summary, our findings contribute to the development of effective motion sickness reduction strategies for in-vehicle media systems, potentially alleviating motion sickness associated with in-vehicle media consumption.
Author Contributions
Conceptualization, H.K. (Hyungseok Kim); methodology, Y.J. and H.K. (Hyungseok Kim); software, Y.J.; validation, H.K. (Hyungseok Kim); formal analysis, J.S.; investigation, Y.J. and J.S.; resources, H.K. (Hyungseok Kim); data curation, Y.J. and J.S.; writing—original draft preparation, Y.J.; writing—review and editing, Y.J. and H.K. (Hyungseok Kim); visualization, Y.J. and J.S.; supervision, H.K. (Hyungseok Kim); project administration, T.K., H.K. (Hoolim Kim), S.B. and H.K. (Hyungseok Kim); funding acquisition, H.K. (Hyungseok Kim). All authors have read and agreed to the published version of the manuscript.
Funding
This work was supported by the Institute of Information & communications Technology Planning & Evaluation (IITP) under the metaverse support program to nurture the best talents (IITP-2023-RS-2023-00256615) grant funded by the Korea government (MSIT).
Institutional Review Board Statement
The study was conducted in accordance with the Declaration of Helsinki and approved by the Institutional Review Board of Konkuk University (IRB No. 7001355-202309-HR-698).
Informed Consent Statement
Informed consent was obtained from all subjects involved in the study. Written informed consent has been obtained from the patient(s) to publish this paper.
Data Availability Statement
The data presented in this study are available on request from the corresponding author.
Acknowledgments
This research was conducted with the support of LG Electronics.
Conflicts of Interest
Authors Taekyoung Kim, Hoolim Kim, and Seunghwan Bang were employed by the company LG Electronics. The remaining authors declare that the research was conducted in the absence of any commercial or financial relationships that could be construed as a potential conflict of interest.
Abbreviations
The following abbreviations are used in this manuscript:
| VR | Virtual Reality |
| FOV | Field of View |
| HMD | Head-Mounted Display |
| SSQ | Simulator Sickness Questionnaire |
| PQ | Presence Questionnaire |
| MSSQ | Motion Sickness Susceptibility Questionnaire |
| MSSQ-Short | Motion Sickness Susceptibility Questionnaire-Short |
| SSQ-Table | Simulator Sickness Questionnaire Table |
| PQ-Table | Presence Questionnaire Table |
| IVB | Independent Visual Background |
| ANOVA | Analysis of Variance |
| DoF | Degrees of Freedom |
Appendix A
The supplementary figure presents the original ANOVA output table used for the main analysis of normalized SSQ scores. This analysis was conducted using data from Day 2 and Day 3, excluding four participants with excessive response variability (resulting in n = 34).
The ANOVA was performed separately for each SSQ subcategory—Nausea, Oculomotor, Disorientation—and for the combined Total score. Each condition (Standard monitor, Brightness adjustment, FOV adjustment) includes group summary statistics such as count, sum, average, and variance.
For each category, the table displays:
SS (Sum of Squares);
df (degrees of freedom);
MS (Mean Square);
F-values;
p-values;
F critical values.
These statistics were used to assess the significance of differences in motion sickness levels across the three display conditions.
Figure A1.
Supplementary ANOVA output tables for each SSQ subscale (Day 2 and 3, n = 34). Each subfigure displays group statistics and significance values across three experimental conditions. (a) ANOVA summary for Nausea. (b) ANOVA summary for Disorientation. (c) ANOVA summary for Oculomotor. (d) ANOVA summary for Total SSQ.
References
- Lim, S.Y.; Jun, B.; Lim, H.J.; Ahn, J.H.; Yi, Y.W.; Kim, H. 79-3: Display Resolution and Human Factors for Presence and Motion Sickness in HMD Experiences. SID Symp. Dig. Tech. Pap. 2019, 50, 1142–1145. [Google Scholar] [CrossRef]
- Jun, B. Analysis of Factor for Motion Sickness in Virtual Reality. Master’s Thesis, Konkuk University Graduate School, Seoul, Republic of Korea, 2020. [Google Scholar]
- Kuiper, O.X.; Bos, J.E.; Diels, C. Vection Does Not Necessitate Visually Induced Motion Sickness. Displays 2019, 58, 82–87. [Google Scholar] [CrossRef]
- Chattha, U.A.; Janjua, U.I.; Anwar, F.; Madni, T.M.; Cheema, M.F.; Janjua, S.I. Motion Sickness in Virtual Reality: An Empirical Evaluation. IEEE Access 2020, 8, 130486–130499. [Google Scholar] [CrossRef]
- Vasylevska, K.; Yoo, H.; Akhavan, T.; Kaufmann, H. Towards Eye-Friendly VR: How Bright Should It Be? In Proceedings of the IEEE Conference on Virtual Reality and 3D User Interfaces (VR), Osaka, Japan, 23–27 March 2019. [Google Scholar] [CrossRef]
- Webb, N.A.; Griffin, M.J. Eye Movement, Vection, and Motion Sickness with Foveal and Peripheral Vision. Aviat. Space Environ. Med. 2003, 74, 622–659. [Google Scholar] [PubMed]
- Fernandes, A.S.; Feiner, S.K. Combating VR Sickness through Subtle Dynamic Field-of-View Modification. In Proceedings of the IEEE Symposium on 3D User Interface, Greenville, SC, USA, 19–20 March 2016. [Google Scholar]
- Lim, S.Y. Analysis of Human Factors for Presence and Motion Sickness in Virtual Environments. Master’s Thesis, Konkuk University Graduate School, Seoul, Republic of Korea, 2019. [Google Scholar]
- LaViola, J.J. A Discussion of Cyber-Sickness in Virtual Environments. SIGCHI Bull. 2000, 32, 1. [Google Scholar] [CrossRef]
- Sharples, S.; Cobb, S.; Moody, A.; Wilson, J.R. Virtual Reality Induced Symptoms and Effects (VRISE): Comparison of Head Mounted Display (HMD), Desktop and Projection Display Systems. Displays 2008, 29, 58–69. [Google Scholar] [CrossRef]
- Lee, J.; Lim, S.; Ahn, J.; Yi, Y.; Kim, H.S. Analysis of Video Image Based Element for Motion Sickness. Electron. Imaging 2018, 30, 470-1–470-6. [Google Scholar] [CrossRef]
- Adhanom, I.B.; Griffin, N.N.; MacNeilage, P.; Folmer, E. The Effect of a Foveated Field-of-View Restrictor on VR Sickness. In Proceedings of the IEEE Conference on Virtual Reality and 3D User Interfaces (VR), Atlanta, GA, USA, 22–26 March 2020. [Google Scholar] [CrossRef]
- Nooij, S.A.E.; Pretto, P.; Oberfeld, D.; Hecht, H.; Bülthoff, H.H. Vection is the Main Contributor to Motion Sickness Induced by Visual Yaw Rotation: Implications for Conflict and Eye Movement Theories. PLoS ONE 2017, 12, e0175305. [Google Scholar] [CrossRef] [PubMed]
- Shahal, A.; Hemmerich, W.; Hecht, H. Brightness and Contrast Do Not Affect Visually Induced Motion Sickness in a Passively-Flown Fixed-Base Flight Simulator. Displays 2016, 44, 5–14. [Google Scholar] [CrossRef]
- Jin, Y.S.; Son, J.; Kim, T.; Kim, H.; Bang, S.; Kim, H. A Study on the Motion Sickness Reduction Technology in Vehicle Media Environment. In Proceedings of the 2024 IEEE International Conference on Big Data and Smart Computing (BigComp), Bangkok, Thailand, 18–21 February 2024; pp. 16–23. [Google Scholar] [CrossRef]
- Iskander, J.; Attia, M.; Saleh, K.; Nahavandi, D.; Abobakr, A.; Mohamed, S.; Asadi, H.; Khosravi, A.; Lim, C.P.; Hossny, M. From Car Sickness to Autonomous Car Sickness: A Review. Transp. Res. Part F Traffic Psychol. Behav. 2019, 62, 716–726. [Google Scholar] [CrossRef]
- Cho, H.J.; Kim, G.J. RideVR: Reducing Sickness for in-Car Virtual Reality by Mixed-in Presentation of Motion Flow Information. IEEE Access 2022, 10, 34003–34011. [Google Scholar] [CrossRef]
- Shi, R.; Liang, H.N.; Wu, Y.; Yu, D.; Xu, W. Virtual Reality Sickness Mitigation Methods: A Comparative Study in a Racing Game. Proc. ACM Comput. Graph. Interact. Tech. 2021, 4, 1–16. [Google Scholar] [CrossRef]
- Crundall, D.; Underwood, G.; Chapman, P. Driving Experience and the Functional Field of View. Perception 1999, 28, 1075–1087. [Google Scholar] [CrossRef] [PubMed]
- Golding, J.F. Predicting Individual Differences in Motion Sickness Susceptibility by Questionnaire. Pers. Individ. Dif. 2006, 41, 237–248. [Google Scholar] [CrossRef]
- Kennedy, R.S.; Lane, K.E.; Berbaum, K.S.; Lilienthal, M.G. Simulator Sickness Questionnaire (SSQ): A New Method for Quantifying Simulator Sickness. Int. J. Aviat. Psychol. 1993, 3, 203–220. [Google Scholar] [CrossRef]
- Witmer, B.G.; Singer, M.J. Measuring Presence in Virtual Environments: A Presence Questionnaire. Presence 1998, 7, 225–240. [Google Scholar] [CrossRef]
- Kennedy, R.S.; Lanham, D.S.; Massey, C.J.; Drexler, J.M.; Lilienthal, M.G. Gender Differences in Simulator Sickness Incidence: Implications for Military Virtual Reality Systems. Safe J. 1995, 25, 69–76. [Google Scholar]
- Kennedy, R.S.; Stanney, K.M.; Dunlap, W.P. Duration and Exposure to Virtual Environments: Sickness Curves During and Across Sessions. Presence Teleoperators Virtual Environ. 2000, 9, 463–472. [Google Scholar] [CrossRef]
| Disclaimer/Publisher’s Note: The statements, opinions and data contained in all publications are solely those of the individual author(s) and contributor(s) and not of MDPI and/or the editor(s). MDPI and/or the editor(s) disclaim responsibility for any injury to people or property resulting from any ideas, methods, instructions or products referred to in the content. |
© 2025 by the authors. Licensee MDPI, Basel, Switzerland. This article is an open access article distributed under the terms and conditions of the Creative Commons Attribution (CC BY) license (https://creativecommons.org/licenses/by/4.0/).


 ,
, 


