


Evaluating Moving Target Defense Methods Using Time to Compromise and Security Risk Metrics in IoT Networks


Abstract
1. Introduction
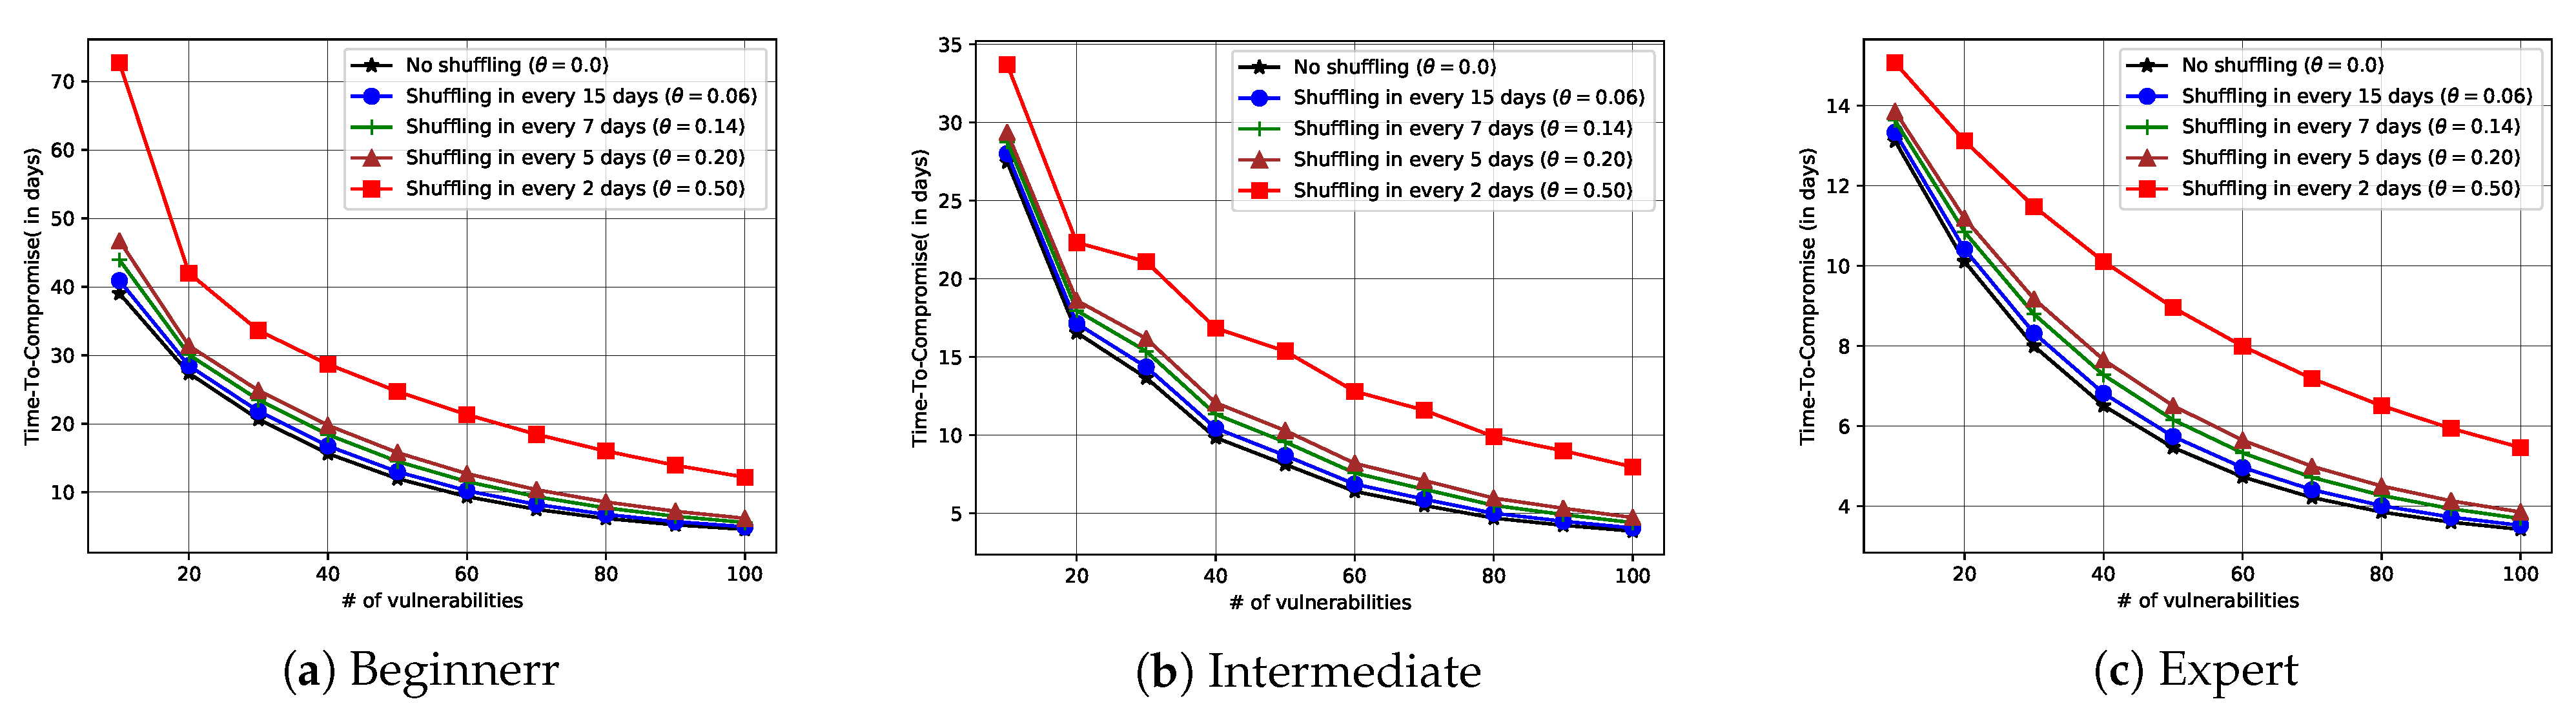
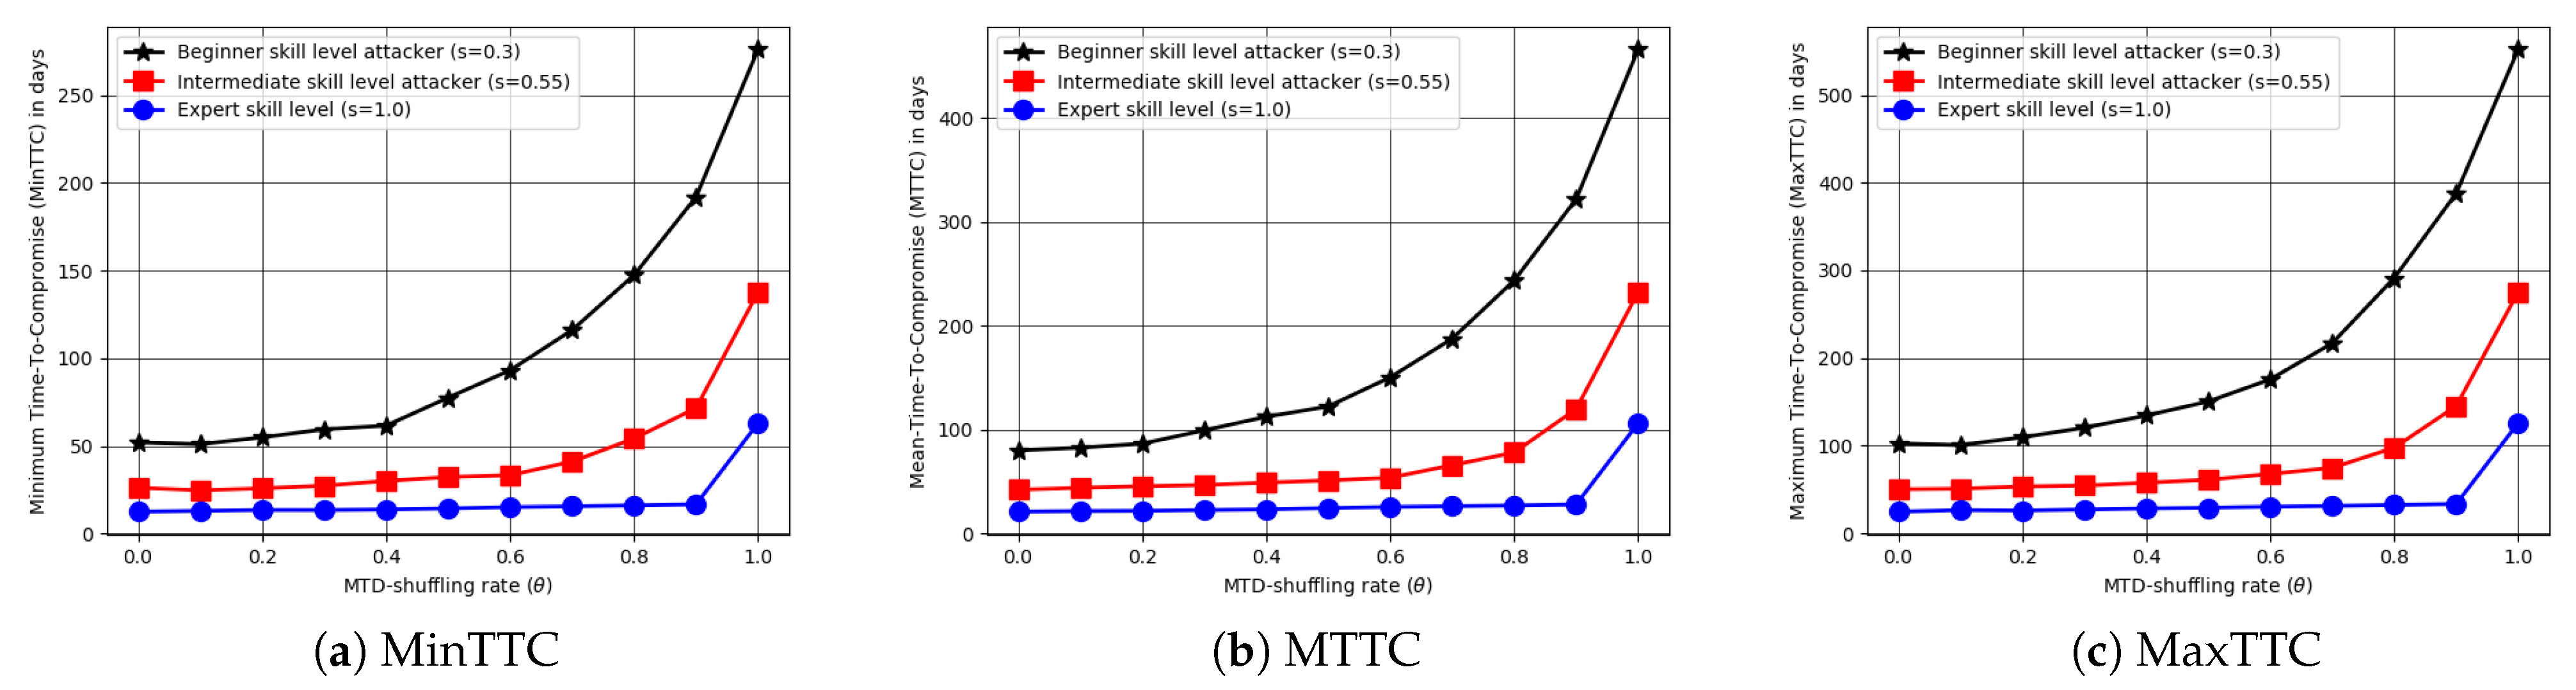
- We propose a set of attack-path-based TTC metrics to estimate the mean time to compromise a smart device in an IoT network deploying the MTD defense mechanism. TTC-related metrics include mean TTC, minimum TTC, and maximum TTC and consider different skill levels on the part of attackers.
- We devise a set of risk-based security metrics taking TTC and attack cost into account. These risk-based metrics compute the risk reduction with MTD mechanisms in terms of shuffling rate and strategies.
- We conduct extensive simulation experiments to measure the effectiveness of the MTD methods deployed in IoT networks and identify key factors that significantly influence the performance of MTD methods.
2. Related Work
3. System Model
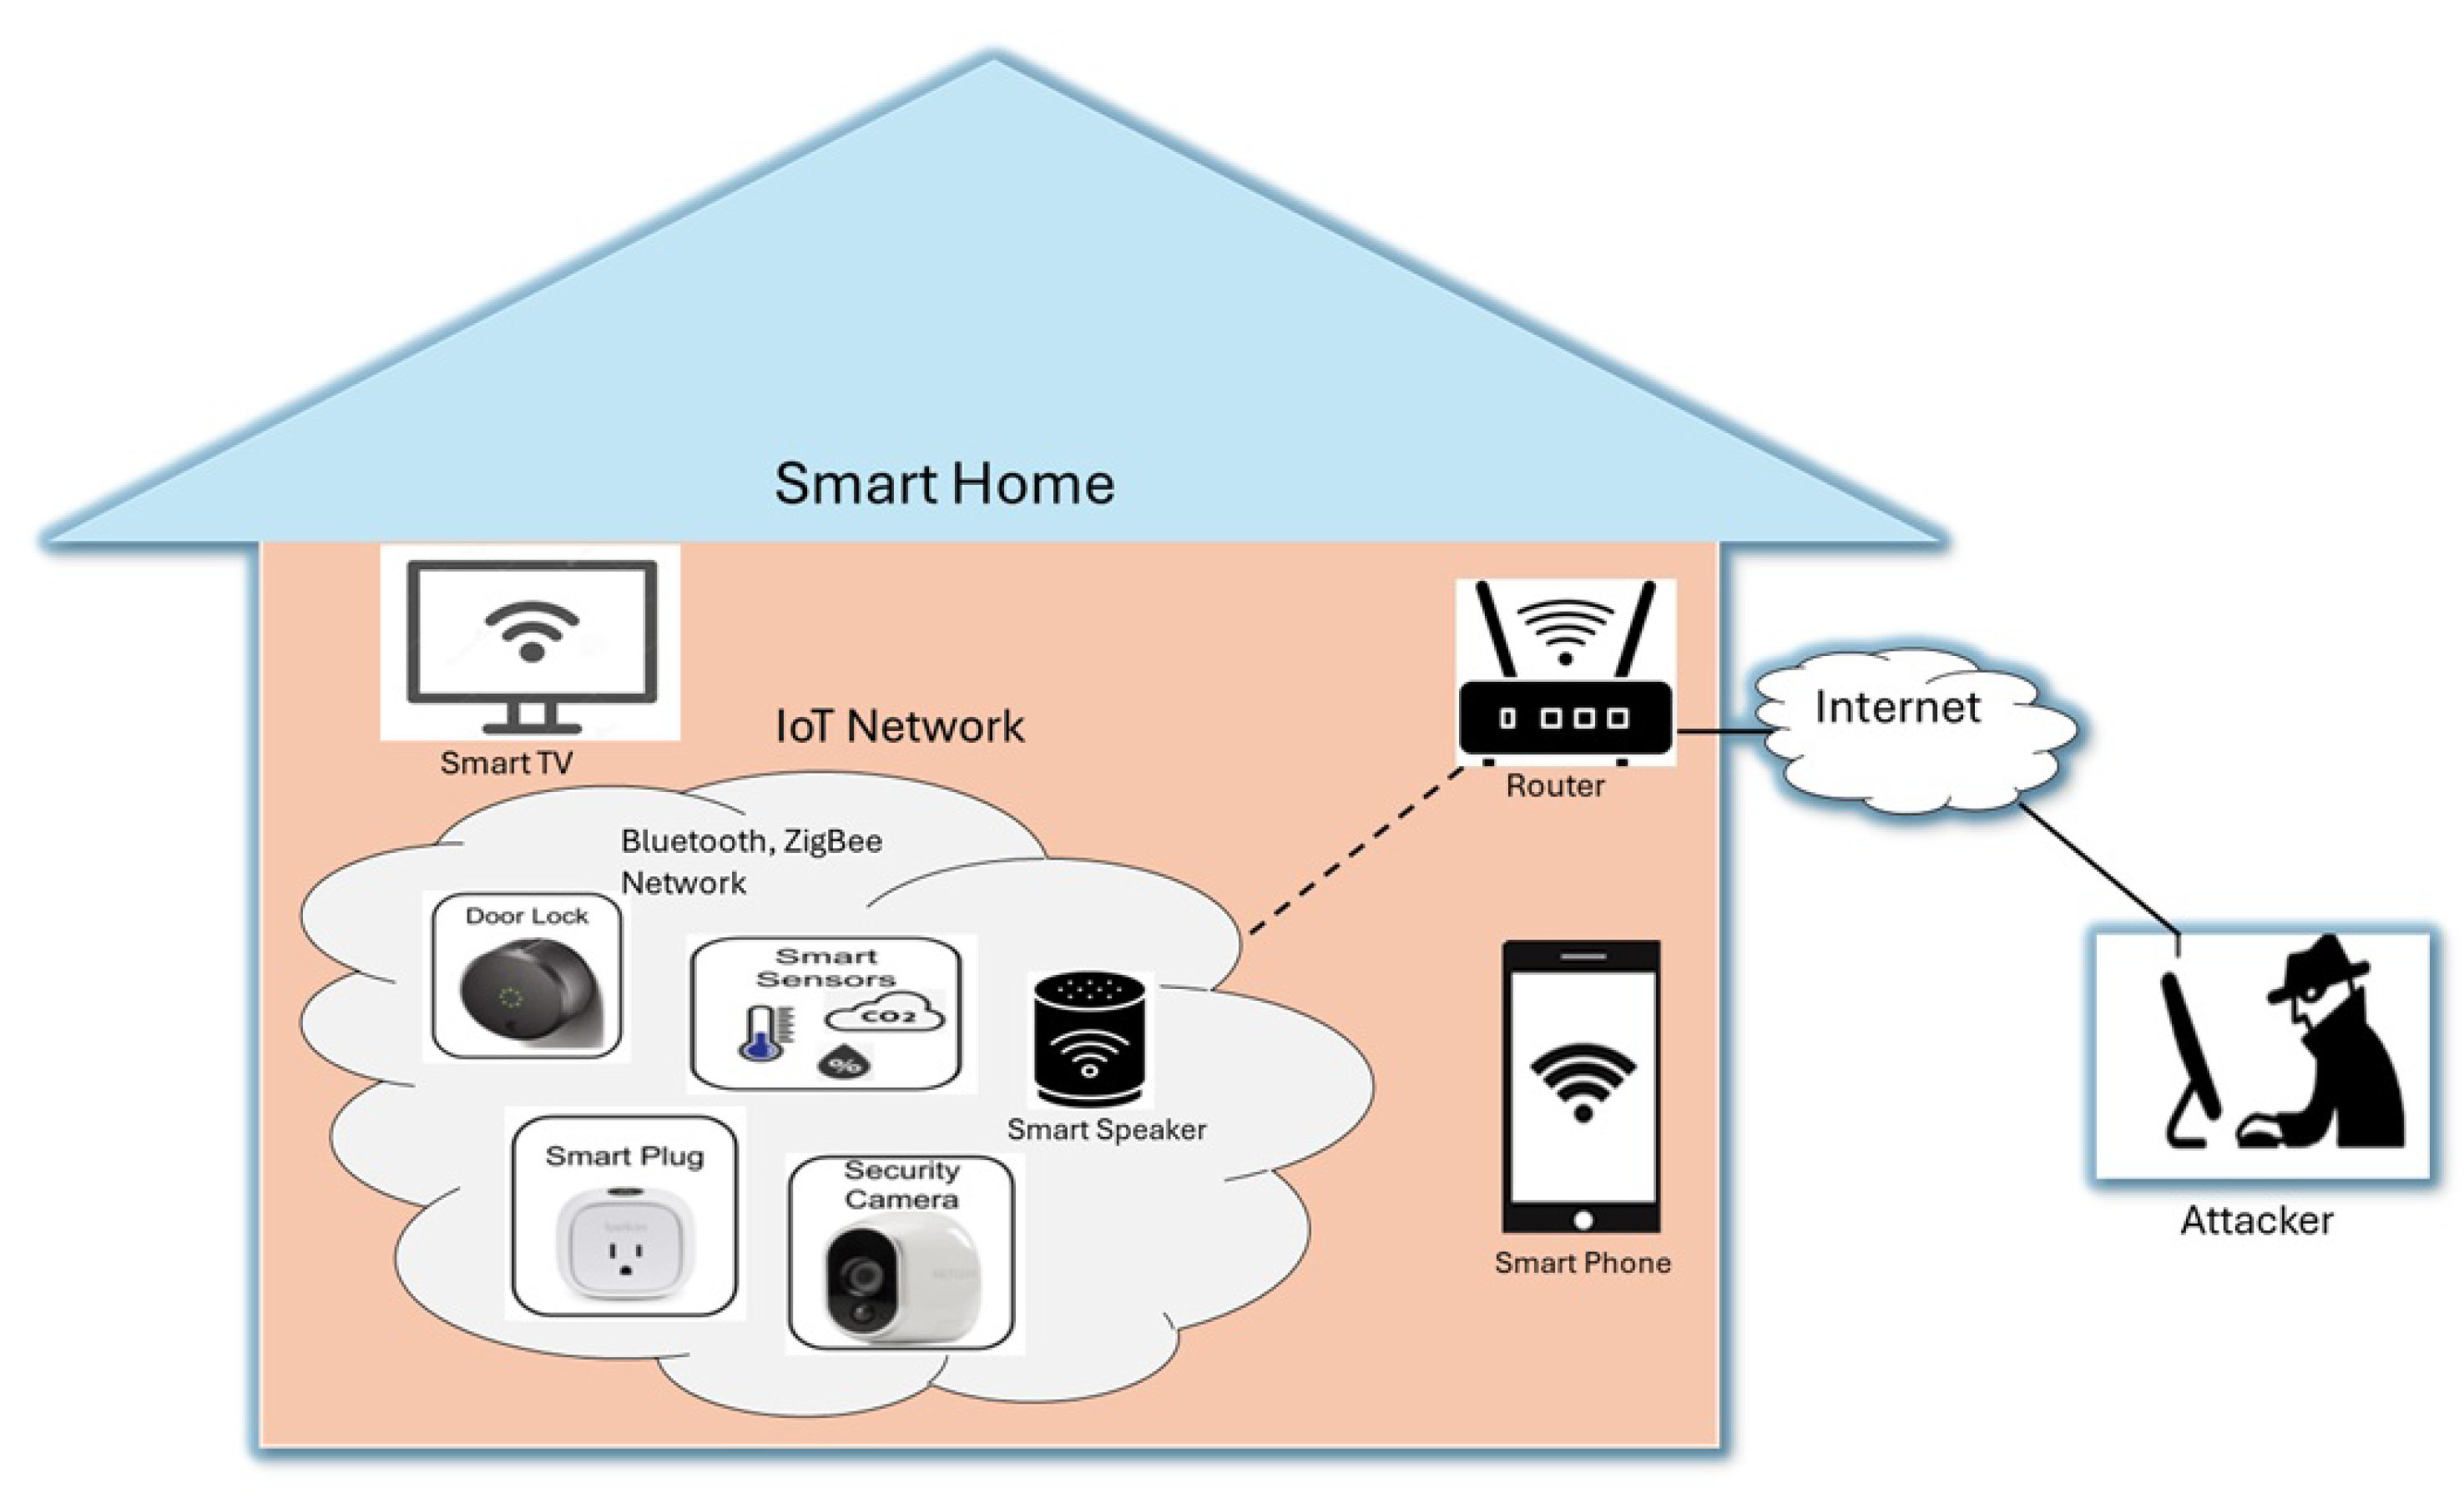
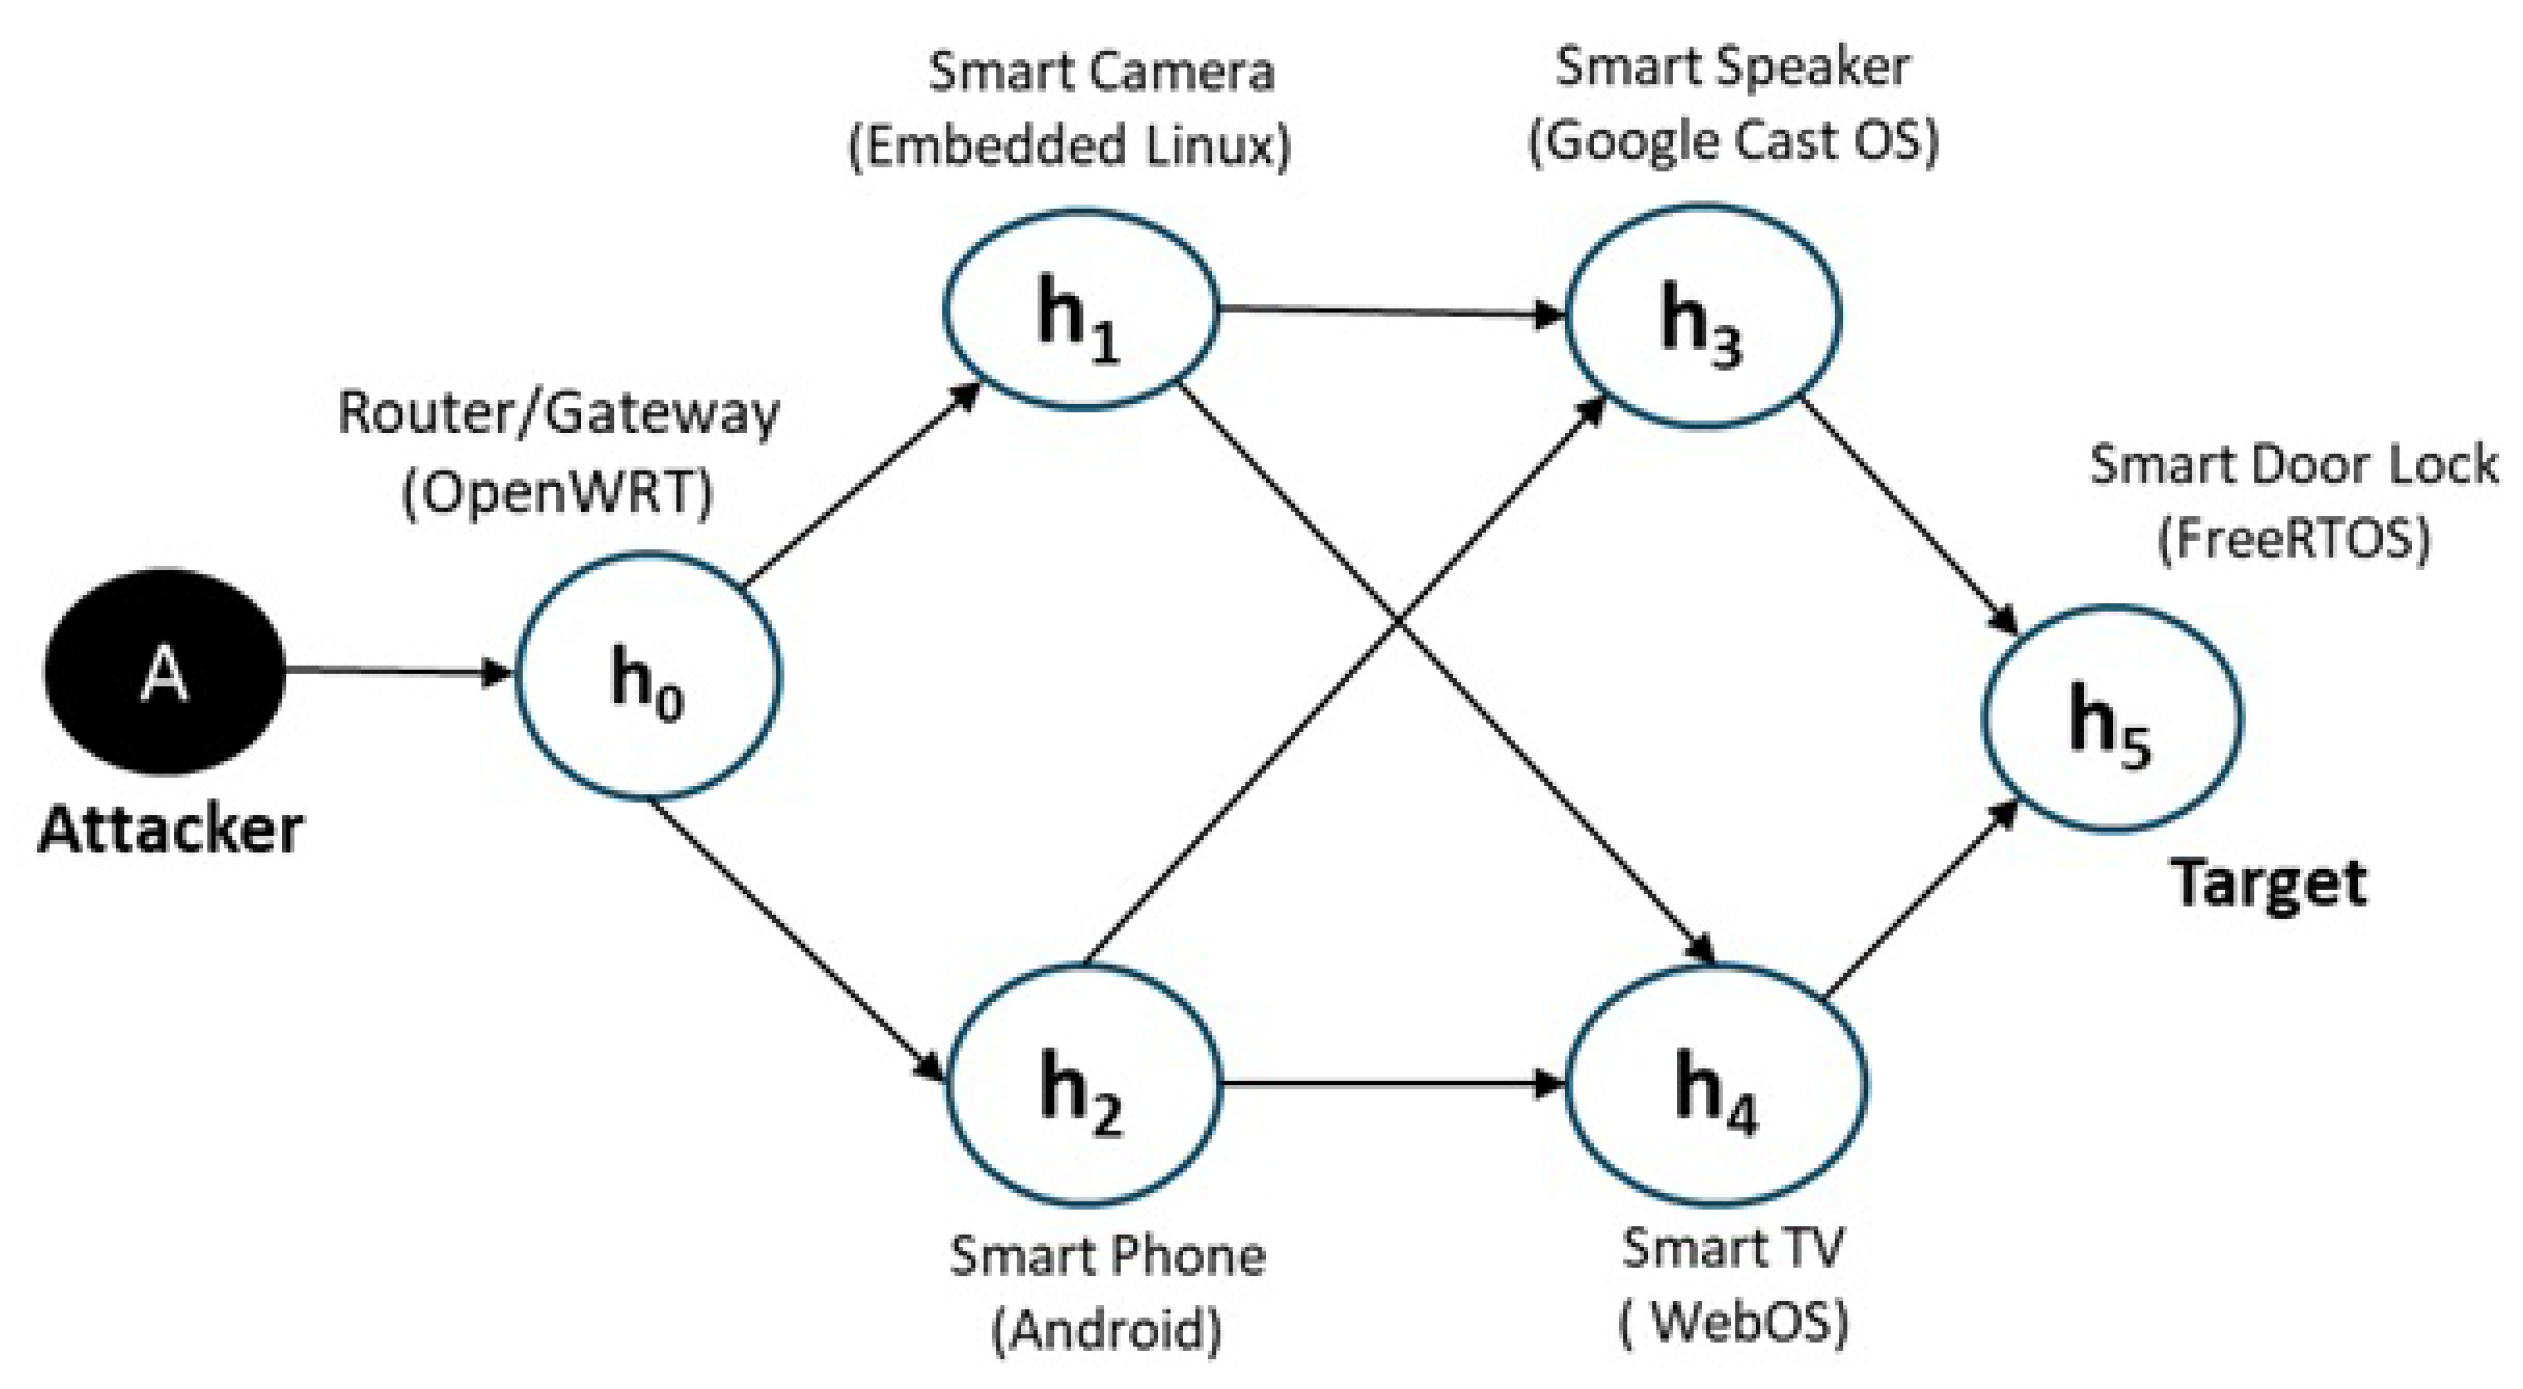
3.1. Network Model
3.2. Threat Model
- Beginner: These attackers use default scanning configurations and have limited knowledge of the target network. Their ability to interpret scan results is minimal, and they require significant effort to identify vulnerabilities and find usable exploits to attack the system.
- Intermediate: These attackers have a moderate understanding of IoT network structures and known vulnerabilities. They can customize scan parameters to focus on specific devices or services, and are generally able to identify vulnerabilities; however, they may struggle to find or develop suitable exploits that effectively compromise the targets.
- Expert: Expert attackers possess deep knowledge of IoT systems and employ stealthy or adaptive scanning techniques. They can efficiently discover vulnerabilities and are capable of locating or creating effective exploits, enabling them to compromise a wide range of heterogeneous devices with ease.
3.3. Defense Model
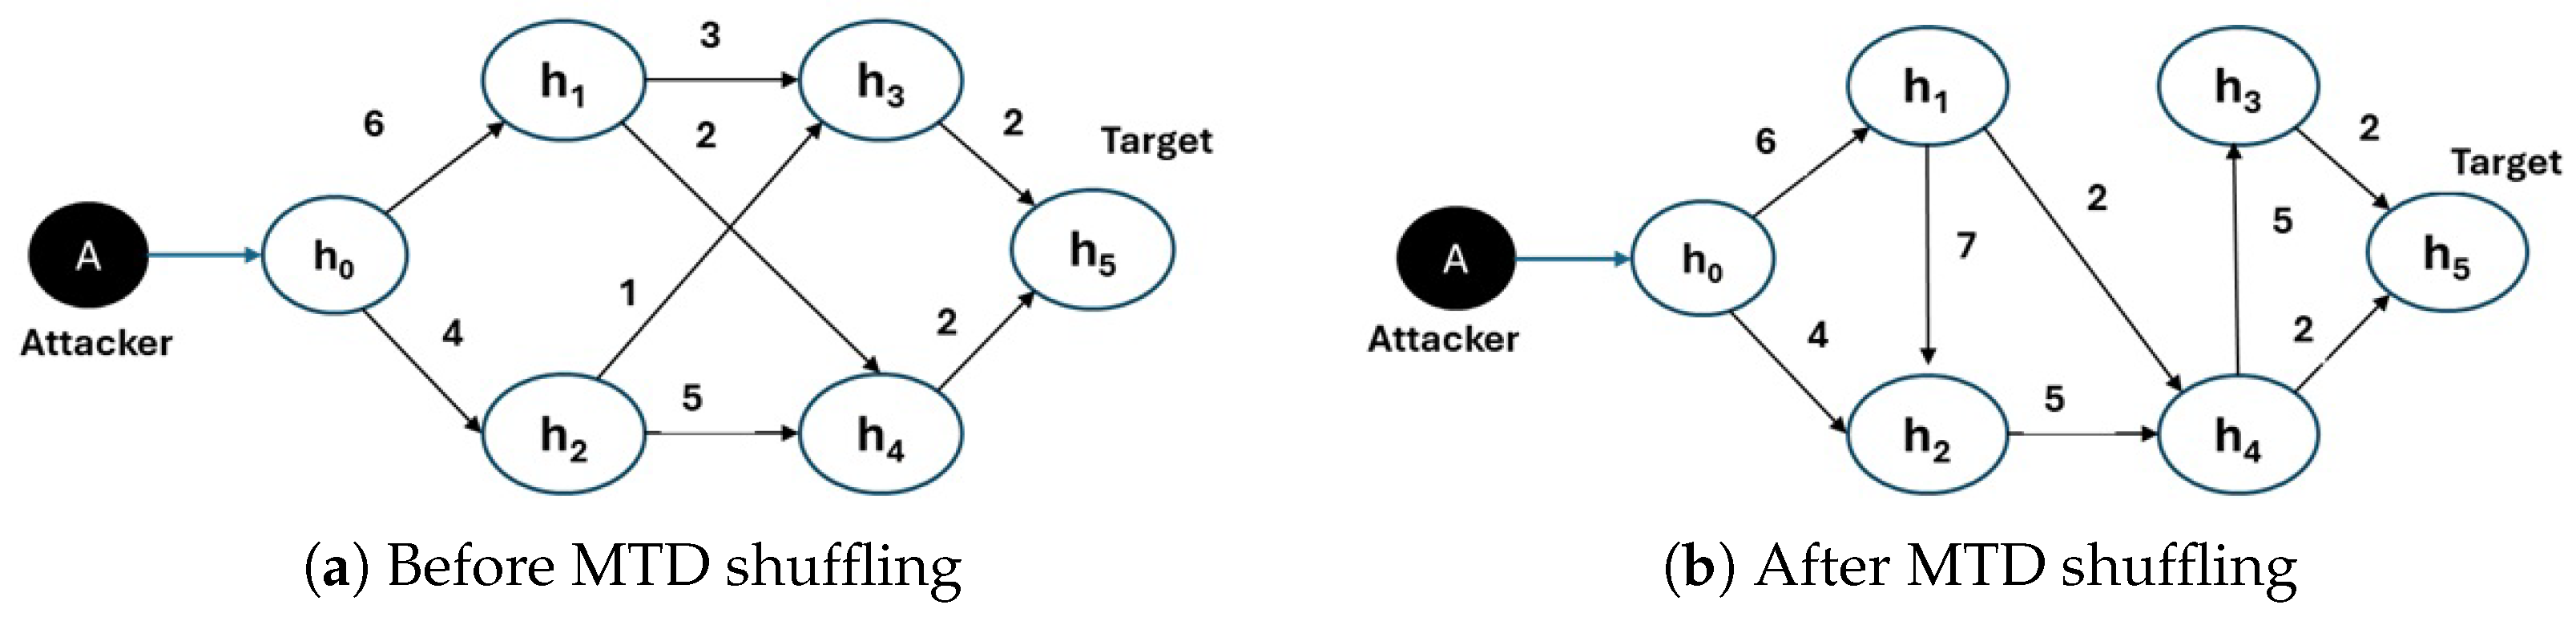
- Shuffling-based MTDs: Shuffling methods periodically modify network attributes such as IP addresses, ports, or configurations in a fixed interval of time. These MTD methods hinder an attacker’s ability to maintain an accurate view of the system, invalidating reconnaissance efforts and narrowing the window for successful exploitation.
- Diversity-based MTDs: Diversity-based MTD methods dynamically change device characteristics such as operating systems (OS rotation), firmware versions, or application configurations to ensure that the vulnerabilities of the IoT devices differ over time, thereby reducing the risk of uniform exploitation.
4. Proposed Approach
4.1. Time-to-Compromise Metrics
- Attack Process 1: In this scenario, the attacker knows one or more vulnerabilities and exploits ( i.e., known vulnerabilities and known exploits). The attacker has all of the required knowledge to attack the system.
- Attack Process 2: In this process, the attacker knows one or more vulnerabilities but does not have any exploits on hand ( i.e., known vulnerabilities and unknown exploits). Thus, the attacker has partial knowledge about the target IoT network system.
- Attack Process 3: In this scenario, the attacker does not know any vulnerabilities or exploits (i.e., unknown vulnerabilities and unknown exploits). This means that the attacker does not possess any knowledge about the target system. Thus, the attacker must scan the network, find vulnerabilities, and build an exploit before launching an attack.
- is the number of vulnerabilities that exist in a host or a component,
- is the number of exploits readily available for the vulnerabilities of host ,
- K is the number of total non-duplicate vulnerabilities in the vulnerability database,
- is the shuffling rate of the host with MTD interval time , ,
- s is the attacker’s skill level, , e.g., for beginner, for intermediate, and for expert.
- day,
- , wherewhere:
- : Expected number of tries
- : Number of vulnerabilities for which exploits are available or can be created by the attacker at their skill level
- : Number of vulnerabilities for which no exploits are available at the attacker’s skill level
- s: Attacker’s skill level.
4.2. Security Risks Metrics
- Security Risk Reduction Percentage (SRRP): The SRRP can is expressed as a percentage, and can be obtained as follows:
- Security Risk Reduction Percentage of a Network (SRRPN): The SRRPN is the network’s risk reduction compromising all hosts in the network using the MTD, and can be obtained as follows:
- Security Risk on Path (SRP): The SRP metric estimates the risk associated with a given attack path. It is the sum of the security risks of the hosts on a path . The SRP of an attack path for an attack duration time t starting at time is obtained as follows:where .
- Security Risk on Paths of a Network (SRPN): The SRPN is the maximum security risk across all the attack paths, which can be obtained as follows:
5. Numerical Computation and Analysis
6. Experimental Results and Analysis
6.1. Network Setting and Scenario Description
6.2. Results and Analysis
7. Conclusions
Funding
Data Availability Statement
Conflicts of Interest
References
- Al-Fuqaha, A.; Guizani, M.; Mohammadi, M.; Aledhari, M.; Ayyash, M. Internet of Things: A Survey on Enabling Technologies, Protocols, and Applications. IEEE Commun. Surv. Tutor. 2015, 17, 2347–2376. [Google Scholar] [CrossRef]
- Roman, R.; Zhou, J.; Lopez, J. On the features and challenges of security and privacy in distributed Internet-of-Things. Comput. Netw. 2013, 57, 2266–2279. [Google Scholar] [CrossRef]
- Ge, M.; Hong, J.B.; Guttmann, W.; Kim, D.S. A Framework for Automating Security Analysis of the Internet of Things. J. Netw. Comput. Appl. 2017, 83, 12–27. [Google Scholar] [CrossRef]
- Cho, J.H.; Sharma, D.P.; Alavizadeh, H.; Yoon, S.; Ben-Asher, N.; Moore, T.J.; Kim, D.S.; Lim, H.; Nelson, F.F. Toward Proactive, Adaptive Defense: A Survey on Moving Target Defense. IEEE Commun. Surv. Tutor. 2020, 22, 709–745. [Google Scholar] [CrossRef]
- Jajodia, S.; Ghosh, A.K.; Swarup, V.; Wang, C.; Wang, X.S. Moving Target Defense: Creating Asymmetric Uncertainty for Cyber Threats, 1st ed.; Springer: Berlin/Heidelberg, Germany, 2011. [Google Scholar]
- Navas, R.E.; Cuppens, F.; Boulahia Cuppens, N.; Toutain, L.; Papadopoulos, G.Z. MTD, Where Art Thou? A Systematic Review of Moving Target Defense Techniques for IoT. IEEE Internet Things J. 2021, 8, 7818–7832. [Google Scholar] [CrossRef]
- Jafarian, J.H.; Al-Shaer, E.; Duan, Q. Openflow random host mutation: Transparent moving target defense using software defined networking. In Proceedings of the First Workshop on Hot Topics in Software Defined Networks, New York, NY, USA, 13 August 2012; pp. 127–132. [Google Scholar]
- Sharma, D.P.; Kim, D.S.; Yoon, S.; Lim, H.; Cho, J.; Moore, T.J. FRVM: Flexible Random Virtual IP Multiplexing in Software-Defined Networks. In Proceedings of the IEEE TrustCom, New York, NY, USA, 1–3 August 2018; pp. 579–587. [Google Scholar]
- Al-Shaer, E.; Duan, Q.; Jafarian, J.H. Random host mutation for moving target defense. In Proceedings of the International Conference on Security and Privacy in Communication Systems; Springer: Berlin/Heidelberg, Germany, 2012; pp. 310–327. [Google Scholar]
- Sherburne, M.; Marchany, R.; Tront, J. Implementing Moving Target IPv6 Defense to Secure 6LoWPAN in the Internet of Things and Smart Grid. In Proceedings of the the 9th Annual Cyber and Information Security Research Conference (CISR), New York, NY, USA, 8–10 April 2014; pp. 37–40. [Google Scholar]
- Thompson, M.; Evans, N.; Kisekka, V. Multiple OS rotational environment an implemented moving target defense. In Proceedings of the 2014 7th International Symposium on Resilient Control Systems (ISRCS), Denver, CO, USA, 19–21 August 2014; pp. 1–6. [Google Scholar]
- Zeitz, K.; Cantrell, M.; Marchany, R.; Tront, J. Designing a Micro-moving Target IPv6 Defense for the Internet of Things. In Proceedings of the Proceedings of IEEE/ACM 2nd International Conference on Internet-of-Things Design and Implementation (IoTDI), Pittsburgh, PA, USA, 18–21 April 2017; pp. 179–184.
- Casola, V.; Benedictis, A.D.; Albanese, M. A moving target defense approach for protecting resource-constrained distributed devices. In Proceedings of the Proceedings of the IEEE 14th International Conference on Information Reuse Integration (IRI), San Francisco, CA, USA, 14–16 August 2013; pp. 22–29.
- Mahmood, K.; Shila, D.M. Moving target defense for Internet-of-Things using context aware code partitioning and code diversification. In Proceedings of the IEEE 3rd World Forum on Internet of Things (WF-IoT), Reston, VA, USA, 12–14 December 2016; pp. 329–330. [Google Scholar]
- Ge, M.; Cho, J.H.; Kim, D.; Dixit, G.; Chen, I.R. Proactive defense for internet-of-things: Moving target defense with cyberdeception. Acm Trans. Internet Technol. (Toit) 2021, 22, 1–31. [Google Scholar] [CrossRef]
- Sharma, D.P.; Enoch, S.Y.; Cho, J.H.; Moore, T.J.; Nelson, F.F.; Lim, H.; Kim, D.S. Dynamic Security Metrics for Software-Defined Network-based Moving Target Defense. J. Netw. Comput. Appl. 2020, 170, 102805. [Google Scholar] [CrossRef]
- Hong, J.B.; Kim, D.S. Assessing the effectiveness of moving target defenses using security models. IEEE Trans. Dependable Secur. Comput. 2016, 13, 163–177. [Google Scholar] [CrossRef]
- Zaffarano, K.; Taylor, J.; Hamilton, S. A Quantitative Framework for Moving Target Defense Effectiveness Evaluation. In Proceedings of the Second ACM Workshop on Moving Target Defense, New York, NY, USA, 12 October 2015; MTD ’15. pp. 3–10. [Google Scholar]
- Zhuang, R.; DeLoach, S.A.; Ou, X. A model for analyzing the effect of moving target defenses on enterprise networks. In Proceedings of the 9th Annual Cyber and Information Security Research Conference, Oak Ridge, TN, USA, 8–10 April 2014; pp. 73–76. [Google Scholar]
- Xiong, X.L.; Yang, L.; Zhao, G.S. Effectiveness evaluation model of moving target defense based on system attack surface. IEEE Access 2019, 7, 9998–10014. [Google Scholar] [CrossRef]
- Connell, W.; Menascé, D.A.; Albanese, M. Performance modeling of moving target defenses. In Proceedings of the 2017 Workshop on Moving Target Defense, Dallas, TX, USA, 30 October–3 November 2017; pp. 53–63. [Google Scholar]
- Alavizadeh, H.; Aref, S.; Kim, D.S.; Jang-Jaccard, J. Evaluating the security and economic effects of moving target defense techniques on the cloud. IEEE Trans. Emerg. Top. Comput. 2022, 10, 1772–1788. [Google Scholar] [CrossRef]
- HaddadPajouh, H.; Dehghantanha, A.; Parizi, R.M.; Aledhari, M.; Karimipour, H. A survey on internet of things security: Requirements, challenges, and solutions. Internet Things 2021, 14, 100129. [Google Scholar] [CrossRef]
- Mishra, N.; Pandya, S. Internet of things applications, security challenges, attacks, intrusion detection, and future visions: A systematic review. IEEE Access 2021, 9, 59353–59377. [Google Scholar] [CrossRef]
- Li, J.; Wu, S.; Zhou, H.; Luo, X.; Wang, T.; Liu, Y.; Ma, X. Packet-level open-world app fingerprinting on wireless traffic. In Proceedings of the 2022 Network and Distributed System Security Symposium (NDSS’22), San Diego, CA, USA, 24–28 April 2022. [Google Scholar]
- Li, J.; Zhou, H.; Wu, S.; Luo, X.; Wang, T.; Zhan, X.; Ma, X. FOAP: Fine-Grained Open-World android app fingerprinting. In Proceedings of the 31st USENIX Security Symposium (USENIX Security 22), Boston, MA, USA, 10–12 August 2022; pp. 1579–1596. [Google Scholar]
- Ni, T.; Lan, G.; Wang, J.; Zhao, Q.; Xu, W. Eavesdropping mobile app activity via Radio-Frequency energy harvesting. In Proceedings of the 32nd USENIX Security Symposium (USENIX Security 23), Anaheim, CA, USA, 9–11 August 2023; pp. 3511–3528. [Google Scholar]
- Sun, Z.; Ni, T.; Yang, H.; Liu, K.; Zhang, Y.; Gu, T.; Xu, W. FLoRa: Energy-efficient, reliable, and beamforming-assisted over-the-air firmware update in LoRa networks. In Proceedings of the Proceedings of the 22nd International Conference on Information Processing in Sensor Networks, San Antonio, TX, USA, 9–12 May 2023; pp. 14–26. [Google Scholar]
- Sun, Z.; Ni, T.; Yang, H.; Liu, K.; Zhang, Y.; Gu, T.; Xu, W. Flora+: Energy-efficient, reliable, beamforming-assisted, and secure over-the-air firmware update in lora networks. ACM Trans. Sens. Netw. 2024, 20, 1–28. [Google Scholar] [CrossRef]
- Picek, S.; Hemberg, E.; O’Reilly, U.M. If you can’t measure it, you can’t improve it: Moving target defense metrics. In Proceedings of the 2017 Workshop on Moving Target Defense, Dallas, TX USA, 30 October 2017; pp. 115–118. [Google Scholar]
- Osei, A.B.; Yeginati, S.R.; Al Mtawa, Y.; Halabi, T. Optimized Moving Target Defense Against DDoS Attacks in IoT Networks: When to Adapt? In Proceedings of the GLOBECOM 2022—2022 IEEE Global Communications Conference, Rio de Janeiro, Brazil, 4–8 December 2022; pp. 2782–2787. [Google Scholar] [CrossRef]
- Carroll, T.E.; Crouse, M.; Fulp, E.W.; Berenhaut, K.S. Analysis of network address shuffling as a moving target defense. In Proceedings of the 2014 IEEE International Conference on Communications (ICC), Sydney, NSW, Australia, 10–14 June 2014; pp. 701–706. [Google Scholar]
- Hong, J.B.; Enoch, S.Y.; Kim, D.S.; Nhlabatsi, A.; Fetais, N.; Khan, K.M. Dynamic security metrics for measuring the effectiveness of moving target defense techniques. Comput. Secur. 2018, 79, 33–52. [Google Scholar] [CrossRef]
- Zhuang, R.; DeLoach, S.A.; Ou, X. Towards a Theory of Moving Target Defense. In Proceedings of the First ACM Workshop on Moving Target Defense, Scottsdale, AR, USA, 7 November 2014; pp. 31–40. [Google Scholar]
- Ma, D.; Wang, L.; Lei, C.; Xu, Z.; Zhang, H.; Li, M. POSTER: Quantitative Security Assessment Method Based on Entropy for Moving Target Defense. In Proceedings of the 2017 ACM on Asia Conference on Computer and Communications Security, New York, NY, USA, 2–6 April 2017; pp. 920–922. [Google Scholar]
- Steinberger, J.; Kuhnert, B.; Dietz, C.; Ball, L.; Sperotto, A.; Baier, H.; Pras, A.; Dreo, G. DDoS Defense using MTD and SDN. In Proceedings of the IEEE/IFIP Network Operations and Management Symposium, Taipei, Taiwan, 23–27 April 2018; pp. 1–9. [Google Scholar]
- CVE. CVEdetails. Available online: https://www.cvedetails.com/ (accessed on 1 March 2025).
- Lyon, G.F. Nmap Network Scanning: The Official Nmap Project Guide to Network Discovery and Security Scanning; Insecure: Los Angeles, CA, USA, 2009. [Google Scholar]
- Nessus. Nessus Professional. 2018. Available online: https://www.tenable.com/products/nessus/nessus-professional (accessed on 20 December 2024).
- Hong, J.B.; Yoon, S.; Lim, H.; Kim, D.S. Optimal network reconfiguration for software defined networks using shuffle-based online MTD. In Proceedings of the 2017 IEEE 36th Symposium on Reliable Distributed Systems (SRDS), Hong Kong, China, 26–29 September 2017; pp. 234–243. [Google Scholar]
- Sheyner, O.; Haines, J.; Jha, S.; Lippmann, R.; Wing, J.M. Automated generation and analysis of attack graphs. In Proceedings of the 2002 IEEE Symposium on Security and Privacy, Berkeley, CA, USA, 12–15 May 2002; pp. 273–284. [Google Scholar]
- Idika, N.; Bhargava, B. Extending Attack Graph-Based Security Metrics and Aggregating Their Application. IEEE Trans. Dependable Secur. Comput. 2012, 9, 75–85. [Google Scholar] [CrossRef]
- Yusuf, S.E.; Ge, M.; Hong, J.B.; Kim, H.K.; Kim, P.; Kim, D.S. Security Modelling and Analysis of Dynamic Enterprise Networks. In Proceedings of the 2016 IEEE International Conference on Computer and Information Technology (CIT), Nadi, Fiji, 8–10 December 2016; pp. 249–256. [Google Scholar] [CrossRef]
- Hong, J.; Kim, D.S. Harms: Hierarchical attack representation models for network security analysis. In Proceedings of the 10th Australian Information Security Management Conference, Novotel Langley Hotel, Perth, Australia, 3–5 December 2012. [Google Scholar]
- Byres, E.; Leversage, D. Estimating a System’s Mean Time-to-Compromise. IEEE Secur. Priv. 2008, 6, 52–60. [Google Scholar]
- McQueen, M.A.; Boyer, W.F.; Flynn, M.A.; Beitel, G.A. Time-to-Compromise Model for Cyber Risk Reduction Estimation. In Proceedings of the Quality of Protection; Gollmann, D., Massacci, F., Yautsiukhin, A., Eds.; Springer: Boston, MA, USA, 2006; pp. 49–64. [Google Scholar]
- NIST-NVD. National Vulnerability Database (NVD). 2025. Available online: https://nvd.nist.gov/ (accessed on 1 March 2025).


| Device Type | Brand/Model | CVE ID | CVSS Score | Description |
|---|---|---|---|---|
| Smart TV | LG WebOS | CVE-2023-6317 | 9.8 | Remote command execution |
| Smart door lock | Suleve 5-in-1 Smart Door Lock v1.0 | CVE-2023-39843 | 2.4 | Missing encryption |
| Smart speaker | Sonos Era 100 | CVE-2024-5269 | 8.8 | Use-after-free remote code execution |
| Smartphone | Android Devices | CVE-2023-40088 | 8.8 | Memory corruption |
| Security Camera | Wyze Cam | CVE-2019-9564 | 9.8 | Bypass login and control the devices |
| Smart Meter | Siemens 7KT PAC1200 | CVE-2017-9944 | 8.8 | Authentication bypass |
| Smart Thermostat | Ecobee3 lite | CVE-2021-27954 | 8.5 | Buffer-overflow |
| Smart Plug | WSP080 v1.2 lite | CVE-2023-33768 | 6.5 | Incorrect signature verification |
| IoT Devices | ||||||
|---|---|---|---|---|---|---|
| (start) | - | - | - | - | - | - |
| $3000.00 | 6 days | 6 days | 500.00 | 500.00 | 0.00% | |
| $3000.00 | 4 days | 4 days | 750.00 | 750.00 | 0.00% | |
| $2000.00 | 5 days | 13 days | 400.00 | 153.84 | 61.00% | |
| $2000.00 | 8 days | 8 days | 250.00 | 250.00 | 0.00% | |
| $5000.00 | 7 days | 10 days | 714.28 | 500.00 | 30.00% |
Disclaimer/Publisher’s Note: The statements, opinions and data contained in all publications are solely those of the individual author(s) and contributor(s) and not of MDPI and/or the editor(s). MDPI and/or the editor(s) disclaim responsibility for any injury to people or property resulting from any ideas, methods, instructions or products referred to in the content. |
© 2025 by the author. Licensee MDPI, Basel, Switzerland. This article is an open access article distributed under the terms and conditions of the Creative Commons Attribution (CC BY) license (https://creativecommons.org/licenses/by/4.0/).
Share and Cite
Sharma, D.P. Evaluating Moving Target Defense Methods Using Time to Compromise and Security Risk Metrics in IoT Networks. Electronics 2025, 14, 2205. https://doi.org/10.3390/electronics14112205
Sharma DP. Evaluating Moving Target Defense Methods Using Time to Compromise and Security Risk Metrics in IoT Networks. Electronics. 2025; 14(11):2205. https://doi.org/10.3390/electronics14112205
Chicago/Turabian StyleSharma, Dilli Prasad. 2025. "Evaluating Moving Target Defense Methods Using Time to Compromise and Security Risk Metrics in IoT Networks" Electronics 14, no. 11: 2205. https://doi.org/10.3390/electronics14112205
APA StyleSharma, D. P. (2025). Evaluating Moving Target Defense Methods Using Time to Compromise and Security Risk Metrics in IoT Networks. Electronics, 14(11), 2205. https://doi.org/10.3390/electronics14112205