
An Improved Lightweight YOLOv5s-Based Method for Detecting Electric Bicycles in Elevators


Abstract
1. Introduction
- We use MobileNetV2 to reduce the parameters and computational complexity of the model and replace the original activation function ReLU6 with SiLU, which improves the training efficiency and convergence speed of the model, as well as its generalization ability and performance.
- We introduce the CBAM attention mechanism at the output position of the backbone network to increase the performance of the model, which helps enhance the feature representation ability of the model, enhance the receptive field, improve detection precision, and reduce computational costs.
- Considering the decrease in precision and recall after the introduction of MobileNetV2, the BiFPN model is introduced to ensure high detection precision.
- We use a Raspberry Pi 4B for model application validation.
- We test the behavior of the YOLOv5s-M2B model on the same dataset, comparing it against Faster RCNN, SSD, and YOLOv3 models, concluding that our model exhibits superior performance.
2. Related Works
2.1. Electric Bicycle Detection in Elevators
2.1.1. Lightweight Model Design
2.1.2. Model Detection Performance
2.1.3. Algorithm Deployment
3. Proposed Method
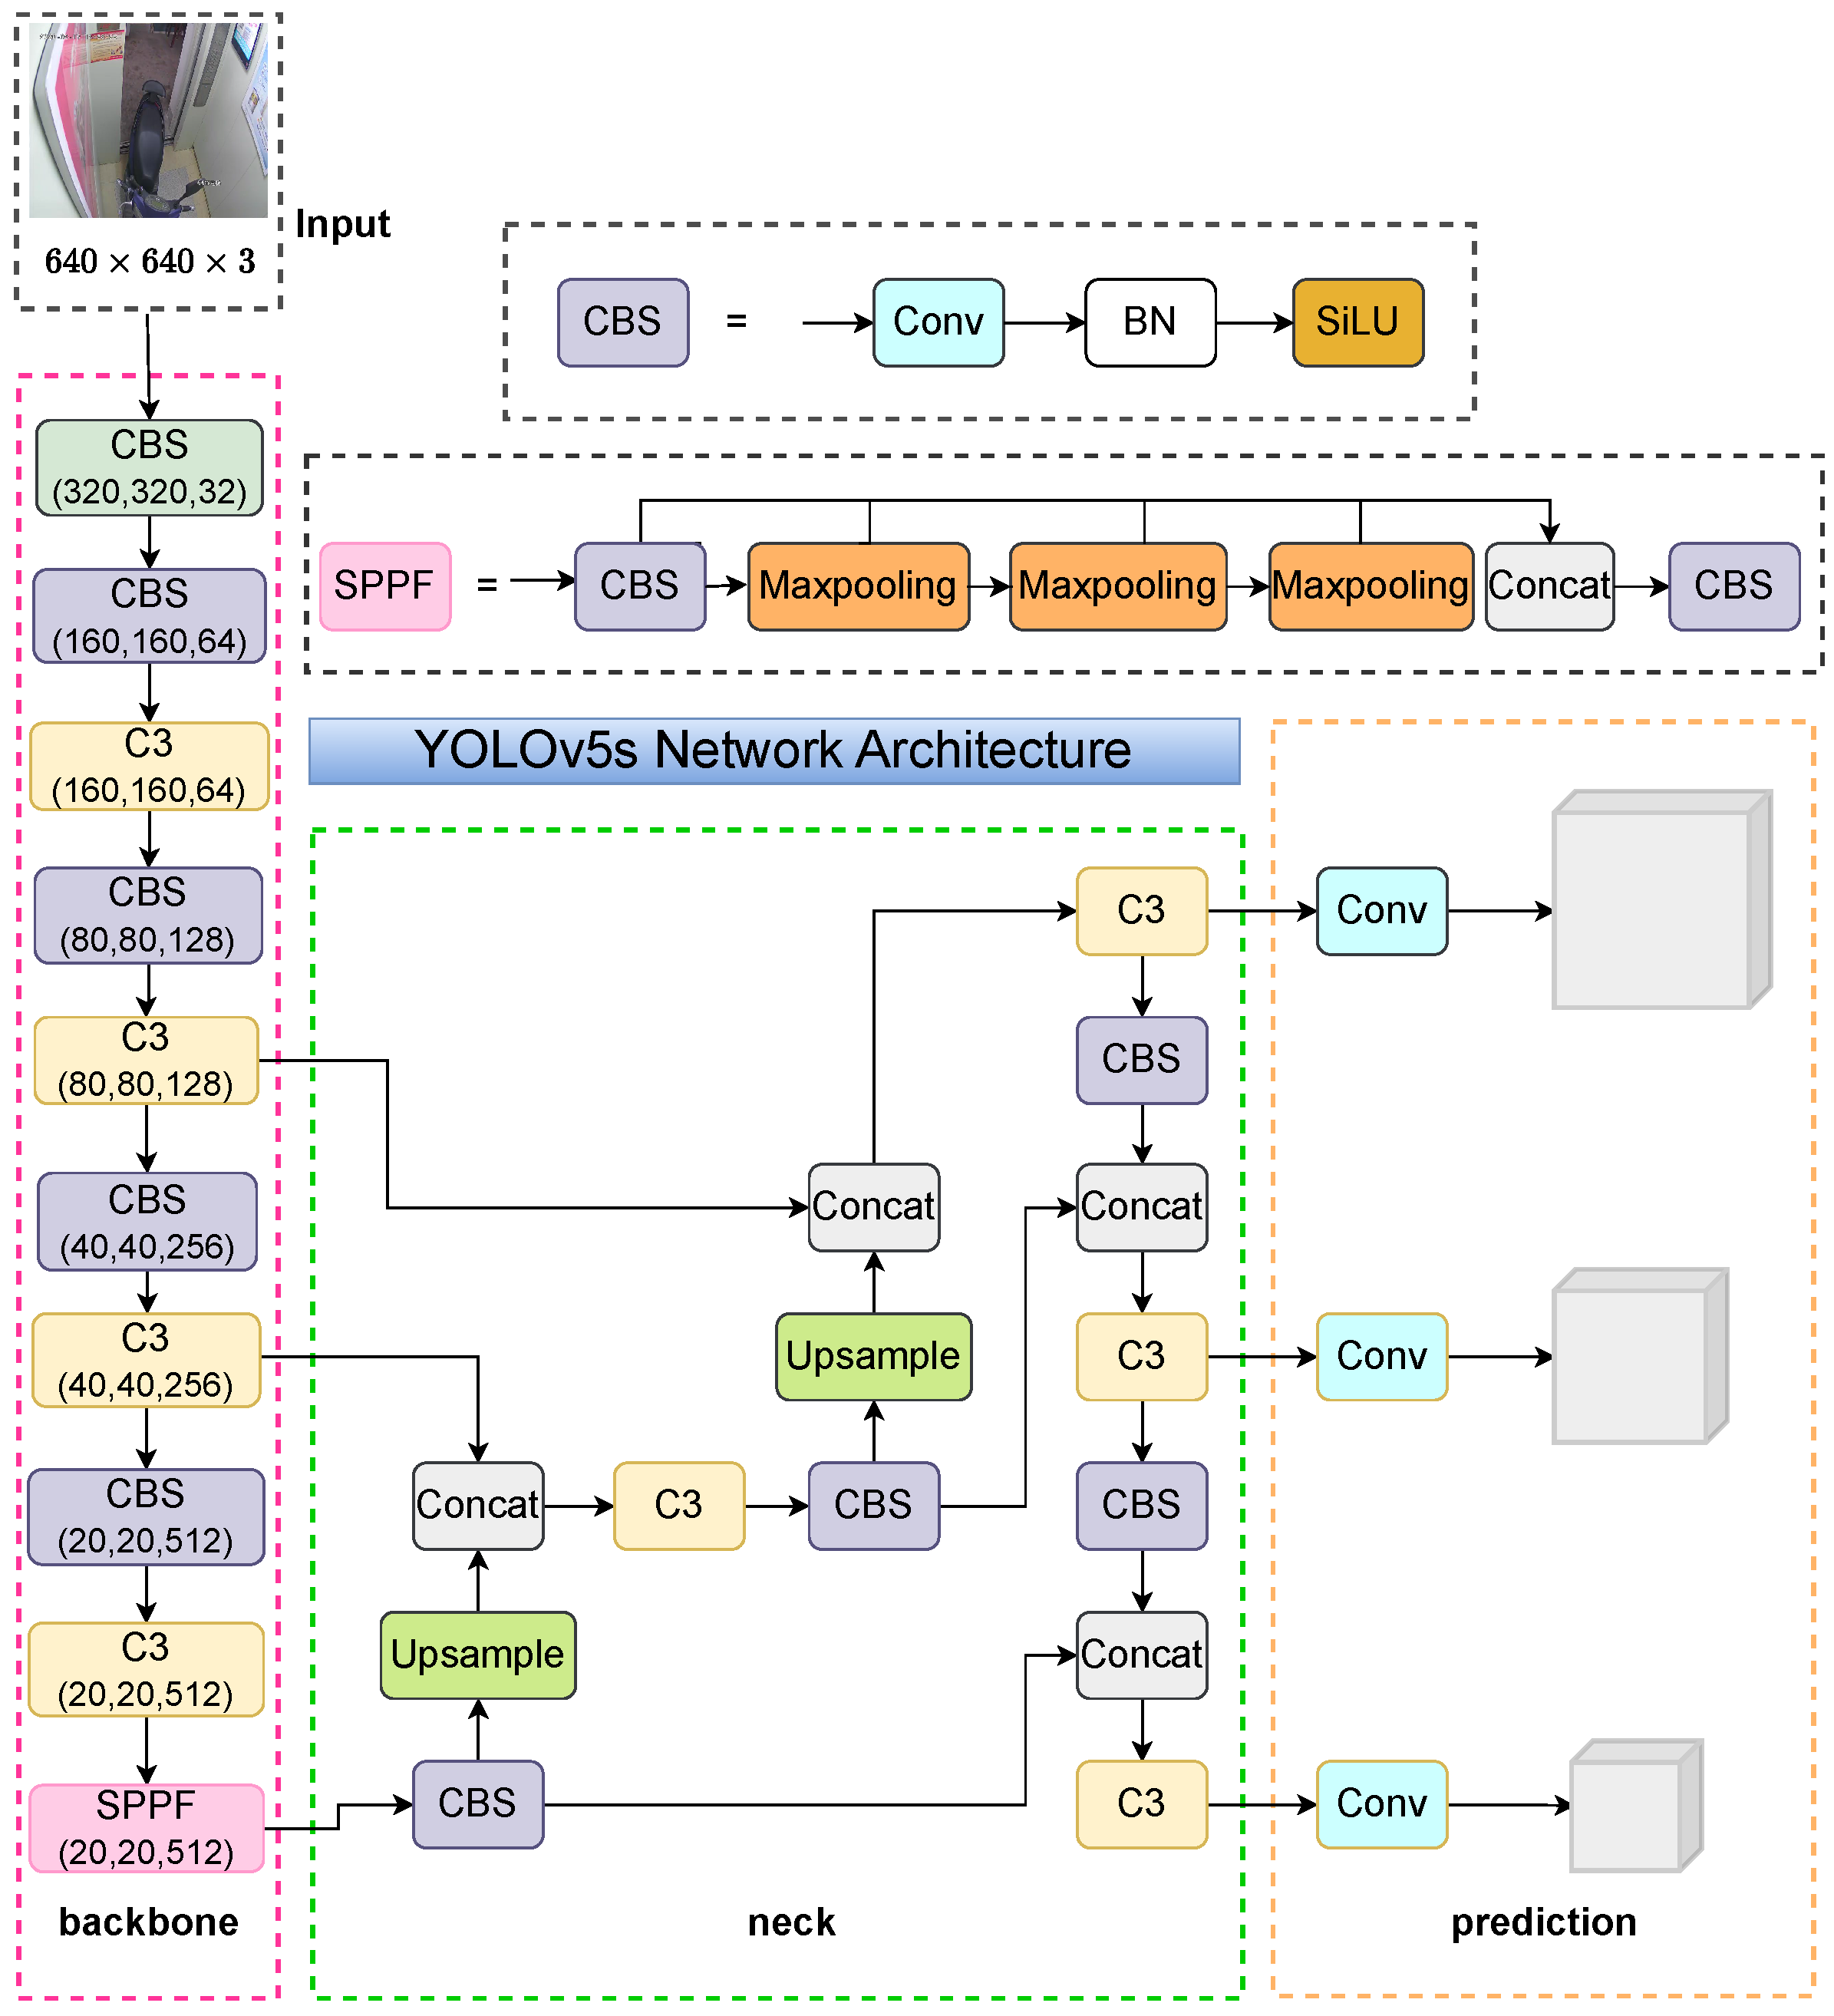
3.1. YOLOv5s Model
3.1.1. Backbone Network
- The input feature maps are divided into two parts.
- In the subnetwork, convolutional layers compress the input feature map, perform a range of convolution computations, and finally expand with convolutional layers. By following these steps, relatively fewer high-level features can be distilled.
- In the subsequent stages, the processed feature maps from the subnetwork are fused with directly processed feature maps, followed by a series of convolution operations.
3.1.2. Neck Network
3.1.3. Loss Functions
3.2. YOLOv5s-M2B Model
- In the backbone, the MobileNetv2 network is introduced to replace the original YOLOv5s, and the SPP and focal modules are removed, thereby reducing the model’s parameter count and computational complexity while ensuring detection precision.
- In the neck, the CBAM attention mechanism is added to the back of the four up- and downsampling stages to improve the detection precision of the model.
- After adding the CBAM attention mechanism, the original contact in the neck is replaced with BiFPN to further improve the recognition performance and detection precision of the model. BiFPN_Add2 represents two feature map addition operations, and BiFPN_Add3 represents three feature map addition operations.
3.2.1. Algorithm Evaluation Indicators
3.2.2. MobileNetV2
3.2.3. CBAM
- Global max pooling and average pooling: In the input feature map, global max and average pooling operations are executed on each channel to calculate the maximum and average feature values on each channel, resulting in two vectors representing the global maximum and average features of each channel.
- Fully connected layer: This layer receives the processed feature vectors and passes them to a shared fully connected layer to learn the attention weights of each channel. The network automatically determines which channels are more relevant to the current task through learning.
- Sigmoid activation: Employing the Sigmoid activation function ensures that the channel attention weights are constrained within the range of 0 to 1.
- Attention weighting: By utilizing the obtained attention weights and multiplying them one by one with each channel of the original feature map, a channel feature map that has undergone attention weighting processing is obtained. This process highlights channels that are beneficial to the current task while suppressing channels that are not related to the task.
- Maximum pooling and average pooling: Within the input feature map, max pooling and average pooling operations are performed across the channel dimension to extract features representing various contextual scales.
- Connection and convolution: The processed features are merged along the channel dimension to form a feature map containing contextual information at different scales. Next, the feature map is processed through convolutional layers to generate spatial attention weights.
- Sigmoid activation: Similar to the channel attention module.
- Attention weighting: By utilizing the generated spatial attention weights and applying them to the original feature map, the features of each spatial position are weighted to highlight important regions in the image while reducing the impact of unimportant regions.
3.2.4. BiFPN
- Nodes with only one input are removed, making the network structure simpler.
- By adding an edge between the primitive input node and the output node, more characteristics can be mixed without any additional cost.
- The top-down and bottom-up paths are integrated into one module to achieve higher-level characteristic fusion.
4. Experiments
4.1. Experimental Settings
4.2. Experimental Results
4.2.1. Training Results
4.2.2. Testing Results
- Extract each frame from the video and pass it to the YOLOv5s-M2B model in the form of images. The model recognizes the received images and labels them with “person”, “cycle”, and ”electric cycle”;
- Establish an interface between the Raspberry Pi 4B and PyCharm Professional 2023.3.5 software. Ensure that the Raspberry Pi 4B and PyCharm software are on the same local area network. Add an SSH interpreter to PyCharm, and input the hostname and username of the Raspberry Pi to be connected. Enter the correct password to connect the two.
- Use the established interface to transfer the annotated image to the Raspberry Pi 4B.
- Identify the annotated images received by the Raspberry Pi 4B. If the image contains an “electric cycle” annotation, use a buzzer to sound an alarm; otherwise, no action is taken. During the process of identifying images, the Raspberry Pi 4B also displays them on the display screen, making it easier for elevator administrators to monitor the situation inside the elevator.
4.3. Comparison Experiment
5. Conclusions and Limitations
5.1. Article Conclusions
5.2. Design Limitations
- The application scenarios of algorithms have limitations. This article only focuses on the detection of electric vehicles inside elevators and is not yet able to detect electric vehicles in other scenarios, such as roads and parking lots.
- The dataset studied is limited. The dataset images used in this article have certain shortcomings, and more datasets related to electric vehicles in elevators need to be introduced to enable the algorithm to adapt to elevator environments with occlusions, blurring, and variable backgrounds, thereby enhancing the universality of the model.
- The model is not novel enough. The model used in this article was proposed previously, and with the rapid development of the manufacturing industry today, there may be a mismatch between the older model and newly emerging embedded devices.
Author Contributions
Funding
Data Availability Statement
Conflicts of Interest
References
- Liu, J.; Xu, Z.; Fan, N.W.; Wang, Y.; Mo, W. The combination mode of forest and SVM for power network disaster response failure identification. Comput. Electr. Eng. 2024, 117, 109255. [Google Scholar] [CrossRef]
- Girshick, B.R.; Donahue, J.; Darrell, T.; Malik, J. Rich feature hierarchies for accurate object detection and semantic segmentation. In Proceedings of the IEEE Conference on Computer Vision and Pattern Recognition, Columbus, OH, USA, 23–28 June 2014; pp. 580–587. [Google Scholar]
- Shihabuddin, A.R.; Beevi, S. Efficient Mitosis Detection: Leveraging Pre-trained Faster R-CNN and Cell-level Classification. Biomed. Phys. Eng. Express 2024, 10, 025031. [Google Scholar] [CrossRef] [PubMed]
- Alruwaili, M.; Siddiqi, H.M.; Atta, N.M.; Arif, M. Deep Learning and Ubiquitous Systems for Disabled People Detection Using YOLO Models. Comput. Hum. Behav. 2024, 154, 108150. [Google Scholar] [CrossRef]
- Hao, M.; Sun, Q.; Xuan, C.; Zhang, X.; Zhao, M.; Song, S. Lightweight Small-Tailed Han Sheep Facial Recognition Based on Improved SSD Algorithm. Agriculture 2024, 14, 468. [Google Scholar] [CrossRef]
- Jing, C.; Rongjie, W.; Anhui, L.; Jiang, D.; Wang, Y. A Feature Enhanced RetinaNet-Based for Instance-Level Ship Recognition. Eng. Appl. Artif. Intell. 2023, 126, 107133. [Google Scholar]
- Rahmat, H.; Wahjuni, S.; Rahmawan, H. Performance Analysis of Deep Learning-based Object Detectors on Raspberry Pi for Detecting Melon Leaf Abnormality. Int. J. Adv. Sci. Eng. Inf. Technol. 2022, 12, 386–391. [Google Scholar] [CrossRef]
- Arrieta-Rodríguez, E.; Murillo, F.L.; Arnedo, M.; Caicedo, A.; Fuentes, M.A. Prototype for identification of vehicle plates and character recognition implemented in Raspberry Pi. IOP Conf. Ser. Mater. Sci. Eng. 2019, 519, 012028. [Google Scholar] [CrossRef]
- Liu, L.; Hang, Y.; Chen, R.; He, X.; Jin, X.; Wu, D.; Li, Y. LDSG-Net: An efficient lightweight convolutional neural network for acute hypotensive episode prediction during ICU hospitalization. Physiol. Meas. 2024, 45, 065003. [Google Scholar] [CrossRef] [PubMed]
- Yang, S.; Zhang, L.; Lin, J.; Cernava, T.; Cai, J.; Pan, R.; Zhang, X. LSGNet: A lightweight convolutional neural network model for tomato disease identification. Crop Prot. 2024, 182, 106715. [Google Scholar] [CrossRef]
- Yi, Z.; Hancheng, H.; Zhixiang, L.; Yiwang, H.; Lu, M. Intelligent garbage classification system based on improve MobileNetV3-Large. Connect. Sci. 2022, 34, 1299–1321. [Google Scholar]
- Zhao, Z.; Li, S.; Wu, C.; Wei, X. Research on the rapid recognition method of electric bicycles in elevators based on machine vision. Sustainability 2023, 15, 13550. [Google Scholar] [CrossRef]
- Li, H.; Zhuang, X.; Bao, S.; Chen, J.; Yang, C. SCD-YOLO: A lightweight vehicle target detection method based on improved YOLOv5n. J. Electron. Imaging 2024, 33, 023041. [Google Scholar] [CrossRef]
- Wang, J.; Chen, K.; Xu, R.; Liu, Z.; Loy, C.C.; Lin, D. CARAFE: Content-Aware ReAssembly of FEatures. In Proceedings of the IEEE/CVF International Conference on Computer Vision, Seoul, Republic of Korea, 20–26 October 2019; pp. 3007–3016. [Google Scholar]
- Wang, C.Y.; Liao, H.Y.M.; Wu, Y.H.; Chen, P.Y.; Hsieh, J.W.; Yeh, I.H. CSPNet: A New Backbone That Can Enhance Learning Capability of CNN. In Proceedings of the IEEE/CVF Conference on Computer Vision and Pattern Recognition Workshops, Seattle, WA, USA, 14–19 June 2020; pp. 390–391. [Google Scholar]
- Bolton, C.; Davies, J. A Singleton Failures Semantics for Communicating Sequential Processes. Form. Asp. Comput. 2006, 18, 181–210. [Google Scholar] [CrossRef]
- Liu, S.; Qi, L.; Qin, H.; Shi, J.; Jia, J. Path Aggregation Network for Instance Segmentation. In Proceedings of the IEEE Conference on Computer Vision and Pattern Recognition, Salt Lake City, UT, USA, 18–23 June 2018; pp. 8759–8768. [Google Scholar]
- Zheng, Z.; Wang, P.; Liu, W.; Li, J.; Ye, R.; Ren, D. Distance-IoU Loss: Faster and Better Learning for Bounding Box Regression. In Proceedings of the AAAI Conference on Artificial Intelligence; AAAI Press: New York, NY, USA, 2020; pp. 12993–13000. [Google Scholar]
- Yu, J.; Jiang, Y.; Wang, Z.; Cao, Z.; Huang, T. Unitbox: An Advanced Object Detection Network. In Proceedings of the 24th ACM International Conference on Multimedia, Amsterdam, The Netherlands, 15–19 October 2016; pp. 516–520. [Google Scholar]
- Ruby, U.; Yendapalli, V. Binary Cross Entropy with Deep Learning Technique for Image Classification. Int. J. Adv. Trends Comput. Sci. Eng. 2020, 9, 5393–5397. [Google Scholar]
- Sandler, M.; Howard, A.; Zhu, M.; Zhmoginov, A.; Chen, L.-C. MobileNetV2: Inverted Residuals and Linear Bottlenecks. In Proceedings of the 2018 IEEE/CVF Conference on Computer Vision and Pattern Recognition, Salt Lake City, UT, USA, 18–23 June 2018; pp. 4510–4520. [Google Scholar] [CrossRef]
- Woo, S.; Park, J.; Lee, J.-Y.; Kweon, I. CBAM: Convolutional Block Attention Module. arXiv 2018, arXiv:1807.06521. [Google Scholar]
- Zhang, K.; Sun, M.; Han, T.X.; Yuan, X.; Guo, L.; Liu, L.; Tao, L. Residual Networks of Residual Networks: Multilevel Residual Networks. IEEE Trans. Circuits Syst. Video Technol. 2018, 28, 1303–1314. [Google Scholar] [CrossRef]


| Input | Operator | t | c | n | s |
|---|---|---|---|---|---|
| cov2d | - | 32 | 1 | 2 | |
| bottleneck | 1 | 16 | 1 | 1 | |
| bottleneck | 6 | 24 | 2 | 2 | |
| bottleneck | 6 | 32 | 3 | 2 | |
| bottleneck | 6 | 64 | 4 | 2 | |
| bottleneck | 6 | 96 | 3 | 1 | |
| bottleneck | 6 | 160 | 3 | 2 | |
| bottleneck | 6 | 320 | 1 | 1 |
| Name | SiLU | ReLU6 | |
|---|---|---|---|
| Indicator | |||
| Precision (%) | 91.2 | 88.8 | |
| Recall (%) | 90.7 | 87.4 | |
| mAP@.5 (%) | 94.5 | 92.7 | |
| mAP@.5:.95 (%) | 62.6 | 61.5 | |
| Parameter Name | Numerical Value |
|---|---|
| epochs | 100 |
| batch size | 2 |
| workers | 8 |
| mosaic | 1.0 |
| weight decay | 0.0005 |
| learning rate | 0.01 |
| image size |
| Name | Parameter |
|---|---|
| SOC | CM2711 |
| CPU | ARM Cortex-A72 1.5 GHz |
| memory | 1 GB/2 GB/4 GB LPDDR4 |
| number of USB ports | 2×USB3.0 |
| 2×USB2.0 | |
| video output | 2 micro HDMI ports |
| 2-lane MIPI DSI display port | |
| power input | 5V USB-TypeC |
| Model | YOLOv5s | YOLOv5-MobileNetV2 | YOLOv5s-M2B | |
|---|---|---|---|---|
| Indicator | ||||
| Precision (%) | 95.2 | 88.8 | 94.3 | |
| Recall (%) | 89.2 | 87.4 | 85.2 | |
| mAP@.5 (%) | 97.2 | 92.7 | 95.9 | |
| mAP@.5:.95 (%) | 68.2 | 61.5 | 66.4 | |
| Parameter (M) | 7.02 | 2.92 | 3.03 | |
| GFLOPs (G) | 15.8 | 7.8 | 8.7 | |
| Model | mAP@.5 (%) | mAP@.5:.95 (%) | Parameter (M) | GFLOPs (G) |
|---|---|---|---|---|
| Faster-RCNN | 85.6 | 51.6 | 137.099 | 370.210 |
| SSD | 92.5 | 58.3 | 26.285 | 62.747 |
| YOLOv3 | 92.7 | 57.6 | 61.95 | 66.17 |
| YOLOv5s | 97.2 | 68.2 | 7.02 | 15.8 |
| YOLOv8 | 97.8 | 88.5 | 11.137 | 28.7 |
| YOLOv5s-M2B | 95.9 | 66.4 | 3.03 | 8.7 |
Disclaimer/Publisher’s Note: The statements, opinions and data contained in all publications are solely those of the individual author(s) and contributor(s) and not of MDPI and/or the editor(s). MDPI and/or the editor(s) disclaim responsibility for any injury to people or property resulting from any ideas, methods, instructions or products referred to in the content. |
© 2024 by the authors. Licensee MDPI, Basel, Switzerland. This article is an open access article distributed under the terms and conditions of the Creative Commons Attribution (CC BY) license (https://creativecommons.org/licenses/by/4.0/).
Share and Cite
Zhang, Z.; Yang, X.; Wu, C. An Improved Lightweight YOLOv5s-Based Method for Detecting Electric Bicycles in Elevators. Electronics 2024, 13, 2660. https://doi.org/10.3390/electronics13132660
Zhang Z, Yang X, Wu C. An Improved Lightweight YOLOv5s-Based Method for Detecting Electric Bicycles in Elevators. Electronics. 2024; 13(13):2660. https://doi.org/10.3390/electronics13132660
Chicago/Turabian StyleZhang, Ziyuan, Xianyu Yang, and Chengyu Wu. 2024. "An Improved Lightweight YOLOv5s-Based Method for Detecting Electric Bicycles in Elevators" Electronics 13, no. 13: 2660. https://doi.org/10.3390/electronics13132660
APA StyleZhang, Z., Yang, X., & Wu, C. (2024). An Improved Lightweight YOLOv5s-Based Method for Detecting Electric Bicycles in Elevators. Electronics, 13(13), 2660. https://doi.org/10.3390/electronics13132660