Abstract
Three-dimensional virtual reality (VR) environments, whether operating on desktop platforms or immersive screens, have been recognized for enabling novel and extremely engaging methods of interacting with digital content across various fields of application. Studies conducted over the past several years have also consistently suggested that utilizing 3D in contrast to 2D interfaces can lead to enhancements in multiple performance dimensions. These enhancements encompass better understanding and retention of information, increased capacity for inventive and efficient collaboration, and the ability to execute workflows that integrate numerous information sources more quickly. At the same time, how digital content such as documents, audio–visual content and web browsers are integrated into 3D spaces is often decided by the creators of the spaces based on either aesthetic considerations, or on a case-by-case basis depending on the workflow. In this paper, we present the results of an experiment we conducted to better understand how users prefer to arrange digital content in their 3D environments, depending on the subject matter, the format of the content (e.g., text-based, image, or audio–visual) and the 3D objects within the space. The results of the experiment presented in the paper can help inform future 3D VR design methodologies and may also provide support for automated content arrangement solutions.
1. Introduction
Virtual reality (VR) is a technology that utilizes 3D digital models to create three-dimensional experiences for users, replicating real or imagined environments. The development of VR has experienced ups and downs, sharing similarities with the periods of “winter” and “summer” in the evolution of artificial intelligence. Although there is no consensus on the precise reasons for this, it has been proposed that the primary obstacles to widespread VR adoption are the inadequate performance of headsets and a limited range of applications [1].
Despite these challenges, the VR industry has witnessed substantial growth over the past ten years and is estimated to reach a market value of USD 50 billion by 2026 [2]. An increasing number of stakeholders now appreciate VR’s practical applications beyond its entertainment potential. While early VR developers saw the technology as a new infocommunications platform [3], it has for a long time largely been perceived as suitable for gaming, entertainment, and professional simulations or training. However, in recent times, VR has been making inroads into a variety of sectors, including primary and higher education [4,5,6], healthcare [7,8,9,10], engineering, and numerous other professional industries [11,12,13,14,15].
In this paper, our main focus is on the use of VR as a digital workspace, and we investigate the typical layouts of 2D content preferred by users within 3D environments, both in terms of content type and relative display size, as well as in terms of thematic cohesion, format (i.e, content type) cohesion and in terms of the relationship with objects in the 3D environment.
The paper is structured as follows. In Section 2, we provide a brief overview of cognitive theories relevant to the processing, grouping, and recall of information in the visual modality. In Section 3, we provide a brief overview of how information is generally organized and visualized in 2D and 3D environments. The main part of this research, i.e., the experiment we have conducted on preferred content layouts in 3D, is reported upon in Section 4. Finally, a short discussion on the interpretation of the results is presented in Section 5.
2. Classical Cognitive Theories on the Processing, Grouping and Recall of Visual Objects
In this section, we provide an overview of cognitive theories relevant to how information is processed, grouped, and recalled, especially in the context of the visual modality. The key takeaway from this overview is that the way in which humans process spatial information, navigate in space, and conceptually represent spatial relationships is dependent on many factors, some of which may span perceptual, high-level cognitive and even emotional aspects. For this reason, predicting user preferences in 3D virtual environments is far from a trivial exercise, and such predictions need to be supplemented by usability experiments.
2.1. Perception of Objects, Shapes and Forms
Historically, the first psychophysical model that described the organization of perceived images into objects was the Gestalt theory. This concept was developed through the contributions of Max Wertheimer, Kurt Koffka, and Wolfgang Köhler. The Gestalt approach emphasizes that the object (the “whole”) is more than the sum of its parts (i.e., the segments that make up the objects). Gestalt psychologists focused their work on three main areas [16,17,18,19,20]:
- The relationships between shape and background;
- Grouping rules;
- The “goodness” of shapes.
Within these areas, they identified six Gestalt principles:
- Law of Similarity;
- Law of Good figure;
- Law of Proximity;
- Law of Continuity;
- Law of Closure;
- Law of Common Region.
The Law of Common Region and the Law of Proximity play a particularly important role in understanding the grouping of information and in cases where the goal is to actively facilitate the speed and quality of the comprehensibility and recall of an image, both of which can be highly relevant in the use of VR to communicate information at a high level.
Based on the Law of the Common Region, the human brain is expected to group together elements that are located in a common, closed region. Even today, user interface and user experience designers rely on this principle when organizing information on specific elements in a closed area and using the same color, whether in, e.g., games or on social interfaces. In the case of the Law of Proximity, objects that are closer to each other are more likely to be considered as a group of related elements. Using this principle, it is also possible to communicate the association of information clearly, even if it is not possible to create closed regions [21,22].
2.2. Human Spatial Behavior
Despite the relative limitations of the human senses and locomotion skills, we can navigate our surroundings skillfully. This indicates that effective spatial orientation is not simply a question of perceptual and/or motor performance. The ability of people to deal effectively and purposefully with their immediate environment is often referred to as human environmental competence [23].
Human environmental competence consists of several components [23,24]:
- The perceptual component means the identification, highlighting, and prioritization of the essential characteristics of the environment.
- The cognitive component performs the interpretation of features highlighted during perception, as well as the storage, organization, and recall of the features that acquire meaning in this way. This results in environmental knowledge.
- The components of the affective component are positive and negative emotional and motivational responses to the characteristics of the environment, behavioral reactions, and personal dispositions that mediate between the former components.
2.3. Categorization and Conceptual Representation
Tversky’s research published in 2003 discusses several types of mental spatial reference frames by which people place themselves in space. Each cognitive subsystem of the complex, multifaceted mental space serves a different function and includes different spatial elements and frames of reference. Although it can be assumed that each of them has a different mental structure, all of them are characterized by schematization. This reduces the load on memory, stimulates information processing, and allows for the integration of a wide variety of information, albeit at the cost of some error and distortion.
In the world in general, as well as in one’s narrow environment, one comes across a lot of information that one will need to recall at some point. This is supported by several cognitive processes, such as categorization. This mostly happens automatically and can affect all modalities. The cognitive processes that help categorization make it possible for people to differentiate between objects classified in different categories based on certain properties, but in the case of objects belonging to the same category, they ignore minor differences and pay attention to common properties [25,26].
Although the categorization of information is essential in our everyday life, organizing the information into blocks can also help make both processing and recall more efficient. In this context, one of the most significant research results in cognitive science has been the discovery of ‘chunking’—a cognitive process in which information is broken down into smaller, more manageable units to make the information more understandable [27,28]. It is a strategy for memorization that can be applied consciously, but can also occur unconsciously through experience, which allows people to recall larger amounts of information [29,30,31]. We have known for a long time that the capacity of working memory is limited in terms of processing and storing information; however, with the help of this cognitive strategy, the amount of information to be processed at a given time can be reduced [32]. Additionally, the efficiency of this process is further supported by the fact that it is often based on an organizing principle that not only uses smaller building blocks but also makes semantic sense, thus resulting in memories that are easier to recall [29,33].
In many cases, however, information-acquisition models have proven to be incomplete in the past because they did not take into account the cognitive state of users, as well as the cognitive strategies they may employ. Pirolli and Card’s 1999 information search model identifies this shortcoming and states that people searching for information search and organize information in clusters to minimize the information search cost of searching between clusters [34]. These clusters appear in both physical and digital forms. Another very important aspect is the user’s mental model, which also explains the different information search behaviors. Differences in the mental model are often determined by the cognitive demographic and social variables of the given user [35].
3. Information Organization in 2D and 3D Interfaces
In this section, we provide a brief overview of how information is generally organized and visualized in 2D and 3D environments, highlighting some of the advantageous ways of using each for improved comprehensibility and information throughput, as well as highlighting some relative benefits of 3D environments versus 2D environments in this context.
3.1. Two-Dimensional Interfaces
With the advent of the digital world and the advancement of graphical interfaces, as well as the growth of digital information and the emergence of computers as mass products, there arose a need for the numerous digital content types—stored on computers, phones, tablets, or other electronic devices—to be organized according to a specific principle. Typically, 2D interfaces employ logically hierarchical solutions to this, displaying files as belonging to a given folder within a folder hierarchy. In such cases, users have no other option than to access the content of a given file using its location in the hierarchy, its extension and name [36,37,38].
3.1.1. Difficulties of Task-Oriented Clustering on 2D Interfaces
The key challenge in using folder-file hierarchies is that it is difficult to conceptually associate a given file with a unique folder, and it is often difficult for users to recall which folder a given file can be found in.
Gwizdka et al. tried to investigate this problem when they looked at how managing emails on 2D interfaces could be improved, i.e., made faster and more efficient. The physical environment in which people perform everyday activities is highly spatial and flexible. They expected that bringing some of these features into the e-mail environment would better support the various tasks performed in an e-mail. Here, too, the goal was to be able to cluster the messages into a working (i.e., task-based) order, thus making it easier to manage them and reply to them [39]. Other works have also aimed at solving similar problems [40].
3.1.2. Two-Dimensional Information Clustering Approaches on Computers
Although folders can be a temporary solution to store documents in a more structured way, it can still be difficult to provide users with universal signals, based on which a stranger can find information with the same speed as the creator of that particular system.
Nowadays, people often use two monitors during their work because they obtain their information from several sources. In real life, this would correspond to someone opening several open books or several papers next to each other in some arrangement, but on a computer, it can still be a struggle to map this feature.
To some degree, the split screen provides a solution to this, and is often used in cases where certain information is needed together to solve a task. In this case, the monitor can display more than one document at the same time and keep it active for the user. In many cases, however, using a split screen can cause scale changes in a given document, which can make its use or interpretation difficult. In addition, without a special configuration, such layouts are generally temporary and need to be re-created again and again through extra effort.
If we look at the solutions of the two dominant operating systems for grouping applications on computers and how they are used, we come across similar solutions. Both Windows and Mac OS versions offer a view in which applications running parallel to each other are displayed to the user in smaller windows on one screen (e.g., Figure 1). This is certainly useful from the point of view that one can see how many content elements and how many types of documents are open in parallel, but it does not help the user in grouping them. It is possible to imagine that one would like to work on several tasks at the same time, each of which has some number of documents/applications. In addition, it is common for certain tasks to occupy people’s capacities for days, weeks, or even longer periods; thus, the content needed to solve them must be continuously available. Last but not least, document access needs are often contextual: for example, it may be the case that after working hours, the user might prefer to consume other types of content.
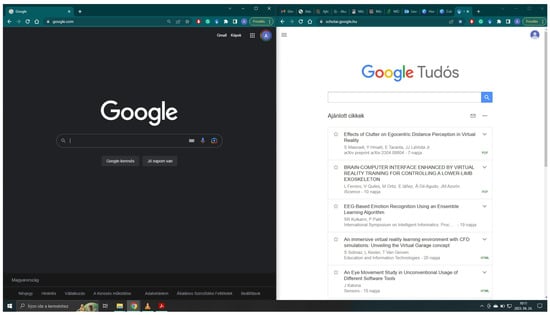
Figure 1.
Laptop screen with a split screen view on Windows OS.
As a solution to this, the major desktop operating systems came up with a new concept, which Windows calls “Virtual Desktop” and Apple calls “Spaces”. The essence of these is that the user can have several tables open simultaneously, such that they can easily switch between them. On the other hand, users are only allowed to change the order of these tables but cannot make any other layout changes (Figure 2).
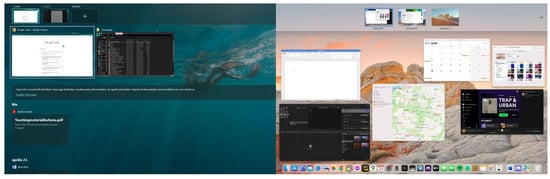
Figure 2.
The Windows virtual desktop and the Mac mission control and space view.
Although this solution is much closer to the organization strategies that occur in reality, it is still confined to the limits of 2D and can hardly communicate relative importance, or the order in which tasks need to be carried out through, e.g., differences in the size of individual content elements and their spatial arrangement.
3.2. Three-Dimensional Interfaces
PC and console games have already demonstrated the importance of spatial layout in processing, understanding, and recalling information. However, with the expansion of non-gaming uses of virtual reality, the question of what purposes such applications should serve has become even more relevant. Virtual reality mimics real life in many respects, but its significant advantage is that it can enhance it in many ways to help users tackle their everyday tasks. The Virtual Desktop VR application, introduced in 2016, offered an intriguing solution to the aforementioned information and document visualization and grouping issue by placing the user’s desktop within a fully immersive environment (https://www.vrdesktop.net/ (accessed on 24 April 2023)). This allows the user to fully utilize the available space, maximizing the sense of presence and accommodating more windows on a larger surface, in a way similar to the setup shown on Figure 3.
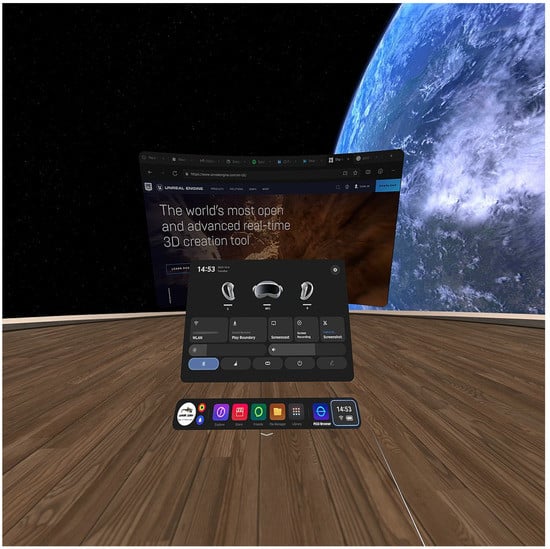
Figure 3.
Virtual desktop-like control panel as viewed on the Pico 4 headset. Source: https://en.wikipedia.org/wiki/PICO_4 (accessed on 24 April 2023)—License: Creative Commons Attribution-Share Alike 4.0 International.
In 2021, Meta released the Horizon Workrooms virtual office and meeting room application, which also works in immersive VR, and requires a headset, but is already suitable for collaboration. One can even work in a shared virtual office with their colleagues, thus facilitating cooperation during task-solving.
These solutions can already leverage the benefits provided by the virtual world by showcasing content within the context of a 3D environment featuring 3D objects, which can substantially aid user recall [41]. However, the head-mounted display itself presents significant limitations, such as inducing motion sickness in a considerable number of individuals, having a short battery life, and still being relatively expensive.
The advantages offered by virtual reality, without the limitations of VR headsets, are used by those applications that provide the opportunity to exchange information, work, study, organize events, etc., using traditional 2D content in desktop VR. Spatial (https://www.spatial.io/ (accessed on 24 April 2023)), a cooperative VR platform, allows 2D content, including documents, images, and videos, to be imported into virtual workspaces. In VRChat (https://hello.vrchat.com/ (accessed on 24 April 2023)), a social VR platform, users can bring 2D content such as images and videos into their virtual realm using the Media Player feature, while ENGAGE (https://engagevr.io/ (accessed on 24 April 2023)) allows for importing videos, websites, and documents through the WebBrowser feature. MaxWhere VR (https://maxwhere.com (accessed on 24 April 2023)) features smartboards that can be integrated into 3D spaces, capable of displaying any content type that a Chrome browser would support (PDFs, images, videos, audio files, local or remote web content).
The effectiveness of such type of VR applications compared to 2D applications has been examined from many aspects in the past years. Significant results in past studies have highlighted the ability of desktop VR to reduce cognitive burden [42,43,44,45] and improve information recall [46,47]. Desktop virtual realities also enhance digital information and content management [48,49,50,51] and can help the user with digital guidance solutions [52,53].
4. Free Spatial Arrangement Study
As discussed in the literature review, it has been shown in recent years that traditional 2D systems are beginning to outgrow the amount of information that humans and machines interact with. Three-dimensional systems have a much greater potential for information exchange and can serve increasing human needs. With increasing information pressure, users often prefer digital environments that allow them to increase the clarity of relationships among digital content and enable them to organize their content into groups not only hierarchically but also in a workflow-based order, and in persistent ways. Although platforms that enable this are increasingly available, in general, little guidance is provided to users as to how they might want to lay out their content in the 3D space. In particular, how real-life physical experiences and preferences influence users’ preferred choice of layout is not well understood, and as a result, they are rarely articulated through the design choices based on which 3D environments are created. In the study detailed in this section, we aim to fill in this gap.
Key questions of this study include: Do the layout conventions that users are accustomed to—based on their frequency of occurrence in real life—also manifest in virtual spaces? Are there differences in terms of the size in which users prefer to display content in VR, depending on the type of content (e.g., text-based, image or audio–visual), depending on the subject matter (with content focusing on the same topics go together), or depending on the geometry of the 3D space (such that e.g., text-based documents are placed on tables, while videos are placed on vertical surfaces)?
For example, if real-world physical environments are anything to go by, one might expect that:
- Videos would preferably be placed on large-sized screens, TV sets, or monitors, which are mostly vertical surfaces;
- PDF files would preferably either be placed on computer screens or on horizontal, flat surfaces such as tables—perhaps depending on the age group of the user, i.e., whether they conceive of PDF files as being consumed on electronic devices or as being closer to physical, printed documents
- PPT files would preferably be placed on large screens, as they are consumed on personal computers
- Images would preferably be placed on vertical, or close to vertically inclined surfaces, as pictures in real life are often hung on walls or placed on furniture.
While the above arrangements may seem reasonable from the starting point of physical reality, it is also possible that users may choose to exploit qualities of 3D virtual reality that result in the arrangement of content being less tethered to such physical metaphors. To find out which is the case and what kinds of novel interaction patterns users might choose to employ (if any), we carried out the experiment described in this section.
4.1. Experimental Design
To observe possible regularities based on which users prefer to organize their digital content in virtual environments, we created a 3D space in which participants were free to arrange a partially pre-defined set of digital documents, which they could freely complement with further materials of their choosing.
To carry out the experiment, we used a space in MaxWhere VR called “Ph.D. Student Room”. Once the test subjects familiarized themselves with the basic use of the platform and the architecture of the space, we gave them a set of “recommended” documents consisting of five images, three PDF files, three video files, and two PowerPoint files containing content on technology-related topics, mostly—but not exclusively—about augmented reality and virtual reality. The task was for subjects to arrange parts or all of this recommended content, along with other potential content they could freely choose from the Web, into the 3D space.
Our goal in allowing such a degree of freedom was to create an ecologically valid scenario, mimicking use cases where users could specify the content of their own 3D virtual space. In addition, the selection of recommended content on the topics of augmented reality and virtual reality was a natural choice, given that the experiment was carried out in a technological (VR) environment; in addition, the number of content elements were selected such that they would be not too large in number as to be difficult to grasp for users, while not too few in number, as to be insufficient for providing an overview of the topic at hand. At the same time, we emphasized to test subjects that these were merely recommended and not compulsory materials; hence, subjects’ choice of content—including their topic, layout and size—was not limited in any significant way.
Following the experiment, we analyzed the quantity, relative size, and spatial cohesiveness of the different document types. In terms of cohesiveness, we were curious to learn whether the organizing principle chosen by subjects was centered around the document types (e.g., images separately, PDFs separately, audio–visual content separately), around subject matter (content types on the same topic go together) or around 3D context (e.g., videos placed on monitors, PDFs placed on flat surfaces such as tables).
4.2. Key Hypotheses
Before conducting our experiment, we formulated the following key hypotheses:
- There is a difference in terms of the frequency with which test subjects prefer to add different content types to their spaces.
- There is a difference in terms of the size in which subjects prefer to display various content types.
- For at least some types of content, an interaction of the content type with certain 3D object types can be observed.
4.3. Materials and Methods
To carry out the experiment, we used the MaxWhere VR platform. MaxWhere is a desktop virtual reality platform that provides interactive 3D spaces capable of integrating not only 3D, but also 2D content (including PDFs, videos, images, and Web URLs organized into so-called smartboards in MaxWhere terminology). Depending on the configuration of any given space, some or all of its users are allowed to add or remove 2D content, as well as to modify the location, orientation and size of 2D content using the so-called “smartboard editor” feature. For more information, visit: https://www.maxwhere.com ( accessed on 24 April 2023).
The virtual space used in the experiment was the so-called “Ph.D. Student Room” (Figure 4). The space is an open construction on an island of sand surrounded by water. The building has two floors. On the ground floor, there are three interconnected rooms, with either no walls, or transparent (glass) walls between them, as follows:
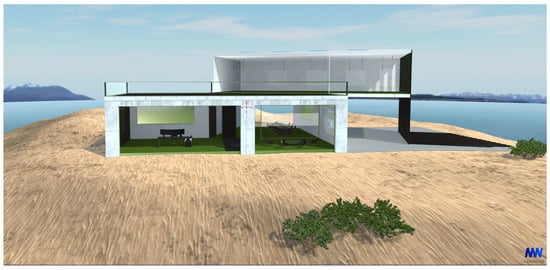
Figure 4.
Empty version of “Ph.D. Student Room” space used for the purposes of the experiment.
- The first of the three rooms has the appearance of a workroom, with a desk, a chair, and three monitors on the desk, as well as a projection screen and a large whiteboard.
- The adjacent lounge area has a few chairs with a coffee table and a large display on the wall.
- The last room looks like a meeting room or information center, with a large table that can be divided into 6 smaller sections. Each of the smaller sections has a chair and a table with a document holder placed on it and tilted at 45 degrees. On the wall, as in the workroom, there is a whiteboard.
On the upper floor, there is a large open terrace and a semi-open exhibition space on one side of the room, with five frames hanging from the ceiling.
At the beginning of the experiment, the virtual space did not contain any smartboards, all of them had to be placed in the space by the participant. The recommended documents given to the test subjects included five images, three PDF files, three videos, and two PowerPoint files, with the following content:
- Three PDFs:
- –
- Çöltekin, A. et al. (2020). “Extended reality in spatial sciences: A review of research challenges and future directions”. ISPRS International Journal of Geo-Information, 9(7), 439;
- –
- Jung, T. et al. (2016). “Effects of virtual reality and augmented reality on visitor experiences in museum”. In Information and Communication Technologies in Tourism 2016: Proceedings of the International Conference in Bilbao, Spain, 2–5, February 2016 (pp. 621–635). Springer International Publishing;
- –
- Morimoto, T. et al. (2022). “XR (extended reality: virtual reality, augmented reality, mixed reality) technology in spine medicine: status quo and quo vadis”. Journal of Clinical Medicine, 11(2), 470
- Two PPTs:
- –
- Future of Technology (from Canva templates);
- –
- Future of communications (from Canva templates);
- Three videos:
- –
- https://www.youtube.com/watch?v=I-EIVlHvHRM&t=1s&ab_channel=WIRED (accessed on 24 April 2023);
- –
- https://www.youtube.com/watch?v=WXuK6gekU1Y&ab_channel=DeepMind (accessed on 24 April 2023);
- –
- https://www.youtube.com/watch?v=XLP4YTpUpBI&t=9s&ab_channel=Simplilearn (accessed on 24 April 2023)
- Five images: shown in Figure 5.
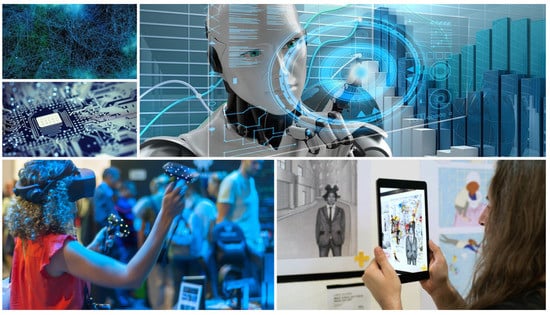 Figure 5. Five images included in the set of recommended content.
When solving the tasks, these materials were not presented to the subjects as mandatory items, but only as recommended content or a baseline. They could be varied with other complementary web and local digital content and could be discarded if not deemed necessary for the presentation of the topic, which focused on virtual reality, augmented reality, and mixed reality, but also included some tutorials on the use of artificial intelligence. All of the materials distributed were English-language materials.
4.4. Subjects and Preliminaries
A total of 32 subjects participated in the research voluntarily, with a gender split of 16 men and 16 women. The mean age was 28.594 (SD: 9.462). All participants were neurotypical English speakers and spoke English at least at an intermediate (B2) level. Thirty-one test subjects were native Hungarian speakers, and one test subject was a native Arabic speaker. All participants had 3D experience, through practice using the MaxWhere software (version 7.0.1) itself as well as in many cases from 3D games. Before the experiment, the MaxWhere platform was introduced to the test subjects, and it was made sure that they were comfortable using MaxWhere spaces prior to having them complete the main task. All of the data collected during the experiment were anonymized and used exclusively as input to the statistical analyses detailed in later parts of this paper.
4.5. Procedure
The measurement was carried out in MaxWhere, which was used either in face-to-face meetings or online by the subjects. In each case, a detailed presentation of the virtual space was given, with several resources provided to the participants.
In the first step, the experimenter demonstrated the virtual space, either in person, or via screen sharing. The experimenter also presented to subjects the task they needed to carry out, along with a video and photographs of the empty virtual space. The recommended documents were also presented in detail, together with a description of their content.
In a second step, participants went through a free layout creation exercise, where they had to choose any variety of 2D content they wanted, whether from the provided recommended documents, from the Web or from their own device. In all cases, test subjects were asked to remain within the same topics: virtual reality, artificial intelligence and their possibilities for collaboration. Participants were free to place the materials anywhere in the space; there were no restrictions on the number, position, orientation, or size of the content. There was also no time limit for carrying out the task.
To save the content, everyone created a separate project for themselves with a random nickname to ensure anonymity.
Once the content was arranged and saved, the data could be retrieved by the experimenter for further analysis.
4.6. Results
In this section, we provide an analysis of the recorded data from various angles.
Thirty-two participants’ preferences were measured in a free layout creation task, where they were able to display in a predefined virtual space as much content as they wanted from different content types. The list of possible content types included PDF files, videos, images, PowerPoint files, or any other Web-based content.
4.6.1. Frequency of Content Types
Figure 6 and Figure 7 show the results of a repeated measures ANOVA, which points to the conclusion that the number of instances in which the content types were displayed in the case of the different test subjects was significantly affected by the content types, . Since Mauchley’s test of sphericity was violated, the Greenhouse–Geisser correction was used. The Eta squared effect size ( ) also indicates that the effect of the type on the number of times each of the content types were employed was substantial.
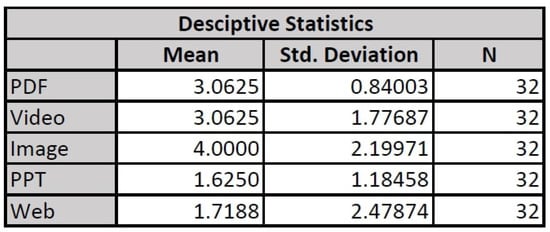
Figure 6.
Descriptive statistics of the repeated measures ANOVA—number of content types.
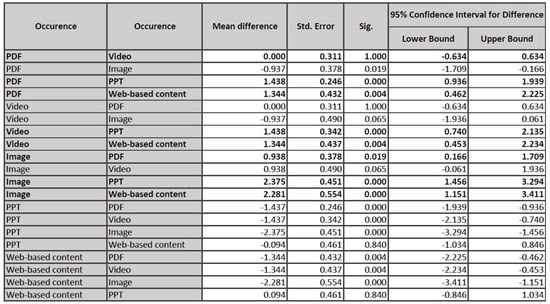
Figure 7.
Pairwise comparisons of the repeated measures ANOVA in the number of content types.
According to the pairwise comparisons, PDF documents were used significantly more often than PowerPoint files or any other Web-based content, and images were used significantly more often than PDF documents, PowerPoint files or any other Web-based content (Figure 6).
Figure 8 shows the distribution of the frequency of content types using a bar chart.
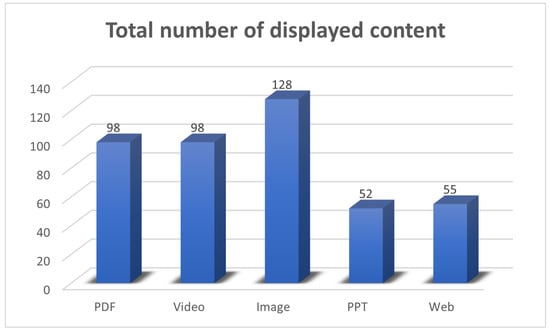
Figure 8.
The total number of times each given content type was used. We note that although in total, video content was added to the spaces as often as PDF files, the variance among users was such that only the distribution of the use of PDF files was statistically significantly greater than those of PowerPoint files, and Web-based content.
4.6.2. Scale of Content Types
Within the same research design, the preferred size of each content type was also analyzed. The content types were the same: PDF files, videos, images, PowerPoint files, and any other Web-based content. To compute the scale, we multiplied together the length (in centimeters) of the horizontal and vertical axes of the corresponding smartboards. Descriptive statistics of smartboard sizes can be seen in Figure 9.
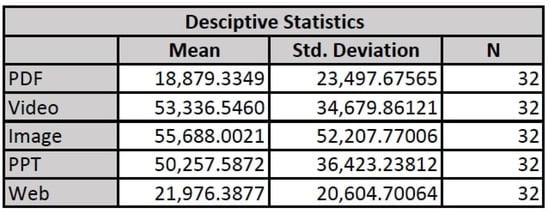
Figure 9.
Descriptive statistics of the repeated measures ANOVA—the size of the different content types.
Results of a repeated measures ANOVA show that the size of the displayed content from one group was significantly affected by the type of the group, . Since Mauchley’s test of sphericity was violated, the Greenhouse–Geisser correction was used. The Eta squared effect size ( ) also indicates that the effect of the type of content on smartboard size was substantial.
According to the pairwise comparisons, videos, images, and PowerPoint documents were displayed at a significantly larger size than PDF files and Web-based content; however, there were no significant differences between the former three types (Figure 10). We note that in cases where a test subject did not add a certain type of file format to their project at all, we set the size for that content type to the average of the sizes specified by all other test subjects. This was necessary to ensure that the number of samples was the same in all cases—a prerequisite for the ANOVA analysis.
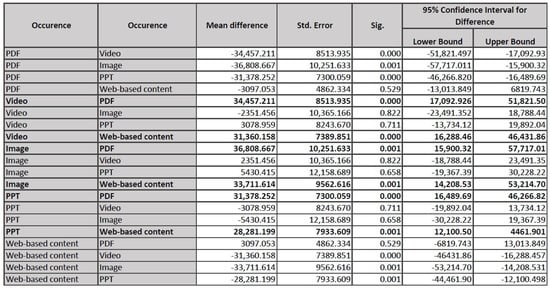
Figure 10.
Pairwise comparisons of the repeated measures ANOVA size of the different content types.
4.6.3. Relationships among Dimensions of Content Type, Content Subject, and 3D Context
Based on an analysis of the projects created by the test subjects, a preference between given content type and spatial object was observed in many cases.
As shown in Figure 11, the projector screen inside the space was used to display video and PowerPoint content three times as often as any of the other predefined types. Equally, the frames hanging from the ceiling were used to hold images much more often than any other type of content.
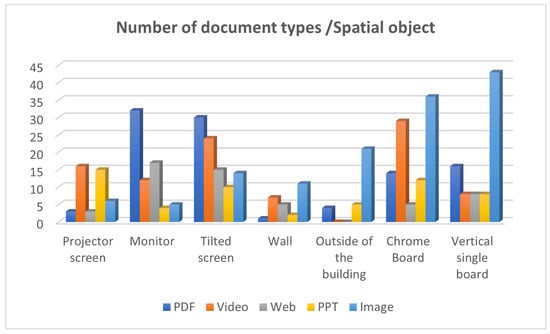
Figure 11.
The total number of document types used in different 3D contexts.
At the same time, our analysis also showed preferences among spatial objects as receptacles for smartboards in general. Thus, test subjects attached content (in general) more often to spatial objects such as tables, monitors, and projector screens than to any other type of object, including the wall itself.
Based on this observation, we distinguished between “object-dependent” and “object-free” placement of smartboards—with the latter referring to walls or other surfaces with no standalone existence—and characterized users based on their preference (in general) for one or the other category. Object-dependent users placed all or most of their content in close proximity to spatial objects (projector screen, monitors, display boards with standalone existence) inside the building, while object-free users placed most or all of their content on walls (often outside of the building) and sometimes even in mid-air.
Figure 12 shows that the split was relatively even among users in the object-dependent/object-free dimension. Figure 13 shows 7 examples object-dependent and object-independent locations in the space.
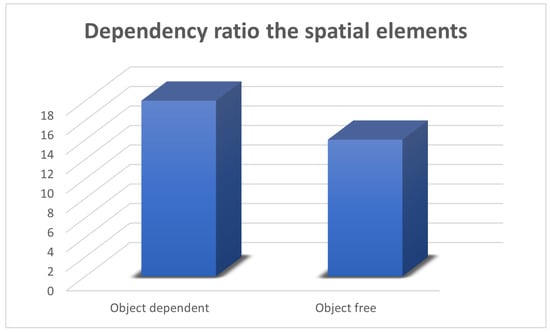
Figure 12.
The distribution of spatial object-dependent and spatial object-free users.
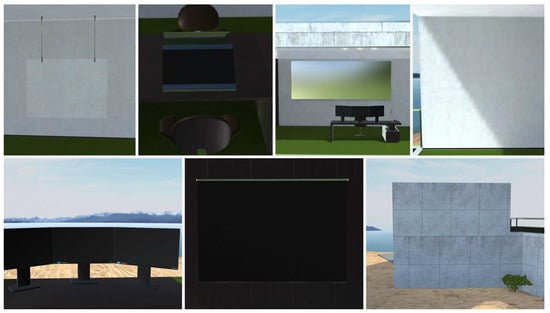
Figure 13.
Examples of object-dependent and object-free locations within the 3D space. The first three examples in the top row and the first two in the bottom row are examples of hanging frames, monitors, and projector screens, which are 3D objects with a “standalone existence”. The walls on the inside and outside of the building with no descriptive features qualify as object-free locations.
Finally, we examined the patterns with which users preferred to arrange the content, and identified three alternatives:
- In the “content case”, content types that had a similar subject matter were most likely to be arranged in clusters, in close proximity to each other;
- In the “type case”, similar content types were most likely to be arranged in clusters, close to each other;
- Finally, in the “mixed case”, a combination of these two approaches was used.
Figure 14 shows the number of users, out of the 32, belonging to each of the three categories.
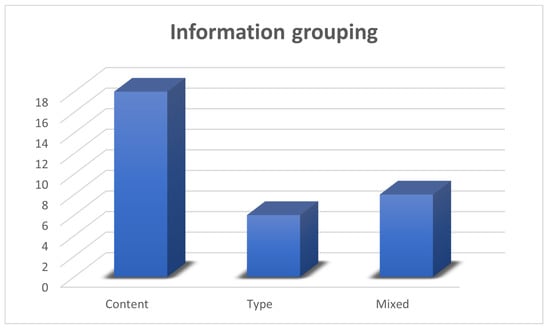
Figure 14.
Distribution of users among the “content”, “type” and “mixed” content arrangement categories. “Content” users created smartboard clusters with content about the same or similar subject matter. “Type” users created smartboard clusters such that different file formats were clustered together. “Mixed” users employed a combination of these strategies.
5. Discussion
Based on the results, we return to our original hypotheses to determine whether or not they were confirmed.
5.1. Differences in Terms of the Relative Frequency of Content Types
The results obtained from the experiment supported the hypothesis according to which a significant difference would be detected in the occurrence of certain content types within any given project.
The task of the participants was to present a topic in a 3D desktop virtual space, for which they could use a pre-designed virtual space and fill it freely with digital content. We defined five types of content: PDF files, videos, images, PowerPoint files, and Web-based URLs. We gave the participants sample content from each of these types, which they could use if they wanted, but this was not mandatory, i.e., they could search for their own content as well and display it in the space.
The analysis of the data showed that significantly more images were laid out in the virtual space than PDF files, PowerPoint files, or Web content; however, the difference between video content and images was not significant, as both were displayed in high numbers in the space.
The second most common type of content was PDF files, which were also added to the space significantly more often than PowerPoint files or Web content.
The prevalence of images can be explained, on the one hand, by the use of non-figurative images that served to “decorate” the plain concrete building—a behavior that was observed in multiple cases. At the same time, audio–visual content is often perceived as easier for laypeople to consume, which may also be an explaining factor for the relative popularity of images.
To determine whether the proportion of the information grouping preferences was equal between the three groups (content, type, mixed) a chi-square goodness of fit test was performed. The proportion differed by the users’ preferences (X2 = 7750, df = 2, p = 0.021).
5.2. Differences in Terms of the Relative Size of Content Types
Differences in the display sizes generally utilized for each of the content types also showed a significant result in the case of certain content types, which confirmed our second hypothesis.
In particular, PDF files and Web-based content were significantly smaller in size, overall, than the sizes of smartboards containing images, videos, and PowerPoint files. At the same time, no significant differences could be detected between the sizes of the latter three types of content.
These results support the assumption that users’ preferences for content display in the virtual world reflects to a large degree the patterns existing in real life. In the case of videos, PPTs and images, we are usually used to the fact that these content types appear in front of us in a very large size, and their interpretability, richness of detail, and immersion in their content come into play when their size is large enough.
In our research, we saw a confirmation of this. Importantly, even though the size of the space was limited and one of the most common content types added to the space was video content, ample space was still dedicated by the test subjects to smartboards displaying such content.
In the case of PDFs and Web content, we assume that users are accustomed to reading and interpreting such content on smaller devices. These are typically text-based documents that rarely appear on large surfaces in real life.
5.3. Interactions between Subject Matter, Content Type and 3D Context
Perhaps the most interesting hypothesis in this paper is our third hypothesis, stating that for at least some types of content, an interaction of the content type with certain 3D object types would be observed.
We were able to confirm this hypothesis, with room for some interesting observations.
Several salient spatial objects were present in the 3D space we used for this experiment. In an overwhelming majority of cases, content that was semantically linked to the object type was placed on any given object, whether they were, e.g., monitors (PDF files, Web-based content), projection screens (videos, PPT files), tilted screens (PDF files, videos), or vertical boards/panels (images). The most prominent of these was the projector projection screen, of which two were available in the space. In a significant proportion of cases, either a video or PowerPoint file was added to the screen.
This also confirms the previously described theory, according to which, during the free furnishing of the virtual space, if there are spatial elements well known to the users, then the virtual space is arranged based on their own experiences in real life. Since this type of content is usually displayed on these projectors in reality as well, our assumption is confirmed. On the monitor placed on the virtual desk, PDF-type, textual content appeared more than twice as often as anything else, and almost only images appeared on the external wall of the building, whereas the occurrence of other content is negligible on this latter surface.
A further highly notable aspect of the study pertains to the placement and orientation of content within the virtual environment. Despite the availability of horizontal surfaces for users to position the content, not a single instance of this occurred among the numerous content placements. Each user opted to place their content vertically or, in accordance with the spatial elements provided, at an approximate 45-degree angle. This can likely be attributed to the fact that, even in our everyday lives, we seldom position informational content on horizontal surfaces. The possibilities afforded by virtual environments can enhance the fulfillment of needs that are challenging to achieve in the physical world, such as a sizable board on which one can freely arrange content vertically to facilitate a clearer understanding of both the content itself and the relationships among the various components.
Finally, our prior research was corroborated [45], as the majority of users independently categorized the boards and their associated content into groups without any explicit guidance. This was performed to enhance the visibility of the topic presented and to ensure that adjacent documents provided supplementary information to the observer. Moreover, in six instances, users organized content based on the type of documents (e.g., video, PowerPoint) rather than their subject matter. Participants in the third, most-preferred group typically arranged the documents spatially according to content, yet within each specific area, the primary organizing principle was the type of content.
In addition to the findings, the study suggests key insights based on which a general design principle can be formulated to provide users with increased freedom in virtual reality while mitigating the restrictions commonly faced in real life. Specifically, if users are unable to freely modify the type and number of spatial elements, such as tables, monitors, or projection screens, they may encounter limitations that hinder the flexible organization of content.
This was evident in the study as participants showed a preference for content-oriented arrangements, whereas the ample availability of tables and monitor screens often caused them to gravitate toward content-type-specific usage. Moreover, the inherent size and orientation of such objects imposed constraints on the location and quantity (i.e., spatial distribution) of content elements, leading to sub-optimal solutions when there were an insufficient number of suitable objects available, or when there was insufficient room in their surroundings, making it challenging to place other types of content nearby. Conversely, when a large billboard was mounted on a wall, participants were often able to utilize the space more freely and accommodate a wider variety of content types.
Based on these observations, a tradeoff exists between the utilization of concrete, semantically charged objects and the availability of adaptable space. When incorporating semantically charged objects, it is advisable to ensure sufficient surrounding space to allow for the free arrangement of content types that differ from those dictated by the objects themselves.
6. Conclusions
In this paper, we examined how users prefer to arrange digital content in 3D virtual environments when given a free hand in creating their own content layouts, depending on the subject matter, the format of the content (e.g., text-based, image, or audio–visual) and the 3D objects within the space.
Results have demonstrated that in keeping with 3D spatial metaphors in physical reality, users most often aim to group together content elements that pertain to the same subject matter, prefer to combine written documents with audio–visual content, and have definite preferences in terms of the sizes of different content types, to the advantage of audiovisual content and presentations, which were more likely to be presented on larger displays. At the same time, the experiment also demonstrated that in some ways, users also expect to surpass the limitations of physical reality in VR. As a case in point, we have uncovered a certain tension between the availability of semantically loaded 3D objects, which entail a certain kind of functionality, and the spatial constraints or limitations any specific arrangement of such objects can engender. Thus, we have formulated a general principle, recommending that spaces be designed such that they provide ample space surrounding such “semantically charged” objects for the incorporation of a variety of content modalities.
The findings of this study can serve as a guide for the development of future virtual spaces, by offering principles by which spatial objects can be designed and arranged to better suit subsequently created layouts of 2D content, as well as by supporting the creation of such layouts in a more principled way. The operation of future innovative solutions that leverage artificial intelligence capabilities, offering users automated content organization and document structure, can also be informed at least in part by this research. Moving forward, it would be beneficial to expand the research to include a larger number of subjects and assess the differences between the document types examined here, their size, and their relationship with spatial elements in a broader range of virtual spaces and through a broader range of (immersive, non-immersive) modalities. This can be expected to offer a more refined picture of the scope of the principles identified in this work.
Author Contributions
Conceptualization, A.S. and Á.B.C.; Methodology, A.S.; Software, Á.B.C.; Validation, A.S. and Á.B.C.; Writing—original draft preparation, A.S. and Á.B.C.; Writing—review and editing, A.S. and Á.B.C. All authors have read and agreed to the published version of the manuscript.
Funding
This research received no external funding.
Informed Consent Statement
Informed consent was obtained from all subjects involved in the study.
Data Availability Statement
If contacted with a similar request, we will share the data of this research (in anonymized form) with fellow researchers.
Acknowledgments
The research presented in this paper was supported by the ELKH-SZE Research Group for Cognitive Mapping of Decision Support Systems.
Conflicts of Interest
The authors declare no conflict of interest.
References
- Laurell, C.; Sandström, C.; Berthold, A.; Larsson, D. Exploring barriers to adoption of Virtual Reality through Social Media Analytics and Machine Learning—An assessment of technology, network, price and trialability. J. Bus. Res. 2019, 100, 469–474. [Google Scholar] [CrossRef]
- IDC. IDC Spending Guide Forecasts Strong Growth for Augmented and Virtual Reality. 2022. Available online: https://www.idc.com/getdoc.jsp?containerId=prUS49916122 (accessed on 24 April 2023).
- Lanier, J.; Biocca, F. An insider’s view of the future of virtual reality. J. Commun. 1992, 42, 150–172. [Google Scholar] [CrossRef]
- Dalgarno, B.; Hedberg, J.; Harper, B. The contribution of 3D environments to conceptual understanding. In Proceedings of the 19th Annual Conference of the Australasian Society for Computers in Learning in Tertiary Education, Winds of Change in the Sea of Learning, Auckland, New Zealand, 8–11 December 2002; UNITEC Institute of Technology: Auckland, New Zealand, 2002; pp. 1–10. [Google Scholar]
- Radianti, J.; Majchrzak, T.A.; Fromm, J.; Wohlgenannt, I. A systematic review of immersive virtual reality applications for higher education: Design elements, lessons learned, and research agenda. Comput. Educ. 2020, 147, 103778. [Google Scholar] [CrossRef]
- Villena-Taranilla, R.; Tirado-Olivares, S.; Cózar-Gutiérrez, R.; González-Calero, J.A. Effects of virtual reality on learning outcomes in K-6 education: A meta-analysis. Educ. Res. Rev. 2022, 35, 100434. [Google Scholar] [CrossRef]
- van der Kruk, S.R.; Zielinski, R.; MacDougall, H.; Hughes-Barton, D.; Gunn, K.M. Virtual reality as a patient education tool in healthcare: A scoping review. Patient Educ. Couns. 2022, 105, 1928–1942. [Google Scholar] [CrossRef]
- Venkatesan, M.; Mohan, H.; Ryan, J.R.; Schürch, C.M.; Nolan, G.P.; Frakes, D.H.; Coskun, A.F. Virtual and augmented reality for biomedical applications. Cell Rep. Med. 2021, 2, 100348. [Google Scholar] [CrossRef]
- Geraets, C.N.; van der Stouwe, E.C.; Pot-Kolder, R.; Veling, W. Advances in immersive virtual reality interventions for mental disorders: A new reality? Curr. Opin. Psychol. 2021, 41, 40–45. [Google Scholar] [CrossRef]
- Vayssiere, P.; Constanthin, P.E.; Herbelin, B.; Blanke, O.; Schaller, K.; Bijlenga, P. Application of virtual reality in neurosurgery: Patient missing. A systematic review. J. Clin. Neurosci. 2022, 95, 55–62. [Google Scholar] [CrossRef]
- Idi, D.B.; Khaidzir, K.A.M. Critical perspective of design collaboration: A review. Front. Archit. Res. 2018, 7, 544–560. [Google Scholar] [CrossRef]
- Dianatfar, M.; Latokartano, J.; Lanz, M. Review on existing VR/AR solutions in human–robot collaboration. Procedia CIRP 2021, 97, 407–411. [Google Scholar] [CrossRef]
- Delgado, J.M.D.; Oyedele, L.; Demian, P.; Beach, T. A research agenda for augmented and virtual reality in architecture, engineering and construction. Adv. Eng. Inform. 2020, 45, 101122. [Google Scholar] [CrossRef]
- Guo, Z.; Zhou, D.; Zhou, Q.; Zhang, X.; Geng, J.; Zeng, S.; Lv, C.; Hao, A. Applications of virtual reality in maintenance during the industrial product lifecycle: A systematic review. J. Manuf. Syst. 2020, 56, 525–538. [Google Scholar] [CrossRef]
- Firu, A.C.; Tapîrdea, A.I.; Feier, A.I.; Drăghici, G. Virtual reality in the automotive field in industry 4.0. Mater. Today Proc. 2021, 45, 4177–4182. [Google Scholar] [CrossRef]
- Wertheimer, M. Gestalt theory. In A Source Book of GESTALT Psychology; Ellis, W.D., Ed.; Kegan Paul, Trench, Trubner & Company: London, UK, 1938. [Google Scholar]
- Koffka, K. Principles of Gestalt Psychology; Routledge: Oxfordshire, UK, 2013; Volume 44. [Google Scholar]
- Kohler, W. The Mentality of Apes; Routledge: Oxfordshire, UK, 2018. [Google Scholar]
- Arnheim, R. Visual Thinking; University of California Press: Oakland, CA, USA, 1997. [Google Scholar]
- Rock, I. The Logic of Perception; MIT Press: Cambridge, UK, 1983. [Google Scholar]
- Palmer, S.E. Common region: A new principle of perceptual grouping. Cogn. Psychol. 1992, 24, 436–447. [Google Scholar] [CrossRef] [PubMed]
- Michotte, A. The Perception of Causality; Routledge: Oxfordshire, UK, 2017; Volume 21. [Google Scholar]
- Pedersen, D.M. Dimensions of environmental competence. J. Environ. Psychol. 1999, 19, 303–308. [Google Scholar] [CrossRef]
- Steele, F. Defining and developing environmental competence. Adv. Exp. Soc. Process. 1980, 2, 225–244. [Google Scholar]
- Tversky, B. Structures of mental spaces: How people think about space. Environ. Behav. 2003, 35, 66–80. [Google Scholar] [CrossRef]
- Tversky, B. Cognitive maps, cognitive collages, and spatial mental models. In Proceedings of the Spatial Information Theory A Theoretical Basis for GIS: European Conference, COSIT’93 Marciana Marina, Elba Island, Italy, 19–22 September 1993; Springer: Berlin, Germany, 2005; pp. 14–24. [Google Scholar]
- Gobet, F.; Lane, P.C.; Croker, S.; Cheng, P.C.; Jones, G.; Oliver, I.; Pine, J.M. Chunking mechanisms in human learning. Trends Cogn. Sci. 2001, 5, 236–243. [Google Scholar] [CrossRef] [PubMed]
- Alamia, A.; Solopchuk, O.; d’Ausilio, A.; Van Bever, V.; Fadiga, L.; Olivier, E.; Zénon, A. Disruption of Broca’s area alters higher-order chunking processing during perceptual sequence learning. J. Cogn. Neurosci. 2016, 28, 402–417. [Google Scholar] [CrossRef]
- Bor, D.; Duncan, J.; Wiseman, R.J.; Owen, A.M. Encoding strategies dissociate prefrontal activity from working memory demand. Neuron 2003, 37, 361–367. [Google Scholar] [CrossRef]
- Sakai, K.; Kitaguchi, K.; Hikosaka, O. Chunking during human visuomotor sequence learning. Exp. Brain Res. 2003, 152, 229–242. [Google Scholar] [CrossRef] [PubMed]
- Rosenbaum, D.A.; Kenny, S.B.; Derr, M.A. Hierarchical control of rapid movement sequences. J. Exp. Psychol. Hum. Percept. Perform. 1983, 9, 86. [Google Scholar] [CrossRef]
- Baddeley, A. Working memory. Science 1992, 255, 556–559. [Google Scholar] [CrossRef] [PubMed]
- Koch, I.; Hoffmann, J. Patterns, chunks, and hierarchies in serial reaction-time tasks. Psychol. Res. 2000, 63, 22–35. [Google Scholar] [CrossRef] [PubMed]
- Pirolli, P.; Card, S. Information foraging. Psychol. Rev. 1999, 106, 643. [Google Scholar] [CrossRef]
- Pan, B.; Hembrooke, H.; Gay, G.; Gonsalves, G.C. Bridging the gap: A conceptual model of the access of digital libraries. J. Digit. Inf. 2006, 7, 1–24. [Google Scholar]
- Bergman, O.; Gradovitch, N.; Bar-Ilan, J.; Beyth-Marom, R. Folder versus tag preference in personal information management. J. Am. Soc. Inf. Sci. Technol. 2013, 64, 1995–2012. [Google Scholar] [CrossRef]
- Dinneen, J.D.; Julien, C.A. The ubiquitous digital file: A review of file management research. J. Assoc. Inf. Sci. Technol. 2020, 71, E1–E32. [Google Scholar] [CrossRef]
- Whittaker, S.; Massey, C. Mood and personal information management: How we feel influences how we organize our information. Pers. Ubiquitous Comput. 2020, 24, 695–707. [Google Scholar] [CrossRef]
- Gwizdka, J. TaskView: Design and evaluation of a task-based email interface. In Proceedings of the 2002 Conference of the IBM Centre of Advanced Studies on Collaborative Research (CASCON), Markham, ON, Canada, 30 September–3 October 2002. [Google Scholar]
- Bomsdorf, B. First steps towards task-related web user interfaces. In Proceedings of the Computer-Aided Design of User Interfaces III: Proceedings of the Fourth International Conference on Computer-Aided Design of User Interfaces, Valenciennes, France, 15–17 May 2002; Springer: Berlin, Germany, 2002; pp. 349–356. [Google Scholar]
- Csapó, Á.B.; Horvath, I.; Galambos, P.; Baranyi, P. VR as a medium of communication: From memory palaces to comprehensive memory management. In Proceedings of the 2018 9th IEEE International Conference on Cognitive Infocommunications (CogInfoCom), Budapest, Hungary, 22–24 August 2018; IEEE: New York, NY, USA, 2018; pp. 389–394. [Google Scholar]
- Lampert, B.; Pongrácz, A.; Sipos, J.; Vehrer, A.; Horvath, I. MaxWhere VR-learning improves effectiveness over clasiccal tools of e-learning. Acta Polytech. Hung. 2018, 15, 125–147. [Google Scholar]
- Horváth, I.; Sudár, A. Factors contributing to the enhanced performance of the maxwhere 3d vr platform in the distribution of digital information. Acta Polytech. Hung. 2018, 15, 149–173. [Google Scholar]
- Horváth, I. MaxWhere 3D capabilities contributing to the enhanced efficiency of the Trello 2D management software. Acta Polytech. Hung. 2019, 16, 55–71. [Google Scholar]
- Sudár, A.; Csapó, Á.B. Descriptive Markers for the Cognitive Profiling of Desktop 3D Spaces. Electronics 2023, 12, 448. [Google Scholar] [CrossRef]
- Berki, B. 2d advertising in 3d virtual spaces. Acta Polytech. Hung. 2018, 15, 175–190. [Google Scholar]
- Berki, B. Desktop vr and the use of supplementary visual information. In Proceedings of the 2018 9th IEEE International Conference on Cognitive Infocommunications (CogInfoCom), Budapest, Hungary, 22–24 August 2018; IEEE: New York, NY, USA, 2018; pp. 333–336. [Google Scholar]
- Setti, T.; Csapo, A.B. A Canonical Set of Operations for Editing Dashboard Layouts in Virtual Reality. Front. Comput. Sci. 2021, 3, 659600. [Google Scholar] [CrossRef]
- Krokos, E.; Plaisant, C.; Varshney, A. Virtual memory palaces: Immersion aids recall. Virtual Real. 2019, 23, 1–15. [Google Scholar] [CrossRef]
- Setti, T.; Csapó, Á.B. Quantifying the Effectiveness of Project-Based Editing Operations in Virtual Reality. In Proceedings of the 2022 1st IEEE International Conference on Cognitive Aspects of Virtual Reality (CVR), Budapest, Hungary, 11–12 May 2022; IEEE: New York, NY, USA, 2022; pp. 49–54. [Google Scholar]
- Galambos, P.; Weidig, C.; Baranyi, P.; Aurich, J.C.; Hamann, B.; Kreylos, O. Virca net: A case study for collaboration in shared virtual space. In Proceedings of the 2012 IEEE 3rd International Conference on Cognitive Infocommunications (CogInfoCom), Kosice, Slovakia, 2–5 December 2012; IEEE: New York, NY, USA, 2012; pp. 273–277. [Google Scholar]
- Sudár, A.; Csapó, Á. Interaction Patterns of Spatial Navigation and Smartboard Use in VR Workspaces. In Accentuated Innovations in Cognitive Info-Communication; Springer: Berlin, Germany, 2023; pp. 149–166. [Google Scholar]
- Sudár, A.; Csapó, A. An MCMC-Based Method for Clustering Display Panels with the Goal of Generating Navigation Paths in 3D. In Proceedings of the 2021 12th IEEE International Conference on Cognitive Infocommunications (CogInfoCom), Online, 23–25 September 2021; IEEE: New York, NY, USA, 2021; pp. 1009–1014. [Google Scholar]
Disclaimer/Publisher’s Note: The statements, opinions and data contained in all publications are solely those of the individual author(s) and contributor(s) and not of MDPI and/or the editor(s). MDPI and/or the editor(s) disclaim responsibility for any injury to people or property resulting from any ideas, methods, instructions or products referred to in the content. |
© 2023 by the authors. Licensee MDPI, Basel, Switzerland. This article is an open access article distributed under the terms and conditions of the Creative Commons Attribution (CC BY) license (https://creativecommons.org/licenses/by/4.0/).