Abstract
Recently, there has been a huge spike in the number of automobiles in the urban areas of many countries, particularly in India. The number of vehicles are increasing rapidly and with the existing infrastructure, the traffic systems stand still during peak hours. Some of the main challenges for traffic management are the movement of overloaded vehicles beyond their restricted zone and time, reckless driving, and overlooking road safety rules. This paper proposes an Internet of Things (IoT)-based real-time Intelligent Traffic Signal System (ITSS), which consists of inductive loops and a programmable micro-controller to determine traffic density. Inter-communication in the centralized control unit sets the timer of the traffic light and synchronizes with the traffic density in real-time for smooth mobility of vehicles with less delay. Additionally, to prioritize emergency vehicles over other vehicles in the same lane, a pre-emption mechanism has been integrated through infrared sensors. The result of traffic density determines the timer of the light post in real-time, which in result enhances the smooth flow of vehicles with reduced delay for travelers. Using its automatic on-demand traffic signaling system, the presented solution has advantages over fixed systems.
1. Introduction
Due to expanding population and industries in urban areas, traffic management has become a challenging task for many cities worldwide particularly in India. According to a report from 2016 [1], around 53,700 vehicles were registered in India every day, which consequently led to increased traffic congestion problems. As more people travel to work, and vice versa, within or across their cities, many urban cities suffer from traffic congestion problems and this keeps on increasing. There are many factors responsible for creating congestion in urban areas [2]. Traffic congestion can be characterized as either recurring or nonrecurring. Recurring congestion occurs daily, and the main reason is the excessive number of vehicles, usually during peak hours, while nonrecurring congestion happens due to unpredictable events (such as weather, work zones, incidents, strikes, and special events) [3]. This shows that several problems are associated for the delay of vehicle movements and one of them is improper management of traffic signal systems [4].
Due to improper management of the situation several problems crop up such as traffic congestion, rule breaking, and long waiting times for vehicles, which has been discussed by [5], resulting in a waste of money, time, and fuel. A dynamic traffic control system can be designed, developed, and used to help clear traffic efficiently and avoid such problems. Intelligence and automation could be applied during the system’s design to enhance the throughput of vehicles passing through each road and junction safely. Some approaches suggest advanced and integrated solutions for traffic signals and control in the literature. For example, the authors in [6] presented an intelligent traffic video surveillance and accident detection system that utilizes extended machine learning techniques (support vector machines merged with a Kalman filter) for vehicle tracking. An integrated traffic signal/control system addresses traffic components such as drivers, pedestrians, and vehicles. A potential solution should consider the traffic system as a whole to avoid traffic congestion issues and prevent unsafe situations at junctions and also manage the arrival of emergency vehicles such as fire brigades and ambulances. According to [7], a traffic signal system needs to be robust so that human intervention should not be required from any side of lanes to detect the route of a vehicle. Use of traffic lights and vehicle movement can be interrelated to find a proper solution for smooth management of traffic signal systems.
In a traditional traffic signal system, the fixed allocation of time slots for the transition of lights may create many problems in regulating different types of vehicles [8], as it does not support real-time traffic monitoring. Traffic signal systems that implement fixed delays may generate heavy traffic congestion and waste time and energy for vehicles waiting for their turn even if no other vehicles are passing from the other end of the road [9]. Most existing traffic signal/control systems do not consider the occurrence of accidents, road works, and car failures, which all result in traffic jams and make the traffic congestion conditions even worse [10].
Different solutions were suggested for synchronous traffic monitoring systems [11]. However, highway lanes are not similar to local lanes on the basis of their usage. Thus, models need to be designed for a generalized traffic signal system, which can address the issues of local as well as highway traffic signal systems [12]. Thus, through our research work, we have proposed a model that considers all shortfalls of the existing models and estimates better performances at uncontrolled four-lane intersections under heterogeneous vehicular traffic conditions [13]. Considering the drawbacks of existing traffic monitoring systems, an Internet of Things (IoT)-based real-time Intelligent Traffic Signal System (ITSS) is presented in this paper. This ITSS utilizes the process of inductive loops and a programmable micro-controller to determine the traffic density. Real-time monitoring with a low error rate helps to improve vehicular traffic flow. The significant contributions of the paper are as follows:
- The suggested solution supports inter-communication in the control units to set the timer of the traffic light for synchronization with the real-time traffic density. Integrating a pre-emption mechanism ensures the prioritization of emergency vehicles over other vehicles in the same lane through infrared sensors.
- An experiment was carried out using IoT and a cloud-based platform to improve the system performance and analysis using device-to-device connectivity.
- The presented system has also been used to enhance the continuous flow of vehicles by reducing the delay of travelers. The proposed solution has advantages over fixed traffic signaling systems due to its automatic on-demand timer.
- The ITSS presented in the paper can be used for investigating the effectiveness of various traffic parameters, which have been optimized specifically to achieve efficiency and scalability.
- The system has been tested for its effective real-time data collection and analysis by using multiple traffic simulation scenarios, to reduce errors irrespective of any geographical location.
The rest of the paper is organized as follows. The study regarding existing solutions in the same field proposed in the literature is presented in Section 2. The ITSS architecture modeling and design are explained in Section 3. In Section 4, the algorithms of the ITSS are presented, whereas in Section 5, the network building and the traffic control by using the proposed ITSS are presented. The experimental results are discussed in Section 6 by considering multiple parameters. Finally, in Section 7, the performance of the ITSS is discussed as well as the paper’s conclusions and future scope.
2. Related Work
Considering different issues in traffic monitoring, this section provides a summary of various approaches with an emphasis on technologies used to resolve the relevant problems. Various traffic monitoring approaches have been proposed, using infrared sensors, magnetic loop sensors, LIght Detection And Ranging (LIDAR), image processing, video processing, piezo device, Light-Dependent Resistors (LDR sensors), and other types of sensors [14]. This section outlines the state-of-the-art in intelligent traffic control systems by detailing various approaches that have been used with their limitations. Each approach has been analyzed by considering factors such as adaptability, scalability, and ability for real-time control.
Through a smart traffic control system, the authors in [15] have explained the idea of controlling traffic flow using infrared sensors installed on the road dividers to detect vehicles. This approach uses three modes of lighting transition slots: the normal mode, the traffic jam mode, and the soft traffic mode. By monitoring the traffic density via infrared sensors, the lighting transition slots can be adapted accordingly. This system also provides a solution for managing a stuck emergency vehicle by incrementing the green light time slot after detecting such a case using the infrared sensor. In particular, the system includes a portable controller for emergency vehicles stuck in traffic. Using an XBee wireless system, the portable controller can trigger the traffic master controller to emergency mode until the emergency vehicle traverses the junction.
Using video surveillance-based traffic control mechanisms, the work in [16] presented that cameras at junctions can be utilized to record live videos on which background differentiation and morphological operations are carried out for the detection and identification of vehicles. This system also processes multiple signals from various sensors to measure several maneuvers, such as the speed changing rate, the number of times the wheel is spun, and the steering angle. However, in the vehicles detection process applied in this system, it was found that they missed smaller vehicles in cases they were behind larger ones. In [17], the authors studied many articles that suggested different intelligent traffic systems methodologies in smart cities. They have proposed an IoT-based Intelligent Transportation System (ITS) for a typical Indian subcontinent city (Chennai). This ITS processes multiple sensor data and applies various big data analytics methods (such as logistic regression, multiple regression analysis, and cluster-based analysis) to perform location tracking of vehicles, monitor vehicles motion, and determine the traffic density.
Another work suggested an IoT-based cloud-centric system for traffic flow and time-optimized vehicle prediction [18]. This system comprises three components, namely user, cloud, and action. In the user component, an IoT platform is responsible for gathering mobility data of vehicles. The cloud component provides the storage and computing power to store the data gathered. The action component performs all data analytics and displays analytics results to various stakeholders at the user subsystem. The system performs traffic inflow prediction and smart navigation of vehicles to avoid long waiting queues and congestion at intersections. The traffic inflow and statistical acknowledgments are predicted using a baseline classifier. Light-emitting diode technology for a traffic light, which can be improved where the light code of a vehicle can be detected by using the sensor, was used in [19]. For emergency vehicles, the signal sequences are used to select the green light of the corresponding lane as soon as possible. The automated time intervals are used for ON and OFF operations, which may create starvation while processing the same light code by multiple vehicles.
By creating a sensor network, magnetic loops were utilized in [20] to detect the length and sequences of lights used for traffic control. This system aims to detect the vehicle and signal the green light using a loop detector and prioritization of the vehicle and a mechanism to combine VANet with cloud storage and give balanced access to network resources to all vehicles as well as for support decision making. They have used the Internet of Vehicles (IoV) to facilitate security during real-time communication. The system uniquely recognizes the vehicles by applying pattern recognition techniques during communication using IoV. This system implemented a pattern-matching procedure for vehicle detection and classification based on a decision tree classification method. Mobile applications have been presented in [21,22], which can send automatic notifications to drivers regarding the precise location of accidents or possible traffic congestion at the nearest traffic junction to reduce traffic congestion.
The approach presented in [23] implemented a cloud-based VANET (Vehicular Ad Hoc NETwork) where vehicles in the network can share network resources and collect information for making decisions. An IoV application management system on the cloud-based VANET is used to perform intelligent and dynamic traffic management, which facilitates the detection of available vehicles in real-time and also considers traffic congestion, road works, accidents, etc. The approach presented in [24] discussed the implementation of three different sensing units divided into two classes of sensors. This approach accepts input using an infrared-based camera as well as a sequence of LIDAR (LIght Detection And Ranging) sensors. This system provides various reports as output, such as the number of vehicles passed, the average speed of the vehicles, and the classification of the vehicles based on their size. Each sensor uses different mechanisms to provide better service for traffic monitoring when multiple vehicles in parallel pass through a junction, but in real-time, both the operation cost of this system and its maintenance cost could be high.
In addition, researchers have applied metaheuristic techniques for signal timing optimization as one of the practical solutions to enhance the performance of the transportation networks [25]. The authors in [26] present a comprehensive survey of techniques and tools used in the optimization of signals in transportation networks. Another study aimed to develop a multi-objective intelligent traffic control protocol based on the non-dominated sorting genetic algorithm II (NSGA-II) at isolated signalized intersections in the city of Dhahran, Kingdom of Saudi Arabia [27]. A novel multi-objective signal timing optimization model with goals of per capita delay, vehicle emissions, and intersection capacity was proposed in [28], where a metaheuristic algorithm combining a difference operator, which is based on the particle swarm optimization algorithm, was developed.
Several intelligent computing techniques have been applied in the domain of traffic control but only a few rely on robust computing systems or large amounts of pre-calculated data. Although control systems have been operating using simple and locally-aware agents and most of these works rely on technology that is currently available, other systems plan for future technological advances, including theoretical requirements. Table 1 outlines and compares intelligent traffic control systems with their advantages and drawbacks.

Table 1.
Comparison study of the existing traffic signaling approaches based on various features.
3. System Modeling
Different technology stacks can be used to design an efficient solution for modern-day traffic signaling in urban areas. Following the principles presented in [29], intelligent mechanisms of traffic lights, wireless sensors, and IoT technologies could be embedded in the design of a modern ITSS. Different components and their use in designing ITSS lead to formulating the solution for an urban traffic monitoring system. In the proposed approach, the lights used to regulate the traffic are following three modes, as in most existing traffic control systems. The traffic lights are adapted in accordance with the differences in the traffic density. The movement of vehicles can be determined by a loop detector sensor installed under the surface of the road. The loop comprises a coil with several rounds to detect the pressure of a vehicle. It is rectangular in shape with a breadth of six feet, which varies in length depending upon the application design. It can be placed about two inches below the street surface, which in turn forms the inductive part of a parallel tuned circuit to generate a magnetic field. As suggested by [30], when the vehicles enter it can be detected by a change in the inductance value in the magnetic field of the loop.
In an attempt to provide possible future scope and eliminate the flaws of existing traffic signal monitoring, the authors in [31] have suggested the use of Simulation of Urban MObility (SUMO). By this the environment can be set by detailing the vehicle with the model, routing, state of the vehicle and lane changing. Based upon the characteristics of SUMO, the details regarding network management, devices used, and junction setup are chosen for simulation, as a result of which the edges, lane numbering, link between devices, the position of the induction loop, and intelligent control with signal plan logic are defined. The induction loop that has been used to develop the proposed system has been integrated within a signal cabinet and can be used to transmit current in the interval between 10 and 200 KHz. A magnetic field is generated as presented in Figure 1. The inductance generated from this depends inversely upon the length of the loop and focuses on the thickness of the wire. After each vehicle that passes above the sensor the weight generates the current in the loop wire, which reduces inductance and is responsible for the change in oscillation frequency [32].
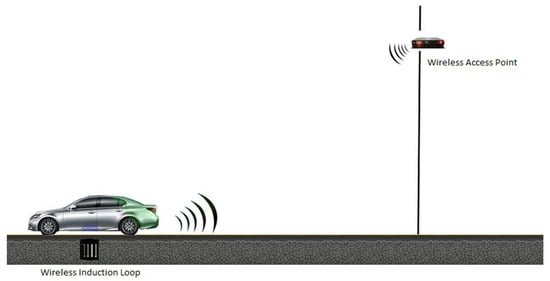
Figure 1.
Wireless induction loop connected with wireless access point.
While designing the ITSS, loop sensitivity has been taken into consideration, as the system results are affected by small changes in inductance at the detector terminals. For the environment setup, the traffic junction has been modeled with four different nodes, namely north, south, east, and west. Every node consists of two lanes, one for incoming and one for outgoing vehicles. Thus, the system environment consists of eight different lanes. The direction of each lane along with the corresponding vehicle movement direction are represented in Figure 2. For each node, one induction loop has been attached to detect the flow of vehicles. The induction loop position was determined to be installed 100 m away from the junction for the incoming lanes, while for the outgoing lanes it is placed right before the junction starts. Any single vehicle is allowed in each lane that has five meters’ width.
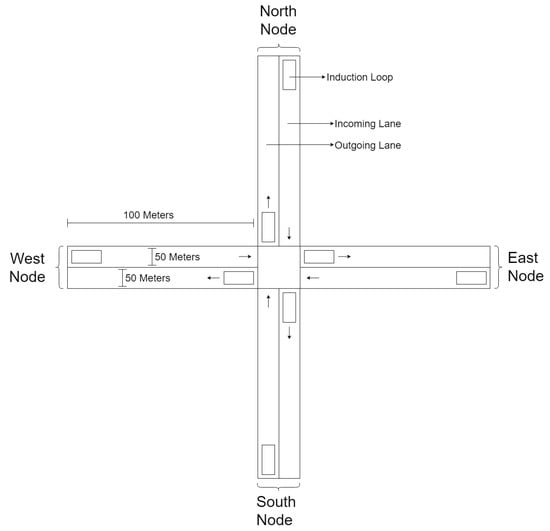
Figure 2.
Basic environment block of ITSS.
Two wireless access points are set on each road direction to allow communication between each induction loop and the wireless signal switch. When a vehicle is detected by an induction loop, the details of the vehicle are communicated wirelessly to the data center of the system. Different wireless devices such as wireless access points, wireless signal switches, and wireless controllers have been embedded in the proposed system to establish direct communication between the wireless vehicle detector and the central data center. The wireless access points accept signals from the various induction loop sensors and forward these signals to the corresponding switches. After signal data acquisition, each switch wirelessly forwards these data to a central controller that plays a vital role in the system as it regularly collects data related to the vehicle movement direction in the lanes and then forwards these data to the data center for further analysis. A block diagram of the ITSS is shown in Figure 3. The system can effectively provide a solution for emergency vehicles by using infrared sensors from all directions within a specified range. The sensor detects the red light in accordance with the central controller, which forwards it to the data center in order to obtain the required solution.
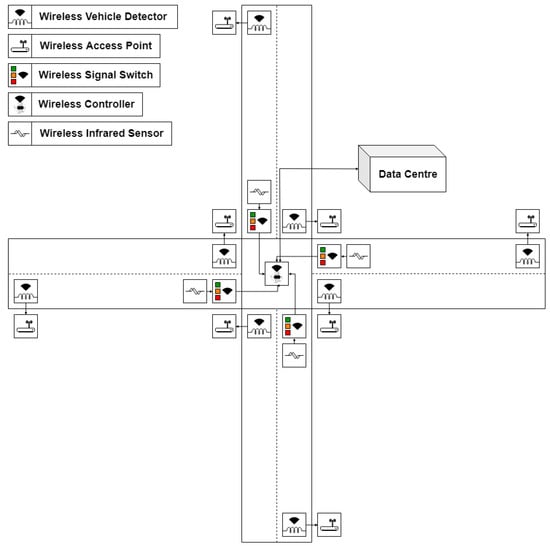
Figure 3.
Block diagram of ITSS.
4. Mathematical Background and Algorithmic Design of the ITSS
The mathematical formulas presented in this section were implemented in the following algorithms.
4.1. Mathematical Background
Loop sensitivity is defined as the smallest percentage change of the inductance at the detector terminals, which will cause the detector to accurately function. Radian frequency W refers to the angular displacement per unit of time. One complete revolution is considered to be equal to radians and can be represented as:
Inductance L is defined as the change in the magnetic field surrounding a conductor, which is caused due to a variation of current inducing a counter electromotive force into the conductor [33]. In addition, capacitance C is defined as the ratio of charge to potential on an electrically charged and isolated conductor [34]. The relations among radian frequency W, frequency f, inductance L, and capacitance C of a resonant circuit are presented as:
The following assumptions have been made to derive Equation (3). is the inductance with no vehicle present, while is the inductance with a vehicle present. Furthermore, is the resonant frequency related to and is the resonant frequency related to . Therefore, and .
As a result, by substituting the mentioned parameters in Equation (2), the following equation can be derived:
where is the radian frequency at initial condition with zero vehicle present over the induction loop and is the radian frequency at an intermediate stage. Furthermore:
where is the inductance at the initial condition when no vehicles are present over the induction loop and is the inductance at an intermediate stage when vehicles are present over the induction loop. Let be the change in amount of inductance in the induction loop due to the presence of vehicles. Hence, .
The sensitivity of the loop S is the ratio of change in loop inductance (i.e., ) over original inductance (i.e., ). It can be written as and can be represented as:
Using the parameter of as , the former Equation (6) can be reformulated as:
We can then substitute and with , and the sensitivity can be rewritten as:
Equation (8), after the substitution , can be written as:
The inductance value is equal to:
Neglecting for small frequency changes, Equation (10) can be represented as:
This equation for inductive shift sensitivity is accurate within for an inductive shifts of or less.
4.2. Proposed Algorithms
Six algorithms are proposed in this subsection as components of the proposed Intelligent Traffic Signal System (ITSS). Specifically, Algorithm 1 is titled “Environment Set-Up” and defines all the variables and their default values, which are required for the ITSS preprocessing. “Vehicle” is a complex data structure comprising four objects and containing three parameters. The first parameter is a constant variable that stores the direction of a particular object. In the following, the second parameter is a list that includes the vehicle ids of all the vehicles passing through the induction loop. The last parameter is used to store the total number of vehicles present in each direction of the traffic junction. “Emergency_vehicle” is a similar data structure to “vehicle”, but is used for storing data related to emergency vehicles.
| Algorithm 1 Environment Set-Up |
|
Algorithm 2 is titled “Vehicle Detection” and consists of steps that store the details of each vehicle passing over the lane’s induction loop. These details consist of many parameters, such as a unique vehicle id for the identification of each vehicle and its flow direction. For each vehicle that overtakes the other, its information is stored in the ideal structure. More to the point, the ideal structure points to the proper format in which the data are stored by capturing values from the sensors. This is implemented by increasing the weight variable by one. If an emergency vehicle is present, then the infrared sensor detects it. The details about the emergency vehicle id and the total number of emergency vehicles are stored in respective data structures.
Algorithm 3 is related to “Flag Conversion” and is used to change the emergency flag value based on the weight value of each direction present inside “emergency_vehicle”. If an emergency vehicle is detected by the infrared sensor, then its detailed information will be added to the “emergency_vehicle” by using the proposed vehicle detection Algorithm 2, and also its weight value will be increased. If any of the weight values is greater than zero, then the value of the emergency flag will be changed from “False” to “True”. In this algorithm, the value of the radian frequency is calculated.
| Algorithm 2 Vehicle Detection |
|
| Algorithm 3 Flag Conversion |
|
Algorithm 4, titled “Signal Switching”, is designed to control the intersection’s traffic light based on given parameters. Initially, the value of the emergency flag is checked, and if the value is true, then the name of the direction is stored along with the total number of vehicles present during the last green direction. In addition, the current signal phase for controlling the signal system is stored. On the other hand, if the emergency flag value is false, the availability of vehicles present in the last green direction will be checked. If there are such vehicles, the traffic signal will turn green for the corresponding direction until all the vehicles cross the intersection. Otherwise, the current highest weight vehicle direction is checked by considering the step flag, which is used to prevent the starvation situation. In the following, the suitable direction will be decided and its traffic signal will turn green for a given time slot generated by the algorithm. In this algorithm, the values of inductance and capacitance are calculated.
| Algorithm 4 Signal Switching |
|
Algorithm 5 is titled “Vehicle Removal” and consists of all the necessary steps that will eliminate the details of each vehicle that passes over the outgoing lane’s induction loop. Information is stored in the corresponding data structure after updating the weight variable for each passing vehicle. For example, if an emergency vehicle passes over the outgoing lane’s induction loop, the loop will detect the emergency vehicle id. Thereafter, the information will be removed from the respective data structure and the total weight will be reduced by one.
Algorithm 6 concerns the overall ITSS implementation and starts as soon as the initial observation time is processed and continues until the program is terminated. This ITSS implementation is used as a recursive process in every millisecond.
| Algorithm 5 Vehicle Removal |
|
| Algorithm 6 ITSS Implementation |
|
5. Network Building and Traffic Control Using ITSS
A SUMO network provides a precise description of the traffic-relevant subset of a map, its roads, and the intersections of the simulated vehicles, which pass along or across the roads. This specific network is a directed graph with nodes standing for intersections, and unidirectional “edges” representing roads. An edge can be a collection of road lanes and can include information about the position, the shape, and the speed limit of every lane.
SUMO applications such as Netconvert and Netgen can significantly generate traffic networks by importing a digital road map. Specifically, Netconvert has been used in terms of interpretation by reading inputs from native modules, which are specific to SUMO and are represented in an XML prototype of a road network graph. This allows the highest degree of control for describing a road network for the SUMO simulator. On the other hand, regarding Netgen, the abstract road networks utilize node.xml for creating the nodes, edge.xml for establishing the links, and type.xml for setting the properties. Additionally, traffic flow can be created and supplied as input to Netconvert for generating the network file, which SUMO can then interpret.
Each vehicle is identified and explicitly defined with the use of a unique id, departure time, and routes in the network. The complete list of edges for all routes between sources to destination is set for each vehicle. Furthermore, each vehicle is assigned a type with a description of the vehicle’s physical attributes and the variables of the user movement model. Additionally, pollutant or noise emission classes are maintained with each mapped vehicle type. Attributes such as the appearance of vehicles within the simulated environment are also defined. Based on the varying demands of vehicle inputs, the SUMO suite can dynamically scale information for both large and small cities. An XML-based file for the route, i.e., rou.xml, is maintained with routing information, as specified. Through network setup and simulation, customization tasks can be supported in many ways, such as the visualization of speeds, the waiting time and the individual vehicle tracking. Both network and route files are given as input to the SUMO network in terms of simulation of the proposed ITSS model with the aim of retrieving relevant results, as depicted in Figure 4.
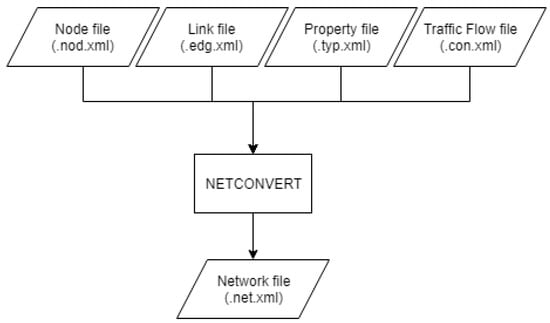
Figure 4.
Conversion of network file using Netconvert.
A Traffic Control Interface (Traci) is employed in order to access the traffic simulation in running zones and encourages the retrieval of simulated object values of their behavioral outcomes in online mode. It is adopted and developed with the use of a TCP-based client/server architecture for providing access to SUMO. Hence, SUMO is operated as a server using additional command-line options, such as remote-port , where indicates a SUMO port and supports listening capability for incoming connections. SUMO has been forced to make simulation preparation and stay in waiting mode until the external application responds and gains controlling authority over SUMO. During the simulation, the TraCI server is executed until the client forces the simulation to stop.
The nodes and lanes with junction creations are set using Netconvert for simulation through SUMO. Figure 5a represents the basic skeleton of the final model designed using Netconvert, which consists of nodes, lanes, and junctions for smooth operations. Using Netconvert, the position of the induction loop has been fixed near the junction for incoming edges. Moreover, in Figure 5b, an added induction loop for outgoing edges is set 100 m away from the junction. Finally, the interconnections of lanes are included in the junction and are prepared for simulation through SUMO.
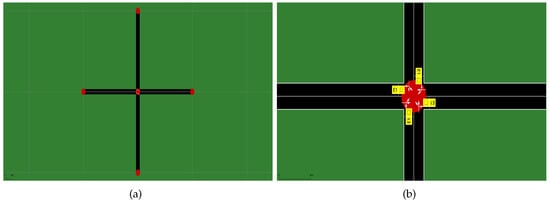
Figure 5.
(a) Representation of nodes, lanes and junctions. (b) Addition of induction loop near the junction for incoming edges.
Figure 6a indicates the placement of induction loops 100 m away from intersection for outgoing lanes. In addition, Figure 6b shows the interconnection between all eight lanes based on which vehicles move through this intersection.
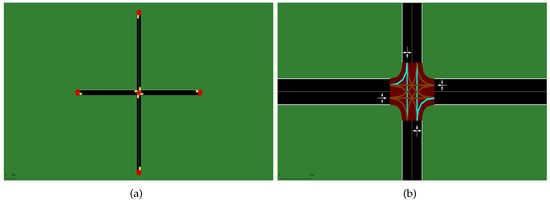
Figure 6.
(a) Addition of induction loop 100 m away from the junction for outgoing lanes. (b) Connections of lanes with each other are added to the junction.
In Figure 7a, the initial simulation phase is carried out where all four directions are set as red with no vehicles present in any lane. More to the point, Figure 7b visualizes an intermediate phase of the simulation, where the north direction is colored green and the rest of the directions are depicted in red color. Due to this, the vehicles approaching from the north direction are allowed to move, whereas vehicles from other directions have to wait for their turn to come.
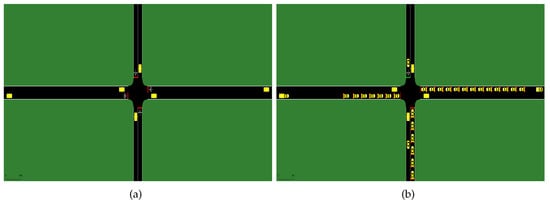
Figure 7.
(a) Initial simulation phase with red from all directions. (b) Intermediate simulation phase where the north has green and the rest have red.
Figure 8a corresponds to an intermediate phase of the simulation, where the south direction is colored orange and the rest of the directions are depicted in red color. During this phase, all the vehicles in the south direction start slowing down as they see the orange light. Figure 8b demonstrates the emergency vehicle detection capabilities of ITSS. Because of the arrival of an emergency vehicle from the north side, the ITSS model turns the corresponding side to green until the emergency vehicle crosses the junction. At the same time, the rest of the directions are automatically depicted in red color in order to force the vehicles to wait.
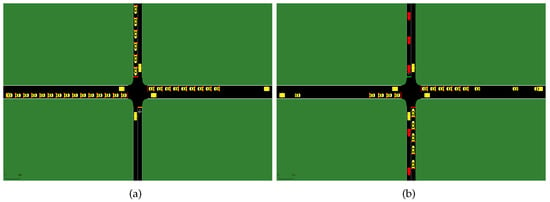
Figure 8.
(a) Intermediate simulation phase where the south has orange and the rest have red. (b) Simulation phase where the emergency vehicle has green and the rest have red.
6. Experimental Result Analysis
The experimental results are presented in this section. The simulation of the realistic ITSS traffic model aims to dynamically control the traffic system and to provide all relevant data to the remote data center for analysis. With suitably selected values, the proposed algorithms simulated the traffic conditions and compare results of the existing models using a fixed control scheme. Due to the stochastic nature of traffic control, several scenarios were considered to make it more reliable. During simulations, all twelve sets of vehicle routes were generated and utilized. The number of vehicles per unit of time varied for each simulation round during the performance comparison. Three scenarios are presented throughout this section, where the model was executed 25,000 times. Observations regarding traffic state included the total waiting time, the mean travel time, the mean speed, the occupancy in the percentage of vehicles, and the number of vehicles passing through the junction.
The developed ITSS model was compared with the working principle of the Piezo-based Traffic Light System (PTLS) [23], which supports the traditional approach with fixed cycle time control. It can be easily noticed that the proposed ITSS model changes the phase intervals per traffic demand, while the conventional system stays in the same phase intervals for each cycle. The proposed ITSS model is implemented using a Python script, which initially provides input to the SUMO model, and in addition, data are collected to be stored in a remote server; these retrieved data are represented through different graphical representations. Each round of simulation is preceded by parameters involved for execution.
Numerous parameters were used during simulation and as proved, they can affect the overall performance of the developed ITSS. Therefore, all the simulations were carried out by considering the parameters of Table 2.

Table 2.
Simulation parameters for ITSS.
6.1. Simulation 1
The complex nature of the real world makes it difficult to predict the relationships between various variables. However, through simulation, the effectiveness of multiple values of each parameter can be examined, and it would be computationally impractical to simulate all scenarios for each possible combination of parameter values generated using the available hardware and sequential nature of current SUMO traffic simulation software. Various values of each parameter were compared with the existing ITSS model as presented in Table 3.

Table 3.
Simulation 1 parameters.
In the first simulation, the performance of the ITSS model was tested by 480 rounds, each comprising an average of 25,000 time steps. The average number of vehicles per lane in this simulation was kept at 30 and the time-to-vehicle density ratio of less than 1 was set. This simulation represents the real-world traffic situations of the morning, late night, and other times when significantly fewer vehicles are on the road. Different parameters have been checked through resultant graphs in order to compare both ITSS and PTLS models.
Referring to Figure 9, it was found that using the ITSS model, vehicles from every direction have to wait for less time than in the PTLS model. Similarly, more vehicles pass through the junction in a shorter duration and the occupancy level is minimum for most of the time at the junction using the ITSS model.
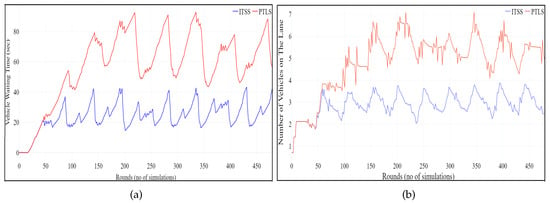
Figure 9.
Comparison graph between ITSS and PTLS in low density: (a) average waiting time of vehicles; (b) number of vehicles that passed through.
Figure 10 shows the difference between ITSS and PTLS model performance in low density where vehicles cross the junction smoothly with more speed and also most of the time the mean speed of vehicles is more than in the PTLS model.
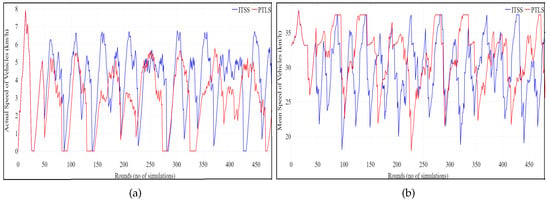
Figure 10.
Comparison graph between ITSS and PTLS in low density: (a) actual speed of vehicles; (b) mean speed of vehicles.
By using the ITSS model, the resultant Figure 11 depicts that a smaller percentage of vehicles halted at the junction to avoid traffic congestion compared to the PTLS model. Additionally, the time consumption for travel in junction was less than in vehicles using the PTLS model.
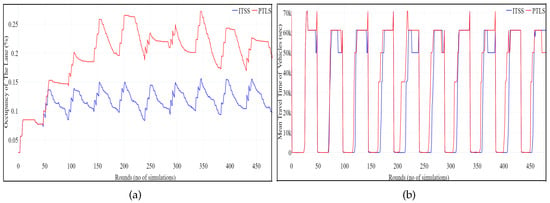
Figure 11.
Comparison graph between ITSS and PTLS in low density: (a) occupancy percentage of vehicles; (b) mean travel time of vehicles.
6.2. Simulation 2
While performing the second simulation, most parameters remained unaltered as compared to the first simulation, except the density field. Similarly, a total of 480 rounds of executions have been performed. Each simulation result is the average of 25,000 time steps. The average number of arrived vehicles per lane was 60 and the time-to-vehicle density ratio was 1. This simulation corresponds to the timing targeting for moderating traffic on the road and the resultant graphs show that ITSS performed better than PTLS for the considered parameters. Various values of each parameter were compared with the existing model as presented in Table 4.

Table 4.
Simulation 2 parameters.
The average waiting time in medium-density was less than the PTLS model due to the dynamic traffic management principle. Hence, ITSS provides the benefit of allowing more vehicles to pass through the junction. Figure 12 gives a clear idea of this aspect through comparisons. Considering the idea of load-balancing, the ITSS model provides the feature to avoid traffic congestion for which the vehicle does not need to wait more time and can pass the junction at normal speed.
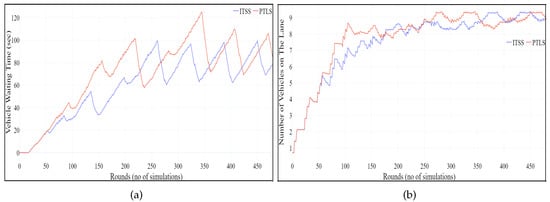
Figure 12.
Comparison graph between ITSS and PTLS in medium density: (a) average waiting time of vehicles; (b) number of vehicles that passed through.
Figure 13 illustrates the comparison results where vehicles traveled with more speed in the junction than the vehicles using the PTLS model. Similarly, the mean speed of vehicles using ITSS was comparatively more than when using the PTLS model. As the vehicles had to wait less time to cross the junction, it can be concluded that they occupied less space near the junction.
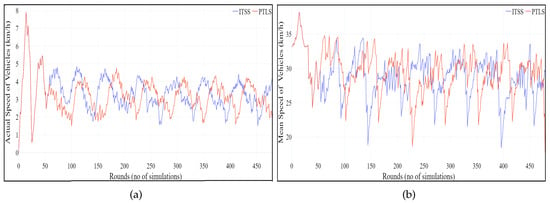
Figure 13.
Comparison graph between ITSS and PTLS in medium density: (a) actual speed of vehicles; (b) mean speed of vehicles.
It is observed from Figure 14 that the percentage of vehicles queued near the stoppage is less than the number of vehicles when using the PTLS model. Due to this reason, the mean travel time decreased and resulted in less energy consumption. Moreover, this figure provides a good idea of the same through the comparison between both situations.
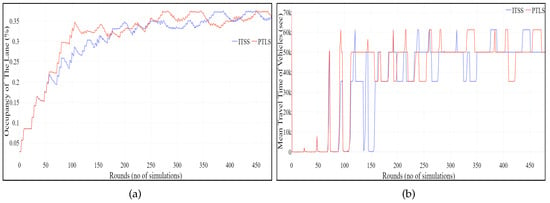
Figure 14.
Comparison graph between ITSS and PTLS in medium density: (a) occupancy percentage of vehicles; (b) mean travel time of vehicles.
6.3. Simulation 3
The third simulation was carried out to observe the performance of both models in extreme traffic congestion situations. Like the other simulations, 480 rounds of executions, each of which comprised an average of 25,000 time steps, were utilized to obtain the performance comparison results of the proposed ITSS model over PTLS. The average number of vehicles per lane in this simulation was set as 90 with a time-to-vehicle density ratio of more than 1. Except for the change in density, all other parameter values were kept the same as in the two previous simulations. Table 5 presents the parameters for this third configuration.

Table 5.
Simulation 3 Parameters.
The average waiting time of vehicles during high density in the case of the proposed ITSS model was less than that of the PTLS model, as the traffic management principle in ITSS was dynamically implemented. Because of this, ITSS provides a solution to allow the maximum number of vehicles passing through the junction. From Figure 15, it is observed that most of the vehicles had to wait less time as the number of vehicles increased and a smaller number of vehicles had to stay in the lane. Due to the inductance factor, ITSS provides the dynamic procedure for managing traffic congestion and allows the vehicles to not stay for a more extended period at the junction; therefore, they can pass through with more speed than in the PTLS model.
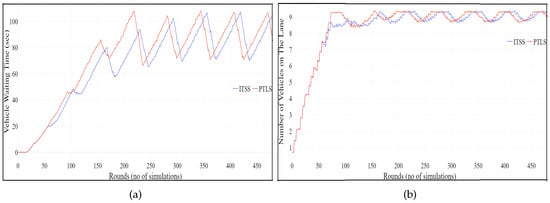
Figure 15.
Comparison graph between ITSS and PTLS in high density: (a) average waiting time of vehicles; (b) number of vehicles passed through.
Figure 16 illustrates the comparison results of the vehicles traveling with more speed at the junction point in the case of the ITSS model than the vehicles using the PTLS model. Although the number of vehicles increased, the mean speed of vehicles using ITSS was comparatively larger than when using the PTLS model to avoid delay in processing.
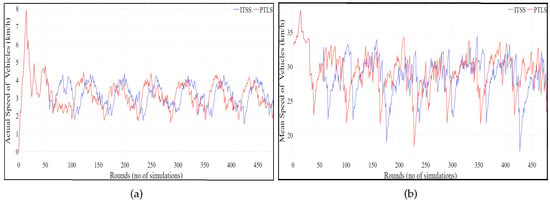
Figure 16.
Comparison graph between ITSS and PTLS in high density: (a) actual speed of vehicles; (b) mean speed of vehicles.
We can observe in Figure 17 that the increase in traffic density did not affect the throughput of the ITSS model, and a comparatively smaller number of vehicles had to stay in the lane waiting for the green light to be turned on. As a result, this proves that the occupancy rate is at a minimum in ITSS compared to the PTLS model. Due to the aforementioned factors, vehicles spend more time for traveling purposes than waiting for their turn. Moreover, this figure shows that when the number of vehicles increases, their travel time also increases without wasting time in waiting for the green light, which maximizes the throughput of the ITSS model.
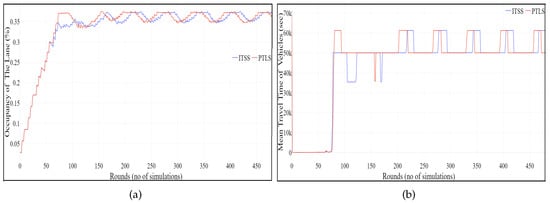
Figure 17.
Comparison graph between ITSS and PTLS in high density: (a) occupancy percentage of vehicles; (b) mean travel time of vehicles.
7. Conclusions and Future Work
The current work discusses vehicular traffic networks and proposes an ITSS model designed for this type of networks. Specifically, as the volume of traffic in major cities continues to increase worldwide, technological advancements and their applications in traffic control will become important. The proposed ITSS model assigns the green light per traffic demand and it can be used for preventing deadlocks and unnecessary starvation through waiting of vehicles. The evaluation results show that the proposed system efficiently utilizes the green light by allowing many vehicles to pass the junction in every cycle. Furthermore, the proposed ITSS model appropriately switches the green light between four lanes, which decreases the waiting time of vehicles. Special features including prioritization of emergency vehicles are also considered through the proposed concise time-response ITSS model.
The designed model can investigate the effectiveness of different traffic parameters, which have been optimized for efficiency and scalability. Different traffic scenarios were simulated to reduce errors irrespective of geographical location. Furthermore, the proposed model was evaluated in various other networks to demonstrate its compatibility in different traffic environments. The ITSS model can efficiently operate on a single-lane road, which can be improved to handle roads with multiple lanes. Instead of a dynamic generation cycle time, machine learning with a deep neural network approach can be performed on the system with the aim of drastically improving its performance. With the help of neural networks, cycle lengths can be predicted ahead of reaching a junction, which will then be shared with the vehicles in the same lane to modify their vehicle speed so that waiting time can be again decreased at the junction. Finally, we plan to model driving behavior parameters using the microscopic simulation software VISSIM; these are lane change distances, additive and multiplicative parts of desired safety distances, the number of preceding vehicles spotted, amber signal decisions, and minimum headway [35].
Author Contributions
Conceptualization, S.C.R., S.P.N., B.A., V.C.G., A.K. and T.P.; Methodology, S.C.R., S.P.N., B.A., V.C.G., A.K. and T.P.; Writing–original draft, S.C.R., S.P.N., B.A., V.C.G., A.K. and T.P.; Writing–review & editing, S.C.R., S.P.N., B.A., V.C.G., A.K. and T.P. All authors have read and agreed to the published version of the manuscript.
Funding
This research work is supported by the All India Council for Technical Education under Research Promotion Scheme reference no: 8-123/RIFD/RPS/POLICY-3/2013-14. The paper also received funding from the research project CRISIS, “Competences for Resilient Smart Cities’ Staff” (Project No.: 2021-1-EL01-KA220-HED-000032257, Erasmus+ KA2).
Conflicts of Interest
The authors declare no conflict of interest.
References
- The Times of India. 53,700 Vehicles Registered Across Country Every Day. Available online: https://timesofindia.indiatimes.com/auto/miscellaneous/53700-vehicles-registered-across-country-every-day/articleshow/53747821.cms (accessed on 11 November 2022).
- Rahman, M.; Najaf, P.; Fields, M.G.; Thill, J.C. Traffic Congestion and its Urban Scale Factors: Empirical Evidence from American Urban Areas. Int. J. Sustain. Transp. 2022, 16, 406–421. [Google Scholar] [CrossRef]
- Afrin, T.; Yodo, N. A Survey of Road Traffic Congestion Measures towards a Sustainable and Resilient Transportation System. Sustainability 2020, 12, 4660. [Google Scholar] [CrossRef]
- Guzman, L.A.; Arellana, J.; Alvarez, V. Confronting Congestion in Urban Areas: Developing Sustainable Mobility Plans for Public and Private Organizations in Bogotá. Transp. Res. Part A Policy Pract. 2020, 134, 321–335. [Google Scholar] [CrossRef]
- Janahan, S.K.; Veeramanickam, M.; Arun, S.; Narayanan, K.; Anandan, R.; Parvez, S.J. IoT based Smart Traffic Signal Monitoring System using Vehicles Counts. Int. J. Eng. Technol. 2018, 7, 309–312. [Google Scholar] [CrossRef]
- Vishnu, V.C.M.; Rajalakshmi, M.; Nedunchezhian, R. Intelligent Traffic Video Surveillance and Accident Detection System with Dynamic Traffic Signal Control. Clust. Comput. 2018, 21, 135–147. [Google Scholar]
- Liu, Y.; Ding, Z.; Al-Dhahir, N.; Schober, R.; Dobre, O.A.; Karagiannidis, G.K.; Fan, P. Introduction to the Issue on Signal Processing Advances for Non-Orthogonal Multiple Access in Next Generation Wireless Networks. IEEE J. Sel. Top. Signal Process. 2019, 13, 388–391. [Google Scholar] [CrossRef]
- Rakib, S.S. Remote Control for Wireless Control of System Including Home Gateway and Headend, Either or Both of Which Have Digital Video Recording Functionality. U.S. Patent No. 8,151,306, 3 April 2012. [Google Scholar]
- Zhang, F.; Hu, X.; Langari, R.; Cao, D. Energy Management Strategies of Connected HEVs and PHEVs: Recent Progress and Outlook. Prog. Energy Combust. Sci. 2019, 73, 235–256. [Google Scholar] [CrossRef]
- Lu, K.; Du, P.; Cao, J.; Zou, Q.; He, T.; Huang, W. A Novel Traffic Signal Split Approach based on Explicit Model Predictive Control. Math. Comput. Simul. 2019, 155, 105–114. [Google Scholar] [CrossRef]
- Zahid, M.; Chen, Y.; Jamal, A.; Mamadou, C.Z. Freeway Short-Term Travel Speed Prediction Based on Data Collection Time-Horizons: A Fast Forest Quantile Regression Approach. Sustainability 2020, 12, 646. [Google Scholar] [CrossRef]
- Zahid, M.; Chen, Y.; Jamal, A.; Memon, M.Q. Short Term Traffic State Prediction via Hyperparameter Optimization Based Classifiers. Sensors 2020, 20, 685. [Google Scholar] [CrossRef]
- Jamal, A.; Ijaz, M.; Almosageah, M.; Al-Ahmadi, H.M.; Zahid, M.; Ullah, I.; Mamlook, R.E.A. Implementing the Maximum Likelihood Method for Critical Gap Estimation under Heterogeneous Traffic Conditions. Sustainability 2022, 14, 15888. [Google Scholar] [CrossRef]
- Barthélemy, J.; Verstaevel, N.; Forehead, H.I.; Perez, P. Edge-Computing Video Analytics for Real-Time Traffic Monitoring in a Smart City. Sensors 2019, 19, 2048. [Google Scholar] [CrossRef] [PubMed]
- Ghazal, B.; ElKhatib, K.; Chahine, K.; Kherfan, M. Smart Traffic Light Control System. In Proceedings of the 3rd IEEE International Conference on Electrical, Electronics, Computer Engineering and their Applications (EECEA), Beirut, Lebanon, 21–23 April 2016; pp. 140–145. [Google Scholar]
- Mehboob, F.; Abbas, M.; Rauf, A.; Khan, S.A.; Jiang, R. Video Surveillance-Based Intelligent Traffic Management in Smart Cities. In Intelligent Video Surveillance; IntechOpen: London, UK, 2019; p. 19. [Google Scholar]
- Muthuramalingam, S.; Bharathi, A.; Kumar, S.R.; Gayathri, N.; Sathiyaraj, R.; Balamurugan, B. IoT Based Intelligent Transportation System (IoT-ITS) for Global Perspective: A Case Study. In Internet of Things and Big Data Analytics for Smart Generation; Springer: Cham, Switzerland, 2019; pp. 279–300. [Google Scholar]
- Sahil; Sood, S.K. Smart Vehicular Traffic Management: An Edge Cloud Centric IoT based Framework. Internet Things 2021, 14, 100140. [Google Scholar] [CrossRef]
- Younes, M.B.; Boukerche, A. An Efficient Dynamic Traffic Light Scheduling Algorithm Considering Emergency Vehicles for Intelligent Transportation Systems. Wirel. Netw. 2018, 24, 2451–2463. [Google Scholar] [CrossRef]
- Kong, F.; Zhou, Y.; Chen, G. Multimedia Data Fusion Method based on Wireless Sensor Network in Intelligent Transportation System. Multimed. Tools Appl. 2020, 79, 35195–35207. [Google Scholar] [CrossRef]
- Ibáñez, J.A.G.; Zeadally, S.; Contreras-Castillo, J. Sensor Technologies for Intelligent Transportation Systems. Sensors 2018, 18, 1212. [Google Scholar] [CrossRef]
- Prakash, O.; Aggarwal, M.; Vishvesha, A.; Kumar, B. Traffic Detection System Using Android. J. Adv. Comput. Commun. Technol. 2015, 3, 56–60. [Google Scholar]
- Sharma, S.; Mohan, S. Cloud-Based Secured VANET with Advanced Resource Management and IoV Applications. In Connected Vehicles in the Internet of Things; Springer: Cham, Switzerland, 2020; pp. 309–325. [Google Scholar]
- Joyce, M.J.; Erb, J.D.; Sampson, B.A.; Moen, R.A. Detection of Coarse Woody Debris using Airborne Light Detection and Ranging (LiDAR). For. Ecol. Manag. 2019, 433, 678–689. [Google Scholar] [CrossRef]
- Jamal, A.; Al-Ahmadi, H.M.; Butt, F.M.; Iqbal, M.; Almoshaogeh, M.; Ali, S. Metaheuristics for Traffic Control and Optimization: Current Challenges and Prospects. In Search Algorithm—Essence of Optimization; IntechOpen: London, UK, 2021. [Google Scholar]
- Jalili, S.; Nallaperuma, S.; Keedwell, E.C.; Dawn, A.; Oakes-Ash, L. Application of Metaheuristics for Signal Optimisation in Transportation Networks: A Comprehensive Survey. Swarm Evol. Comput. 2021, 63, 100865. [Google Scholar] [CrossRef]
- Al-Turki, M.; Jamal, A.; Al-Ahmadi, H.M.; Al-Sughaiyer, M.A.; Zahid, M. On the Potential Impacts of Smart Traffic Control for Delay, Fuel Energy Consumption, and Emissions: An NSGA-II-Based Optimization Case Study from Dhahran, Saudi Arabia. Sustainability 2020, 12, 7394. [Google Scholar] [CrossRef]
- Jia, H.; Lin, Y.; Luo, Q.; Li, Y.; Miao, H. Multi-objective optimization of urban road intersection signal timing based on particle swarm optimization algorithm. Adv. Mech. Eng. 2019, 11, 1687814019842498. [Google Scholar] [CrossRef]
- Frank, A.; Aamri, Y.S.K.A.; Zayegh, A. IoT based Smart Traffic density Control using Image Processing. In Proceedings of the 4th MEC International Conference on Big Data and Smart City (ICBDSC), Muscat, Oman, 15–16 January 2019; pp. 1–4. [Google Scholar]
- Al-Turjman, F.; Poncha, L.J. Intelligence, Security, and Vehicular Sensor Networks in Internet of Things (IoT)-enabled Smart-Cities: An Overview. Comput. Electr. Eng. 2020, 87, 106776. [Google Scholar] [CrossRef]
- Behrisch, M.; Bieker, L.; Erdmann, J.; Krajzewicz, D. SUMO—Simulation of Urban MObility: An Overview. In Proceedings of the 3rd International Conference on Advances in System Simulation (SIMUL), Barcelona, Spain, 23–28 October 2011. [Google Scholar]
- McLyman, C.W.T. Transformer and Inductor Design Handbook, 3rd ed.; CRC Press: Boca Raton, FL, USA, 2004. [Google Scholar]
- Pizzo, F.P. Magnetic Loop Detectors in Traffic Engineering Studies. Ph.D. Thesis, The Ohio State University, Columbus, OH, USA, 1978. [Google Scholar]
- Westerlund, S.; Ekstam, L. Capacitor theory. IEEE Trans. Dielectr. Electr. Insul. 1994, 1, 826–839. [Google Scholar] [CrossRef]
- Al-Ahmadi, H.M.; Jamal, A.; Reza, I.; Assi, K.J.; Ahmed, S.A. Using Microscopic Simulation-Based Analysis to Model Driving Behavior: A Case Study of Khobar-Dammam in Saudi Arabia. Sustainability 2019, 11, 3018. [Google Scholar] [CrossRef]
Disclaimer/Publisher’s Note: The statements, opinions and data contained in all publications are solely those of the individual author(s) and contributor(s) and not of MDPI and/or the editor(s). MDPI and/or the editor(s) disclaim responsibility for any injury to people or property resulting from any ideas, methods, instructions or products referred to in the content. |
© 2023 by the authors. Licensee MDPI, Basel, Switzerland. This article is an open access article distributed under the terms and conditions of the Creative Commons Attribution (CC BY) license (https://creativecommons.org/licenses/by/4.0/).