1. Introduction
Affected by the intensification of uncertainty in the global energy market, high oil prices recently, and the government’s vigorous promotion of the implementation of the “dual carbon” goal, new energy vehicles have gradually been sought by the market [
1,
2]; V2G (vehicle-to-grid) technology has realized the interactive relationship of “two-way charging of the vehicle network”, achieving a win-win situation between the power grid and users [
3]; and they have begun to operate on a large scale in the market.
The charging pile mainly works outdoors, which is susceptible to harsh environmental influences such as high temperature and humidity, and short circuit and open circuit faults occur [
4]. Due to long-term working in a high-voltage environment and being used intensively, the performance of internal components gradually decreases and eventually fails [
5]. The electrolyte inside the electrolytic capacitor gradually evaporates during the working process, and the capacitance decreases and fails [
6]. The data point out that the short circuit and open circuit faults of the power tube and electrolytic capacitor account for about 85% of the total number of faults of the charging module. Short circuit faults generally have built-in sensing elements for monitoring and protection [
7] or add fuses to convert short circuit faults into open circuit faults, but there is no perfect solution for open circuit faults. Therefore, this paper studies the open circuit fault diagnosis model of power tube and electrolytic capacitor in the charging pile, diagnoses the location of the faulty components, troubleshoots the fault in time, and improves the maintenance efficiency.
Fault characteristic diagnosis of the charging pile is essentially fault diagnosis of the power electronic circuits, and the current fault diagnosis methods can be divided into two types [
8]: diagnostic methods based on analytical models or methods based on process data. The analytical-model-based approach is by building a mathematical model. The literature [
9] calculated the residual between different fault states and normal operation by establishing a four-quadrant pulse rectifier mathematical model and locating the open circuit fault of the switch tube. The authors of [
10] used current vector slope and load current polarity for fault IGBT localization. Such methods rely too much on accurate models and are difficult to establish in practice.
Fault diagnosis methods based on process data have been widely used in recent years, mainly by analyzing a large amount of data accumulated during the operation process to find the relationship between the data and fault types. In [
11], charging module fault characteristics were extracted by wavelet packet decomposition, PCA principal component analysis was used to reduce dimensionality, and a random forest fault diagnostic was established to realize charging module switch faults, which required manual calibration of fault characteristics, large calculations, and high model complexity. The authors of [
12] used wavelet packet transformation to analyze the energy spectrum and power spectrum of charging module components to obtain fault characteristics, which avoided the problem of poor adaptability of the wavelet function to different signal decompositions, but it required repeated solution algorithms to obtain the best parameters, and the diagnosis efficiency was low. The deep learning algorithm reduced the computational complexity and improved the accuracy by independently learning the fault sample and extracting the feature information. The authors of [
13] used deep neural networks to extract data signals and independently learn and diagnose them under different control strategies but did not solve the influence of noise on diagnostic accuracy. In [
14], using wavelet packet transformation to extract the eight-dimensional energy spectrum of the input current of the rectifier and combining the fuzzy algorithm, the diagnostic accuracy was improved but the data processing time was longer. The study by [
15] used convolutional neural network to convert fault feature signals into feature images and then realize the leap of fault diagnosis models from theoretical research to actual hardware deployment by independent analysis and diagnosis in the network,.
However, there is the problem that feature information is easily lost after image input. The deep learning diagnosis method can avoid the error caused by the artificial selection of features and has good generalization ability and robustness. The traditional deep learning algorithm uses the fully connected network as the classifier, but it is difficult to achieve structural optimization; once the sample data are insufficient, it is easy to overfit, and only the local optimal solution can be obtained, which reduces the diagnostic accuracy.
The research purpose of this paper is to make better and faster diagnosis of the fault of the charging pile using technology based on deep learning. Compared with the traditional machine learning algorithm, this paper does not need to calibrate the fault characteristics manually. The neural network can make independent judgment with self-learning and analyzing the waveform difference of different faults, which greatly saves the diagnosis time and reduces the diagnosis error rate. At the same time, SVM is used to replace the SoftMax classifier in the traditional neural network to further improve the classification performance of the convolutional neural network, and the V2G charging pile fault diagnosis model based on CNN-SVM is constructed, which is the main innovation of this paper. In order to ensure the diagnostic accuracy of the model, before inputting the waveform into the convolutional neural network, wavelet packet transformation is used to analyze the signal in time and frequency domain, extract important feature information, and remove the impact of noise, which will also greatly optimize the structure of the convolutional neural network and reduce the requirements for hardware deployment. At the same time, the particle swarm optimization algorithm is used to optimize the parameters of SVM, which will help to avoid the problem that the traditional mesh parameter optimization cannot find the optimal result when the data set is too large.
2. Main Topology and Fault Analysis of Charging Pile Circuit
2.1. V2G Charging Pile
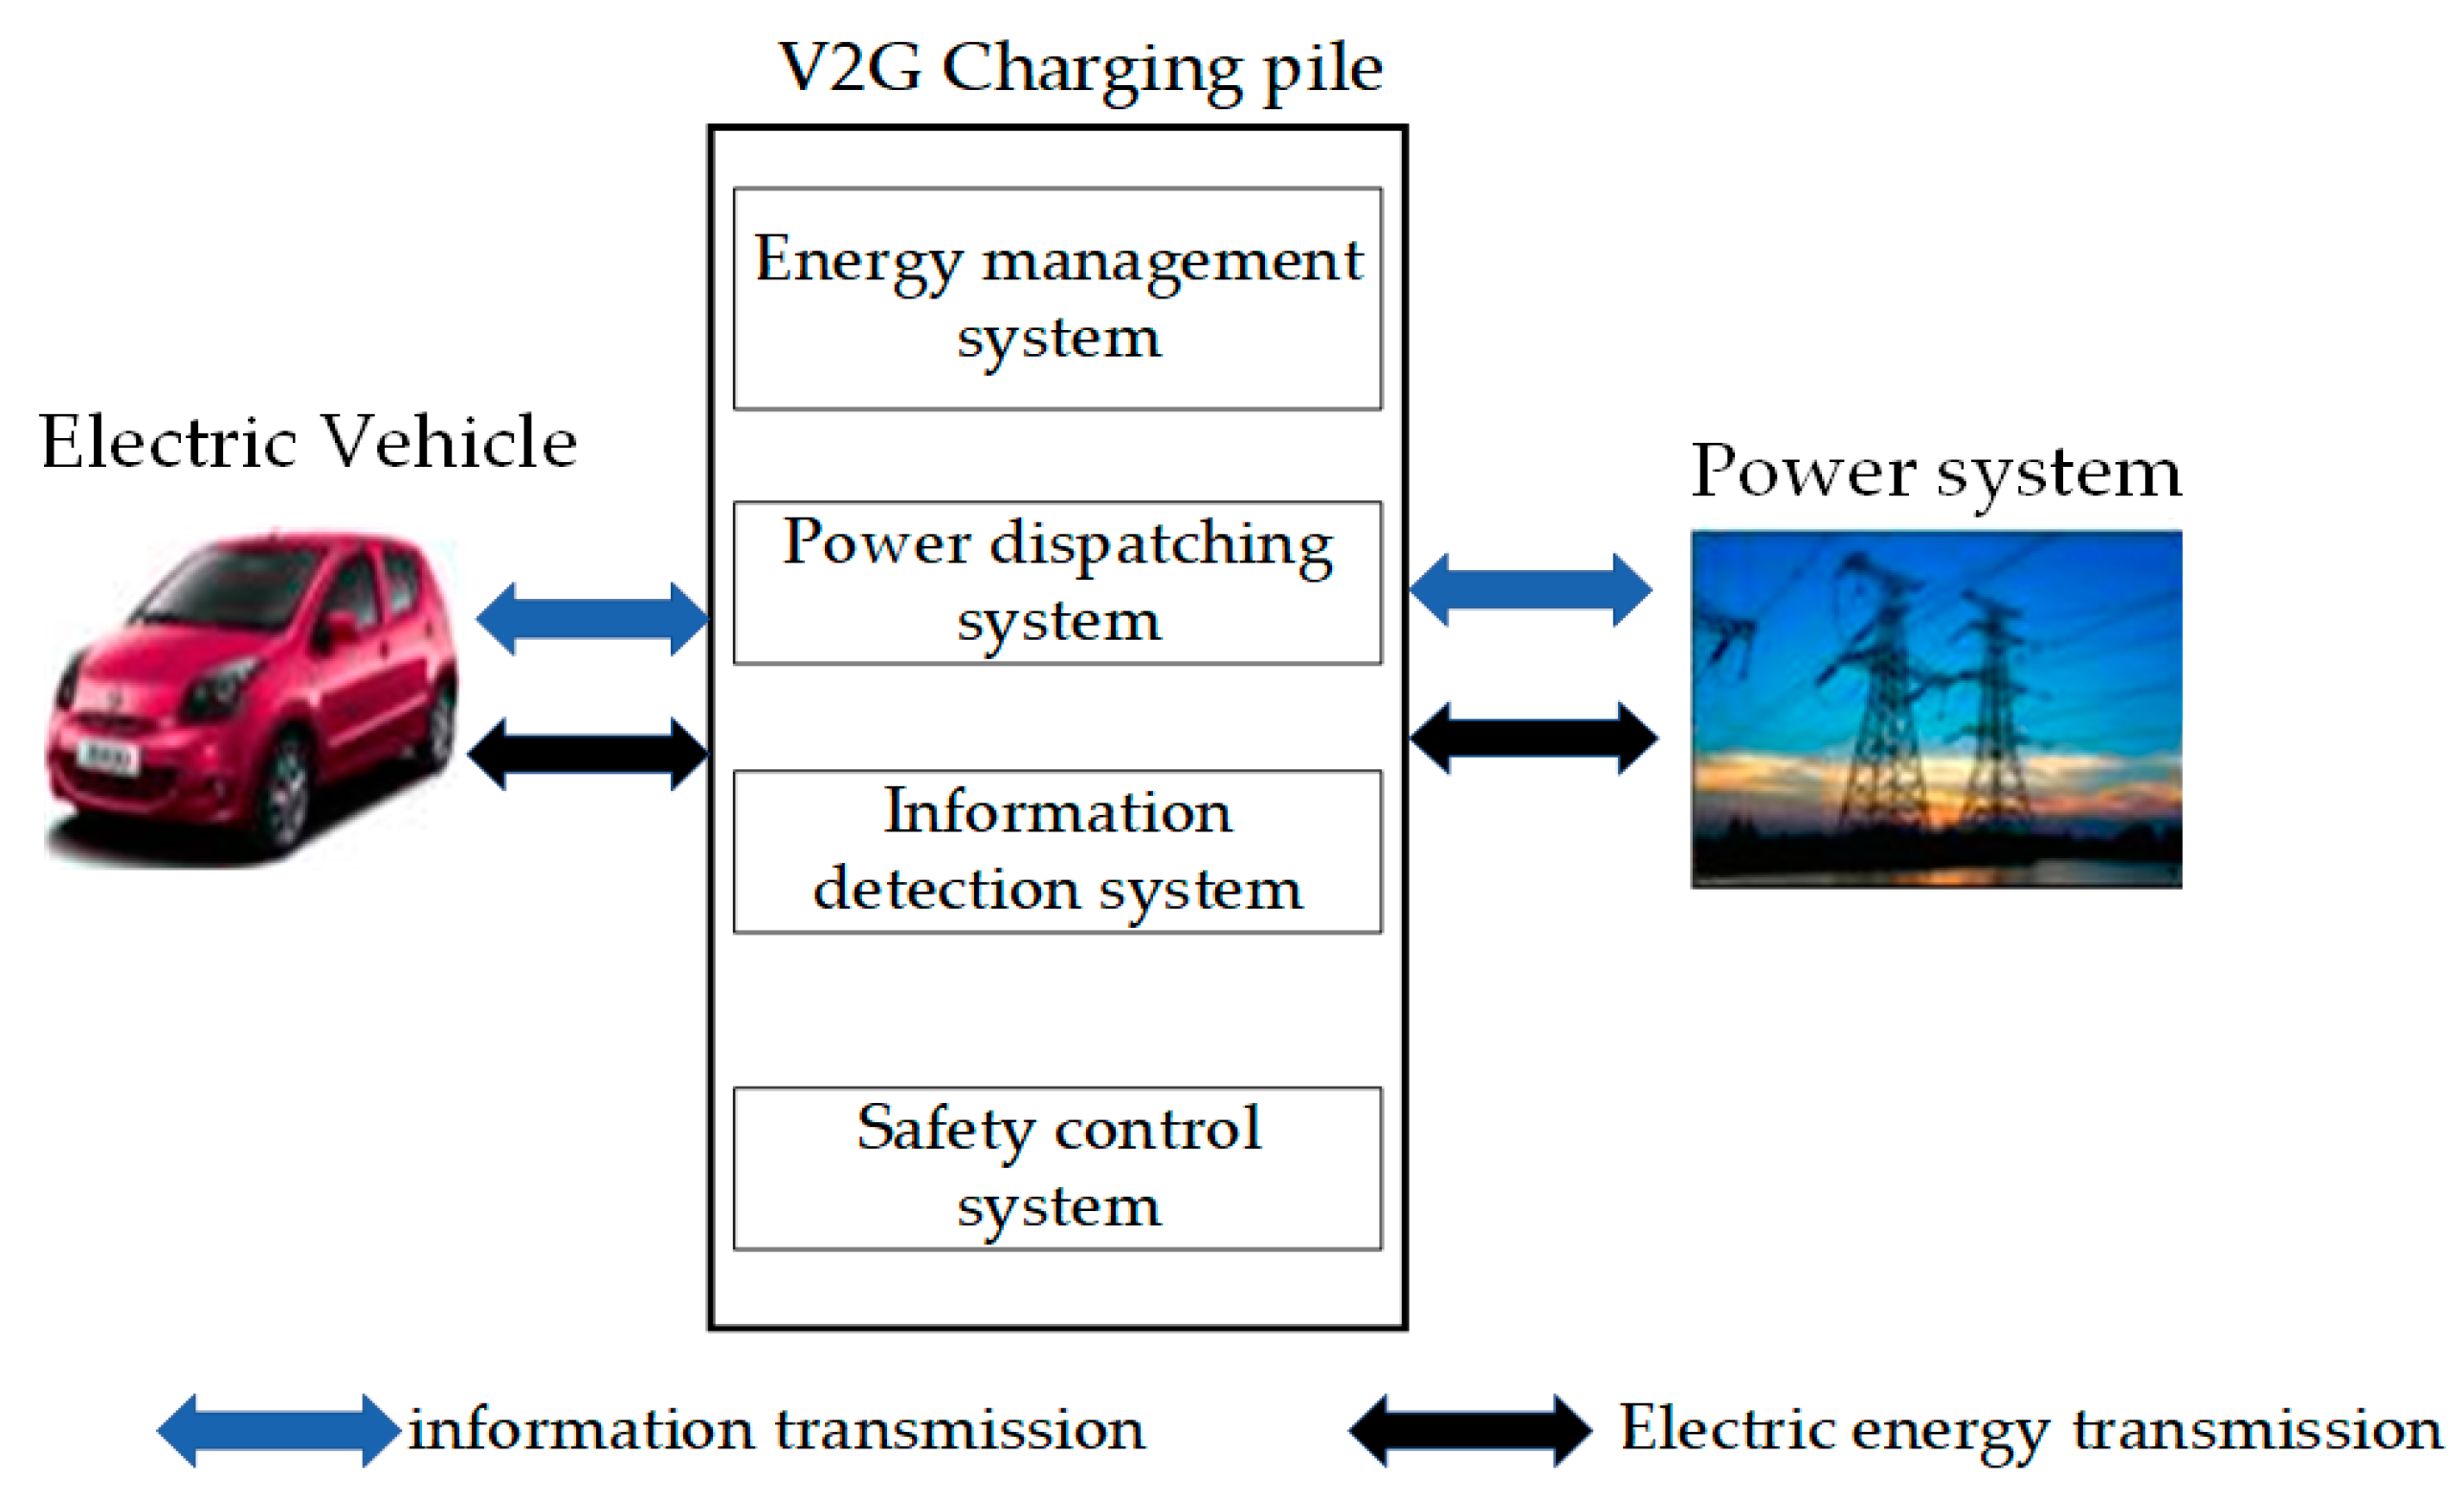
The V2G system is the abbreviation of the system after integrating two-way charging and discharging technology, two-way communication technology, safety monitoring technology, data acquisition technology, and intelligent control technology [
16]. The conceptual diagram of the system is shown in
Figure 1. The core of the entire system is the V2G charging pile.
The most critical part of the charging pile is the charging module [
17]. The basic structure is shown in
Figure 2:
2.2. Open Fault Types and Signature Signals
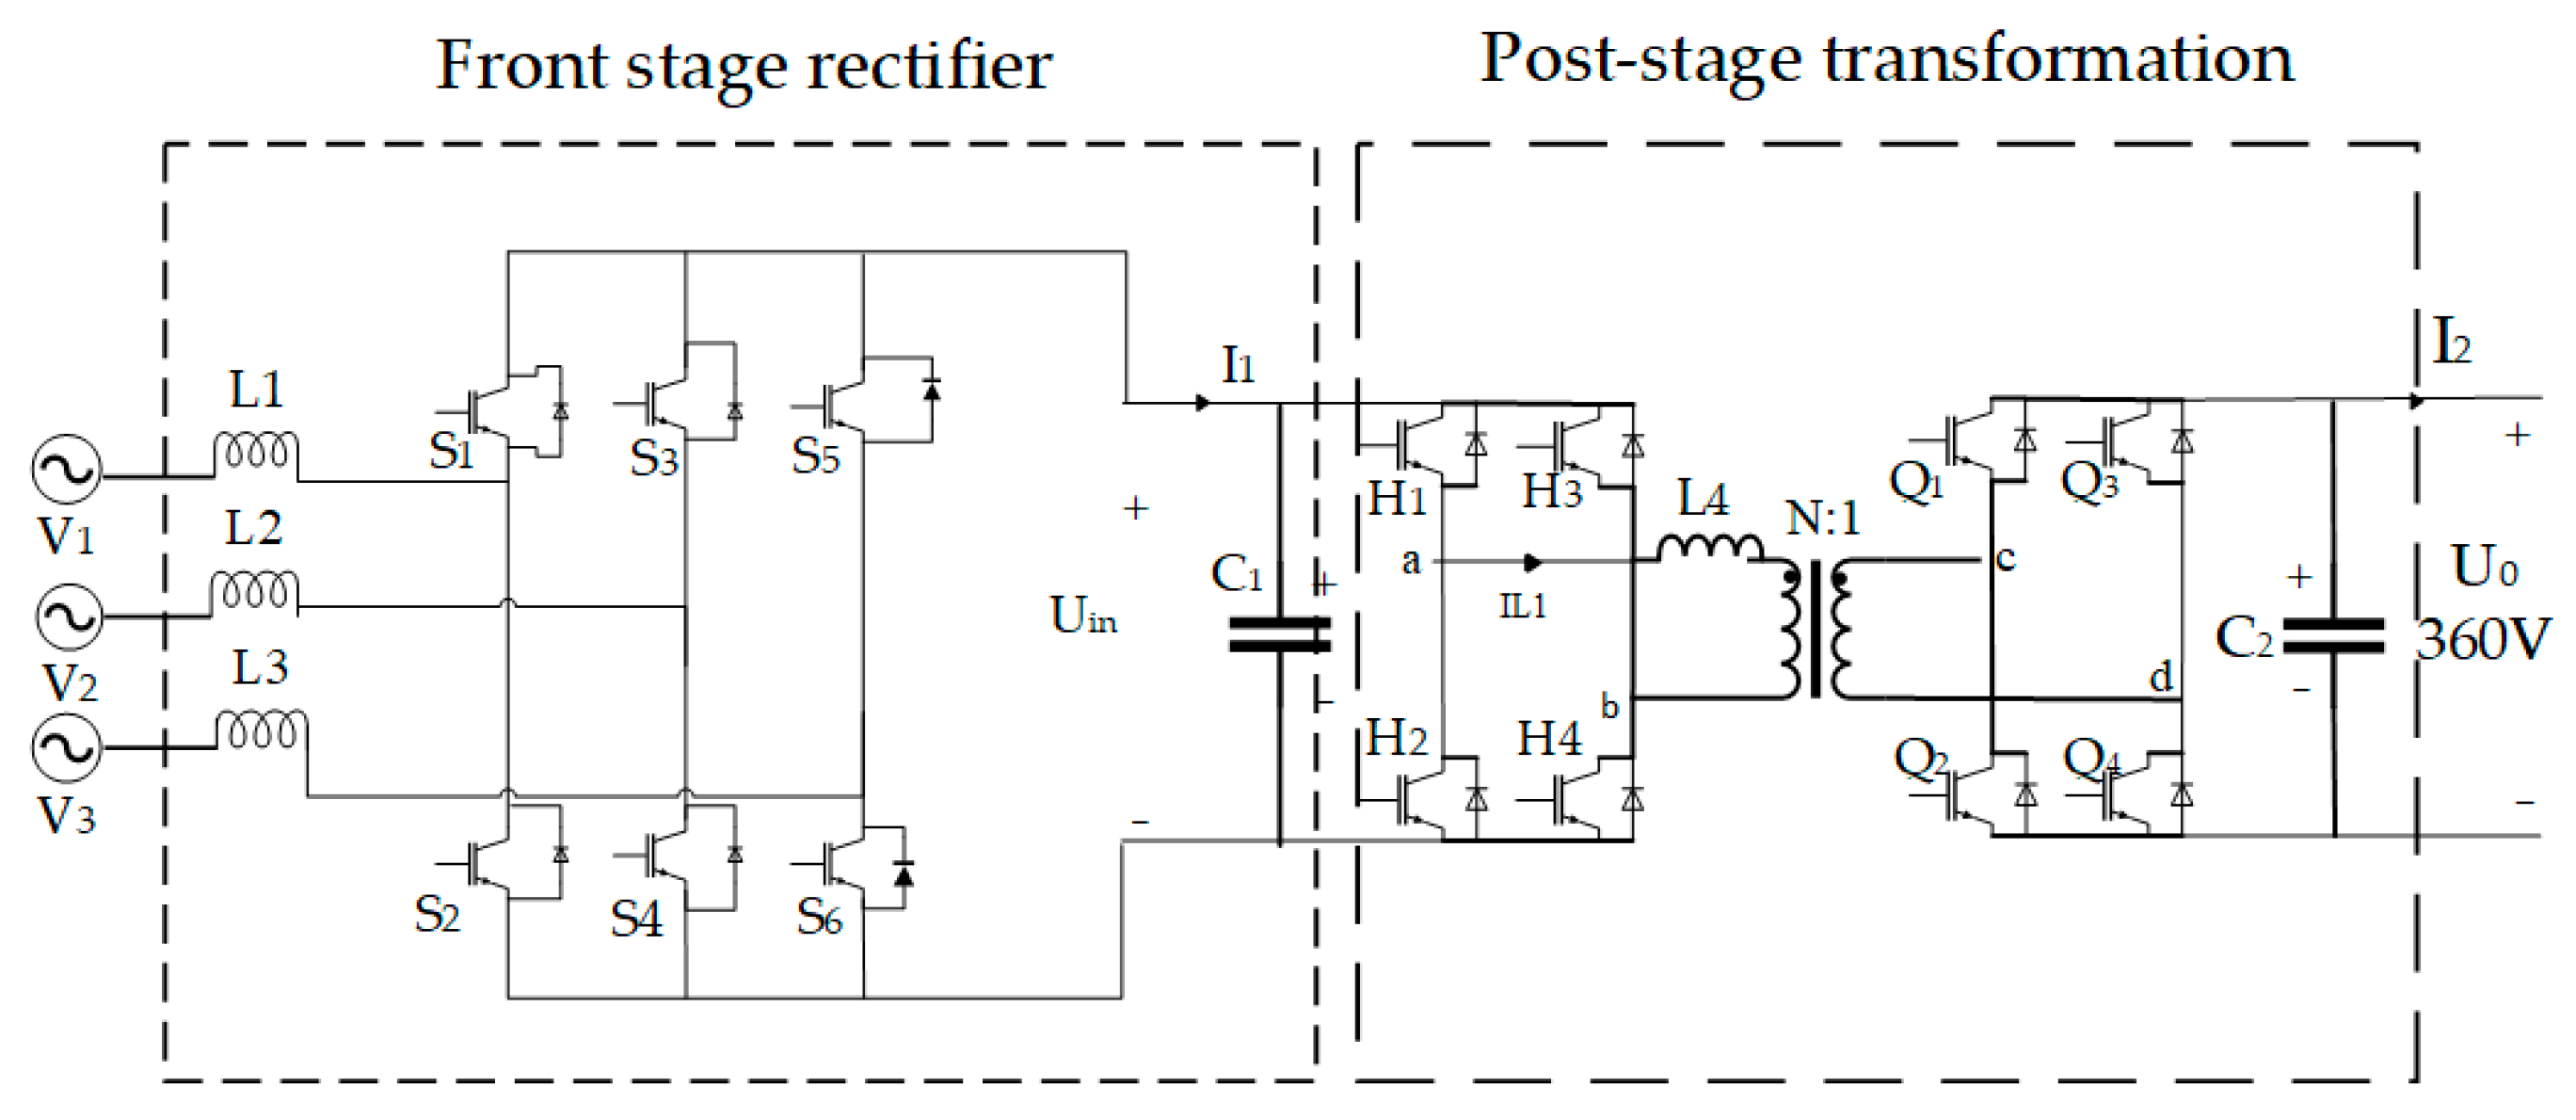
As shown in
Figure 3, the pre-circuit uses a voltage source type three-phase full-bridge PWM converter (VSC), and the backstage DC converter module uses a Dual Active Bridge (DAB).
When the power tube has an open circuit fault, the input current contains a wealth of open circuit fault characteristics [
18]. We built a simulation model according to the circuit in
Figure 2 and set the circuit parameters as shown in
Table 1:
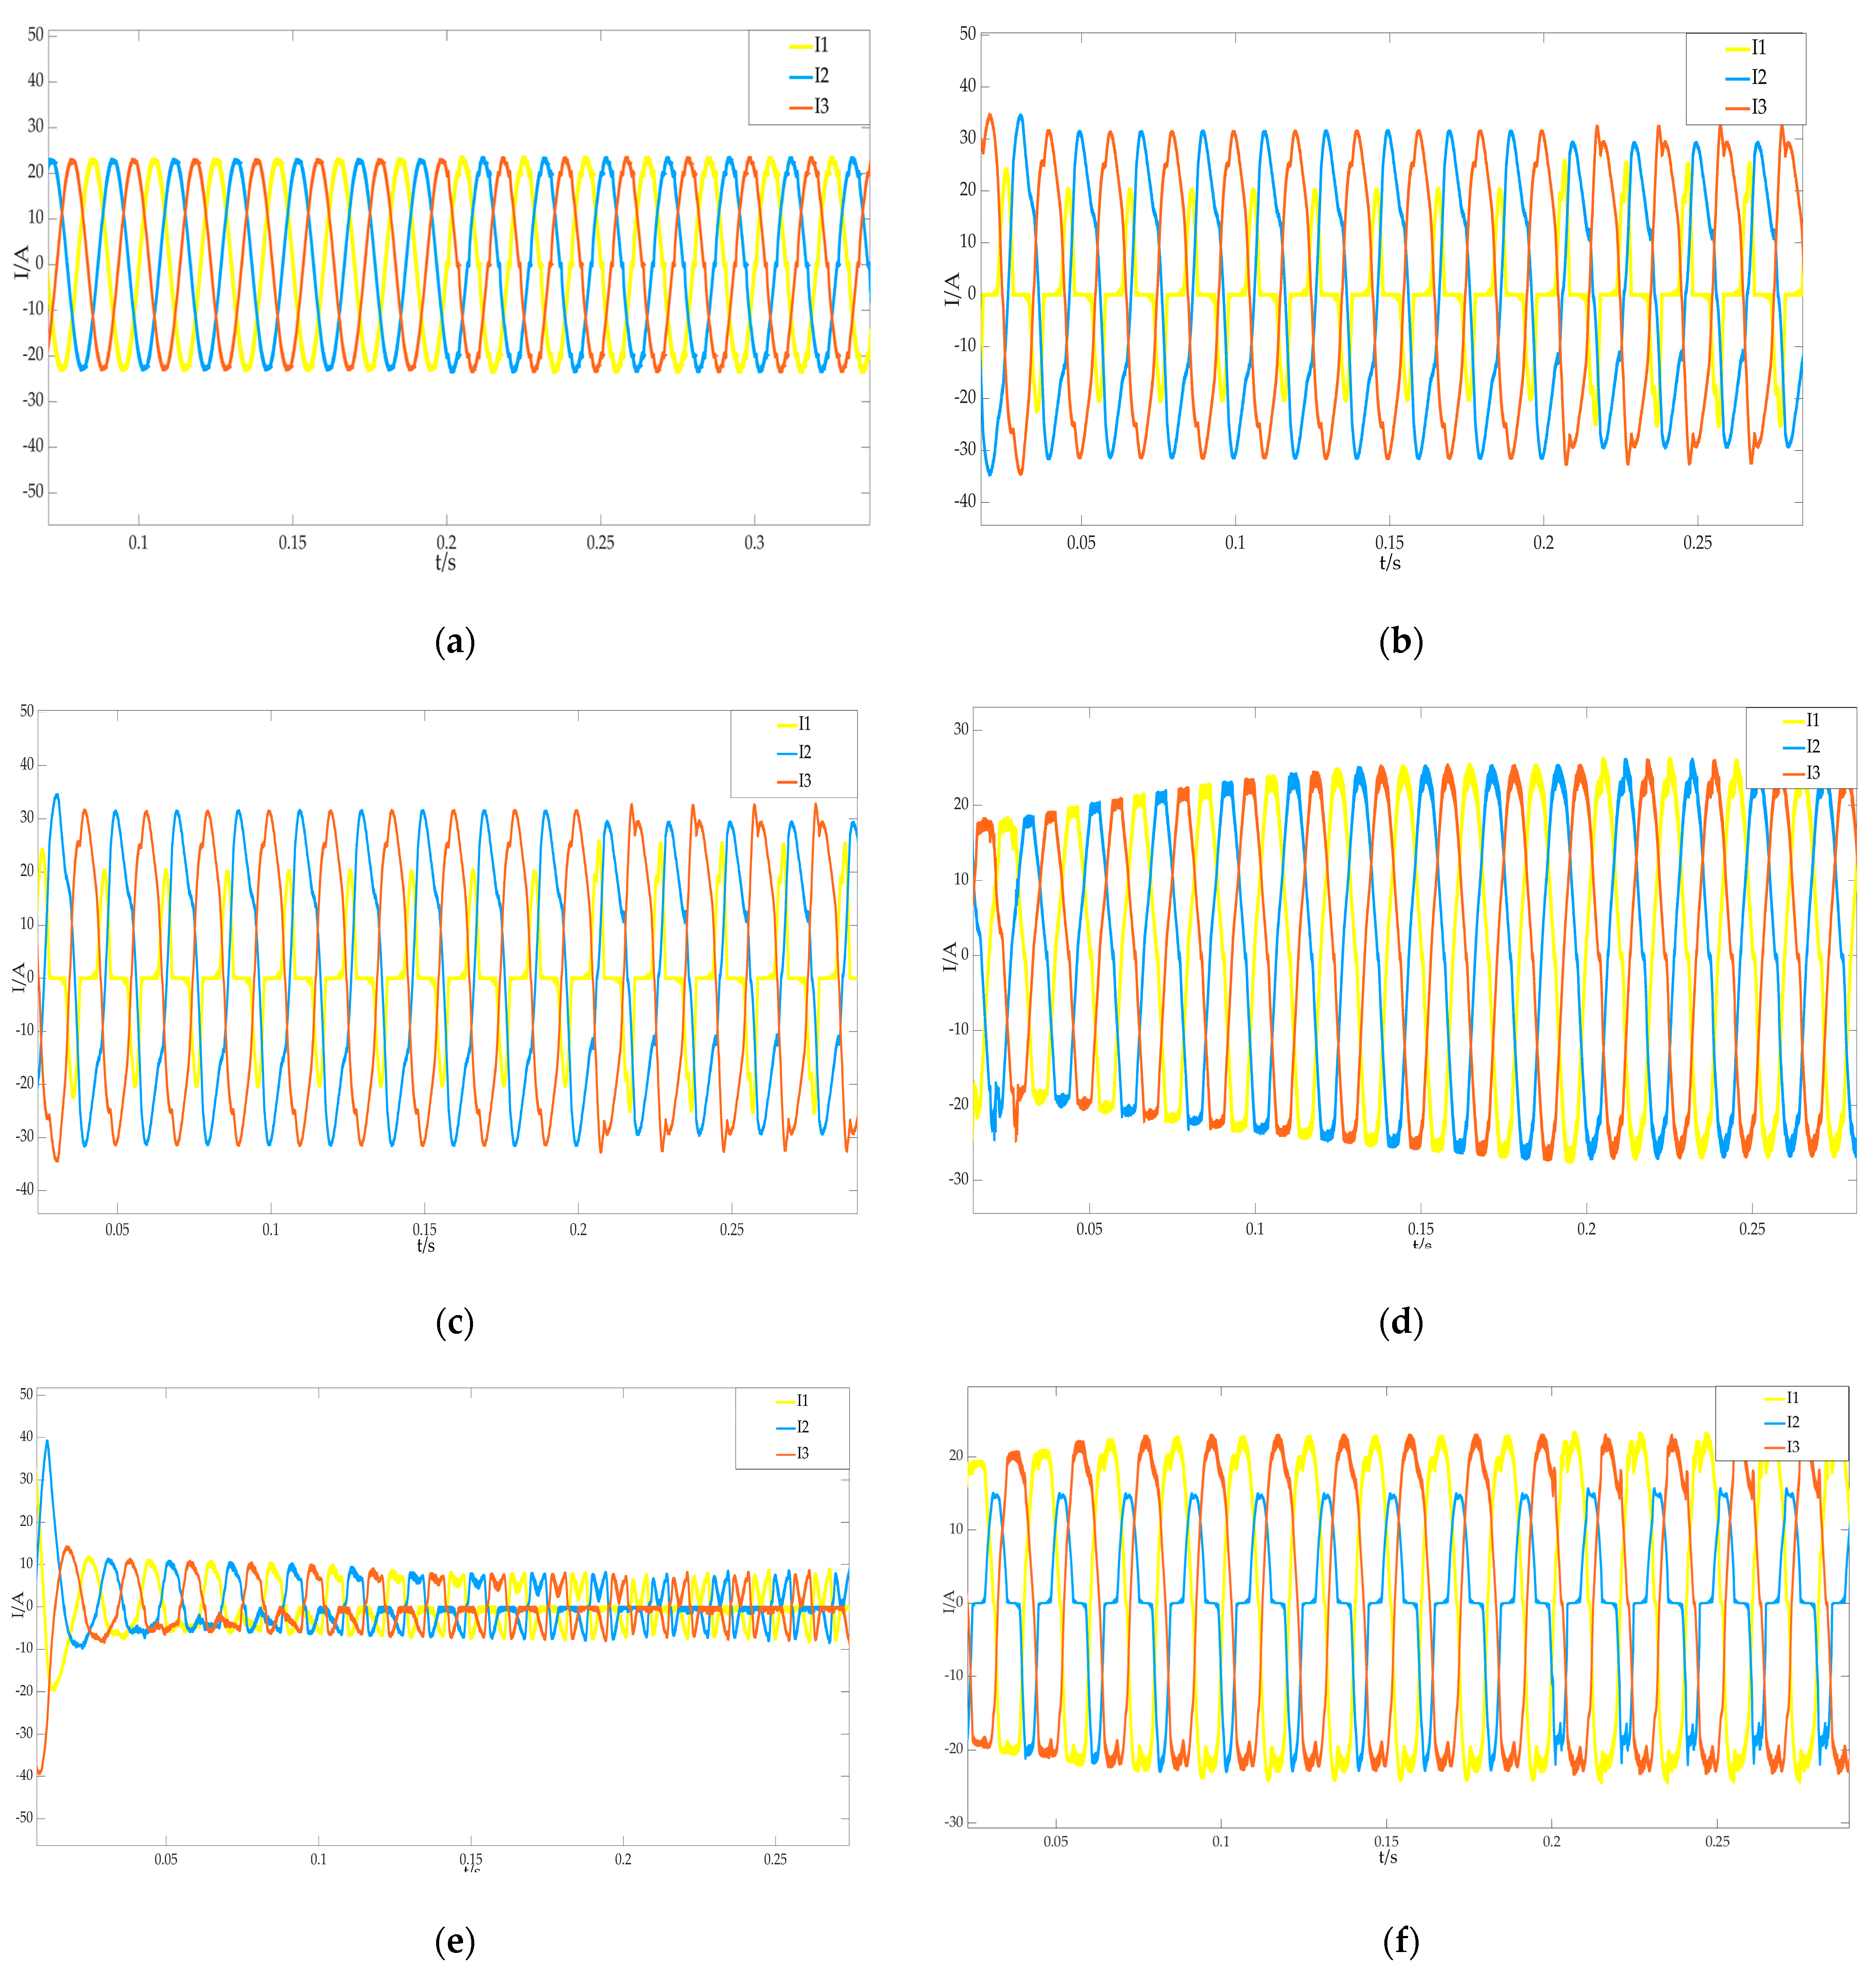
This paper mainly studies the open circuit fault diagnosis of power components of electric vehicle DC charging piles; the faults are divided into 16 types, as shown in
Table 2.
We set the sampling frequency to 4 kHz, the simulation time was 0.6 s, the pre-rectifier circuit added SVPWM modulation optimization waveform at 0.2 s, and the post-stage converter adopted single phase shift (SPS) control to collect different types of open circuit fault inductor three-phase current I1, I2, and I3 waveforms, shown in
Figure 4.
From the current waveform, the input current of each fault had different degrees of distortion, and the symmetrical power tube fault had a similar effect on the current waveform. It was found that the time-domain waveform image of the three-phase input current of the pre-inductor alone could not accurately locate the specific location of the fault. Therefore, this paper used wavelet packet transformation for time-domain analysis, extracted fault feature vectors, and then entered the model to achieve accurate classification.
2.3. Wavelet Packet Decomposition Extracts Fault Features
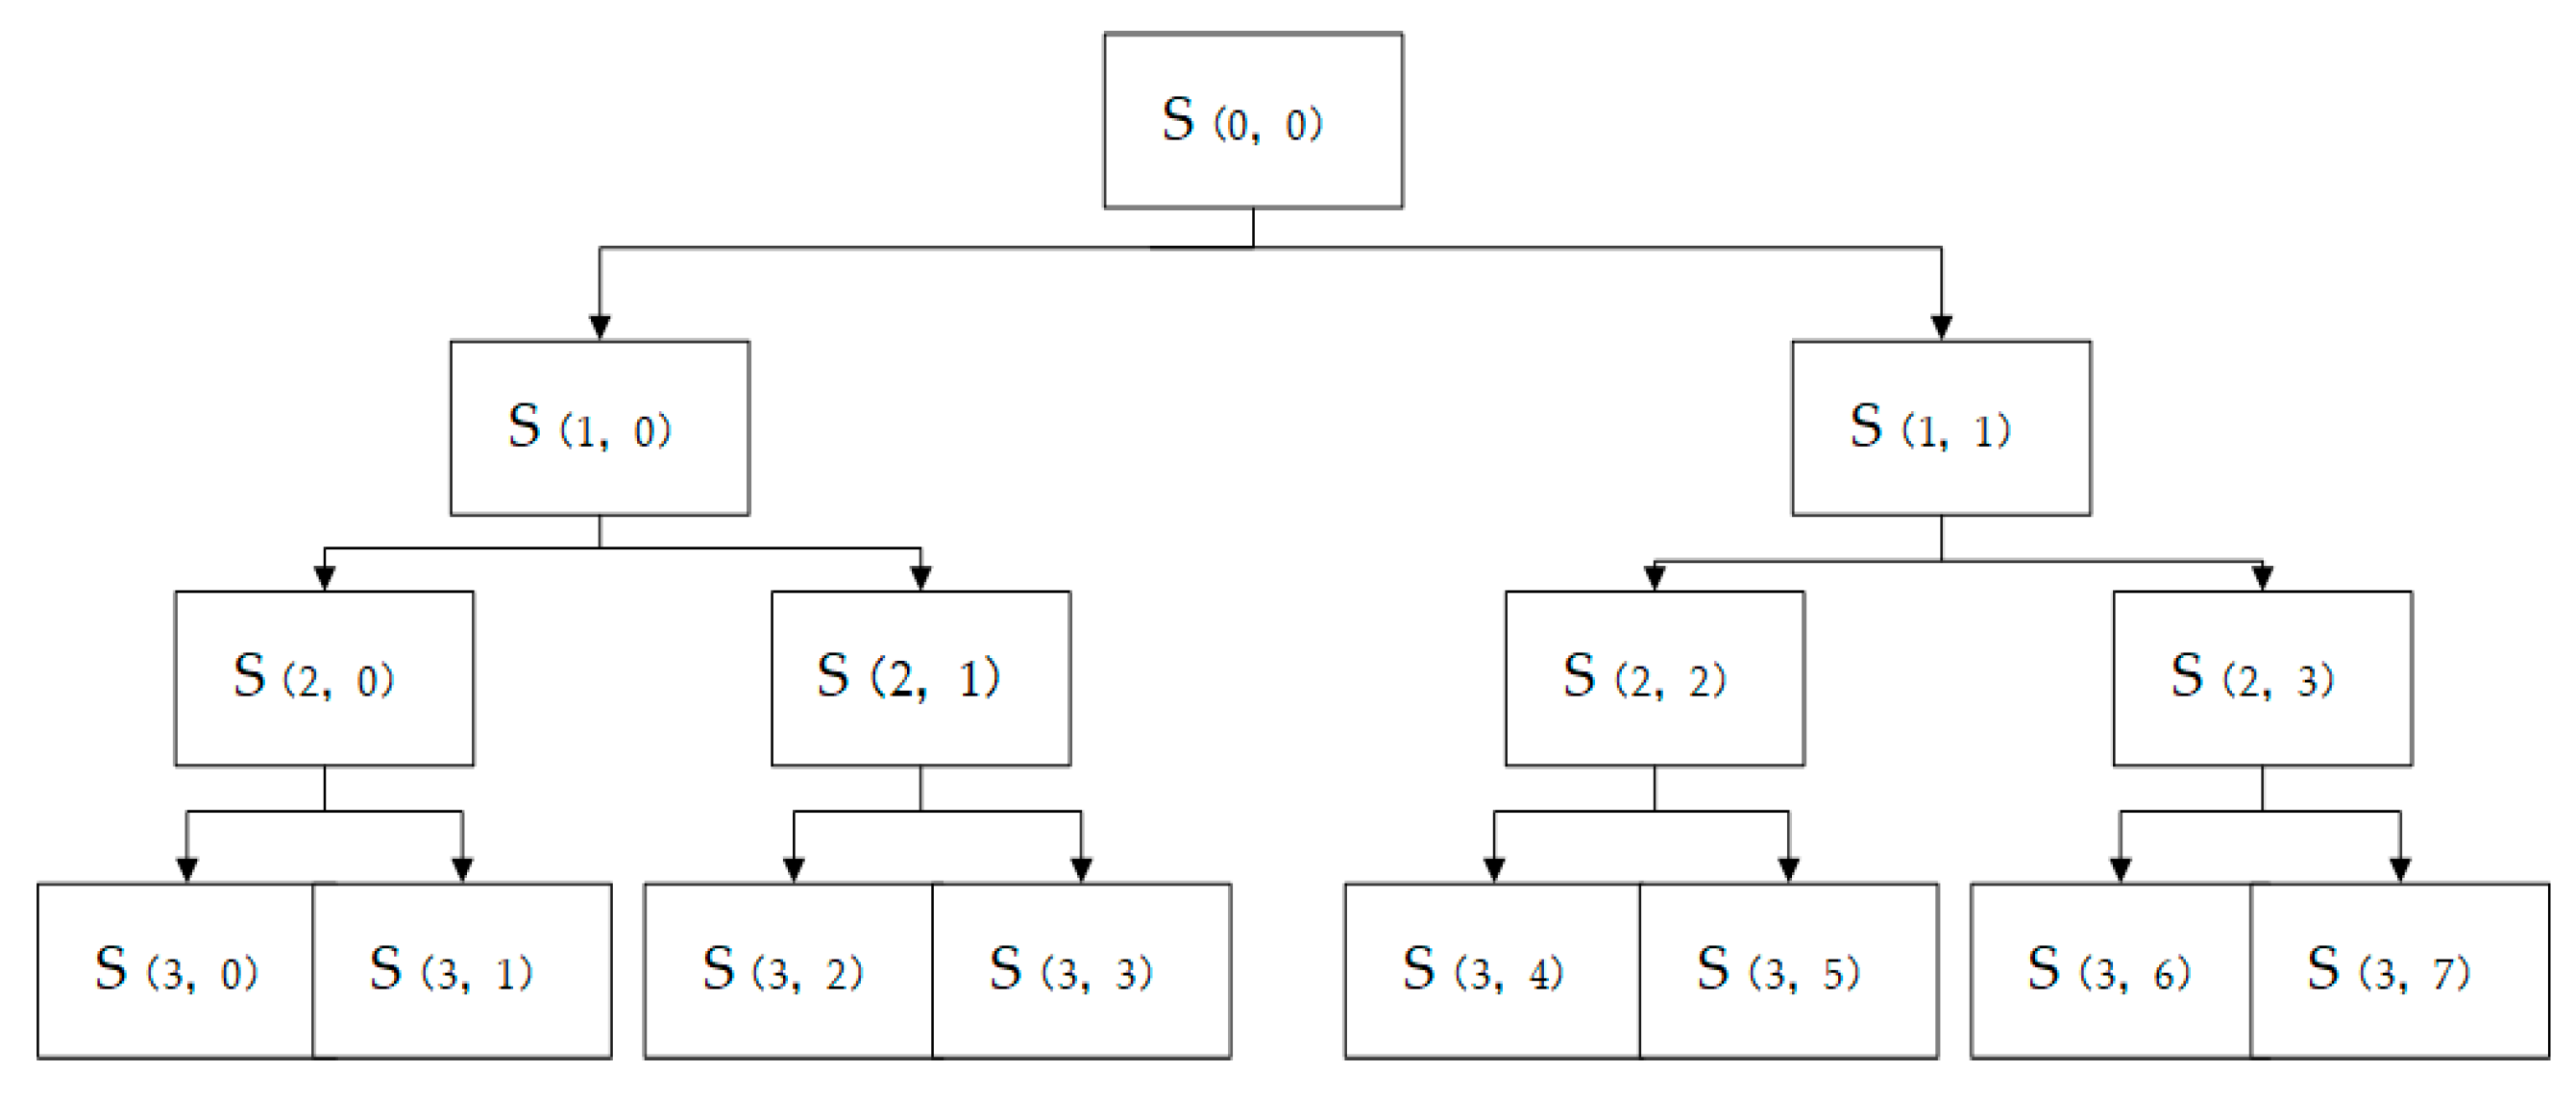
Wavelet packet decomposition can decompose the high-frequency and low-frequency amounts of the signal and improve noise immunity of the information [
19]. Dwe drew the three-layer wavelet packet structure as shown in
Figure 5.
S(0,0) is the original signal, and S (i,j) represents the decomposition signal corresponding to the j node of the i layer.
The specific steps to extract the fault characteristics are as follows:
- (1)
Set the signal sampling frequency to 4 kHz. The analysis frequency is 2 kHz, as can be seen from Shannon sampling [
20]. Perform a three-level decomposition of the sample data:
P is the number of decomposition layers, Np-j,n, Nk-j+1, 2n., and so on are the decomposition coefficients, and h(2p−k) and g(2p−k) are the low-pass and high-pass filter coefficients.
- (2)
Reconstruct the wavelet packet decomposition coefficient, and reconstruct the signal frequency as shown in
Table 3:
- (3)
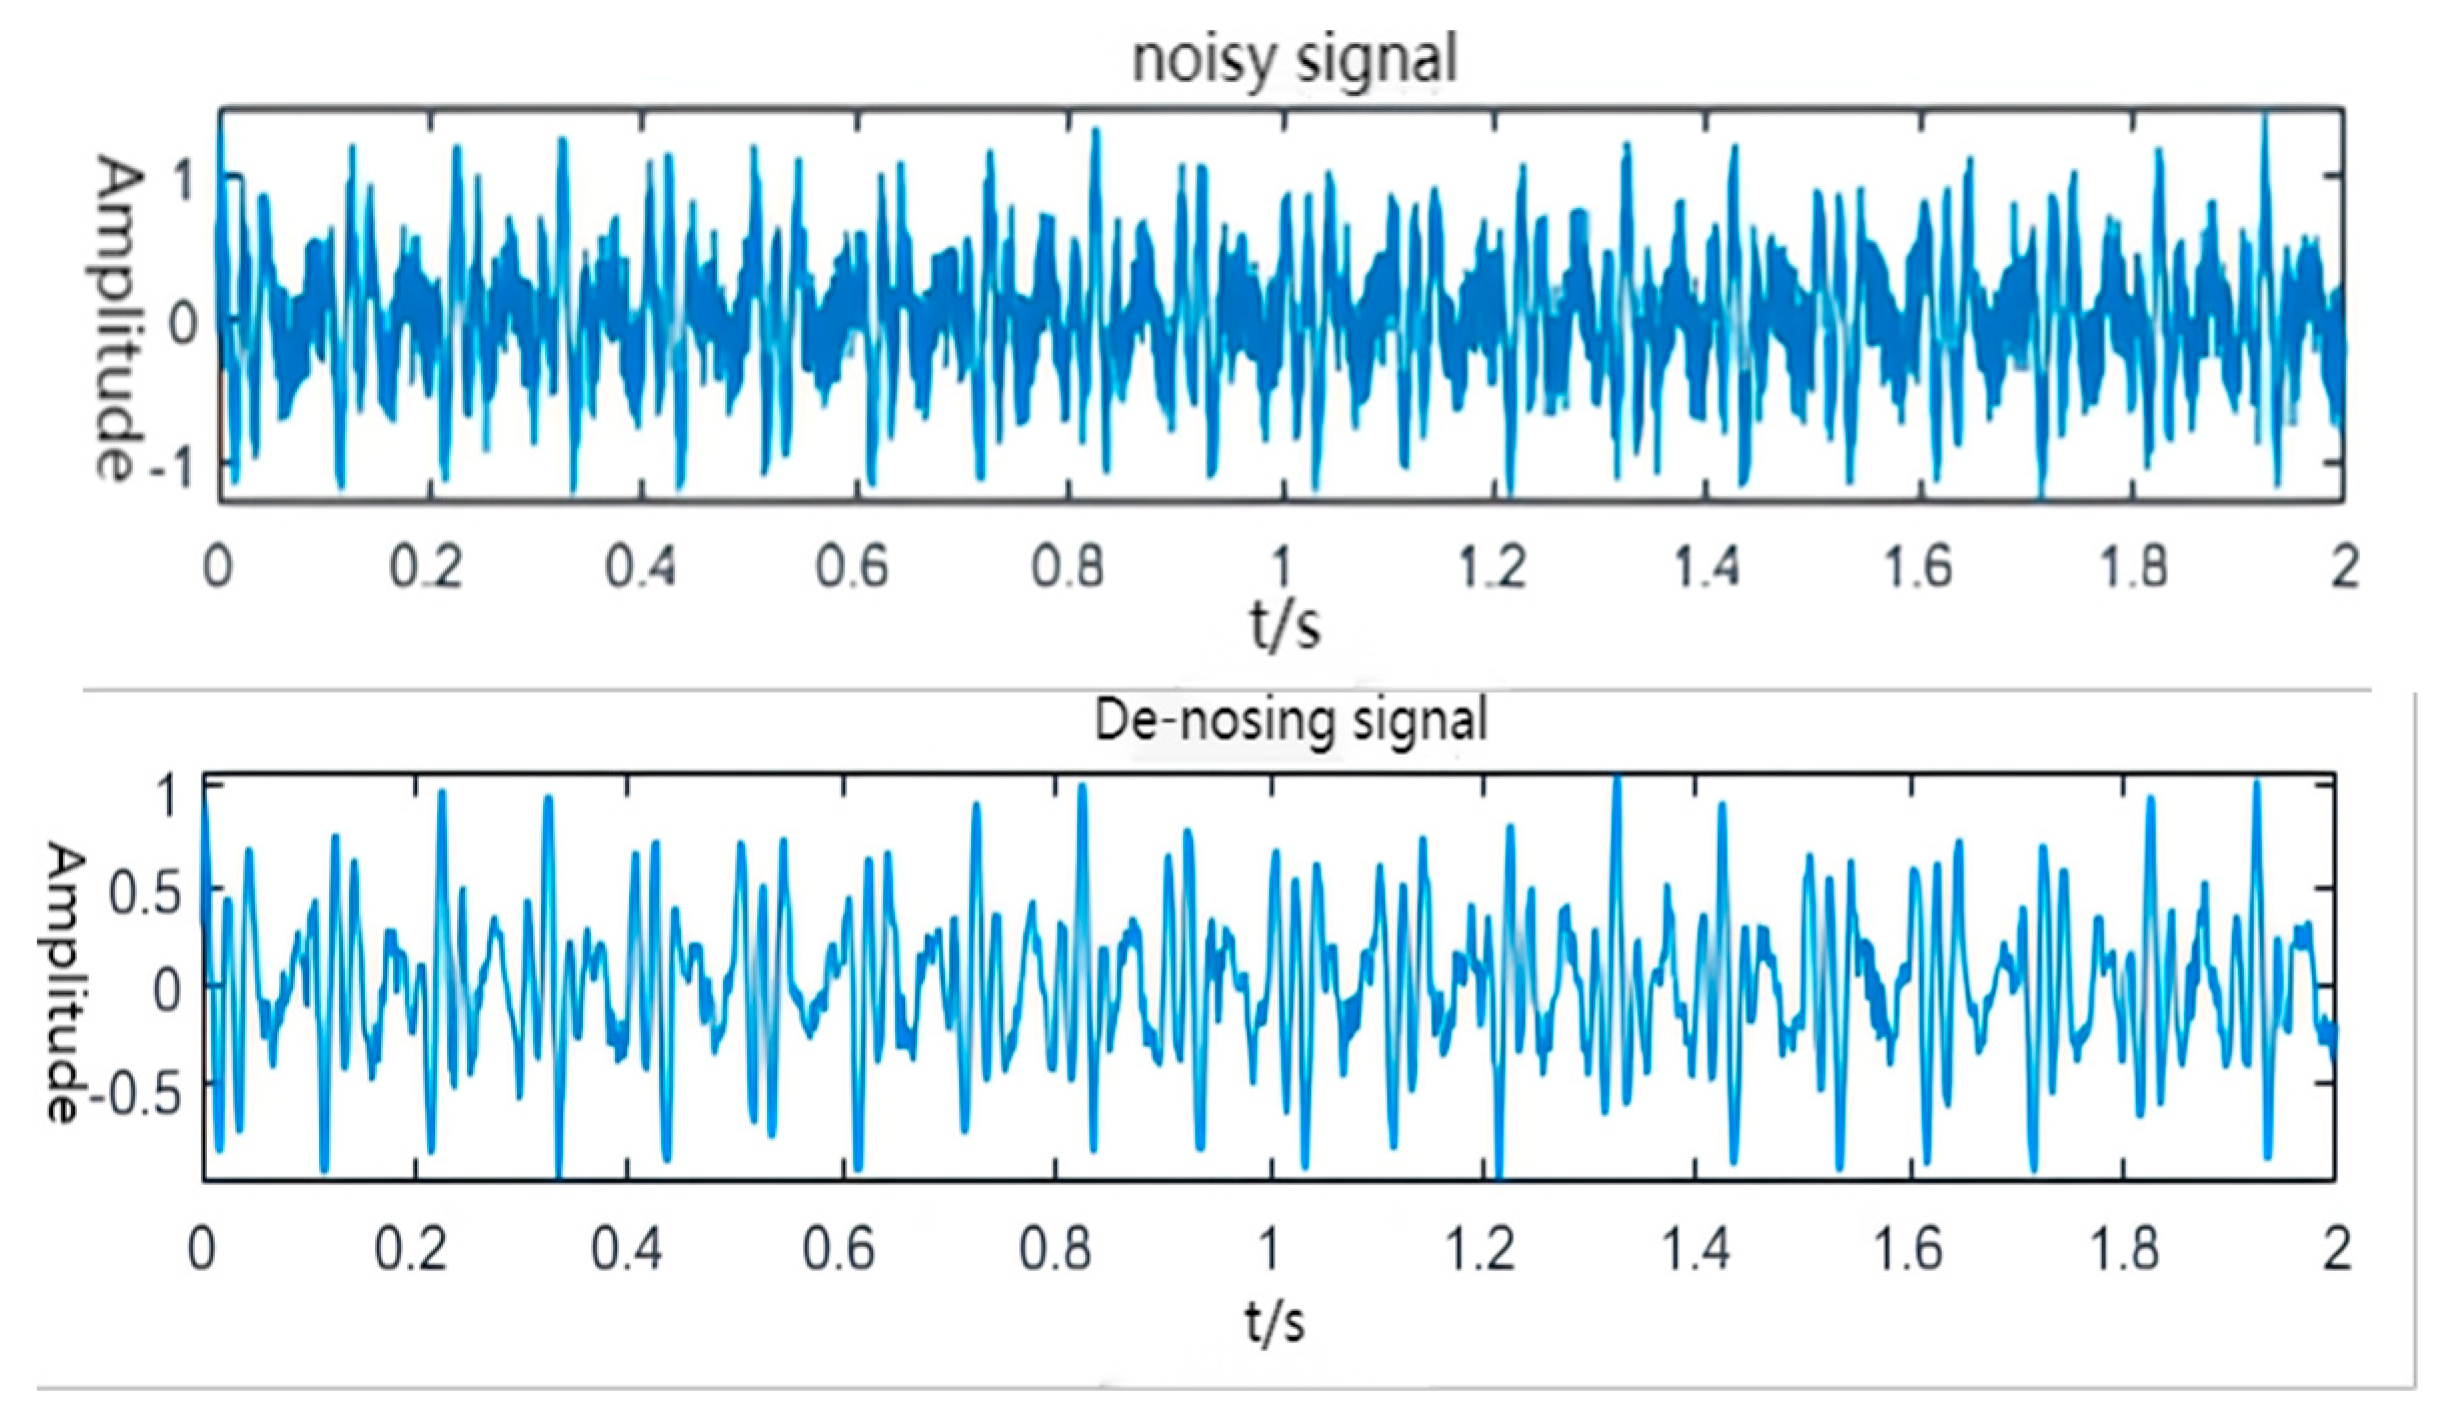
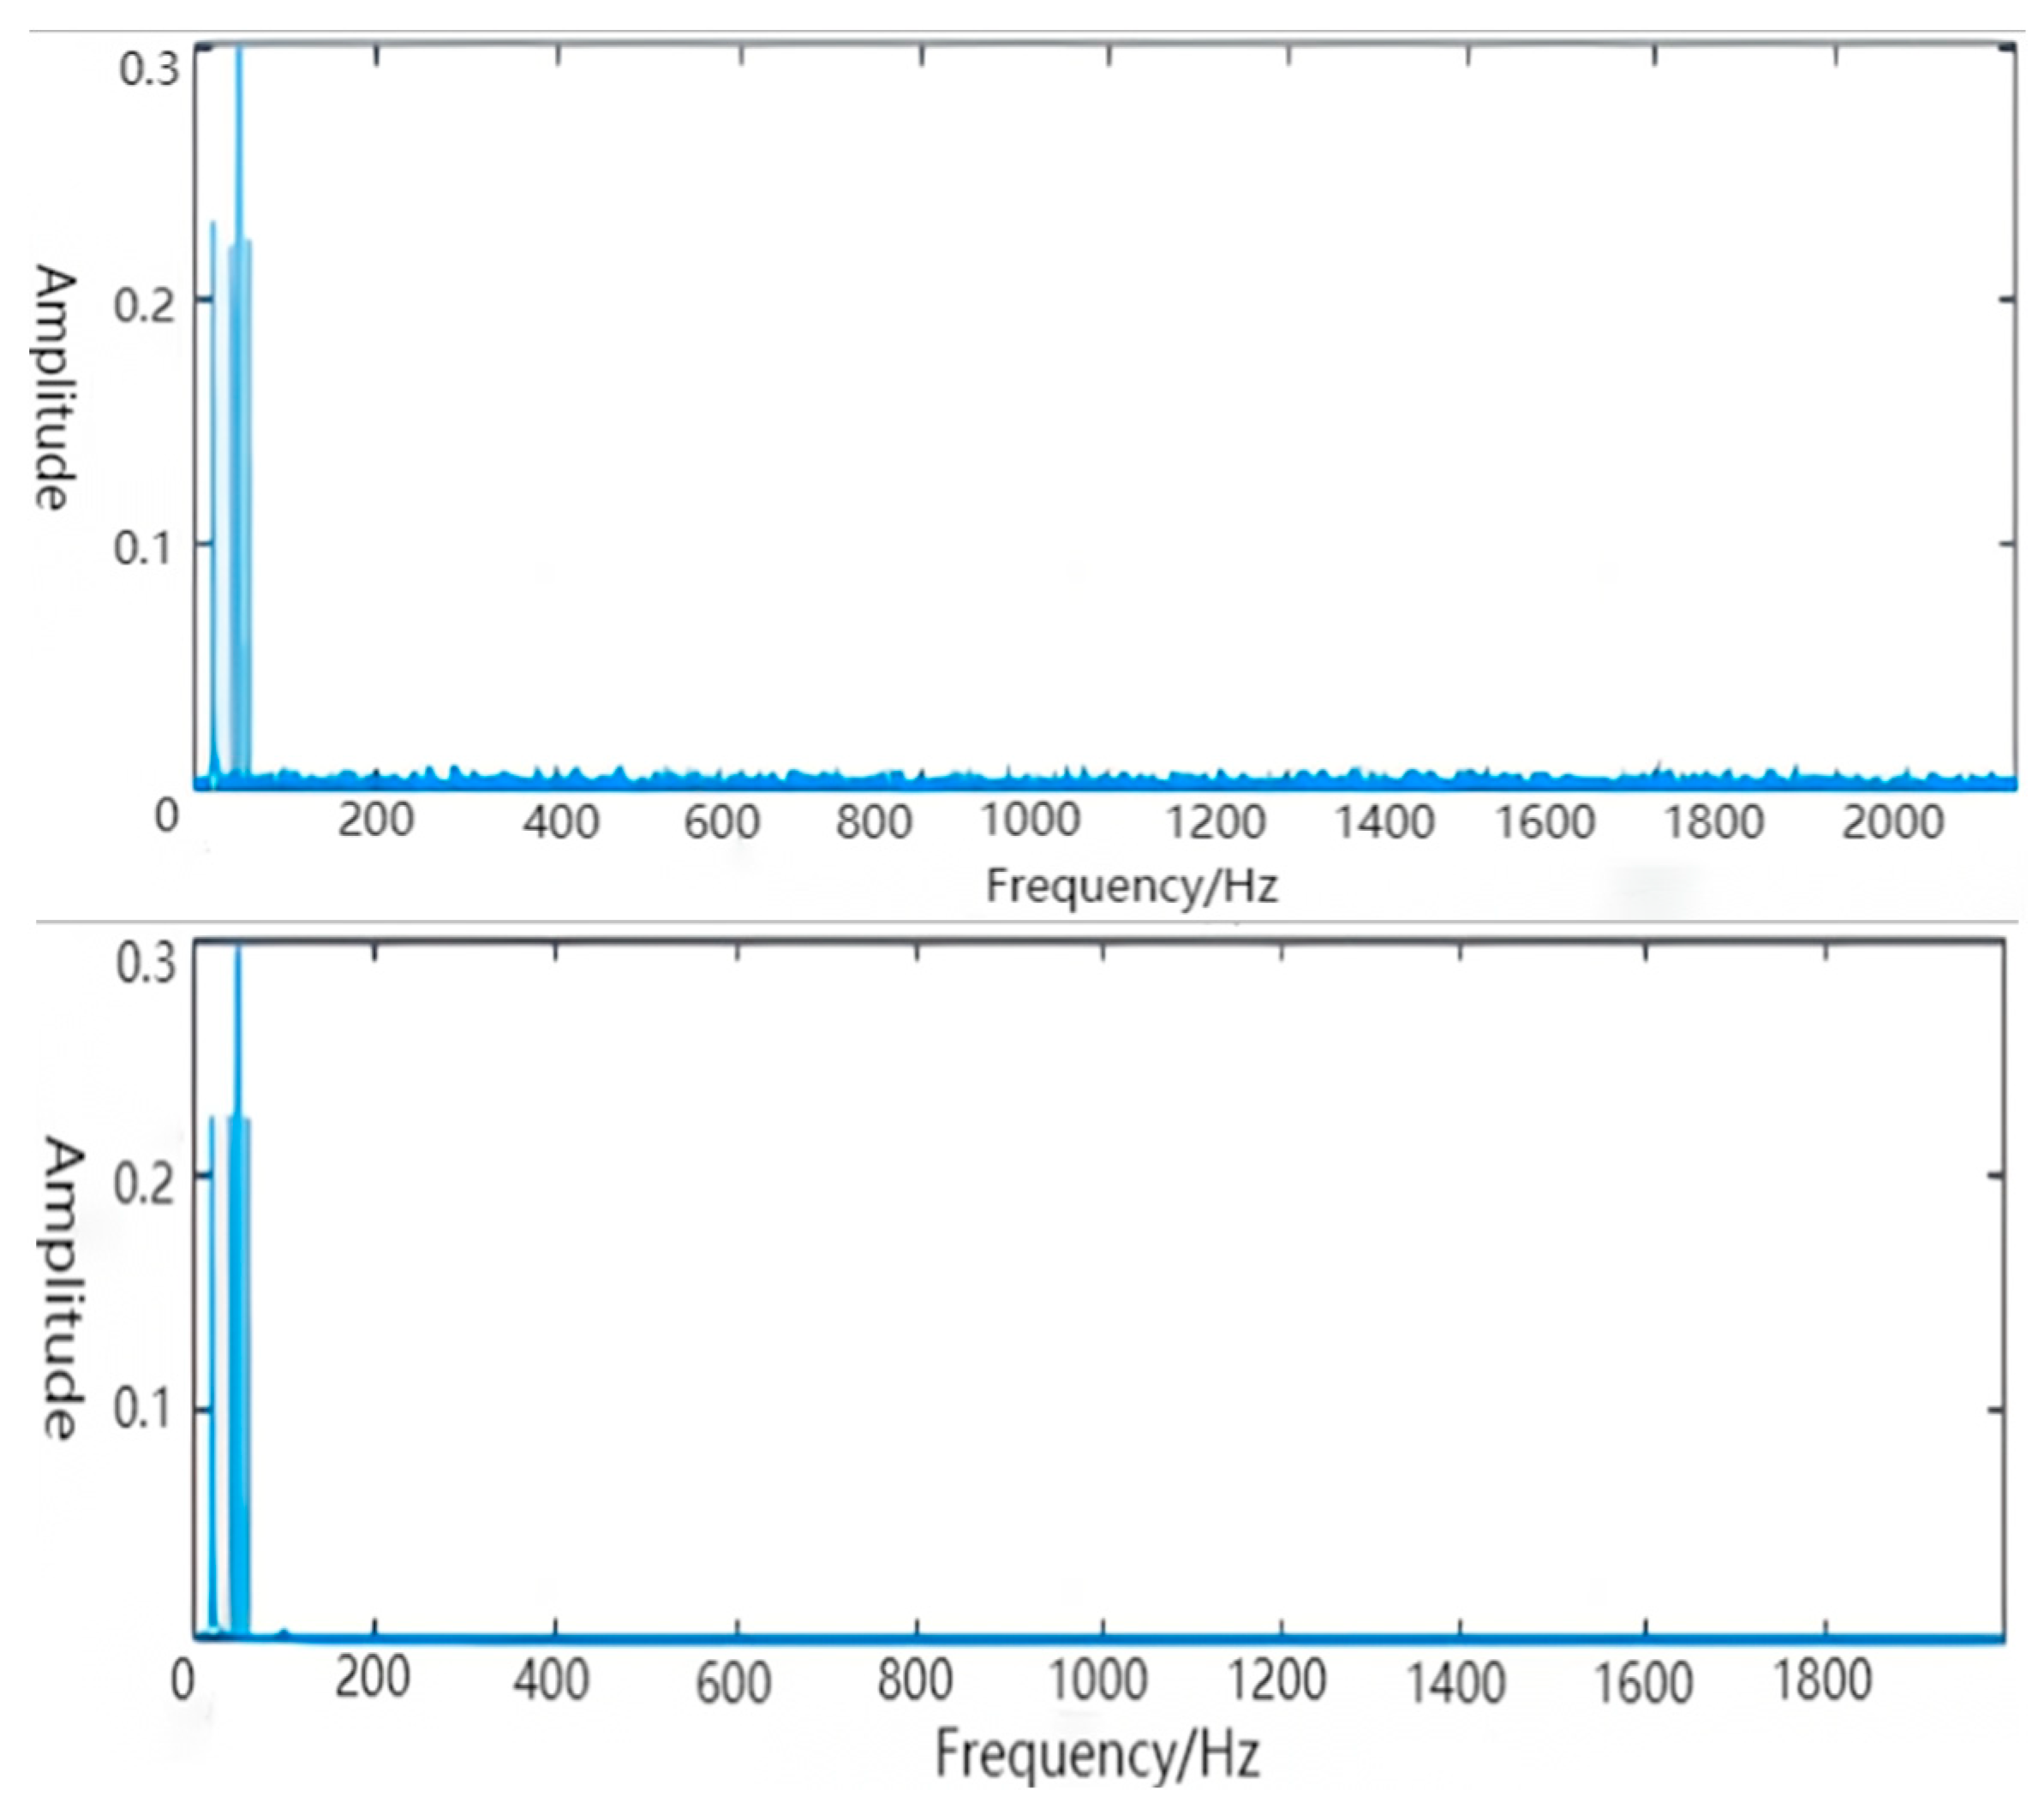
The signal is analyzed by wavelet packets to further eliminate the noise margin present in the high-frequency section. After wavelet decomposition, the wavelet decomposition coefficient of useful signal is larger, and the wavelet decomposition coefficient of noise is smaller. Therefore, by setting the threshold function for denoising, the decomposition coefficient greater than the threshold is retained, while the decomposition coefficient less than the threshold is eliminated by zeroing. Based on wavelet transformation, wavelet packet analysis subdivides and decomposes the unprocessed high-frequency components in wavelet transform again. Compared with wavelet denoising, wavelet packet analysis has higher frequency resolution, which can further eliminate the noise margin in high-frequency parts and improve the denoising accuracy. The image comparison of noisy signal and de-noised signal are shown in
Figure 6. The image comparison of signal spectrum diagrams are shown in
Figure 7.
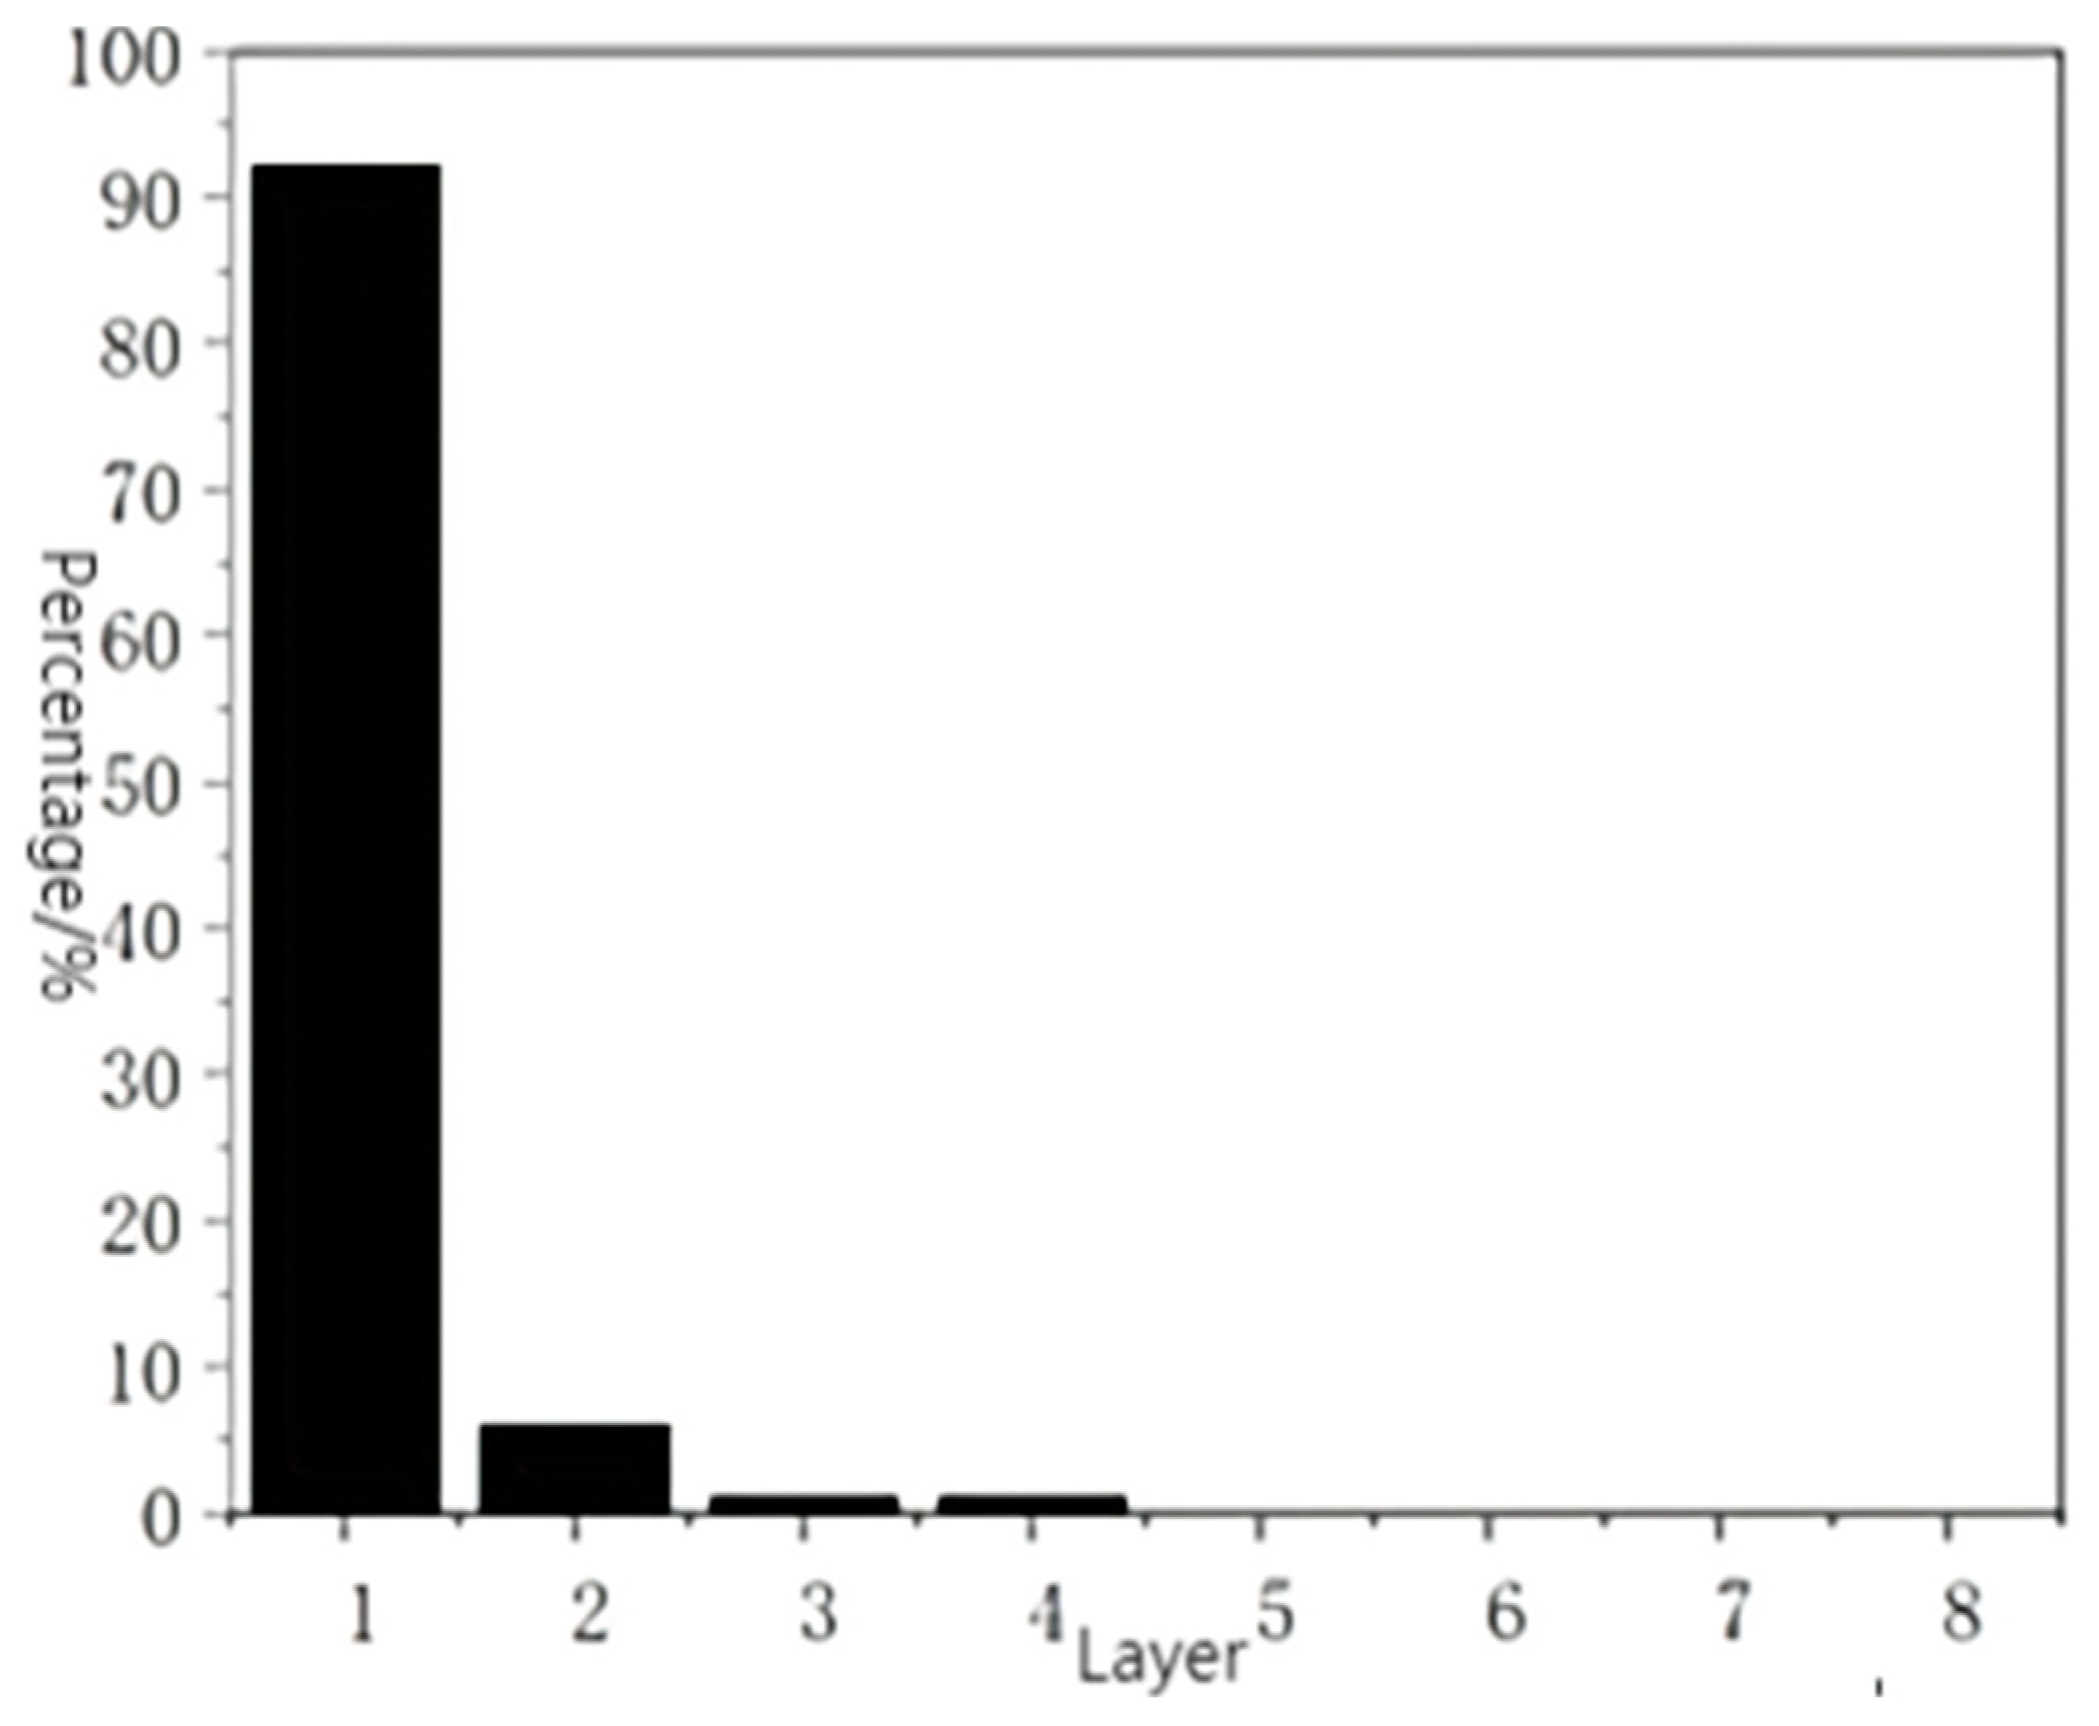
We calculated the energy of the third layer of wavelet packet energy spectrum shown in
Figure 8:
From
Figure 8 we found that the signal energy corresponding to the first node of Layer 3 accounted for more than 90%, which had rich time-frequency information. Therefore, the corresponding signal of this node was selected as a feature vector to input into the neural network.
2.4. Principle of CNN
The convolutional neural network (CNN) is a multi-layer neural network [
21] with strong adaptability. The weight-sharing network structure is shown in
Figure 9, using local spatial correlation to connect adjacent lower neuronal nodes with similar upper neuron nodes to optimize the network structure. The image can be directly used as the input of the network to improve the diagnostic accuracy, which avoids the complex feature extraction and data reconstruction process in the traditional recognition algorithm.
Figure 9 is a schematic diagram of a three-channel convolution operation, the input image is 5 * 5 size, three channels, and then reduced to 3 * 3 size after output, the operation process includes two sets of convolution kernels, namely filters W0 and W1. The original two-dimensional image was input to the convolutional layer and the convolution kernel extracted the local features of the input image. Each convolution kernel corresponds to one feature, and by increasing the number of convolution kernels, different features were extracted from the same position of the input image, thereby forming different feature maps, which were arranged and combined as the output of the convolutional layer.
2.5. Principle of SVM
The traditional neural network learning method mainly adopts the principle of empirical risk minimization, as shown in Equation (2):
The
are the loss function, according to the law of large numbers, the sample size N approaches infinity and the empirical risk, R
emp(f) approaches the ideal value [
21]. However, in reality, the training samples are limited, and the model can only make good predictions on the training set, but the effect on the test set is poor. This is often referred to as “overfitting” [
22].
Support vector machine (SVM) is a binary classification model based on the principle of structural risk minimization, which improves the overall performance of the model by controlling the ratio between empirical risk and confidence range.
represents the complexity of the model and λ is the coefficient, which was used to weigh empirical risk so that the desired risk on the entire sample would be controlled.
2.6. Particle Swarm Optimization Supports Parameter Selection of Vector Machines
Support vector machines have a high dependence on internal parameters, among which the two factors of nuclear parameter σ and penalty factor C directly affect the accuracy of classification [
23].
Particle Swarm Optimization (PSO) iteratively finds the optimal solution by simulating the predation behavior of flocks.
Firstly, a group of random particles was initialized, and iteratively finds the optimal solution. In each iteration, the particles were updated by tracking two extremes. One was the optimal solution “
Pbest” of the particle itself. The expression is shown in Equation (4):
Another extreme value is the current optimal solution of the entire population, the global extreme value “
gbest”.
In this paper, the global search capability and local search capability of particle swarm optimization are used to reasonably optimize the parameters required in the modeling process of the support vector machine, as shown in
Figure 10:
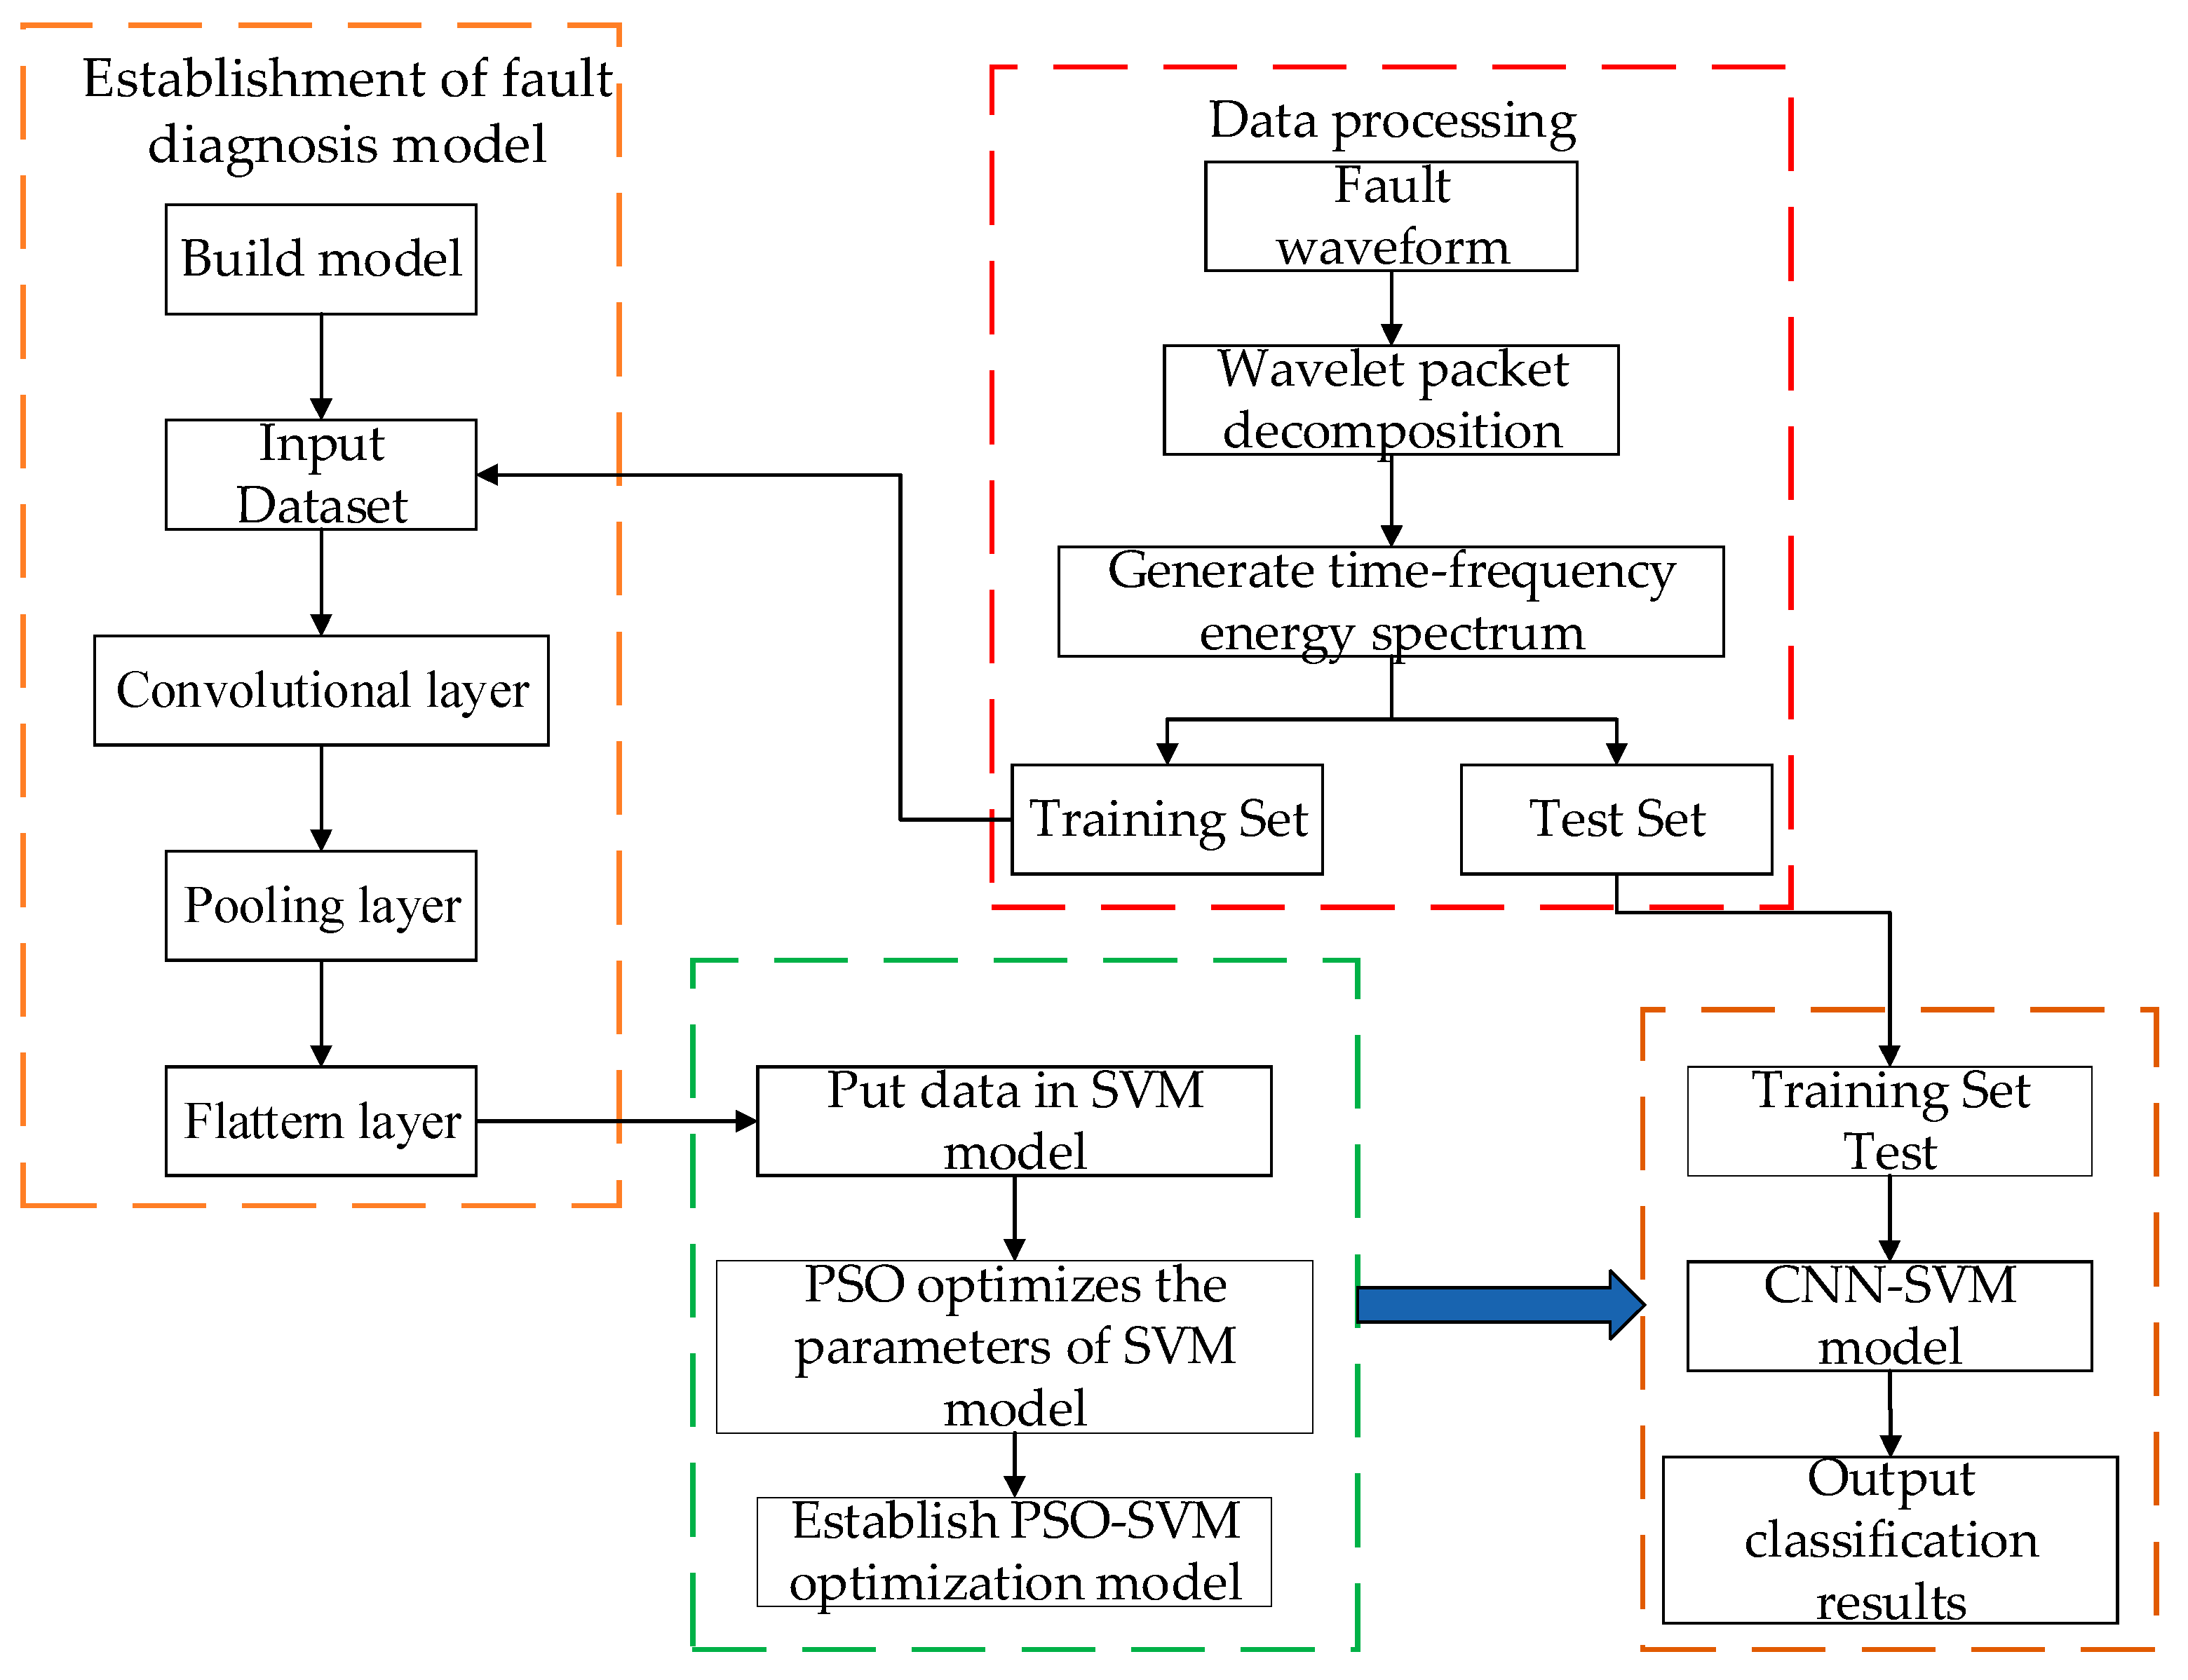
2.7. Fault Diagnosis Based on Convolution Support Vector Machine
2.7.1. Improvement of Fault Diagnosis Model
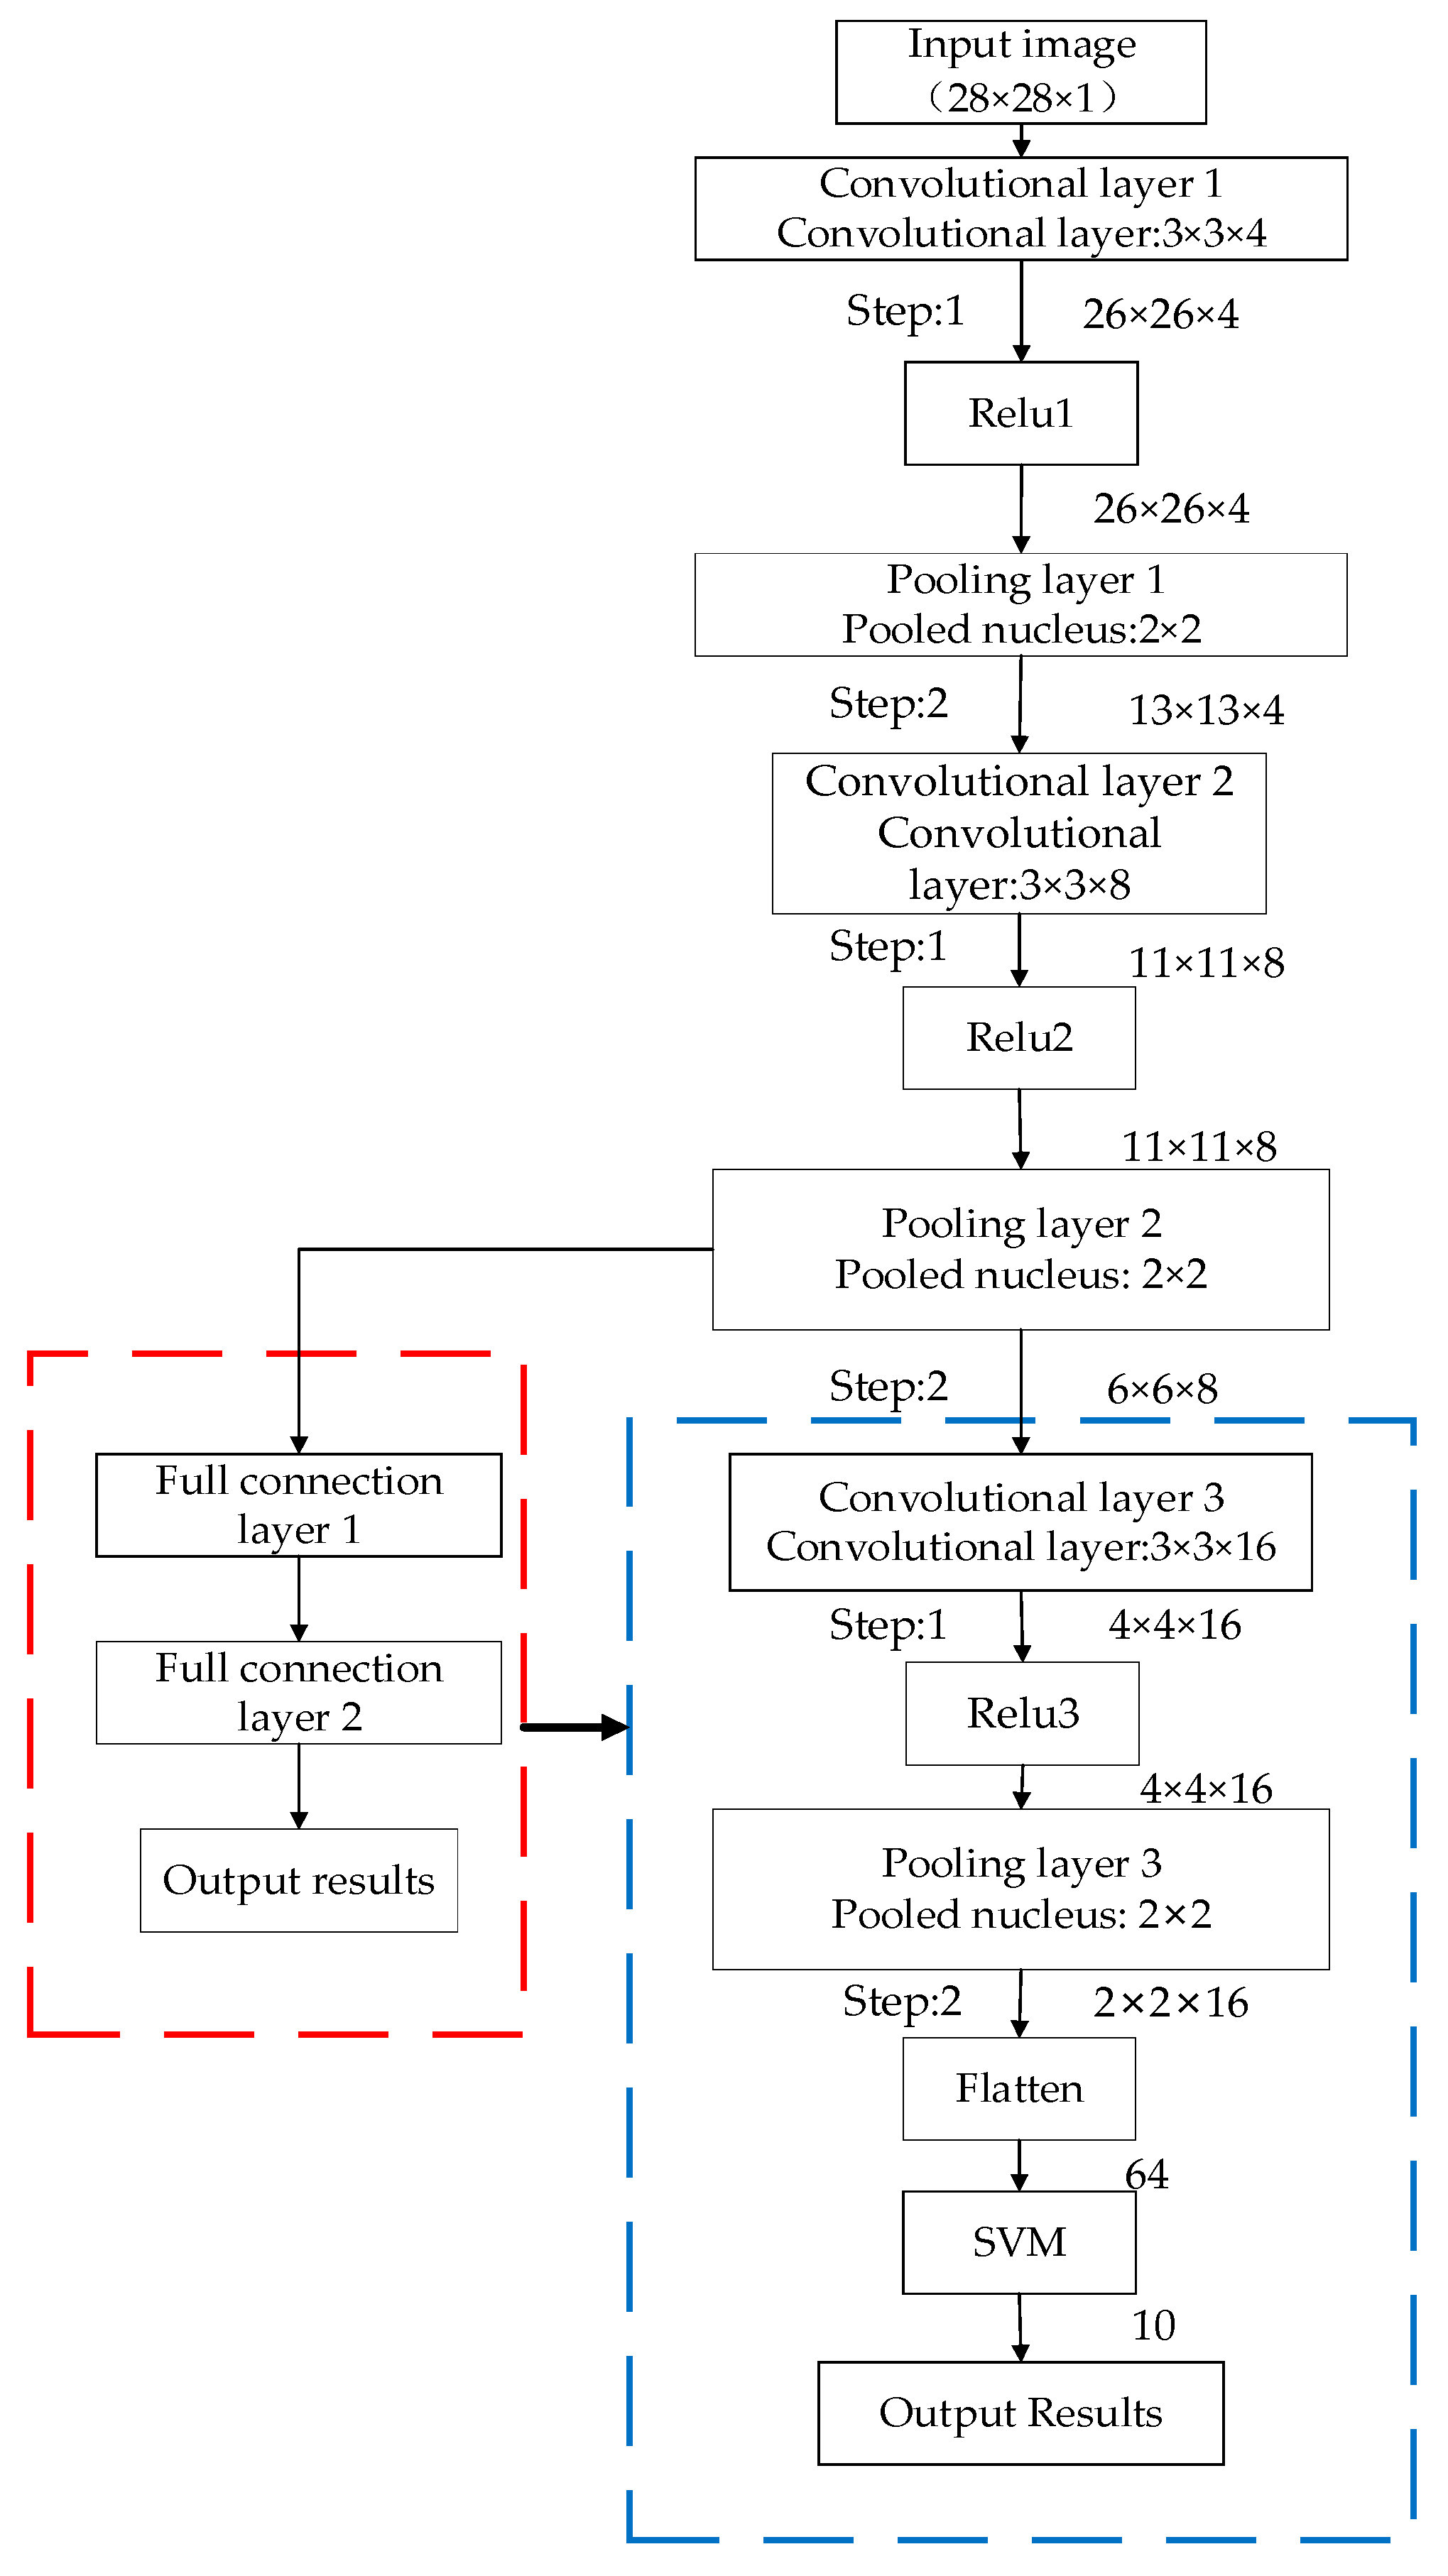
Considering that the CNN-SVM model needed to be deployed in hardware, the structure of the traditional CNN-SVM model was improved:
- (1)
The original 5 × 5 convolution kernel was replaced by a 3 × 3 size convolution kernel to further reduce the complexity of the model.
- (2)
Referring to the model structure of Yolo, ResNet, and other models [
24,
25], we modified the number of convolution channels to 4/8/16.
- (3)
The convolutional layer was increased to three layers, replacing the original double fully connected layer to further reduce the amount of parameter input.
- (4)
The data retained rich feature information through wavelet packet decomposition before entering the neural network, so the filling operation in the convolution process was removed and the hardware memory occupation was reduced. The improved model structure is shown in
Figure 11:
The statistics of the original CNN-SoftMax and the improved CNN-SVM model parameter amount (Params) and computational amount (MACC) are shown in
Table 4:
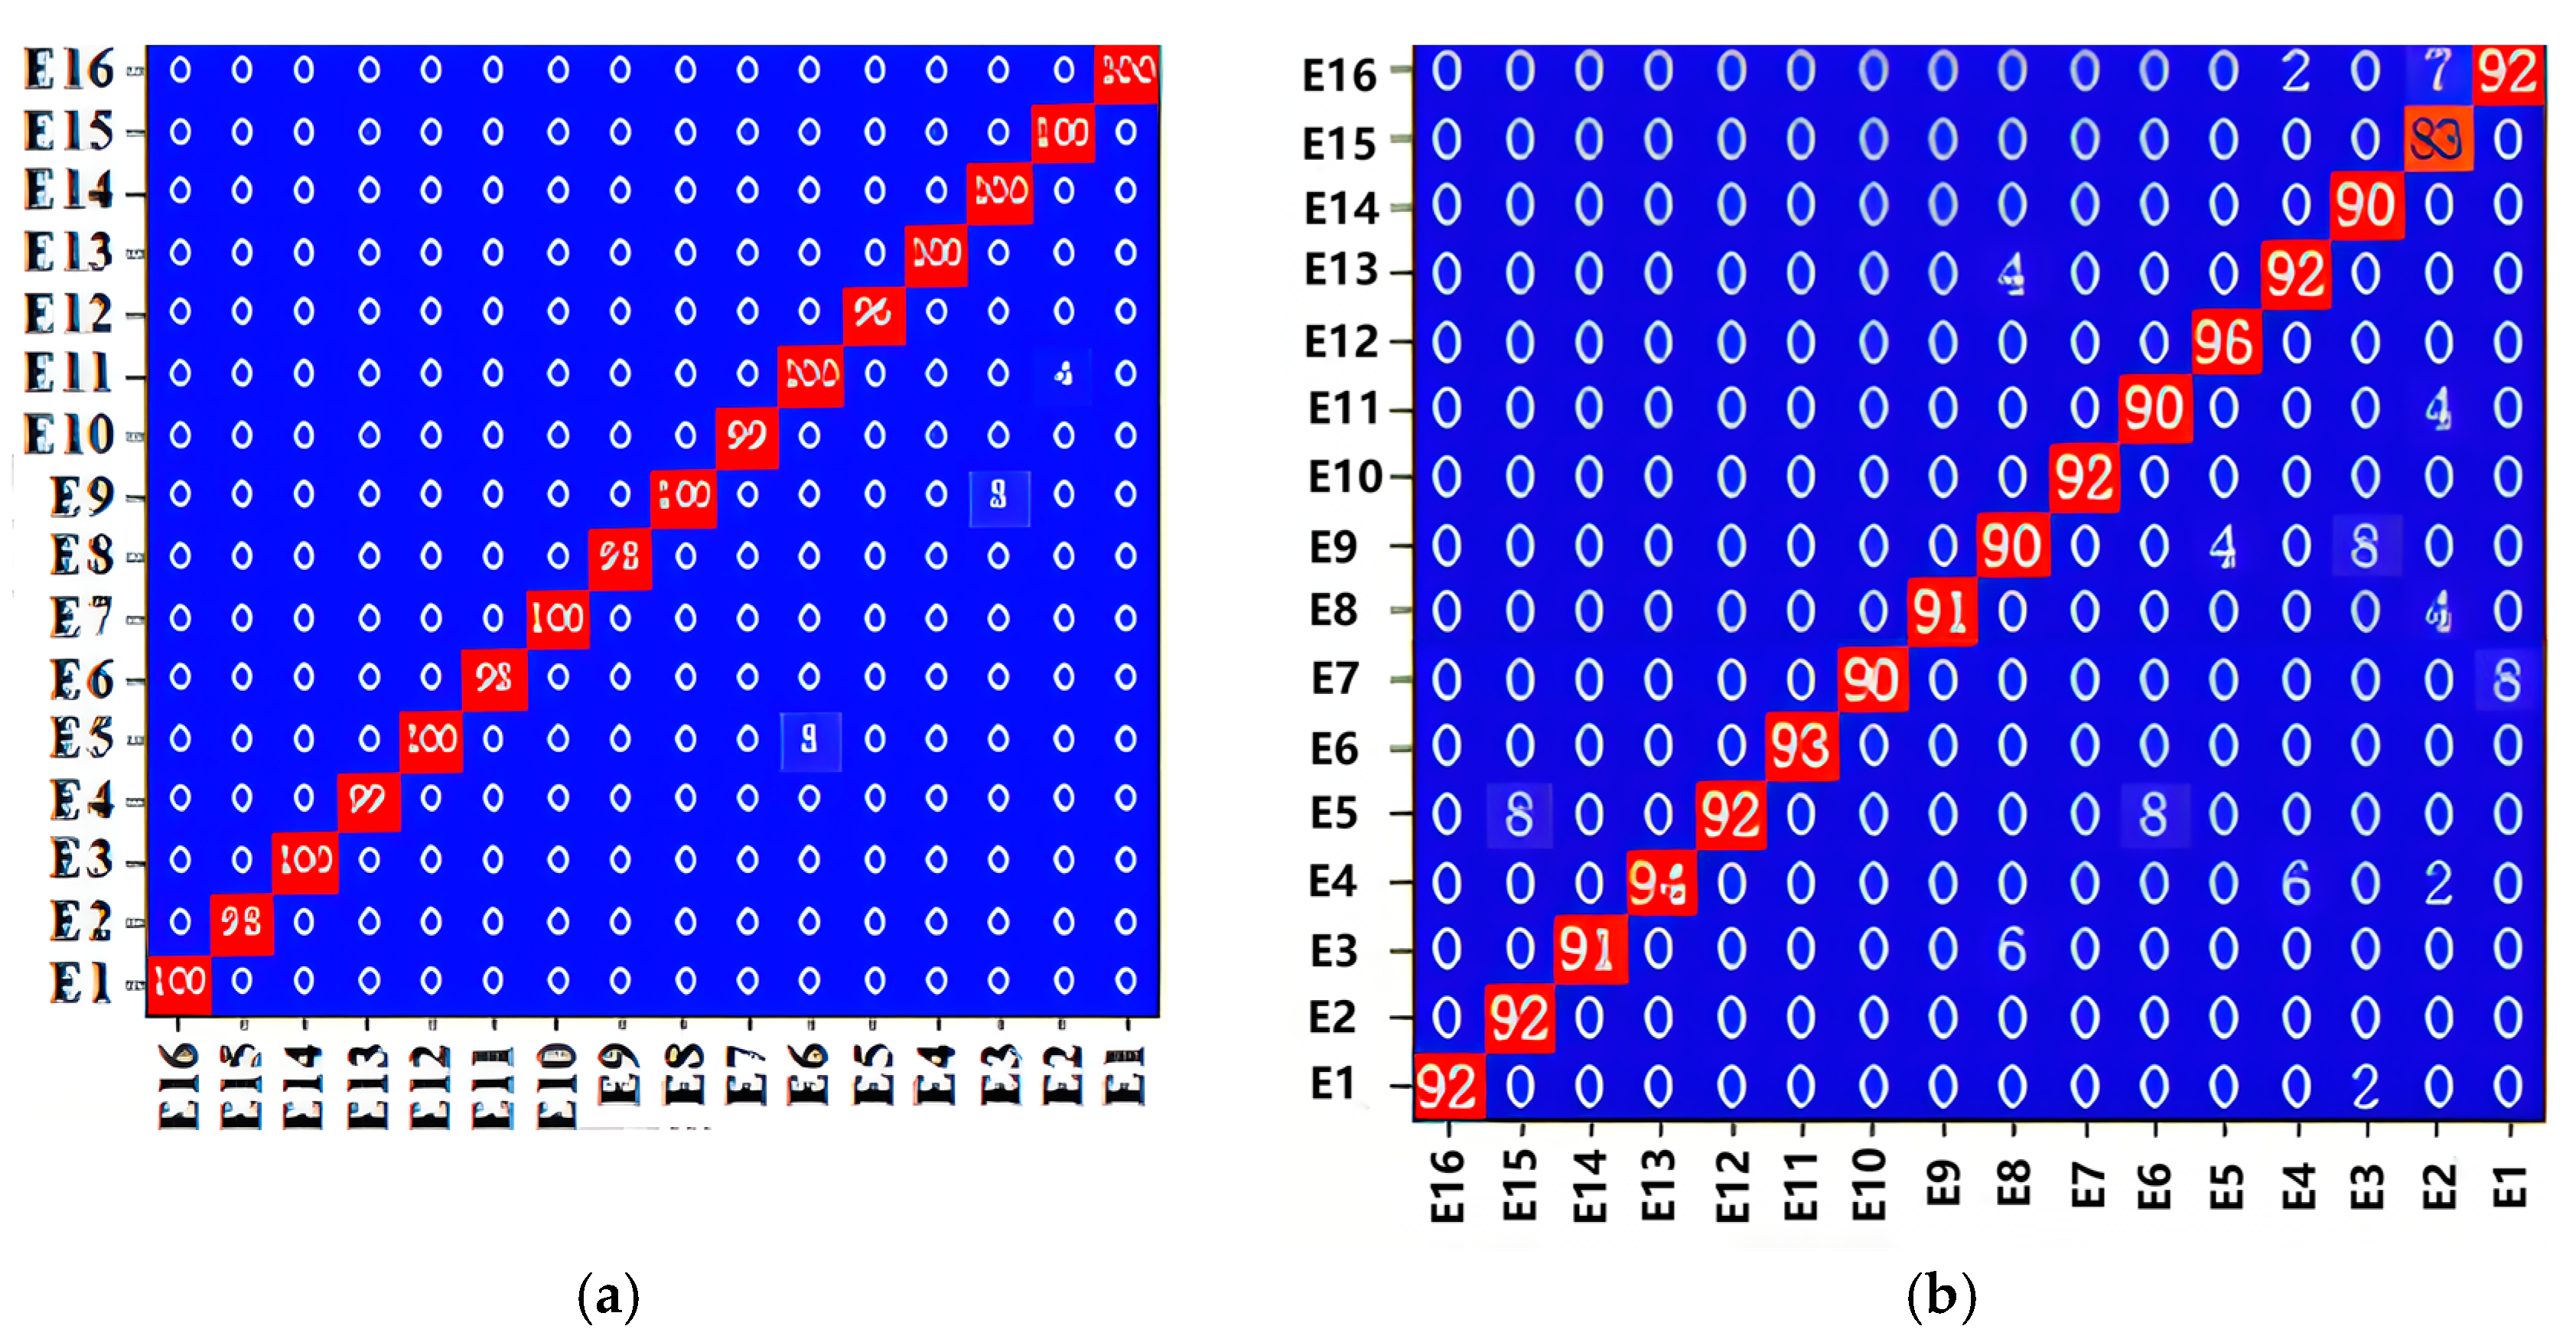
The calculation amount and parameter amount of the improved model are 3.62% and 8.65% of the original, greatly reducing the hardware deployment requirements.
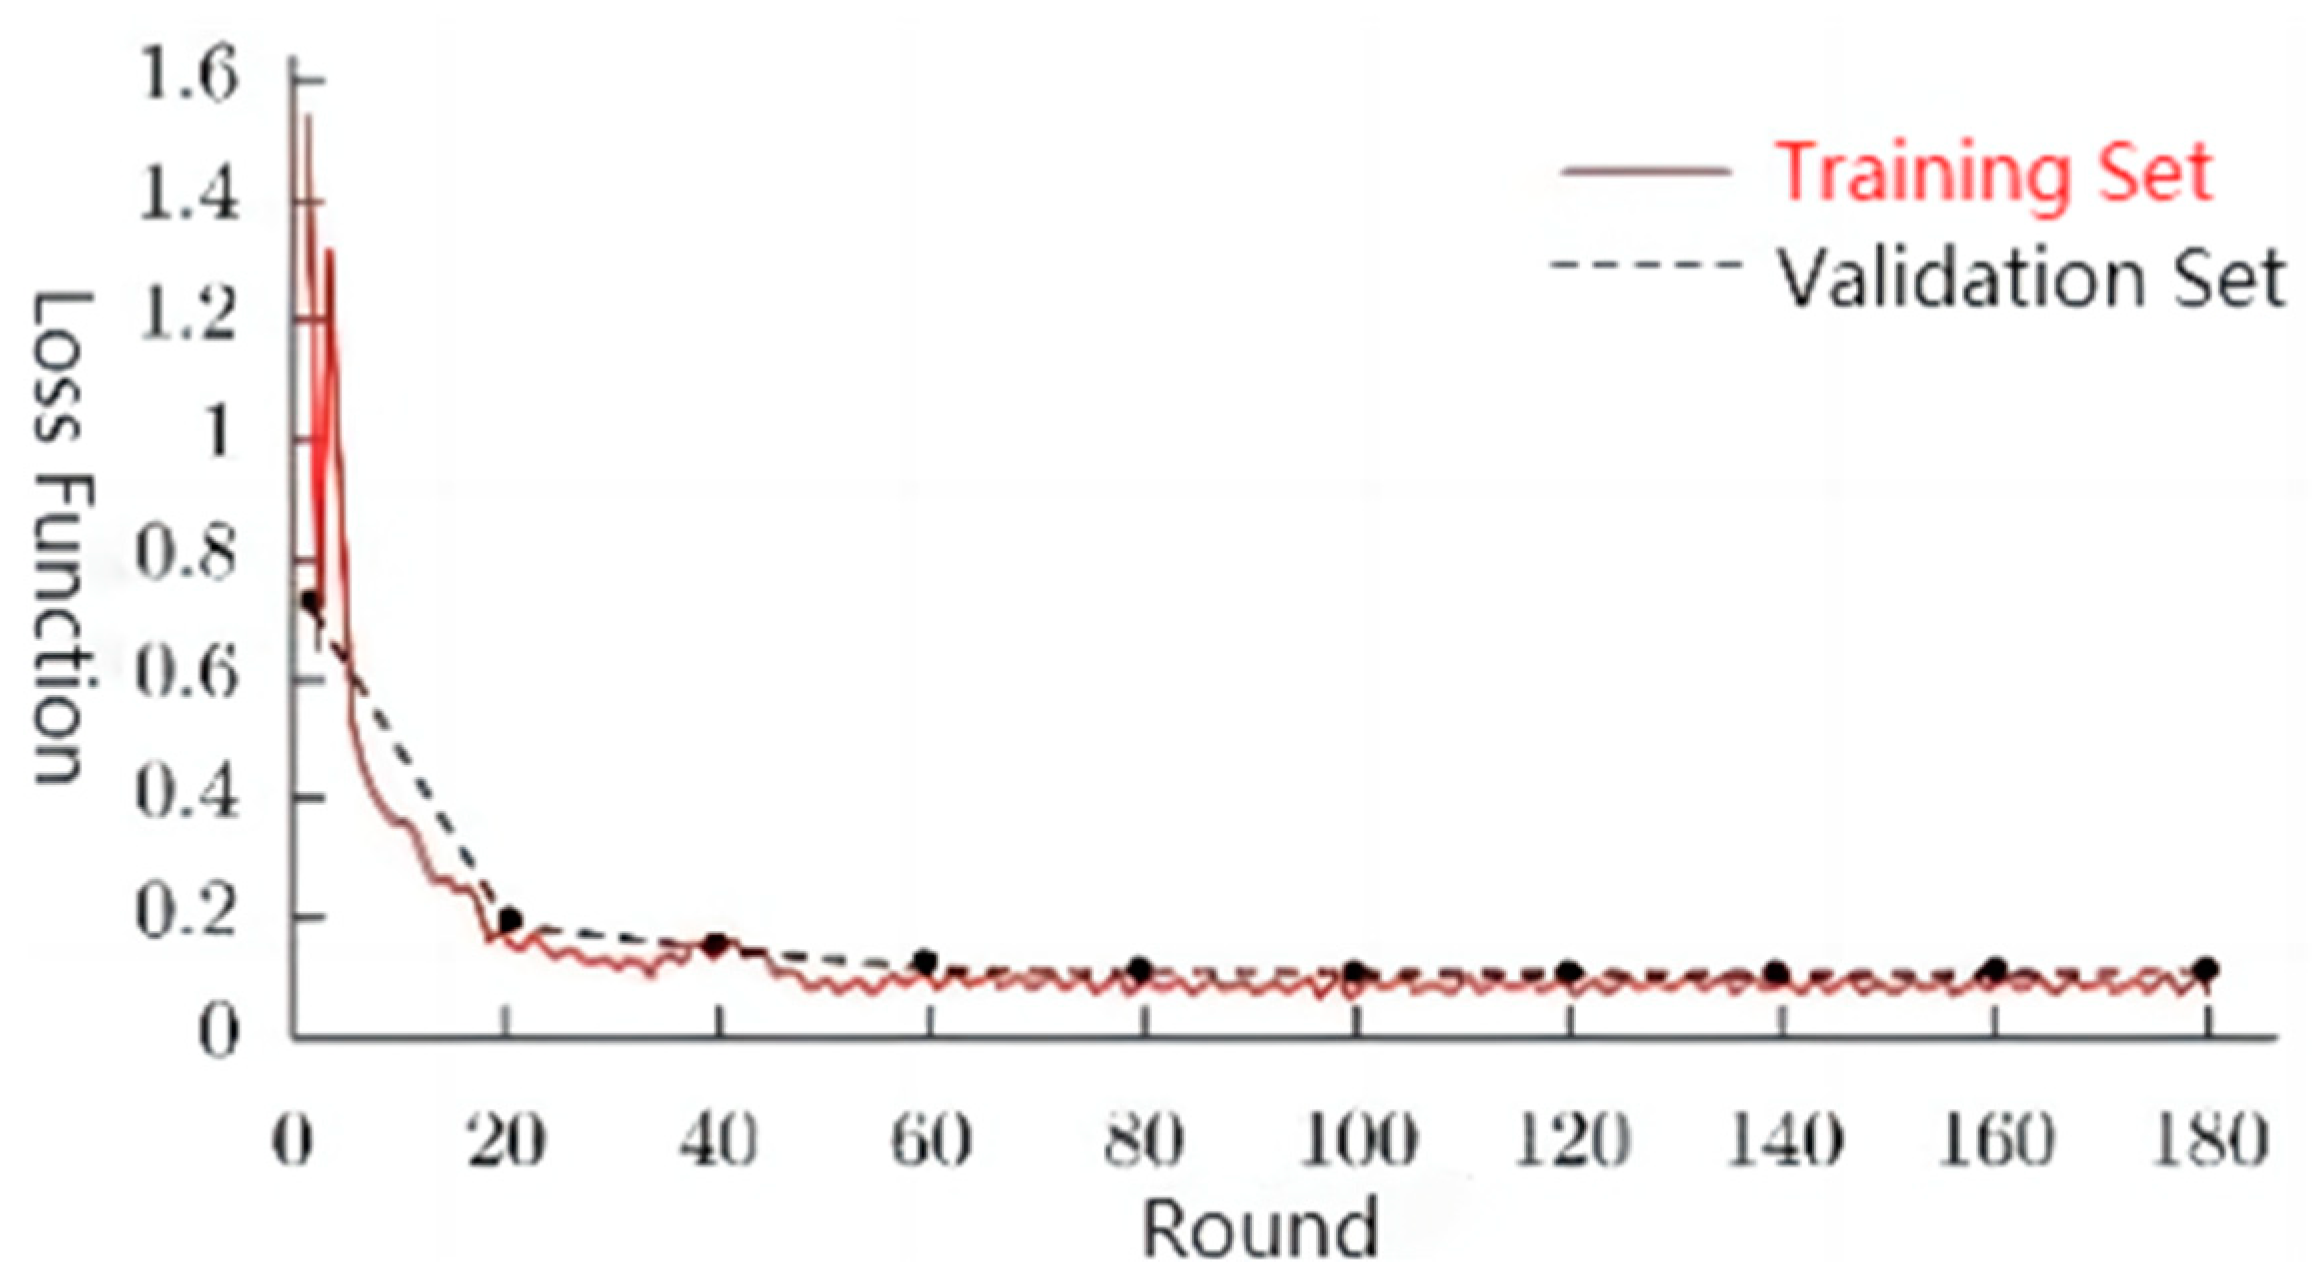
The model was built based on the TensorFlow framework. SVM adopted one-to-one learning strategy (One vs. One, OvO), CNN adopted Adam (Adaptive moment estimation) optimizer [
26], and the model super parameters are shown in
Table 5:
2.7.2. Process of Fault Diagnosis
In this paper, SVM was used instead of the SoftMax classification layer of the CNN network, and the model training part used a large amount of fault data to train the diagnostic model. The model operation process is shown in
Figure 12:
2.7.3. Dataset Establishment
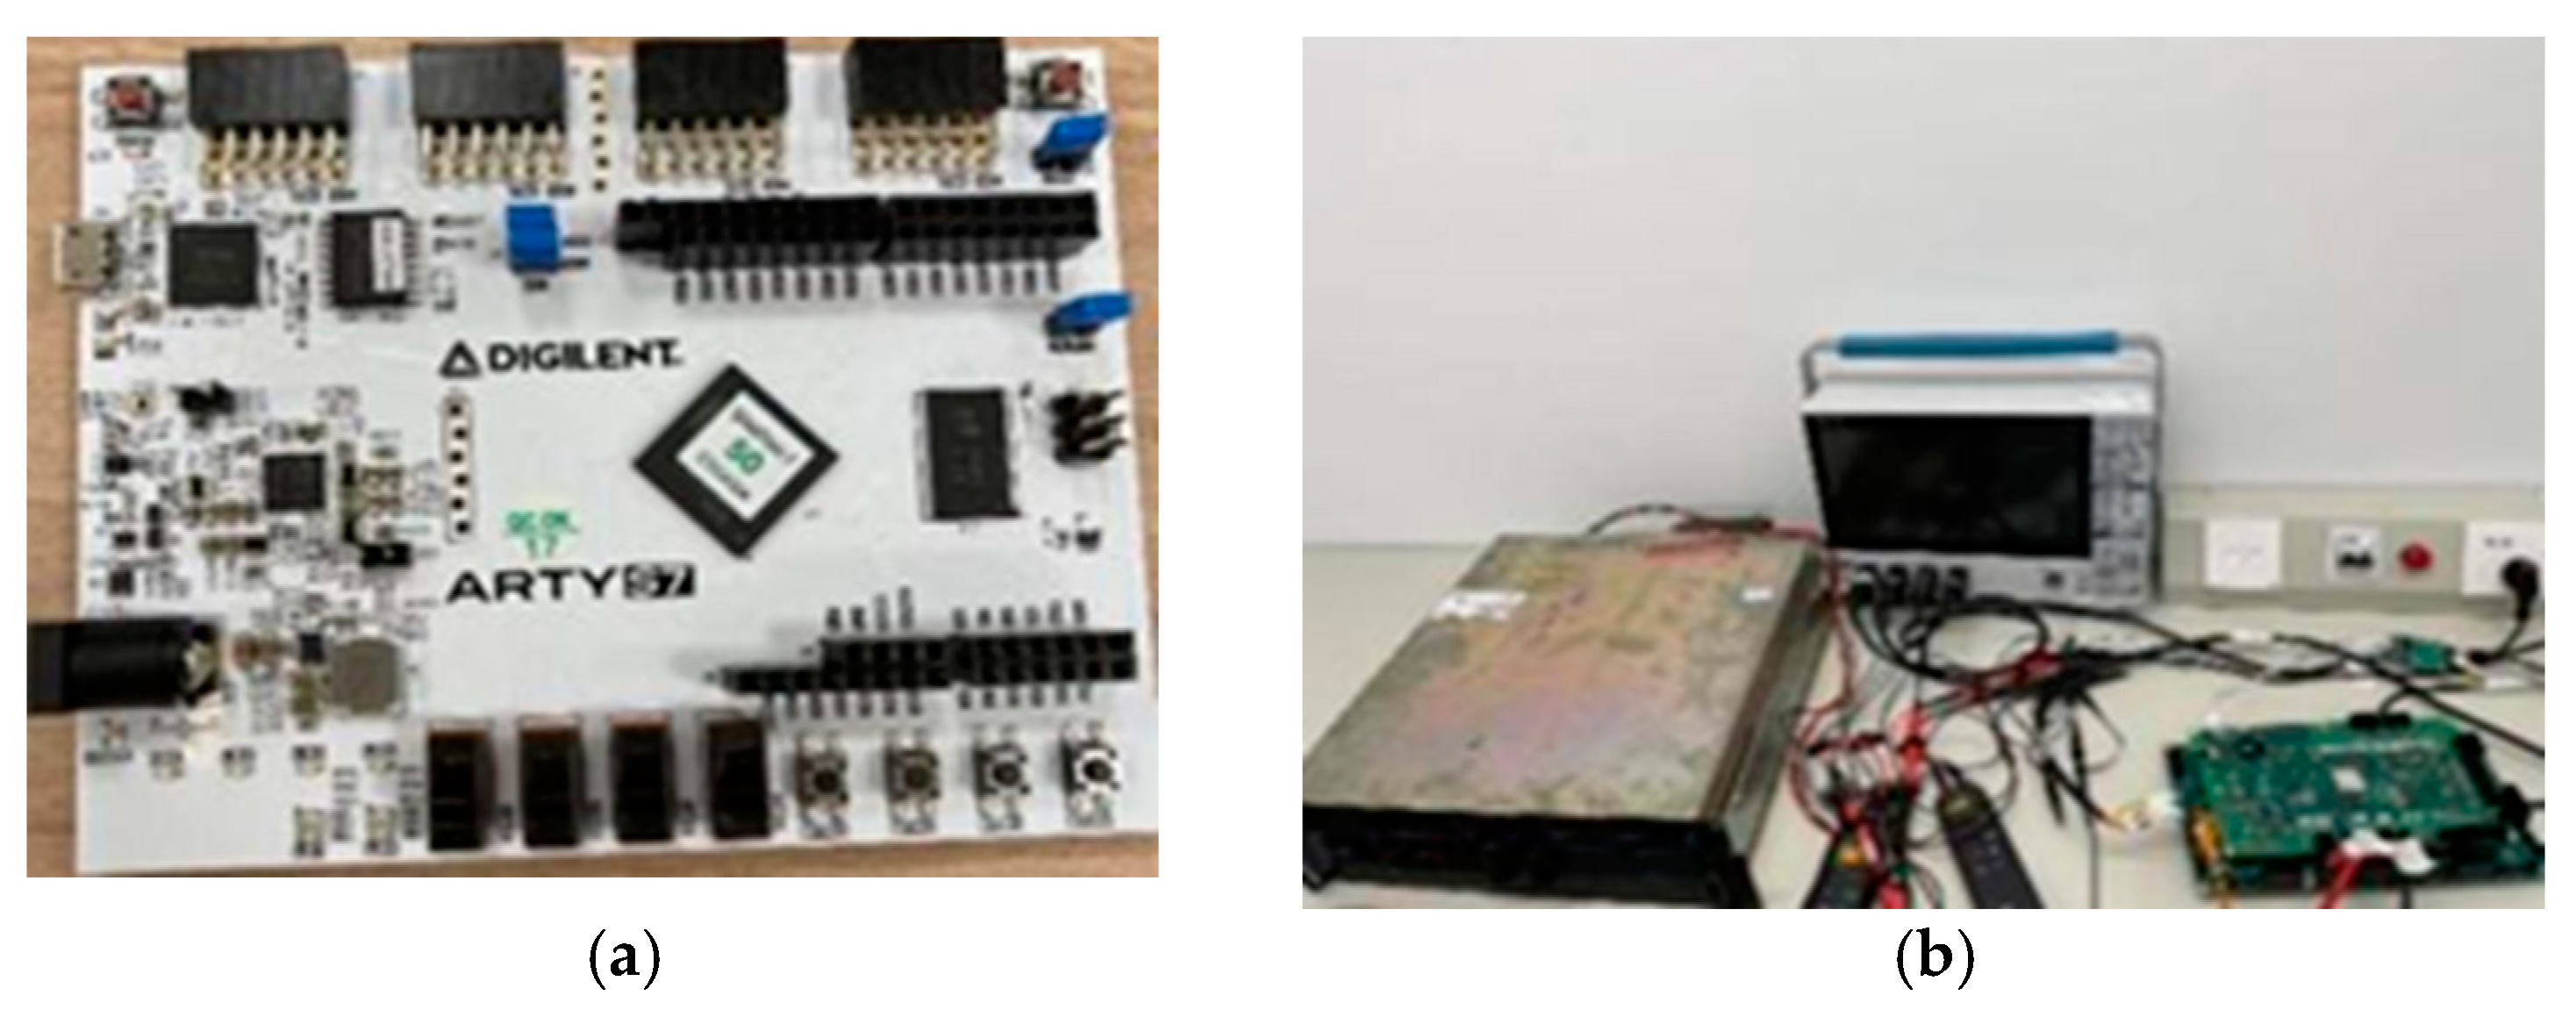
In order to verify that the model had practical application value for the diagnosis of charging module faults of charging piles, this paper selected AMD ARTYS7 microcontroller as the main processor, UCC14240-Q1 DC/DC module and LM5021 PWM rectifier module as the front and rear stages, and ABB M2BAX IE2 low-voltage motor as the AC input power supply. The V2G charging pile circuit topology platform and main control processor are shown in
Figure 13, and some of the actual output waveforms are shown in
Figure 14. Different fault conditions were simulated, 6400 sets of data were obtained by recording the output current signal data, and different levels of noise were added to form the final training set.
The TeKtronix MDO3024 oscilloscope was selected to read the current waveform, and the display waveform is shown in
Figure 14:
4. Conclusions
In this paper, a fault diagnosis research model of charging piles based on CNN-SVM is proposed, and the circuit topology model of the V2G charging pile is constructed and analyzed by example. The following conclusions were obtained:
- (1)
The deep learning model adopted in this paper avoids the problems with traditional machine learning, such as how it is easy to lose some features when manually extracting fault signals and the signal difference characterization is weak under complex fault conditions, which cannot be accurately identified. This model improves the classification accuracy
- (2)
Wavelet packet decomposition was introduced to extract the time-frequency feature map of the signal to prevent the image from being directly input into the neural network to generate a large amount of data redundancy, and at the same time, the SSO was used to optimize the SVM model to find the optimal parameters and penalty factors and to further optimize the model.
- (3)
The structure of the traditional convolutional neural network was modified to reduce the complexity of the model. Through the hardware platform test, the improved model still maintained high classification accuracy and calculation speed under different noise intensities, and the operating power consumption was also greatly reduced, which is of practical significance.
The proposed CNN-SVM fault diagnosis model has unique advantages and higher accuracy in fault diagnosis of the front and rear stages of the charging pile. However, it still has certain limitations and drawbacks in its practical application which should be well addressed in future studies.
Firstly, in future research, we will further focus on how the fault diagnosis model based on deep learning can better adapt to new energy electric equipment, such as electric vehicles and charging piles, and improve some of the problems in previous studies. These improvements include how the model can maintain high diagnostic accuracy when the front and rear modules of the charging pile adopt different topological structures (three-phase Vienna structure, PWM rectifier) and using different types of power electronic components (electric vehicle charging station, low-voltage frequency converter). Additionally, the robustness of the proposed method was affected owing to the limited dataset used for the model. Accordingly, in future work, the experimental tests will be conducted on the accuracy of fault diagnosis of the model on different front and rear circuits in the laboratory. Different from the traditional simulation circuit, we will build more actual circuit platforms and carry out experimental tests under various parameter conditions to expand the test set and experimental set of the model. Actually, the selection of the optimization algorithm for this task is not unique. In the future, other intelligent algorithms, such as information fusion and deep residual shrinkage network [
25], FASSA-SVM [
23] will be further applied to the fault diagnosis model to improve the diagnostic accuracy and speed.


