Abstract
Radio resource allocation schemes are critical to enhance user experience and spectrum efficiency. In the context of fifth-generation (5G) and future networks, co-construction and sharing among multiple telecom operators, which effectively mitigate challenges stemming from resource scarcity, energy consumption, and network construction costs, also attract wide attention. Therefore, optimal resource allocation techniques in sharing networks should be explored. Current resource allocation schemes primarily optimize for load balancing, single-user throughput, and fairness of multi-user whole network throughput, with minimal consideration for network-level user experience. Moreover, existing approaches predominantly concentrate on specific resource domains, seldom considering holistic collaboration across all domains, which limits the user experience of the whole network. This paper introduces an innovative resource allocation method grounded in the Shannon theorem, incorporating time-frequency-spatial domain multi-dimensional collaboration. More importantly, by constructing an optimization model, we strive to attain optimal network-level user experience. Furthermore, we provide a smart grid technology based on the Artificial Intelligence (AI) method to predict inter-frequency information, including Received Signal Reference Power (RSRP), beam ID, and spectral efficiency, which are modeled as air interface utilization, channel bandwidth, and signal-to-noise ratio, respectively, providing input for the optimization algorithm, which seeks to achieve the optimal time-frequency-space resource allocation scheme. Extensive experimentation validates the effectiveness and superiority of our proposed methodology.
1. Introduction
The development of mobile communication technology has gradually evolved towards ultra-high data rates, ultra-low latency, and massive connectivity [1,2,3]. Enhancing user experience remains a common objective pursued by both the industry and academia [4,5,6]. However, the advancement of mobile networks also encounters unprecedented challenges. The scarcity of spectrum resources and the constraints of network deployment costs pose significant obstacles to achieving extensive network coverage and site deployment in the short term [7,8]. Additionally, issues such as network duplication and high energy consumption impose higher requirements on the evolution of mobile communication technology [9,10]. Therefore, enhancing spectrum resource utilization, reducing network construction and operation costs, and minimizing system energy consumption present crucial challenges for global operators [11,12].
Mobile communication network co-construction and sharing among multiple telecom operators effectively alleviate the aforementioned issues [13]. Specifically, different operators can engage in various degrees of cooperation or sharing regarding telecommunications network infrastructure, network equipment, and spectrum resources [14]. The infrastructure mainly includes site-related facilities such as site locations, equipment rooms, towers, power supply equipment, etc. Network equipment comprises telecommunication network devices such as base stations, transmission equipment, etc. The aforementioned approach can significantly reduce the number of sites, prevent redundant infrastructure construction, lower system energy consumption, enhance resource utilization efficiency, and expeditiously establish leading network infrastructure capabilities. However, after co-construction and sharing, spectrum resources increase, and network scenarios and network systems become complex. The questions of how to make full use of the advantages of increased spectrum resources after sharing and achieve reasonable resource allocation are paramount to improving user experience. In addition, it is noted that spectrum sharing for unlicensed frequencies can also increase resource utilization, which is another important topic that needs to be explored [15,16,17].
To enhance user experience and spectrum efficiency, researchers explore techniques such as load balancing [18,19] and carrier aggregation [20,21] to achieve resource allocation and integration. Extensive literature has delved into allocation methods for time-domain, frequency-domain, and component carrier resources [22,23,24], providing optimization modeling and solutions. However, methods comprehensively considered the collaborative allocation of spatial resources have not been fully explored. With the development of 5G technology, massive Multiple-Input Multiple-Output (MIMO) has garnered widespread attention as a key technology for improving spectrum efficiency [25]. By fully exploring spatial resources through beamforming techniques, scarce spectrum resources are efficiently utilized, leading to a significant increase in network capacity. Consequently, the rational allocation of spatial resources has become a critical factor influencing communication performance. In the context of co-construction and sharing, inefficient coordination and scheduling among different frequency bands can lead to an imbalance in spatial loads; thus, users may cluster around certain beams in specific frequency bands, making it challenging to achieve multi-user pairing in the spatial domain and hindering the maximization of spectrum utilization.
In terms of the optimization objective of the resource allocation methods, traditional attempts involve maximizing the throughput of a single user [26,27], ensuring fairness of multi-user whole network throughput [21,28]. However, these methods cannot ensure the maximization of multi-user experience at the network level. In addition, the objective of load balancing methods has traditionally been focused on achieving equilibrium involving user distribution or physical resource block (PRB) utilization [29]. These approaches also fall short of guaranteeing an enhancement in network-level user experience.
The current optimization method of resource allocation in the industry predominantly relies on the best-effort model based on expert experience. For instance, resource allocation is achieved through algorithmic design and parameter tuning based on manual experience. This large-scale, long-term, and single-target method severely restricts the full exploitation of network capabilities involving complex scenarios with multiple entities and parameters at the cell and system layer. Therefore, it is necessary to explore a network-level optimization theory that serves as a top-level framework guiding resource allocation for shared resources from an overarching perspective.
This study aims to investigate resource allocation methods that jointly consider time-domain, frequency-domain, and spatial-domain aspects to achieve optimal network-level user experience of multi-users under multi-carrier and multi-beam in the co-construction and sharing scenarios of 5G and future mobile communication networks. In situations where users are covered by multiple frequency bands simultaneously within a scheduling period, frequency resources and beam resources of a certain frequency band are reasonably allocated to the user. This allows us to comprehensively consider the communication performance of all users to obtain a better user experience.
This paper proposes a time-frequency-space resource allocation method with the optimization goal of network-level user experience maximization. To achieve this, the Shannon theorem serves as the foundation, considering the multi-user and multi-carrier conditions in the scheduling period, the channel bandwidth is modeled by using the Resource Block Group (RBG) granularity resources and spatial-domain beam resources, and the signal-to-noise ratio (SNR) is modeled by using the spectral efficiency, and the channel capacity can be obtained through calculation. By maximizing channel capacity, the network-level user experience is optimized. Moreover, this paper innovatively proposes an air interface information prediction scheme based on smart grid technology and constructs an optimal parameter set for optimal modeling. By incorporating intelligent technologies to construct a virtual grid fingerprint map, the system can predict users’ Received Signal Reference Power (RSRP), beam ID, and spectral efficiency on different carriers. This information serves as input to the optimization algorithm. Through the optimization algorithm, the optimal time-frequency-space resource allocation scheme can be obtained.
The main contributions can be summarized as follows:
- We propose a resource allocation scheme based on a joint optimization problem of time-frequency-space resources with the optimization goal of maximizing network-level user experience to enhance overall network performance and user satisfaction;
- We provide a smart grid technology to predictive air interface information, including RSRP, beam ID, and spectral efficiency, which are used as input for the optimization algorithm;
- The feasibility and superiority of the proposed method are verified through simulation platforms with extensive experiments.
The main structure of this paper is as follows: Section 2 provides the related work; Section 3 analyzes the challenges faced in resource allocation under the co-construction and sharing network; Section 4 proposes a time-frequency-spatial resource allocation method for maximizing user experience in network-level; Section 5 validates the performance of the proposed method; finally, the paper concludes with a comprehensive summary.
2. Related Work
In this section, we analyze methods related to resource allocation. We primarily compare the existing methods with our proposed approach from two perspectives: optimization dimensions and optimization objectives of resource allocation schemes. Detailed comparisons can be found in Table 1.

Table 1.
Related Work.
Firstly, from the perspective of optimization dimensions of resource allocation schemes, current methods mainly focus on the allocation of resources in the time and frequency domains, with little consideration for the joint allocation of spatial domain resources.
Ref. [22] addresses resource allocation in wireless communication systems with multiple component carriers (CC) aggregation to achieve peak data rates of up to 1 Gbps for low mobility and 100 Mbps for high mobility targets in IMT-Advanced. It proposes an L2 carrier scheduling algorithm, aiming to allocate CCs to each user and reuse multiple users in each CC. It improved scheduling fairness and coverage performance by independently scheduling each carrier. However, it only adjusts scheduling priorities in the time domain and does not consider spatial resources. In the context of carrier aggregation (CA), CCs can be the activation and deactivation according to various factors such as user energy consumption and Quality of Service (QoS) requirements. Ref. [23] models resource allocation as a centralized multi-objective optimal CC management problem and formulates it as a stochastic game optimization problem. The paper proposes a multi-agent Double Deep Q-Network method to solve it, demonstrating a substantial reduction in User Equipment (UE) power consumption (approximately 20%) compared to full CC activation schemes. However, it also does not consider spatial domain beamforming resources. Ref. [21] focuses on optimizing resource allocation in scenarios involving CA. It models CC selection and resource block (RB) allocation as an Integer Linear Programming (ILP) problem and provides an optimization solution. It allocates the optimal rate to each user within the effective range of resource allocation algorithms under high and low traffic conditions. However, the algorithm models only time-frequency domain resource allocation and does not consider spatial beamforming resources extensively used in 5G. The above three methods primarily consider the allocation of resources in the time and frequency domains, lacking joint consideration of spatial domain resource allocation, limiting user experience, and resource utilization.
From the perspective of optimization objectives of resource allocation schemes, current resource allocation schemes primarily optimize for load balancing [18,19], single-user throughput, and fairness of multi-user whole network throughput, with minimal consideration for network-level user experience.
In terms of the subchannel and power allocation in multi-carrier Non-Orthogonal Multiple Access (NOMA) communication systems, Ref. [26] designs a fast dynamic resource allocation (FDRA) algorithm to maximize system sum rate efficiently by quickly identifying interfering nodes with poor channel conditions, thus reducing search complexity. By jointly optimizing subcarrier and power resource allocation, it maximizes system performance while guaranteeing user QoS. Ref. [20] jointly optimized subcarrier allocation, subcarrier pairing, relay selection, and power allocation in multi-carrier cooperative relay NOMA systems. To solve the non-convex optimization problem, it proposes an asymptotically optimal solution using the Lagrange dual method and Hungarian algorithm. Simulation results demonstrate the asymptotic optimality of the algorithm and its superior performance compared to traditional Orthogonal Multiple Access (OMA) schemes and other existing resource allocation methods. The above methods mainly aim to maximize the throughput of a single user without considering network-level user experience in multi-frequency multi-cell scenarios.
Ref. [27] addresses the problem of optimal CC selection and resource allocation in 5G networks. It considers delays associated with CC activation and deactivation, control channel overhead for switching CCs, and various service types with different 5G QoS Identifiers (5QIs). It proposes QAP and QAP-ACDC methods to jointly allocate RBs and CCs in downlink transmission based on Channel Quality Index (CQI) and QoS requirements. QAP proportionally maximizes the average throughput of different service level users while satisfying user rate and delay requirements. QAP-ACDC minimizes activation/deactivation frequency, reducing control channel information for configuring CC transmission to a minimum. The proposed solutions outperform state-of-the-art approaches in meeting QoS requirements while reducing CC activation/deactivation by approximately 95.5%. Ref. [28] proposes a proportional fair (PF) scheduling-based Radio Resource Management (RRM) optimization solution for carrier aggregation. This method models RRM functionality as an ILP problem related to CA, modulation and coding scheme (MCS) allocation, secondary component carrier (SCC) selection, and RB allocation. By solving the joint optimization problem that maximizes the PF objective function, simulation results demonstrate the superiority of the algorithm in terms of fair throughput and average cell throughput. However, this method is primarily applicable to Long Term Evolution (LTE) systems and does not consider the impact of Multi-User (MU) pairing on RRM resource allocation in 5G multibeam scenarios. Ref. [21] addresses the resource allocation problem of joint carrier aggregation in cellular networks. It proposes a robust distributed optimal resource allocation method using a utility proportionally fair allocation strategy to achieve fairness in resource allocation among users. Simulation results demonstrate the convergence of the algorithm to optimal resource allocation. Ref. [24] proposes a novel scheduling algorithm based on user grouping, investigating throughput fairness among different users and load balancing among different CCs. The algorithm achieves better coverage and fairness, appropriately allocating resources to users at the cell edge. The above three approaches only consider the fairness of multi-user in resource allocation, without considering network-level user experience.
In summary, it is essential to explore resource allocation schemes that aim to optimize network-level user experience while considering the coordinated allocation of time, frequency, and spatial domain resources to enhance network resource utilization and user experience.
3. Challenges in Resource Allocation of Sharing Network
After achieving deep co-construction and sharing between operators, in addition to sharing infrastructure at the base station hardware level, the spectrum resources available to operators become more abundant. For instance, before co-construction and sharing, Operator A possesses a 100 MHz bandwidth spectrum around the 3.5 GHz band, and Operator B also has another 100 MHz bandwidth spectrum around the 3.5 GHz band. After the co-construction and sharing, users of both Operator A and Operator B can access a combined 3.5 GHz spectrum with a total bandwidth of 2 × 100 MHz. With the increase in spectrum resources following co-construction and sharing, the network scenarios and systems become more intricate, effectively leveraging the advantages of increased spectrum resources, achieving globally optimal resource allocation across multiple frequency bands, maximizing spectrum efficiency, and enhancing user experience. However, despite these improvements, they still face numerous challenges. In this section, we will elaborate on the challenges faced in resource allocation after co-construction and sharing across three dimensions: time domain, frequency domain, and spatial domain.
Time Domain Challenges: One of the challenges in the time domain is the uneven distribution of scheduled users per Transport Time Interval (TTI) across different operator frequency bands, leading to higher communication delays for different users. How to organize the users and allocate the time-domain resources can significantly impact the user experience.
As shown in Figure 1, in the cell of Operator B, multiple User Equipment (UE) have different scheduling priorities. Due to limited scheduling resources, the network prioritizes high-priority users, resulting in delayed scheduling for some low-priority users and consequently affecting their user experience. However, Operator A’s resources remain idle. In this scenario, it becomes necessary to leverage the idle resources of Operator A to alleviate congestion in the time-domain resources of Operator B’s users.
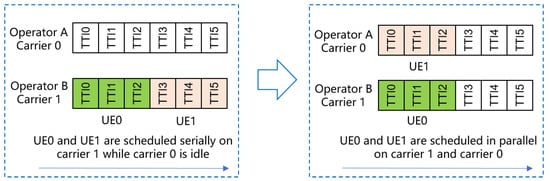
Figure 1.
Multi-user scheduling for different operators.
Therefore, it is essential to coherently allocate time-domain resources among different operators. This involves scheduling users with varying priorities on different carriers simultaneously, reducing scheduling delays for low-priority users.
Frequency Domain Challenges: The challenges in the frequency domain arise due to the differences in frequency ranges and duplexing modes between Frequency Division Duplexing (FDD) and Time Division Duplexing (TDD) frequency bands among different operators. This leads to varying user experiences when users are located in different coverage areas of the cell or reside in FDD/TDD frequency bands.
As shown in Figure 2, the green lines represent TDD, while the blue lines represent FDD. In Area 1 of the TDD cell, the close-coverage point, TDD provides advantages such as larger bandwidth and precise channel estimation based on Sounding Reference Signal (SRS), resulting in better user experiences for both uplink and downlink compared to FDD. In Area 2 of the TDD cell, the mid-coverage point, TDD enhances coverage by multi-antenna beamforming and benefits from the large bandwidth, leading to superior downlink user experiences compared to FDD. However, TDD uplink coverage is constrained by the lower transmit power of the terminal, resulting in weaker uplink user experiences compared to FDD. In Area 3 of the TDD cell, the far-coverage point, TDD uses the Precoding Matrix Indicator (PMI) for data channel precoding. As TDD frequencies are generally higher than FDD, signal attenuation increases with the increase of distance, leading to worse uplink and downlink user experiences compared to FDD.
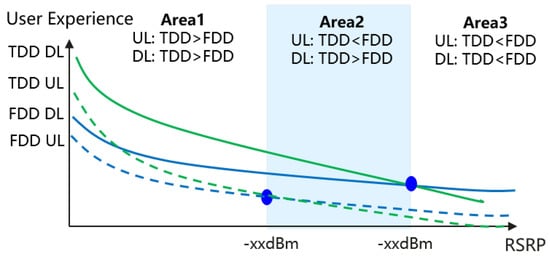
Figure 2.
Uplink and downlink experiences in different frequency bands and coverage areas.
Hence, when a sharing network is made up of both TDD frequency bands and FDD frequency bands in the frequency domain, it is crucial to select appropriate resident frequency bands for users in different areas based on coverage and bandwidth considerations. This ensures an enhanced user experience for users allocated to those frequency bands.
Spatial Domain Challenges: The spatial domain challenges arise due to differences in product forms (e.g., the number of antennas) for FDD and TDD frequency bands among different operators. For instance, TDD usually utilizes massive MIMO antenna arrays, leading to a larger spatial dimension, while FDD mainly employs 4T4R or 8T8R configurations with a smaller spatial dimension. After co-construction and sharing, the coexistence of wide and narrow beams increases the complexity of spatial beam combinations. Differences in rank streams and Multi-User Multiple Input Multiple Output (MU-MIMO) pairing layers in the spatial channel space result in variations in user experiences. Moreover, users of different operators are not evenly distributed on different beams, suppressing the further release of spatial MU pairing capability.
As depicted in Figure 3, Operator A has more users, and due to user clustering, the TDD beam loads of Operator A are imbalanced. At the same time, Operator B has fewer users, leading to lower FDD beam loads. Without coordinated spatial resource scheduling between Operator A and Operator B, the idle resources of Operator B cannot be shared, resulting in wasted spectrum resources for Operator B.
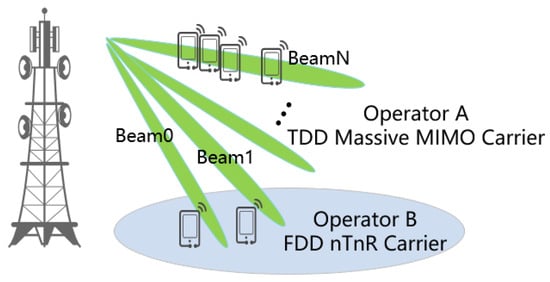
Figure 3.
Unbalanced load distribution on distinct beams of different operators.
Therefore, in the spatial domain, it is crucial to holistically allocate beam resources to users. This involves balancing the user loads across different beams for operators, activating more users to achieve MU-MIMO, and efficiently utilizing the available spatial resources.
Furthermore, the allocation of time, frequency, and spatial resources needs to cooperate with each other. As shown in Figure 4, the network allocates appropriate time, frequency, and spatial resources based on the volume and type of service for different users. For instance, For low-latency services like UE0, a shorter time-domain symbol resource can be allocated, and according to the volume of the user’s service, dynamically allocating suitable frequency-domain Resource Blocks (RB) resources. For high-data-rate services, such as enhanced Mobile Broadband (eMBB) for UE1, a larger allocation of time-domain symbols, frequency-domain RBs, and spatial resources can be provided. This approach ensures the specific requirements of each user, leading to an optimized allocation of resources in the time, frequency, and spatial domains.
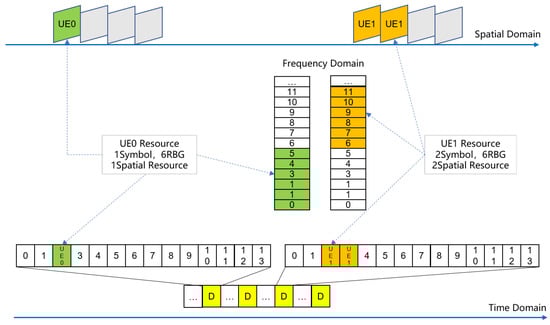
Figure 4.
Cooperative resources allocation of time, frequency and spatial domains.
In summary, after implementing a co-construction and sharing network, there may be challenges, such as user imbalances in the time domain, significant variations in user experience across different frequency bands in the frequency domain, and uneven distribution of users in the case of spatial multi-dimensional combinations. Therefore, it is necessary to achieve a coordinated allocation of time, frequency, and spatial resources. Existing methods predominantly focus on the resource allocation of certain domains and rarely consider the resource allocation of all domains globally. Therefore, we need to explore the collaborative resource allocation method that maximizes the user experience and guides the optimal allocation of time, frequency, and spatial resources in the case of co-construction and sharing so as to enhance network performance.
4. Time-Frequency-Space Resource Allocation Method in Sharing Network
In information theory, Shannon’s theorem defines the air interface performance for a single link. Over the past decades, spanning from 2G to 5G and from convolutional codes to Polar codes, physical layer channel coding techniques have continuously advanced. They have progressively approached the Shannon limit in terms of single-user, link-level performance. Indeed, practical communication networks are complex systems comprised of multiple users and links. As illustrated in Figure 5, within the entire network, multiple users coexist. The overarching goal is to optimize the collective experience of all users to achieve network-level experience maximization.
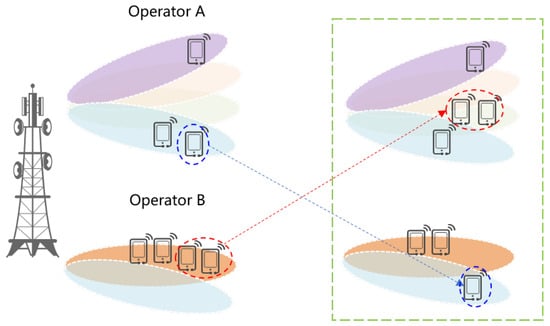
Figure 5.
Multi-user network-level experience maximization.
4.1. General Framework
In the context of a multi-user, multi-carrier, and multi-beam network, achieving network-level optimal performance and maximizing system-level capacity to reach the system limit are prerequisites for achieving the best overall user experience. As shown in Figure 6, when a user is in Frequency Band 1 of Operator A (service cell) and detects Frequency Band 2 of Operator B (adjacent cell), a decision is made on whether to perform inter-frequency handover to enhance the overall user experience. Therefore, we propose a resource allocation approach with the goal of maximizing network-level user experience. To achieve this optimization objective, time, frequency, and spatial resources need to be collaboratively taken into account.
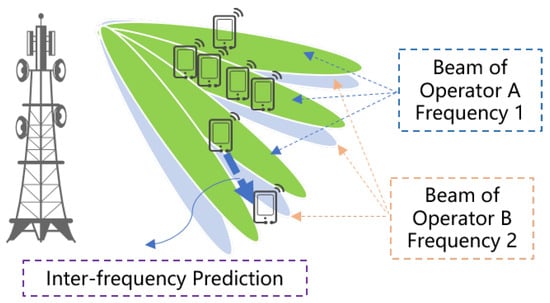
Figure 6.
Schematic diagram of air interface information prediction between different frequency bands.
The framework of the time-frequency-space resource allocation method is shown in Figure 7. The input information of the framework uses features from service cells and co-frequency neighbor cells. The output information is the optimal resource allocation scheme. By combining network-level optimization algorithm modules with smart grid technology modules, this framework aims to maximize the network-level user experience in a multi-user, multi-carrier, and multi-beam context. Specifically, we set up an optimization model aiming at the optimal network-level user experience. To determine the time, frequency, and spatial parameters that maximize network performance, we introduce an air interface information prediction method based on smart grid technology, which constructs fingerprint maps using intelligent techniques with features from service cells and co-frequency neighbor cells as training data. The smart grid comprises coverage grids, spectrum efficiency grids, and beam grids. The coverage grids yield information about the inter-frequency RSRP, the spectrum efficiency grids offer insights into inter-frequency spectral efficiency, and the beam grids provide information about inter-frequency SRS beam ID. These grids collectively provide input data for the network-level optimization algorithm. Additionally, cell load information from neighboring cells operating at different frequencies is taken into account to achieve optimal results in resource allocation. By solving the optimization algorithm, an optimal time-frequency-space resource allocation scheme is obtained. This scheme facilitates adjustments to the distribution of users and services at the beam level, ultimately enhancing the downlink experience for users across the entire sharing network. The details of the method will be given in Section 4.2 and Section 4.3.
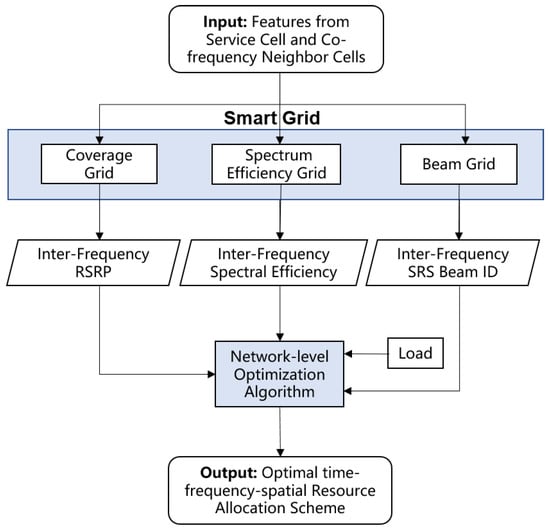
Figure 7.
The framework of the time-frequency-spatial resource allocation method.
4.2. Mathematical Modeling
The Shannon theorem, represented by the formula , describes the relationship between the maximum achievable transmission rate in a channel with finite bandwidth, subject to random noise, and the channel bandwidth and signal-to-noise power ratio. Here, C represents the maximum rate that the channel can support, often referred to as channel capacity; B is the channel bandwidth; S stands for average signal power; N represents average noise power; represents SNR. By adjusting the bandwidth and SNR, the maximum throughput for a single carrier can be achieved.
To achieve optimal network-level performance in a multi-user, multi-carrier scenario inspired by the principles of the Shannon theorem, we model the allocation of time-frequency-space resources for multiple users as a mathematical optimization problem. Specifically, we divide the bandwidth resource B into segments for each scheduling time slot, introducing the time-domain parameter t and the frequency-domain parameter b. Since we aim to allocate bandwidth resources to multiple users, we introduce the user parameter k. Detailed explanations of the parameters are listed in Table 2.
Table 2.
Nomenclature.
Firstly, in the scenario of a single-cell and single-user, the Shannon formula can be transformed as follows:
The meanings of each variable in the formula are as follows:
- : the b-th spectrum resource allocated at time t.
- : the total scheduling duration. In this paper, = 1 ms, and the step length is 0.5 ms.
- : the number of copies of the allocated bandwidth resource. The granularity is RBG (integer).
Secondly, in the scenario of a single-cell and multi-user, the above formula can be further evolved into:
where is equivalent to , we can obtain
The implications of each variable in the formula are as follows:
- : whether the b-th spectrum resources are scheduled at time t by user k.
- : the b-th spectrum resource allocated to user k at time t.
- : the signal strength, interference strength, and noise strength of user k on the b-th spectrum resource at time t, respectively.
- : the total number of scheduled users (integer).
The following constraints exist in the formula:
- , map user k whether schedule the b-th spectrum resource at time t or not to two states: 0 and 1.
- , the sum of spectrum resources allocated at a time cannot exceed the total spectrum resources.
The above formula aims to optimize the allocation of time, frequency, and spatial resources to achieve the highest collective network experience rate for all users () within a given scheduling duration () and on a specific allocated frequency domain resource (). This process results in determining values for and . Specifically, for each user, whether the spectrum resource can be scheduled at a particular time t, and if so, how many frequency bandwidth resources can be allocated.
In addition, spatial resources are also an important factor that we need to consider. For , considering that users on different beams can reuse the same spectrum resources by means of MU pairing, it can be modeled as:
where indicates the ID of the beams. Users who reuse the same spectrum resources have different . represents the total available frequency domain resources after taking into account the MU function. Then, the modeling formula of single-cell and multi-user is obtained:
Finally, the formula of multi-cell (or multi-carrier) and multi-user can be modeled as:
where represents spectral efficiency, that is, the spectral efficiency of user k on b-th spectrum resource and n-th beam of carrier i at time t.
The meanings of each variable in the formula are as follows:
- : whether the b-th spectrum resources in beam n on carrier i are scheduled at time t by user k.
- : the b-th spectrum resource allocated for user k on carrier i in beam n at time t, which is the allocation of time-frequency-space resources for each user.
- : the signal strength, interference strength, and noise strength of user k on carrier i and b-th spectrum resource in beam n at time t, respectively.
- : the number of carriers configured on the network side.
The following constraints exist in the formula:
- , map user k whether schedule the b-th spectrum resource on carrier i in beam n at time t or not to two states: 0 and 1.
- , the frequency spectrum resources allocated by all users at the same time will not exceed the total frequency spectrum resources. (e.g., 100 Mbit/s bandwidth corresponds to 18 RBGs).
- For single user, = min {maximum number of CA carriers supported by UE capability, number of carriers configured on the base station side}
The above formula aims to optimize the allocation of time, frequency, and spatial resources within the scheduling duration while assigning frequency resources , spatial resources , and carrier resources . The objective is to achieve the optimal network-wide experience rate for all users . This process aims to determine for each user, carrier, beam, and frequency resource for each user. Utilizing the smart grid technology described in the following section, this optimization algorithm is provided with input. Then, by employing typical optimization-solving algorithms such as the branch and bound method and block coordinate descent method, the optimal resource allocation scheme for each user is obtained. The smart grid technology assists in offering inputs to the optimization algorithm. In the given formula, can be predicted using smart spectrum efficiency grids. can be obtained from smart beam grids. is determined through smart coverage grids.
4.3. Smart Grid Technology
In wireless networks, terminals often incur time costs or performance losses to obtain target information. For instance, terminals need to perform inter-frequency GAP measurements to acquire inter-frequency RSRP information. During these inter-frequency GAP measurement periods, the terminal suspends both uplink and downlink transmissions, leading to reduced throughput. Smart grid technology takes the grid as the fundamental unit, and a virtual wireless air interface environment characteristic library is established by incorporating air interface measurement information. Leveraging the correlation between co-frequency and inter-frequency measurement reports of historical users, an Artificial Intelligence (AI) model is trained to predict inter-frequency information based on co-frequency information. This approach effectively mitigates the impact of inter-frequency GAP measurements on services.
To achieve optimal network-level performance for time-frequency-space resource allocation, the optimization formula mentioned above needs to be solved, yielding the optimal parameter combinations. For each user’s utilization of air interface resources on each frequency band , we propose an RSRP prediction method based on smart coverage grids. When the predicted RSRP corresponding to UE in beam n on carrier i at time t falls below a predefined minimum threshold, is set to 0; otherwise, it is set to 1. Note that RSRP, as defined in the 3rd Generation Partnership Project (3GPP) protocol, generally refers to Synchronization Signaling Block (SSB) RSRP or Channel State Information Reference Signal (CSI-RS) RSRP. Here, we refer to SSB RSRP. The frequency domain position of the SSB is independent of the specific allocation of frequency resources b; hence the predicted value of can be obtained from , which, in turn, can be predicted using coverage grids. Moreover, we introduce a prediction method for spectrum efficiency based on smart spectrum efficiency grids, as well as a prediction method for based on smart beam grids. By intelligently predicting the beam ID information of each user, users with the same beam ID are collectively considered, and the total resources are divided by the number of users. We can achieve frequency resource allocation at the granularity of RBGs. As depicted in Figure 8, we achieve predictions for RSRP, spectrum efficiency, and beam ID across different frequency bands by constructing high-resolution smart grids. These predictions provide essential inputs for solving the network-level optimization algorithm.
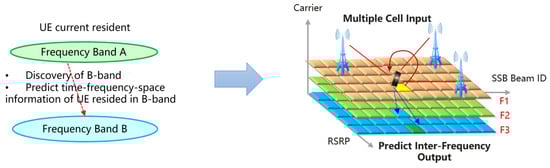
Figure 8.
Schematic diagram of Smart grids.
Through multi-dimensional measurements of wireless signals, UE with similar wireless characteristics can be classified together. The base station gNodeB in 5G networks groups users with identical measurement results into the same grid, referred to as a smart grid. Utilizing machine learning techniques, gNodeB takes these smart grids as crucial features to extract the mapping relationship between all smart grids within a cell and the signal characteristics of a specific frequency point. This mapping relationship is constructed by a smart grid model. For instance, if a 5G cell is configured with M neighboring frequency points, there would be M smart grid models.
As illustrated in Figure 9, within a same-frequency network at frequency point F1, there are two cells labeled Cell1 and Cell2. If UE2 measures a frequency point and its results are [(Cell 1, RSRP 1), (Cell 2, RSRP 2),...], and UE3 measures the same frequency point with identical results as UE2, UE2, and UE3 are considered to belong to the same smart grid. Utilizing the Cell ID and RSRP for each cell under the neighboring frequency point F3 as labels, the RSRP coverage grid is used to train the relationship model between frequency point F1 [(Cell 1, RSRP 1), (Cell 2, RSRP 2),...] and frequency point F3 [(Cell 1, RSRP 1), (Cell 2, RSRP 2),...].
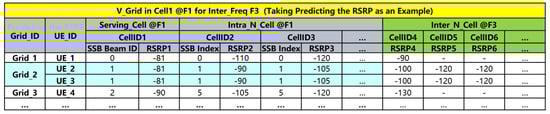
Figure 9.
Definition of Smart grids.
Smart grid technology leverages AI algorithms to achieve the prediction of inter-frequency performance metrics. As illustrated in Figure 10, a neural network model is trained using the collected historical data. The mapping relationship between input and output is obtained, which is used to predict the inter-frequency information.
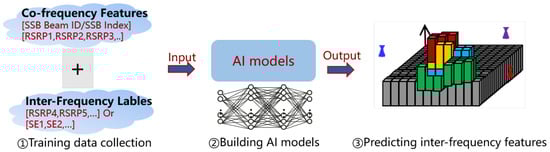
Figure 10.
Diagram of inter-frequency information prediction.
Based on the distinct input features and output results, smart grid models include RSRP prediction models, spectrum efficiency prediction models, and beam ID prediction models. Taking the RSRP coverage grid as an example, a multi-layer perceptron (MLP) algorithm is employed. There are 2M inputs, 3 hidden layers, and the activation function utilizes a ReLU function. M consists of 1 service sell and M-1 Co-frequency Neighbor Cells. The loss function is Focal Loss. The output size is P, which signifies the number of predicted inter-frequency neighboring cells, and the predicted RSRP for the corresponding P inter-frequency neighboring cells can be obtained. The network structure for the spectrum efficiency grid model and beam grid model is identical to the RSRP coverage grid model. The input-output feature quantities for each type of grid are presented in Table 3, Table 4 and Table 5.
Table 3.
RSRP coverage grid-neural network input feature and output feature.
Table 4.
Spectrum efficiency grid-neural network input feature and output feature.
Table 5.
Beam grid-neural network input feature and output feature.
During the model prediction stage, the same feature vectors used during model training are inputted to realize the prediction of RSRP, spectrum efficiency, and beam ID information. Specifically, gNodeB utilizes A3 event measurement reports reported by users on the same frequency. The RSRP information within these reports is taken as the input for the smart grid model. This input is combined with other necessary feature information. By querying the RSRP model, spectrum efficiency model, and beam model for a particular inter-frequency point, it becomes possible to swiftly predict the RSRP, spectrum efficiency, and beam ID for a UE at that specific inter-frequency point’s coverage location.
5. Evaluation
5.1. Experience Setup
In order to evaluate the performance of the proposed time-frequency-space resource allocation method based on network-level user experience maximization, we conduct a simulation and compare it with the classical load balancing method based on PRB utilization. Through the analysis of performance indicators such as user experience rate and throughput rate, we verify the effectiveness and superiority of the method. We use C++ object-oriented programming language to build the whole communication process, including instantiating various types of network elements, base stations, users, network configurations, and servers in communication scenarios. We also simulate the process of scheduling and receiving service requests, channel measurement, and resource allocation. In addition, we use Python to realize the deep learning method for information prediction.
The end-to-end system-level simulation process in this paper simulates the whole communication process. It does not involve modifications in the PHY layer, which is fully implemented in accordance with 3GPP NR standards. The simulation focuses on the design of the resource allocation in the multi-user scenario on a high level. In the simulation process, we begin by configuring simulation-specific model parameters for scene construction and channel initialization. This primarily includes initial user deployment, business model, and channel model. Specifically, for user deployment, we distribute a specified number of users evenly across the geographical locations of each cell. Users select the optimal RSRP beam for access, with a minimum access RSRP of −113 dB. If a user does not meet the access conditions for any beam, the user is repositioned. Regarding the business model, we employ the Burst model defined in 3GPP TR, where each user’s packet size and packet duration vary, and the inter-packet intervals differ. For the channel model, we utilize the large-scale channel model defined in 3GPP TR 37.910. In addition, in the simulation environment, different cells are overlapped by common stations. Noise power spectral density is 7 dB. The transmitting power of the base station side is 46 dB in 20 M bandwidth. The detailed simulation configuration parameters are shown in the Table 6. Next, we proceed with business scheduling and channel-related computations. Subsequently, we employ the proposed time-frequency-space resource allocation algorithm to further conduct user behavior scheduling. Throughout the simulation, relevant statistics are recorded, including user traffic volume, user session durations, available RBs in each cell, and the number of users in each cell. The simulation outputs encompass network-level user experience rate, SINR, and cell-level PRB utilization.
Table 6.
The simulation configuration parameters.
The specific flow for one scheduling cycle is as follows. Specifically, first, we randomly scatter points. When t = 0.5 ms, collect the initial data involving the service cell and the co-frequency neighbor cell, input them to the trained smart grid model, and predict the inter-frequency RSRP, spectral efficiency, and beam information; then, input them into the optimization formula for accumulation. The time step length is 0.5 ms. When t = 1 ms, continue to record the data of the service cell and the co-frequency neighbor cell at this time, these data change due to changes in information such as user location and service. Input these data into the smart grid model again, predict the RSRP, spectral efficiency, and beam information at this time, and provide this output to the optimization formula to continue to accumulate again. At this time, a scheduling cycle finished. Finally, we solve the optimization algorithm to calculate the resource allocation combination that maximizes the objective function.
5.2. Experience Results
5.2.1. Overall Performance
Firstly, we discuss the performance gains compared with the load balancing method based on PRB utilization in the experiment scene, which is composed of two TDD cells, each of which owns 20 M bandwidth. Specifically, the load situation, the number of antennae, the number of users, and overall performance gains are shown in Table 7. As we can see, in all four different scenes, we obtain performance gain in network-level downlink user experience rate ranging from 17% to 30%.
Table 7.
Performance Gain for Networking TDD@20 M+TDD@20 M.
In Figure 11, Figure 12, Figure 13 and Figure 14, we demonstrate the user experience rate of each user. Blue indicates the method based on the PRB utilization rate, and orange represents our proposed method based on time-frequency-space optimal resource allocation. As we can see, almost all of the users show a higher user experience rate than the traditional method. Although the performance of a small number of users is degraded, the overall user experience of the entire network has greatly improved. As shown in Figure 15, it is the average experience rate of the overall users. We can see the performance improvement for all the four experience scenes.
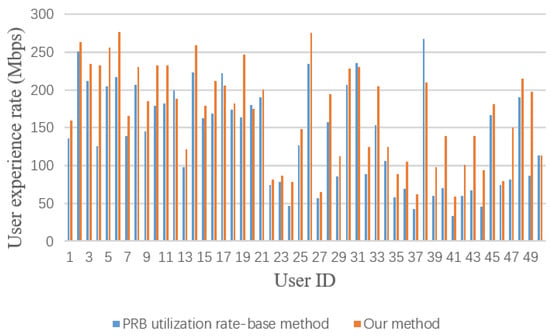
Figure 11.
Performance comparison for each user in scene 1.1.
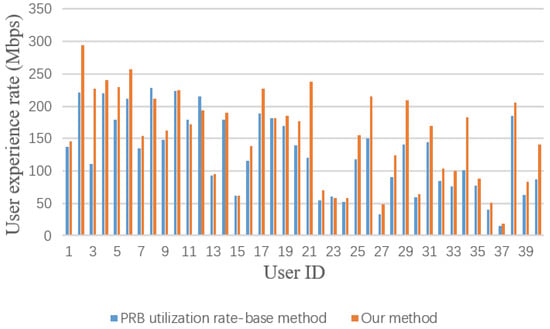
Figure 12.
Performance comparison for each user in scene 1.2.
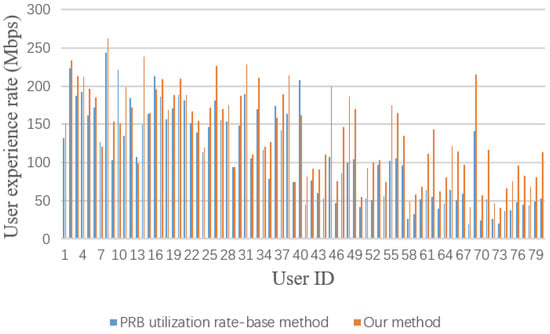
Figure 13.
Performance comparison for each user in scene 1.3.
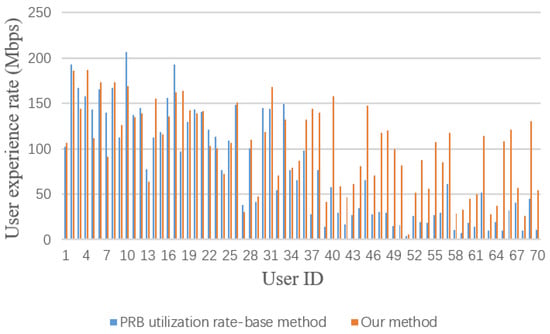
Figure 14.
Performance comparison for each user in scene 1.4.
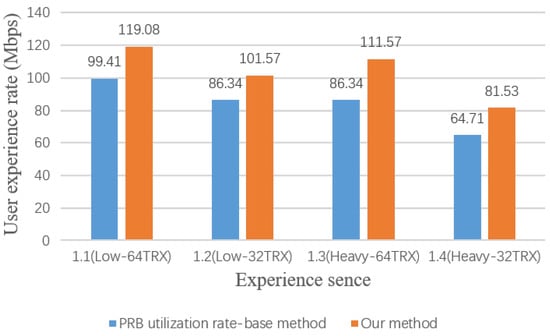
Figure 15.
Average experience rate for different methods in scene 1.
In the mid-low load scenario, leveraging the load balancing method based on PRB utilization, the perceived downlink rate of the whole network user is 99.41 Mbps and 86.34 Mbps with 64 TRX and 32 TRX, respectively. For the time-frequency-space resource allocation method, the perceived downlink rate of the whole network user is 119.08 Mbps and 101.57 Mbps, respectively. The perceived downlink rate of the whole network user is increased by 21% and 17%, respectively. In the mid-heavy load scenario, leveraging the load balancing method based on PRB utilization, the perceived downlink rate of the whole network user is 86.34 Mbps and 64.71 Mbps with 64 TRX and 32 TRX, respectively. For the time-frequency-space resource allocation method, the perceived downlink rate of the whole network user is 111.57 Mbps and 81.53 Mbps, respectively. The perceived downlink rate of the whole network user is increased by 30% and 26%, respectively.
In addition, by conducting separate statistics for each cell, as shown in Figure 16, it can be found that the proposed method can also effectively improve the average throughput for different cells.
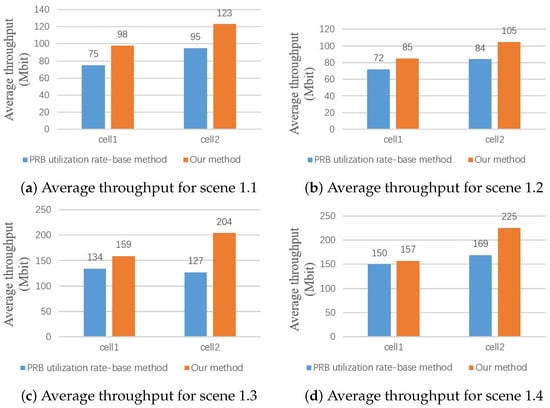
Figure 16.
Average throughput for different cells.
In conclusion, under the same number of antennae and bandwidth, with the increase of load (from mid-low load to mid-heavy load), the time-frequency space resource allocation algorithm can achieve user balance on the heavy-load beam and the low-load beam, release the potential capability of MU pairing, make more rational utilization of space resources, and increase the average throughput gain of network-level users. In addition, under the same bandwidth, load, and user distribution, with the increase in the number of antennae, the larger the number of beams, the finer the beam granularity, the larger the MU gain, and the larger the average throughput of network-level users.
5.2.2. Performance for Different Bandwidth
In this part, we increase the system bandwidth from 20 M to 40 M to validate the performance of the method with different bandwidths. As shown in Table 8, we also design scenes 2.1–2.4. The performance gains are ranging from 18–31%.
Table 8.
Performance Gain for Networking TDD@40 M+TDD@40 M.
Compared with Table 7, we can find that under the same load and user distribution, the network-level user experience improves with the increase in bandwidth, and in the case of large bandwidths, the advantages of our approach are further amplified. Because more frequency-domain RB can be used in this situation, more RB combinations can be selected by different users under multi-user arrangement, which is equivalent to an increase in freedom in resource allocation. Figure 17 shows the average experience rate for different methods and scenes. Although the available RB of PRB utilization-based methods also increases, our method can better coordinate time-frequency-space three-dimensional resources, leading to higher gain. Additionally, the average experience rates for different methods and scenes are shown in Figure 17.
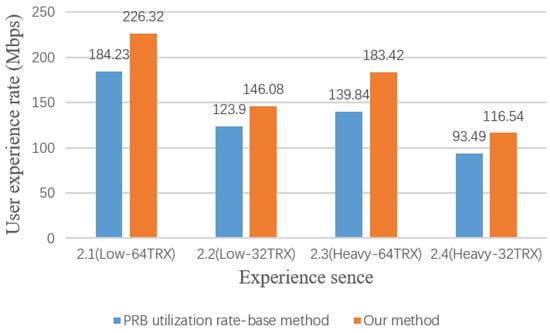
Figure 17.
Average experience rate for different methods in scene 2.
5.2.3. Performance for Different Networking Modes
The aforementioned evaluation focuses on the networking modes involving two inter-frequency carriers. In this part, we verify the performance of the proposed method with three inter-frequency carriers, including TDD 3.5 G, TDD 3.5 G, and FDD 2.1 G. The performance gains involving different loads and different numbers of antennae are demonstrated in Table 9. Our method owns 20–35% gain compared with the traditional method. Additionally, the average experience rates for different methods and scenes are shown in Figure 18. Our approach has obvious advantages.
Table 9.
Performance Gain for Networking TDD@40 M+TDD@40 M+FDD@20 M.
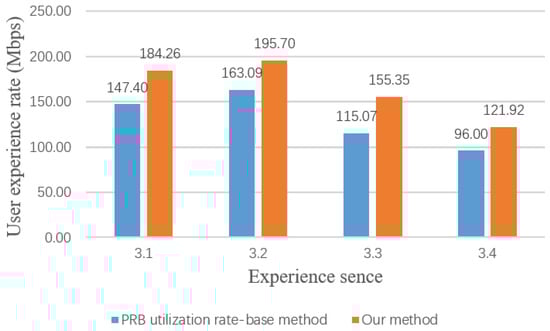
Figure 18.
Average experience rate for network with three carriers.
In conclusion, our method improves system-level performance in a multi-user, multi-carrier scenario. The time-frequency-space resources can be allocated cooperatively. Compared with the classical method, the proposed method achieves better network-level user experience.
6. Conclusions
In this paper, we explore resource allocation methods that comprehensively consider time-domain, frequency-domain, and spatial-domain multi-dimensional collaboration to achieve optimal network-level user experience in multi-carrier and multi-beam scenarios within the context of 5G and future mobile communication sharing networks. We build an optimization model based on the Shannon theorem. Additionally, an AI-based smart grid technology is introduced to achieve inter-frequency information prediction, enabling the construction of an alternative parameter set for optimization. This scheme predicts inter-frequency RSRP, beam, and spectral efficiency, which are integrated into the optimization algorithm to determine the optimal time-frequency-space resource allocation scheme. Through efficient coordination of multiple frequency bands and inter-beam resources, the potential capability of MU pairing can be released; space resources will be used more rationally. Extensive experiments validate the effectiveness and superiority of the proposed methods. This work contributes to the ongoing efforts to enhance spectrum efficiency and elevate user satisfaction, thereby paving the way for more efficient and user-centric next-generation communication networks.
Author Contributions
Conceptualization, G.L. and L.Z.; methodology, G.L., P.L., L.Z., X.D., C.H. and W.X.; software, L.Z.; validation, X.D. and L.Z.; formal analysis, X.D., P.L. and W.X.; investigation, X.D.; resources, P.L. and C.H.; data curation, L.Z.; writing—original draft preparation, X.D.; writing—review and editing, X.D. and W.X.; visualization, X.D.; supervision, G.L., P.L., C.H. and W.X.; project administration, P.L. and C.H.; funding acquisition, G.L. and W.X. All authors have read and agreed to the published version of the manuscript.
Funding
This research received no external funding.
Data Availability Statement
No public involvement in any aspect of this research.
Conflicts of Interest
The authors declare no conflict of interest.
References
- Jun, S.; Choi, Y.S.; Chung, H. Considerations on Ultra broadband, High reliable and Low latency services in 6G system. In Proceedings of the 2021 International Conference on Information and Communication Technology Convergence (ICTC), Jeju Island, Republic of Korea, 20–22 October 2021; pp. 1552–1554. [Google Scholar]
- Adhikari, M.; Hazra, A. 6G-enabled ultra-reliable low-latency communication in edge networks. IEEE Commun. Stand. Mag. 2022, 6, 67–74. [Google Scholar] [CrossRef]
- Kelechi, A.H.; Alsharif, M.H.; Ramly, A.M.; Abdullah, N.F.; Nordin, R. The four-C framework for high capacity ultra-low latency in 5G networks: A review. Energies 2019, 12, 3449. [Google Scholar] [CrossRef]
- Taha, A.E.M. Quality of experience in 6G networks: Outlook and challenges. J. Sens. Actuator Netw. 2021, 10, 11. [Google Scholar] [CrossRef]
- Pirinen, P. A brief overview of 5G research activities. In Proceedings of the 1st International Conference on 5G for Ubiquitous Connectivity, Akaslompolo, Finland, 26–28 November 2014; pp. 17–22. [Google Scholar]
- Liu, G.; Jiang, D. 5G: Vision and requirements for mobile communication system towards year 2020. Chin. J. Eng. 2016, 2016, 8. [Google Scholar] [CrossRef]
- Ouamri, M.A.; Azni, M.; Oteşteanu, M.E. Coverage Analysis in Two-tier 5G Hetnet Based on Stochastic Geometry with Interference Coordination Strategy. Wirel. Pers. Commun. 2021, 121, 3213–3222. [Google Scholar] [CrossRef]
- Ouamri, M.A.; Zenadji, S.; Khellaf, S.; Azni, M. Optimal base station location in LTE heterogeneous network using non-dominated sorting genetic algorithm II. Int. J. Wirel. Mob. Comput. 2018, 14, 328–334. [Google Scholar] [CrossRef]
- Chang, K.C.; Chu, K.C.; Wang, H.C.; Lin, Y.C.; Pan, J.S. Energy saving technology of 5G base station based on internet of things collaborative control. IEEE Access 2020, 8, 32935–32946. [Google Scholar] [CrossRef]
- Hu, N.; Tian, Z.; Du, X.; Guizani, M. An energy-efficient in-network computing paradigm for 6G. IEEE Trans. Green Commun. Netw. 2021, 5, 1722–1733. [Google Scholar] [CrossRef]
- Xu, Y.; Gui, G.; Gacanin, H.; Adachi, F. A survey on resource allocation for 5G heterogeneous networks: Current research, future trends, and challenges. IEEE Commun. Surv. Tutor. 2021, 23, 668–695. [Google Scholar] [CrossRef]
- Taheribakhsh, M.; Jafari, A.; Peiro, M.M.; Kazemifard, N. 5G implementation: Major issues and challenges. In Proceedings of the 2020 25th International Computer Conference, Computer Society of Iran (CSICC), Tehran, Iran, 1–2 January 2020; pp. 1–5. [Google Scholar]
- 3GPP. Telecommunication Management; Network Sharing; Concepts and Requirements. 3GPP TS 32.130 2016. Available online: https://portal.3gpp.org/desktopmodules/Specifications/SpecificationDetails.aspx?specificationId=1873 (accessed on 21 September 2023).
- Mobile Infrastructure Sharing. Available online: https://www.gsma.com/publicpolicy/wp-content/uploads/2012/09/Mobile-Infrastructure-sharing.pdf (accessed on 1 September 2012).
- Mekuria, F.; Mfupe, L. Spectrum Sharing for Unlicensed 5G Networks. In Proceedings of the 2019 IEEE Wireless Communications and Networking Conference (WCNC), Marrakesh, Morocco, 15–18 April 2019; pp. 1–5. [Google Scholar] [CrossRef]
- Bao, H.; Huo, Y.; Dong, X.; Huang, C. Joint Time and Power Allocation for 5G NR Unlicensed Systems. IEEE Trans. Wirel. Commun. 2021, 20, 6195–6209. [Google Scholar] [CrossRef]
- Candal-Ventureira, D.; González-Castaño, F.J.; Gil-Castiñeira, F.; Fondo-Ferreiro, P. Coordinated Allocation of Radio Resources to Wi-Fi and Cellular Technologies in Shared Unlicensed Frequencies. IEEE Access 2021, 9, 134435–134456. [Google Scholar] [CrossRef]
- Ma, B.; Yang, B.; Zhu, Y.; Zhang, J. Context-aware proactive 5G load balancing and optimization for urban areas. IEEE Access 2020, 8, 8405–8417. [Google Scholar] [CrossRef]
- Addali, K.M.; Melhem, S.Y.B.; Khamayseh, Y.; Zhang, Z.; Kadoch, M. Dynamic mobility load balancing for 5G small-cell networks based on utility functions. IEEE Access 2019, 7, 126998–127011. [Google Scholar] [CrossRef]
- Li, C.; Li, X. Throughput maximization for multi-carrier non-orthogonal multiple access systems with coordinated direct and relay transmission. In Proceedings of the 2018 IEEE International Conference on Communications (ICC), Kansas City, MO, USA, 20–24 May 2018; pp. 1–6. [Google Scholar]
- Shajaiah, H.; Abdelhadi, A.; Clancy, T.C. Robust resource allocation with joint carrier aggregation in multi-carrier cellular networks. IEEE Trans. Cogn. Commun. Netw. 2017, 4, 53–65. [Google Scholar] [CrossRef]
- Wang, Y.; Pedersen, K.I.; Sørensen, T.B.; Mogensen, P.E. Carrier load balancing and packet scheduling for multi-carrier systems. IEEE Trans. Wirel. Commun. 2010, 9, 1780–1789. [Google Scholar] [CrossRef]
- Khoramnejad, F.; Joda, R.; Sediq, A.B.; Abou-Zeid, H.; Atawia, R.; Boudreau, G.; Erol-Kantarci, M. Delay-aware and energy-efficient carrier aggregation in 5G using double deep Q-networks. IEEE Trans. Commun. 2022, 70, 6615–6629. [Google Scholar] [CrossRef]
- Huang, Q.; Zhou, J.; Sarkar, M. A grouping-based radio resource allocation algorithm for multi-carrier LTE-A systems. In Proceedings of the 6th International Conference on Wireless, Mobile and Multi-Media (ICWMMN 2015), Beijing, China, 20–23 November 2015; pp. 78–82. [Google Scholar]
- Ngo, H.Q.; Larsson, E.G.; Marzetta, T.L. Energy and spectral efficiency of very large multiuser MIMO systems. IEEE Trans. Commun. 2013, 61, 1436–1449. [Google Scholar]
- Hu, Y.; Liu, R.; Bian, H.; Gao, X. A Low Complexity Algorithm of Dynamic Resource Allocation for Downlink Multi-Carrier NOMA Systems. IEEE Trans. Veh. Technol. 2021, 70, 13418–13423. [Google Scholar] [CrossRef]
- Joda, R.; Elsayed, M.; Abou-Zeid, H.; Atawia, R.; Sediq, A.B.; Boudreau, G.; Erol-Kantarci, M. QoS-aware joint component carrier selection and resource allocation for carrier aggregation in 5G. In Proceedings of the ICC 2021-IEEE International Conference on Communications, Montreal, QC, Canada, 14–23 June 2021; pp. 1–6. [Google Scholar]
- Rostami, S.; Arshad, K.; Rapajic, P. Optimum radio resource management in carrier aggregation based LTE-advanced systems. IEEE Trans. Veh. Technol. 2017, 67, 580–589. [Google Scholar] [CrossRef]
- Mishra, S.; Mathur, N. Load balancing optimization in lte/lte-a cellular networks: A review. arXiv 2014, arXiv:1412.7273. [Google Scholar]
Disclaimer/Publisher’s Note: The statements, opinions and data contained in all publications are solely those of the individual author(s) and contributor(s) and not of MDPI and/or the editor(s). MDPI and/or the editor(s) disclaim responsibility for any injury to people or property resulting from any ideas, methods, instructions or products referred to in the content. |
© 2023 by the authors. Licensee MDPI, Basel, Switzerland. This article is an open access article distributed under the terms and conditions of the Creative Commons Attribution (CC BY) license (https://creativecommons.org/licenses/by/4.0/).