Article

Exploring Biosignals for Quantitative Pain Assessment in Cancer Patients: A Proof of Concept

by
Marco Cascella
1,
Vincenzo Norman Vitale
2,3,
Michela D’Antò
1,
Arturo Cuomo
1,
Francesco Amato
3,
Maria Romano
3,* and
Alfonso Maria Ponsiglione
3
1
Department of Anesthesia and Critical Care, Istituto Nazionale Tumori-IRCCS Fondazione Pascale, 80100 Naples, Italy
2
Interdepartmental Research Center URBAN/ECO, University of Naples “Federico II”, 80127 Naples, Italy
3
Department of Information Technology and Electrical Engineering, University of Naples “Federico II”, 80125 Naples, Italy
*
Author to whom correspondence should be addressed.
Electronics 2023, 12(17), 3716; https://doi.org/10.3390/electronics12173716
Submission received: 3 August 2023 / Revised: 23 August 2023 / Accepted: 31 August 2023 / Published: 2 September 2023

Abstract

:
Perception and expression of pain in cancer patients are influenced by distress levels, tumor type and progression, and the underlying pathophysiology of pain. Relying on traditional pain assessment tools can present limitations due to the highly subjective and multifaceted nature of the symptoms. In this scenario, objective pain assessment is an open research challenge. This work introduces a framework for automatic pain assessment. The proposed method is based on a wearable biosignal platform to extract quantitative indicators of the patient pain experience, evaluated through a self-assessment report. Two preliminary case studies focused on the simultaneous acquisition of electrocardiography (ECG), electrodermal activity (EDA), and accelerometer signals are illustrated and discussed. The results demonstrate the feasibility of the approach, highlighting the potential of EDA in capturing skin conductance responses (SCR) related to pain events in chronic cancer pain. A weak correlation (R = 0.2) is found between SCR parameters and the standard deviation of the interbeat interval series (SDRR), selected as the Heart Rate Variability index. A statistically significant (p < 0.001) increase in both EDA signal and SDRR is detected in movement with respect to rest conditions (assessed by means of the accelerometer signals) in the case of motion-associated cancer pain, thus reflecting the relationship between motor dynamics, which trigger painful responses, and the subsequent activation of the autonomous nervous system. With the objective of integrating parameters obtained from biosignals to establish pain signatures within different clinical scenarios, the proposed framework proves to be a promising research approach to define pain signatures in different clinical contexts.

1. Introduction

The World Cancer Research Fund reported that approximately 18 million new cancer cases were estimated globally in 2020 [1]. Cancer pain is a common issue among cancer patients, with its prevalence varying depending on the cancer type, stage, and pain management strategies. The World Health Organization (WHO) reported that approximately 30–50% of cancer patients experience moderate to severe pain [2], whereas 70–90% of individuals with advanced cancer experience pain [3]. According to the International Association for the Study of Pain (IASP), chronic pain refers to persistent or recurring pain that lasts for an extended period, typically three months or more [4]. It is a complex and multidimensional experience that significantly affects physical, emotional, and social well-being. This condition often hampers daily activities, sleep, work, and social interactions [5].
An effective pain treatment approach typically involves a combination of pharmacological and non-pharmacological interventions tailored to individual patient needs [6]. In this complex scenario, accurate pain assessment plays a critical role in guiding treatment decisions [7]. However, widely used self-report quantitative methods like the Numeric Rating Scale (NRS) and Visual Analog Scale (VAS) are susceptible to reporting bias influenced by psychosocial factors, including tendencies to catastrophize or underreport pain [8,9]. In cancer patients, indeed, pain perception and expression are often influenced by various variables such as psychosocial issues, distress, tumor type and progression, and pain pathophysiology [10]. Additionally, individual factors like pain tolerance, communication abilities, coping strategies, and emotional state further complicate the clinical evaluation [11]. These challenges underscore the need to develop models and methods to identify measurable, reliable, and appropriate indicators to support the objective and automatic assessment of cancer pain and to carefully guide pain management in cancer patients.
Automatic pain assessment (APA) aims to use objective measures to evaluate pain intensity, providing a more objective alternative to subjective pain scales. APA strategies are particularly valuable in situations where reliable self-report data are difficult to obtain, such as in children with cognitive disabilities or individuals with communication challenges, including those with dementia or those who are non-verbal or intubated [12,13,14,15]. APA encompasses different approaches, including behavioral and physiological indicators. Behavioral strategies involve analyzing facial expressions, linguistic analysis using qualitative and quantitative methods, and observing non-verbal physical indicators like body movements and gestures. Physiological indicators include biosignals such as electrocardiogram (ECG), electrodermal activity (EDA), and brain imaging techniques such as functional magnetic resonance imaging (fMRI) and electroencephalography (EEG) to measure pain-related brain activity [16,17]. In particular, EDA and ECG signals were chosen for this research due to their novelty and importance in pain evaluation. Concerning EDA signals, some preliminary results already show rapid responses caused by specific stimuli (sensorial and/or emotional) [18]. On the other hand, RR series were assessed based on ECG signals, since the relationship between HRV and pain and/or stress is known in the literature [19,20]. However, only recently is a more direct relationship between HRV parameters and tumors being studied [21].
On these premises, this work aims at presenting a general framework for the objective pain assessment of cancer patients, leveraging the power of a combination of biosignals. The framework is introduced, and two preliminary case studies are presented.

2. Materials and Methods

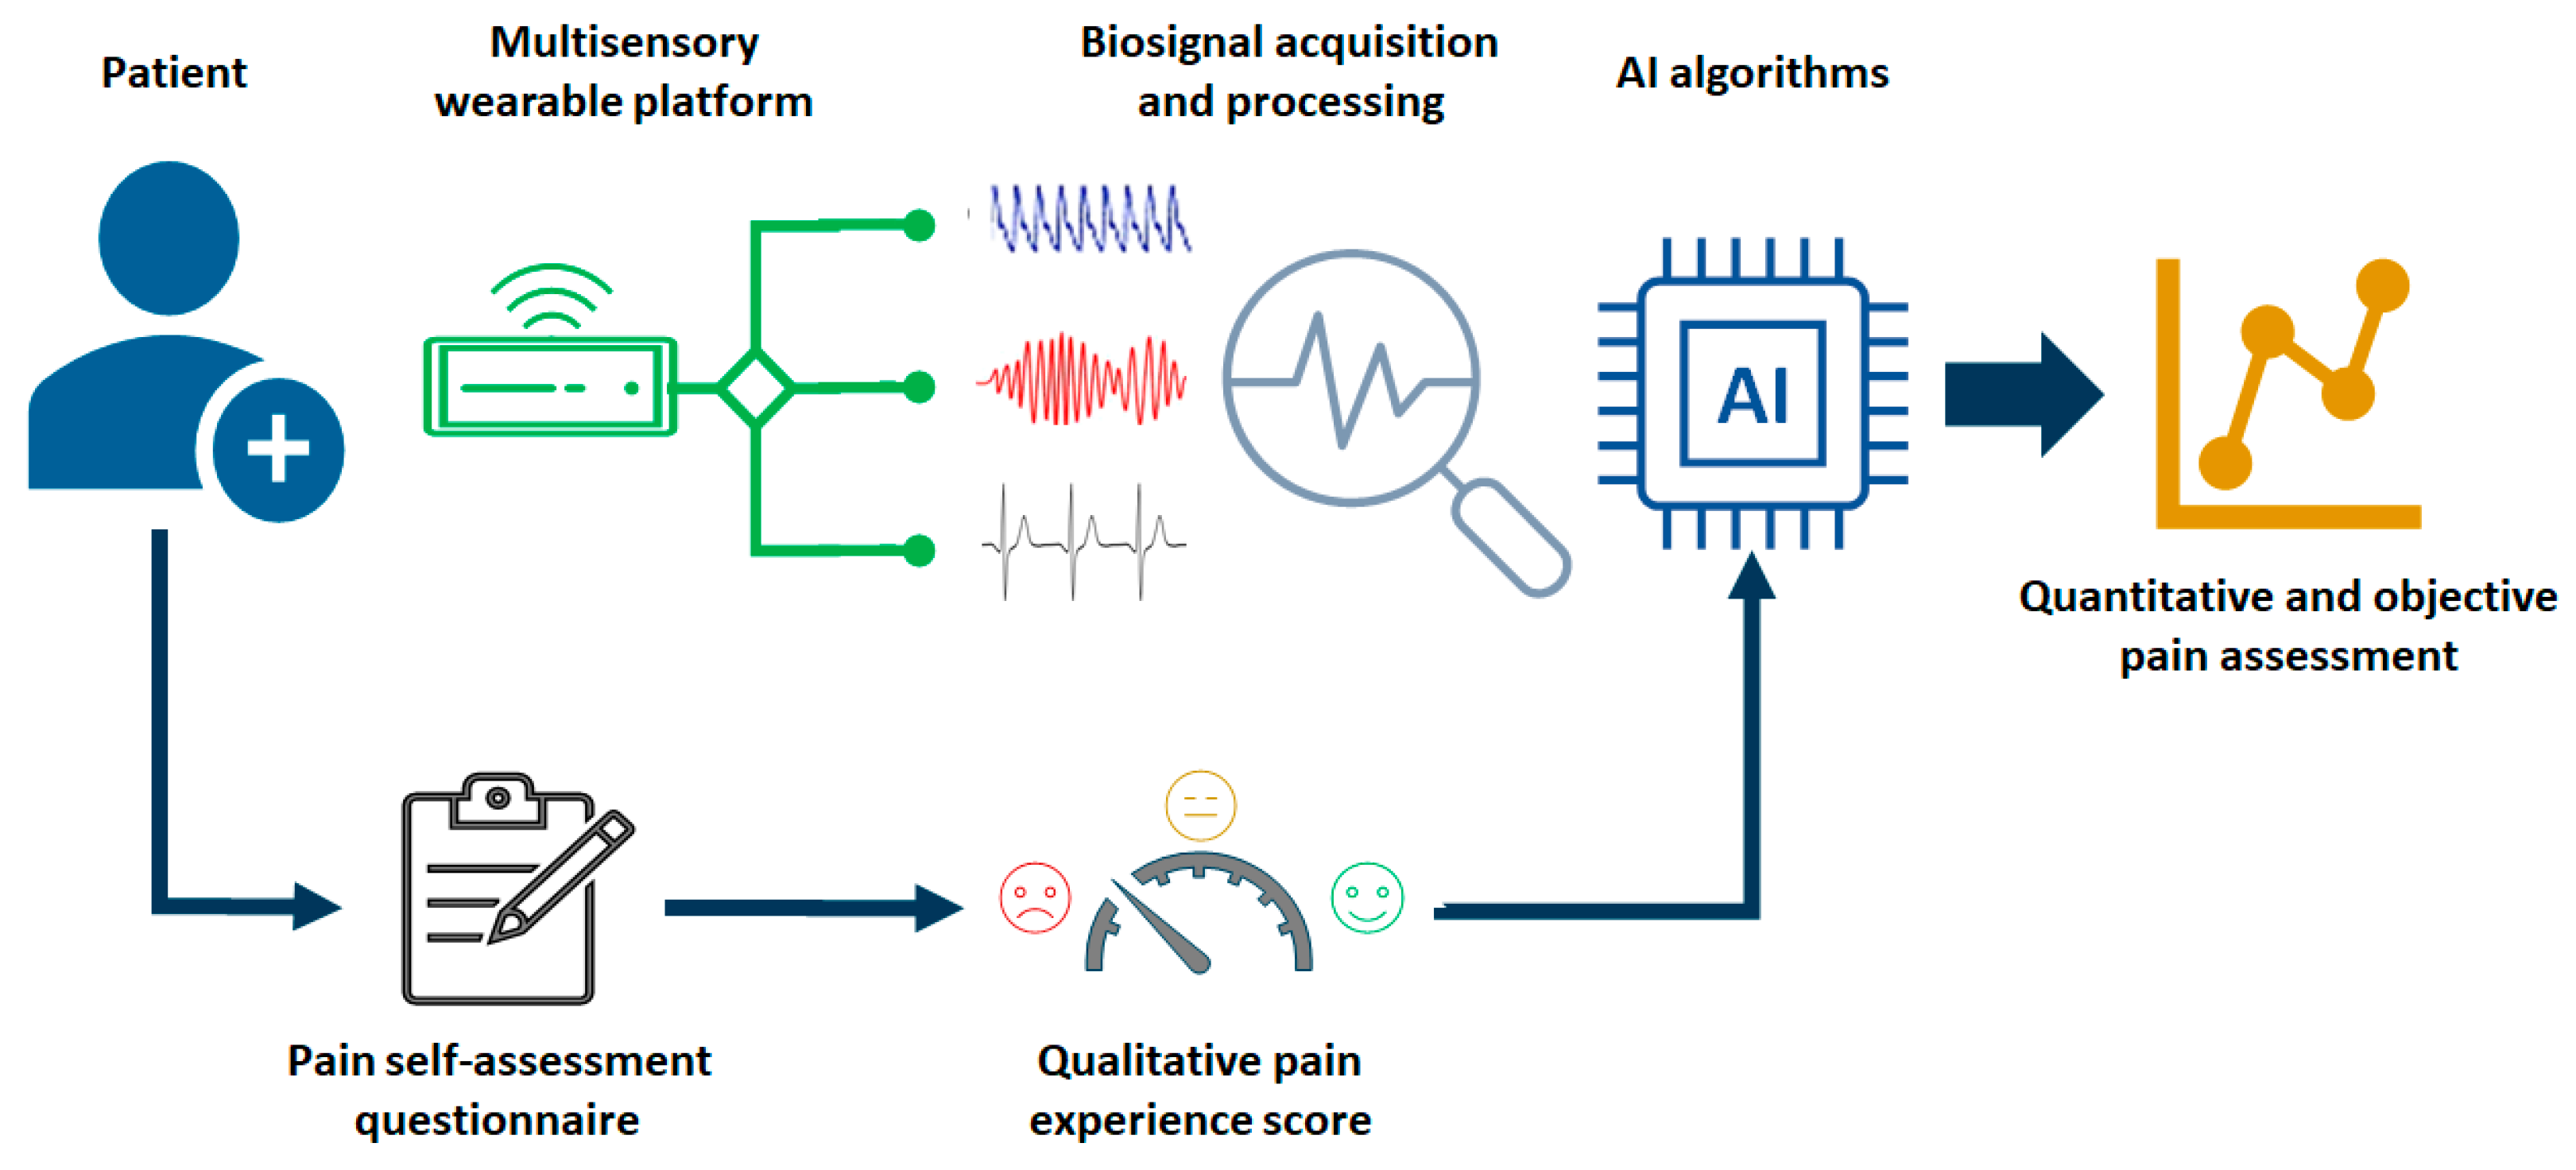
2.1. Framework for Quantitative Cancer Pain Assessment

The framework, illustrated in Figure 1, enables the simultaneous acquisition of various physiological signals through a biosignal acquisition and processing platform. These signals are then processed to extract the most significant features that correlate with the patient’s pain experience. The evaluation of this experience is based on a self-assessment report provided by the patient.
The features extracted from the biosignals may include both time-domain and frequency-domain parameters characterizing the acquired signals and could then be used to train artificial intelligence (AI) algorithms to achieve fast prediction of the patient pain experience, thereby providing a reliable route for an automatic objective pain assessment.

2.2. Context and Data Collection

The study was carried out at the National Institute for Tumors Pascale Foundation, a Scientific Institute for Research, Hospitalization and Healthcare (IRCCS) in Naples, Italy. The study is a crucial component of an investigation aimed at gathering comprehensive data that encompasses both behavioral data and the collection of biosignals in the context of the APA (Pain ASsessment in CAncer Patients by Machine LEarning, PASCALE study) (ClinicalTrials.gov Identifier: NCT04726228).
The research received approval from the local Medical Ethics Committee under the protocol code 41/20 Oss on 26 November 2020. Written informed consent was obtained from all participating patients, and the investigation strictly followed the principles outlined in the Declaration of Helsinki.
We offer a comprehensive presentation of the framework through the analysis of two preliminary case studies.

2.3. Approach for Qualitative Pain Assessment

Qualitative pain ratings were assessed on a reference numerical scale. The adopted NRS scale ranges from 0 to 10, with 0 corresponding to the absence of pain and 10 to high-intensity pain.
Regarding the process of educating patients on pain assessment, they were guided to employ the numeric 0–10 scale. Moreover, patients were explicitly informed that the underlying oncologic pain (background pain) might intensify due to movements or procedures, or arise spontaneously, even when effectively managing the background pain. The phenomenon of pain re-exacerbation is widely acknowledged in clinical practice and is referred to as breakthrough cancer pain (BTCP). It can occur spontaneously (spontaneous or unpredictable BTCP) or in response to movement or medical procedures (incident or predictable BTCP) [22]. Consequently, patients were instructed to provide verbal feedback in case of pain exacerbation, enabling us to establish a correlation between their pain perception and signal variations (pain-related events).

2.4. Approach for Quantitative Pain Assessment

To extract quantitative pain metrics, the simultaneous acquisition of the following three signals was carried out:
-
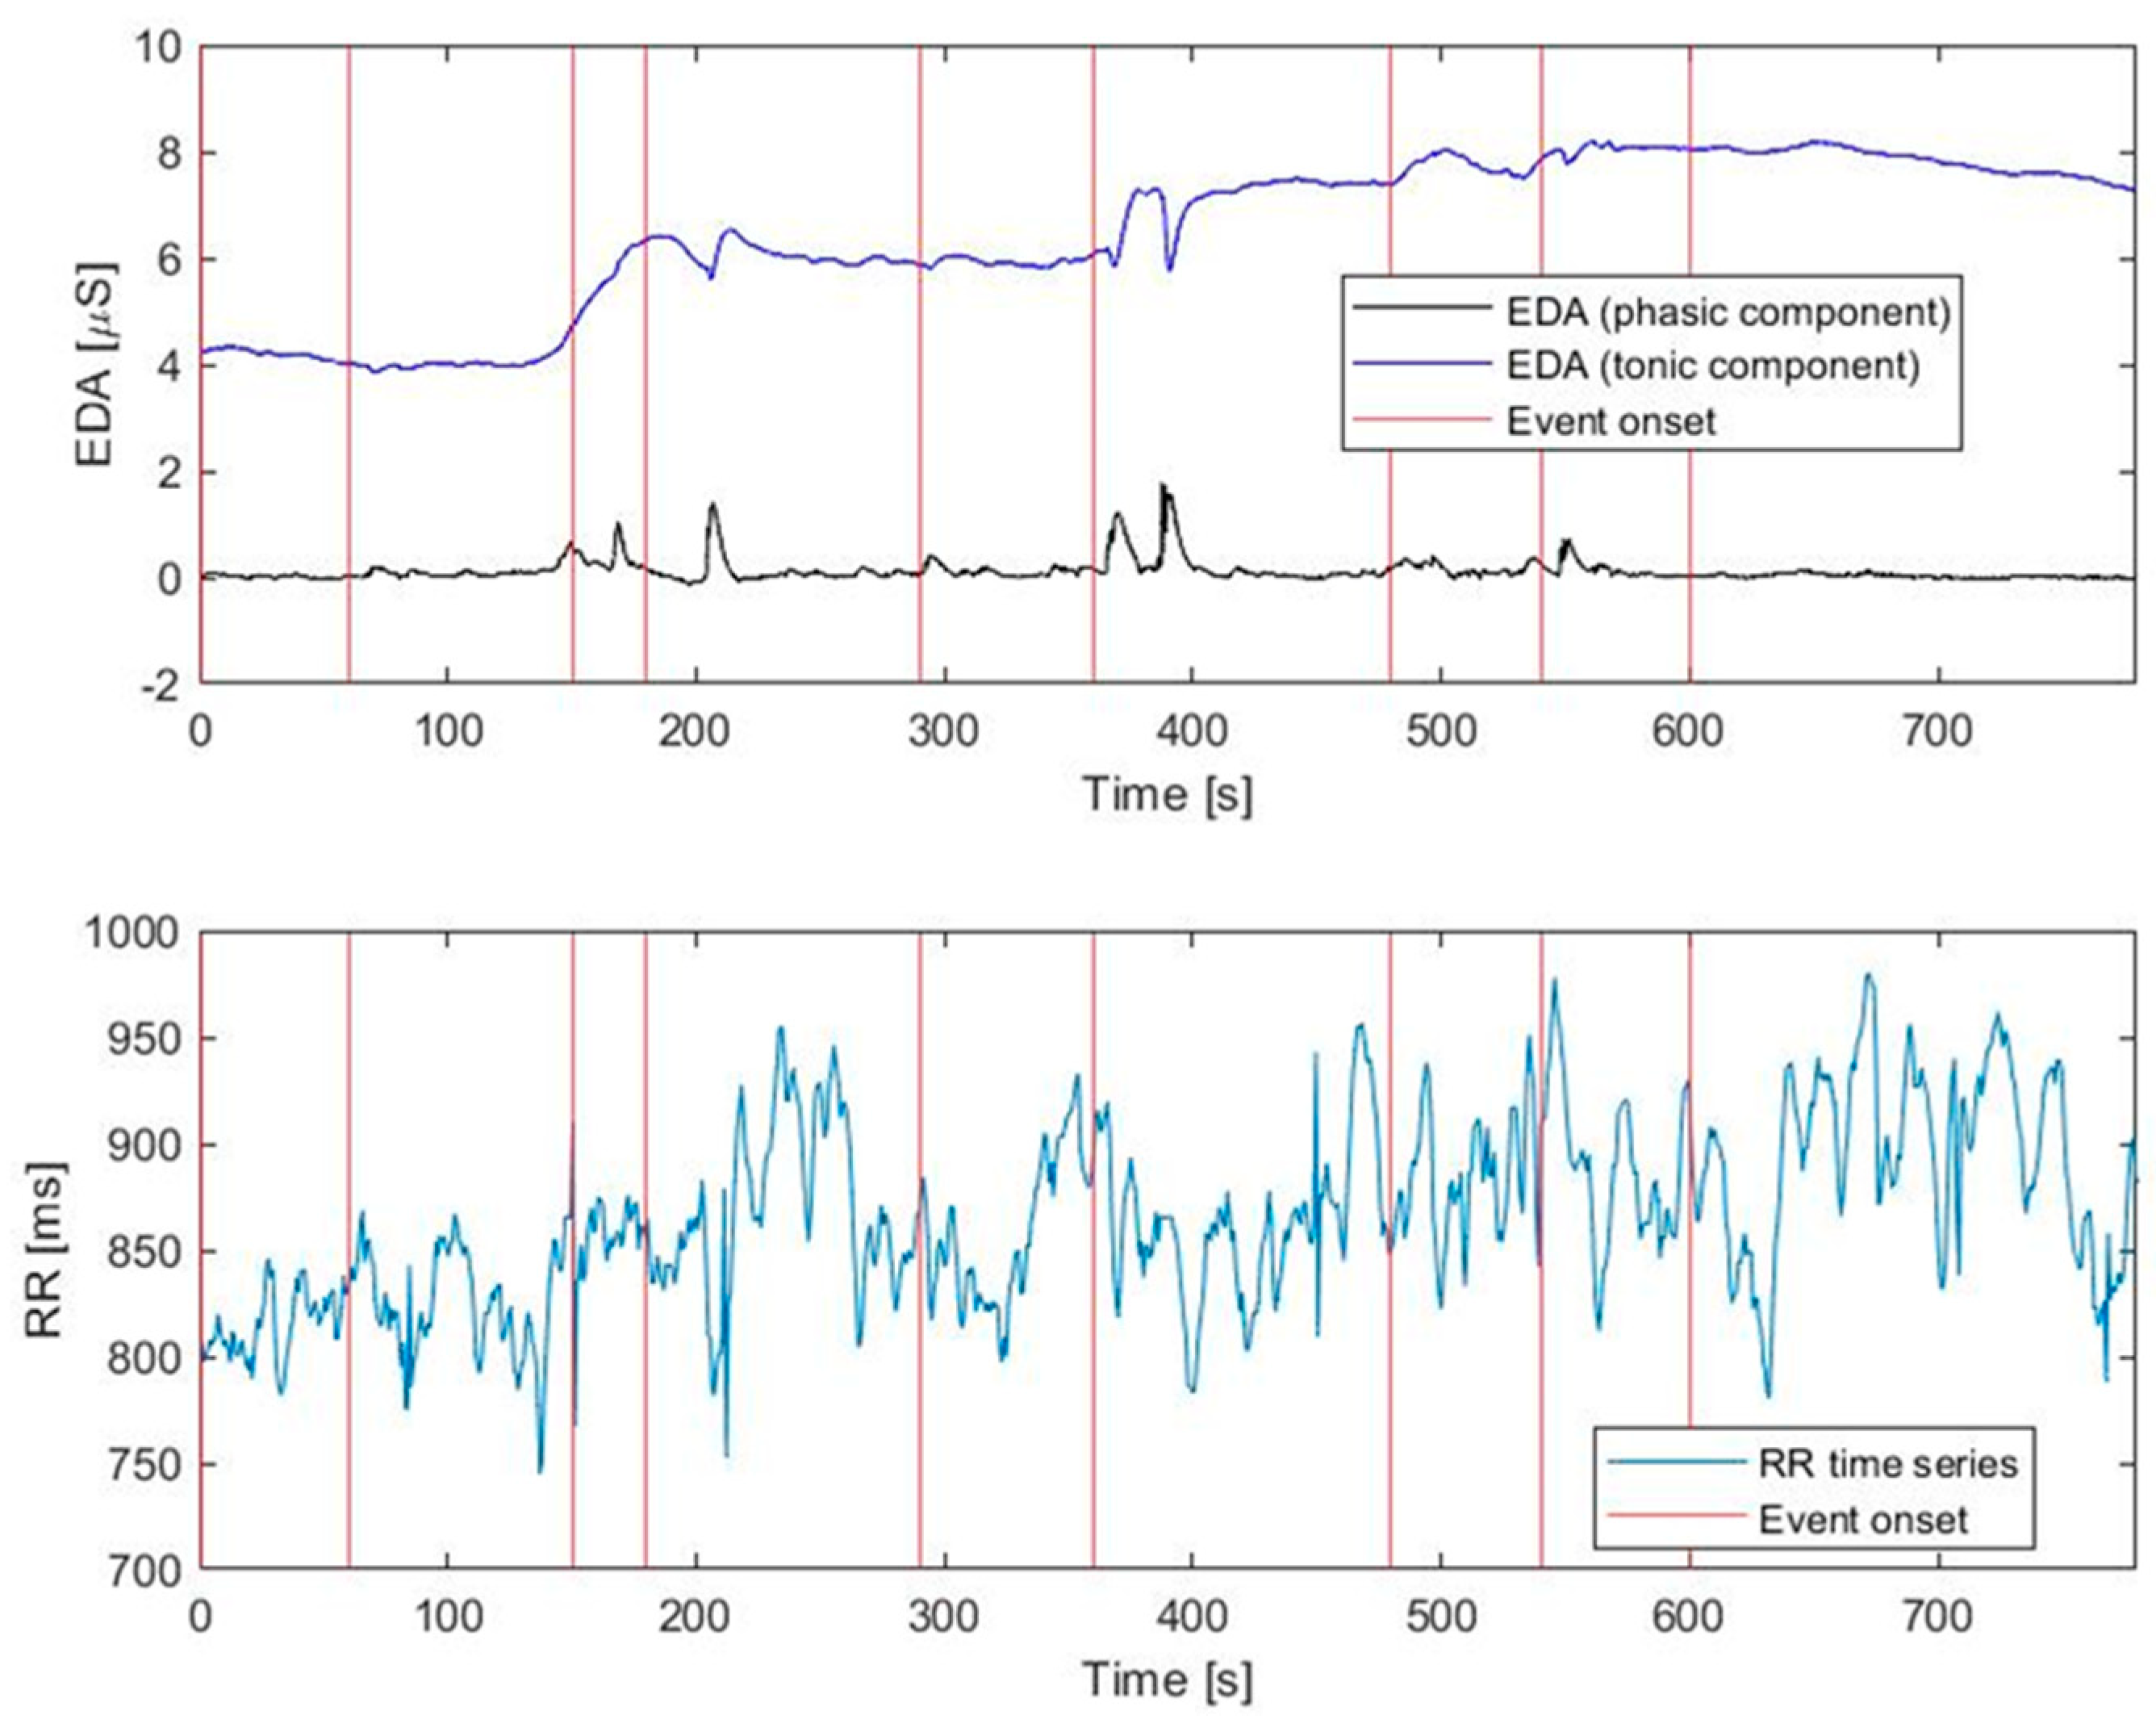
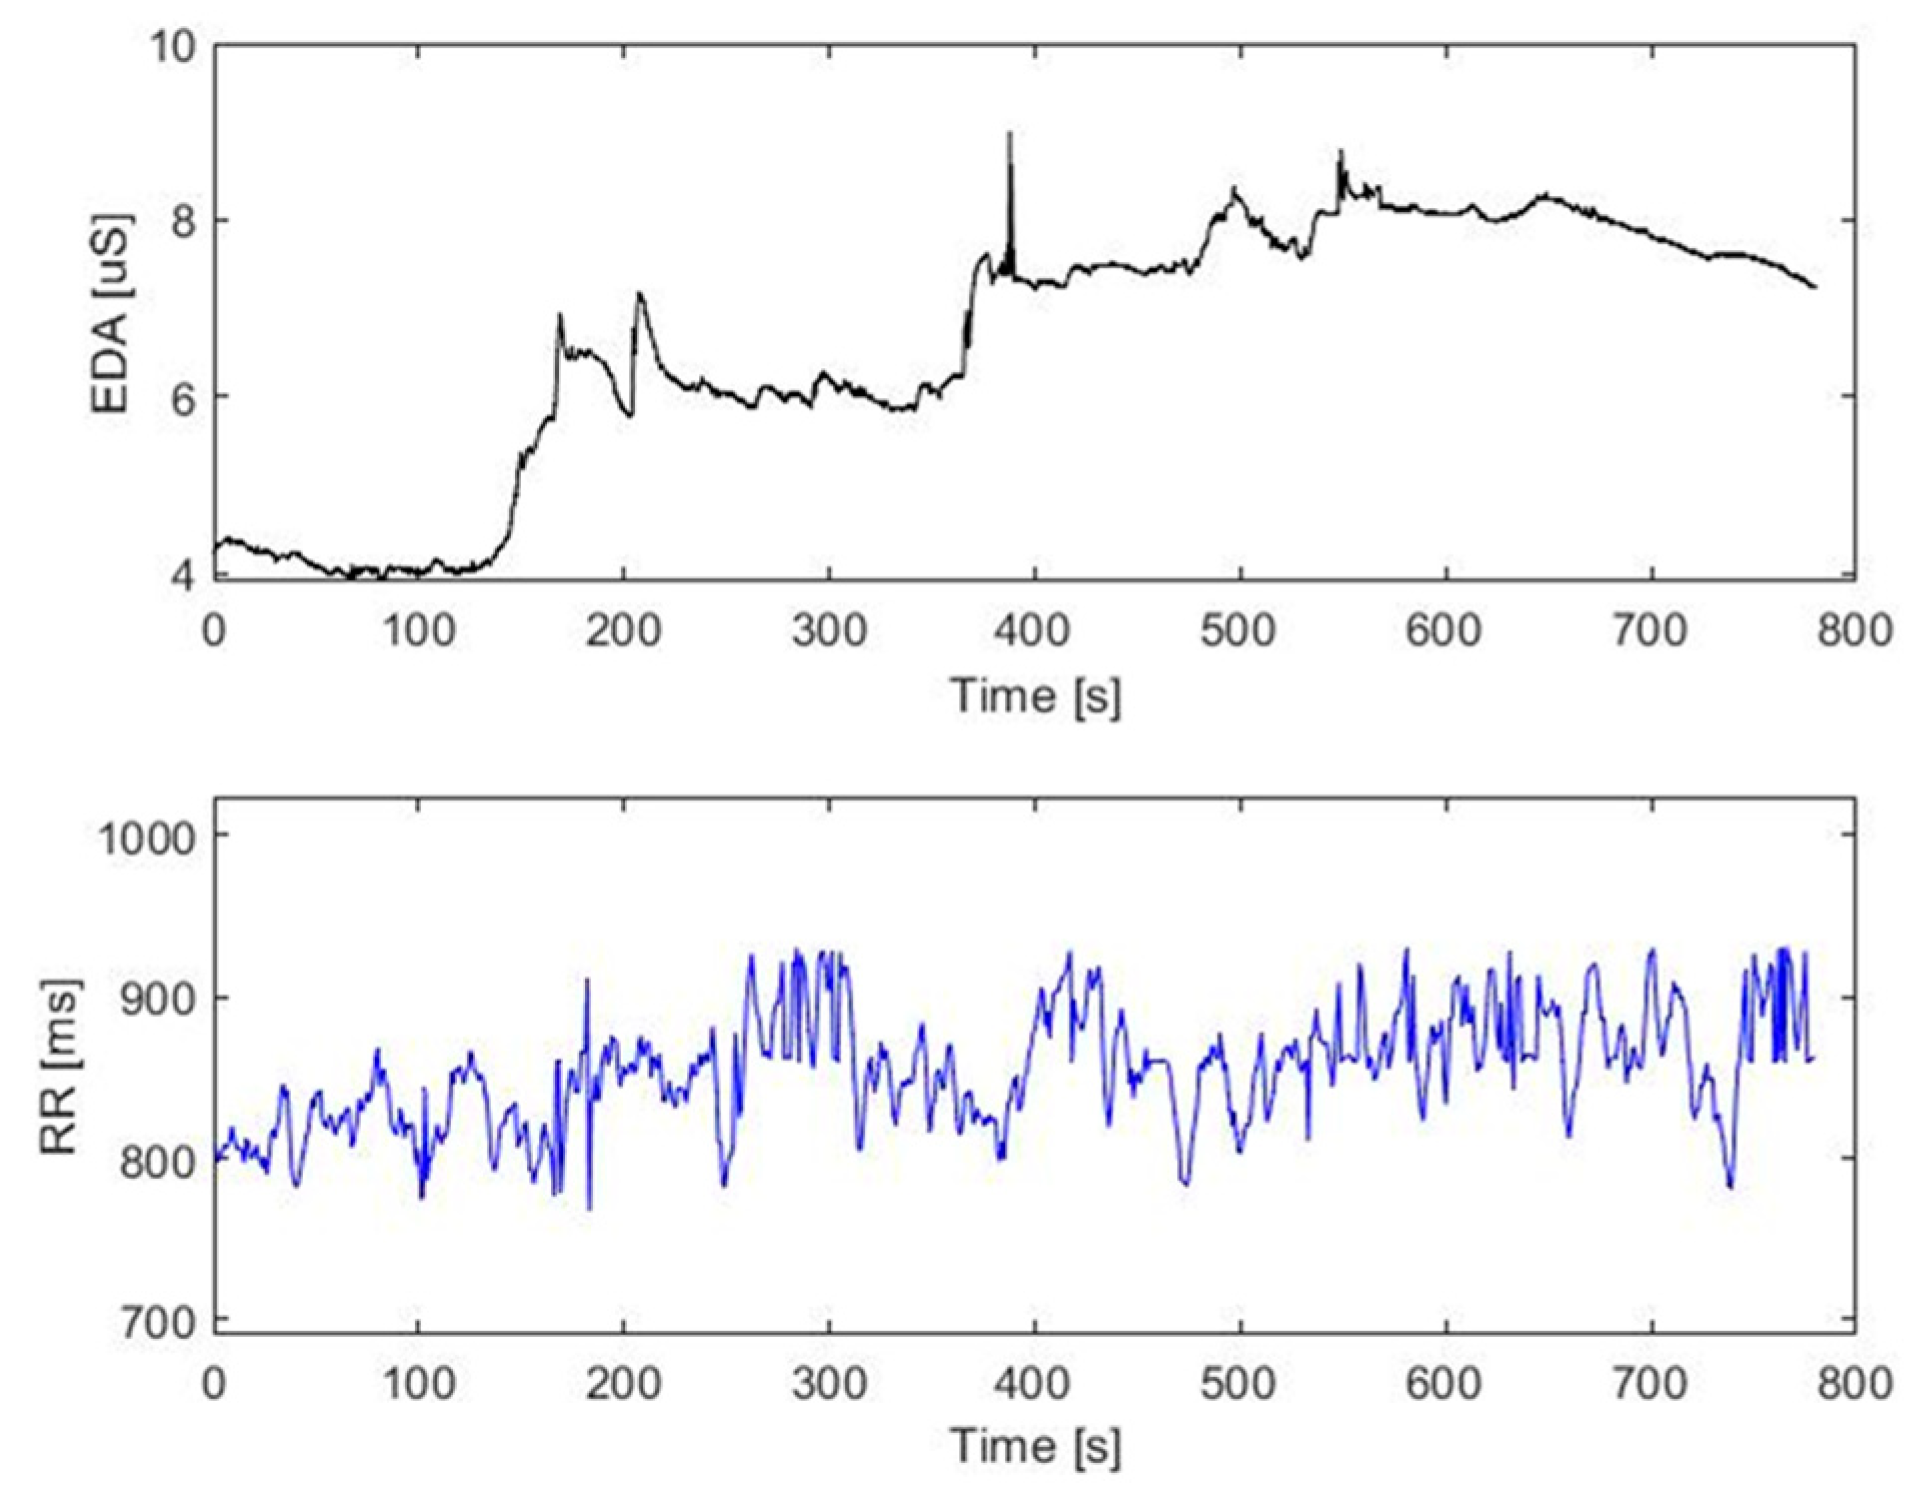
EDA signal. This reflects the sympathetic nervous system activity and has already been used in pain recognition tasks [23]. This approach serves as a valuable indicator for assessing pain-induced neurocognitive stress by detecting changes in the electrical properties of the skin with the activation of sweat glands and ultimately an increase in skin conductance. The continuous changes in skin conductance are referred to as the skin conductance level (SCL), whereas the transient responses that occur within seconds are known as the galvanic skin response (GSR). Both the SCL and GSR contribute to the tonic and phasic components. The former represents a basic level of conductance (i.e., the SCL) and exhibits slow variations. On the other hand, the phasic component reflects the short-duration changes in the EDA signal (i.e., the skin conductance responses, SCRs) aroused by the presentation of a stimulus. Usually, the EDA signal is quantified in microsiemens (µS). Notably, this component can be used for providing insights into the overall automatic pain response [18].
-
ECG signal. This is the superficial recording of the heart’s electrical activity. Temporal fluctuations in inter-beat intervals can provide a measure of heart rate variability (HRV). This variability is closely linked to the activity of the autonomic nervous system (ANS) [24]. Indeed, HRV is influenced by the dynamic interplay between the sympathetic and parasympathetic branches of ANS (sympathovagal balance). These branches work in opposite directions, regulating heart rate to accommodate the body’s changing demands. Shifts in this equilibrium, reflected in HRV changes, are due to physiological factors (such as circadian rhythm) and pathological conditions (like diabetes and post-infarction situations) [25]. These variations can also indicate physiological responses to stressful and painful circumstances [16]. The RR series of interbeat intervals (i.e., the time between successive R waves of the QRS complex on the ECG waveform) has been computed to extract time-domain parameters of the HRV.
-
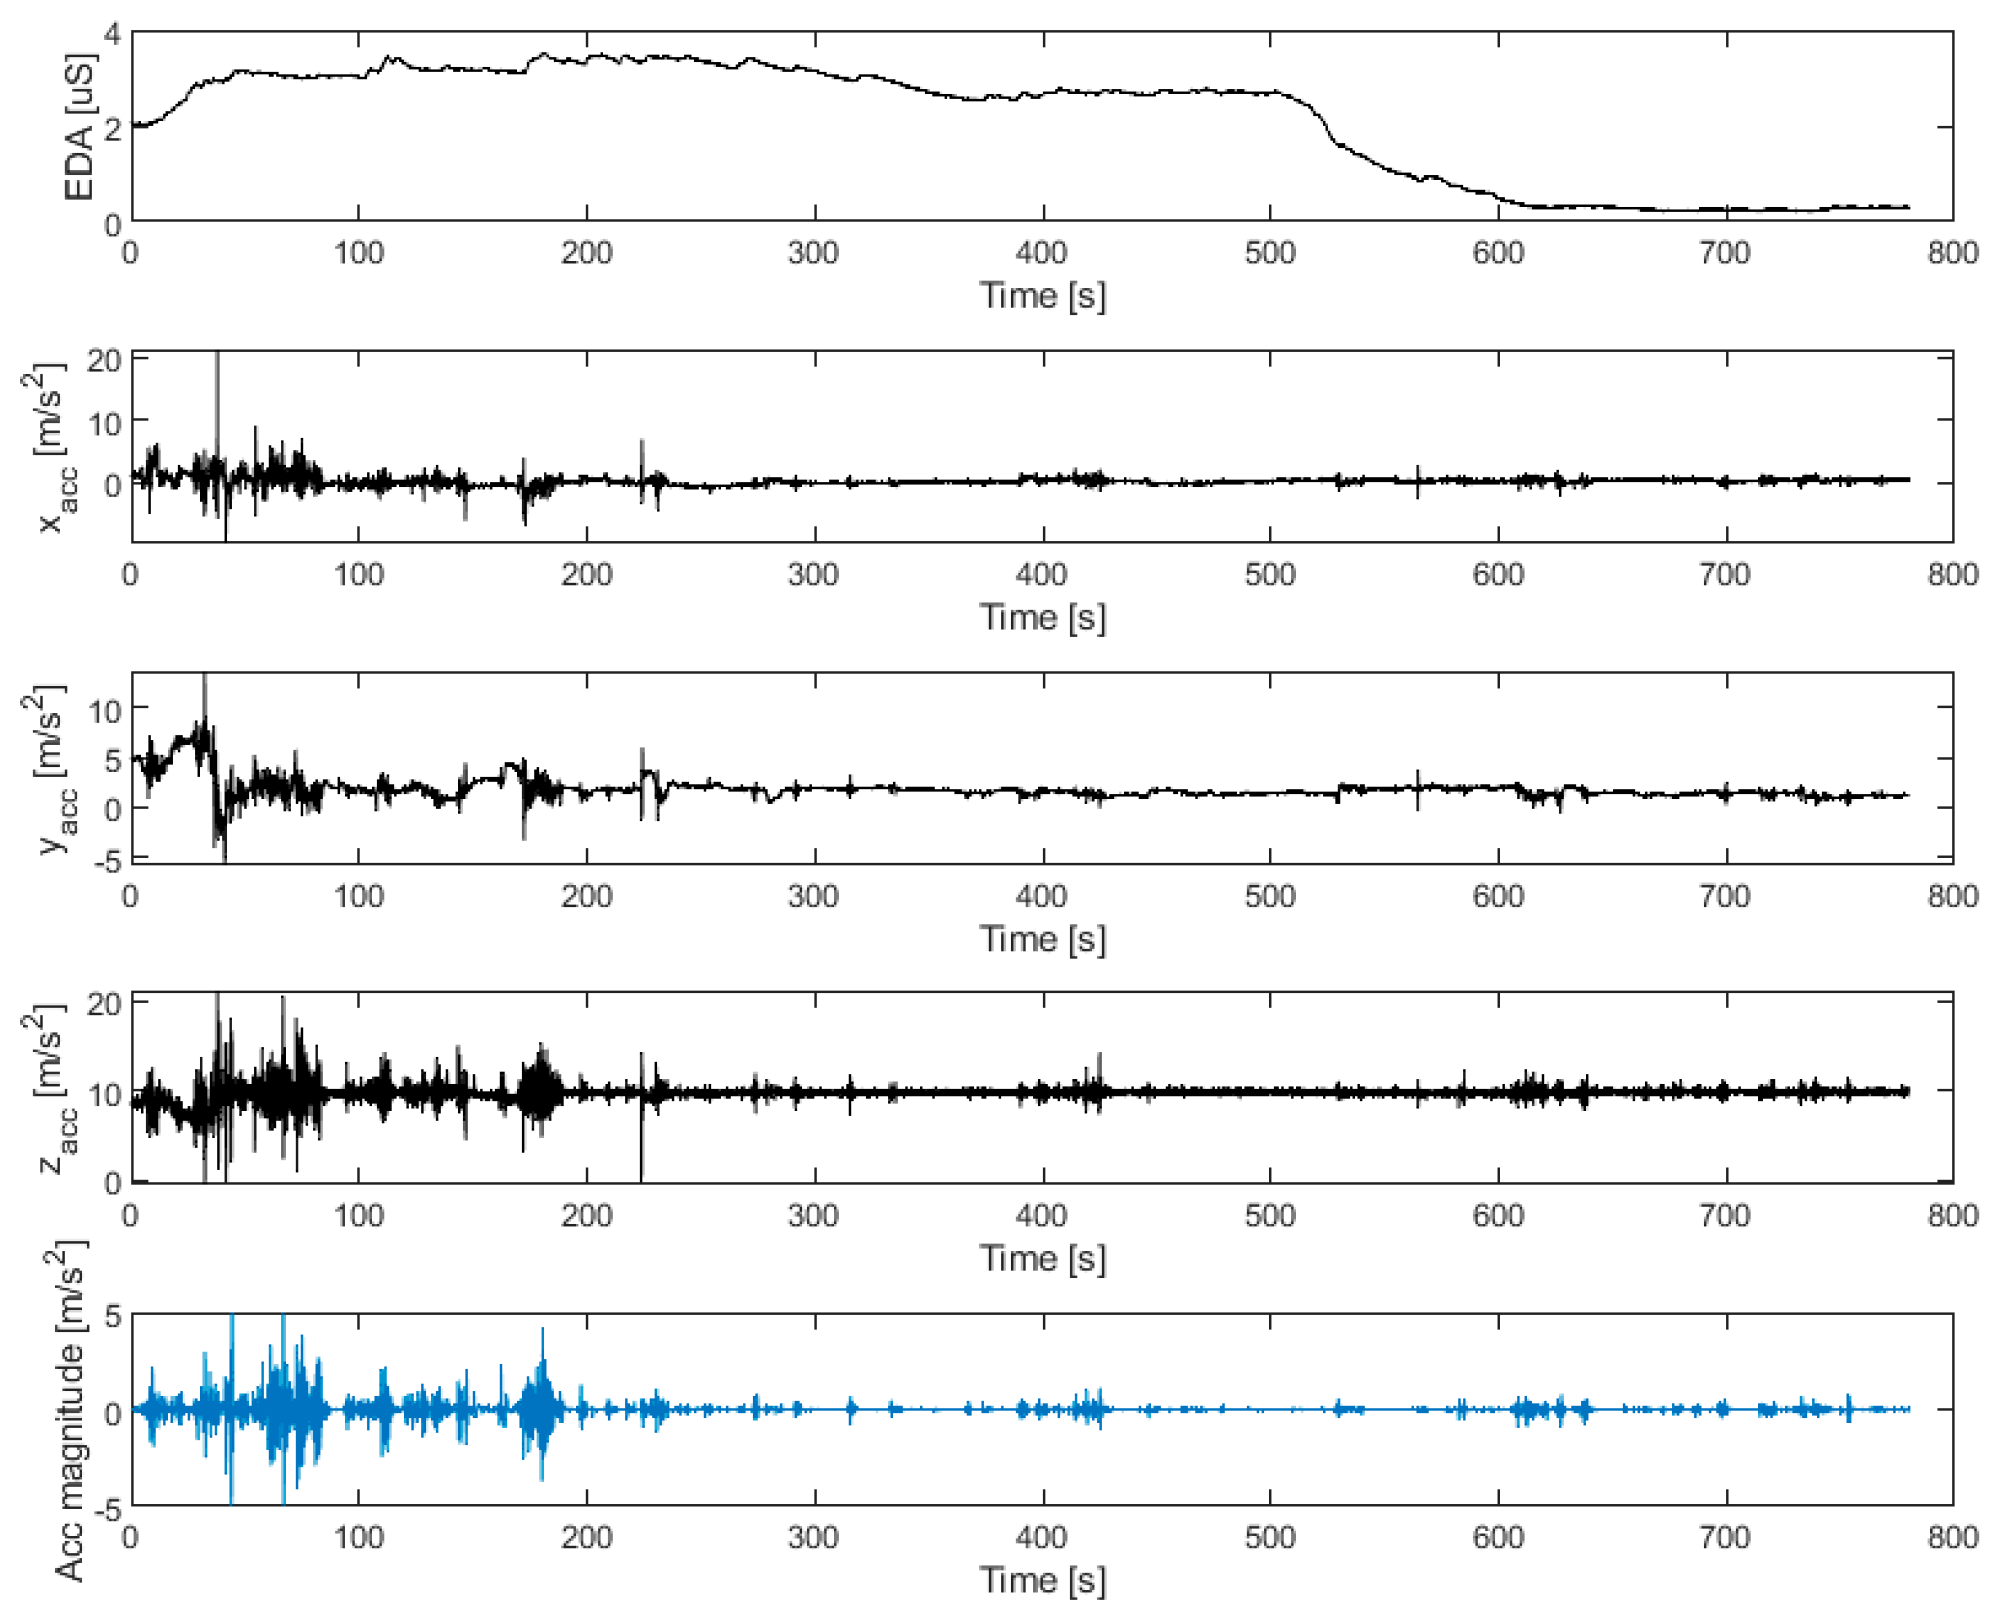
Accelerometer signals. These can provide measurements of the motor activity along the three main directions of an orthogonal cartesian plane. Chen et al. [26] demonstrated that accelerometer signals correlate to the patient’s stress-induced pain. Within the proposed framework, they are used for obtaining a quantitative measure of motion-associated pain.
EDA and ECG signals were acquired by using a BITalino device equipped with sensors for the recording of ECG and EDA signals. The BITalino platform is a hardware-affordable and open-source biosignal platform developed for physiological computing. As reported in the literature, data acquired with this device demonstrate reliability for quantitative analysis [27]. Signals were measured at a 1000 Hz sampling rate (Figure 2).
Accelerometer data were extracted from smartphone built-in sensors at a 100 Hz sampling rate, as suggested in other studies [28,29]. The simultaneous recording of both BITalino and smartphone sensor data was carried out using the BITalino OpenSignal application for Android devices. The synchronization between the two devices is automatically provided by the OpenSignal application.
These devices were chosen for their use simplicity, versatility (more signals can be acquired simultaneously), and size, which allow them to be worn, as shown in Figure 2.

2.5. Biosignal Processing and Statistical Analysis

Before detailing the biosignal processing, it is worth recalling some EDA characteristics. First, as mentioned in Section 2.4, EDA signals were chosen for this study since they are among the most useful in identifying changes in sympathetic arousal due to emotional, pain, and cognition states. EDA signals show two main components, the tonic level, which represents the basal (or tonic) skin conductance level, and the phasic level, which corresponds to variations in sweat release and therefore in skin conductance. The tonic component varies more slowly than the phasic one, which shows rapid variations of a few seconds. Obviously, this different time trend corresponds to different frequency ranges (lower for the tonic component), so the two components can be separated by filtering the raw EDA signals [18].
Indeed, for the processing and analysis of EDA signals, a fifth-order Butterworth low-pass filter with a cutoff frequency of 1 Hz was applied, following the methodology described elsewhere [14,30]. The signals were further analyzed using a deconvolution approach, as suggested in previous studies [31,32], to separate the tonic (basic level of conductance [18]) and phasic components (short-duration changes in the presentation of a stimulus [18]) after downsampling the signal by a factor equal to 100 for reducing the computational burden of the analysis, as suggested in [33]. The onset of pain episodes during registration was temporally marked as reported by the patient during the session (NRS ≥ 4) and was considered for the following analysis and extraction of EDA features.
Regarding the ECG signal, an R peak detection was carried out by adopting a modified version of the Pan–Tompkins algorithm [34] as suggested in [35,36], and the corresponding RR series of interbeat intervals were derived as the difference between successive R peaks. The ECG-derived RR time series was then filtered by means of a recursive procedure, as described in [37], to remove the intervals differing most from the mean of the surrounding RR intervals. Both the mean and the standard deviation (SD) of the resulting RR series were calculated afterward, with the latter being a time-domain indicator of the variability of the heart rhythm (i.e., HRV). Features extracted from EDA and ECG data were used to obtain quantitative metrics of the overall patient pain experience.
Finally, concerning the accelerometer data analysis, the magnitude of the acceleration (hereinafter also referred to as the Acc magnitude) was calculated from the acquired raw XYZ acceleration signals and used as a unified acceleration metric reflecting large changes in the overall acceleration regardless of the device orientation. In particular, the acceleration vector magnitude was calculated as reported in the following equation [38]:
A c c   m a g n i t u d e =   a x 2 + a y 2 + a z 2
where, ax, ay, and az represent the acceleration on the x-, y-, and z-axis, respectively. The final vector magnitude of the acceleration was obtained by subtracting the mean to discard any constant effect, such as gravity [38]. The resultant acceleration signal was then filtered using a third-order Butterworth bandpass filter with 0.25 Hz and 2.5 Hz cut-off frequencies, as suggested in [38], aiming at removing extraneous accelerations that were not due to human movement and high-frequency noise [39], as it has been proven to be a simpler and less operation-intensive procedure to achieve a filtered signal.
Statistical analysis was carried out to assess the EDA response associated with the patient’s motion during the experimental acquisition. Before applying any statistical tests to compare the results, the data distribution shape must be assessed. Specific tests, often referred to as parametric, are well suited only for Gaussian distributions. The Shapiro–Wilk test is generally employed with this aim. After checking the kind of distribution, it is possible to choose the most adequate test. Our data were non-normally distributed; hence, a Wilcoxon signed-rank test (the most used non-parametric test) was chosen. This is used to check whether there are any significant differences between representative parameters of two situations (e.g., before and after treatment). In our case, it was carried out to compare the median values of the EDA signals during motion and rest phases, with a significance level equal to 0.05. Furthermore, in order to examine the temporal trends in EDA and HRV parameters and their relationships, a bivariate regression and correlation analysis was carried. The Pearson correlation coefficient and the determination coefficient (R2) was calculated to characterize the relationship between EDA and HRV parameters, and a non-parametric Spearman correlation coefficient [40] was calculated to characterize the association between the discrete pain event onsets (marked by the patients during the experimental acquisition) and the calculated biosignal parameters.
Biosignal processing and analysis were carried out in MatLab v. R2021b (The MathWorks Inc., Natick, MA, USA) for EDA, ECG, and accelerometer signals. Normality tests (Shapiro–Wilk) and hypothesis tests (Wilcoxon rank sum) were performed and correlation coefficients (Pearson and Spearman correlation) were determined using SPSS Statistics v. 28 (IBM Corp., Armonk, NY, USA). To compare the EDA values during rest and motion, a Wilcoxon signed-rank test, chosen as a non-parametric alternative to the Student’s t-test (due to the non-normal data distributions), was carried out.

2.6. Case Studies

The first case study regards the measurement of EDA signals on a patient affected by lung cancer and suffering from post-thoracotomy pain. The EDA signal recording was carried out for a 13 min duration in static conditions (i.e., patient at rest). Pain-related events were reported by the patient, who indicated the occurrence time of the pain episode (signatures).
A second case study focuses on the simultaneous measurement of both EDA and accelerometer signals on a patient with prostate cancer and cancer-related pain. In this case, the objective was to assess the motion-associated pain. To this aim, a 13 min EDA and accelerometer signal acquisition was carried out during both the motion and the rest phase.

3. Results

Clinical descriptions and the corresponding preliminary findings in terms of biosignals are reported for each case study.

3.1. Case Study No. 1: Clinical Presentation

A 66-year-old female was referred to the Department of Anesthesia, Pain Medicine, and Supportive Care due to post-thoracotomy thoracic pain. In 2020, the patient underwent lung resection for carcinoma and is currently undergoing regular follow-up appointments. Despite the successful resolution of the oncological condition and the absence of any signs of disease recurrence according to the diagnostic tests, the patient continued to experience a significant impact on her quality of life. The primary factor contributing to this impairment was the presence of pain (NRS 6), which manifested as a persistent and distressing sensation along the T4–T5 right dermatome, projecting in a posterior-to-anterior direction. The pain experienced by the patient was accompanied by a range of debilitating sensory abnormalities, including dysesthesias (a constant perception of heat in the affected area), allodynia (wherein normally innocuous stimuli evoke pain responses), and hyperesthesia, as even the mildest touch or minimal pressure could provoke an amplified and overwhelming pain response.
Pain management therapy was based on opioids (oxycodone 10 mg orally twice a day and pregabalin 150 mg twice a day). The patient underwent several peripheral neuromodulation treatments, including percutaneous electrical nerve stimulation (PENS) and high-frequency neurostimulation (Biowave®).

3.2. Case Study No. 1: Pain Assessment by Means of EDA Signal

In Figure 3, the unprocessed EDA signal (in microsiemens, µS), and the RR time series (in milliseconds, ms) are presented. The RR time series was obtained by analyzing the recorded ECG signal after detecting the R peaks.
To highlight signal changes due to a pain increase, time intervals that included this occurrence are shown. In particular, they illustrate a first tract, up to about 160 s, where the tonic component of the EDA signal was stable, and the following, up to the end, where it was increased by pain. At the same time interval, the changes that occurred in the RR series were observed. As is elucidated further below, a temporal gap existed between the occurrence of the pain event and the onset of the EDA increase.
The EDA signal was decomposed into its tonic and phasic components. Subsequently, both the EDA and ECG (i.e., RR intervals) signals were paired and analyzed based on the pain events reported by the patient (NRS ≥ 4).
Figure 4 displays the original and decomposed EDA signals with marked pain event onsets.
The following SCR features were calculated for each pain event within a preset time window of 40 s after the event onset: (i) the SCR latency, which represents the latency of the first detected SCR above 0.01 μS amplitude threshold; (ii) the SCR sum, which represents the sum of the detected SCR amplitudes within the predefined time window; (iii) the SCR average, which represents the mean value of the phasic activity in the EDA signal within the predefined time window; and (iv) the integrated SCR (ISCR), which indicates the area of the detected phasic activity in the EDA signal under the predefined time window.
Regarding HRV signals, although a wide range of approaches and metrics that concern HRV analysis as well as the different conditions (e.g., age, gender, circadian cycle) can affect them [41], the following time-domain HRV features were calculated: (i) mean RR, which is the average value of the RR intervals, and (ii) SD RR, which represents the standard deviation of the RR intervals and is used as a measure of short-term HRV [42]. Among all possible parameters, for this pilot study, mean and SD were chosen because both are reliable markers of health, and they can quickly change in the case of an imbalance of the ANS. Moreover, HRV mean (in turn, RR mean) is a simple, fast impact parameter, even for visual analysis, and SD is affected both by the sympathetic and the parasympathetic nervous system.
Table 1 reports the parameters for the three most relevant peaks detected in the phasic component of the EDA signal.
Remarkably, both Table 1 and the subsequent Figure 5 clearly illustrate an ascending trend in the SD RR as the data acquisition progressed and the EDA signal intensified. This observation indicates an increase in the HRV concurrent with the onset of pain (Spearman correlation coefficient between SD RR and pain event onset was equal to 0.733 and was statistically significant, p-value = 0.025) despite a less marked variation observed for the ISCR parameter (Spearman correlation coefficient between SD RR and pain event onset was equal to 0.217 but without statistical significance, p-value = 0.576). However, despite the increasing trends observed, the statistical analysis showed only a weak correlation between EDA and HRV parameters (Pearson correlation coefficient between SD RR and ISCR was equal to 0.179), and no statistical significance was found (p-value = 0.644).
An in-depth analysis of the physiological mechanisms underlying the obtained results is not simple. Even if an oscillation at each frequency represents a specific HR control mechanism, they interact in a non-linear way; hence, only a very complex oscillatory pattern reflects the capacity for regulation [43]. Nevertheless, the mechanism likely responsible for the increase in HRV could be due to the change in peripheral vascular resistance associated with the baroreflex-mediated circulatory redistribution occurring under stressful conditions [44]. Besides, in analogy with other painful and stressful conditions [45,46], as the acquisition progresses, the increase in the HRV and decrease in mean rhythm, which reflects vagal dominance, indicates a healthier ANS. Again, even in newborns, whose ANS is still finishing its evolution, the short-term HRV, mediated by the vagal tone, which decreases the mean rhythm, reflects a healthy, dynamic cardiac regulation [47]. Mean HR and HRV are indicators so meaningful that they are capable of discriminating between healthy and at-risk newborns [48]. Therefore, it is possible to hypothesize that in cancer pain the increase in the HRV and decrease in mean rhythm could also indicate a healthy ANS, i.e., the physiological system has greater flexibility to respond to successive pain stimuli (regardless of the feedback of the patient’s conscious response).

3.3. Case Study No. 2: Clinical Presentation

A 74-year-old male patient was referred to the Department of Anesthesia, Pain Medicine, and Supportive Care due to pain induced by prostate cancer. The patient’s clinical history revealed an advanced-stage (stage IV) oncological disease characterized by extensive metastasis involving both sessile and appendicular bony structures. This indicates a progressive and aggressive nature of the cancer, affecting multiple skeletal sites. The primary source of pain was nociceptive in nature and originated from the involvement of the vertebral column, significantly impacting the patient’s overall quality of life.
The patient’s baseline pain was effectively managed with the current therapy, which consisted of a daily oral dose of 20 mg of oxycodone. However, the pain became more pronounced during movement, leading to increased discomfort. Therefore, the patient experienced episodes of severe cancer-induced incident pain with intensity levels ranging from 7 to 8 on the NRS. To address these episodes, an additional pharmacological treatment based on opioids was administered, specifically 100 mcg of transmucosal fentanyl.

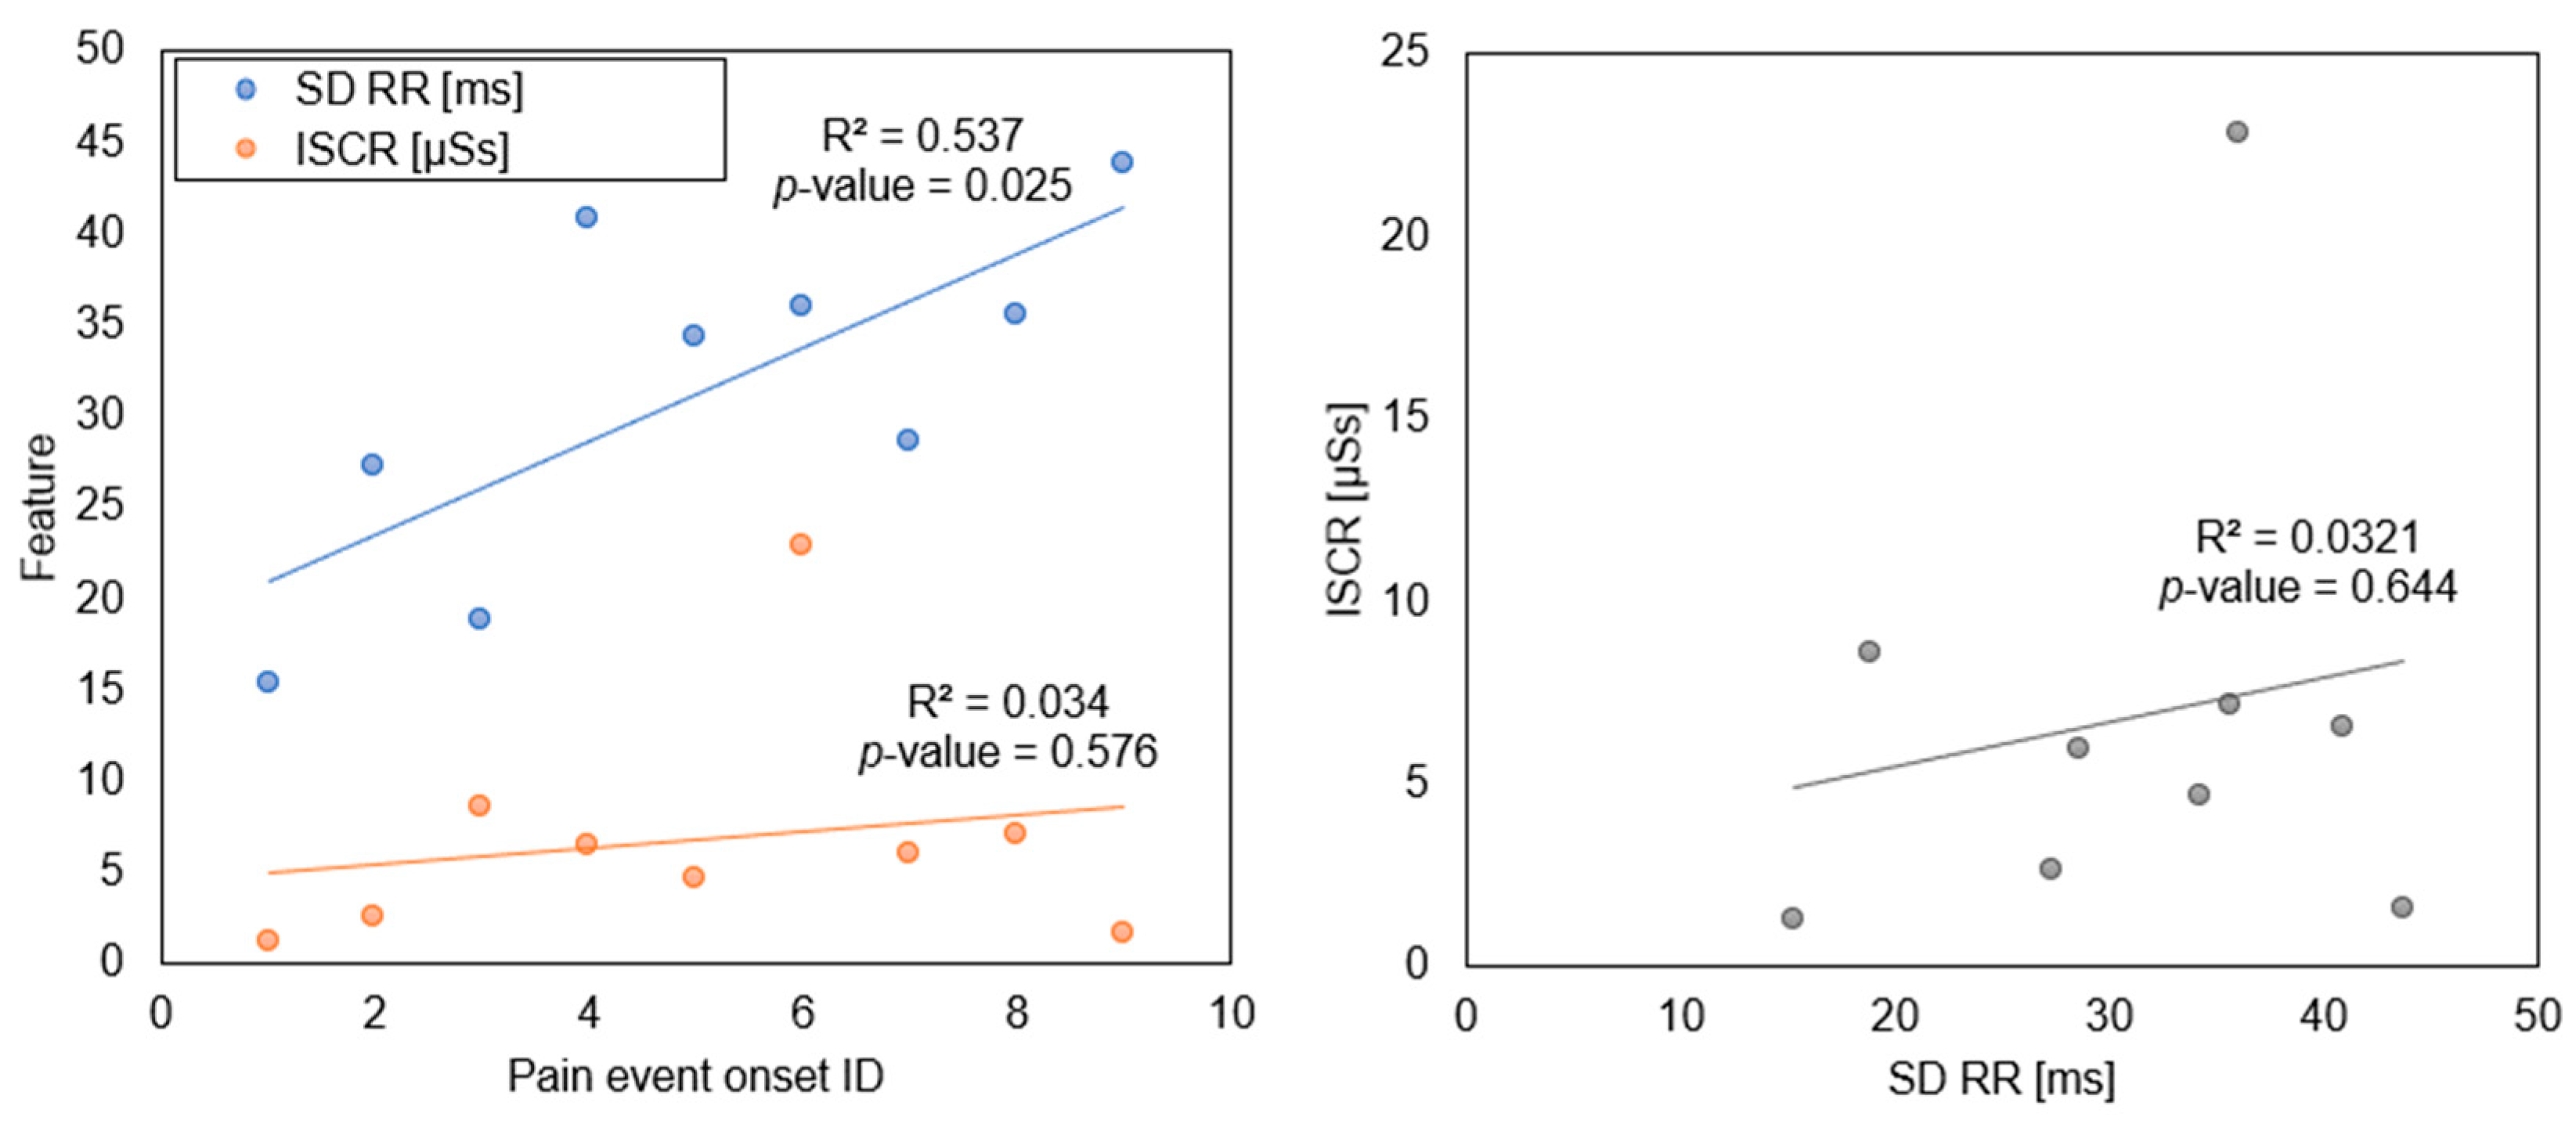
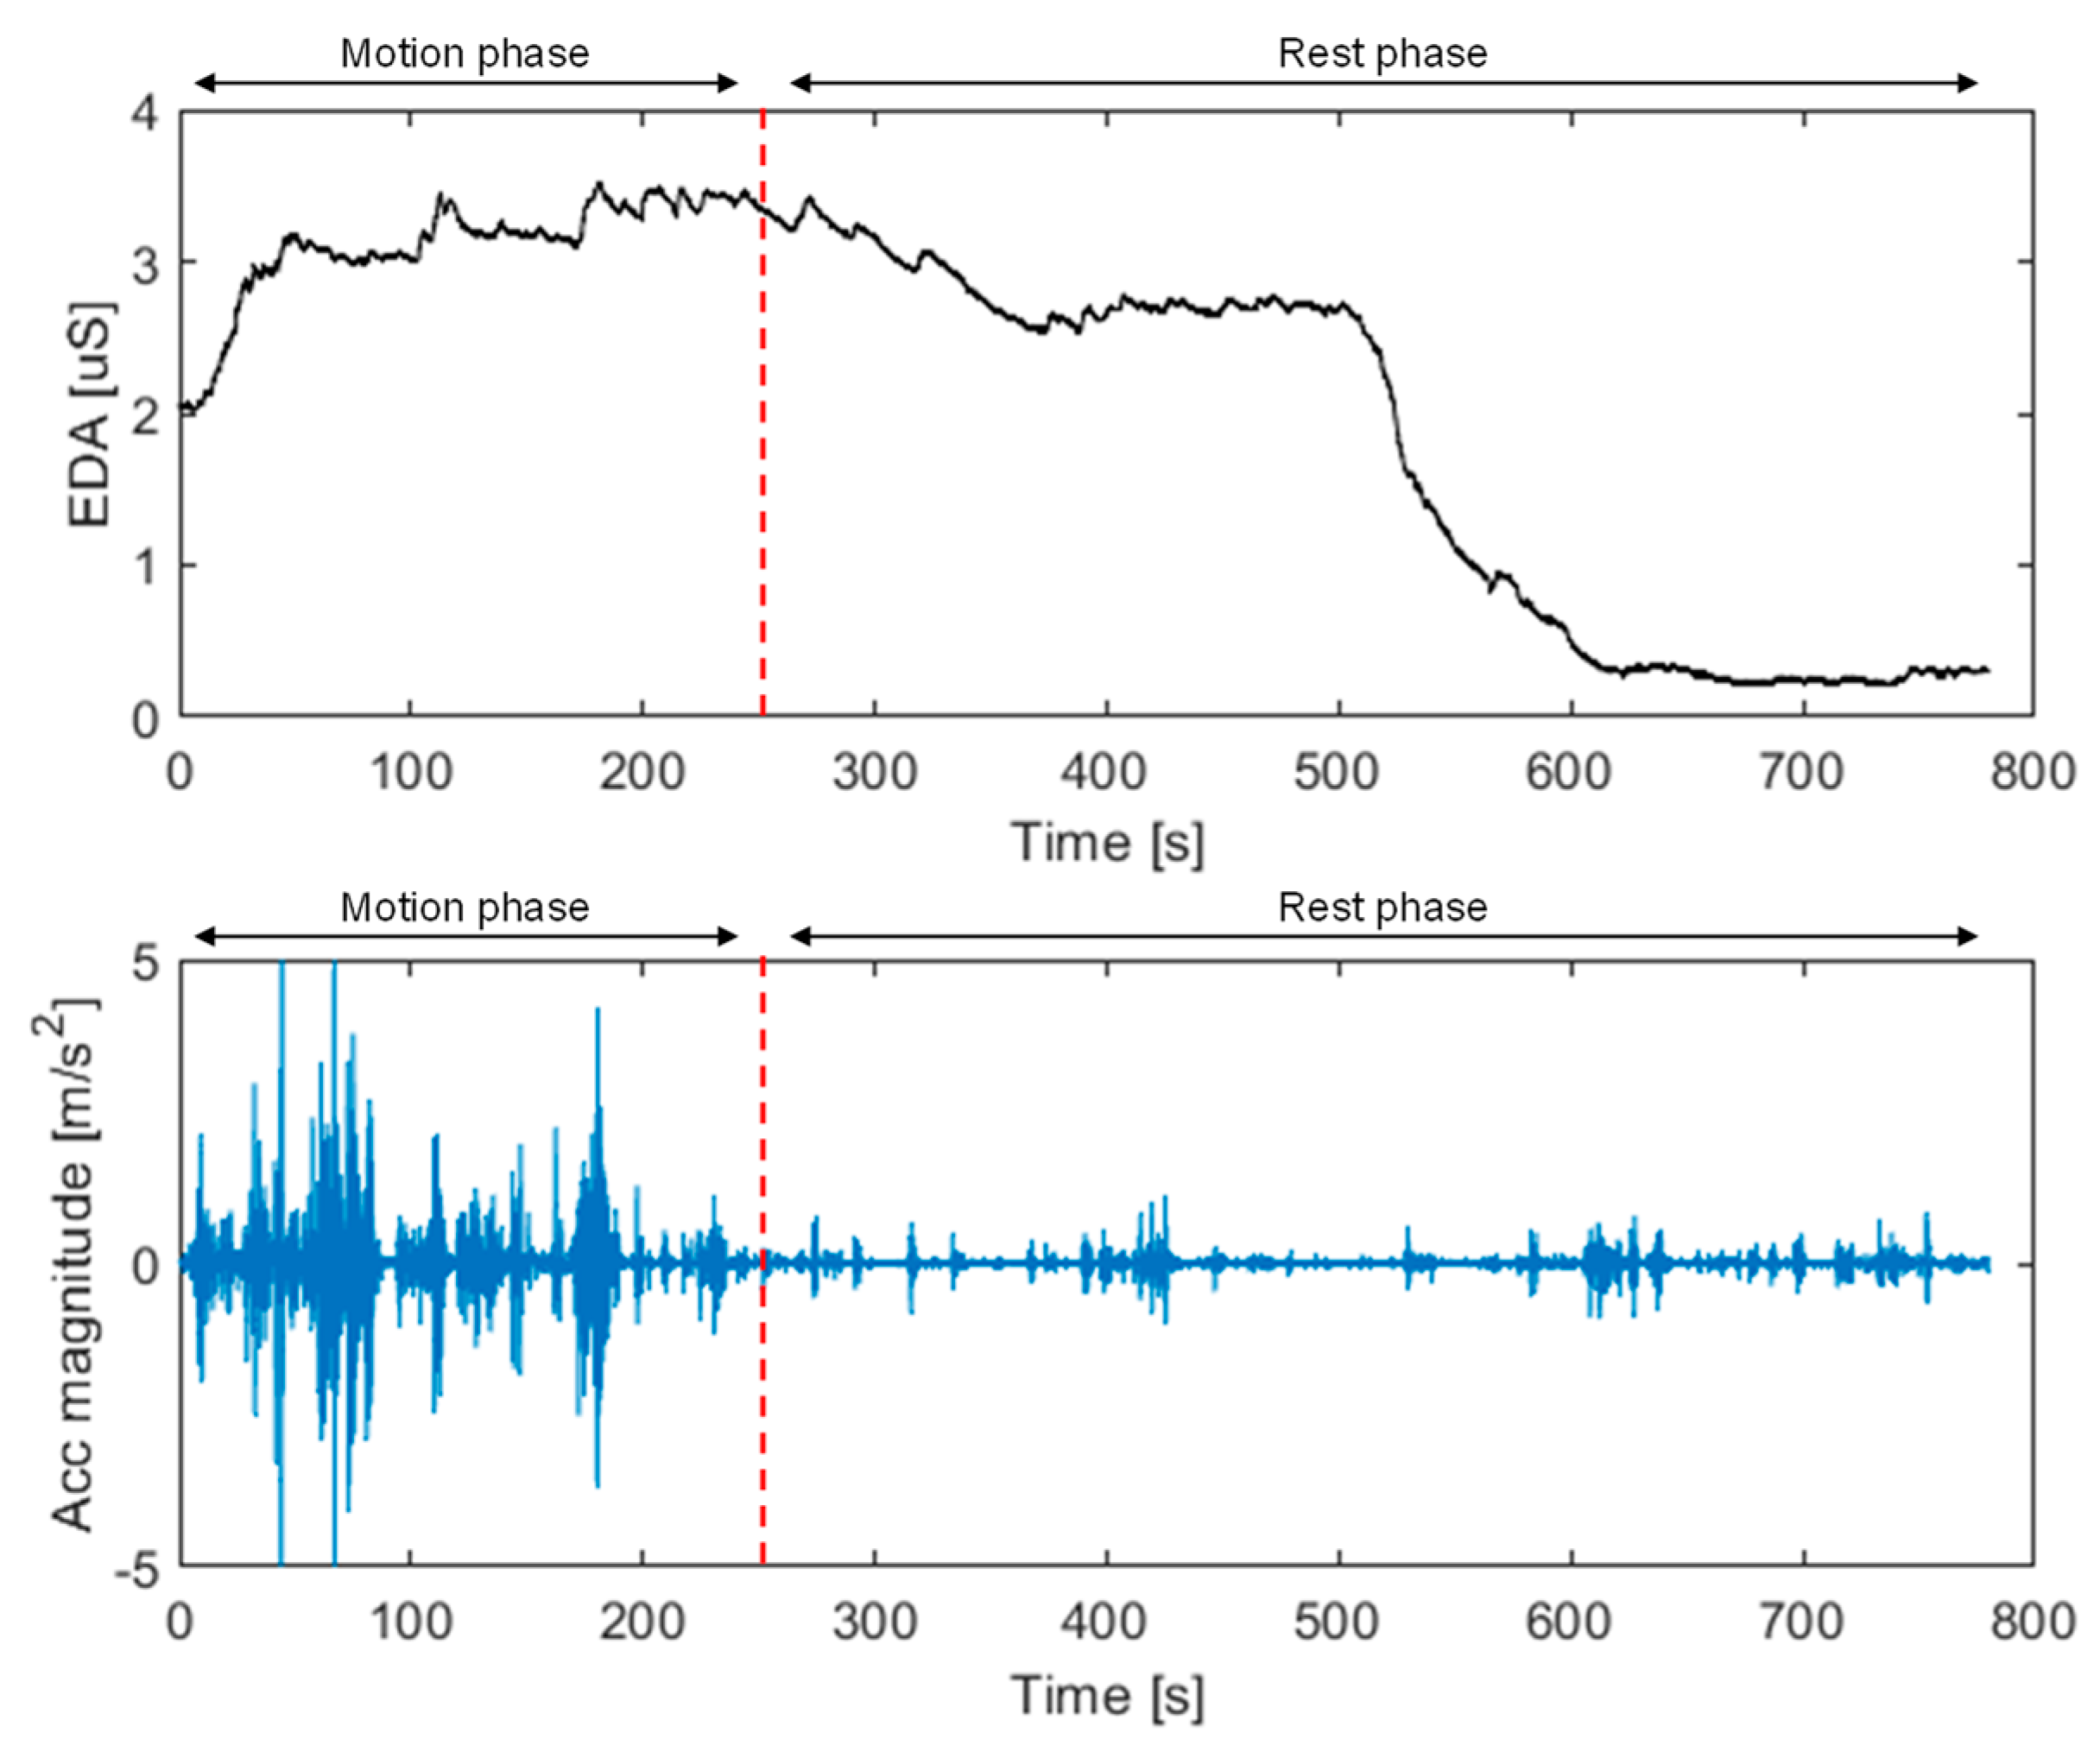
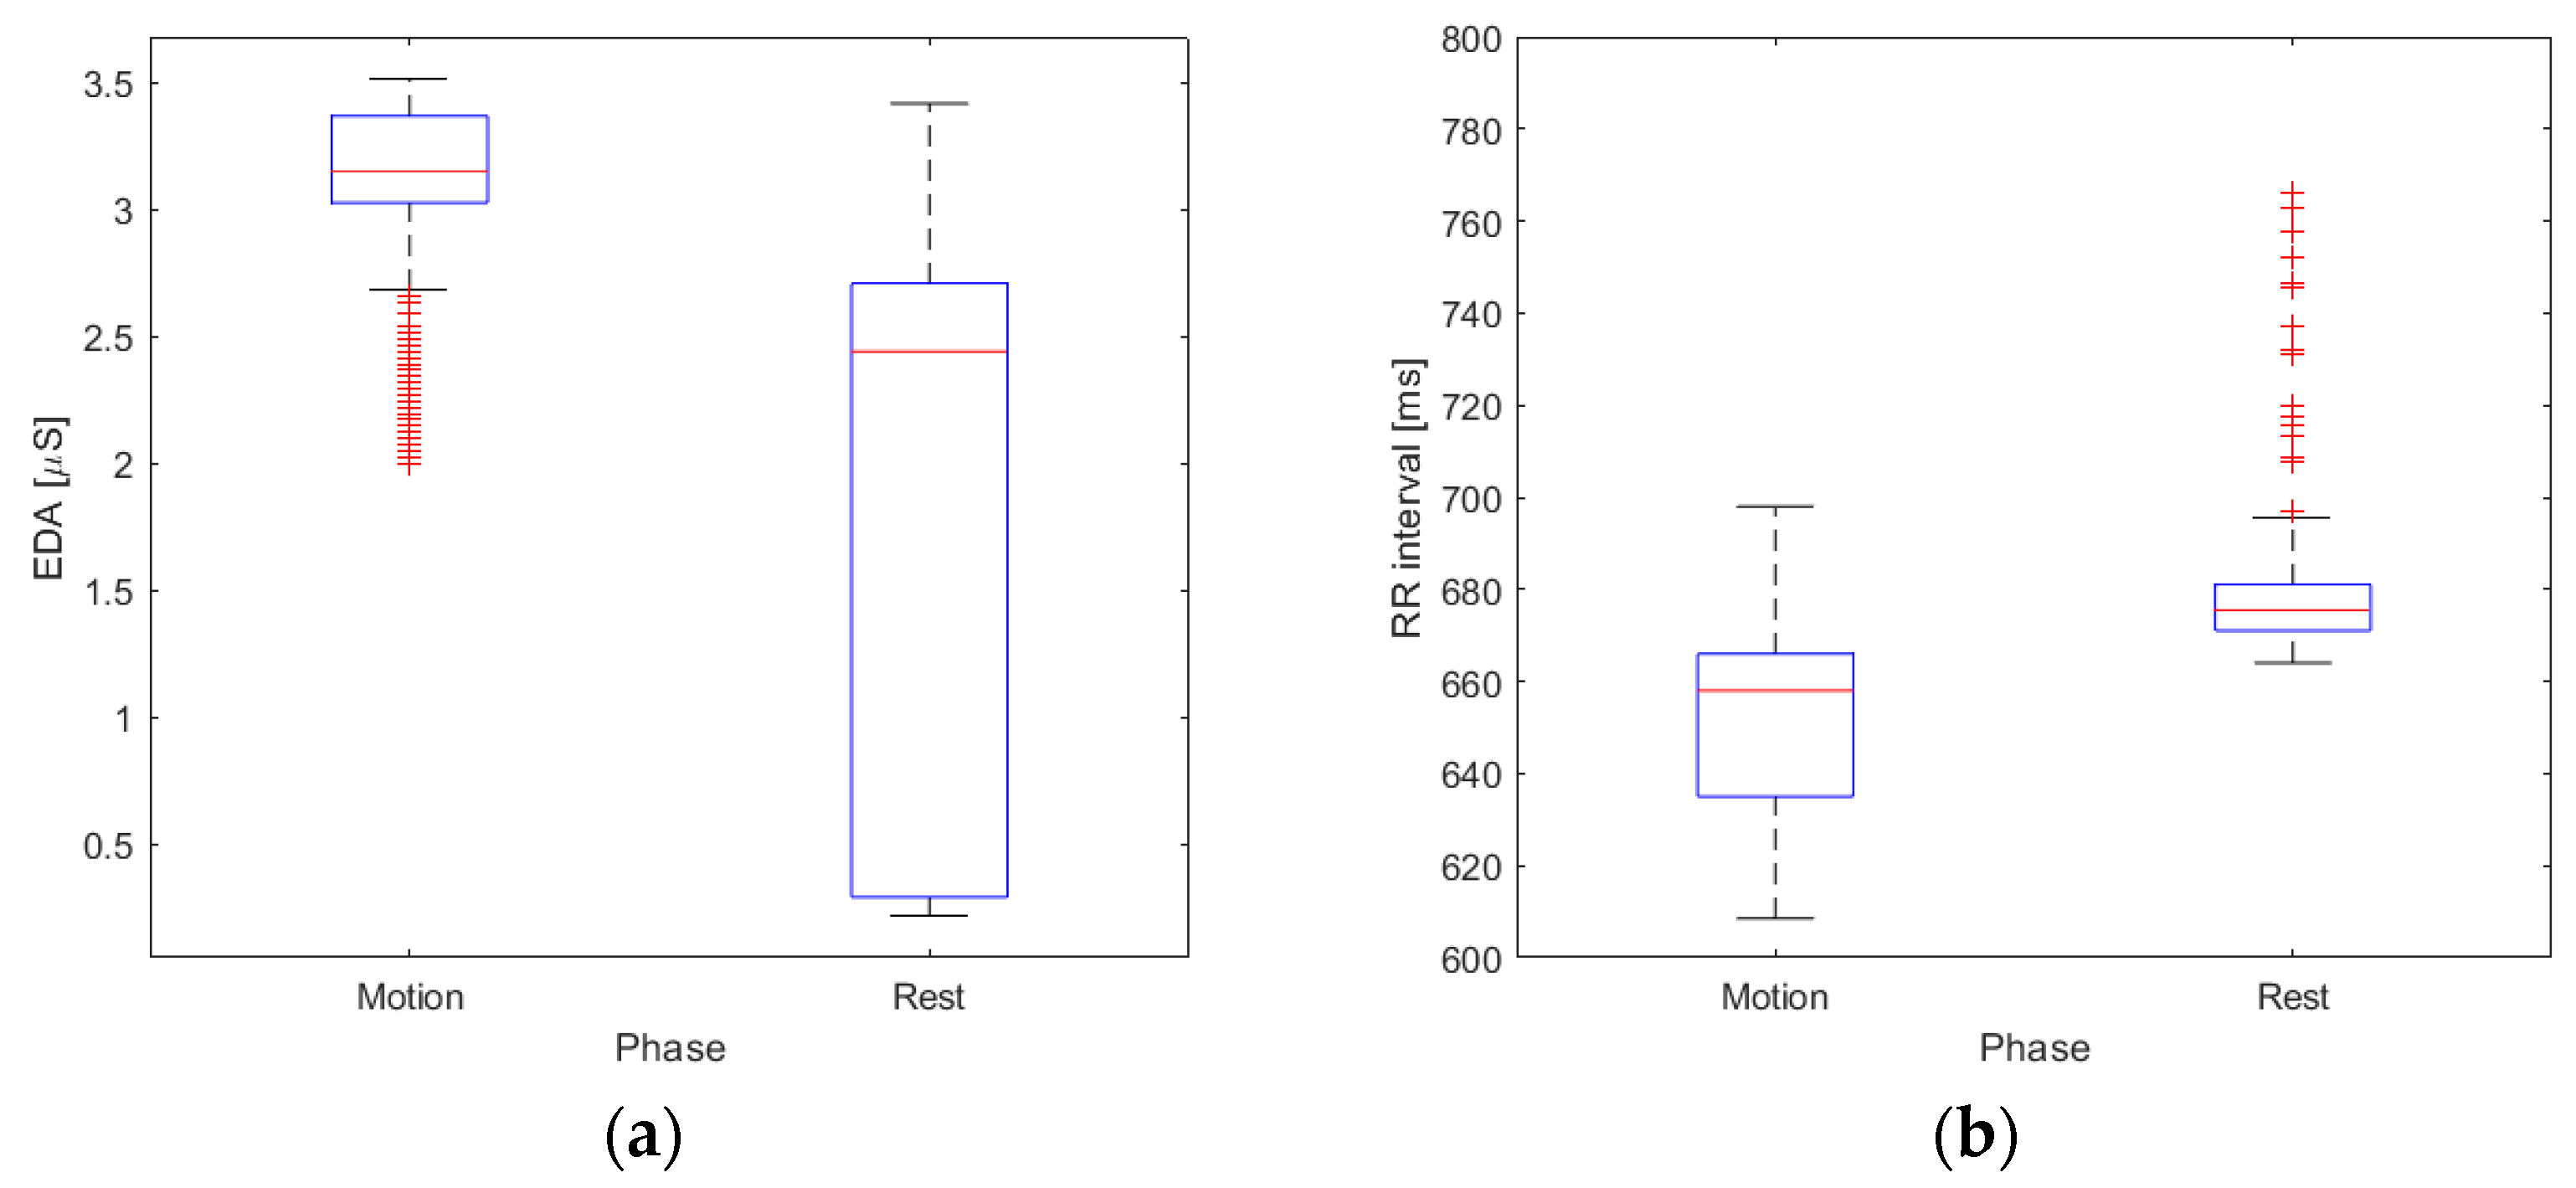
3.4. Case Study No. 2: Motion-Associated Pain Assessment by Means of EDA Signal and Accelerometer Data

Figure 6 depicts the visual representation of the recorded and processed EDA signals and its integration with the accelerometer data. It can be observed that movement served as a pain trigger, as indicated by higher EDA values, corresponding to increased acceleration magnitudes. Nonetheless, the EDA signal required some time to gradually revert back to its baseline values.
The simultaneous registration of EDA and acceleration magnitude with the indication of motion and rest phases during the acquisition is presented in Figure 7.
In addition, Figure 8 shows the boxplots of the EDA- and ECG-derived RR values in both the motion and rest phases. The time-domain parameters of the HRV are also provided.
The EDA signal was considerably higher in the motion phase compared to the rest phase of the experimental acquisition. The statistical significance was confirmed by the p-value < 0.001 of the Wilcoxon signed-rank test. Similarly, heart rate values significantly differed between the motion and rest phases (p-value < 0.001 for the Wilcoxon signed-rank test), with higher mean rhythm and higher variability during the motion phase compared to the rest phase.

4. Discussion

To introduce the framework, we selected two patients with distinct manifestations of oncologic pain. The first case involved a patient with a well-defined baseline pain profile. Nevertheless, the patient experienced spontaneous pain spikes (spontaneous or non-predictable BTCP). In the second case, the patient’s pain intensified upon movement, indicating the presence of incident BTCP episodes [22].
Quantitative and objective pain assessment is an ongoing research challenge, particularly for cancer pain, which is complex in nature and can be caused by a variety of factors [49]. Regrettably, there is compelling evidence highlighting the inadequacy of pain management leading to detrimental effects on various aspects of well-being. The consequences of this insufficiency encompass a diminished quality of life, suboptimal adherence to therapy, potential adverse effects, and a subsequent rise in healthcare expenditures [2,5,49,50]. Therefore, there is an urgent need for new methods and approaches to identify standardized, measurable, reliable, and appropriate indicators for the quantitative assessment and proper management of cancer pain. Recent studies have suggested that biosignals could be used to objectively quantify cancer pain [51]. However, there is currently no standardized approach for quantitative pain assessment [52].
The novelty of our framework lies in the processing of the EDA signal into tonic and phasic components and its subsequent integration with data obtained from motion activity using a three-axis accelerometer and elements achieved from the ECG analysis. The goal is to combine parameters derived from multiple biosignals to define pain signatures in different clinical contexts, such as at rest (Case 1) and during movement (incident pain, Case 2). For this aim, a commercial low-cost multisensory wearable platform was used to simultaneously acquire different types of physiological signals during a pain-monitoring session. The EDA signal is processed and decomposed into tonic and phasic components and finally integrated with data from motion activity (accelerometer) to assess incident pain. By analyzing the raw ECG data, the RR series of interbeat intervals (i.e., the time between successive R waves of the QRS complex) is calculated to derive a time-domain parameter related to the HRV, which has been extensively explored in different physiological and pathological conditions but, to the best of our knowledge, has not yet been investigated in depth in the management of cancer pain in combination with other biosignals such as EDA and accelerometer data. The features extracted from the acquired biosignals could serve as indicators of the patient’s pain experience and could be further investigated, selected, and implemented to train AI algorithms to quantitatively assess the pain experience, thus potentially providing standardized automatic objective pain assessment methods.
Although this study is preliminary and experimental in nature, the obtained results are highly promising. They not only demonstrate the feasibility of the proposed approach but also highlight its potential impact. For example, referring to Table 1, it becomes apparent that the registration and analysis of EDA signals can effectively identify and characterize notable skin conductance responses. It is important to note that, although the results were not statistically significant, the potential of EDA for capturing and evaluating these responses is evident. Consequently, these findings can serve as indicators of the patient’s pain experience. The inclusion of data from multiple samples will provide us with more accurate estimates.
Moreover, from Figure 7 and Figure 8, it can be observed that an increase in the EDA signal could be detected in the presence of higher acceleration magnitude (motion phase), whereas during the rest (or static) phase of the experimental acquisition, the lowest acceleration magnitude was accompanied by lower EDA responses. These data provide compelling evidence of the dynamic relationship between the activity of the ANS and motor dynamics in response to painful stimuli [53]. The intricate interplay between the sensory perception of pain and motor responses is reflected in the variations observed in the ANS [54]. When exposed to a painful stimulus, this complex system undergoes adaptive changes to modulate the body’s response [55]. These phenomena also highlight the complex nature of pain processing. In particular, different motor activities, such as voluntary movements, reflexes, or postural adjustments, can influence the autonomic response to pain. These motor dynamics can either amplify or suppress the autonomic response, leading to distinct patterns of autonomic modulation. For example, during certain motor tasks or movements such as strenuous exercise or intense physical exertion, the autonomic response to pain may be heightened, reflecting increased sympathetic arousal and potentially altering pain perception. Conversely, in other motor scenarios, the autonomic response may be dampened, suggesting a regulatory mechanism that minimizes the impact of pain on motor performance. This occurs, for instance, during highly focused tasks or movements that require precise motor control, such as fine motor skills or delicate manipulations [56]. Therefore, by incorporating both autonomic and motor assessments, a more comprehensive understanding of pain mechanisms and the development of targeted interventions can be achieved.
The decomposition of the EDA signal into its tonic and phasic components, along with the analysis of the HRV using the data provided by the patient as signatures, serves as a vital foundation for validating the model. By separating the EDA signal into its tonic component, which represents the baseline sympathetic activity, and its phasic component, which reflects rapid changes associated with emotional arousal or stress, researchers can gain valuable insights into the physiological responses of the patient. Additionally, analyzing HRV can provide valuable information about pain-related ANS functioning. By examining HRV patterns, it is possible to assess the balance between the sympathetic and parasympathetic branches of the ANS and infer the overall physiological state of the patient, such as stress levels, emotional regulation, and cardiovascular health. These analytical approaches, combined with the utilization of patient-specific data (e.g., NRS), can play a critical role in validating the accuracy and effectiveness of the model. By comparing the model’s predictions with the measured EDA components and HRV parameters derived from the patient’s data, it could be possible to evaluate the model’s performance, refine its algorithms, and ensure its reliability for future applications in understanding physiological responses and assessing health conditions. Furthermore, the extracted features could support the investigation of the pain events (e.g., incident pain) occurring during the acquisition, providing a more accurate quantitative indication of the extent of the pain felt by the subject.
Future studies will aim at building a large dataset containing both clinical parameters and biosignal features for different types of cancer patients participating in the study. The dataset will serve as a basis to validate the proposed approach by carrying out correlation studies and statistical analyses to investigate the relationships between clinical and biosignal features. This approach can be also used to train AI algorithms for predicting the scores obtained by administering qualitative pain assessment questionnaires and for defining automatic and reliable quantitative pain assessment metrics.

Limitations of the Study

The study is subject to several limitations. These constraints often pose challenges to the analysis and validation of APA systems. For instance, the equilibrium of the autonomic nervous system is recognized to be influenced by a wide array of physiological, pathophysiological, and pharmacological factors. HRV exhibits distinct variations between pediatric and adult populations [57], and it also diminishes with advancing age in adults [58]. Notably, our investigation exclusively involved older adults, potentially introducing a limitation related to age thresholds. Furthermore, the effectiveness of the approach could be curtailed by specific medications, such as beta-adrenergic blockers [59]. Moreover, concerning HRV (or, equivalently, RR) signals, an in-depth study concerning their correlation with tumor pain and, therefore, a wider analysis of parameters (e.g., involving frequency parameters) will be necessary. Additionally, specific scenarios, like concurrent nausea, might induce such significant alterations in the autonomic system that pain signals could become obscured within the surrounding noise [60]. Although the two patients enrolled in the study were not taking any medication that could have potentially impacted the biosignal analysis, it is crucial to carefully verify potential drug agents or clinical conditions that might alter the signal during the course of clinical investigation. These aspects are of paramount importance for researching and evaluating the potential implementation of these techniques in clinical practice.

5. Conclusions

In conclusion, since quantitative and objective pain monitoring is still an unsolved research problem, the identification of quantifiable, trustworthy, and relevant markers is therefore urgently needed to facilitate quantitative assessment and effective management of cancer pain. Using multiple analyses of ECG and EDA biosignals, this study introduced a paradigm for the quantitative and objective assessment and treatment of pain and presented two experimental case studies to demonstrate the viability of the proposed approach. The obtained results, although preliminary, are promising and suggest the potential application of the suggested route to build a more robust and reliable quantitative approach for cancer pain assessment.

Author Contributions

Conceptualization, M.C.; methodology, F.A., M.R. and A.M.P.; software, V.N.V. and A.M.P.; validation, M.C., M.D., A.C. and F.A.; formal analysis, M.R. and A.M.P.; investigation, M.C., M.R. and A.M.P.; resources, A.C. and F.A.; data curation, M.C., V.N.V. and A.M.P.; writing—original draft preparation, M.C. and A.M.P.; writing—review and editing, M.C., V.N.V., M.R. and A.M.P.; visualization, M.C., V.N.V. and A.M.P.; supervision, M.C., M.D. and F.A.; project administration, M.D. and A.C. All authors have read and agreed to the published version of the manuscript.

Funding

This research received no external funding.

Institutional Review Board Statement

The study was approved by the local Medical Ethics Committee (protocol code 41/20 Oss; date of approval: 26 November 2020).

Informed Consent Statement

All participating patients provided written informed consent.

Data Availability Statement

The data are not publicly available due to privacy reasons.

Acknowledgments

The authors are grateful to Alessandra Trocino from the Istituto Nazionale Tumori IRCCS Fondazione Pascale for providing excellent bibliographic service and assistance. The authors also warmly thank Concetta Ovetta from the Department of Electrical Engineering and Information Technology of the University of Naples Federico II for her excellent assistance in the data collection process.

Conflicts of Interest

The authors declare no conflict of interest.

References

  1. WCRF International. Global Cancer Data by Country; World Cancer Research Fund International: London, UK. Available online: https://www.wcrf.org/cancer-trends/global-cancer-data-by-country (accessed on 23 August 2023).
  2. World Health Organization (WHO). WHO Guidelines for the Pharmacological and Radiotherapeutic Management of Cancer Pain in Adults and Adolescents. Available online: https://www.who.int/publications-detail-redirect/9789241550390 (accessed on 16 June 2023).
  3. Fallon, M.; Giusti, R.; Aielli, F.; Hoskin, P.; Rolke, R.; Sharma, M.; Ripamonti, C.I. Management of Cancer Pain in Adult Patients: ESMO Clinical Practice Guidelines. Ann. Oncol. 2018, 29, iv166–iv191. [Google Scholar] [CrossRef]
  4. Treede, R.-D.; Rief, W.; Barke, A.; Aziz, Q.; Bennett, M.I.; Benoliel, R.; Cohen, M.; Evers, S.; Finnerup, N.B.; First, M.B.; et al. Chronic Pain as a Symptom or a Disease: The IASP Classification of Chronic Pain for the International Classification of Diseases (ICD-11). Pain 2019, 160, 19–27. [Google Scholar] [CrossRef]
  5. Cohen, S.P.; Vase, L.; Hooten, W.M. Chronic Pain: An Update on Burden, Best Practices, and New Advances. Lancet Lond. Engl. 2021, 397, 2082–2097. [Google Scholar] [CrossRef]
  6. Cuomo, A.; Bimonte, S.; Forte, C.A.; Botti, G.; Cascella, M. Multimodal Approaches and Tailored Therapies for Pain Management: The Trolley Analgesic Model. J. Pain Res. 2019, 12, 711–714. [Google Scholar] [CrossRef]
  7. Brunelli, C.; Borreani, C.; Caraceni, A.; Roli, A.; Bellazzi, M.; Lombi, L.; Zito, E.; Pellegrini, C.; Spada, P.; Kaasa, S.; et al. PATIENT VOICES, a Project for the Integration of the Systematic Assessment of Patient Reported Outcomes and Experiences within a Comprehensive Cancer Center: A Protocol for a Mixed Method Feasibility Study. Health Qual. Life Outcomes 2020, 18, 252. [Google Scholar] [CrossRef]
  8. Caraceni, A.; Shkodra, M. Cancer Pain Assessment and Classification. Cancers 2019, 11, 510. [Google Scholar] [CrossRef]
  9. Kristiansen, F.L.; Olesen, A.E.; Brock, C.; Gazerani, P.; Petrini, L.; Mogil, J.S.; Drewes, A.M. The Role of Pain Catastrophizing in Experimental Pain Perception. Pain Pract. Off. J. World Inst. Pain 2014, 14, E136–E145. [Google Scholar] [CrossRef]
  10. Cascella, M.; Muzio, M.R.; Monaco, F.; Nocerino, D.; Ottaiano, A.; Perri, F.; Innamorato, M.A. Pathophysiology of Nociception and Rare Genetic Disorders with Increased Pain Threshold or Pain Insensitivity. Pathophysiol. Off. J. Int. Soc. Pathophysiol. 2022, 29, 435–452. [Google Scholar] [CrossRef] [PubMed]
  11. Yessick, L.R.; Tanguay, J.; Gandhi, W.; Harrison, R.; Dinu, R.; Chakrabarti, B.; Borg, E.; Salomons, T.V. Investigating the Relationship between Pain Indicators and Observers’ Judgements of Pain. Eur. J. Pain Lond. Engl. 2023, 27, 223–233. [Google Scholar] [CrossRef] [PubMed]
  12. Cascella, M.; Bimonte, S.; Saettini, F.; Muzio, M.R. The Challenge of Pain Assessment in Children with Cognitive Disabilities: Features and Clinical Applicability of Different Observational Tools. J. Paediatr. Child Health 2019, 55, 129–135. [Google Scholar] [CrossRef] [PubMed]
  13. Deldar, K.; Froutan, R.; Ebadi, A. Challenges Faced by Nurses in Using Pain Assessment Scale in Patients Unable to Communicate: A Qualitative Study. BMC Nurs. 2018, 17, 11. [Google Scholar] [CrossRef]
  14. Moscato, S.; Orlandi, S.; Giannelli, A.; Ostan, R.; Chiari, L. Automatic Pain Assessment on Cancer Patients Using Physiological Signals Recorded in Real-World Contexts. In Proceedings of the 2022 44th Annual International Conference of the IEEE Engineering in Medicine & Biology Society (EMBC), Glasgow, UK, 11–15 July 2022; pp. 1931–1934. [Google Scholar] [CrossRef]
  15. Wang, J.; Cheng, Z.; Kim, Y.; Yu, F.; Heffner, K.L.; Quiñones-Cordero, M.M.; Li, Y. Pain and the Alzheimer’s Disease and Related Dementia Spectrum in Community-Dwelling Older Americans: A Nationally Representative Study. J. Pain Symptom Manag. 2022, 63, 654–664. [Google Scholar] [CrossRef]
  16. Misra, G.; Wang, W.-E.; Archer, D.B.; Roy, A.; Coombes, S.A. Automated Classification of Pain Perception Using High-Density Electroencephalography Data. J. Neurophysiol. 2017, 117, 786–795. [Google Scholar] [CrossRef]
  17. Pouromran, F.; Radhakrishnan, S.; Kamarthi, S. Exploration of Physiological Sensors, Features, and Machine Learning Models for Pain Intensity Estimation. PLoS ONE 2021, 16, e0254108. [Google Scholar] [CrossRef]
  18. Posada-Quintero, H.F.; Chon, K.H. Innovations in Electrodermal Activity Data Collection and Signal Processing: A Systematic Review. Sensors 2020, 20, 479. [Google Scholar] [CrossRef]
  19. Forte, G.; Troisi, G.; Pazzaglia, M.; Pascalis, V.D.; Casagrande, M. Heart Rate Variability and Pain: A Systematic Review. Brain Sci. 2022, 12, 153. [Google Scholar] [CrossRef]
  20. Kim, Y.; Yoon, H.Y.; Kwon, I.K.; Youn, I.; Han, S. Heart Rate Variability as a Potential Indicator of Cancer Pain in a Mouse Model of Peritoneal Metastasis. Sensors 2022, 22, 2152. [Google Scholar] [CrossRef]
  21. Li, G.; Wu, S.; Zhao, H.; Guan, W.; Zhou, Y.; Shi, B. Non-Invasive Prognostic Biomarker of Lung Cancer Patients with Brain Metastases: Recurrence Quantification Analysis of Heart Rate Variability. Front. Physiol. 2022, 13, 987835. [Google Scholar] [CrossRef]
  22. Cuomo, A.; Cascella, M.; Forte, C.A.; Bimonte, S.; Esposito, G.; De Santis, S.; Cavanna, L.; Fusco, F.; Dauri, M.; Natoli, S.; et al. Careful Breakthrough Cancer Pain Treatment through Rapid-Onset Transmucosal Fentanyl Improves the Quality of Life in Cancer Patients: Results from the BEST Multicenter Study. J. Clin. Med. 2020, 9, 1003. [Google Scholar] [CrossRef]
  23. Moscato, S.; Cortelli, P.; Chiari, L. Physiological Responses to Pain in Cancer Patients: A Systematic Review. Comput. Methods Programs Biomed. 2022, 217, 106682. [Google Scholar] [CrossRef]
  24. Cascella, M.; Schiavo, D.; Cuomo, A.; Ottaiano, A.; Perri, F.; Patrone, R.; Migliarelli, S.; Bignami, E.G.; Vittori, A.; Cutugno, F. Artificial Intelligence for Automatic Pain Assessment: Research Methods and Perspectives. Pain Res. Manag. 2023, 2023, e6018736. [Google Scholar] [CrossRef] [PubMed]
  25. Tiwari, R.; Kumar, R.; Malik, S.; Raj, T.; Kumar, P. Analysis of Heart Rate Variability and Implication of Different Factors on Heart Rate Variability. Curr. Cardiol. Rev. 2021, 17, e160721189770. [Google Scholar] [CrossRef] [PubMed]
  26. Chen, J.; Abbod, M.; Shieh, J.-S. Pain and Stress Detection Using Wearable Sensors and Devices-A Review. Sensors 2021, 21, 1030. [Google Scholar] [CrossRef] [PubMed]
  27. Batista, D.; Silva, H.; Fred, A. Experimental Characterization and Analysis of the BITalino Platforms against a Reference Device. In Proceedings of the 2017 39th Annual International Conference of the IEEE Engineering in Medicine and Biology Society (EMBC), Jeju, Republic of Korea, 11–15 July 2017; pp. 2418–2421. [Google Scholar]
  28. Clevenger, K.A.; Pfeiffer, K.A.; Mackintosh, K.A.; McNarry, M.A.; Brønd, J.; Arvidsson, D.; Montoye, A.H.K. Effect of Sampling Rate on Acceleration and Counts of Hip- and Wrist-Worn ActiGraph Accelerometers in Children. Physiol. Meas. 2019, 40, 095008. [Google Scholar] [CrossRef] [PubMed]
  29. Khan, A.; Hammerla, N.; Mellor, S.; Plötz, T. Optimising Sampling Rates for Accelerometer-Based Human Activity Recognition. Pattern Recognit. Lett. 2016, 73, 33–40. [Google Scholar] [CrossRef]
  30. Taylor, S.; Jaques, N.; Chen, W.; Fedor, S.; Sano, A.; Picard, R. Automatic Identification of Artifacts in Electrodermal Activity Data. In Proceedings of the 2015 37th Annual International Conference of the IEEE Engineering in Medicine and Biology Society (EMBC), Milan, Italy, 25–29 August 2015; pp. 1934–1937. [Google Scholar] [CrossRef]
  31. Benedek, M.; Kaernbach, C. A Continuous Measure of Phasic Electrodermal Activity. J. Neurosci. Methods 2010, 190, 80–91. [Google Scholar] [CrossRef]
  32. Benedek, M.; Kaernbach, C. Decomposition of Skin Conductance Data by Means of Nonnegative Deconvolution. Psychophysiology 2010, 47, 647–658. [Google Scholar] [CrossRef]
  33. Daviaux, Y.; Bonhomme, E.; Ivers, H.; de Sevin, É.; Micoulaud-Franchi, J.-A.; Bioulac, S.; Morin, C.M.; Philip, P.; Altena, E. Event-Related Electrodermal Response to Stress: Results From a Realistic Driving Simulator Scenario. Hum. Factors 2020, 62, 138–151. [Google Scholar] [CrossRef]
  34. Pan, J.; Tompkins, W.J. A Real-Time QRS Detection Algorithm. IEEE Trans. Biomed. Eng. 1985, BME-32, 230–236. [Google Scholar] [CrossRef]
  35. Moeyersons, J.; Amoni, M.; Van Huffel, S.; Willems, R.; Varon, C. R-DECO: An Open-Source Matlab Based Graphical User Interface for the Detection and Correction of R-Peaks. PeerJ Comput. Sci. 2019, 5, e226. [Google Scholar] [CrossRef]
  36. Armañac, P.; Hernando, D.; Lázaro, J.; De Haro, C.; Magrans, R.; Sarlabous, L.; López-Aguilar, J.; Laguna, P.; Gil, E.; Blanch, L.; et al. Baroreflex Sensitivity Evolution Before Weaning From Mechanical Ventilation. In Proceedings of the 2020 Computing in Cardiology, Rimini, Italy, 13–16 September 2020; pp. 1–4. [Google Scholar]
  37. Karlsson, M.; Hörnsten, R.; Rydberg, A.; Wiklund, U. Automatic Filtering of Outliers in RR Intervals before Analysis of Heart Rate Variability in Holter Recordings: A Comparison with Carefully Edited Data. Biomed. Eng. Online 2012, 11, 2. [Google Scholar] [CrossRef] [PubMed]
  38. Maczák, B.; Vadai, G.; Dér, A.; Szendi, I.; Gingl, Z. Detailed Analysis and Comparison of Different Activity Metrics. PLoS ONE 2021, 16, e0261718. [Google Scholar] [CrossRef]
  39. John, D.; Tyo, B.; Bassett, D.R. Comparison of Four Actigraph Accelerometers During Walking and Running. Med. Sci. Sports Exerc. 2010, 42, 368–374. [Google Scholar] [CrossRef] [PubMed]
  40. Khamis, H. Measures of Association: How to Choose? J. Diagn. Med. Sonogr. 2008, 24, 155–162. [Google Scholar] [CrossRef]
  41. Shaffer, F.; Ginsberg, J.P. An Overview of Heart Rate Variability Metrics and Norms. Front. Public Health 2017, 5, 258. [Google Scholar] [CrossRef] [PubMed]
  42. Malik, M. Heart Rate Variability. Ann. Noninvasive Electrocardiol. 1996, 1, 151–181. [Google Scholar] [CrossRef]
  43. Vaschillo, E.; Lehrer, P.; Rishe, N.; Konstantinov, M. Heart Rate Variability Biofeedback as a Method for Assessing Baroreflex Function: A Preliminary Study of Resonance in the Cardiovascular System. Appl. Psychophysiol. Biofeedback 2002, 27, 1–27. [Google Scholar] [CrossRef]
  44. Martin, C.B. Physiology and Clinical Use of Fetal Heart Rate Variability. Clin. Perinatol. 1982, 9, 339–352. [Google Scholar] [CrossRef]
  45. Meister, K.; Juckel, G. A Systematic Review of Mechanisms of Change in Body-Oriented Yoga in Major Depressive Disorders. Pharmacopsychiatry 2018, 51, 73–81. [Google Scholar] [CrossRef]
  46. Mathersul, D.C.; Dixit, K.; Avery, T.J.; Schulz-Heik, R.J.; Zeitzer, J.M.; Mahoney, L.A.; Cho, R.H.; Bayley, P.J. Heart Rate and Heart Rate Variability as Outcomes and Longitudinal Moderators of Treatment for Pain across Follow-up in Veterans with Gulf War Illness. Life Sci. 2021, 277, 119604. [Google Scholar] [CrossRef]
  47. Javorka, K.; Lehotska, Z.; Kozar, M.; Uhrikova, Z.; Kolarovszki, B.; Javorka, M.; Zibolen, M. Heart Rate Variability in Newborns. Physiol. Res. 2017, 66, S203–S214. [Google Scholar] [CrossRef]
  48. Rother, M.; Zwiener, U.; Eiselt, M.; Witte, H.; Zwacka, G.; Frenzel, J. Differentiation of Healthy Newborns and Newborns-at-Risk by Spectral Analysis of Heart Rate Fluctuations and Respiratory Movements. Early Hum. Dev. 1987, 15, 349–363. [Google Scholar] [CrossRef] [PubMed]
  49. van den Beuken-van Everdingen, M.H.J.; de Rijke, J.M.; Kessels, A.G.; Schouten, H.C.; van Kleef, M.; Patijn, J. Prevalence of Pain in Patients with Cancer: A Systematic Review of the Past 40 Years. Ann. Oncol. Off. J. Eur. Soc. Med. Oncol. 2007, 18, 1437–1449. [Google Scholar] [CrossRef] [PubMed]
  50. Cascella, M.; Vittori, A.; Petrucci, E.; Marinangeli, F.; Giarratano, A.; Cacciagrano, C.; Tizi, E.S.; Miceli, L.; Natoli, S.; Cuomo, A. Strengths and Weaknesses of Cancer Pain Management in Italy: Findings from a Nationwide SIAARTI Survey. Healthcare 2022, 10, 441. [Google Scholar] [CrossRef] [PubMed]
  51. Gkikas, S.; Tsiknakis, M. Automatic Assessment of Pain Based on Deep Learning Methods: A Systematic Review. Comput. Methods Programs Biomed. 2023, 231, 107365. [Google Scholar] [CrossRef]
  52. Cascella, M.; Coluccia, S.; Grizzuti, M.; Romano, M.C.; Esposito, G.; Crispo, A.; Cuomo, A. Satisfaction with Telemedicine for Cancer Pain Management: A Model of Care and Cross-Sectional Patient Satisfaction Study. Curr. Oncol. 2022, 29, 5566–5578. [Google Scholar] [CrossRef]
  53. Lamotte, G.; Shouman, K.; Benarroch, E.E. Stress and Central Autonomic Network. Auton. Neurosci. Basic Clin. 2021, 235, 102870. [Google Scholar] [CrossRef]
  54. Hohenschurz-Schmidt, D.J.; Calcagnini, G.; Dipasquale, O.; Jackson, J.B.; Medina, S.; O’Daly, O.; O’Muircheartaigh, J.; de Lara Rubio, A.; Williams, S.C.R.; McMahon, S.B.; et al. Linking Pain Sensation to the Autonomic Nervous System: The Role of the Anterior Cingulate and Periaqueductal Gray Resting-State Networks. Front. Neurosci. 2020, 14, 147. [Google Scholar] [CrossRef]
  55. Arslan, D.; Ünal Çevik, I. Interactions between the Painful Disorders and the Autonomic Nervous System. Agri J. Turk. Soc. Algol. 2022, 34, 155–165. [Google Scholar] [CrossRef]
  56. Kyle, B.N.; McNeil, D.W. Autonomic Arousal and Experimentally Induced Pain: A Critical Review of the Literature. Pain Res. Manag. 2014, 19, 159–167. [Google Scholar] [CrossRef]
  57. Dormal, V.; Vermeulen, N.; Mejias, S. Is Heart Rate Variability Biofeedback Useful in Children and Adolescents? A Systematic Review. J. Child Psychol. Psychiatry 2021, 62, 1379–1390. [Google Scholar] [CrossRef] [PubMed]
  58. Geovanini, G.R.; Vasques, E.R.; de Oliveira Alvim, R.; Mill, J.G.; Andreão, R.V.; Vasques, B.K.; Pereira, A.C.; Krieger, J.E. Age and Sex Differences in Heart Rate Variability and Vagal Specific Patterns—Baependi Heart Study. Glob. Heart 2020, 15, 71. [Google Scholar] [CrossRef] [PubMed]
  59. Pei, Z.; Shi, M.; Guo, J.; Shen, B. Heart Rate Variability Based Prediction of Personalized Drug Therapeutic Response: The Present Status and the Perspectives. Curr. Top. Med. Chem. 2020, 20, 1640–1650. [Google Scholar] [CrossRef]
  60. Wujtewicz, M.; Owczuk, R. Heart Rate Variability in Anaesthesiology—Narrative Review. Anaesthesiol. Intensive Ther. 2023, 55, 1–8. [Google Scholar] [CrossRef] [PubMed]
Figure 1. The proposed framework for automatic pain assessment.
Electronics 12 03716 g001
Figure 2. BITalino anatomy. Board and plugged channel mapping, 3D printed casing, and application; data and signals were acquired from 2 sensors, namely electrocardiography (ECG) and electrodermal activity (EDA).
Electronics 12 03716 g002
Figure 3. Acquired EDA signal (top) and RR interbeat interval time series (bottom); EDA was quantified in microsiemens (µS).
Electronics 12 03716 g003
Figure 4. (Top) Decomposition of the original EDA signal into tonic and phasic components, with pain event onsets (straight vertical red lines); (bottom) corresponding RR interbeat interval time series, with pain event onsets (straight vertical red lines). Red lines indicate pain events (numeric rating scale ≥ 4); EDA was measured in microsiemens (µS).
Electronics 12 03716 g004
Figure 5. (Left) Values of both ISCR and SD RR at each progressive pain event onset; (right) scatter plot to assess the relationship between ISCR and SD RR; a linear fitting curve with a corresponding determination coefficient (R2) is displayed in both figures; abbreviations: ISCR, integrated skin conductance response; SD RR, standard deviation of the RR intervals.
Electronics 12 03716 g005
Figure 6. Simultaneous registration of electrodermal activity (EDA), x–y–z acceleration, and acceleration magnitude after gravity subtraction.
Electronics 12 03716 g006
Figure 7. Simultaneous registration of electrodermal activity (EDA) and acceleration magnitude with an indication of motion and rest phases during the acquisition; the EDA signal demonstrates a gradual return to its baseline values, requiring a certain amount of time for recovery.
Electronics 12 03716 g007
Figure 8. Boxplots of (a) electrodermal activity (EDA) values and (b) ECG-derived RR values during both the motion and rest phases.
Electronics 12 03716 g008
Table 1. Features extracted from EDA and ECG signals.
Event ID *SCR Latency
(s)
SCR Sum
(μS)
SCR Average
(μS)
ISCR
(μSs)
Mean RR
(ms)
SD RR
(ms)
11.250.280.031.25814.5515.35
27.350.530.072.61824.3127.33
31.951.680.228.56855.5318.83
42.051.540.176.55868.5740.88
51.050.990.124.68857.7834.31
62.353.380.5922.86861.5136.05
71.751.350.155.98883.9428.64
87.751.300.187.16888.0935.62
95.650.270.041.61891.1843.80
Abbreviations: SCR, skin conductance responses; ISCR, integrated SCR; SD RR, standard deviation of the RR intervals. * Event No. 1 is the start of the signal acquisition, and the IDs correspond to pain onsets reported by the patient, as reported in Figure 4 (red vertical lines).
Disclaimer/Publisher’s Note: The statements, opinions and data contained in all publications are solely those of the individual author(s) and contributor(s) and not of MDPI and/or the editor(s). MDPI and/or the editor(s) disclaim responsibility for any injury to people or property resulting from any ideas, methods, instructions or products referred to in the content.

