Abstract
Fully automated homes, equipped with the latest Internet of Things (IoT) devices, aiming to drastically improve the quality of lives of those inhabiting such homes, is it not a perfect setting for cyber threats? More than that, this is a fear of many regular citizens and a trending topic for researchers to apply Cyber Threat Intelligence (CTI) for seamless cyber security. This paper focuses on the Risk Assessment (RA) methodology for smarthome environments, targeting to include all types of IoT devices. Unfortunately, existing approaches mostly focus on the manual or periodic formal RA, or individual device-specific cyber security solutions. This paper presents a Dynamic Risk Assessment Framework (DRAF), aiming to automate the identification of ongoing attacks and the evaluation of the likelihood of associated risks. Moreover, DRAF dynamically proposes mitigation strategies when full automation of the decision making is not possible. The theoretical model of DRAF was implemented and tested in smarthome testbeds deployed in several European countries. The resulting data indicate strong promises for the automation of decision making to control the tightly coupled balance between cyber security and privacy compromise in terms of the embedded services’ usability, end-users’ expectations and their level of cyber concerns.
1. Introduction
The IoT has attracted considerable attention during recent decades and still presents a significant opportunity for many industrial and business stakeholders in various domains [1]. Smarthomes are adopting IoT as an emerging technology to provide specialised services to control household appliances, automate specific tasks and, in general, improve quality of life. These devices take all forms and shapes, varying from a smart lightning or heating system to a smart fridge. Moreover, they are embedded in our daily appliances, making it less and less transparent what data is going in and out of our homes, leveraging existing and creating new cyber threats. Each of these devices, capable of communicating with one another and with external services accessible through the Internet, creates unmonitored data flows, unknowingly exposing us, regular users, to all kinds of cyber threats. The heterogeneity and diversity of the ‘Things’, as well as new lightweight communication protocols appropriate for IoT technology, create new challenges for the protection of such systems [2]. This gives a rise to the need for tools that provide visibility into the cyber risks and threats in smarthomes in an easy and understandable way, tailored towards people without a deep knowledge of Information Communication Technology (ICT) in general. Such tools will empower their users to take control and make appropriate decisions regarding home cyber security and their privacy.
Despite the acknowledged need for RA for smarthomes [3,4], the risk awareness solutions available for regular users with the purpose of understanding ongoing risks evolving on a daily basis are still very immature. Several academic works aim to provide policy based solutions [5] and formal periodic RA frameworks [3,6]. Other works demonstrate limited system knowledge and a lack of dynamic adaptation [4], lack of risk propagation and dependencies understanding [7] or lack of usability for regular citizens [8]. However, to the best of our knowledge, none of these works are capable of establishing a holistic approach to include the identification of risks and automation of mitigation measures in a dynamic manner.
The main goal of the proposed framework is to provide a real-time security and privacy RA of the ongoing activities on the network. It validates current communications by assessing any anomaly detected and deviations in the IoT device’s normal behaviour through device profiles. DRAF performs real-time RA by continuous evaluation and monitoring of various risk levels at multiple stages of data processing. To control the behaviour of devices and corresponding payload exchanges, permitted risk levels of ongoing network activity are dynamically calculated for each network activity event, practically determining the required decision to be taken. RA also involves establishing risk controls for the users’ privacy and making them aware of the associated risks. DRAF integrates multi-faceted anomaly detection analysers and risk Receptors to support behaviour deviation detection, involving deep understanding of risk propagation and inter-dependencies within the network. For this purpose, it leverages the existing open threat modelling tools (e.g., the open cyber threat intelligence platform) to integrate a network entity correlation ontology. Furthermore, a set of expert values for risk estimation was established to allow the comparison of associated impacts in various risk situations.
This work aims to reply to the following research questions:
- RQ1.
- Can a generic ontology be developed to capture complex relationships between heterogeneous IoT properties to encapsulate vulnerabilities, attack attribution, impact evaluation, and mitigation strategies?
- RQ2.
- Can a unique risk scoring be developed to eliminate environment context dependency? How does the initial setting of the expert values for the RA offer a valid approach, and are these values generally applicable in a standard installation?
- RQ3.
- What are the limitations on the automated decision making for RA in dynamic environments, such as smarthomes, where deployed IoT devices constantly evolve (get replaced, updated and moved)?
Our contributions can be summarised as follows:
- Development of a generic ontology for the representation of the IoT objects to encapsulate vulnerabilities, attack attribution, impact evaluation, and mitigation strategies in a smarthome environment.
- Presentation of the DRAF, encapsulating a risk scoring methodology based on the expert opinion settings. This framework was validated in real-life testbeds deployed in three European countries and demonstrates the potential of automated RA.
- Investigation into the limitations of the automated decision making for RA in a smarthome environment and their potential adaptation for similar dynamic environments, such as autonomous driving.
This work is organised as follows. In Section 2, main concepts are presented, necessary to understand the scope of this research, together with our analysis on the ongoing research efforts. Section 3 outlines the methodology we have followed for the development of the theoretical models. In Section 4, the implementation of the proposed approach framework on dynamic RA is described. Then, in Section 5, the map of the performed experiments, the deployment setup and the results are presented, followed by the analysis of the research questions and identified challenges in Section 6. Finally, Section 7 concludes the paper and outlines directions of future work.
2. Related Work
2.1. Background
RA is a holistic process of measuring the probability and severity of various effects on a system in question. In general, it is based on many unknowns, yet our concern should be even higher when operating in a setting where we know very little. It is the only way to enable any involved stakeholders to make pragmatic decisions on the system when those risks will eventually occur. It is a multidisciplinary approach and can be broken down into five stages:
- Risk Identification
- What can go wrong?
- Risk Modelling, Quantification and Measurement
- Assessing likelihood;
- Modelling relationships between risks and impacts.
- Risk Evaluation
- Trade-offs in terms of costs, benefits and risks;
- Multi objective analysis.
- Risk Acceptance and Avoidance
- Decision making through level of risk acceptability;
- How safe is safe enough?
- Risk Management
- Execution or actual implementation of decision making.
Traditional Approaches
RA is a process enabling the identification, estimation and prioritisation of risks associated with different dimensions: activity, operation, subject, environment.
Risks can be evaluated for each dimension in isolation or in a mixed setup, where various combinations are possible. RA sets the foundations for the following risk evaluation stages [9]:
- Acceptance: acknowledgement of the possibility of the risk to occur in a specific setup, and taking the responsibility of dealing with the caused consequences;
- Mitigation: taking actions to limit the exposure of the risk and its consequences by controlling and limiting its occurrence;
- Transfer: delegation or propagation of the risk occurrence to a third party capable of taking responsibility and liability of the risk’s consequences; and
- Avoidance: ignorance of the risk occurrence likelihood and assumption of risk non-existence, as evidence of its occurring is too low or the associated cost of mitigation and transfer is too high.
When evaluating the risk stages and associated measurements costs, the RA relies on five main variables:
- Assets: any items of value (infrastructure or reputation);
- Vulnerabilities: how to exploit assets;
- Threats: action to exploit vulnerability (deliberate or accidental);
- Attack likelihood: probability of threat; and
- Impact: estimation of the attack consequence.
The significance and weight of the previously mentioned variables produce variations of the RA approaches and models. The asset-centric models, such as OCTAVE [7], evaluate the impact of the risk occurrences. The threat-centric models, such as NIST SP800–30 [10], are focused on the feasibility of the risk occurrence.
Furthermore, risks can be measured in two ways: qualitatively and quantitatively [11]. While the first method appears to be very simple, time- and cost-effective, it is also known to be not precise and without impact measurement, as it uses non-numeric values as descriptive results. On the contrary, quantitative methods give a numeric probability, enabling easy measurement of the impact. However, its complex modelling relies on the historical data and, therefore, cannot provide values at loss at a particular time, especially for the risks that never occurred before.
The hybrid RA methodologies aim to address those shortcomings by including user-centric concepts in traditional RA models, where the following properties are included [12]:
- Human system integration: visual representation of the system;
- Interoperability identification: considerations towards dependencies; and
- Emergent behaviour evaluation: coupling systems for a new purpose.
2.2. Dynamic Risk Assessment
Understanding the operational environment is crucial in complex decision making and dynamic environments [4], where the collection and projection of various contextual factors, as well as time- and space-specific data collection takes place. The formal RA models presented in Section 2.1 are based only on periodic assessment with limited system knowledge and lack of dynamic adaptation of the evolving situational risks, where the user is a key element in the future risk projections.
Several works exist in the domain of RA aiming to address this shortcoming with partial automation. For instance, the RA framework [13] in IoT systems was developed with periodic RA. The main reasoning for such an approach is the limitation on the system’s knowledge and dynamic adaptation due to the lack of understanding of risk propagation and dependencies between different assets.
The MS STRIDE and DREAD application for threat modelling, described in [14] and widely used in RA, attempts to solve automation characteristics, yet still relies on a completely manual approach. The application of OCTAVE methodology provided in [7] presents the top 10 risks. Nevertheless, this method once again lacks dynamic properties and is subject to one expert opinion for eventual risk score calculation. Furthermore, the linking between threats and assets is unclear.
Atlam et al. [15] proposed a dynamic risk calculation method, but only in the domain of access control for IoT devices, incorporating the real-time contextual data, such as user attributes related to the surrounding environment. It is our understanding that this work is the closest achievement towards dynamic RA in a real-time situational monitoring network flow. Fuzzy logic and expert judgement risk estimation approaches were fused together to enhance crucial aspects of risk model applications, such as dynamism and usability. Nevertheless, this work stays only at the theoretical level, with future projected validation with security expert interviews. Furthermore, a fuzzy logic enabled system implies natural language based operation. While this can be beneficial in the setting where input is taken directly from the end-users, in network monitoring solutions such an approach has severe limitations, especially in terms of scalability. Alali et al. [16] also proposed the use of fuzzy logic for the impact assessment of criminal activities. The authors developed a RA process with the application of Mamdani and Sugeno fuzzy methods and compared RA models in a simulation environment. While the viability of the proposed approach is sound, its main limitation is that RA is performed on static objects only.
Gonzalez-Granadillo et al. [8] realised a dynamic risk management framework for critical infrastructure systems. Their work was based on the fusion of three models: attack modelling via attack graph generation, RA via threat risk quantification of observed network events, and response assistance via evaluation of all possible mitigation actions and safety scoring assignments. The main advancement of this work is the integration of security action impacts into the final mitigation response. However, the whole framework operates on a dynamically loaded set of configuration files: network topology, abstract privacy policies, authorised mitigation actions, vulnerability inventory and a reachability matrix. The final reports generated are for the risk management experts, not regular users, and still need to be deployed in the operational environment after an expert analyses them and chooses the most suitable action.
This is where our advancement in automated RA, called DRAF, brings its innovation capacity and implements theoretical advancements in real-life applications. The main differentiating factors of our framework is its capability to execute RA on IoT assets in a dynamic and constantly evolving smarthome environment. DRAF addresses the limitation of existing frameworks in performing periodic and static RA by operating on the currently observed data. Furthermore, not only does it integrate human-centric aspects into an RA model, but it also empowers its users to perform dynamic near-to-real-time RA on constantly evolving situational risks through the integration of a constant feed of the external intelligence.
2.3. Attack Classification
One of the most broad surveys attempting to enumerate a full attack landscape in an IoT ecosystem also proposed a classification system based on a layered approach: physical objects, protocols, data and software [17]. However, the main drawback of this approach is its overlapping attack attribution based on a singular property of any IoT object. For example, an object jamming attack, which is classified under physical object attacks, lacks annotation of the belonging property of the involved protocol characteristics.
Adat and Gupta [18] also propose a taxonomy of IoT based on the classical architecture of IoT, composed of four layers: perceptual, network, support and application. Yet, the explicit link between those architecture layers and the proposed threat classification is lacking, as only a subset of layers can be explicitly annotated. Physical issues are linked to the perceptual layer; data link, network and transport issues can be attributed to the network layer. However, support and application layers are omitted all together. Nevertheless, an in-depth review of commercial network protection solutions is presented.
Similarly, Chen et al. [19] presented an attack taxonomy based on the IoT ecosystem architecture: perception, network, middle-ware and application. Further classification of application domains was provided: industry (automobile or mining), urban infrastructure (smart grid, transportation, logistics), healthcare (medical devices) and smart environment (smarthome, smartphone, wearables).
A three-level attack classification approach was suggested by the authors of [20], where the level attribution was dictated by the severity of the security issue, ranging from low to high. The low level class was mostly correlated with physical and data link layers of communication. The intermediary level mostly concerned communications, routing and session management. Finally, the high level was applicable to applications executed in the IoT devices. In contrast, a three-dimensional taxonomy of attacks was proposed by [21], where the security landscape was analysed based on connectivity, actual device specification characteristics and the application domain. Furthermore, the attacks were classified into eight categories.
However, any attempt to uniquely attribute the attack to a specific category is prone to fail, as any IoT ecosystem, due to its heterogeneous nature, will always have a multitude of device specific properties, which will dictate attack scope. These include the affection vector, mitigation possibilities, likelihood impact, and cascading effects.
On the contrary, by focusing on the risk analysis, one can merge several attacks into the same risks, which matter the most to the end-user. Regular citizens are more keen to know the result of the attack and how it affects them rather than the technical cause at the root of the problem. For instance, the technology specific attack attribution provided in [22] can be used to form a multidimensional IoT attack correlation model, which, in turn, serves as the basis of the generic threat model and RA. The need for the development of a standardised representation of the diversified properties of a generic IoT object is continuously increasing as we move towards attack attribution issue, especially in the context of raising end-users’ awareness. Our proposal is to move towards embedding attack classification directly in the RA process, where the end-user will be presented with comprehensible information on what the possible consequences of the detected threat are.
2.4. Threat Modelling and Ontologies
An excellent identification of the current research gap in the domain of threat modelling and its standardisation adoption is provided in [23], outlining potential solutions to narrow the gap. A wide adaptation and referencing to the same (standardised) threat modelling framework would be highly beneficial to enable the possibility of comparative studies, where the reasoning on the model selection and attack prioritisation would be possible. Unfortunately, such a recommendation remains an unrealistic target due to the competitive nature of security research in the IoT environment. Most of the existing frameworks either come from similar, yet relevant, domains, or have a dedicated focus on some specific attributes.
Doynikova et al. [24] presented an ontology on metrics for cyber security assessment, as well as comparative studies on existing ontologies for security management. Unfortunately, none of them combine all necessary aspects of IoT object specific properties, correlated security issues and associated mitigation actions.
Semantic-based approaches were widely proposed in the recent academic literature. One of the most complete and promising approaches is based on the Semantic Web Rule Language (SWRL), which is designed specifically for smarthome safety services [25]. However, the main limitation of their approach is that devices’ data are redirected to the middleware on the remote server, which is further uploaded to the database to map with the ontology and propagates risk related information to a safety manager. Furthermore, their ontology does not incorporate cybersecurity related attributes, such as vulnerabilities, threats and Personal Data (PD) data exposure, constraining its capacity for attack and risk correlation.
The closest taxonomy of threats in the smarthome domain belongs to [26]. It incorporates impacts on the system and home’s occupants and their lives. However, explicit links between attack classification and an IoT object taxonomy is not provided. This classification serves as a base for the definition of our IoT Stack, which takes any existing and freely available ontology one step further by incorporating the functionality of vulnerability-attack-risk association in real time. This innovative step bypasses the static evaluation of the possible attack attribution and impact prediction, making the RA process truly dynamic.
3. Materials and Methods
3.1. Attack and Risk Mapping
In a classical setting, when observing network traffic and detecting an ongoing or recent attack, one of the most important challenges is to identify the source of the threat. Once the origin of the threat is known, it can be addressed adequately.
To identify an ongoing attack, one needs to have a deep understanding of the numerous properties that each attack can possess. This task becomes even more challenging when dealing with passive network traffic observation. One way to approach this is to create a generic attack taxonomy relevant to a specific environment. However, this implies creation of static definitions and classification of known attacks existing up to today only. This means that tomorrow’s attacks will not be included when using such approach. An alternative method is to start from the entities that can be deployed on the network and create an ontology supporting a generic description of properties belonging to those objects. This, in turn, enables reverse association from an IoT device property to a specific technological risk, which in turn will serve as a descriptor of attack association.
3.1.1. IoT Stack
For this purpose, we have developed IoT Stack ontology. As already stated in Section 2.4, our work is based on the existing taxonomy of the smarthome domain. With the aim to further extend it with the attack attribution properties, we have performed literature reviews and conducted several interviews with the expert groups. Furthermore, through the establishment of the reference architecture for securing smarthomes [27,28], a comprehensive set of the generic IoT object properties was derived. Each IoT device is characterised by multidimensional properties at three layers that we have identified: hardware, software and data. An attack can not be attributed by only one property defining the IoT stack. This is why attack association with the risk always overlaps with various IoT stack properties.
A smarthome is a system that can not be secured by isolating its components. Instead, we break it apart with the help of the IoT stack, extract smaller properties, attribute them to the associated attacks and risks, and monitor the smarthome as a whole. With this approach, we can also slice the observing system when a more detailed view is required, for instance by looking at a specific IoT device as a whole system on its own.
Furthermore, multiple properties of IoT devices dictate the affection vector, mitigation possibilities, likelihood and impact vector, and cascading vectors. During our studies, we have extracted key properties allowing such a correlation, which incorporates substantial variation of the IoT objects’s properties at the identified layers.
The overall concept of allowing attributions from the attack to the affected IoT device, and from specific characteristics of the IoT device back to the associated potential attack is depicted in Figure 1, represented with many-to-many relationship. Furthermore, an illustrative example of the multidimensional properties specification of the IoT object by utilising the IoT Stack concept is presented in Figure 2.

Figure 1.
Iot Stack with many-to-many relationship concept.

Figure 2.
Iot Stack example.
Such an approach enables each property to be linked to the risk through attack association, targeting the inclusion of all types of IoT objects that can be deployed in the smarthome.
3.2. Risk Definition
Extending the original idea of a system concept, we consider the smarthome environment as a holistic system, where risks can be measured quantitatively by utilising formal methodology on impact assessments when making decisions in critical situations.
Our initial analysis was inspired by the formal methodology widely used in the risk identification stage of the RA, called Hierarchical Holographic Modelling (HHM) [29]. This unique methodology enables the versatile aspects and dimensions of a system to be captured from the systemic modelling perspective, corresponding to our vision on the system’s slicing approach, where the object in question can be observed from a different granularity view (see Section 3.1.1). More specifically, the definition and application of the HHM framework will serve as a basis for the smarthome risk identification, answering the prime RA question: ‘What can go wrong?’. The graphical representation of the final definition of the HHM for the smarthome environment is depicted in Figure 3.

Figure 3.
HHM for smarthome risk identification.
The main sources of cyber risks in the smarthome environment can be classified into four categories:
- Manufacturer related, such as human factors, industrial process influence, operations, specifications, and protocols utilised, manufacturing costs, prioritisation of the customer requests, time constraints and legal compliance and obligations;
- Software related, such as the capability to perform and frequency of the updates, potential access to various kinds of data (personal and non-personal), vulnerability exposure, the inclusion of security and privacy threat modelling in the design process and source code openness for independent auditing;
- Hardware related, such as connectivity capabilities (direct Internet access or proxy mediator), the localisation of the object, the power and performance constraints and the actual materials used for object fabrication; and
- User related, such as behaviour patterns, general cyber awareness and human risk perception.
The visualisation and deep understanding of these perspectives set the foundation of the development of the risk model, defined in the next section.
3.3. Risk Model
While developing the IoT Stack concept, we have observed that, similarly to the specification of IoT objects’ multidimensional properties, generic risk can also be represented by various descriptors.
The smallest piece of information describing the risk descriptor, which can also be observed directly in the network traffic, is defined as an Artefact. The Artefact itself can be defined by several properties: origin, name and message. An Artefact which is assigned a certain weight then forms a so-called Receptor. Each Artefact with different weight values will create a new Receptor. Finally, risk is composed of numerous Receptors. The main concept here comes from the idea that each Receptor can be associated with many risks, and each Artefact is accepted by many Receptors. In order for the risk to become active, i.e., identified to be caused by an Attack, certain Receptors should be activated to outweigh the threshold of the risk. Figure 4 outlines the full Object Role Modelling (ORM) schematic for the risk model from the implementation perspective. More details on the technical implementation of this model are given in Section 4.1.

Figure 4.
ORM for the risk model.
3.3.1. Risk Calculation
The main question that we want to answer here is: ‘What is the likelihood that Risk X will happen, given X, Y and Z circumstances’? Let us assume that we are given R1: a PD leak. For the IoT device, iKettle, we have the following properties:
- Software: v23.6.4;
- Data: username; risk weight: 0.3; and
- Hardware: BLE; risk weight: 0.4.
In this case, the overall R1 = Medium, as the device potentially can leak only username. For the IoT device Fitbit watch, we have the following properties:
- Software: PROM24js;
- Data: age; risk weight: 0.7;
- Data: address: risk weight: 0.6;
- Hardware: WiFi; risk weight: 0.7; and
- Hardware: BLE; risk weight: 0.4.
In this case, the overall R1 = High, as the device has access to PD data directly and has direct connectivity to the network to transmit the data. Hence, the R1 for the Fitbit watch is higher than the R1 for the iKettle. However, the question is then raised of how to determine such initial weights. In this specific example, it is rather intuitive, but we need to build a scientifically sound model to support such a comparison.
3.3.2. Methodology on Risk Mapping Derivation
We have established the following methodology to identify the starting weight values for the IoT stack properties association with risks. First, we performed an extensive literature review to collect all relevant approaches and risks estimations in the domain of smarthomes and intelligent buildings. We have searched all indexed scientific repositories with the following search words: risk estimation, RA, smarthome, IoT, cyber physical systems, intelligent buildings, formal RA, and risk identification. This resulting list of papers was screened first for the relevance of the content. Then, in-depth analysis of most relevant works was performed to identify the list of the most appropriate risks appearing frequently in the scientific literature. The exhaustive list was aggregated with initial severity classification and potential cause attribution. In the second phase, we started from the attack classification landscape gathering, where the taxonomy of smarthome specific attacks was developed. It consisted of three main categories: Physical, Network and Software attacks. Each group was further classified into specific attacks. For each attack, we then derived a list of associated risks, based on the expert opinion survey. In the third phase, we cross-correlated risk lists from two previous phases and finalised it into a single list with manually assigned risk attribute weights. An extract of the data can be seen in Table 1.

Table 1.
Risks and attacks association.
3.3.3. Expert Values for Receptor Weights
We have applied the same methodology as for the risk mapping (Section 3.3.2) to establish expert defined values for the initial Receptors’ weights. Based on the literature review and expert opinion surveys, we have assigned averaged values for each identified risk Receptor. As described in Section 3.3, each risk can be triggered by the Receptor provided by the network Artefact. Therefore, we had to decompose all identified risks into associated Receptors and attribute the values for linked Artefacts, as shown in the Table 2. We have marked in green the Receptors with different weights that can trigger the same ‘Unauthorised Control’ risk.
Table 2.
Snippet of expert values for Receptors.
Furthermore, we have created a logical structure to calibrate the weights at run-time, depending on the anomaly report’s type (Section 4.4.3) and the feedback collected directly from the end-users of the proposed solution (Section 4.5.3).
4. Implementation
Inspired by the Immune Theory, which arose from the biology domain [30,31], we have conceptualised and implemented DRAF. This section illustrates in detail the internal architecture of the DRAF with the entire flow of the RA, as shown in Figure 5.

Figure 5.
DRAF architecture with data flow and risk propagation.
Data coming in from the several underlying modules is interpreted and allocated to the several distinct Analysers for further processing. These Analysers will each output a set of zero or more risk related events, so-called Artefacts.
These Artefacts are entities describing an element of the threat risk and an associated probability. This probability is the confidence level of the existence of that element of risk, which is thereafter reflected against a set of predefined risk scenarios for identification. A risk, as seen by DRAF, can be defined as a set of risk Receptors, which are the Artefacts with threshold and weight values. Each induced Artefact from the Analysers comes with a probability high enough to overcome the threshold for activation of risk and is then multiplied by the Artefacts internal weight attribution. The sum of all activated risk Receptors gives an overall risk likelihood. Using the matching and threshold comparison, a resulting set of risks with their likelihoods are then set as candidates for the calculation of the Immediate Risk Level (IRL) and the Current Risk Level (CRL). This produces a sparse matrix of the risks and their severity in conjunction with current in-place automation, possible (user) actions and outcomes (see [32] for more details on the theoretic model application for the definition of the risk levels). The Risk Automation and Exposure recommendation and related statistical data are parsed through producing a set of Instructions for the Mitigation Advisor.
4.1. Architecture and Workflow
The main goal of the DRAF is to provide real-time security and privacy RA of the ongoing activities on the network. It validates the current communication by assessing any anomaly detected and deviations in the IoT device’s normal behaviour through device profiles. RA performs real-time RA by continuous evaluation and monitoring of various risk levels at multiple stages of data processing. To control the behaviour of devices and corresponding payload exchanges, permitted risk levels of ongoing network activity are dynamically calculated for each network activity event, practically determining the required decision to be taken. RA also establishes the risk controls for the users’ privacy and makes them aware of the associated risks. DRAF integrates multi-faceted anomaly detection analysers and risk Receptors to support behaviour deviation detection, involving a deep understanding of risk propagation and inter-dependencies within the network. For this purpose, it leverages the existing open threat modelling tools (e.g., the Open cyber threat intelligence platform (https://www.opencti.io/en/, accessed on 27 February 2022)) to integrate a network entity correlation ontology.
4.2. Input Processor
The main controller component for the DRAF is depicted in Figure 6. It receives and manages incoming Anomaly reports that trigger the creation of the jobs to be executed. It is composed of a Launcher and Scheduler, and is constrained by the Reporting Strategies (RSs) for conform and standardised anomaly reporting inputs.

Figure 6.
Input Processor.
4.2.1. Launcher
The Launcher is a wrapper component responsible for the run-time environment configuration of the DRAF’s essential internal components, such as performance tracker, access to database repositories, risk estimator, communication handler, decision making, analysers launchers and the actual job scheduler. It serves as an initiator of the main execution process and exists in four variations to permit necessary integration into different deployment environments: a stand-alone command line Java virtual machine (JVM)-enabled environment, Jsvc (http://commons.apache.org/proper/commons-daemon/jsvc.html, accessed on 27 February 2022) and OSGi (https://www.osgi.org/, accessed on 27 February 2022) wrappers for specific gateway environments and a dedicated trials launcher for controlled testing of the DRAF automation features. It also initiates a Communicator component, responsible for listening to all incoming messages to be further dispatched and normalised for the risk analysis, as well as to handle remote call execution for asynchronous communications.
4.2.2. Reporting Strategies
To process incoming network messages coming from an external anomaly reporting module, a structured formulation of its content is required. The goal is to get the right information processed into the correct outputting Artefacts with minimal overhead. The network messages describe a detected anomaly report through the means of several predefined attributes:
- Severity: the degree the impact of the detected anomaly can have on the device or home environment;
- Priority: the importance of having the anomaly resolved or investigated. This attribute relates mostly to the end-user point of view of how an anomaly may affect them (e.g., private data leakage vs. a non-functional smart lamp);
- Reliability: the confidence factor from the anomaly reporting module;
- Attack attribution: a reporting module can indicate a potential attack classification for a detected anomaly;
- Attack probability: the confidence of the reporting module on the attack’s class attribution;
- Source/Destination: depending on the reporting module field of view within the network, these two fields contain the corresponding source and destination identifiers. These identifiers are provided in several granular levels, namely at the smarthome level, indicating there is something wrong in the network, at the interface of a device (e.g., gateway endpoint with device ID or interface channel) or generic subnetwork type (e.g., Zigbee, Bluetooth, Z-wave), or precisely to the device by providing its Internet Protocol address (IP) or Media Access Control address (MAC);
- Target recipient: similar to source/destination, looking at the communication channel can precisely narrow down the scope of the anomaly. Depending on the type of analysed communication protocol, this can be indicated as broadcast, unicast or multicast destination points; and
- Reasoning: a descriptive field in which the reporting module may provide additional information through the means of a fixed set of acceptable values.
While restricting and enforcing conformance to the input structure reduces the complexity, it does not entirely cover the vast differences that the reporting modules can exhibit. This means, for example, that a reporting module may report, in particular, a certain attack detection, while another reporting module operates at a higher level of granularity and reports on overall changes in the network communication behaviour. As a result, not all anomaly occurrences contain information on every attribute, nor is it required. Taking into account that any reporting module can differ and is residing somewhere in the network, e.g., on an IoT device, intermediate gateway or a home server, it is important to take into account their purpose. To illustrate this further we exemplify this with some questions:
- What information needs to be transmitted? A reporting module can encompass a broad range of monitoring functionalities that can describe a variety of anomalies or focus on very specific issues. Thus, the information that reporting modules can provide can vary strongly and distinctly from one another.
- When and in what form? Many factors influence when a report will be generated, due to the intended functions of the module, the observed parameters, its operating context (on edge device, on the gateway or even external as a service in the Internet). The DRAF has to handle asynchronously the incoming reports from multiple reporting modules, which report in an irregular (sparse) manner.
- Why and how? As functions differ, their intent for providing a report can be misleading. For example a module monitoring the absence of data reporting, e.g., a life beat packet from a smart smoke detector, may indicate that the battery has been depleted or the device is malfunctioning. On the other hand, a bed sensor may also report absence of data due to the person not being at home, while both stating the same report for absence of data.
Although most of these questions are covered by the attributes defined previously, we further systemise reporting modules into RSs by identifying their prime attributes. We defined three anomaly RSs that DRAF is fully integrated with. Each RS focuses on a subset of the variables as shown in Table 3.
Table 3.
Correlation matrix: inclusion of anomaly reports’ attributes per Reporting Strategy.
- Aggregated Prioritisation (AG): As the name implies, the primary attribute is priority. The anomaly reports incorporate intelligence on the aggregation of anomalies output based on the priority of the individual elements and provide their final outcome as the conclusion of the aggregation process (e.g., threshold, time window, batch size) with a priority score.
- Behaviour Deviation (BD): Leaning towards the severity and reliability as primary attributes, there are anomaly reports that report device and non-device behaviour deviations and higher level (application layer) events caused by a smarthome habitants.
- Attack Attribution (AA): Represented by anomaly reports that provide attack attribution data, either in the report as a dynamically filled attack identifier or as a fixed identifier defined by the scope of a specific attack detection use case.
Based on the identified strategy for an incoming reporting message, the DRAF then applies weight adjustments that influence the internal risk analysers’ assessment of the report (see Section 4.4.3).
4.2.3. Scheduler
The main DRAF workflow control unit, Scheduler, is in charge of incoming reports propagation from the the input reception and the risk analyser job dispatching to the result collector for the Decision Handler (DH) when the risk exceeds the configured acceptable risk threshold. It contains several functions/classes:
- Job creator: for each packet an encapsulated job is launched, enabling the control and monitoring of the analysis of the packet;
- Parameter application: an internal interface to get and set DRAF parameters (e.g., number of threads, sleep time settings, priorities);
- Selection of the checker for the performance control and monitoring. For example, Block Rules (BR) are always verified, but Behaviour Analyser (BA) or Payload Check (PC) verification depends on the metrics that influence the choice of not running a checker; and
- Tracker: responsible for the main pipeline monitor. It creates estimations of how long jobs take to complete based on the historical effort log. For example, a huge number of profiles per device can influence the time it takes to process a packet from a specific device. Additionally, the type of the data might affect the effort for the PC.
4.3. Risk Analysers
Scheduler coordinates and runs a set of Analysers producing risk Artefacts, which in turn trigger risk Receptors. The correlation between internal components is depicted in Figure 7.

Figure 7.
Risk analysers.
4.3.1. Behaviour Analyser
The aim of the BA is to see if the data flow from a device is within the nominal operations of non-faulty day-to-day usage data behaviour. The difficulty of operating and judging device behaviour roots in many unknowns of its operating environment.
Other than operating within a smarthome, nothing much is known, and its behaviour is established based on historic data flows, for which the Profile Building (PB) is responsible. For each device, the PB creates a graph of connected data flows, also known as the Device Profile, linking the flows together chronologically. as nodes. Each node then has the observed attributes of the data flows (accumulating, aggregating and merging of similar data flows). Each Device Profile is specific to the device and associated user’s interaction with it.
The Profile Handler (PH) component is responsible for the management and communication with the PB for retrieving and restructuring the Device Profiles to be used by the Analyser.
The main logic of the BA, which is responsible for comparing the current packet with any existing profile, is encapsulated in the functionality of the Contextual Checker (CC). Whenever the BA receives a processing job from the Scheduler, it will request from the PB the device profile linked to the job. The profile is then internally loaded through the PH in a new data structure enhanced for several operations. From the job, the properties and metrics are translated into a comparison query that can be given to the PH. Consecutively, PH will compare the query parameters with the nodes in the graph and output a set of pointers to nodes that are closest to the given query data. The CC then analyses these nodes on several aspects, with examples including:
- A comparison to the historical observations between the last identified pointers and accepted pointers;
- A comparison to the forecasted behaviour for the predicted pointers;
- Query matching thresholds with weights per identified property (e.g., 5 out of 10 properties matched);
- Per matched property evaluation of the threshold margins of the comparison per node (e.g., flow size property matched 80%); and
- Analysis of the system and user set configuration and preferences, forming exception or inclusion rules for properties, e.g., ‘ignore flow size’.
Finally, CC then determines if the behaviour is in line with its expectations of that specific device and marks the identified pointers as accepted pointers. The output will be an Artefact of misbehaviour with a given weight, as previously described in Section 3.3.
The Active Profile (AcP) is a profile that was matched in the recent past with incoming packets to the DRAF and is currently being tracked. It is a cursor in the profile’s tree, indicating at what stage the communication flow is, as well as the depths of the built tree.
The Garbage Collector (GC) is a separate process that monitors AcPs and checks on their activity and progression heuristics (e.g., time constraints on the next node in the tree).
We assume that several communications are going on at the same time. Additionally, there can be several matching profiles for a packet/flow, which should decrease over time, either by new packets and their matching probability or checking in the tree for the next node timeouts by GC. Therefore, we have built a structure to support the buffer of all active profiles.
A separate process for monitoring the absence of any communication was also envisioned as part of the device presence behaviour. It keeps track of profiles’ activity by counting how many times the profile was executed partially and fully.
Finally, the BA has a secondary behaviour verification algorithm running independently from its main function. In this case, it periodically requests a device profile from the PB and deduces in which time period it is expected of the device to communicate on the network. This algorithm further verifies if this has happened, and if not, it emits an Artefact of absence.
4.3.2. Payload Check
The PC uses the gathered information to inspect the data of the flow for any suspicious data patterns, the scope of which is predefined by user configuration. In addition, when the data stream is encrypted, it tries to verify the certificate data related to it. The internal logic of this component includes the following features:
- RegEx matching: a set of regular expressions to detect private data;
- Secure Socket Layer (SSL) check: verify the SSL certificate and see if proper SSL packet is observed; and
- Suspicious payload confidence level.
4.3.3. Block Rules
The BR are re-verified and extended to a broader view on the target destination to see if there could be any reason if a certain communication should be blocked. This includes the current rules in place from the IPtables, which are the raw rules as used by the underlying Operating System (OS) provided through the interoperable middleware or complemented by user-added information from the user configuration or public blacklisting. It verifies the authenticity of the destination (e.g., who is scraping from several sources). The gathered information is used to produce threat/risk levels for three categories: direct destination (e.g., IP), domain name (e.g., the Domain Name System (DNS) name) and connectivity (neighbouring IPs) in relation to their reputations (e.g., previously reported hosting malware and/or phishing sources and gathered by the central intelligence repository).
The current implementation of the BR operates on various interface types (IP, Bluetooth, Zigbee, Z-Wave, RF869, and PPP). However, in the case of IP traffic, we check only the destination, while in all other cases, both the destination and source are verified. BR is supported by the following use cases:
- Public Blacklist: based on the data retrieved from the official external threat intelligence by means of the scoring system;
- Private Whitelist: as the name indicates, it enables the public blacklist to be bypassed by adding the destination point to the whitelist; and
- Private Blacklist: a personalised blacklist of selected addresses.
BR performs external checks only once a dedicated alert is sent and executes the following procedure:
- Prioritisation: check the local whitelist, private blacklist and then copy of the public blacklist;
- Data refresh: if not blacklisted, then check with the external repository. If there is a reply time out, assume that IP is not present in the central intelligence repository (as the local copy of the public blacklist was synchronised earlier); and
- Score comparison: if the address is not blacklisted, check the score through the external resilience infrastructure. If the reply times out, assume that IP is safe. Otherwise, perform the reputation scoring routine [33].
4.3.4. Alert Processor
The Alert Processor (AP)’s primary function is to act on messages coming from the externally plugged reporting modules. These components provide a risk/anomaly analysis themselves and ‘merely’ inform the DRAF. It is up to the AP to handle the provided information in an appropriate way, meaning that the information given may not always be conclusive and the AP will try to consult with the other analyser outputs and historic data to relate the presented risks with ongoing events. Furthermore, it will apply aggregation and merging strategies to the incoming messages, as the underlying components may continuously emit these messages, and it would not be appropriate to overwhelm either the DH or the Mitigation Advisor (MA), and thus, ultimately the user, with it.
4.4. Risk Level Estimator
The overall workflow of the Risk Level Estimator (RLE) is illustrated in Figure 8. It is the most crucial component of the DRAF responsible for the risk estimation of an ongoing event and its impact on the overall risk level.

Figure 8.
Risk Level Estimator.
The risk model is composed of a collection of identified risks atomically split in the risk Receptors (as outlined in Section 3.2) and serves as a main controlling input for the RLE. Risk Receptors identify the set of currently applicable risks by incorporating the threat level, consequential exposure and the automation strategy.
4.4.1. Immediate Risk Level
One or more produced Artefacts with an established Receptor’s weights, initialised with expert weight values, can trigger one or more risks. For the risk to become active, an overall cumulative weight of all Receptors should overpass the established Receptor threshold. This threshold is controlled by the end-user and depends on his personal risk perception in terms of the compromise between acceptable risk tolerance and smarthome functionality. The currently processed Artefact produces a value called IRL. It initialises the corrective course of actions towards DH, described in detail in Section 4.5.
4.4.2. Current Risk Level
CRL is responsible for tracking all recently active risks by maintaining an in-memory table on the latest risk estimation scores. Once a risk value from IRL is processed by the weight adjustment, a comparison can be performed by CRL to identify whether any of the active risks exceed the risk threshold. Risk estimation is calculated by summing up CRL with the risk brought by the observed Artefact. This approach enables the sequential processing of the multiple Artefacts, as any of them can contribute to the detection of a risk. When Receptors weights are below the threshold, the average value is used for summing up risk estimation. When the latest Receptor observed is above the threshold, its value is used to report the detected risk accident.
The risk threshold value is controlled by two elements: the Accepted Risk Level and the Historical Raise Factors. The Accepted Risk Level is a structure to support the user definition of Accepted Risk Levels per device and is used for the overall smarthome installation. It has a dynamic property, as it evaluates over the time the initial setting by means of the feedback pipeline from the user interface. For example, if the user prefers to perform corrective action on the automated decision, then the Accepted Risk Level will be modified accordingly. This is implemented through the Historical Raise Factors feature, which reviews the risk history to reveal when and what risk events occurred, what was handled automatically, and which event requested a decision from the user.
4.4.3. Weight Adjustments
As previously mentioned, to calibrate expert weights assigned to the Receptors, we have implemented a weight adjustments strategy for each type of the RS. More specifically, we have integrated 180 different types of external anomaly reporting inputs, which can be categorised into three major RSs, as was described in Section 4.2. Below we provide examples of the weight adjustment per RS type through an example of a specific anomaly report integrated in the DRAF.
AG Weight Adjustment
This report example of type AG provides aggregated reports on IP-related anomalies of the format presented in Listing 1, including its own classification on the alert priority.
The maximum number of the occurrences provided in the list of FlowAlert can change from one deployment environment to another. Therefore the controlling variable for giving indicative value on the maximum number of accumulated alert_counts is externalised into the configuration settings of DRAF.
| Listing 1. AG alert format extract. |
| message AGReport { repeated AttackAlert attack_alert; } message AttackAlert { required AttackClass alert_class; required string alert_description; required Priority alert_priority; repeated FlowAlert flow_alert; } message FlowAlert { required string src_ip; required string dst_ip; required uint32 src_port; required uint32 dst_port; required uint32 alert_count; } |
For each attributed Artefact, the Receptor’s weight for the associated risks is adjusted in the following way:
- Prioritisation: alert_priority is given higher impact, and the sum of alert_count is given lower impact;
- Normalisation: a higher priority with a higher count should be more crucial to report, yet a higher priority with a low count is more valuable than low priority with a high count;
- Score adaptation:where significanceFactor is loaded from application properties and corresponds to the forecasted maximum number of occurrences (as described above);
- The final score adaptation strategy is calculated based on two variables:
- stepSize: ;
- maxNumberOfSteps: number of possible priorities scores, equal to 4 for the AG type of report;
- During the risk evaluation phase, the Artefact’s weight is adjusted according to this score, taking into consideration the observation of other ongoing anomalies.
For example, for an Artefact with the Receptor weight 0.8, an alert of HIGH priority (highest value) and 10 occurrences will give a final weight of 0.8. For an Artefact with a Receptor weight of 0.8, an alert with VERY_LOW priority and 1000 occurrences will give a final weight of 0.6. The adjusted weight is always less or equal to the predefined weight value.
BD Weight Adjustment
This module provides reports on the devices’ behaviour deviation anomalies with corresponding severity and reliability scores, summarised in Listing 2.
| Listing 2. BD alert format extract. |
| message AnomalyDetection { required uint32 severity_score; required uint32 reliability_score required DeviceInfo device; required string timestamp; required string reason; } |
The severity_score’s value range is , where 0 is a safe score and 1 to 10 is a threat, where 10 is the most severe score. The score 0 is used for the ‘safe’ reports, while values in the range are used for ‘threat’ reporting. The reliability_score’s value range is , where 0 is the lowest confidence and 10 is the highest confidence of the algorithm for its response. Furthermore, the severity-reliability relationship for ‘threat’ is linearly dependent (e.g., 1 severity score corresponds to 1 reliability score), and severity-reliability for ‘safe’ depends on the stability of the cluster.
The controlling variables for ensuring configurable and dynamic adaptations for anomaly reporting are externalised into the configuration settings of DRAF, setting the margins for the threat detection sparsity.
For each attributed Artefact, the Receptor’s weight for the associated risks are adjusted in the following way:
- Prioritisation: severity_score is given higher impact, while reliability_score is given lower impact;
- Normalisation: higher severity with higher reliability should be more urgent to report, yet higher reliability with lower reliability is more valuable than low severity with high reliability;
- Score adaptation:where significanceFactor is a multiplication product of the value ranges of severity and reliability, loaded from application properties;
- The final score adaptation strategy is calculated based on two variables:
- stepSize: ;
- maxNumberOfSteps: number of possible priority scores, equal to 10 for the BD type of report;
- During the risk evaluation phase, an Artefact’s weight is adjusted according to this score, taking into consideration the observation of other ongoing anomalies.
For example, for an Artefact with a Receptor weight of 0.7, an alert with a severity score of 7 (highest value) and a reliability score of 7 will give a final weight of 0.6. For an Artefact with a Receptor weight of 0.8, a BD alert with a severity score of 1 and a reliability score of 1 will give a final weight of 0.4. The adjusted weight is always less than or equal to the predefined weight value.
AA Weight Adjustment
This module provides reports on detected attack classifications for devices based on various metrics, where attribution probabilities are incorporated for the most likely detection attribution, as summarised in Listing 3.
| Listing 3. AA alert format extract. |
| message CybersecurityStatus { required InterfaceType if_type; required InterfaceId if_id; required int32 id_slot; required float attack_proba; required double start_time; required double end_time; repeated AttackClassification attack_classification; } message AttackClassification { required AttackAttribution attack_class; required float probability; optional DeviceId device_id; } |
The attack_proba’s value range is , where 1 corresponds to the highest likelihood. Furthermore, each AttackClassification provides an additional probability for attack classification to a specific attack class. The controlling variables for ensuring configurable and dynamic adaptations for anomaly reporting are externalised into the configuration settings of DRAF, setting the margins for the threat detection sparsity and the threshold for integrating the report result into the overall RA.
For each AA attributed Artefact, the Receptor’s weight for the associated risks are adjusted in the following way:
- Prioritisation: overall attack_proba is given higher impact, than individual probabilities for each classified attack;
- Normalisation: the bigger the difference between two variables, the less impact will be propagated to the RA;
- Score adaptation:where significanceFactor is a scaling product of probabilityScale, loaded from application properties, and diffFactor is the normalised difference of the overall attack probability and probability of attack class attribution;
- The final score adaptation strategy is calculated based on two variables:
- stepSize: ;
- maxNumberOfSteps: number of possible priority scores, considering the threshold;
- During the risk evaluation phase, the Artefact’s weight is adjusted according to this score, taking into consideration the observation of other ongoing anomalies.
4.5. Decision Handler
Depending on the user preference settings and resulting risk identification, DH either propagates a mitigation strategy to the end-user or performs automated actions with the possibility for the user to retract decisions made through a feedback loop.
4.5.1. Automated Decision Making
Utilising resulting data on exposure and automation together with user preferences, a course of Mitigation Advisory is extracted. Furthermore, a tracking mechanism is initiated for the follow-up of the scenario actively presented to the end-user.
The developed algorithm, demonstrated in Algorithm 1, outlines its main logic with the following abbreviations utilised:
- SCI corresponds to Special Case Intervention, where no automation is possible at all; only Mitigation Advisory is provided;
- AA corresponds to Automated Action, where a decision was made in accordance with user’s desirable risk level settings;
- SI corresponds to Security Intervention, where a decision should be made by the user with a recommendation.
| Algorithm 1: Decision Handler. |
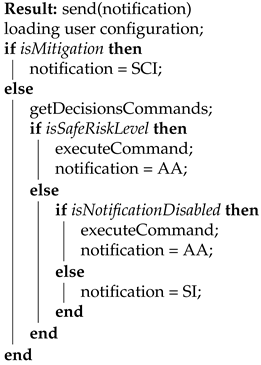 |
As can be observed from the above algorithm, a mandatory user interaction is required only in the case of SCI. In the other two instances, an automated decision will be executed, which can be verified by the end-user. Guided by the validation methodology established at the architecture level of the overall GHOST solution [27], a set of automatable technical actions was established, an extract of which is depicted in Table 4. The purpose of this example is to show the variety of possible technical actions that we could automate and to demonstrate the variation of the composed variables for the action selection. For example, different Receptors can cause the same risk, leading to different actions (ID1 and ID2). The same action can be executed in case of different risks triggered by different Receptors (ID2 and ID3). The same risk can lead to the same action, even if caused by different Receptors (ID3 and ID4). Additionally, the same Receptors causing different risks will lead to different actions (ID5 and ID8). This is due to the underlying risk model, which enables the diverse mapping of the Receptors, risks and associated attacks.
Table 4.
Automatable action mapping.
4.5.2. Rendering Mediator
This component is responsible for the translation of the risk parameters into an end-user-friendly explanation and acts as mediator between the Automated Decision Making and Web Interpreter. More specifically, it provides the reasoning on the automated action performed by DRAF or the Mitigation Advisory provided to the end-user. It is composed of:
- The attribution level, e.g., device, interface, gateway;
- The last triggered Receptor, which enabled acceptable risk threshold over-passing;
- The associated risk, controlled by the attack vector scope;
- The identifier for the translation key; and
- The mitigation advisory.
Furthermore, to follow-up on the pending user decisions or to correlate user decisions with reoccurring risks, a tracking mechanism is implemented.
The sample output is provided in Table 5, outlining the partial selection of the resulting variables. It should be emphasised that the ability of the DRAF to perform automated decisions is tightly coupled with the end-user preferences linked to their risk perception. For instance, for row ID1, we can see that the Mitigation Advisory value is set to n/a, while in row ID2, Mitigation Advisory is set to Block. This happens when the end-user is selecting a high tolerance risk acceptability level, meaning allowing maximum automation of DRAF, and does not receive notifications for each automated action (in case of ID1). However, when the end-user settings indicate that all automated actions should be reviewed, we provide the Mitigation Advisory. The final text displayed to the end-user corresponds to “Private data has been detected, coming from a blood pressure measurement device”. A similar differentiation can be observed in the rows ID3 and ID4. In both cases, the risk of communication with a malicious destination was addressed by continuous blocking of the traffic on a specific interface with the blacklisted address. However, in the row ID3, the end-user’s settings permitted the maximum automation level, hence, no Mitigation Advisory was provided. The final end-user text for the row ID4 corresponds to “Communication to a known malicious destination, botnet.com, was detected again on your network. Please contact the manufacturer to replace the malfunctioning device”. Finally, the row ID6 demonstrates the output of the DRAF when only mitigation by the end-user is possible due to technical limitations of the automation aspects. The final end-user text corresponded to the following: “No measurements were detected for the sleeping sensors. Please indicate how you resolved the issue: (i) I removed the device; (ii) I checked the device and behaviour is normal; (iii) Contact Manufacturer.”.
Table 5.
Output sample.
4.5.3. Feedback Refinement
To include the direct feedback of the end-users in the automated decision-making process, a set of user interfaces with different input options was created, as described in Section 4.5.1. Together with the Historical Raise Factors, this approach served to allow the fine-tuning and rectification (if desired) of the automated decisions to be overruled by the end-users. An example of such an action is demonstrated in Table 5, row ID5, where the output of the automated decision-making was refined directly by the end-user from continuing to block the traffic to allow it instead.
5. Results
We have executed several experiments to validate the proposed solution. Table 6 shows the correlation between each experiment, RQ relevance and utilised method for the validation of achieved results.
Table 6.
Experimental validation mapping.
5.1. Experimental Validation
The DRAF was deployed in more than 80 smarthomes as part of real-life trials in three European countries (Spain, Norway and Romania) in the period from June 2019 to April 2020 under the umbrella of the GHOST research project (https://cordis.europa.eu/project/id/740923, accessed on 27 February 2022). Furthermore, explicit validation and the calibration of the DRAF workflow was implemented with the help of the GHOST-IoT-dataset [34] in a testbed environment, fully replicating the smarthome setup. This dataset was collected in anticipation of the ethical constraints for attack simulation in real-life deployments faced in the GHOST project. For this purpose, on the voluntary basis, a full smarthome setup was deployed in one of the project participant’s apartments to capture two types of smarthome network traffic: normal behaviour and attack simulation. Availability of this data is a significant contribution to the functional validation of the IoT enabled environment under the execution of a cyber threat.
The purpose of all executed experiments is threefold:
- Measure the performance overhead of DRAF on the gateway;
- Validate the workflow capability to detect ongoing risks and apply an appropriate mitigation strategy in a real smarthome environment; and
- Validate the expert values’ correctness and their independence from the user profile settings, such as acceptable risk levels, automation optimisation and IoT devices’ profiles.
5.1.1. Deployment Setup
A typical installation of the smarthome was composed of the following devices:
- Smarthome gateway (e.g., Raspberry Pi 3 single-board computer, CareLife smart IoT gateway (https://cordis.europa.eu/project/id/740923, accessed on 27 February 2022));
- Zigbee sensors (e.g., presence detector, door aperture detector);
- Bluetooth enabled medical devices (weight scale, blood pressure meter);
- Z-wave sensors (e.g., motion, door and window opening, smoke and flood sensors); and
- Z-wave devices (e.g., smart plug, smart dimmer).
All IoT devices deployed in the smarthome environment communicated through the gateway, on which DRAF was deployed.
The real-life trials were performed in three stages, where different combinations of the RSs were used. The outline is provided in Table 7. Such consequential inclusion methodology allowed close monitoring of the performance overhead measurement.
Table 7.
Inclusion of RSs in the real-life trials.
Statistically, we have observed a 3.2% Central Processing Unit (CPU) overhead and 61.22 MB of memory consumption when deploying DRAF on the gateways. More details are depicted in Table 8. Considering that a smarthome gateway has, on average, at least CPU and 1 GB memory, our solution creates minimal overhead, completely acceptable for real-life deployment environments.
Table 8.
DRAF overhead statistics.
5.1.2. Ethical Constraints
In order to validate the correctness of the DRAF workflow and perform the necessary calibration of the expert values, one has to test the solution with cyber attacks. Due to the ethical approach applied throughout the project, it was agreed with the National Data Protection Authorities involved in the real-life trials that any form of real attack execution in the smarthome environments was not possible, and only simulated approaches in a controlled environment were allowed (https://ec.europa.eu/research/participants/documents/downloadPublic?documentIds=080166e5ceacdf7d&appId=PPGMS, accessed on 27 February 2022). Furthermore, dedicated debriefing of the participants after simulations was required, limiting the effectiveness of technological and functional testing of the framework. Therefore, any validation involving the execution of attacks was constrained to be performed only in the testbed environments.
5.1.3. Workflow Validation in the Testbed Environments
In alignment with the methodology on risk modelling, as described in Section 3.3.2, the technical functioning of the proposed framework was validated in the testbeds. The extract of the tested DRAF components is presented in Table 9. Here, the focus was given to the validation of the workflow correctness by triggering a specific incoming anomaly report. Simulation of the attack in isolation primarily ensured the correctness of the invoked analyser capable of identifying applicable risks and application of the appropriate automated Decision (D) and Mitigation Action (MA). Secondly, this setting also permitted the validation of the expert weights’ initialisation values, as different testbeds equipped with different IoT devices were utilised. As can be observed, only in cases when dealing with BD RSs the automation of mitigation actions was not possible. This is explained due to the technical constraint on the nature of the associated risks, where additional feedback from the end-users was required.
Table 9.
Automation status of draf for decision making and mitigation.
5.1.4. Alert Fusion and Receptors Verification
The final and most challenging validation experiment was designed as a simultaneous reporting of various attack scenarios to verify that the DRAF assigned risk Receptor weights used at the initialisation are adequate and the overall behaviour of risk detection is correct. For this purpose, we used the GHOST-IoT-dataset, which was replayed in the testbed’s gateway with several anomaly reporting components running together with DRAF. This setup simulated, as close as possible, an authentic smarthome but in a controlled manner and with no real users involved to avoid ethical constraints. The testbed further permitted simultaneous triggering of the AA and BD Reporting Strategies and invocation of the AP, BA and BR analysers.
We replayed seven attack scenarios:
- Attack 1: The battery of the living room sensor was removed;
- Attack 2: A total of 10 consecutive wrong blood pressure measurements were made;
- Attack 3: The emergency button was activated 20 times in a row;
- Attack 4: The door opening sensor of the entrance was uninstalled, and several detection triggers were forced;
- Attack 5: The battery of the door opening sensor of the entrance was removed;
- Attack 6: The bedroom sensor was moved to a nearer position; and
- Attack 7: A connection from an unknown device to the WiFi network.
The DRAF outcomes are outlined in Table 10 for each attack (Nr). As one can note, the verification of the DRAF behaviour was not possible in all cases due to the missing underlying anomaly reporting for Attacks 2, 4 and 6. In all other cases, the risks were identified in an acceptable time-frame, ranging from 56 to 295 . In the cases of Attacks 1 and 5, two Artefacts were observed, both triggering the Receptors for the same risk of Physical Damage, which finally was flagged as ‘over-passed the threshold’. For Attack 3, three distinct Artefacts were observed, where weight adjustments were applied due to the underlying RSs. More specifically, the risk of Physical Damage was lowered down for the BEHAVIOUR_DEVIATION Artefact, coming from AP:BD RSs. However, the same risk was enhanced by the BEHAVIOUR_ANOMALY Artefact processed by BA and UNKNOWN_TRAFFIC processed by AP, resulting in the final risk of Physical Damage being detected in the shortest time-frame observed during the experiment. Finally, Attack 7 caused the creation of two Artefacts, both triggering the Sniff Traffic risk. However, despite the fact that initial risk weights did not surpass the set threshold, the prioritisation of the BR analysers permitted propagation of the risk estimation to finally be triggered with a minor delay of less than .
Table 10.
Detection of attacks, receptors, and risks.
In conclusion, this experiment also showcased that Receptors’ weight initialisation based on expert’s opinion and their further run-time adjustment presents an accurate approach, as the risk detection was executed in a required time. Furthermore, the applied weight adjustment enables faster detection time, as shown in the case of Attack 3.
5.1.5. Risk Coverage Analysis
Finally, we performed an analysis on the coverage of the risks in relation to the attack association and reported Artefacts. Table 11 shows an extract of the generated distribution of the Artefacts utilised in the validation setup, grouped by the RSs. For each risk shown in the table, we can see the overall number of Artefacts potentially capable of triggering the risks and their distribution per RS. Furthermore, for each risk shown in the table, a specific RS appears to be more reliable for the risk-triggering mechanisms, e.g., for the risk of Physical Damage, the BD RS provided 29 potential Artefacts, while the AA and AG RSs provided only 2 potential Artefacts. This can be explained by the technological nature of the risk in question. The risk of physical damage implies an actual change in the behaviour of the IoT object, and therefore, reports containing data on the behavioural aspects will be of greater relevance. Some of the risks exhibit a very low coverage by RSs, such as Malicious Destination and Behaviour Deviation. This can be explained by the actual setup of the experiment executions. DRAF heavily relies on the external anomaly reporting inputs. These two reports were integrated in the deployed testbed environment, providing additional inputs for the DRAF for very specific cases, which were requested in the final iteration of the projects’ development cycle to support the integration of externalised threat intelligence.
Table 11.
Risks and Artefacts per RS distribution.
6. Discussion
Our research goal was threefold: study the identified research questions, set the foundation for the generalised dynamic RA framework and provide validation on the implementation of our solution.
6.1. RQ1: Generic Ontology
RQ1 was the prime motivation of our study. The main goal was to develop a generalised ontology to encapsulate fine-granular descriptors of vulnerabilities, threat vectors, risk mitigation strategies, impact evaluation, and cascading effects. This was successfully demonstrated through the development of the IoT Stack concept, which was included in the core of the DRAF (see Section 3.1.1). This enabled efficient bi-directional linking from the IoT device to the potential attack attribution and associated risks. Furthermore, such modelling permits the generalisation of the concept being applied to any IoT domain, ranging from smarthomes and connected vehicles to industrial smart factories and smart city infrastructures. The same concept comprises the notion of the granular slicing of the system into atomic components, identified as IoT objects. This approach grants the possibility of the identification of the cascading effects due to the inter-dependencies of object properties and their communications and coexistence in the same environment.
6.2. RQ2: Risk Calculation and Context Dependency
Quantification is the most crucial aspect in any RA system. Our methodology, applied throughout various risk modelling steps (see Section 3.2), eliminated most common problems for quantification of the risk weight values, namely high dependency on the available historical and current data. By utilising the initial expert values for risk weight allocation, we could advance the development of the framework from a prototyping environment into the real-life environment. The dynamic adaptation of the risk weights for the Receptors, based on the individual and collective decision making feedback, permitted the fine-tuning and validation of the DRAF in the real-life deployments (see Section 5.1). Furthermore, it was observed that the expert values are context independent, as no calibration was required for the utilised values in different smarthomes, where the actual smarthome setup was different from one place to another.
6.3. RQ3: Limitations on Dynamic Risk Assessment
The automated decision making in the context of the RA is bound to the limitation of the available data granularity of the underlying anomaly reporting, addressing entirely RQ3. DRAF was proven to be efficient in the automation of the decision making when quality reports were provided (see Section 5.1.4). For example, in cases when external reports being fed into the system did not have granular data on the affected device, no automation of mitigation actions was achieved. This was due to the technical limitation of attributing a specific device causing the anomaly observed throughout various RSs. Another important factor is the risk perception of the actual end-users. The less the users cared for cyber security and privacy risks, the more they were willing to compromise the decision-making efficiency towards smarthome functionality features.
6.4. Challenges and Limitations
Any theoretical solution can only be validated with technical implementation and the data quality. The original plan of this study was based on the availability of the IoT data to be generated and collected directly from the real smarthome installations. Unfortunately, this approach faced several obstacles, most importantly the ethical and privacy related restrictions when monitoring and analysing the network data. As a result, we had to readjust the scope of our experiments and rely mostly on testbed environments to mitigate the imposed delays. We have faced the same source of another challenge regarding the validation of expert values, originally planned to be performed during real-life trials by simulating attacks. However, due to the ethical constraints (see Section 5.1.2), these experiments had to be substituted by testbed simulations and voluntary IoT dataset collection.
Several technological challenges were also confronted, including, for instance, the integration of the external threat intelligence and decentralised resistance directly into the enhancement of the automated decision making of DRAF. The first technology targeted the inclusion of the openly available data from the Internet to contribute to the identification of risks and attribution to the known attacks. This was achieved by means of the development of the sub-component responsible for feeding DRAF the external data and incorporating known threats reporting into the BR decision making logic. On the same note, we have also anticipated the decentralised resilience of the DRAF through reputation scoring integration, enabling other instances of the system running in other smarthomes to share zero-day threats and identify the misbehaviour of the IoT devices [33].
While the methodology utilised in our study already had a dedicated research question on the limitations of DRAF’s application in the smarthome environment (Section 6.3), we have also observed direct restrictions related to the study’s execution. More specifically, the input data type and its granularity affects the quality of the automation aspects of the RA. More granular reporting on the potential threats and anomalies is required for higher intelligence and automation in the decision-making process. We have addressed this limitation by developing various RS (described in detail in Section 4.2.2) as an attempt to normalise incoming reports for DRAF. However, it remains subject to external technical factors.
7. Conclusions and Future Work
The presented solution is a complete framework that successfully demonstrates the feasibility of decision-making automation in the RA domain in a dynamic environment, such as a smarthome. As a background, the domain of RA has been introduced, highlighting the five stages for its definition, followed up by traditional approaches on asset-centric and threat-centric models, with newer models taking the hybrid approach and also including user-centric concepts. Our framework leverages the RA by focusing on the attacks and risk association through the addition of an ontology and a unique methodology on binding elementary attacks or anomaly properties to risks. The full RA model has been illustrated from several angles, including the ORM outlining the conceptual objects with their relations and attributes, a technical flow diagram addressing each of the elements on their utility, and describing their actual implementation from the development viewpoint. The framework emphasises the interoperability with external reporting by proposing a structured Application Programming Interface (API) for anomaly reports, which thereafter are handled by DRAF’s own internal analysers. This provides flexibility to the types of smarthome monitoring and its locality (e.g., monitoring on IoT devices themselves, whereas our solution runs on the home gateway). Our approach has demonstrated that a unique risk scoring can be developed to eliminate context dependency. While initial expert weight values are required, by introducing weight adjustment strategies to calibrate the values to a given environment, we have shown that they are transferable to other environments without per-site modifications. Thus, we can conclude that the approach utilised is context-independent and generally applicable to any standard installation on a home gateway. Furthermore, our theoretical model was implemented and tested in smarthome testbeds and real-life environments in several European countries, demonstrating its potential for technological adoption.
An analysis of the presented research questions was provided, evaluating corresponding achievements and shortcomings. Our scientific contribution is notable in terms of the successful illustration of the IoT Stack model, the dynamic adaptations of risk scores and the automated decision making in RA for the smarthome environment. It is of the utmost priority not only in academic research, but also for regular citizens to be provided with the tools enabling them to understand and to have control over the IoT objects’ activities in privacy-crucial environments, such as smarthomes. Furthermore, we generalised the initialisation process of the DRAF deployment in the IoT-enabled ecosystem by advancing the formation of the CTI system based on the risk scoring model. The demonstration and validation of the automation aspects of our framework in real-life deployments indirectly pushes forward the frontier of the general awareness of the citizens regarding cybersecurity and privacy problems.
As a future work, we are currently working on an extension of the risk coverage mapping, as already indicated in Section 5.1.5, by integrating a greater variety of external reports, more specifically in the domain of the connected and automated vehicles. Future work will put more emphasis on the privacy compliance aspects for the refinement of the currently used risk model. This will also be achieved through already ongoing efforts in the certification domain with the purpose of developing a standardised interfacing for easier integration of any external anomaly reporting in the DRAF.
Author Contributions
Conceptualisation, A.C. and N.A.N.; methodology, A.C. and N.A.N.; software, A.C.; validation, A.C.; writing—original draft preparation, A.C.; writing—review and editing, A.C. and N.A.N.; visualisation, N.A.N. and A.C.; supervision, N.A.N. All authors have read and agreed to the published version of the manuscript.
Funding
This work has received funding by the European Union’s Horizon 2020 Research and Innovation Programme through the SHOW project (https://show-project.eu/, accessed on 27 February 2022) under grant agreement No 875530 and the nIoVe project (https://www.niove.eu/, accessed on 27 February 2022) under grant agreement No 833742.
Institutional Review Board Statement
Not applicable.
Informed Consent Statement
Not applicable.
Data Availability Statement
The data used for the experiments in this study are openly available at https://github.com/gspathoulas/ghost-iot-dataset accessed on 27 February 2022 [34].
Acknowledgments
The authors would like to thank Roland Bolboaca, who helped to replicate the experiments’ environment and capture risk-engine-generated data. We would also like to thank Meriem Benyahya for the constructive insights on the manuscript and proofreading.
Conflicts of Interest
The authors declare no conflict of interest.
Abbreviations
The following abbreviations are used in this manuscript:
| AA | Attack Attribution |
| AcP | Active Profile |
| AG | Aggregated Prioritisation |
| AP | Alert Processor |
| API | Application Programming Interface |
| BA | Behaviour Analyser |
| BD | Behaviour Deviation |
| BR | Block Rules |
| CC | Contextual Checker |
| CPU | Central Processing Unit |
| CRL | Current Risk Level |
| CTI | Cyber Threat Intelligence |
| DH | Decision Handler |
| DNS | Domain Name System |
| DRAF | Dynamic Risk Assessment Framework |
| GC | Garbage Collector |
| HHM | Hierarchical Holographic Modelling |
| ICT | Information Communication Technology |
| IoT | Internet of Things |
| IP | Internet Protocol address |
| IRL | Immediate Risk Level |
| JVM | Java virtual machine |
| MA | Mitigation Advisor |
| MAC | Media Access Control address |
| ORM | Object Role Modelling |
| OS | Operating System |
| PB | Profile Building |
| PC | Payload Check |
| PD | Personal Data |
| PH | Profile Handler |
| RA | Risk Assessment |
| RLE | Risk Level Estimator |
| RS | Reporting Strategy |
| SSL | Secure Socket Layer |
| SWRL | Semantic Web Rule Language |
References
- Bansal, M.; Chana, I.; Clarke, S. A Survey on IoT Big Data. ACM Comput. Surv. 2021, 53, 1–59. [Google Scholar] [CrossRef]
- Ali, W.; Dustgeer, G.; Awais, M.; Shah, M.A. IoT based smart home: Security challenges, security requirements and solutions. In Proceedings of the 2017 23rd International Conference on Automation and Computing (ICAC), Huddersfield, UK, 7–8 September 2017; pp. 1–6. [Google Scholar] [CrossRef]
- Jacobsson, A.; Boldt, M.; Carlsson, B. A risk analysis of a smart home automation system. Future Gener. Comput. Syst. 2016, 56, 719–733. [Google Scholar] [CrossRef] [Green Version]
- Park, M.; Oh, H.; Lee, K. Security risk measurement for information leakage in IoT-based smart homes from a situational awareness perspective. Sensors 2019, 19, 2148. [Google Scholar] [CrossRef] [PubMed] [Green Version]
- Rahmati, A.; Fernandes, E.; Eykholt, K.; Prakash, A. Tyche: Risk-Based Permissions for Smart Home Platforms. arXiv 2018, arXiv:1801.04609. [Google Scholar]
- Nurse, J.R.; Radanliev, P.; Creese, S.; De Roure, D. If you can’t understand it, you can’t properly assess it! The reality of assessing security risks in internet of things systems. IET Conf. Publ. 2018, 2018, 1–9. [Google Scholar] [CrossRef] [Green Version]
- Ali, B.; Awad, A.I. Cyber and physical security vulnerability assessment for IoT-based smart homes. Sensors 2018, 18, 817. [Google Scholar] [CrossRef] [Green Version]
- Gonzalez-Granadillo, G.; Dubus, S.; Motzek, A.; Garcia-Alfaro, J.; Alvarez, E.; Merialdo, M.; Papillon, S.; Debar, H. Dynamic risk management response system to handle cyber threats. Future Gener. Comput. Syst. 2018, 83, 535–552. [Google Scholar] [CrossRef]
- Wheeler, E. Security Risk Management; Elsevier: Berlin/Heidelberg, Germany, 2011. [Google Scholar] [CrossRef]
- Caralli, R.; Stevens, J.; Young, L.; Wilson, W. Introducing OCTAVE Allegro: Improving the Information Security Risk Assessment Process; Technical Report CMU/SEI-2007-TR-012; Software Engineering Institute, Carnegie Mellon University: Pittsburgh, PA, USA, 2007. [Google Scholar]
- Ruan, K. Introducing cybernomics: A unifying economic framework for measuring cyber risk. Comput. Secur. 2017, 65, 77–89. [Google Scholar] [CrossRef]
- Colella, A. Cyber Security and Ubiquity: An Human-Centric Approach. 2017. Available online: http://elea.unisa.it/xmlui/handle/10556/2688 (accessed on 27 February 2022).
- Rao, A.; Carreon, N.; Lysecky, R.; Rozenblit, J. Probabilistic Threat Detection for Risk Management in Cyber-physical Medical Systems. IEEE Softw. 2018, 35, 38–43. [Google Scholar] [CrossRef]
- Nurse, J.R.; Creese, S.; De Roure, D. Security Risk Assessment in Internet of Things Systems. IT Prof. 2017, 19, 20–26. [Google Scholar] [CrossRef]
- Atlam, H.F.; Walters, R.J.; Wills, G.B.; Daniel, J. Fuzzy Logic with Expert Judgment to Implement an Adaptive Risk-Based Access Control Model for IoT. Mob. Netw. Appl. 2019, 26, 2545–2557. [Google Scholar] [CrossRef] [Green Version]
- Alali, M.; Almogren, A.; Hassan, M.M.; Rassan, I.A.; Bhuiyan, M.Z.A. Improving risk assessment model of cyber security using fuzzy logic inference system. Comput. Secur. 2018, 74, 323–339. [Google Scholar] [CrossRef]
- Jakobson, G. Mission cyber security situation assessment using impact dependency graphs. In Proceedings of the Fusion 2011—14th International Conference on Information Fusion, Chicago, IL, USA, 5–8 July2011; pp. 1–8. [Google Scholar]
- Adat, V.; Gupta, B.B. Security in Internet of Things: Issues, challenges, taxonomy, and architecture. Telecommun. Syst. 2018, 67, 423–441. [Google Scholar] [CrossRef]
- Chen, K.; Zhang, S.; Li, Z.; Zhang, Y.; Deng, Q.; Ray, S.; Jin, Y. Internet-of-Things Security and Vulnerabilities: Taxonomy, Challenges, and Practice. J. Hardw. Syst. Secur. 2018, 2, 97–110. [Google Scholar] [CrossRef]
- Khan, M.A.; Salah, K. IoT security: Review, blockchain solutions, and open challenges. Future Gener. Comput. Syst. 2018, 82, 395–411. [Google Scholar] [CrossRef]
- Hossain, M.M.; Fotouhi, M.; Hasan, R. Towards an Analysis of Security Issues, Challenges, and Open Problems in the Internet of Things. In Proceedings of the 2015 IEEE World Congress on Services, SERVICES 2015, New York, NY, USA, 27 June–2 July 2015; pp. 21–28. [Google Scholar] [CrossRef]
- Cvitić, I.; Vujić, M.; Husnjak, S. Classification of security risks in the iot environment. In Proceedings of the 26th DAAAM International Symposium; DAAAM International: Vienna, Austria, 2016; pp. 731–740. [Google Scholar] [CrossRef]
- Aufner, P. The IoT security gap: A look down into the valley between threat models and their implementation. Int. J. Inf. Secur. 2020, 19, 3–14. [Google Scholar] [CrossRef] [Green Version]
- Doynikova, E.; Fedorchenko, A.; Kotenko, I. Ontology of metrics for cyber security assessment. In Proceedings of the 14th International Conference on Availability, Reliability and Security, Canterbury, UK, 26–29 August 2019. [Google Scholar] [CrossRef]
- Huang, X.; Yi, J.; Zhu, X.; Chen, S. A semantic approach with decision support for safety service in smart home management. Sensors 2016, 16, 1224. [Google Scholar] [CrossRef] [Green Version]
- Heartfield, R.; Loukas, G.; Budimir, S.; Bezemskij, A.; Fontaine, J.R.; Filippoupolitis, A.; Roesch, E. A taxonomy of cyber-physical threats and impact in the smart home. Comput. Secur. 2018, 78, 398–428. [Google Scholar] [CrossRef] [Green Version]
- Augusto-Gonzalez, J.; Collen, A.; Evangelatos, S.; Anagnostopoulos, M.; Spathoulas, G.; Giannoutakis, K.M.; Votis, K.; Tzovaras, D.; Genge, B.; Gelenbe, E.; et al. From Internet of Threats to Internet of Things: A Cyber Security Architecture for Smart Homes. In Proceedings of the 2019 IEEE 24th International Workshop on Computer Aided Modeling and Design of Communication Links and Networks (CAMAD), Limassol, Cyprus, 11–13 September 2019; pp. 1–6. [Google Scholar] [CrossRef]
- Collen, A.; Nijdam, N.A.; Augusto-Gonzalez, J.; Katsikas, S.K.; Giannoutakis, K.M.; Spathoulas, G.; Gelenbe, E.; Votis, K.; Tzovaras, D.; Ghavami, N.; et al. GHOST—Safe-Guarding Home IoT Environments with Personalised Real-Time Risk Control. In Proceedings of the Security in Computer and Information Sciences, Euro-CYBERSEC 2018, Communications in Computer and Information Science, London, UK, 26–27 February 2018; Volume 821, pp. 68–78. [Google Scholar] [CrossRef] [Green Version]
- Haimes, Y.Y. Hierarchical Holographic Modeling. IEEE Trans. Syst. Man Cybern. 1981, 11, 606–617. [Google Scholar] [CrossRef]
- Meisel, M.; Pappas, V.; Zhang, L. A taxonomy of biologically inspired research in computer networking. Comput. Netw. 2010, 54, 901–916. [Google Scholar] [CrossRef] [Green Version]
- Alaparthy, V.T.; Morgera, S.D. A Multi-Level Intrusion Detection System for Wireless Sensor Networks Based on Immune Theory. IEEE Access 2018, 6, 47364–47373. [Google Scholar] [CrossRef]
- Pandey, P.; Collen, A.; Nijdam, N.; Anagnostopoulos, M.; Katsikas, S.; Konstantas, D. Towards automated threat-based risk assessment for cyber security in smarthomes. In Proceedings of the European Conference on Information Warfare and Security, ECCWS, Coimbra, Portugal, 4–5 July 2019; pp. 839–844. [Google Scholar]
- Spathoulas, G.; Collen, A.; Pandey, P.; Nijdam, N.A.; Katsikas, S.; Kouzinopoulos, C.S.; Moussa, M.B.; Giannoutakis, K.M.; Votis, K.; Tzovaras, D. Towards Reliable Integrity in Blacklisting: Facing Malicious IPs in GHOST Smart Contracts. In Proceedings of the 2018 IEEE (SMC) International Conference on Innovations in Intelligent Systems and Applications, INISTA 2018, Thessaloniki, Greece, 3–5 July 2018; pp. 1–8. [Google Scholar] [CrossRef]
- Anagnostopoulos, M.; Spathoulas, G.; Viaño, B.; Augusto-Gonzalez, J. Tracing Your Smart-Home Devices Conversations: A Real World IoT Traffic Data-Set. Sensors 2020, 20, 6600. [Google Scholar] [CrossRef] [PubMed]
Publisher’s Note: MDPI stays neutral with regard to jurisdictional claims in published maps and institutional affiliations. |
© 2022 by the authors. Licensee MDPI, Basel, Switzerland. This article is an open access article distributed under the terms and conditions of the Creative Commons Attribution (CC BY) license (https://creativecommons.org/licenses/by/4.0/).