Abstract
For the purpose of attaining a high degree of freedom (DOF) for the direction of arrival (DOA) estimations in radar technology, coprime sensor arrays (CSAs) are evaluated in this paper. In addition, the global and local minima of extremely non-linear functions are investigated, aiming to improve DOF. The optimization features of the cuckoo search (CS) algorithm are utilized for DOA estimation of far-field sources in a low signal-to-noise ratio (SNR) environment. The analytical approach of the proposed CSAs, CS and global and local minima in terms of cumulative distribution function (CDF), fitness function and SNR for DOA accuracy are presented. The parameters like root mean square error (RMSE) for frequency distribution, RMSE variability analysis, estimation accuracy, RMSE for CDF, robustness against snapshots and noise and RMSE for Monte Carlo simulation runs are explored for proposed model performance estimation. In conclusion, the proposed DOA estimation in radar technology through CS and CSA achievements are contrasted with existing tools such as particle swarm optimization (PSO).
1. Introduction
In radar technology, our prime concern is to detect the target through its parameters such as the direction of arrival, amplitude, frequency, velocity and scattering behaviour. In these parameters, DOA estimation is a key parameter that plays a vital role in electromagnetic spectrum sensing to locate the target. It is also applied in vast variety of applications such as sonar [1], wireless communication [2], satellite communication [3], medical applications [4], etc. In most of the literature, two famous array structures are implemented for DOA estimation [5,6,7]. One of them is uniform linear arrays [8,9,10] and the second one is sparse arrays [11,12]. A lot of research has been done on uniform linear arrays (ULA). ULA is one of the simplest forms of antenna array structures, but it can estimate only targets by using N antenna elements through subspace-based methods. In radar antenna array signal processing, we want to enhance freedom without increasing hardware costs. Nevertheless, sparse arrays can resolve more targets than several antenna elements. Therefore, sparse arrays have become a scorching area of research since the last decade in order to estimate DOA with an enhanced degree of freedom (DOF) precisely. In the perspective of radar technology, DOF is defined as the number of sources that can be resolved with a given number of antenna elements. Minimum redundancy array (MRA) [13,14], nested arrays (NA) [15] and coprime sensor arrays (CSA) [16] are the most prominent types of non-uniform linear arrays that provide higher degree of freedom. Moffet introduced MRA in 1968 [17] to improve the DOF, but this array structure has no closed-form expression to identify the location of antenna elements. Later on, in [18], nested array structure was proposed by PPal and PP Vaidyanathan in 2010 and this array structure is the combination of dense and sparse uniform linear sub-arrays. On the one hand, hole-free difference co-array and DOF are the features of this array structure, but on the other hand, severe mutual coupling occurs in this array structure due to the part of dense sub-array. This mutual coupling is the primary cause of performance degradation of nested arrays in DOA estimation. Compared with these arrays structures, the coprime array structure has less mutual coupling due to its sparse array structure and higher DOF. CSA consists of two ULAs having M and N antenna elements with and inter-element spacing, respectively, and DOF. CSA has been become more attractive for researchers due to its less mutual coupling and higher achievable DOF [19]. Therefore, this paper addressed the coprime array structure for far-field sources estimation to enhance the DOF in radar antenna array signal processing.
After receiving the signal through antenna arrays, estimation algorithms play an important role in array signal processing for parameters estimation. In most of the literature, the two most dominant algorithms are used in array signal processing for parameter estimation. One of them is deterministic algorithms, and the other is the heuristic approach. Deterministic algorithms are mostly sub-space based methods like multiple signal classification (MUSIC) [20,21], signal parameter via rotational invariance Technique (ESPRIT) [22], root MUSIC [23], weighted subspace fitting (WSF) [24], etc. Although these algorithms perform very well in estimation accuracy, the major issue to implementing them is computational complexity. In this modern era of technology, this issue is resolved using meta-heuristic algorithms. Nobody can deny the significance of heuristic techniques such as genetic algorithm (GA) [25], particle swarm optimization (PSO) [26], differential evolution (DE) [27], simulated annealing (SA) [28], ant colony optimization (ACO) [29], bee colony optimization (BCO) [30], flower pollination algorithm (FPA) [31], cuckoo search algorithm [32] and so on. These techniques are population based, and these methods are efficient and robust. Recently in the research community, cuckoo search has become more popular due to its easy implementation and few parameters required to execute the algorithm compared with other heuristic approaches.
Following our literature review, no one has implemented the cuckoo search technique through coprime arrays for DOA estimation. Therefore, a novel approach has been executed by employing coprime antenna arrays in radar technology with an intelligent metaheuristic optimization algorithm. The structure of the paper is organized as follows. Section 2 discusses the analytical representation of the proposed CSAs, including fitness function. The presented methodology is investigated in Section 3 with the currently used PSO system. Section 4 contains the material related to results and discussion of the simulation analysis of the proposed CSA technique for DOA. The conclusion of the presented framework is summarized in Section 5.
2. Analytical Representation
2.1. Coprime Sensor Array Structure
In this part, the formation of the coprime array structure is discussed briefly, we then perform the derivation of the received signal. The coprime array comprises two coprime uniform linear arrays with P and Q antenna elements as shown in Figure 1. The inter-element distance between two consecutive antennas of the first sub-array is , and in the second sub-array is , which is more significant than in both arrays. By merging these two sub-arrays, we obtain the coprime antenna array with the shared the first antenna element. P and Q are coprime integers, d is equal to the wavelength of the received signal and for the sake of generality. and shows the indexes of sub-array 1 and 2 while demonstrates the positions of the coprime array. This coprime array consists of antenna elements having non-uniform inter-element distance among them, as depicted in the following equations.
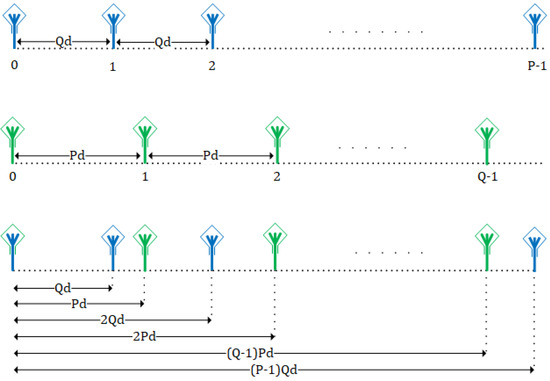
Figure 1.
Generalized coprime antenna array structure.
2.2. Signal Modelling
In this module, we will establish the signal model for L narrowband uncorrelated unknown sources. Figure 1 shows each parameter of CSA for physical location and estimated as:
The DOA of these L uncorrelated signals are summarized in vector
Accordingly, the received signal of L uncorrelated sources of coprime array is specified in Equation (6).
where
In Equation (6), is the complex iid and AWGN with variance and zero mean.
Taking the expectation of the output signals the computation of covariance matrix can be performed in terms of coprime array framework, which are defined as
where is the vectorization of the covariance matrix and can be further expanded as
The covariance matrix amplitude of the output signal is denoted by and written as
With the help of the virtual uniform linear array can be computed which is described as
where B is the Kronecker product and the elements in B are expressed in the form of following equation
In Matlab, the command is used for vectorization. After performing vectorization of , this matrix will become a column vector having the dimension . Furthermore, this z vector will be sorted out in accordance with the exponent term of the received signal and presented as
The locations of these virtual ULA elements are presented as
Our prime concern is the continuous part of vULA of CSA in this research work. The continuous part of vULA causes an enhancement in the degree of freedom. Moreover, this DOF is directly proportional to the length of continuous vULA.
2.3. Fitness Function
In heuristically optimization algorithms, the fitness function plays a vital role. A fitness function is a fundamental tool for evaluating the population and provides the difference between actual and estimated angles. Based on this difference, algorithms perform their estimation, and the equation for the fitness function is written in Equation (17).
The nests and particles are analyzed for the fitness function’s proposed setup.
3. Proposed Methodology
3.1. Cuckoo Search Algorithm
This algorithm is developed in combination with levy flights. Due to obtained accurate optimal solution, the performance of cuckoo search is much better than other meta-heuristic approaches. The direction of arrival estimation is the unconstrained optimization problem, and it is minimized by implementing a cuckoo search algorithm through the following function
is the fitness function and is also known as the objective function while and are actual and estimated angles respectively and these are optimized by evaluating the objective function through the cuckoo search algorithm. The evolution process of the cuckoo search algorithm is elaborated in Algorithm 1, and the flow diagram of cuckoo search is depicted in Figure 2.
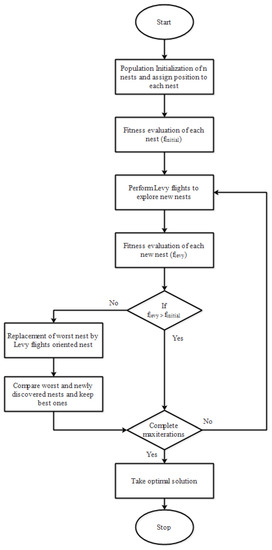
Figure 2.
The description of cuckoo search algorithm.
| Algorithm 1 Pseudocode: cuckoo search algorithm |
| Begin |
| Generate initial population |
| While or (stopping criterion) |
| Cuckoo is picked randomly by level flights to analyze fitness |
| Choose a nest randomly |
| If |
| Old nest is abandoned and new nest will be built |
| Keep the best solution |
| Find the current best |
| End |
| Post process results and visualizations |
| End |
3.2. Particle Swarm Optimization
PSO is a nature inspired optimization technique based on the movement and intelligence of the swarm. In PSO, each particle continues to update its position under the previous experience and neighbours. A particle is composed of three vectors. The first is the x-vector, which records the current situation. The second one is the p-vector which records the location of the best solution in search space, and the third one is v-vector which contains the gradient for which particles will travel if undisturbed. The working of PSO can be explained in the following four steps as illustrated in Figure 3.
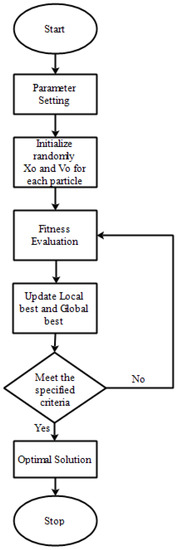
Figure 3.
The explanation of particle swarm optimization in terms of a flow chart.
Step 1: Initialization: Random particles initialize the PSO algorithm, and each particle is a solution. Each particle searches for the optimum value by updating the generation. In each iteration, every particle is updated. After finding the best value, the particle updates its velocity and position. Particles can update their position by
Particle can update its velocity by the following equation
Step 2: Fitness investigation: The fitness size is analyzed for every particle. Choose the particle with the best fitness value.
Step 3: For each particle calculate velocity and position from Equations (1) and (2)
Step 4: Evaluate Fitness Find current best
Step 5: Update t = t + 1
Step 6: Output gbest and
The process will be repeated until the condition is met.
4. Results, Discussions and Achievements
In prior studies, uniform linear arrays and plenty of heuristic algorithms were used for DOA estimation. Still, in this work, we implemented a novel approach of the coprime array with a cuckoo search algorithm for DOA estimation. In this part of the paper, a series of experimental simulations are conducted to confirm the performance of the proposed scheme for DOA estimation. In our first experiment, we analyze the estimation accuracy of the proposed algorithm by comparing the results with PSO. After this analysis, the performance of root means square error (RMSE) by signal to noise ratio (SNR) and the number of snapshots is examined. Moreover, variation analysis, cumulative distribution function analysis and histogram analysis are also performed. The experimental analyses are categorized into three portions, six, nine and twelve sources estimations to validate our results and DOF.
4.1. Estimation Accuracy
Results for estimation accuracy of CS and PSO are obtained by setting different parameters as a signal-to-noise ratio, number of sources and their locations. The analysis is performed based on both algorithms’ best, mean and worst estimations. In case of six sources, results for estimation accuracy of CS and PSO are quite well at 0 dB, −5 dB and −10 dB as shown in Table 1, Table 2 and Table 3.

Table 1.
Calculation of accuracy for six targets at 0 dB SNR.
Table 2.
Calculation of accuracy for six targets at −5 dB SNR.
Table 3.
Calculation of accuracy for six targets at −10 dB SNR.
In the case of the nine sources estimation, the performance of CS is much better than PSO at 0 dB and −5 dB. At −10 dB performance of CS is slightly degraded but even then results are much better as compared to PSO as mentioned in Table 4, Table 5 and Table 6.
Table 4.
Calculation of accuracy for nine targets at 0 dB SNR.
Table 5.
Calculation of accuracy for nine targets at −5 dB SNR.
Table 6.
Calculation of accuracy for nine targets at −10 dB SNR.
In the case of the twelve sources estimation, CS again performed well, whereas PSO could not handle this scenario as well as CS. Performance of CS at 0 dB, −5 dB and −10 dB is remarkable in all three cases. Results obtained from CS and PSO are illustrated in Table 7, Table 8 and Table 9.
Table 7.
Calculation of accuracy for twelve targets at 0 dB SNR.
Table 8.
Calculation of accuracy for twelve targets at −5 dB SNR.
Table 9.
Calculation of accuracy for twelve targets at −10 dB SNR.
4.2. Overview of Robustness against Noise
Robustness against noise is considered a powerful tool for evaluating the outcomes of parameters estimation algorithms in radar array signal processing. In this analysis, the value of RMSE is monitored at different SNR levels. Therefore, RMSE is called a performance indicator in this analysis. In Figure 4, CS shows much robustness against noise than PSO. When SNR is increased from −15 dB to −5 dB, the value of RMSE decreases abruptly in the case of six sources. In the scenario of nine sources estimation, CS performs much better than PSO, as shown in Figure 5. Similarly, in the case of twelve sources, again, CS provides better results than PSO, as illustrated in Figure 6. In all of the instances, CS performs much better than PSO for the direction of arrival estimation.
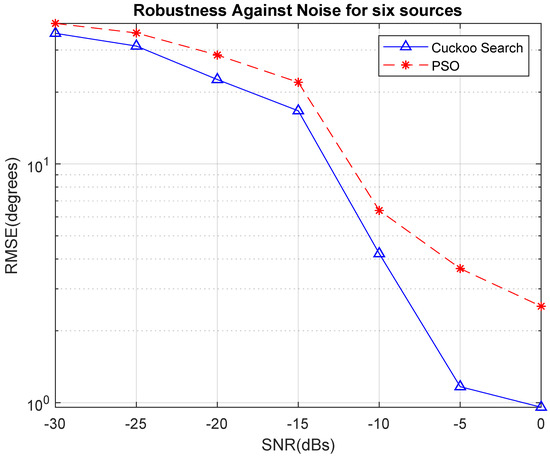
Figure 4.
Estimation of robustness using six sources.
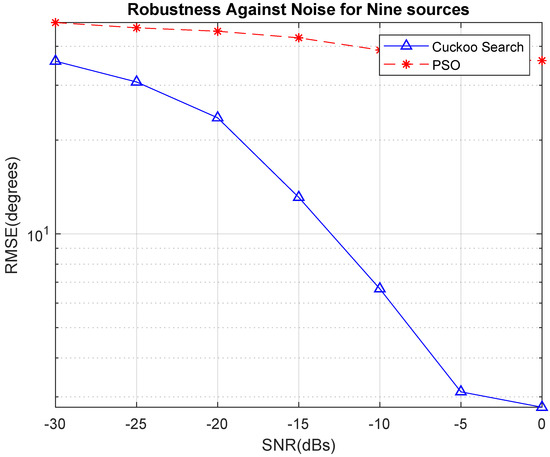
Figure 5.
Robustness against noise for nine sources.
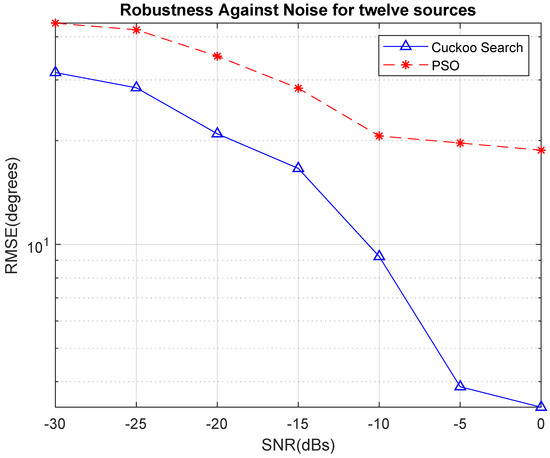
Figure 6.
Robustness against noise for twelve sources.
4.3. RMSE Analysis against Multiple Snapshots
In this analysis, we investigate the value of RMSE against multiple snapshots. Therefore, this analysis is also known as robustness against snapshots. In Figure 7, we examine that value of RMSE of CS is decreasing as the number of snapshots increases as compared to PSO. In the region of 0 to 100 snapshots, RMSE is falling off rapidly for both optimization schemes, and the overall performance of CS is better than PSO. In the scenario of nine and twelve targets estimation, the version of CS is better than PSO. Therefore, the required degree of freedom is achieved using CS, as shown in Figure 8 and Figure 9.
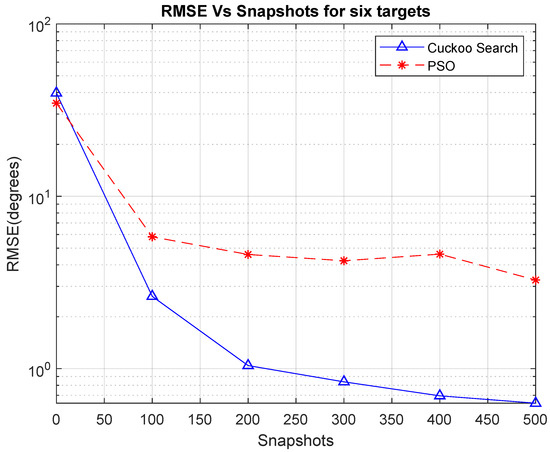
Figure 7.
Estimation of robustness using six sources in terms of snapshots.
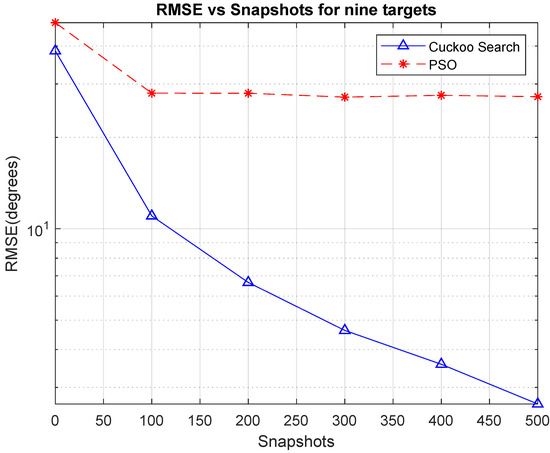
Figure 8.
Estimation of robustness using nine sources in terms of snapshots.
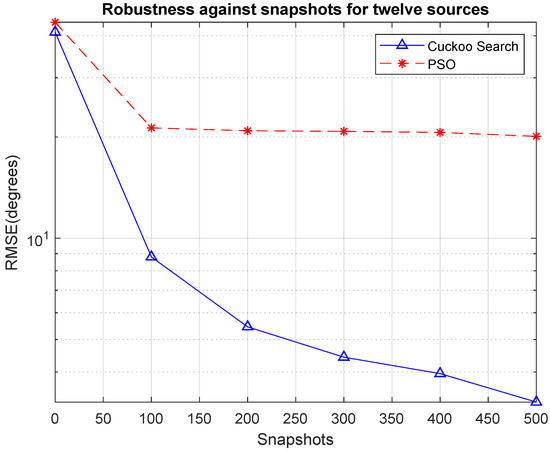
Figure 9.
Estimation of robustness using twelve sources in terms of snapshots.
4.4. Variation Analysis of RMSE
Variation analysis of RMSE is one of the popular tools to express the distribution of error concerning ,, min and max values of given data. These values are distinguished using outlier, where the performance of estimation algorithm can be easily identified of used parameters. The performance of proposed CS and PSO are compared in Figure 10 for maximum RMSE of FPA using 40, 55 and 60 at 0 dB, −5 dB and −10 dB, respectively. The result elaborates the outcomes of FPA against the current PSO system.
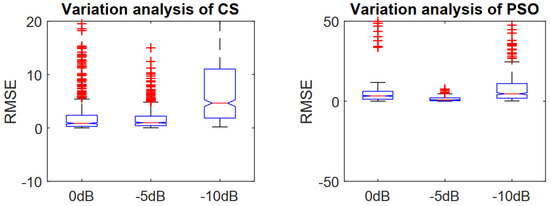
Figure 10.
Variation analysis of CS and PSO by estimating six sources.
As for nine targets, the RMSE of FPA has less expansion than PSO at 0, −5 and 10 dB as mentioned in Figure 11. Similar performance of FPA as compared to PSO can be seen in Figure 12 at 0, −5 and −10 dB.
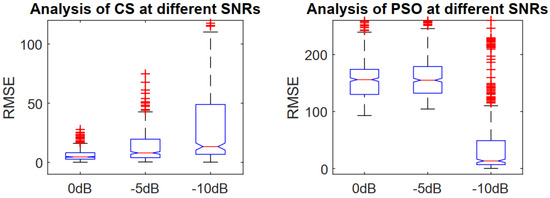
Figure 11.
Variation analysis of CS and PSO by estimating nine sources.
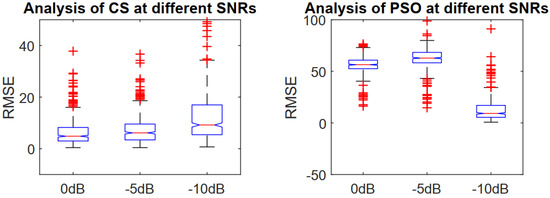
Figure 12.
Variation analysis of CS and PSO by estimating twelve sources.
4.5. Cumulative Distribution Function of RMSE
The cumulative distribution function belongs to the family of non-decreasing functions. This function shows the steadiness and failure of the optimization techniques based on Monte Carlo simulation runs. In Figure 13, at 0 dB, RMSE occurred after 75% runs in the case of CS optimization, and RMSE occurred at 30% of Monte Carlo simulation runs of PSO optimization. At −5 dB, RMSE occurred after 50% Monte Carlo simulation runs in both algorithms. RMSE rises in CS algorithm after 60% of Monte Carlo simulation runs, and in PSO algorithm, it raised after 40% of Monte Carlo simulation tuns. At −10 dB, RMSE occurred at 40% of Monte Carlo simulation runs, but an increase in RMSE is more rapid in PSO than CS. So the overall performance of CS is strongly preferable concerning PSO in the case of six sources estimation.
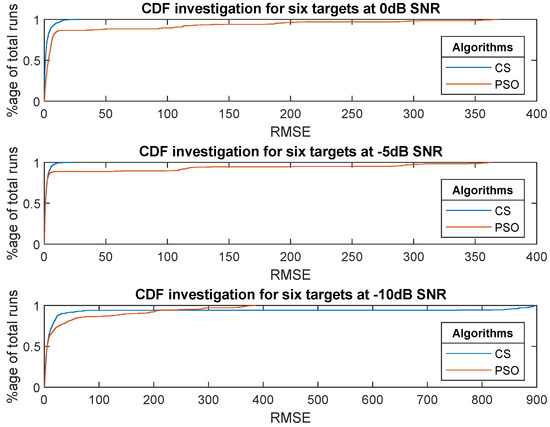
Figure 13.
RMSE investigation in terms of CDF using six targets for various values of SNR.
In the case of nine and twelve sources estimation, the performance of CS is significantly better than PSO, as shown in Figure 14 and Figure 15. We have successfully achieved the maximum DOF of coprime arrays up to by estimating twelve sources through the CS algorithm.
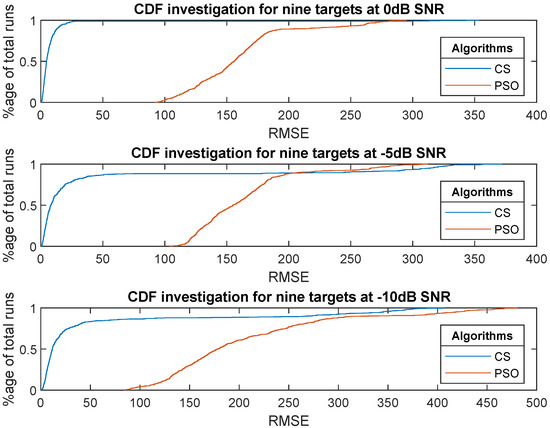
Figure 14.
RMSE investigation in terms of CDF using nine targets for various values of SNR.
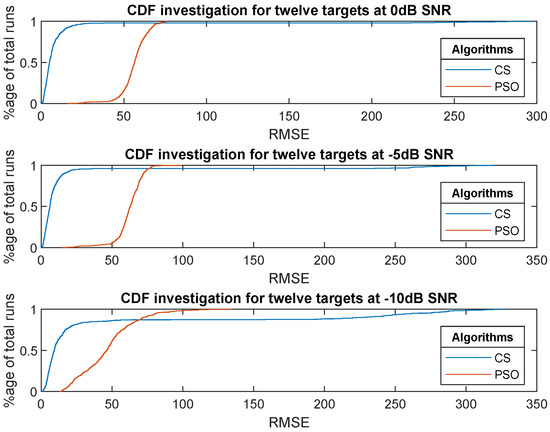
Figure 15.
RMSE investigation in terms of CDF using twelve targets for various values of SNR.
4.6. Histogram Analysis of RMSE
Histogram analysis shows how much error occurred against the different Monte Carlo simulation runs. By this analysis, we evaluate the performance of optimization schemes. In histogram analysis, bars are in the form of continuous grouping. In the case of six sources estimation, RMSE of CS and PSO is very good at 0 dB, −5 dB and −10 dB SNR over the 500 iterations. Figure 16 explored the analysis for nine targets in terms of RMSE and compared the outcomes among proposed CS and PSO, where the performance of CS is more efficient than PSO. Furthermore, the spread of RMSE at 0, −5 and 10 dB is analyzed for PSO using 500 iterations as discussed in Figure 17 and Figure 18.
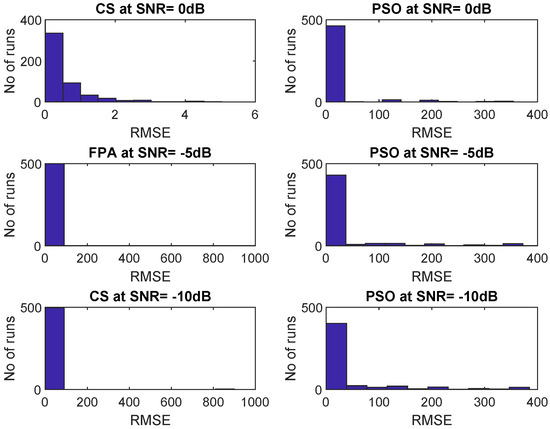
Figure 16.
Correlation of proposed CS and PSO models based on RMSE using six targets.
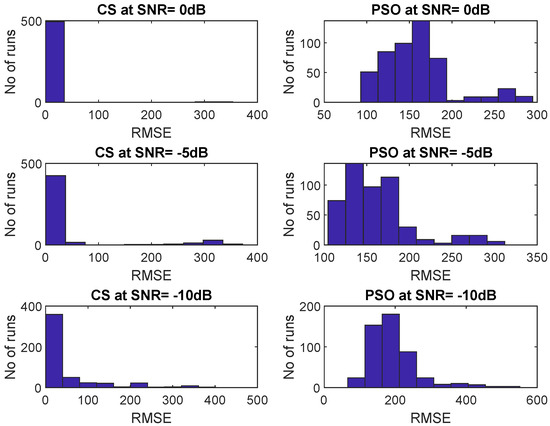
Figure 17.
Correlation of proposed CS and PSO models based on RMSE using nine targets.
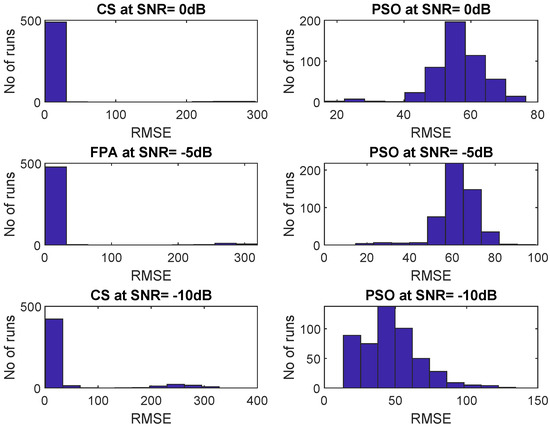
Figure 18.
Correlation of proposed CS and PSO models based on RMSE using twelve targets.
5. Conclusions
This paper estimates the DOA of electromagnetic waves for far-field sources by implementing coprime arrays through a cuckoo search algorithm. We have achieved maximum freedom in a low SNR environment using metaheuristic algorithms while the performance of deterministic algorithms is degraded at a low SNR regime. Nevertheless, cuckoo search provides better resolution and higher DOF at low SNR. In the future, we can also estimate the frequency, amplitude and other parameters of the electromagnetic wave as per our requirement by using this methodology.
Author Contributions
Conceptualization, K.H., F.A., W.K., M.S.Q. and A.A.; methodology, M.A. (Muhammad Asif), Y.S.A., F.F.A.-H., M.A. (Mohammad Alibakhshikenari), and M.D.; software, K.H., F.A. and M.S.M.; validation, F.F.A.-H., M.S.M., M.A. (Mohammad Alibakhshikenari) and M.D.; formal analysis, K.H.; investigation, M.A. (Mohammad Alibakhshikenari), M.D.; resources, M.A. (Muhammad Asif); data curation, Y.S.A., F.F.A.-H.; writing—original draft preparation, K.H., F.A.; writing—review and editing, F.F.A.-H., A.A., M.A. (Muhammad Asif), F.A., M.S.M. M.A. (Mohammad Alibakhshikenari) and M.D.; visualization, K.H., F.A., M.A. (Mohammad Alibakhshikenari) and M.D.; supervision, K.H., F.A., M.A. (Mohammad Alibakhshikenari), M.D.; project administration, F.A., M.A. (Muhammad Asif), M.A. (Mohammad Alibakhshikenari) and M.D.; funding acquisition, M.A. (Mohammad Alibakhshikenari) and M.D. All authors have read and agreed to the published version of the manuscript.
Funding
This project has received funding from Universidad Carlos III de Madrid and the European Union’s Horizon 2020 research and innovation programme under the Marie Sklodowska-Curie Grant 801538.
Data Availability Statement
All date and research finding are included withing the manuscript.
Acknowledgments
The authors sincerely appreciate the supports from Universidad Carlos III de Madrid and the European Union’s Horizon 2020 research and innovation programme under the Marie Sklodowska-Curie Grant 801538. The authors express their gratitude to Princess Nourah bint Abdulrahman University Researchers Supporting Project (Grant No. PNURSP2022R55), Princess Nourah bint Abdulrahman University, Riyadh, Saudi Arabia.
Conflicts of Interest
The authors declare no conflict of interest.
References
- Wu, J.; Bao, C. Multiple target DOA estimation with single snapshot in sonar array. Eleventh International Conference on Signal Processing Systems. Int. Soc. Opt. Photonics 2019, 11384, 113840L. [Google Scholar]
- Wang, J.; Xu, H.; Leus, G.J.; Vandenbosch, G.A. Experimental assessment of the coarray concept for DoA estimation in wireless communications. IEEE Trans. Antennas Propag. 2018, 66, 3064–3075. [Google Scholar] [CrossRef]
- Huang, L.; Lu, Z.; Xiao, Z.; Ren, C.; Song, J.; Li, B. Suppression of Jammer Multipath in GNSS Antenna Array Receiver. Remote Sens. 2022, 14, 350. [Google Scholar] [CrossRef]
- Lehtonen, O. Medical Ultrasound Imaging Using Sparse Arrays. Master’s Thesis, Aalto Universit, Espoo, Finland, 2021. [Google Scholar]
- Zhou, C.; Shi, Z.; Gu, Y.; Shen, X. DECOM: DOA estimation with combined MUSIC for coprime array. In Proceedings of the 2013 International Conference on Wireless Communications and Signal Processing, Hangzhou, China, 24–26 October 2013; pp. 1–5. [Google Scholar]
- Guo, M.; Zhang, Y.D.; Chen, T. DOA estimation using compressed sparse array. IEEE Trans. Signal Process. 2018, 66, 4133–4146. [Google Scholar] [CrossRef]
- Qin, G.; Amin, M.G.; Zhang, Y.D. DOA estimation exploiting sparse array motions. IEEE Trans. Signal Process. 2019, 67, 3013–3027. [Google Scholar] [CrossRef]
- Wajid, M.; Kumar, B.; Goel, A.; Kumar, A.; Bahl, R. Direction of arrival estimation with uniform linear array based on recurrent neural network. In Proceedings of the 2019 5th International Conference on Signal Processing, Computing and Control (ISPCC), Solan, India 10–12 October 2019; pp. 361–365. [Google Scholar]
- Wu, H.; Shen, Q.; Liu, W.; Cui, W. Underdetermined low-complexity wideband DOA estimation with uniform linear arrays. In Proceedings of the 2020 IEEE 11th Sensor Array and Multichannel Signal Processing Workshop (SAM), Hangzhou, China, 8–11 June 2020; pp. 1–5. [Google Scholar]
- Hammed, K.; Ghauri, S.A.; Qamar, M.S. Biological inspired stochastic optimization technique (PSO) for DOA and amplitude estimation of antenna arrays signal processing in RADAR communication system. J. Sens. 2016, 2016, 9871826. [Google Scholar] [CrossRef]
- Papageorgiou, G.K.; Sellathurai, M. Fast direction-of-arrival estimation of multiple targets using deep learning and sparse arrays. In Proceedings of the ICASSP 2020-2020 IEEE International Conference on Acoustics, Speech and Signal Processing (ICASSP), Barcelona, Spain, 4–8 May 2020; pp. 4632–4636. [Google Scholar]
- Hameed, K.; Tu, S.; Ahmed, N.; Khan, W.; Armghan, A.; Alenezi, F.; Alnaim, N.; Qamar, M.S.; Basit, A.; Ali, F. DOA Estimation in Low SNR Environment through Coprime Antenna Arrays: An Innovative Approach by Applying Flower Pollination Algorithm. Appl. Sci. 2021, 11, 7985. [Google Scholar] [CrossRef]
- Geng, W.; Changxiao, C.; Yi, H.; Mingyue, F.; Jiang, Y.; Zhao, R. 2-D DOA Estimation Based on Rectangular Generalized Minimum Redundancy Array via Partial Grid Covariance Vector Sparse Reconstruction. In Proceedings of the 2021 6th International Conference on Intelligent Computing and Signal Processing (ICSP), Xi’an, China, 9–11 April 2021; pp. 859–864. [Google Scholar]
- Wang, G.; He, M.; Yu, C.; Han, J.; Chen, C. Fast Underdetermined DOA Estimation Based on Generalized MRA via Original Covariance Vector Sparse Reconstruction. IEEE Access 2021, 9, 66805–66815. [Google Scholar] [CrossRef]
- Zheng, Z.; Yang, C.; Wang, W.Q.; So, H.C. Robust DOA estimation against mutual coupling with nested array. IEEE Signal Process. Lett. 2020, 27, 1360–1364. [Google Scholar] [CrossRef]
- Zhou, C.; Gu, Y.; Shi, Z.; Haardt, M. Direction-of-arrival estimation for coprime arrays via coarray correlation reconstruction: A one-bit perspective. In Proceedings of the 2020 IEEE 11th Sensor Array and Multichannel Signal Processing Workshop (SAM), Hangzhou, China, 8–11 June 2020; pp. 1–4. [Google Scholar]
- Moffet, A. Minimum-redundancy linear arrays. IEEE Trans. Antennas Propag. 1968, 16, 172–175. [Google Scholar] [CrossRef]
- Pal, P.; Vaidyanathan, P.P. Nested arrays: A novel approach to array processing with enhanced degrees of freedom. IEEE Trans. Signal Process. 2010, 58, 4167–4181. [Google Scholar] [CrossRef]
- Zhou, C.; Zhou, J. Direction-of-arrival estimation with coarray ESPRIT for coprime array. Sensors 2017, 17, 1779. [Google Scholar] [CrossRef] [PubMed]
- Qamar, M.S.; Tu, S.; Ali, F.; Armghan, A.; Munir, M.F.; Alenezi, F.; Muhammad, F.; Ali, A.; Alnaim, N. Improvement of Traveling Salesman Problem Solution Using Hybrid Algorithm Based on Best-Worst Ant System and Particle Swarm Optimization. Appl. Sci. 2021, 11, 4780. [Google Scholar] [CrossRef]
- Liu, A.; Yang, D.; Shi, S.; Zhu, Z.; Li, Y. Augmented subspace MUSIC method for DOA estimation using acoustic vector sensor array. IET Radar Sonar Navig. 2019, 13, 969–975. [Google Scholar] [CrossRef]
- Vikas, B.; Vakula, D. Performance comparision of MUSIC and ESPRIT algorithms in presence of coherent signals for DoA estimation. In Proceedings of the 2017 International Conference of Electronics, Communication and Aerospace Technology (ICECA), Coimbatore, India, 20–22 April 2017; Volume 2, pp. 403–405. [Google Scholar]
- Zhang, D.; Zhang, Y.; Zheng, G.; Feng, C.; Tang, J. Improved DOA estimation algorithm for co-prime linear arrays using root-MUSIC algorithm. Electron. Lett. 2017, 53, 1277–1279. [Google Scholar] [CrossRef]
- Yao, B.; Zhang, W.; Wu, Q. Weighted subspace fitting for two-dimension DOA estimation in massive MIMO systems. IEEE Access 2017, 5, 14020–14027. [Google Scholar] [CrossRef]
- Ahmed, N.; Wang, H.; Raja, M.A.Z.; Ali, W.; Zaman, F.; Khan, W.U.; He, Y. Performance analysis of efficient computing techniques for direction of arrival estimation of underwater multi targets. IEEE Access 2021, 9, 33284–33298. [Google Scholar] [CrossRef]
- Chang, J.C. DOA Estimation for local scattered cdma signals by particle swarm optimization. Sensors 2012, 12, 3228–3242. [Google Scholar] [CrossRef]
- Sheikh, Y.A.; Zaman, F.; Qureshi, I.; Atique-ur Rehman, M. Amplitude and direction of arrival estimation using differential evolution. In Proceedings of the 2012 International Conference on Emerging Technologies, Islamabad, Pakistan, 8–9 October 2012; pp. 1–4. [Google Scholar]
- Jia, W.; Liu, S. Application of simulated annealing genetic algorithm in DOA estimation technique. Comput. Eng. Appl. 2014, 50, 266–270. [Google Scholar]
- Mao, L.; Zhang, Q.; Huang, J.; Han, J. Maximum likelihood direction of arrival estimator based on modified ant colony optimization. In Proceedings of the 2013 IEEE International Conference of IEEE Region 10 (TENCON 2013), Xi’an, China, 22–25 October 2013; pp. 1–4. [Google Scholar]
- Parsa, S.A.; Zadeh, A.E.; Kazemitabar, S.J. A Novel Modified Artificial Bee Colony for DOA Estimation. Int. J. Sens. Wirel. Commun. Control 2021, 11, 96–106. [Google Scholar] [CrossRef]
- Akbar, S.; Raja, M.A.Z.; Chaudhary, N.I.; Zaman, F.; Alquhayz, H. Flower Pollination Heuristics for Parameter Estimation of Electromagnetic Plane Waves. CMC Comput. Mater. Contin. 2021, 68, 2529–2543. [Google Scholar] [CrossRef]
- Gandomi, A.H.; Yang, X.S.; Alavi, A.H. Cuckoo search algorithm: A metaheuristic approach to solve structural optimization problems. Eng. Comput. 2013, 29, 17–35. [Google Scholar] [CrossRef]


Publisher’s Note: MDPI stays neutral with regard to jurisdictional claims in published maps and institutional affiliations. |
© 2022 by the authors. Licensee MDPI, Basel, Switzerland. This article is an open access article distributed under the terms and conditions of the Creative Commons Attribution (CC BY) license (https://creativecommons.org/licenses/by/4.0/).