1. Introduction
Close-range localization has gained significant attention for applications in consumer electronics, such as smart shelf [
1], asset auto-management [
2,
3], autonomous vehicle positioning [
4], robot navigation [
5,
6,
7,
8], and tracking [
9,
10]. Technologies using laser, sonar, infrared, or visual sensors have been developed. However, these sensors generally suffer from poor accuracy in various harsh environments (e.g., fog, smoke, and darkness) [
11,
12]. Recently, radio frequency (RF) positioning technology has attracted widespread attention, owing to its low cost, light weight, and lack of sensitivity to optical environments [
4,
7,
13,
14]. An RF positioning system usually consists of tags (target antennas) that transmit signals containing location information and anchors (measuring antennas) that estimate the position of the tags [
15]. Various methods—received signal strength (RSS), time of arrival (TOA), time difference of arrival (TDOA), and phase difference of arrival (PDOA)—have been used to explore different types of information from the received signals.
The RSS-based technique can be used to estimate the positions of targets under non-line-of-sight conditions. Using the multipath attenuation of signals, theoretical and experimental models can be established to estimate the distance of targets from a set of measuring units. The positioning error of RSS-based techniques is typically in the order of 1 m [
7,
16,
17,
18]. However, this technique requires a large working area and pre-correction; therefore, it is difficult to build a universal model, owing to the complicated propagation environment.
TOA-based systems calculate the range between the target and the measuring unit by recording the travel time of line-of-sight signals. A minimum of three measuring units are required to determine the target position. The standard error of TOA measurements in open areas is approximately 1 m [
19]. Similar to the RSS technique, [
20,
21] recorded TOAs of the shadowed links as location fingerprints for localization achieve a precision of approximately 0.9 m. However, the TOA-based systems require all the targets and measuring units to be precisely synchronized and a timestamp labeled in the transmitting signal for the measuring units to discern the propagation time.
The TDOA measures the time difference of the signal arriving at multiple measuring units. The measured TDOAs are then converted into the angle-of-arrival (AOA) information for localization. Ref. [
22] employed TDOA in indoor localization and achieved an accuracy within a 1 m range with a probability of approximately 99%. A 3D TDOA-based positioning system [
23] placed four measuring units at four corners to achieve a precision of 0.3 m. However, similar to TOA, TDOA requires a precise time reference between the measuring units.
PDOA-based localization is similar to the TDOA method; however, it is based on phase measurements and can achieve high location precision. Ref. [
24] used three antenna arrays to produce three AOAs that intersect at the target position, achieving a mean positioning error of 0.21 m in an area of 3 × 3 m. For indoor autonomous vehicle positioning, Ref. [
4] combined an odometry sensor with an RFID reader and fixed tags on the ceiling and realized an average positioning error of approximately 4 cm in an area of 5 m
2. PDOA-based localization has a higher location accuracy compared to other technologies. However, it requires a tradeoff between the direction-finding accuracy and the phase ambiguity, depending on the antenna baseline length. Resolving this ambiguity usually requires more than two anchor antennas, which increases the system complexity and entails the use of precise systematic calibration [
25]. A rotating long-baseline PDOA-base system was reported in [
26], using only two antennas at the anchor side but still achieving high AOA precision. However, its size and cost prohibited its application in consumer electronics.
If the location system only uses a single range or AOA estimation, the number of measuring units required in the system would be fairly large and acquire a significant amount of space. The number of measuring units can be reduced to one by combining range and AOA estimation [
4,
14,
27]. In Ref. [
28], a novel indoor localization technique was proposed that utilized physical layer information to extract the signal strength and the angle of only the direct path, successfully avoiding the effect of multipath reflections. This technique was used to localize a device when only a single access point (AP) was present. Meanwhile, a system in [
29] enabled a single Wi-Fi AP to localize clients to within tens of centimeters. The system can compute sub-nanosecond time-of-flight using commodity Wi-Fi cards. By multiplying the time-of-flight by the speed of light, a MIMO AP can compute the distance between each of its antennas and the client, hence localizing it. The authors of [
30] proposed S-Phaser, an indoor localization system that uses a single Wi-Fi AP to locate terminals. S-Phaser utilizes channel state information to compute the direct path length between a single AP and terminals, using a geometric positioning algorithm to determine the user’s location. S-Phaser can improve the median localization error to 1.5 m with a single Wi-Fi AP. The purpose of Ref. [
31] was to implement a novel active radar system, which employed the 802.11 fine time measurement round trip time (RTT) to calculate the ranging distance and acquired two channels of the RSS indicator to estimate the azimuthal angle. This demonstrated the real-time two-dimensional localization of Wi-Fi RTT-compatible mobile internet-of-things devices.
In practical application scenarios, the PDOA-based localization system encounters several problems, such as environmental effects [
32], coupling between antennas [
33], and polarization purity deterioration [
34]. Considering an auto-tracking system where both the tags and anchors are movable, the relative pose of the transceiver antennas changes [
35], causing inconsistencies in the polarization direction and maximum radiation direction of the transceiver antennas, which ultimately reduces the system reliability. Therefore, it is essential to eliminate the impact of the antenna pose variation on auto-tracking.
In this study, a novel PDOA-based auto-tracking system with robust location accuracy is demonstrated for low-cost and compact consumer electronics. This system is designed for a wide range of practical scenarios (e.g., an office, market, and park). The main contributions of the proposed system are as follows:
It combines the PDOA method with an odometry sensor, such that only one tag and one anchor are required for high-precision positioning.
To meet the requirement of consumer electronics, the system is designed to be compact and low-cost.
A high linear-polarization patch antenna array and a wide-beam circularly polarized (CP) antenna are utilized. This configuration provides reliable positioning performance for all DOAs, various axial rotating angles, and most maximum radiation deflection angles of the tag antenna.
The turntable is used to rotate the anchor antenna to remove the ambiguity period of 2π in the phase measurement and further improve the system’s accuracy and reliability.
The rest of this paper is organized as follows.
Section 2 introduces the concept of PDOA-based localization and the problems under consideration for the auto-tracking system. In
Section 3, different types of antennas are analyzed and compared to illustrate the effect of changing antenna poses. The design requirement for the antenna is then outlined. The proposed positioning system is also introduced in this section.
Section 4 discusses the proposed least-squares algorithm for calibration and the correlation algorithm for direction-of-arrival (DOA) estimation.
Section 5 reports the results of the antenna and operating principle of the turntable. The system configuration and tracking verification are also included in this section.
Section 6 draws some conclusions.
2. PDOA Method
DOA estimation is one of the key technologies of an ultra-wideband (UWB) system. In [
36], a new DOA estimation method was proposed based on the array cross-correlation vector model that can decrease the computational complexity of the multiple measurement vectors model. The new method can provide high detection probability while maintaining a low computational cost. The authors of [
37] suggested a novel hybrid non-uniform and linear array and proposed an efficient DOA estimation scheme that can distinguish adjacent signal sources with high accuracy. In addition, the proposed scheme tackles the problem of phase ambiguity.
Generally, the PDOA-based localization system uses the range and bearing information to locate an object.
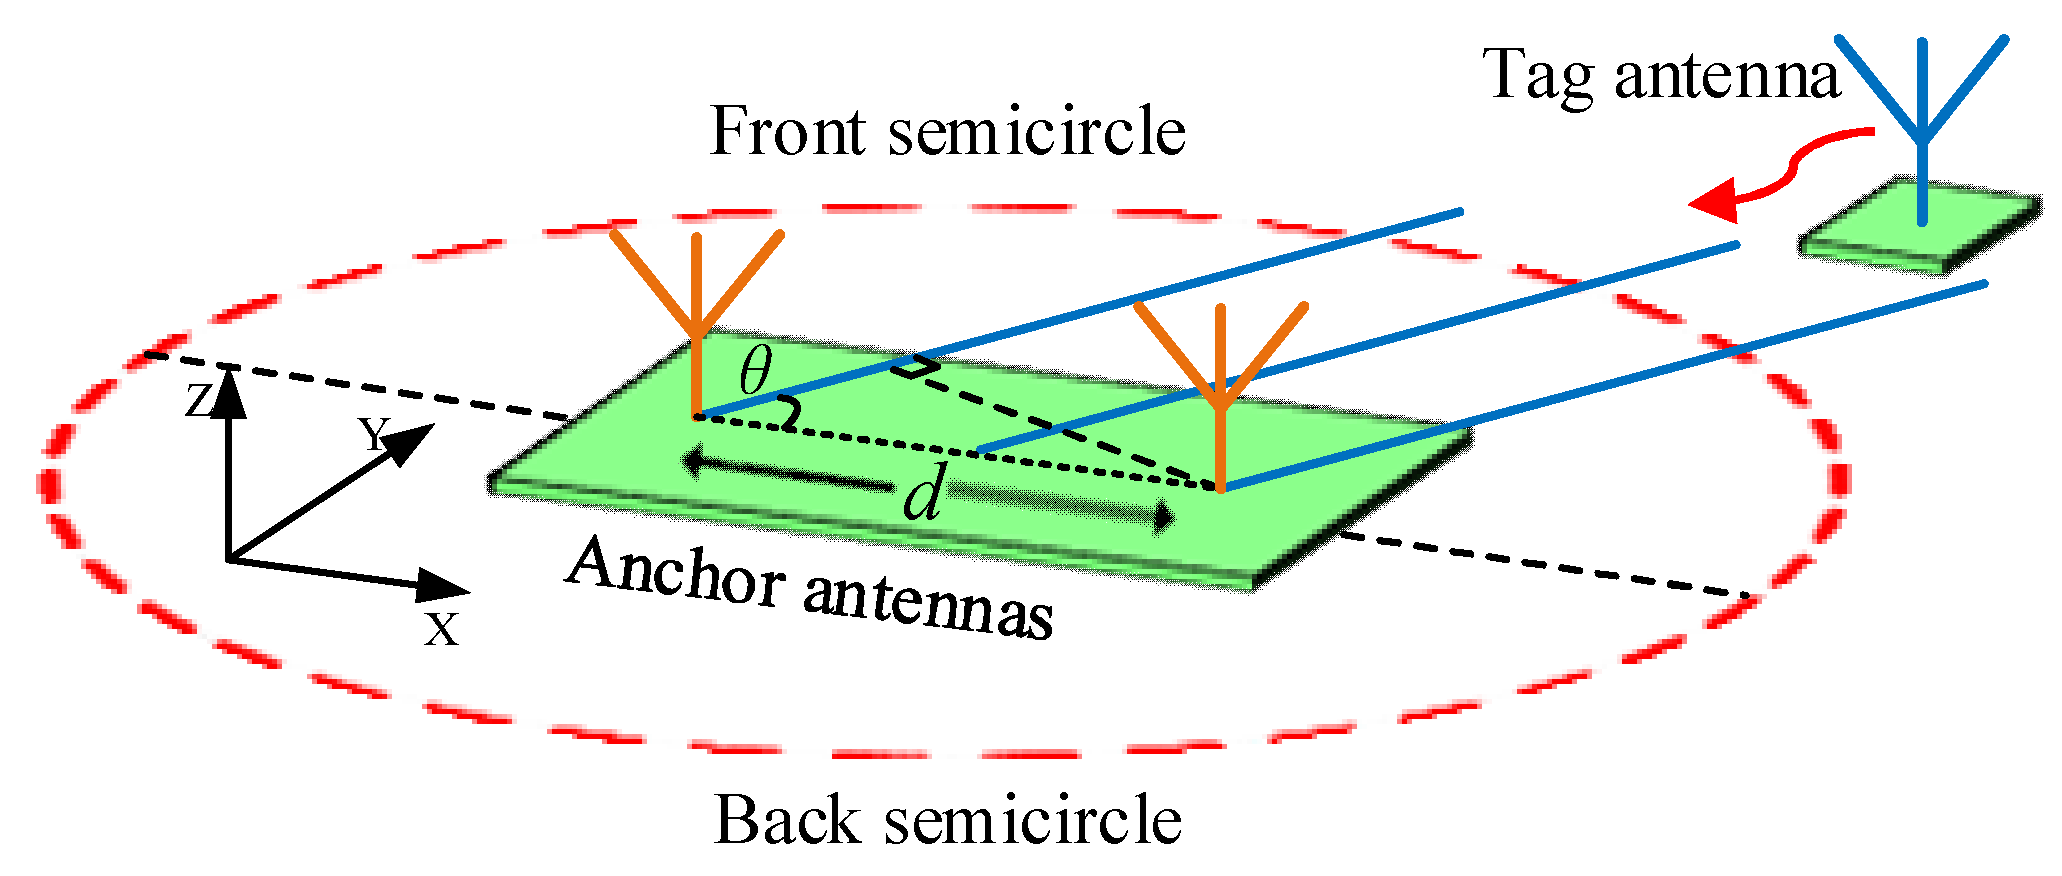
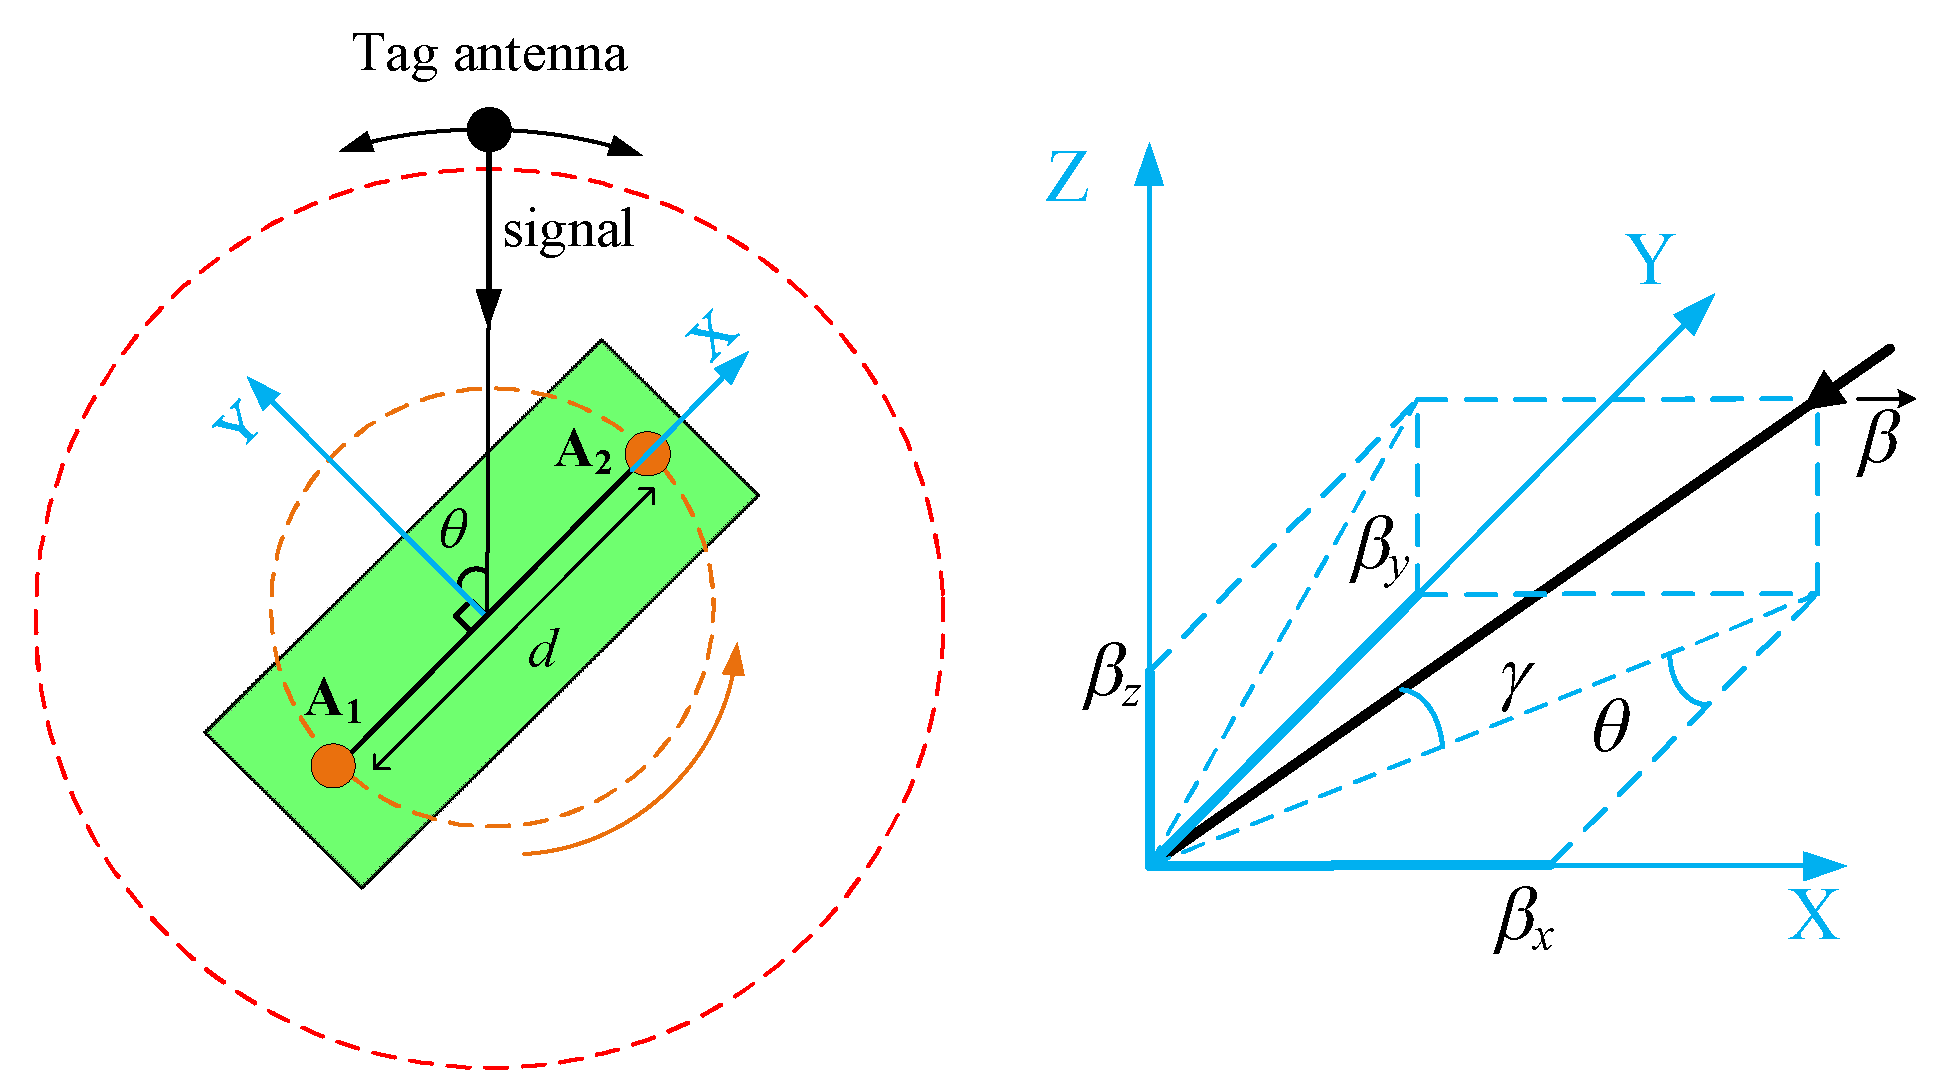
Figure 1 shows a simple configuration of the location system, involving two anchor antennas at the receiving side and a tag antenna at the transmitting side. All antennas are linearly polarized and placed in the same horizontal plane. The working principle of the system is as follows:
The tag antenna sends out a UWB signal to the anchor side.
The two anchor antennas receive the signal and extract the phase difference and perform the DOA estimation.
Because the UWB signal is a pulse in the time domain, the anchors can acquire an accurate time-of-flight (TOF) between the tag and anchor antennas, and the range between them can be calculated.
With the range and DOA information, the position of the tag antenna can be determined.
The phase difference between the two anchor antennas can be calculated using Equation (1) as follows:
where
d is the baseline distance between the two anchor antennas,
θ is the angle between the DOA and baseline, and
λ is the wavelength of the incoming wave. The output phase difference is not only obtained at a single frequency but also averaged over the entire UWB band. Thus, the errors that may occur at some frequencies are averaged out to an insignificant level.
Compared with TDOA and TOA, the PDOA-based localization system can achieve higher localization accuracy with a more compact antenna layout and fewer antennas [
20,
22,
24], rendering it less costly and more portable. Unlike GPS- or WLAN-based positioning, the PDOA-based localization system is more versatile both indoors and outdoors [
7,
38]. Furthermore, this location system can quickly locate a mobile object installed with a tag antenna and automatically track it; the typical positioning time is 100 ms. Such factors render the PDOA-based localization the most suitable for consumer electronics.
Despite these benefits, PDOA-based localization encounters problems in practical applications. In the phase measurement, the spacing between the two anchor antennas must ideally be less than λ/2 to avoid the ambiguity of 2π in phase. However, such proximity between the antennas reduces the isolation and polarization purity, introducing errors into the measured phase. Therefore, a tradeoff is required to optimize the DOA estimation accuracy. In addition, the PDOA-based DOA estimation with two anchor antennas results in two solutions, one in the front 180° semicircle and the other in the back semicircle, as illustrated in
Figure 1. This causes reverse ambiguity in the DOA estimation. Using more than two anchor antennas can solve this ambiguity at the cost of increasing the system complexity and requires a precise calibration procedure to remove phase errors.
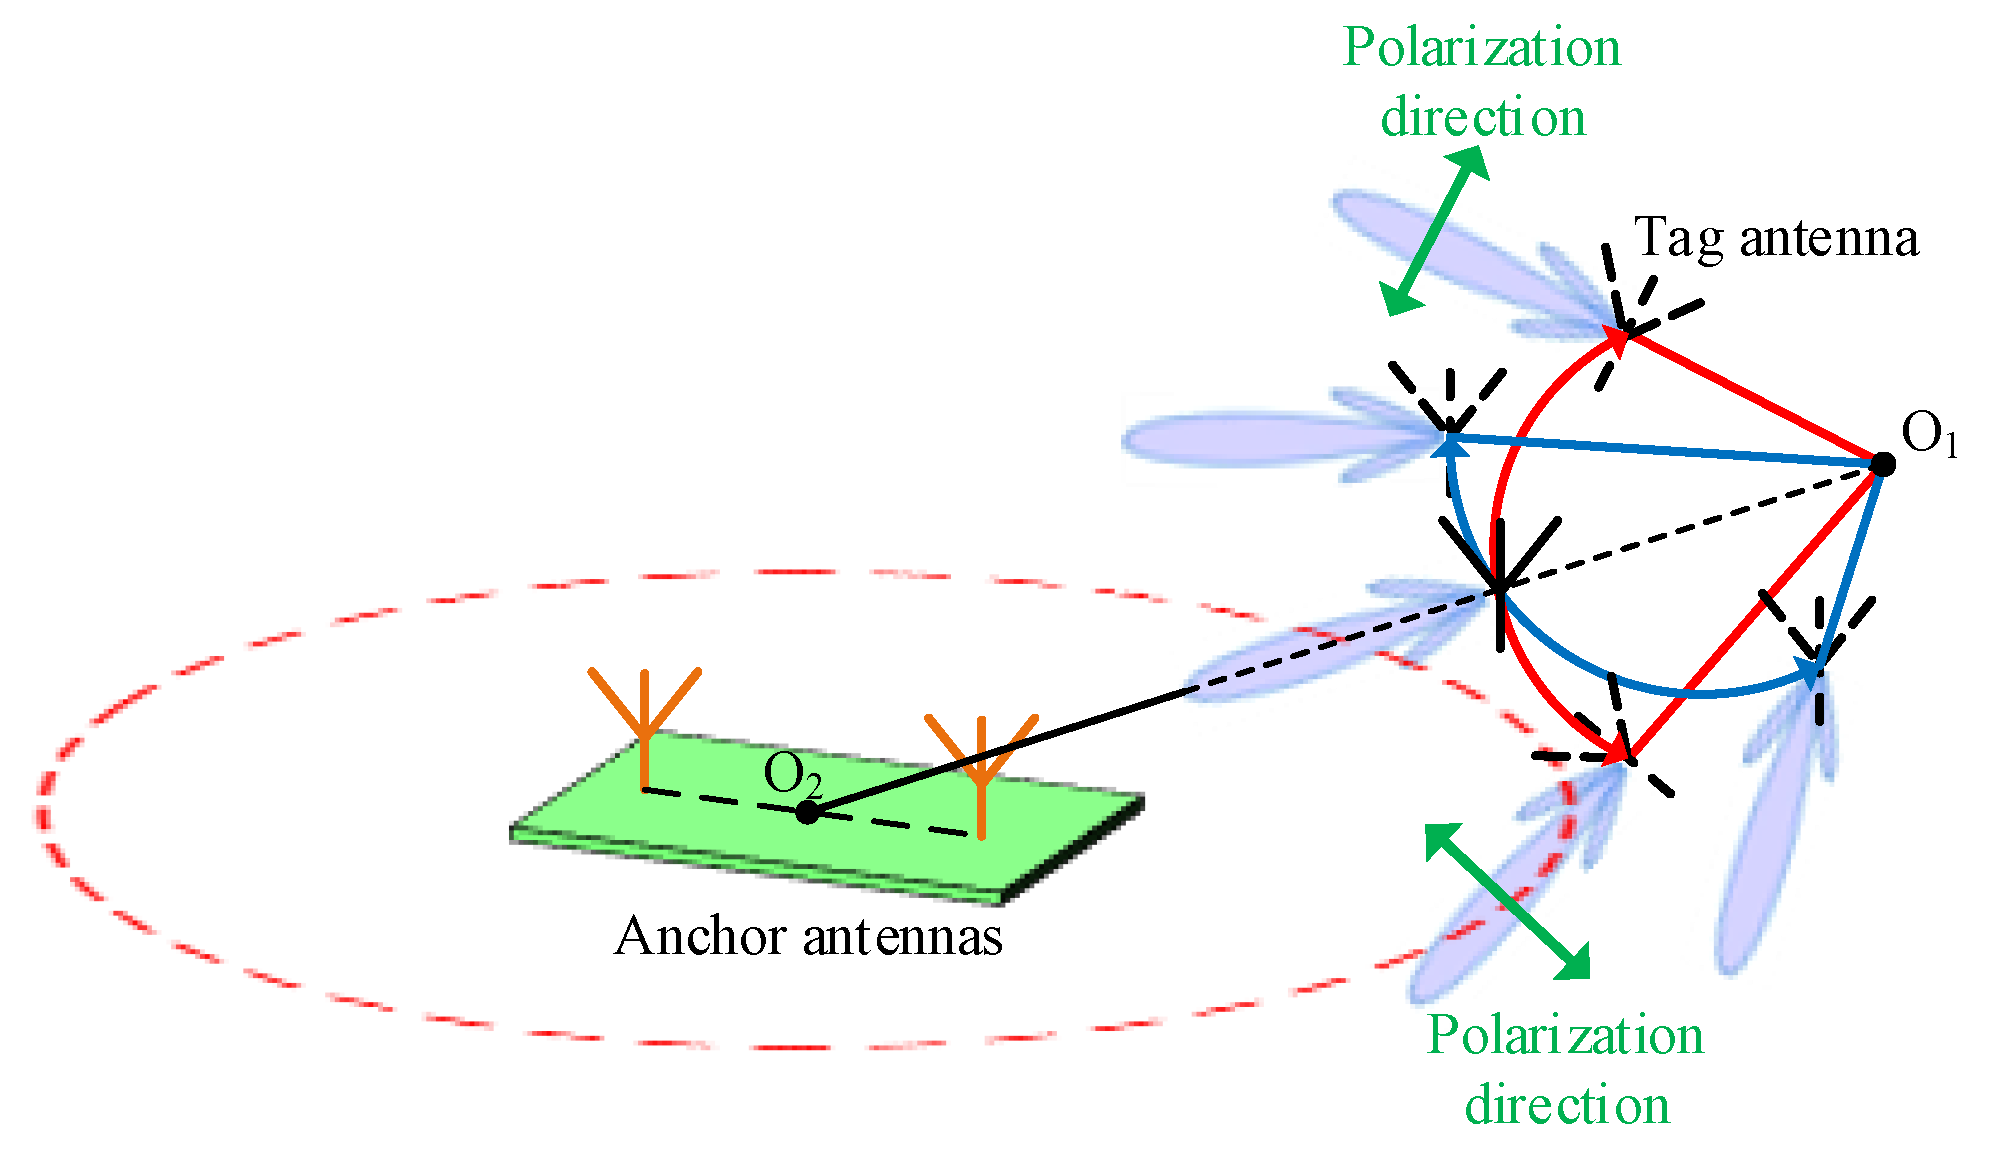
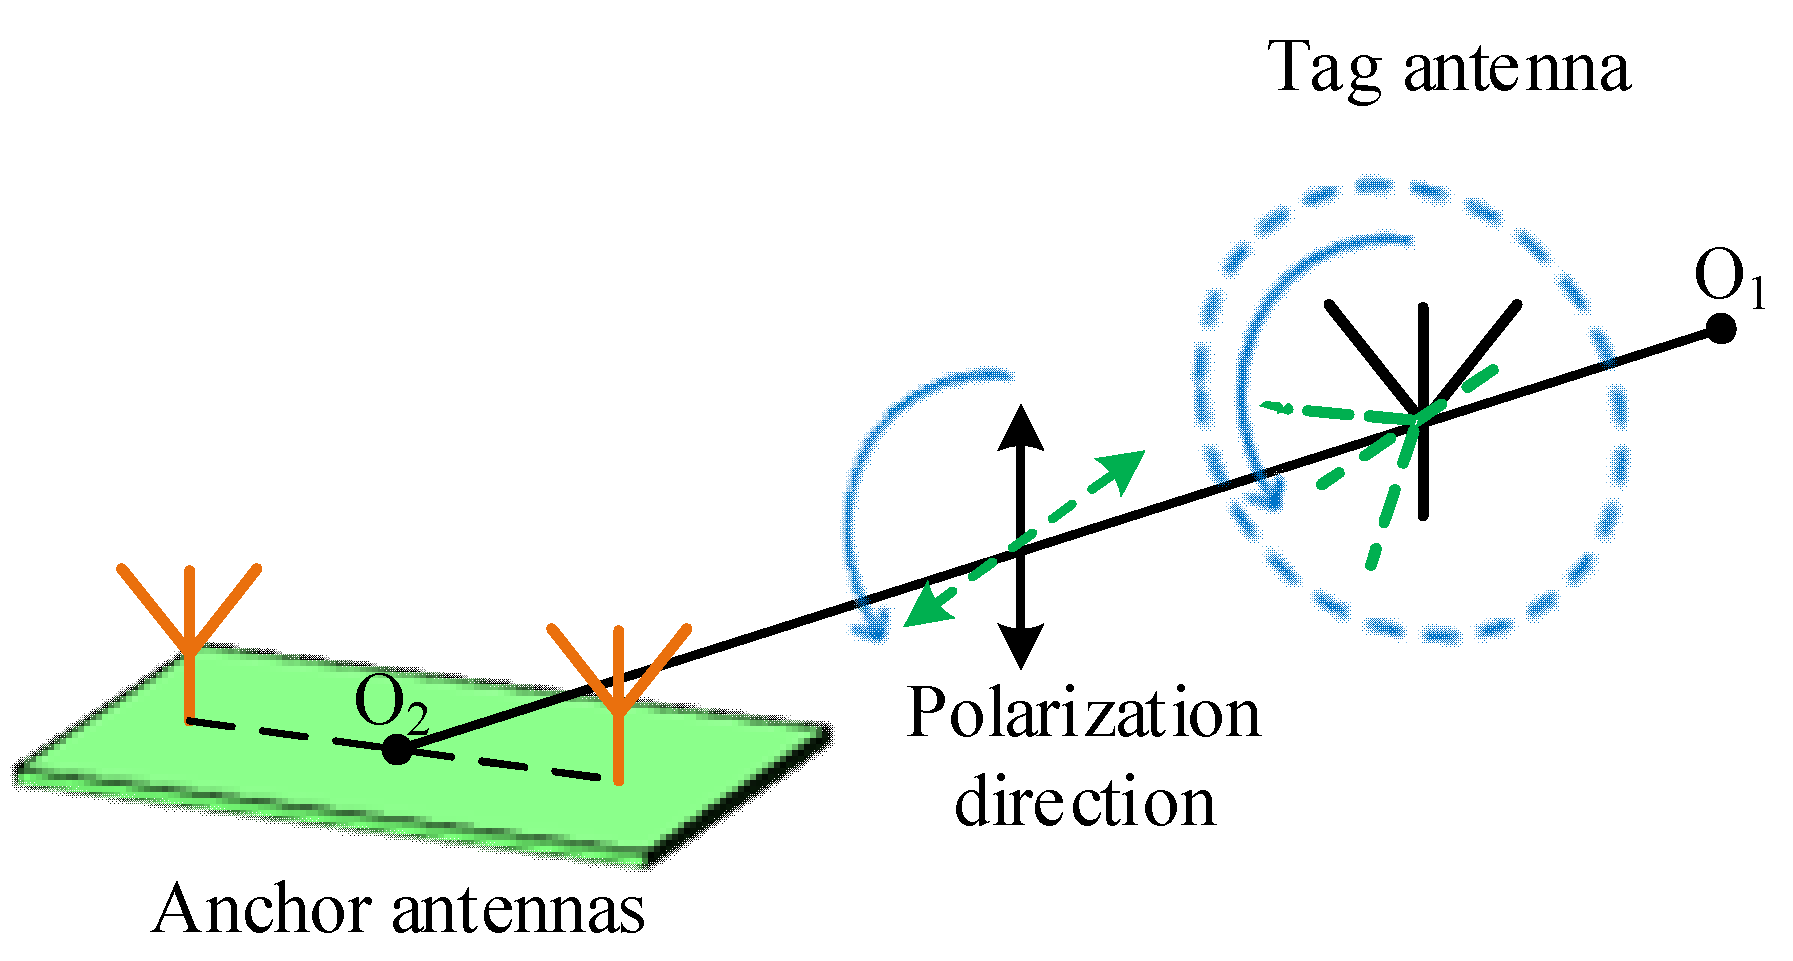
The relative pose of the tag and anchor antenna after installation on a moving platform, similar to the most practical cases, changes due to the movement. This affects the stability of the positioning system. Three such scenarios are illustrated in
Figure 2,
Figure 3 and
Figure 4.
Figure 2 illustrates the case when the maximum radiation direction of the tag antenna deflects from its boresight (O
1O
2). This lowers the signal strength received in the anchor side and results in a reduced signal-to-noise ratio.
Figure 2 and
Figure 3 show the polarization change of the tag antenna relative to the anchors, as the tag deflects from O
1O
2 in the vertical plane or rotates around O
1O
2. As a result, the co-polarization component of the incoming wave is reduced, which decreases the received signal intensity. The cross-polarization component of the incoming wave may also increase, causing co-channel interference. In
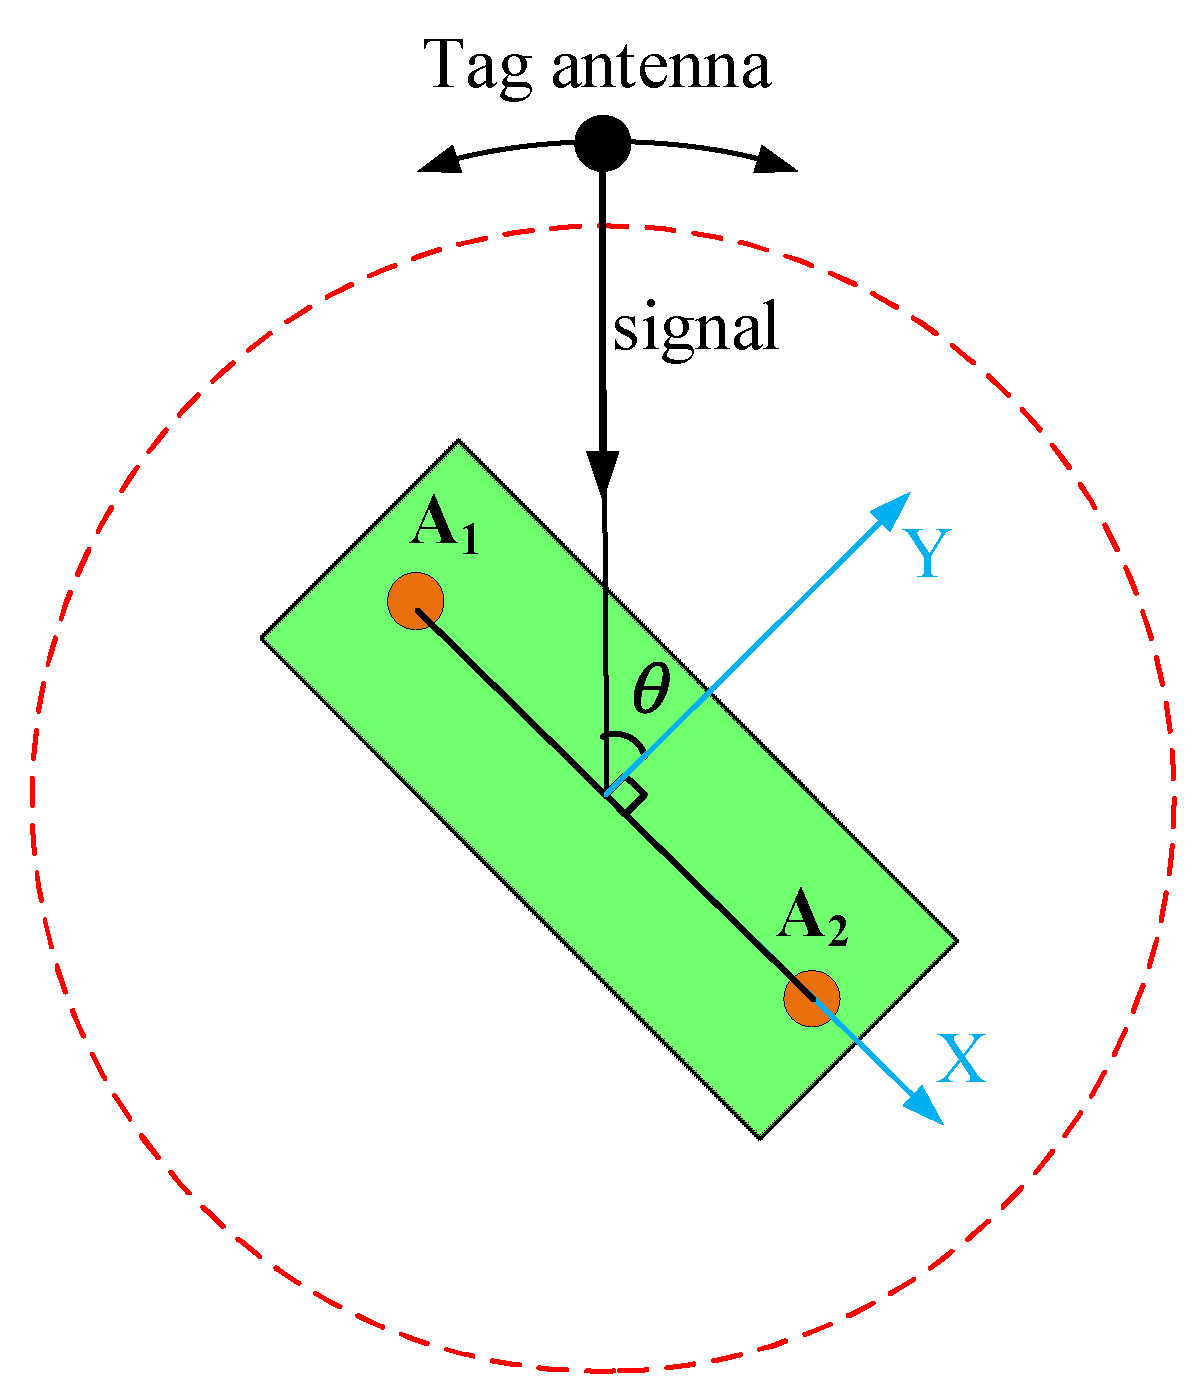
Figure 4, the angle,
θ, is the DOA deviation from the normal direction of the anchor baseline. The larger the deviation of
θ, the lower the DOA estimation accuracy [
25]. In addition, when the localization is performed in a complex electromagnetic environment, such as indoors, the signal may be reflected or blocked by other objects. This multipath effect increases the noise level.
To mitigate the abovementioned complexities, it is vital to develop an antenna system that is immune from the phase ambiguity and variation in antenna poses. It also requires a system setup to estimate the DOA with high precision with no reverse ambiguity. With these improvements, the PDOA-based localization may perform more reliably in complex environments.
3. Antenna System Design
In this section, the errors due to antenna polarization purity and the coupling between antenna elements are studied and compared. To address these issues, tag-anchor antennas are proposed to reduce the errors caused by pose-changing antennas, and turntable under anchor antennas are used to align the main lobe of the transceiver antennas together.
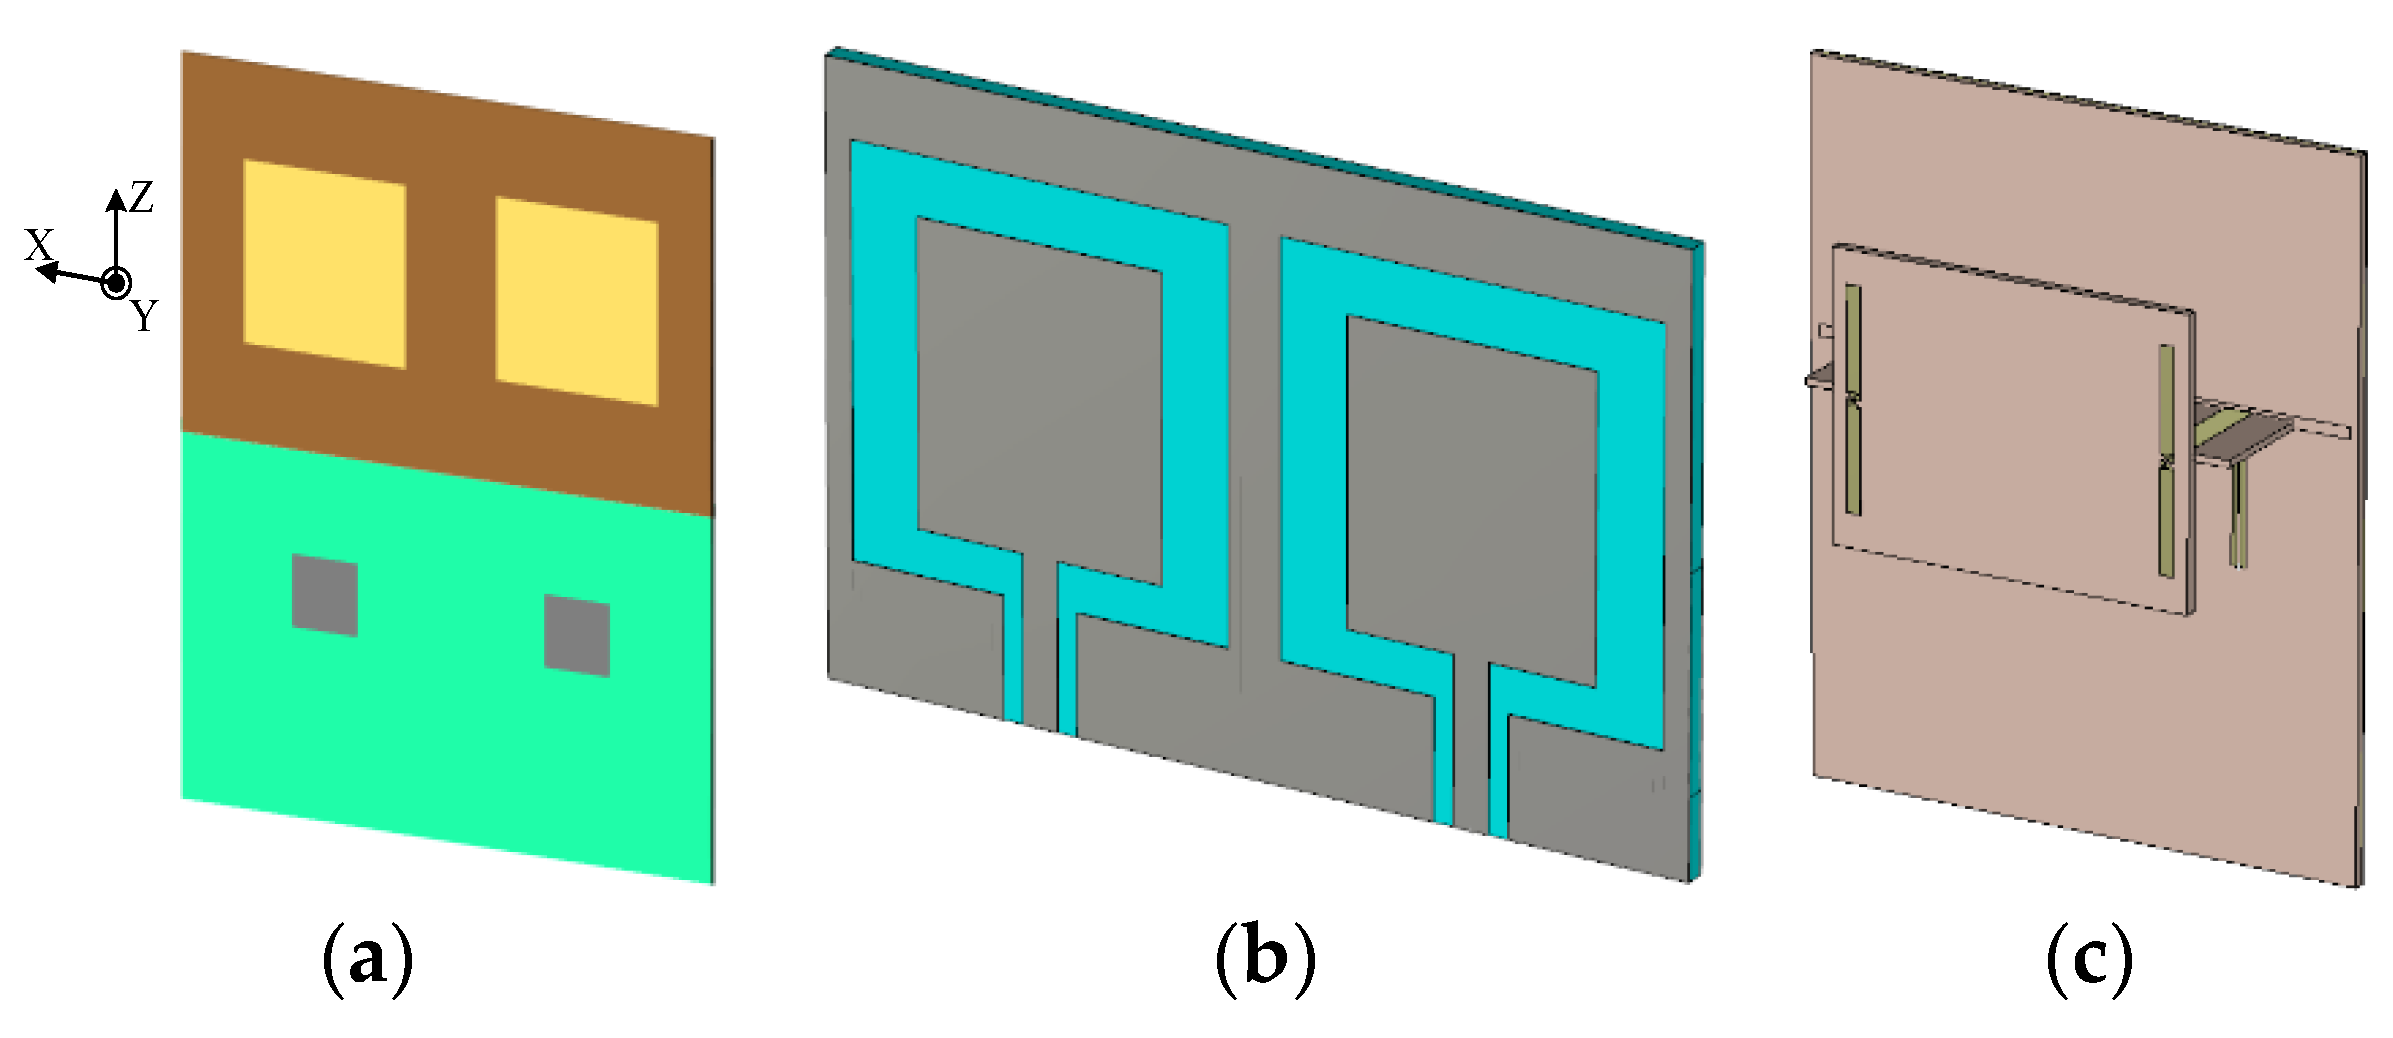
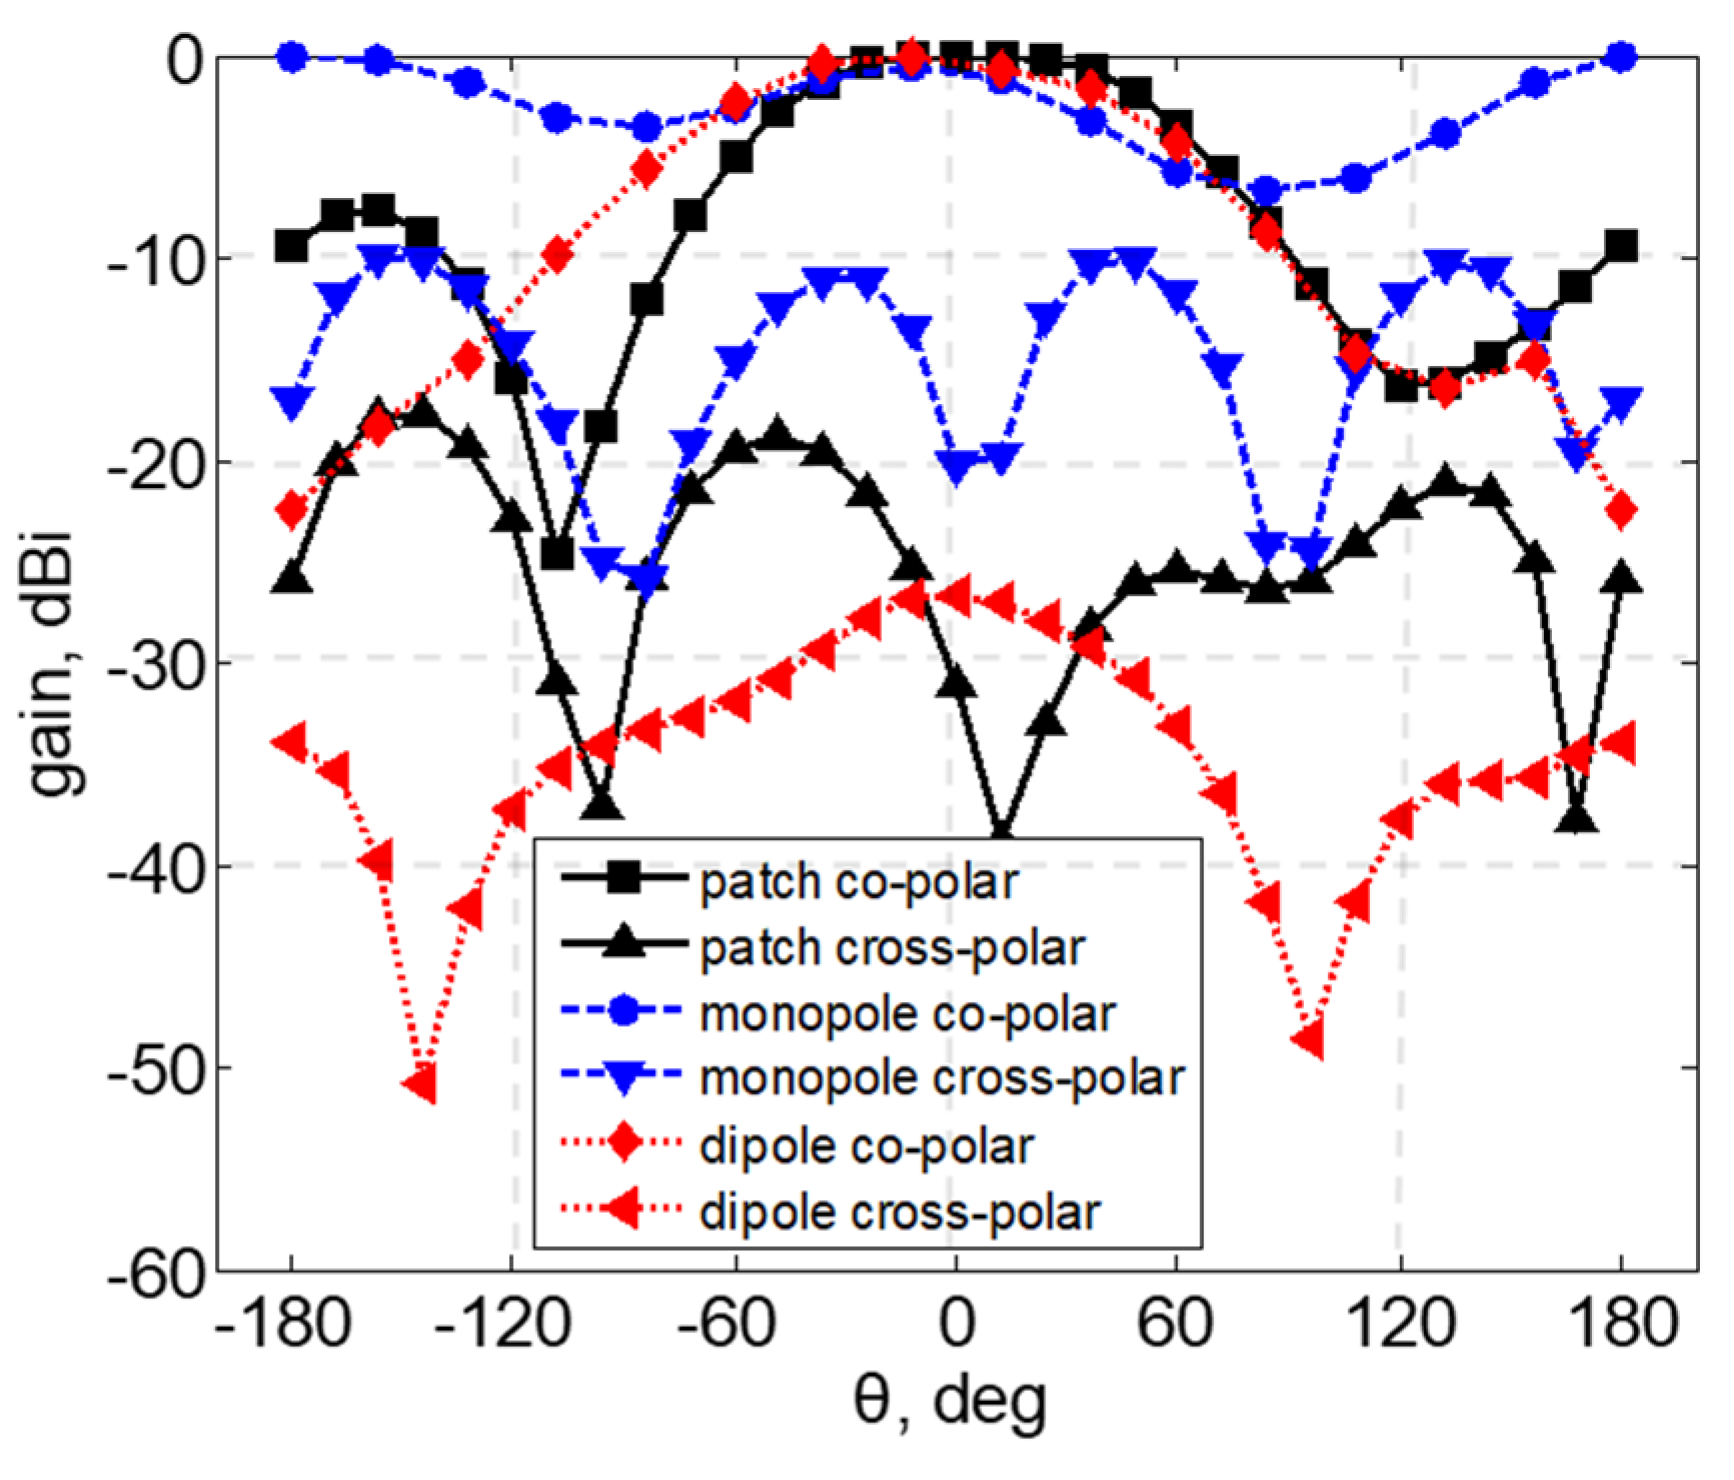
The coupling effects between the two anchor antennas are generally harmful for the DOA estimation. Therefore, high isolation between the antennas is desired in such localization scenarios. However, we found that the DOA estimation accuracy relies more on the polarization purity than the isolation. The following text provides a summary of the comparative study among three two-element antenna arrays— high-isolation monopole array, high linear-polarization rectangular patch array, and high linear-polarization dipole array, as shown in
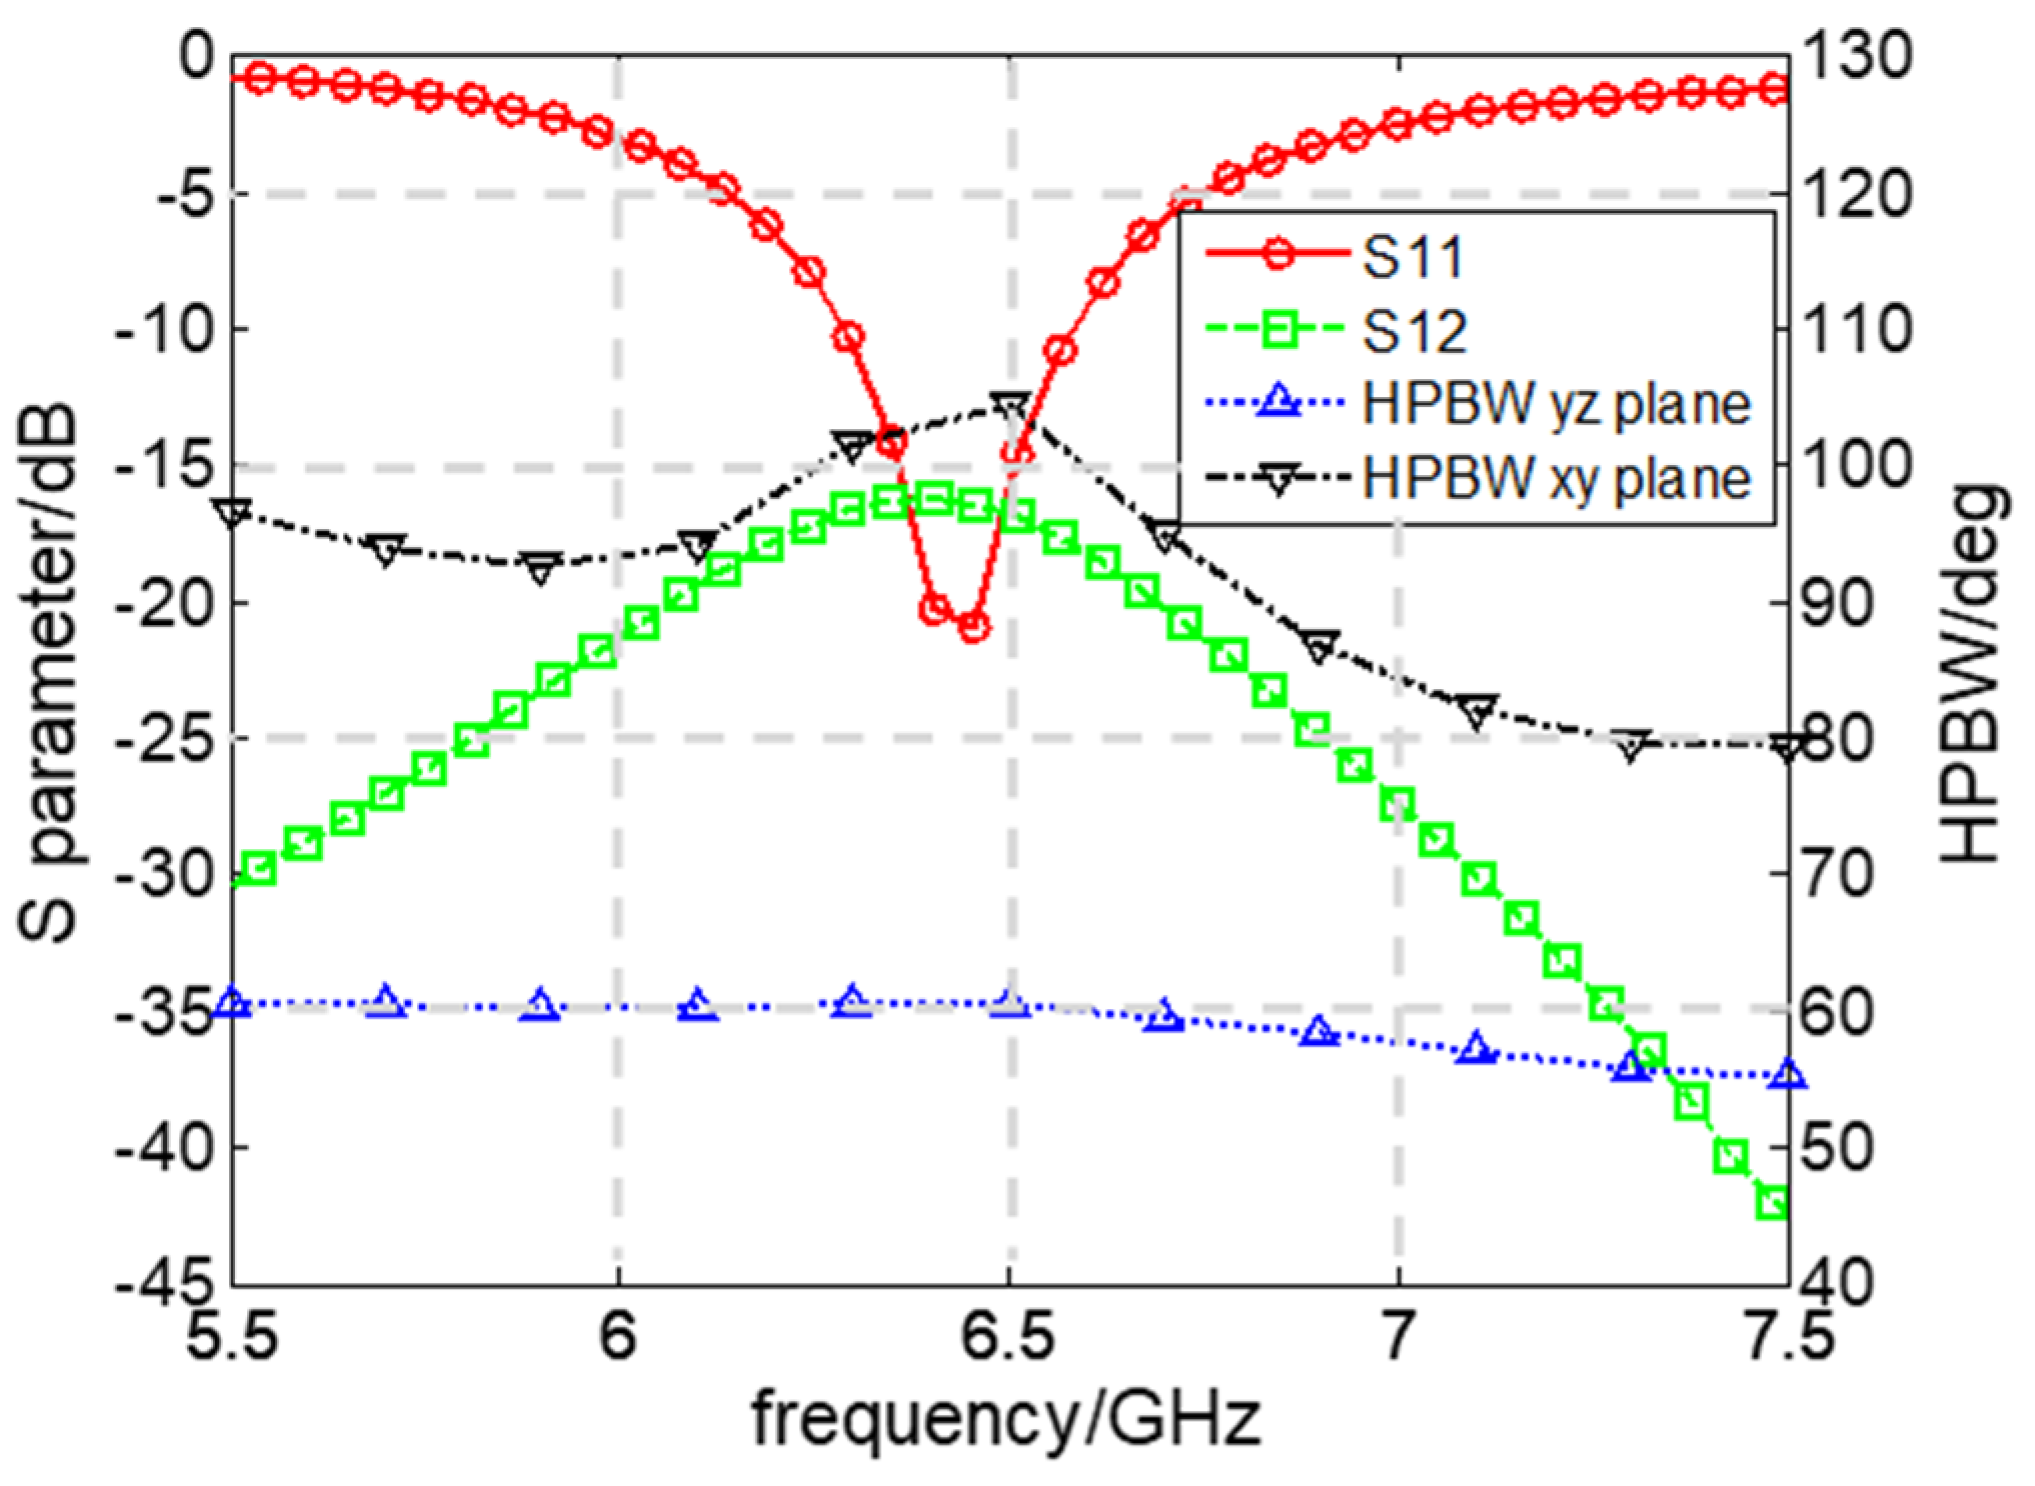
Figure 5. The performance of the three types of two-element antenna arrays was simulated using CST microwave studio. The simulated
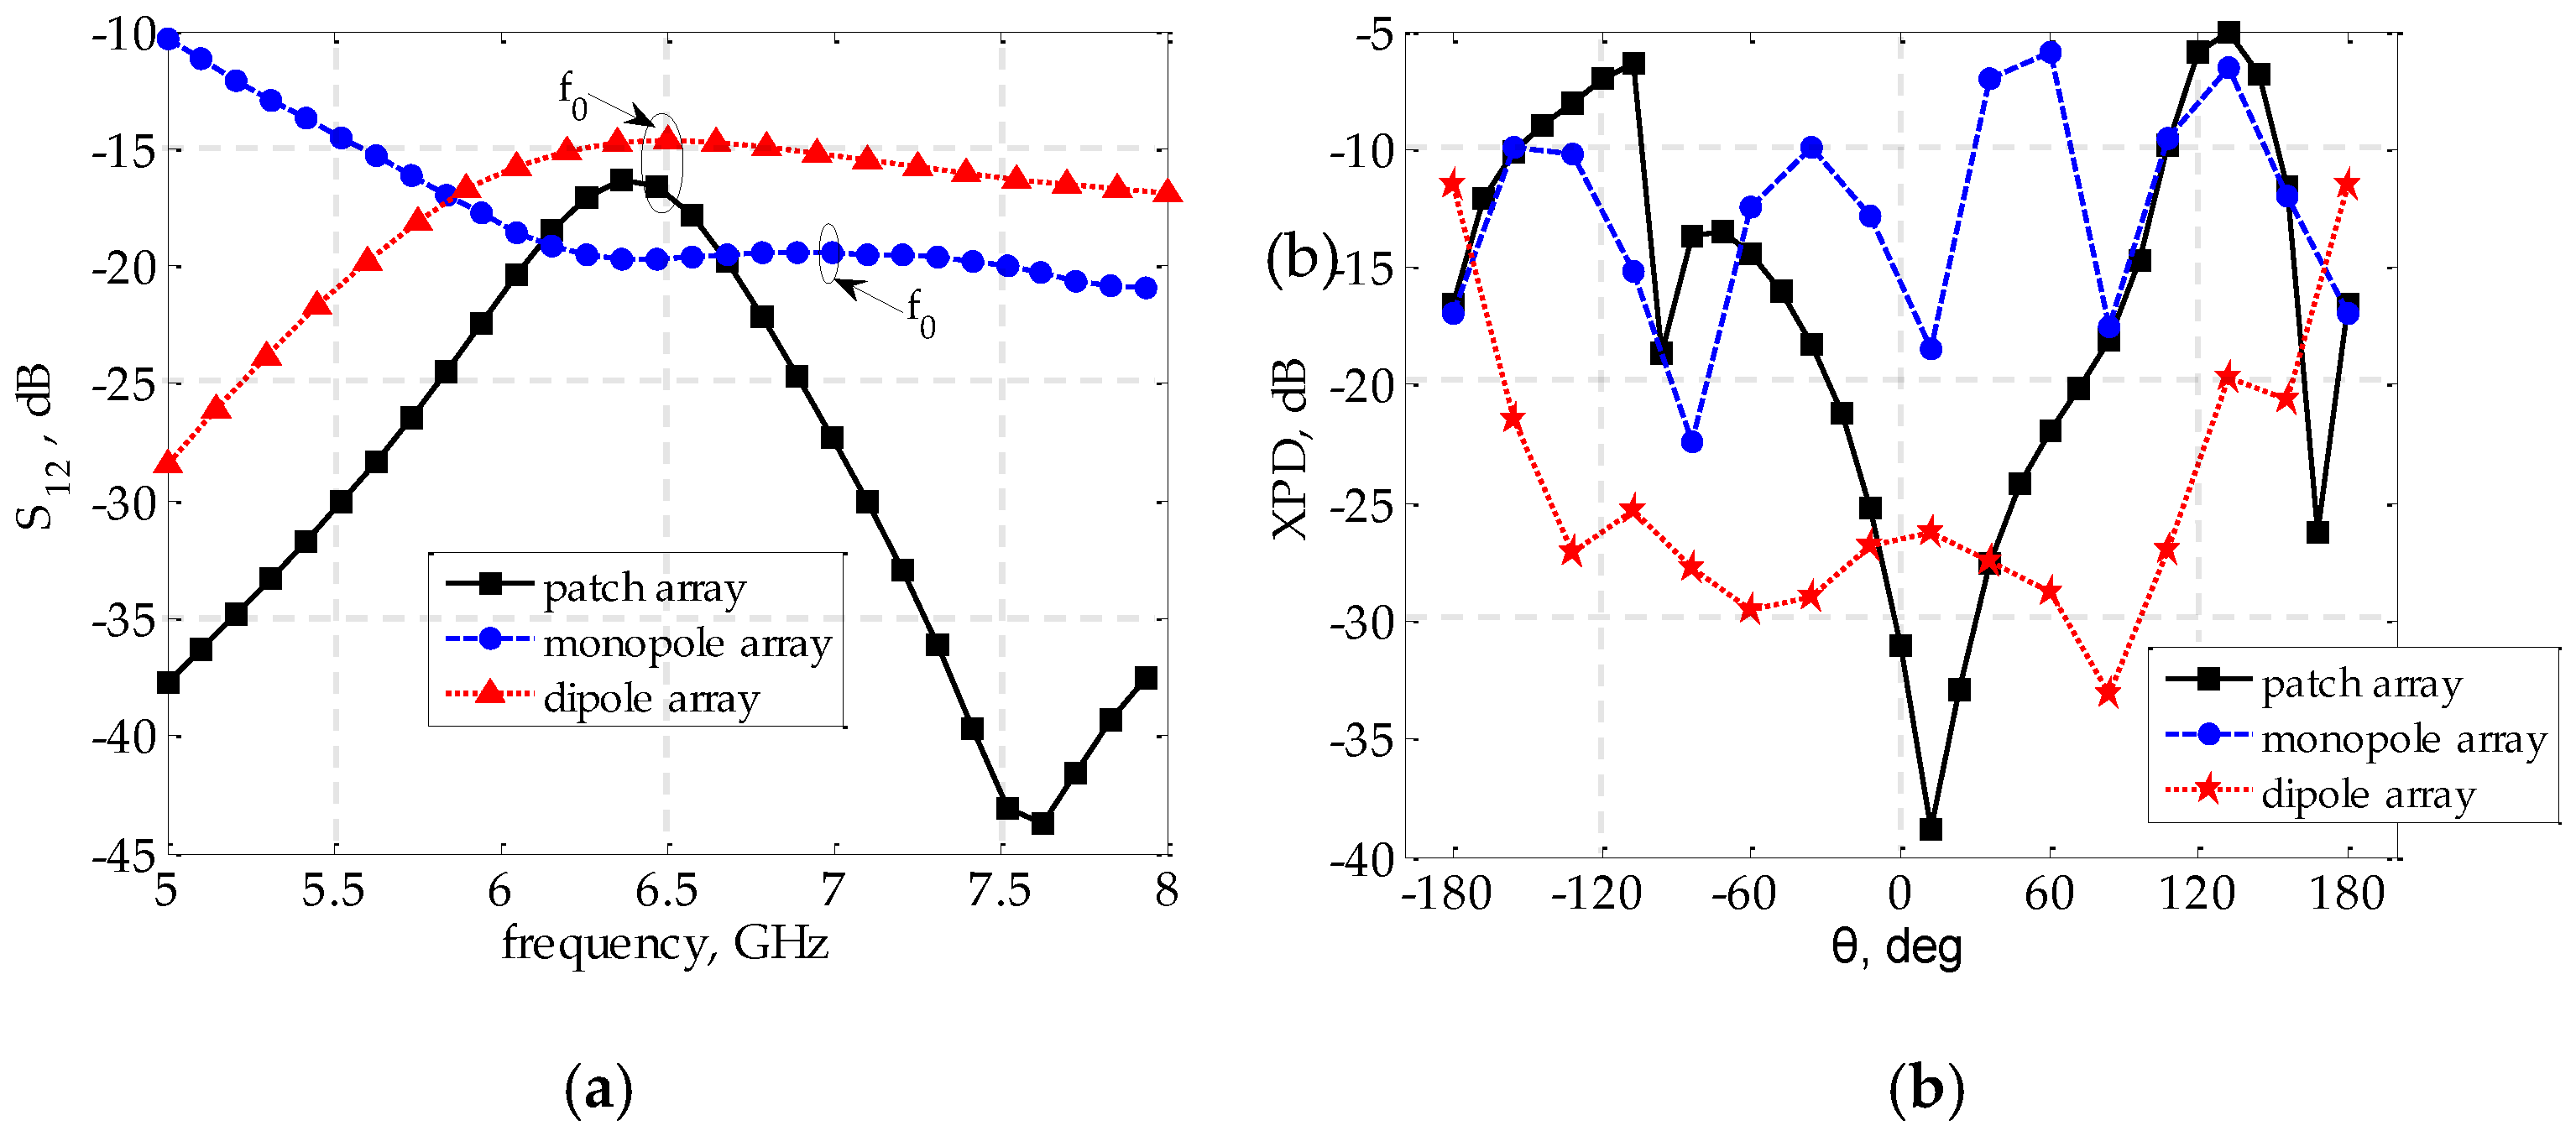
S12 responses in
Figure 6a and the cross-polarization discrimination (XPD) over the working azimuth angle (θ) of −90° to +90° in
Figure 6b show that the rectangular patch array shows 5 dB better XPD but 5 dB lower isolation than the monopole array. The dipole array provided 6 dB higher XPD with slightly lower isolation than the rectangular patch array.
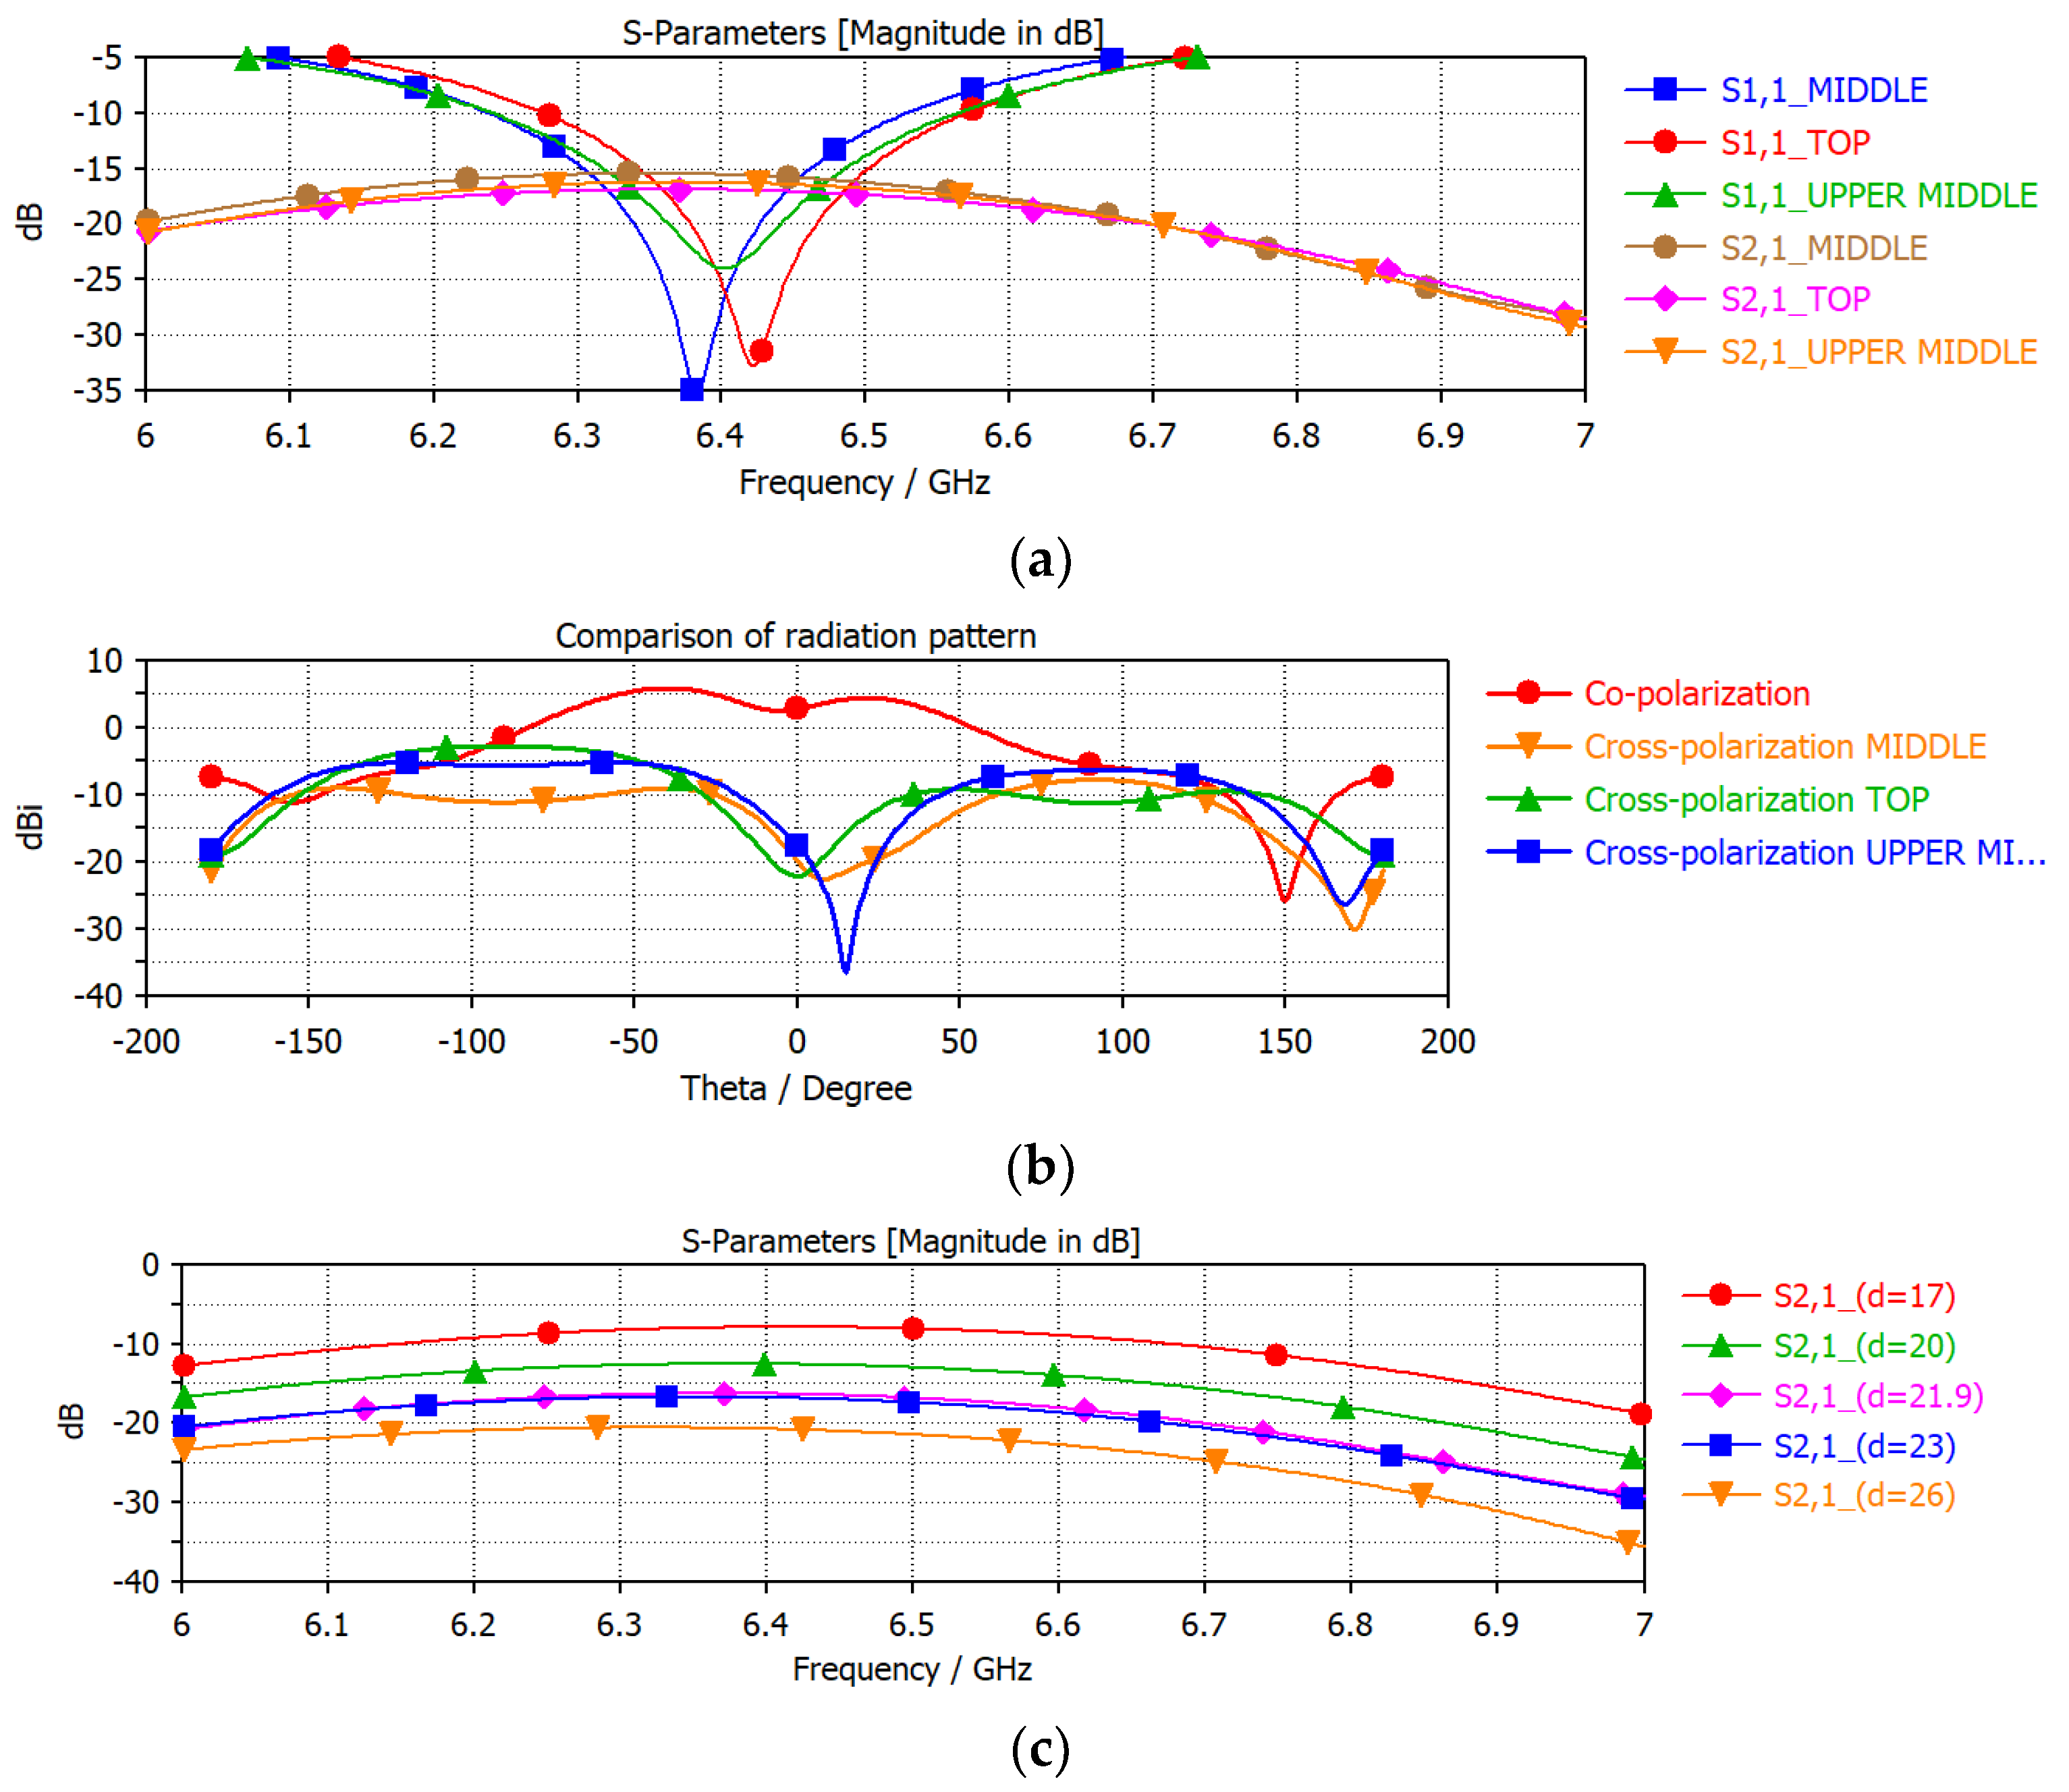
The layout of the antenna array is more focused on whether the antenna array should be located at the top, upper middle or middle of the whole board. Considering that the mutual coupling between the antenna and the circuit board is difficult to be accurately simulated, the antenna is generally arranged on the top of the whole circuit board. The radiation performance of the patch antenna element is actually significantly affected by the size and layout of the ground plane. In this layout, when the antenna array is close to the top of the whole circuit board, the mutual coupling between the two antenna units is relatively low because the ground plane size with a strong current is decreased, as shown in
Figure 7a. At the same time, the cross-polarization symmetry in the
Y-axis direction is also improved, which is conducive to obtaining a relatively accurate DOA angle within a wide angle range in the
Y-axis direction, as shown in
Figure 7b. The coupling between the antenna elements with different d is presented in
Figure 7c. The coupling strength will decrease with the increase in the distance between antenna elements. The design goal of the system is that the coupling strength is less than −15 dB. In this paper, the smallest spacing is selected under the condition that S21 is below −15 dB. necessary
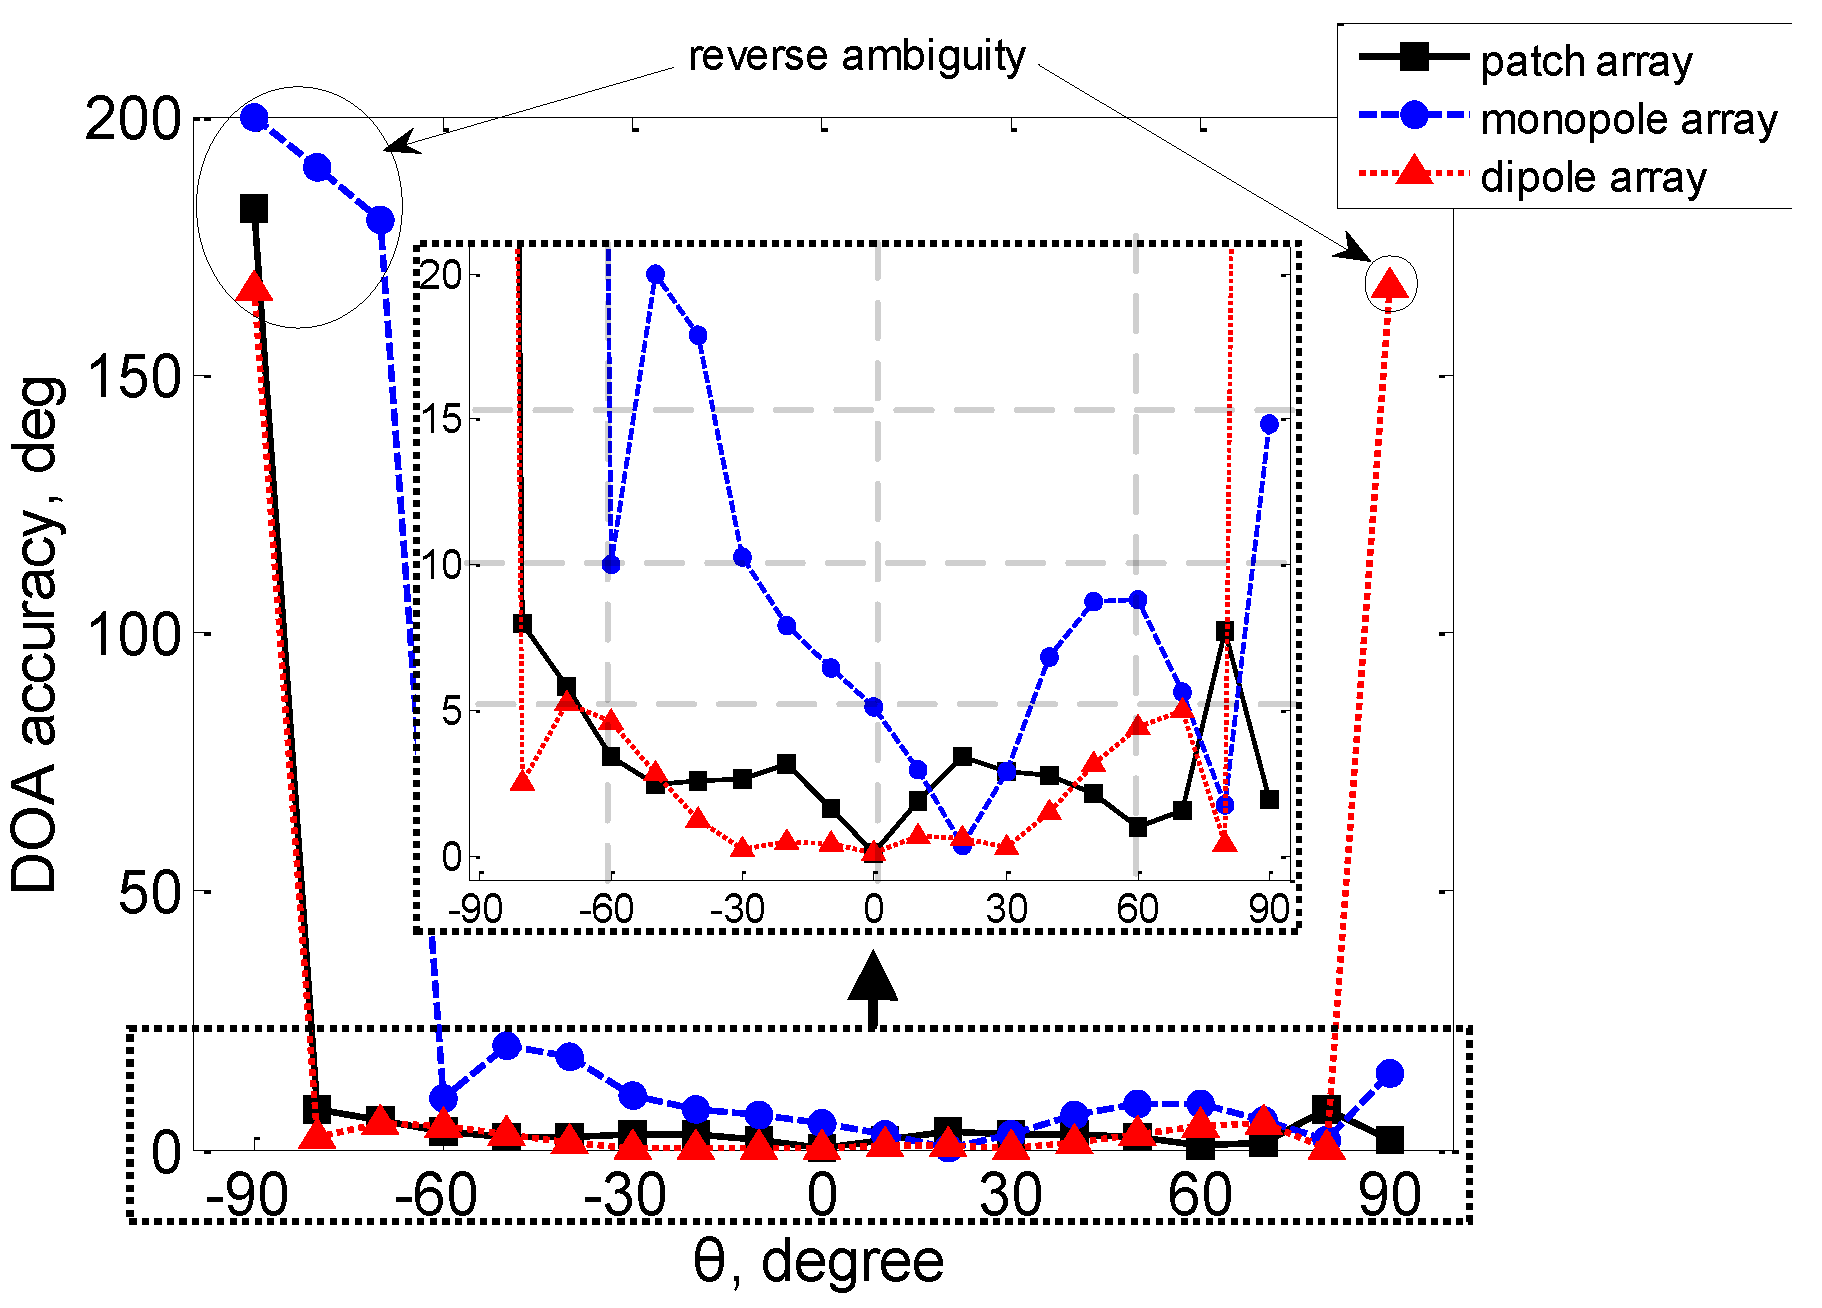
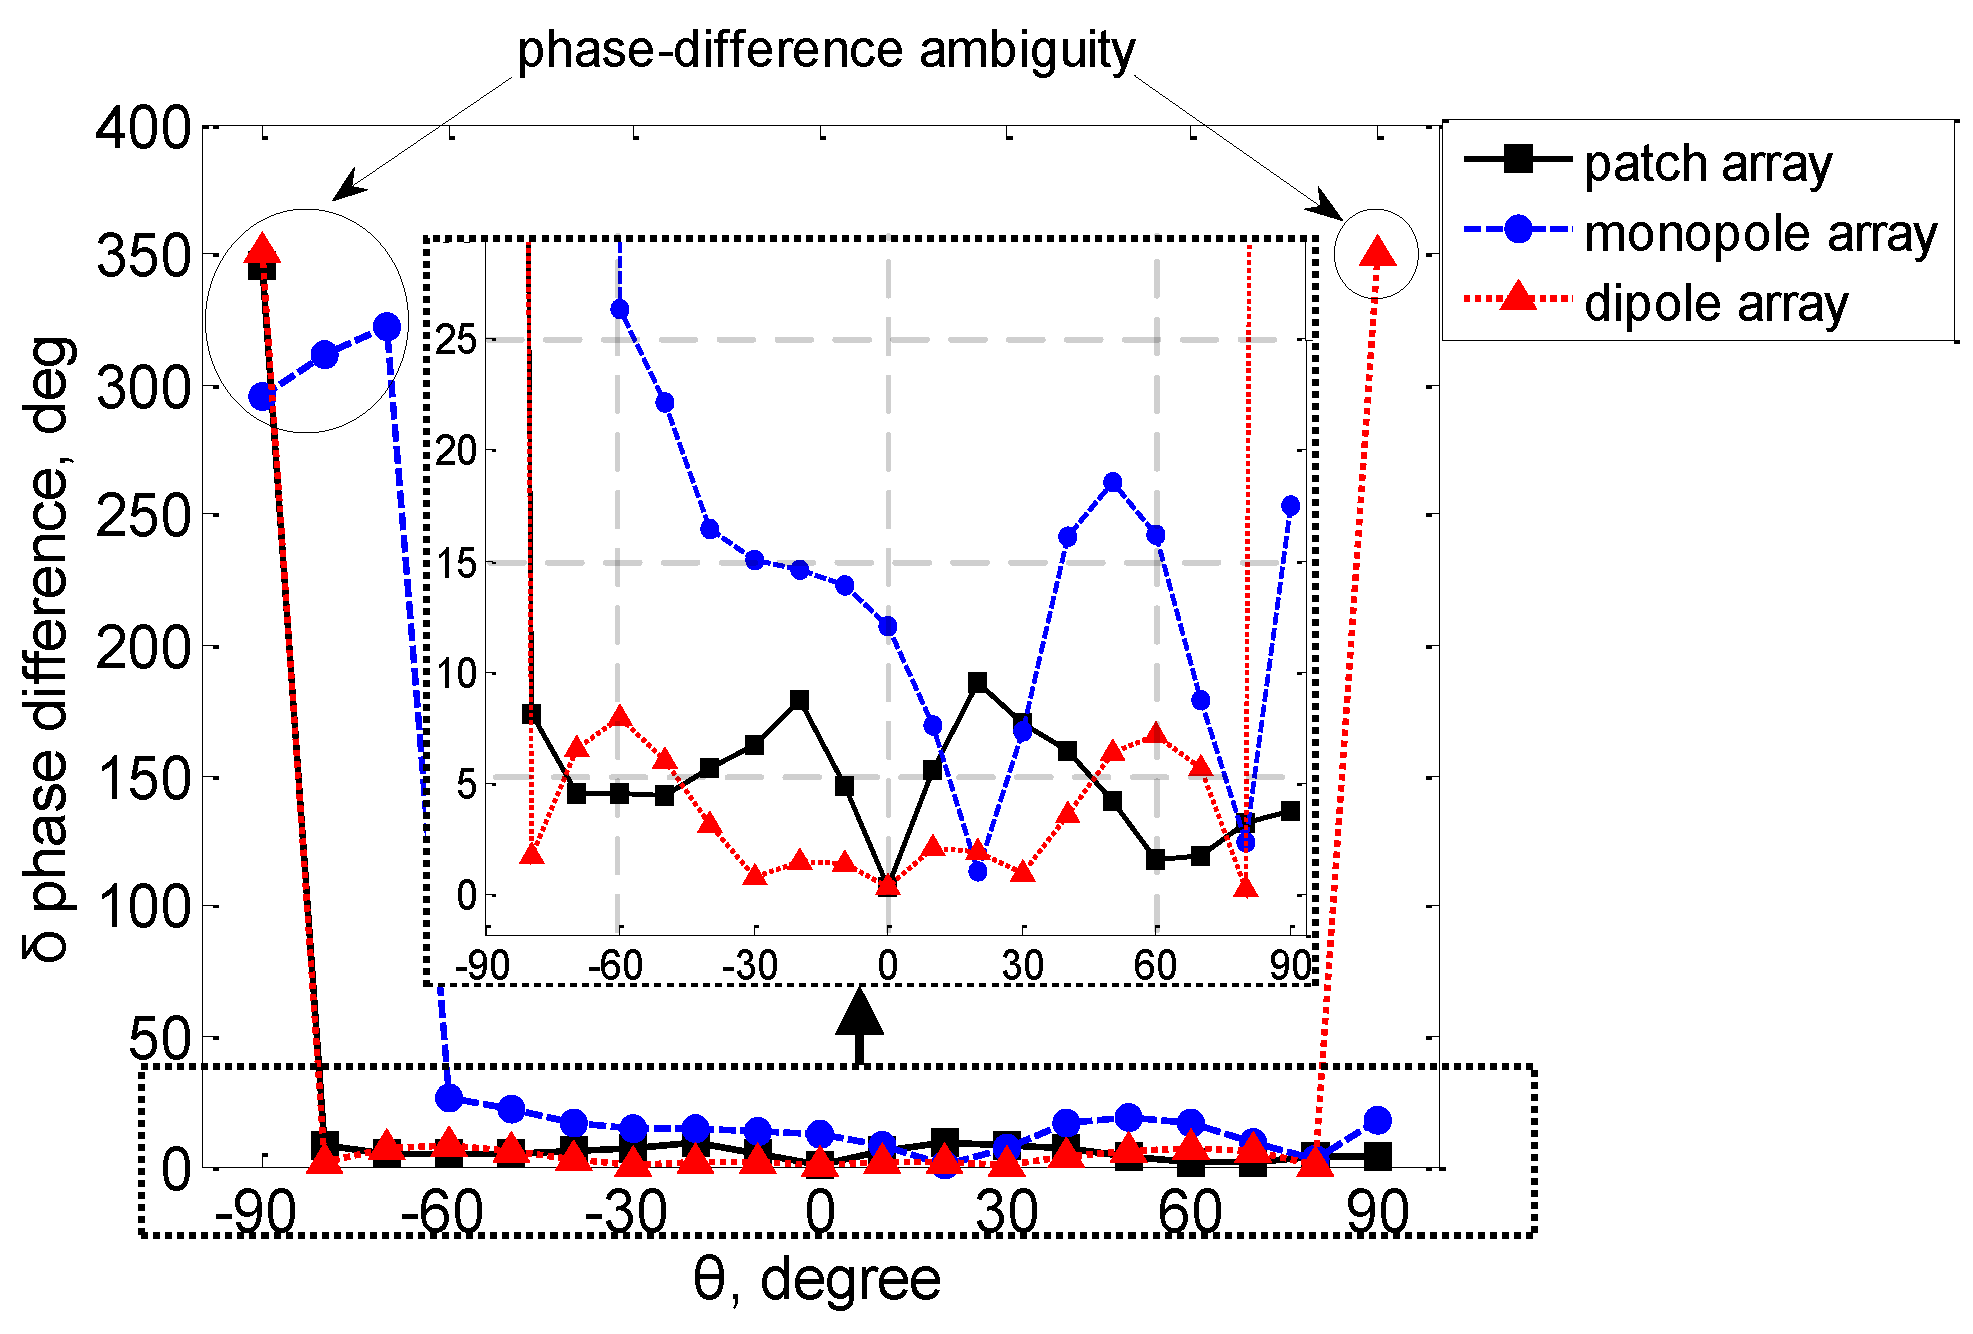
Figure 8 compares the DOA estimation accuracy of the three arrays illuminated by a CP wave. The DOA was estimated through a radiation pattern phase difference in the simulation. The rectangular patch array, with a higher XPD, shows an overall better DOA estimation accuracy than the monopole, although it has lower isolation. The dipole array, with the highest XPD in the horizontal plane, provided the highest DOA estimation accuracy of less than 5° between −80° and 80°. It can be concluded that the DOA estimation depends more on the polarization purity than the isolation between the radiation elements. The deviations of the simulated phase difference from the theoretical difference calculated using Equation (1) are shown in
Figure 9 and denoted as δ phase difference. The phase difference shows a strong correlation with the XPD in
Figure 6a. This is because the phase between the received cross-polar component and co-polar component is different, and the absolute phase difference is the superposition of the two. These results further confirm that the higher polarization purity is significantly beneficial to the DOA estimation. In addition,
Figure 9 shows that the δ phase difference of the anchor antennas is approximately 360° at the edges of the front semicircle, causing the ambiguity of 2π to the phase measurement. This corresponds to the reverse ambiguity as indicated in the DOA estimation in
Figure 8.
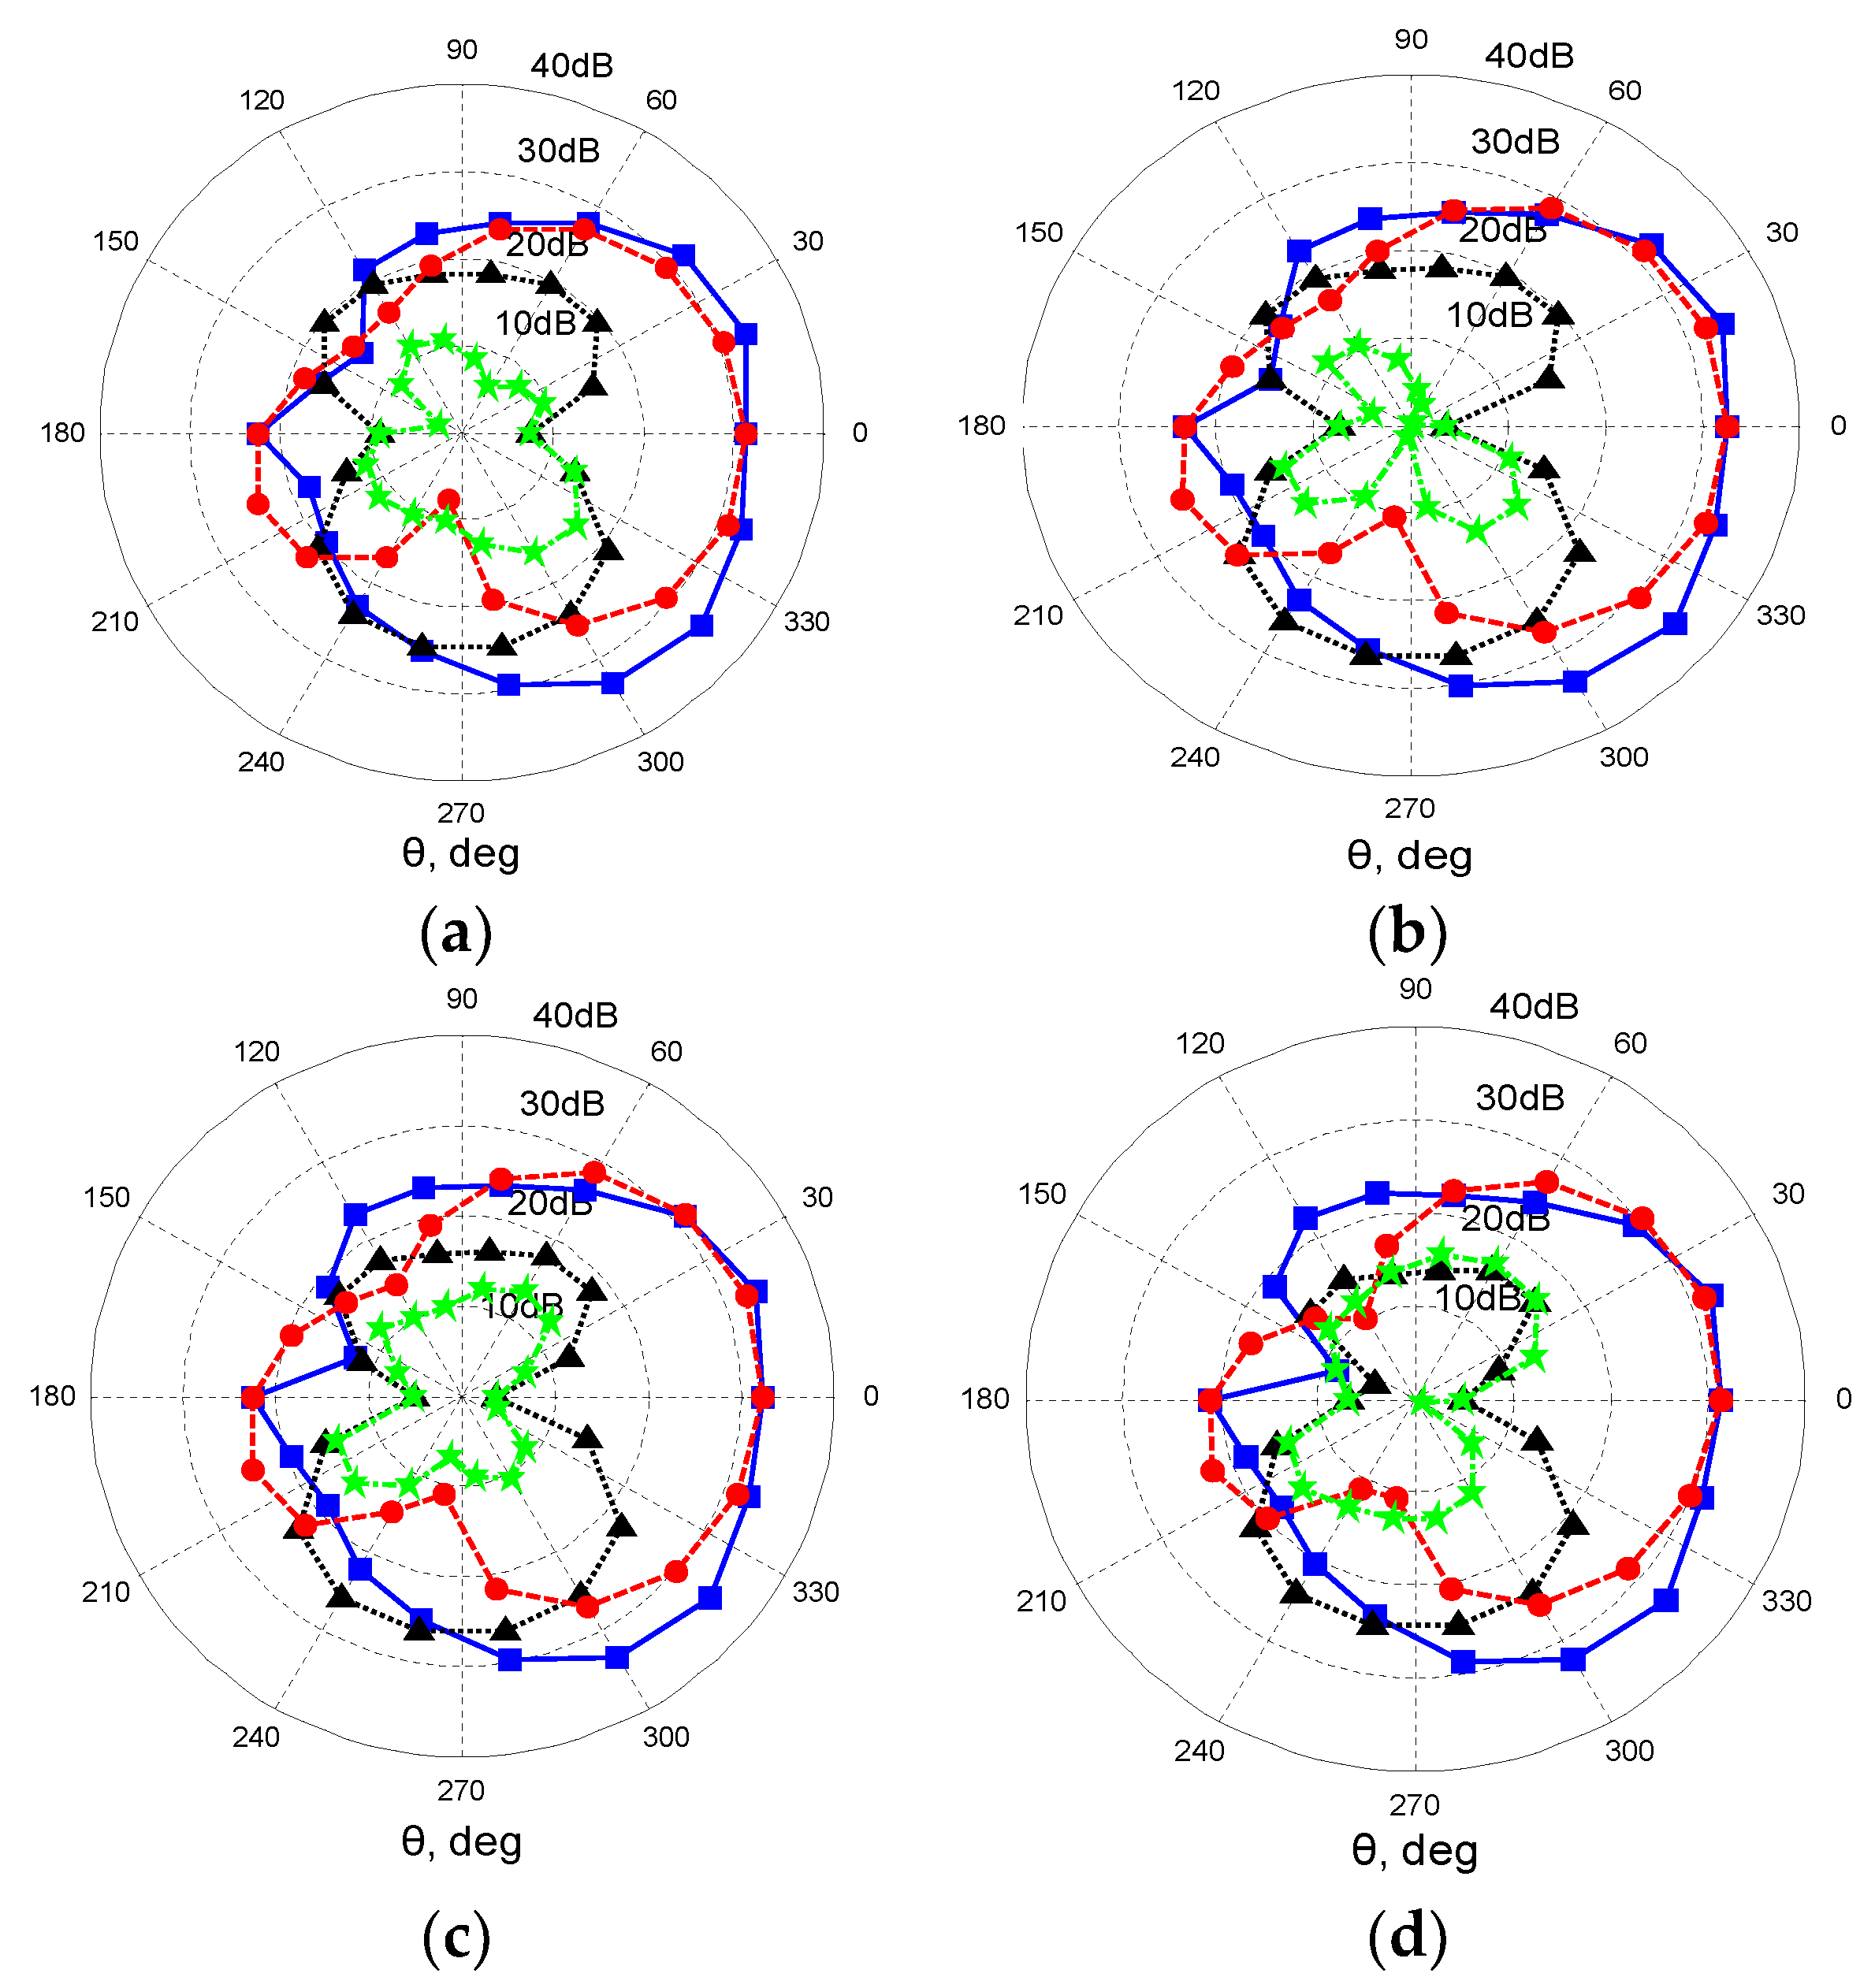
Since the two-element array only estimated DOA from the front semicircle in the horizontal plane, a good front-to-back ratio is required for the anchor antennas.
Figure 6b and
Figure 10 show that the front side of the two high linear–polarization arrays has a higher gain and better XPD in the front semicircle than in the back semicircle. The front-to-back ratio was over 10 dB. This removes the reverse ambiguity caused by strong back radiation in the DOA estimation. In contrast,
Figure 8 shows that the monopole array is prone to reverse ambiguity in the DOA estimation due to its poor front-to-back ratio.
Although the dipole array showed the best DOA estimation precision, it occupies more space and is difficult to manufacture. In contrast, the patch antenna is easily fabricated using the print circuit board (PCB). Thus, the rectangular patch array was chosen as the anchor antenna in this study.
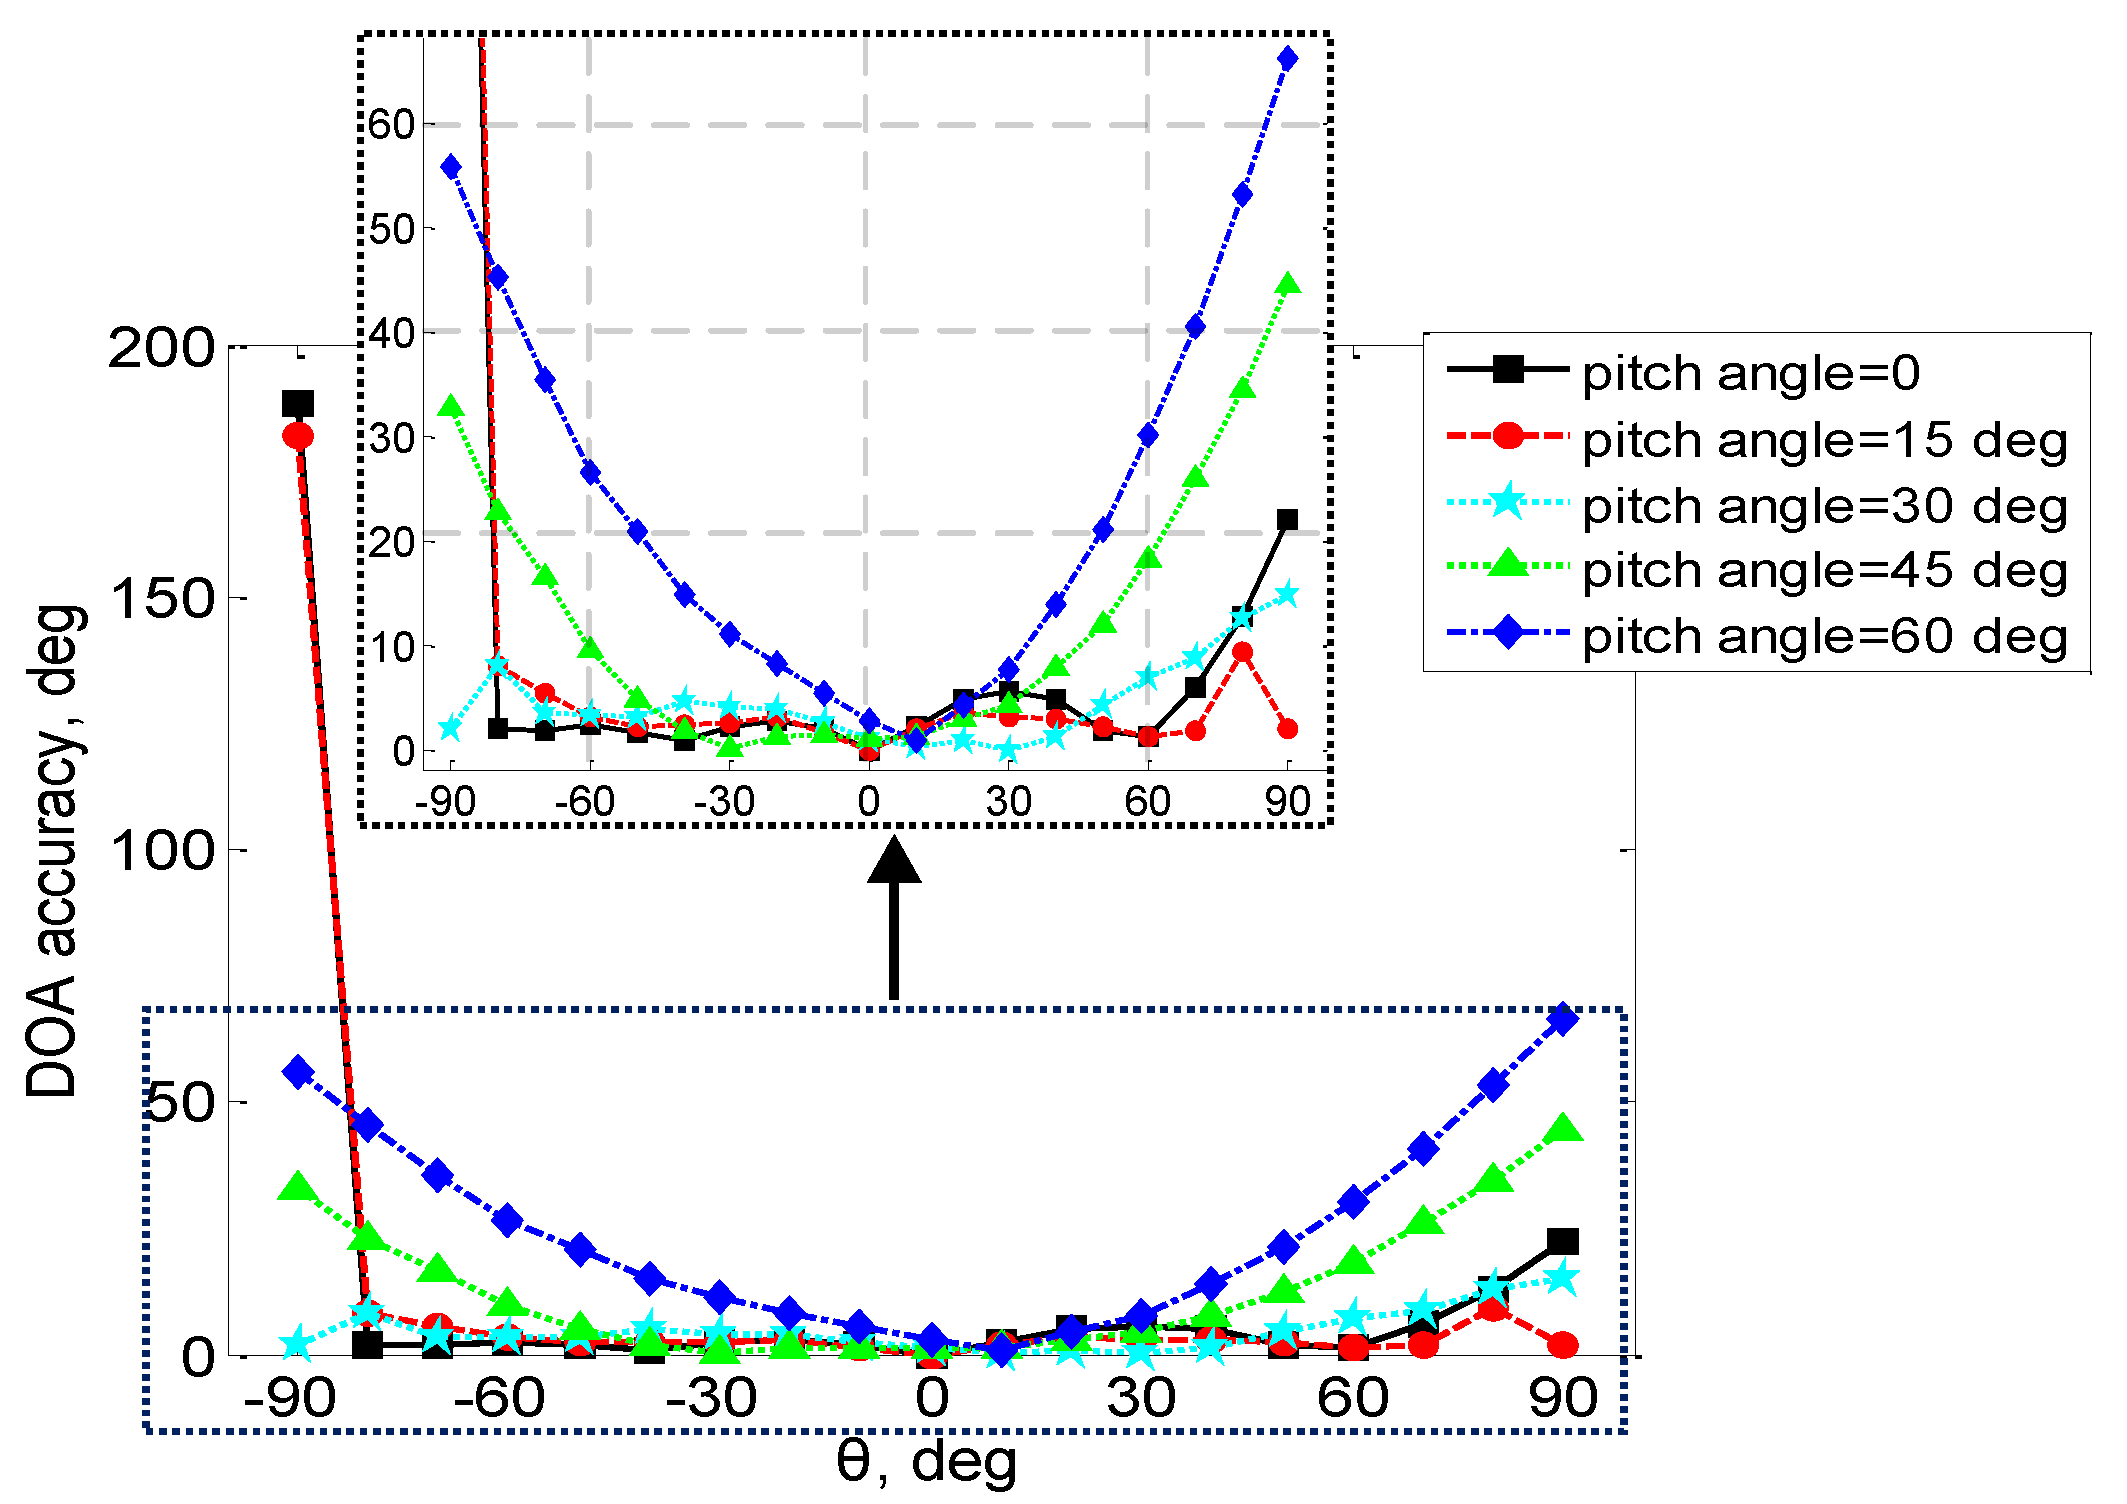
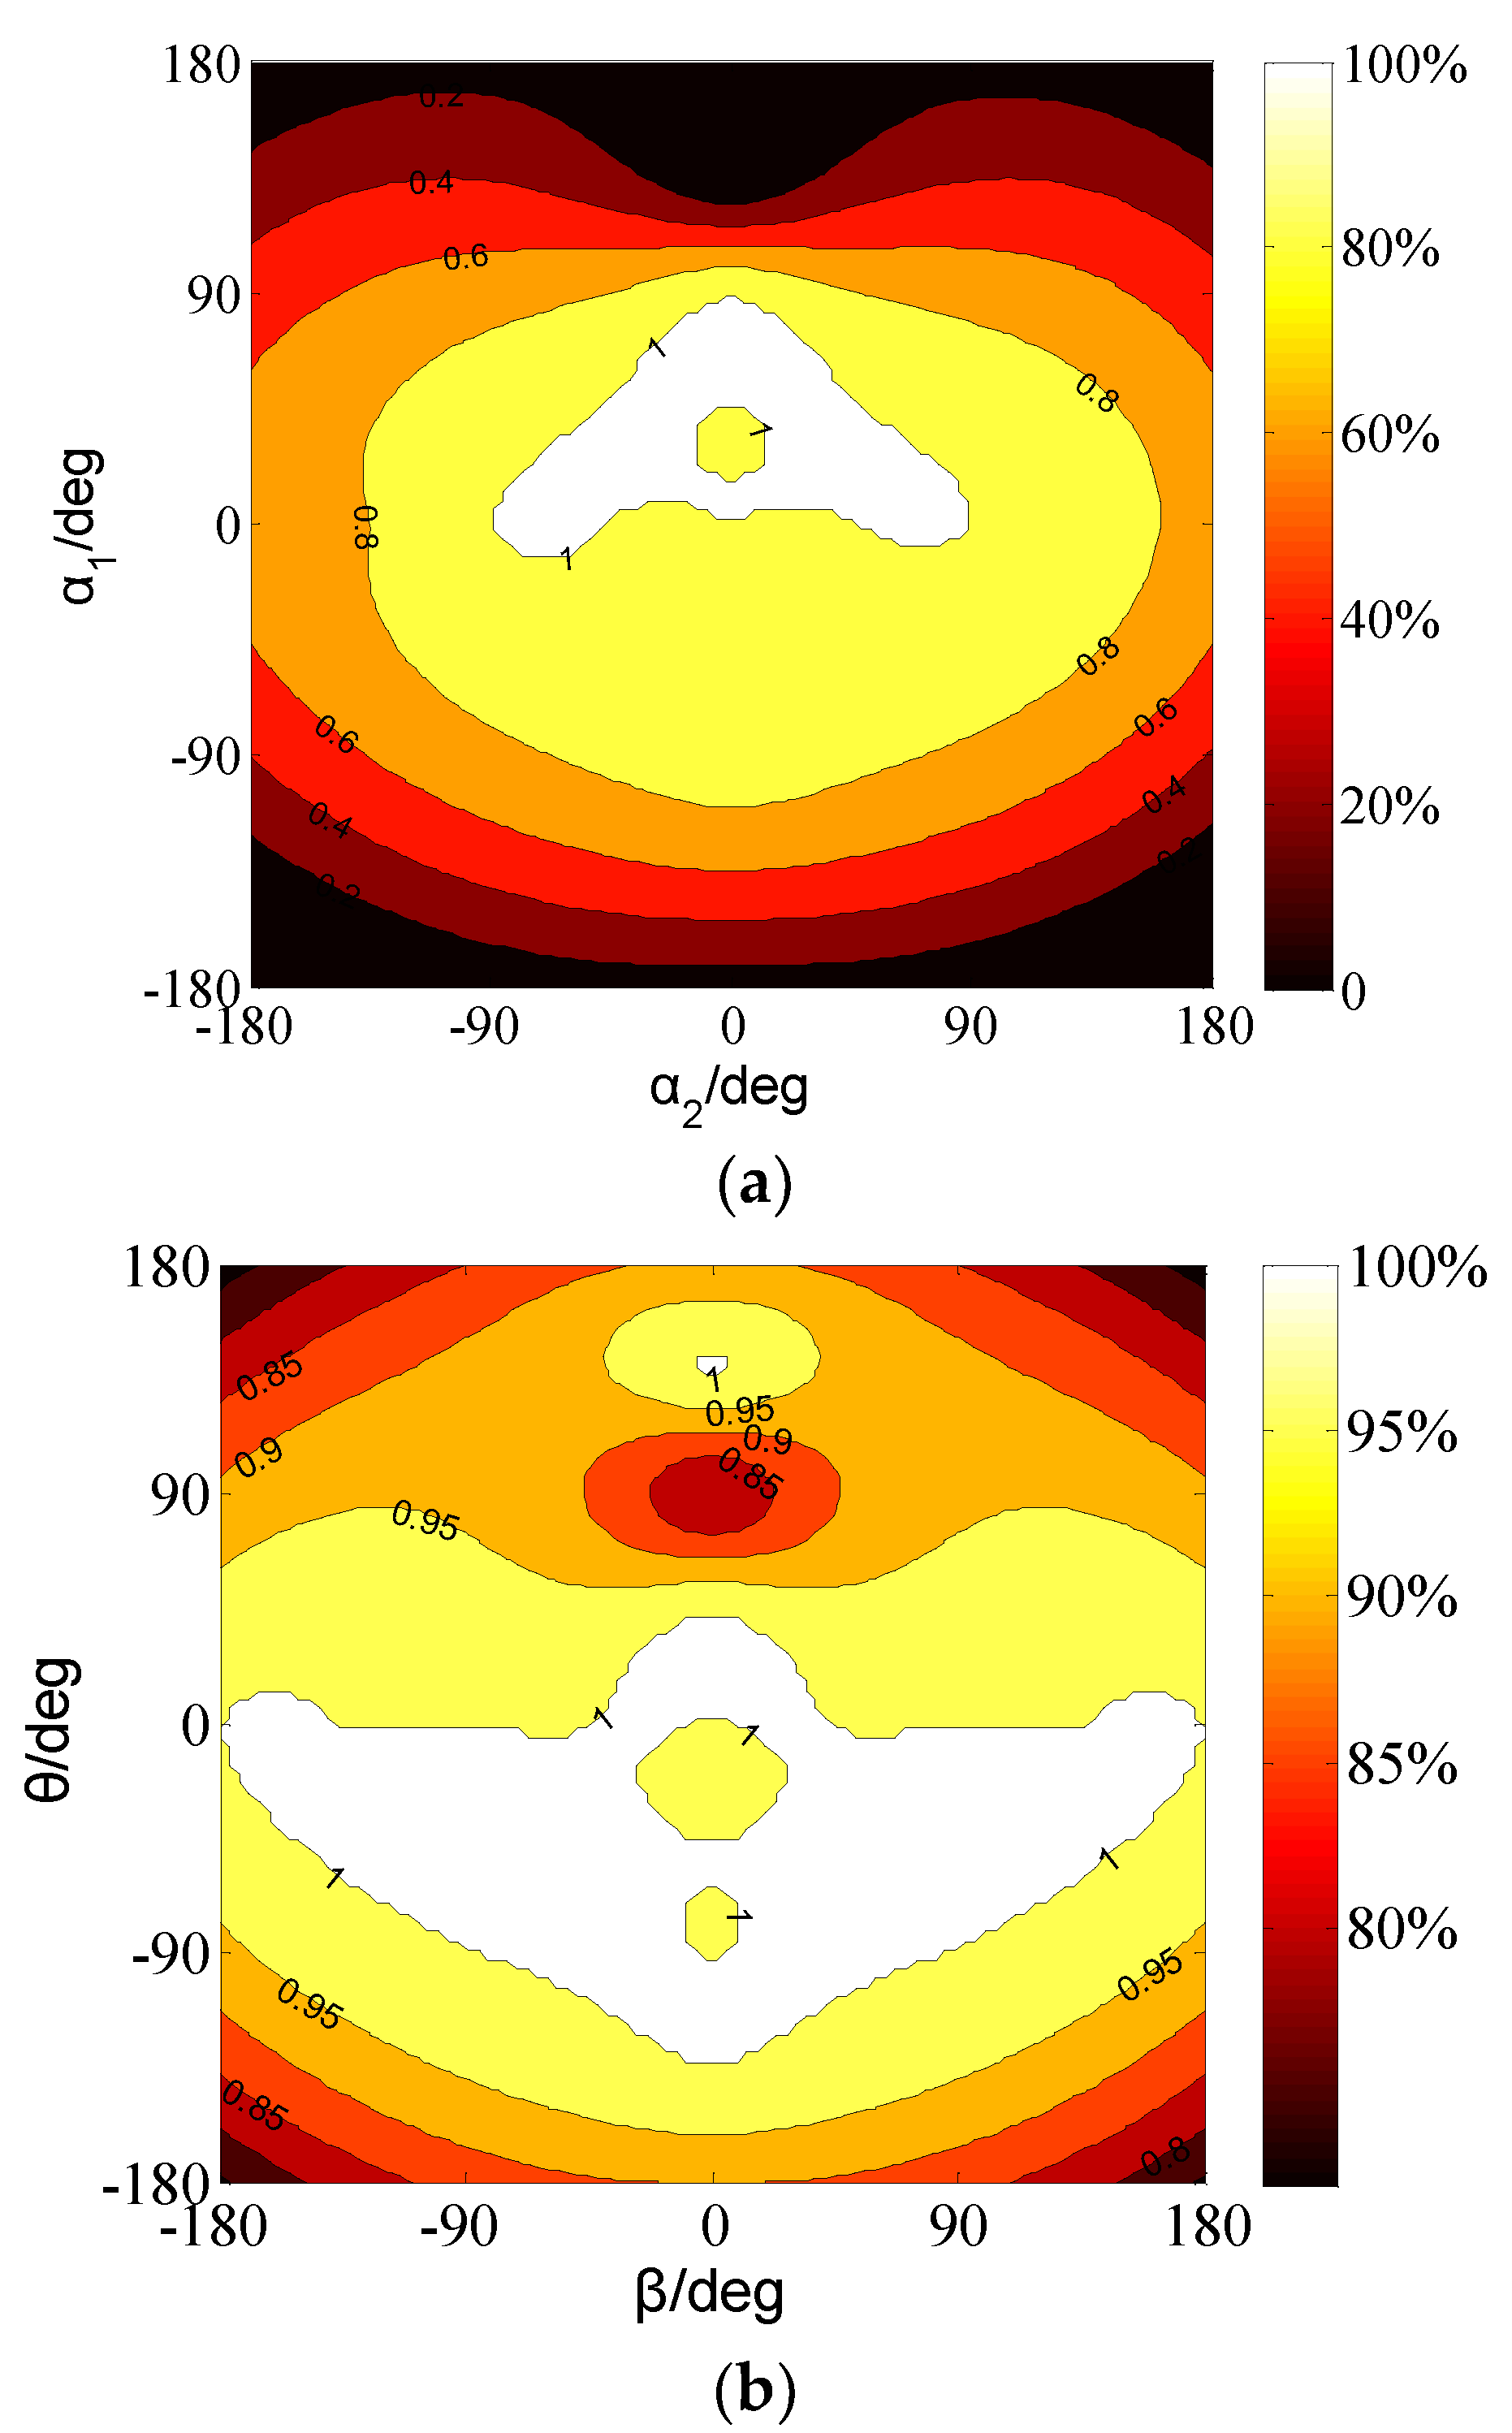
Figure 11 shows that the proposed anchor antennas have a high DOA estimation accuracy in the pitch angle from 0° to 30°, whereas the DOA estimation accuracy becomes poorer when the pitch angle is greater than 45°.
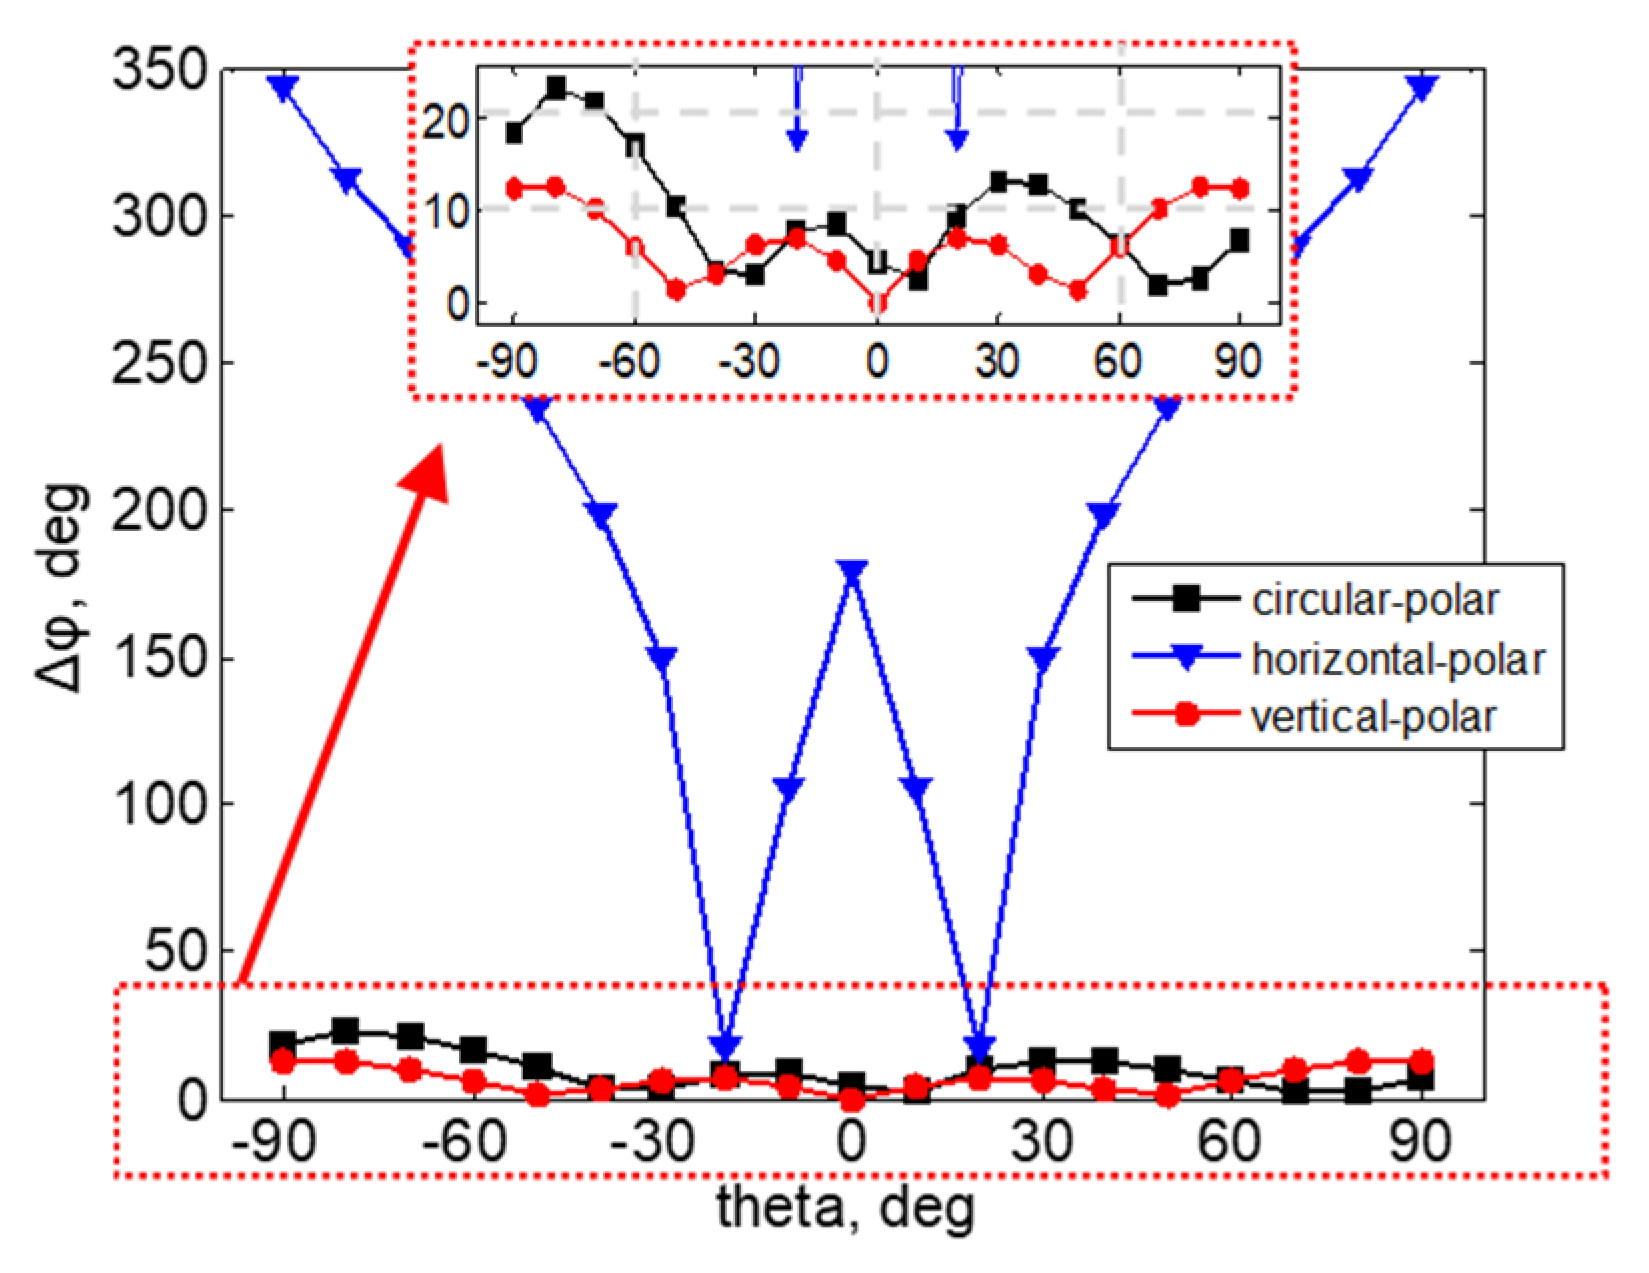
Figure 12 shows the deviations between the extracted phase difference and the ideal difference calculated using Equation (1), denoted as Δ
ϕ under three polarization scenarios of the incoming signal. Since the horizontally polarized wave was orthogonal to the polarization of the anchor antennas, it resulted in significant errors in the phase difference. For vertical and circular polarizations, the anchor antennas resolved the phase difference with an error of less than 15° on average. A CP antenna was preferred because the reception was less affected by the axial rotation of the tag antenna. Furthermore, the tag antenna required a wide beamwidth to compensate for the deflection of the beam from O
1O
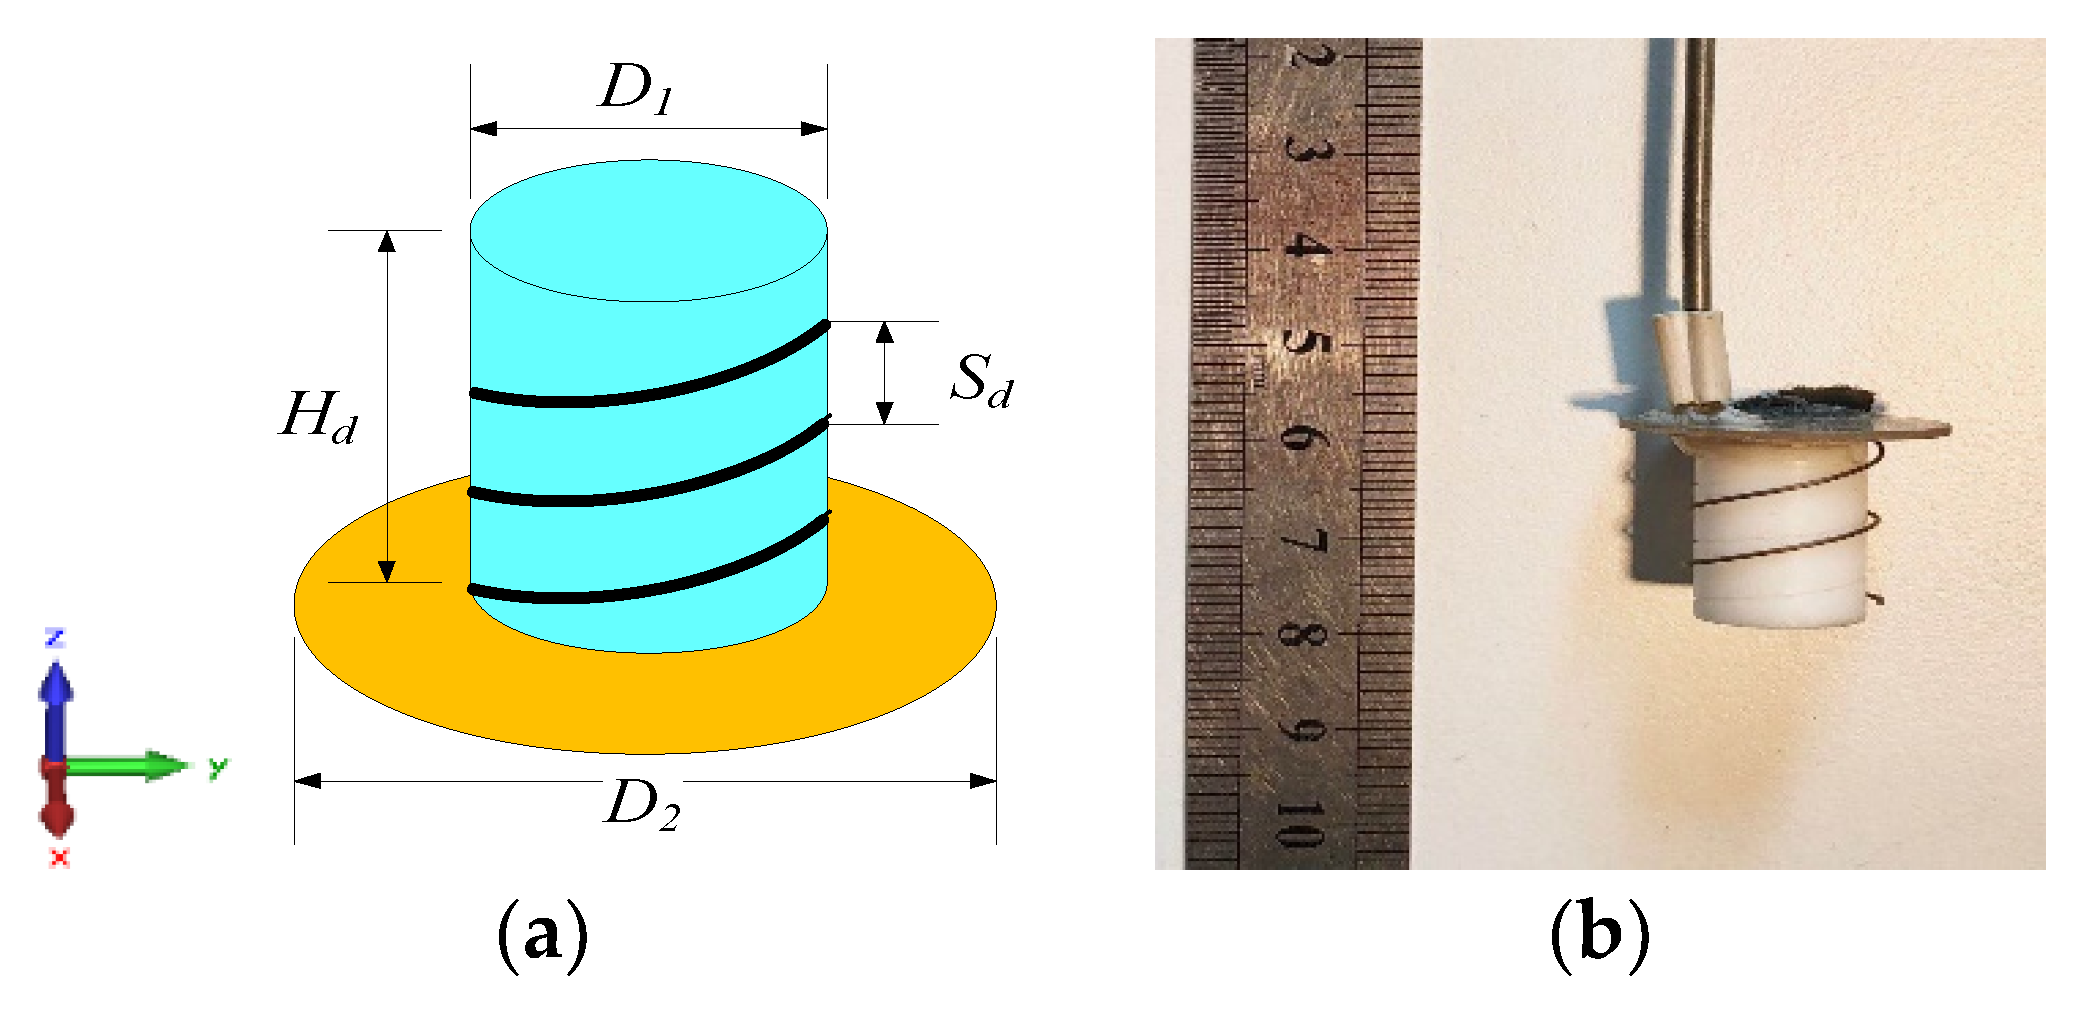
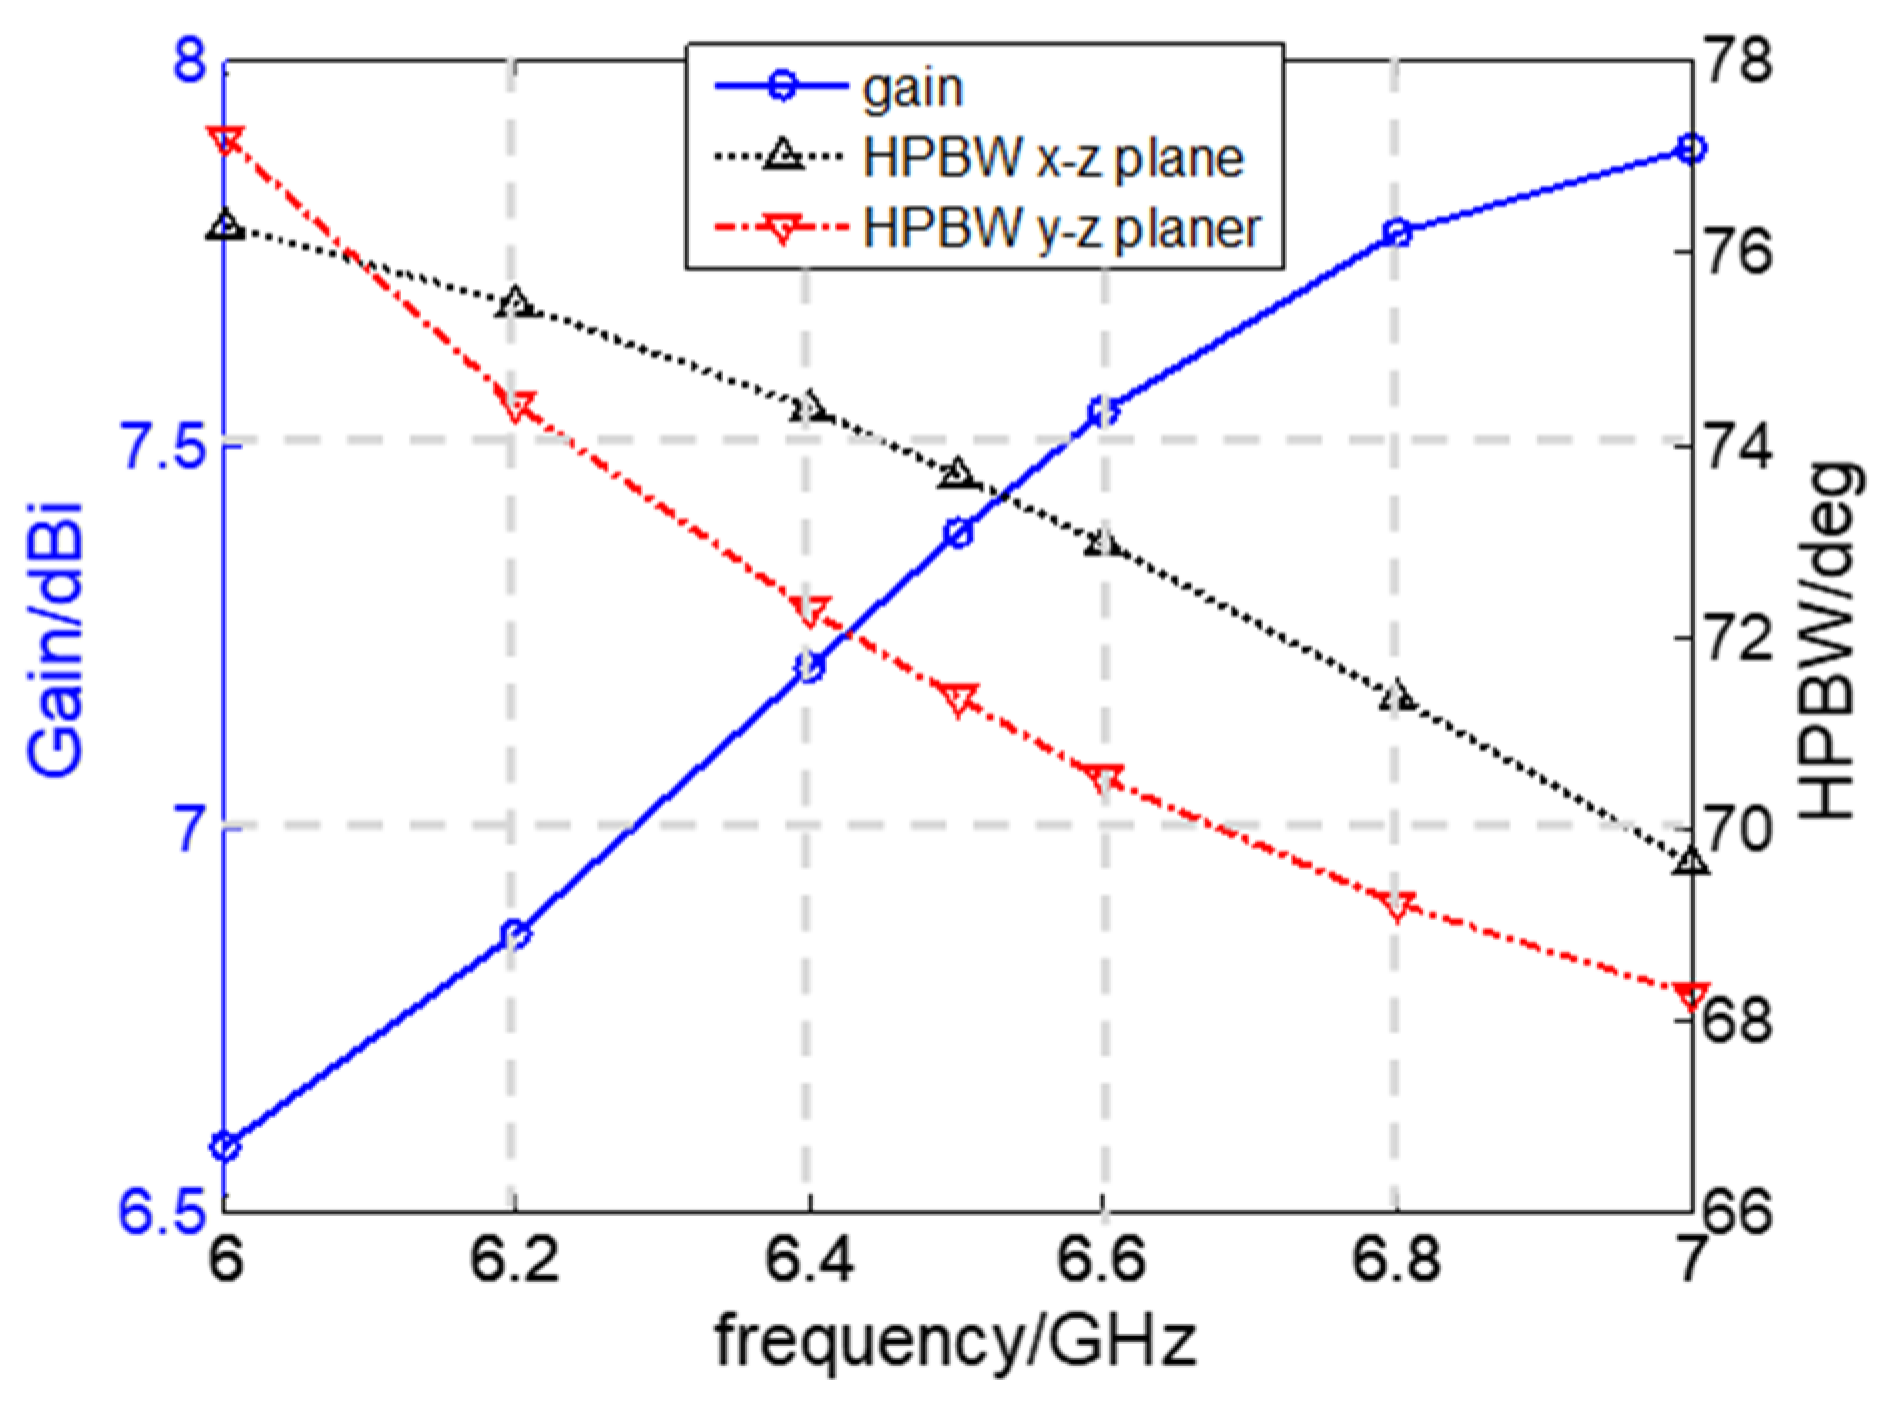
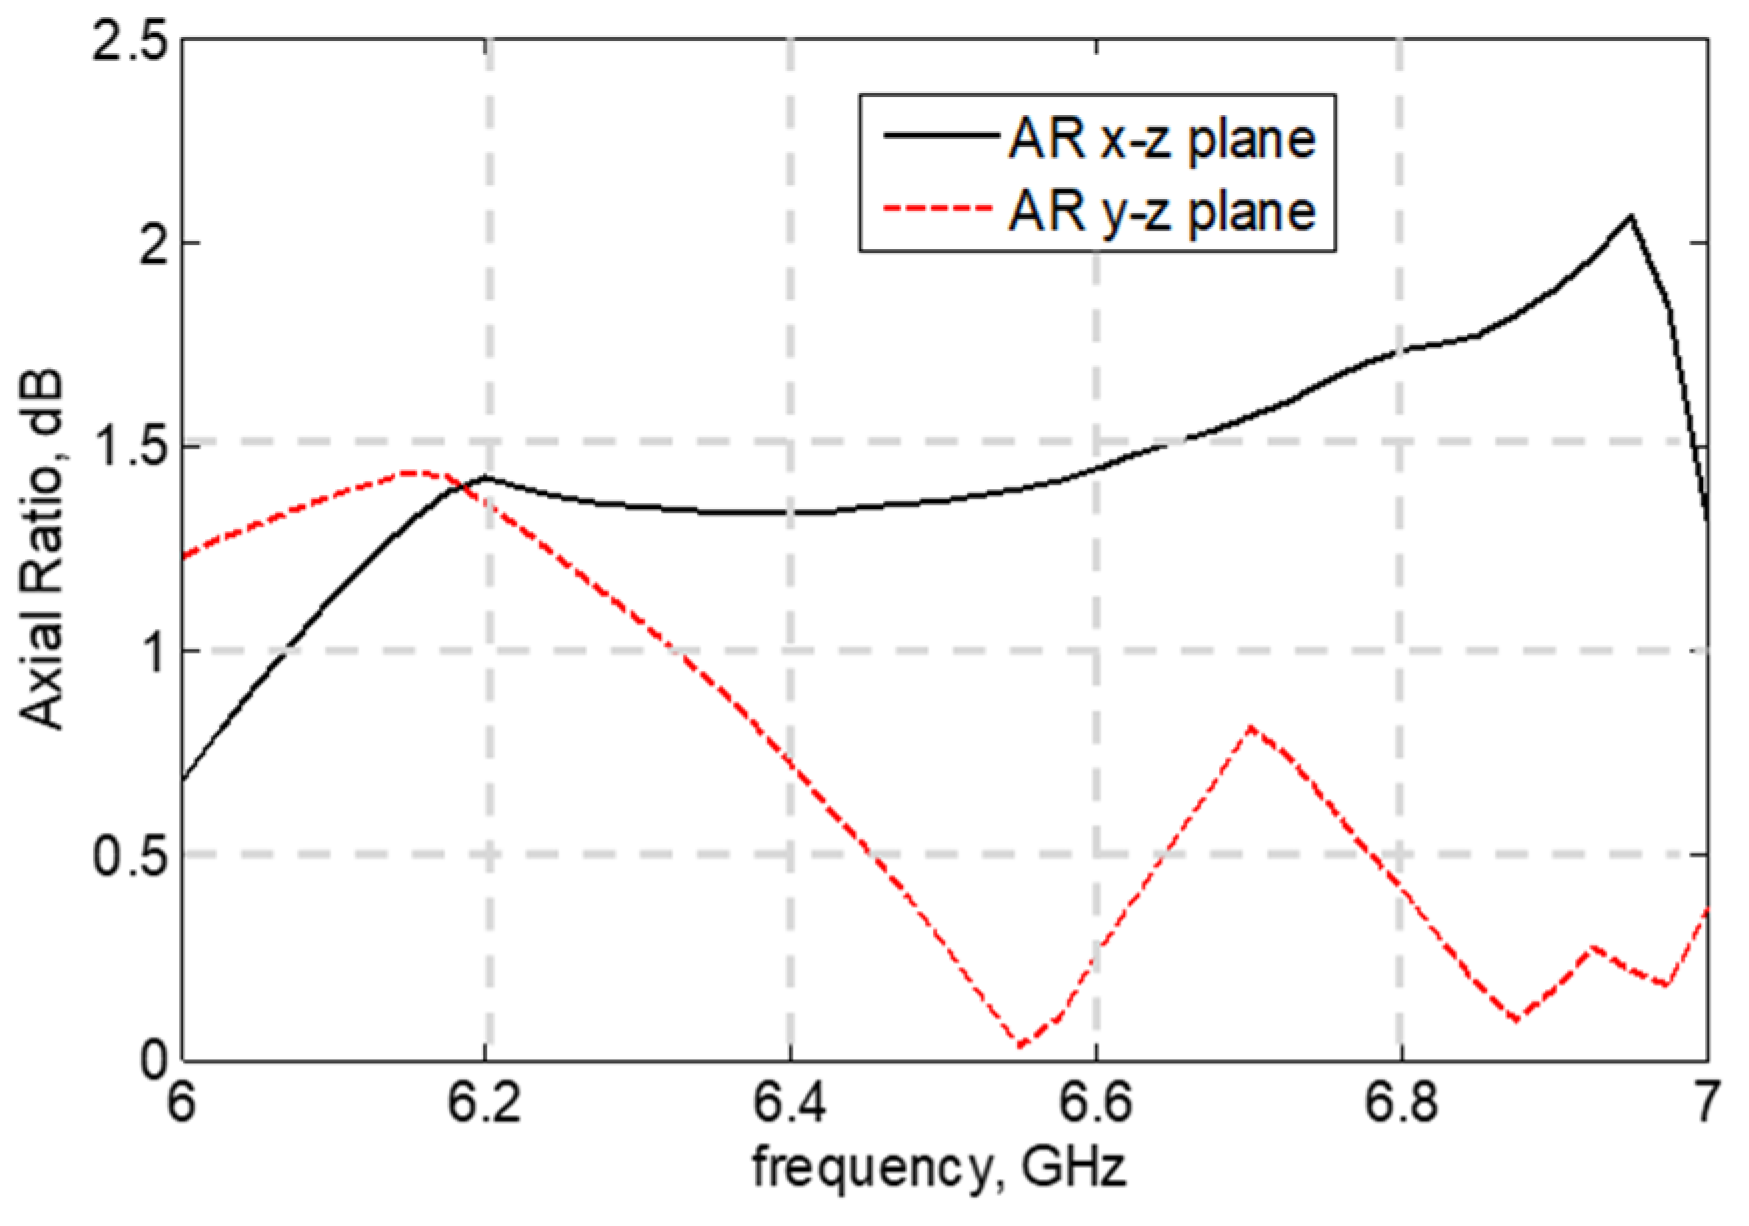
2. Considering these factors, the tag antenna must have circular polarization and wide beamwidth to provide a reliable DOA estimation.
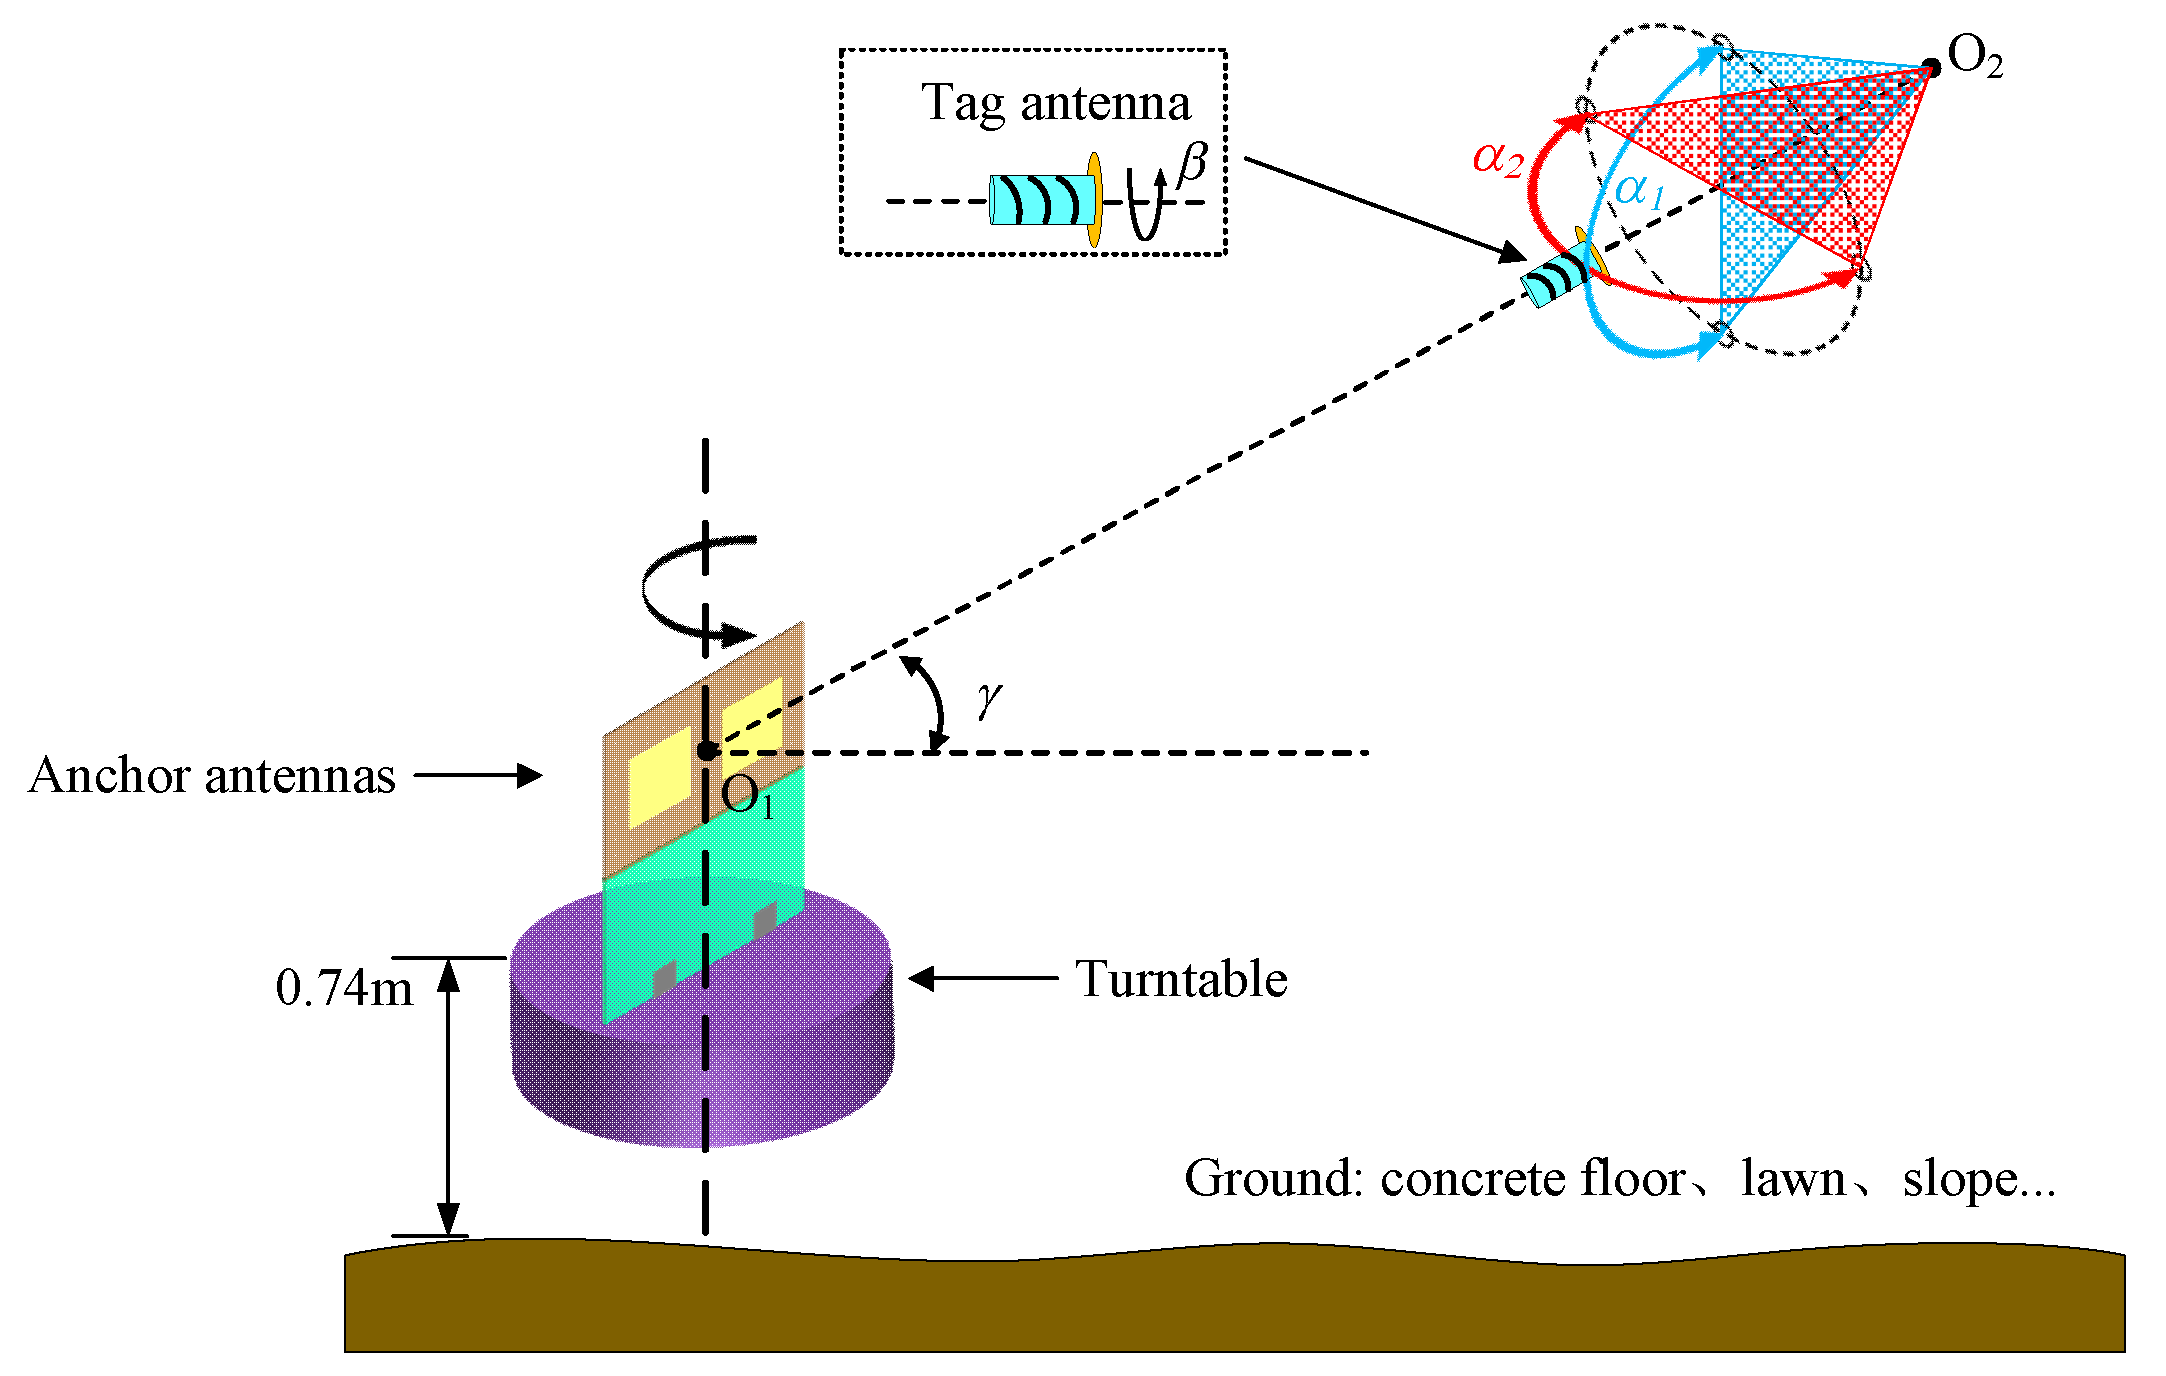
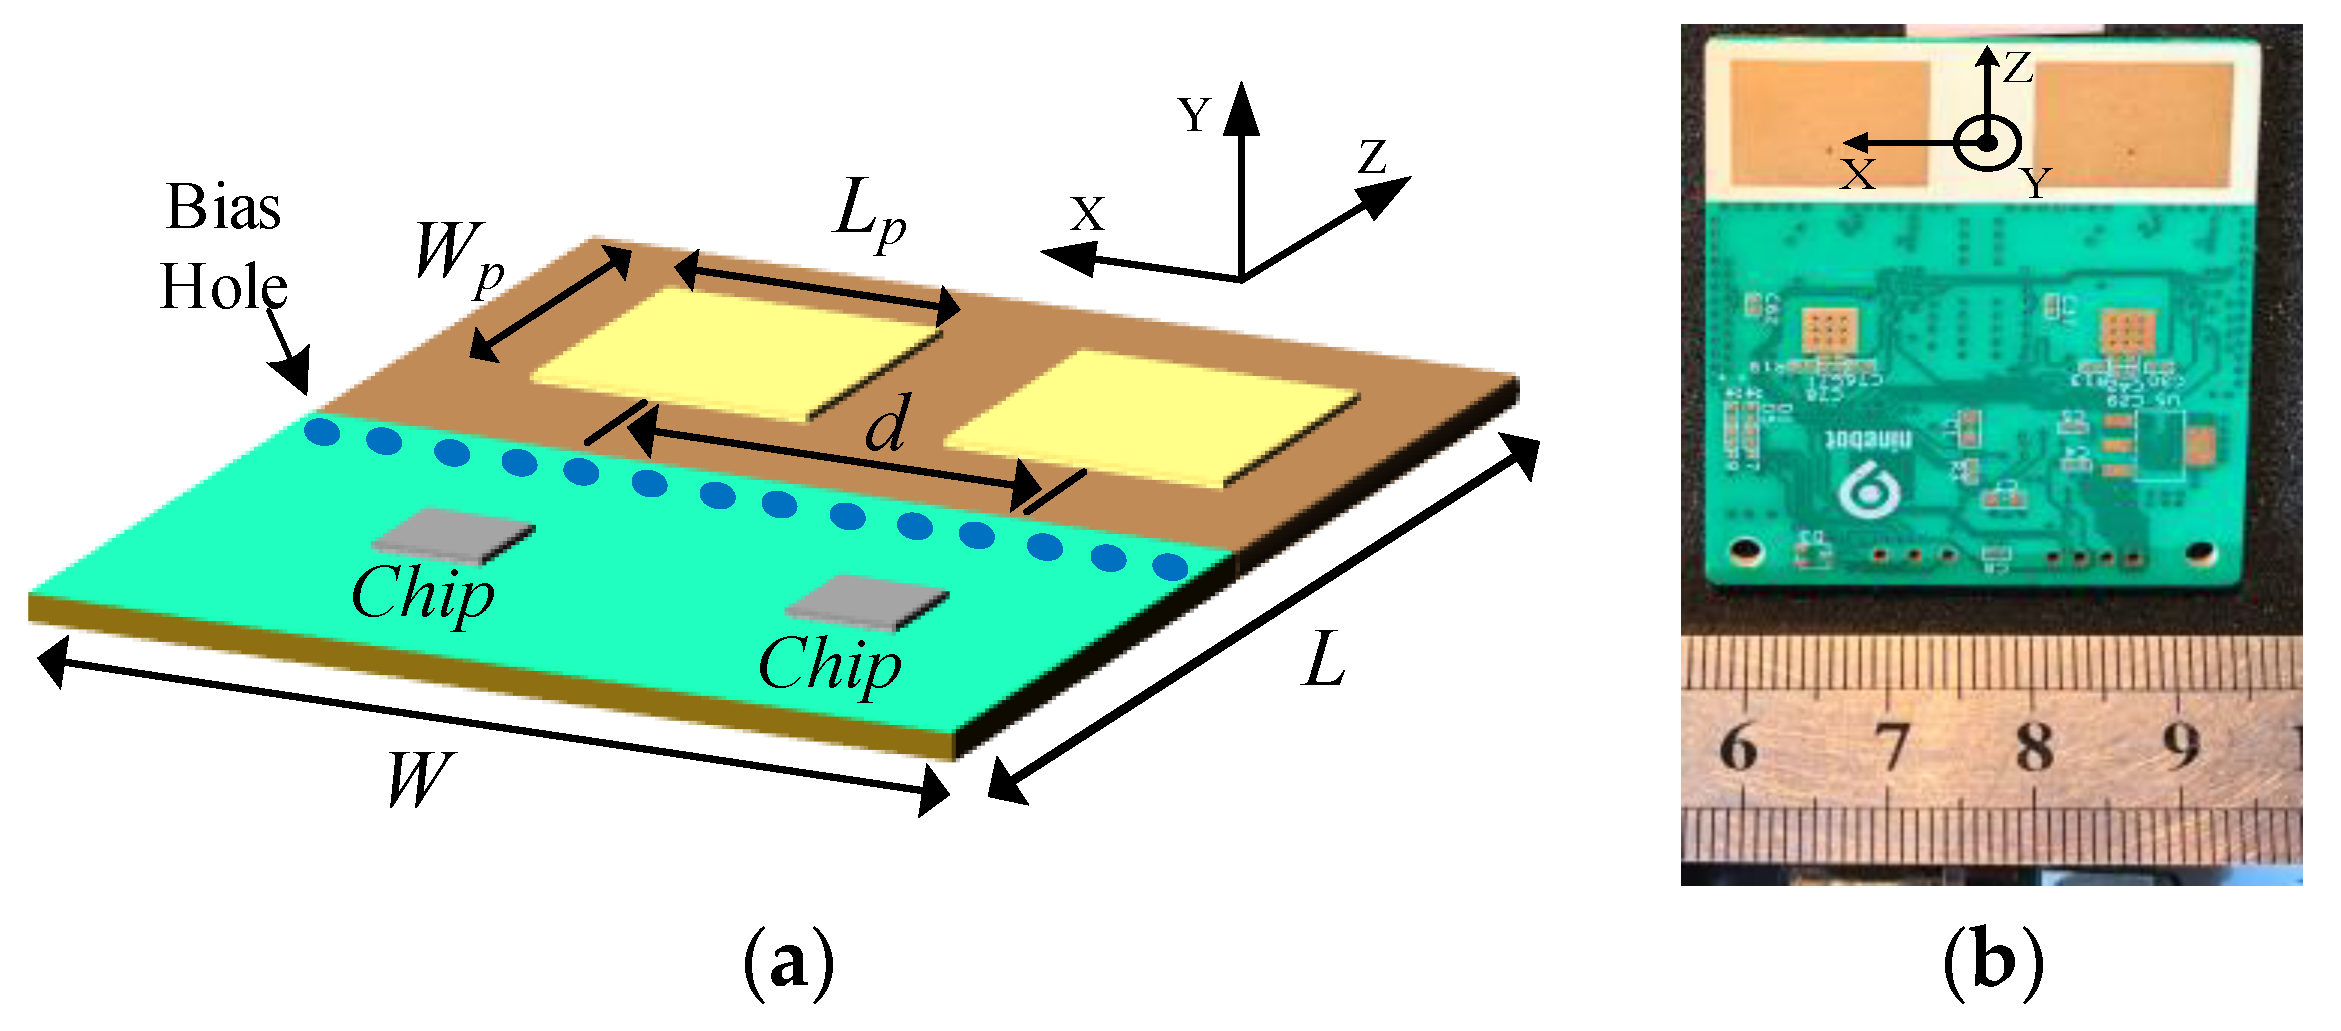
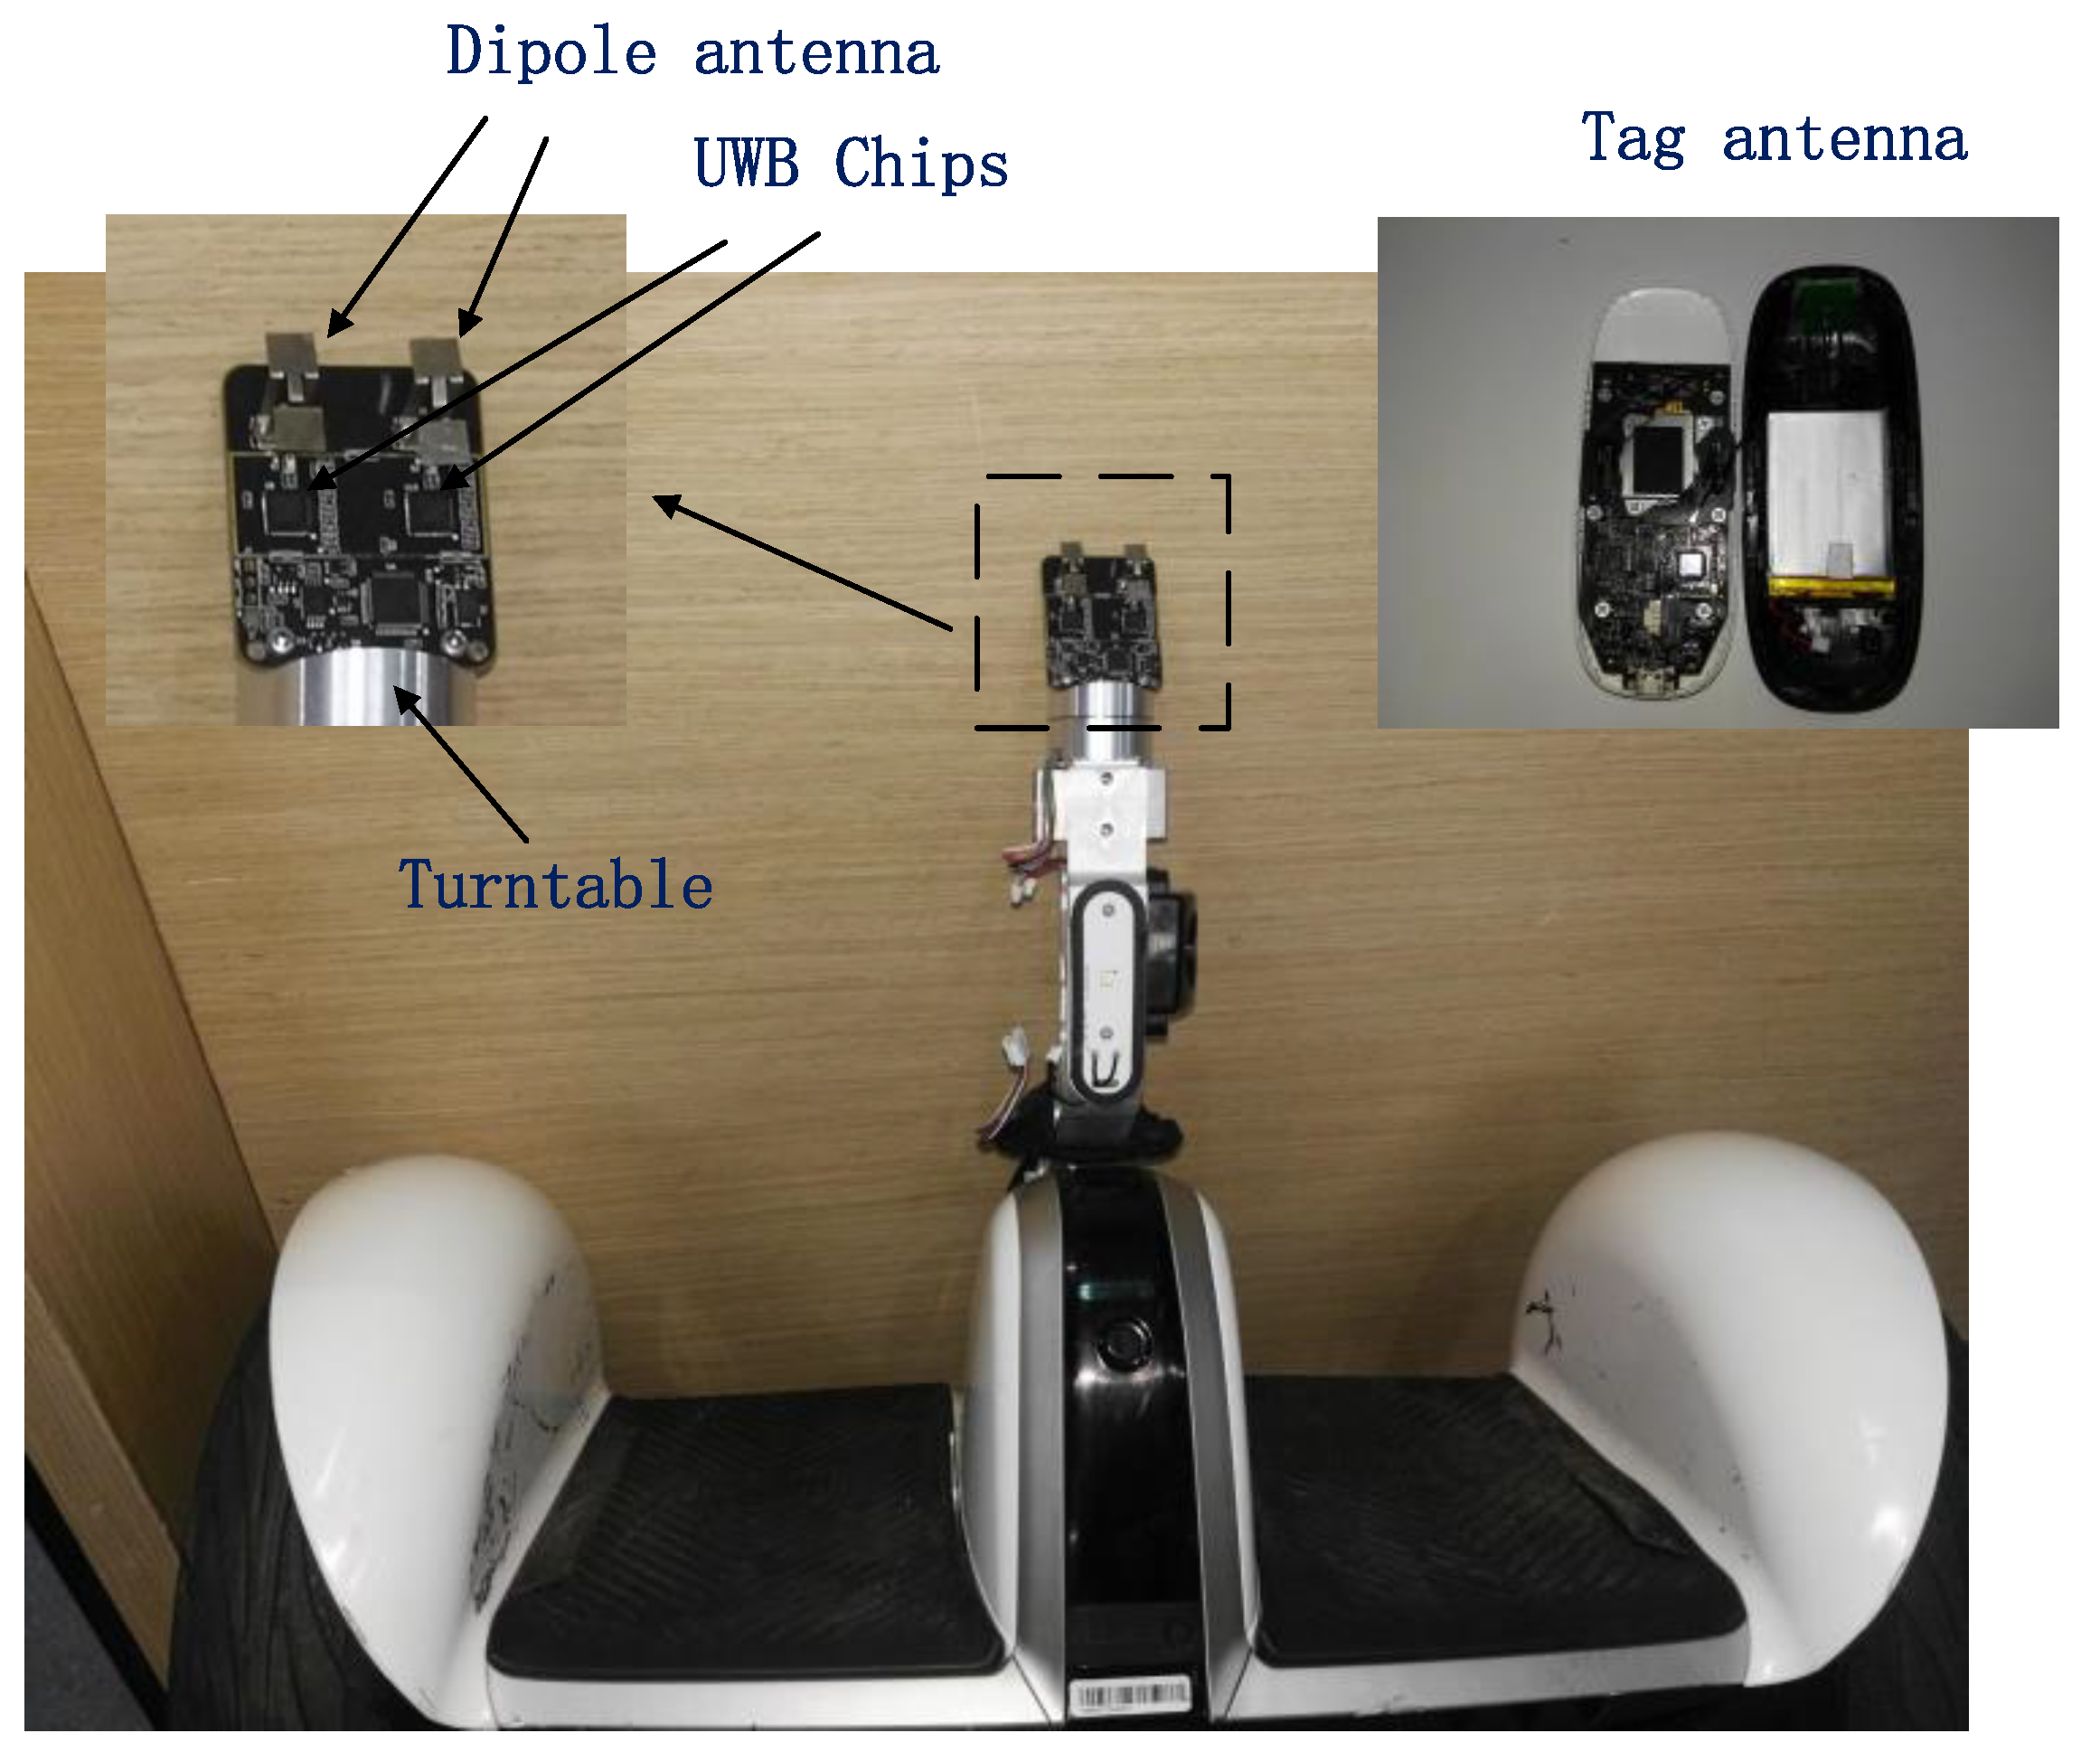
Considering all of the aforementioned factors, we propose a system architecture of the PDOA-based localization as shown in
Figure 13. It contains two anchor antennas on a turntable installed in a self-balancing two-wheeled vehicle and a tag antenna mounted in a handheld device. The tag antenna in the handset was used to transmit a UWB signal containing bearing information to the anchor antennas. The turntable was 0.74 m above the ground. The pitch angle,
γ, between the tag and anchor antennas ranged from 0 to 25°. The tag antenna was allowed to be deflected by
α1 in a vertical plane or
α2 in a horizontal plane from O
1O
2. In addition, the tag antenna was allowed to rotate at an angle (
β) around its axial direction.
α1 and
α2 ranged from 0 to 50°, and
β had a range of 0–360°. The operation range was 0–20 m.
Figure 14 shows the top view of two anchor antennas and their interaction with the incoming wave.
θ is the DOA ranging from –180° to 180°.
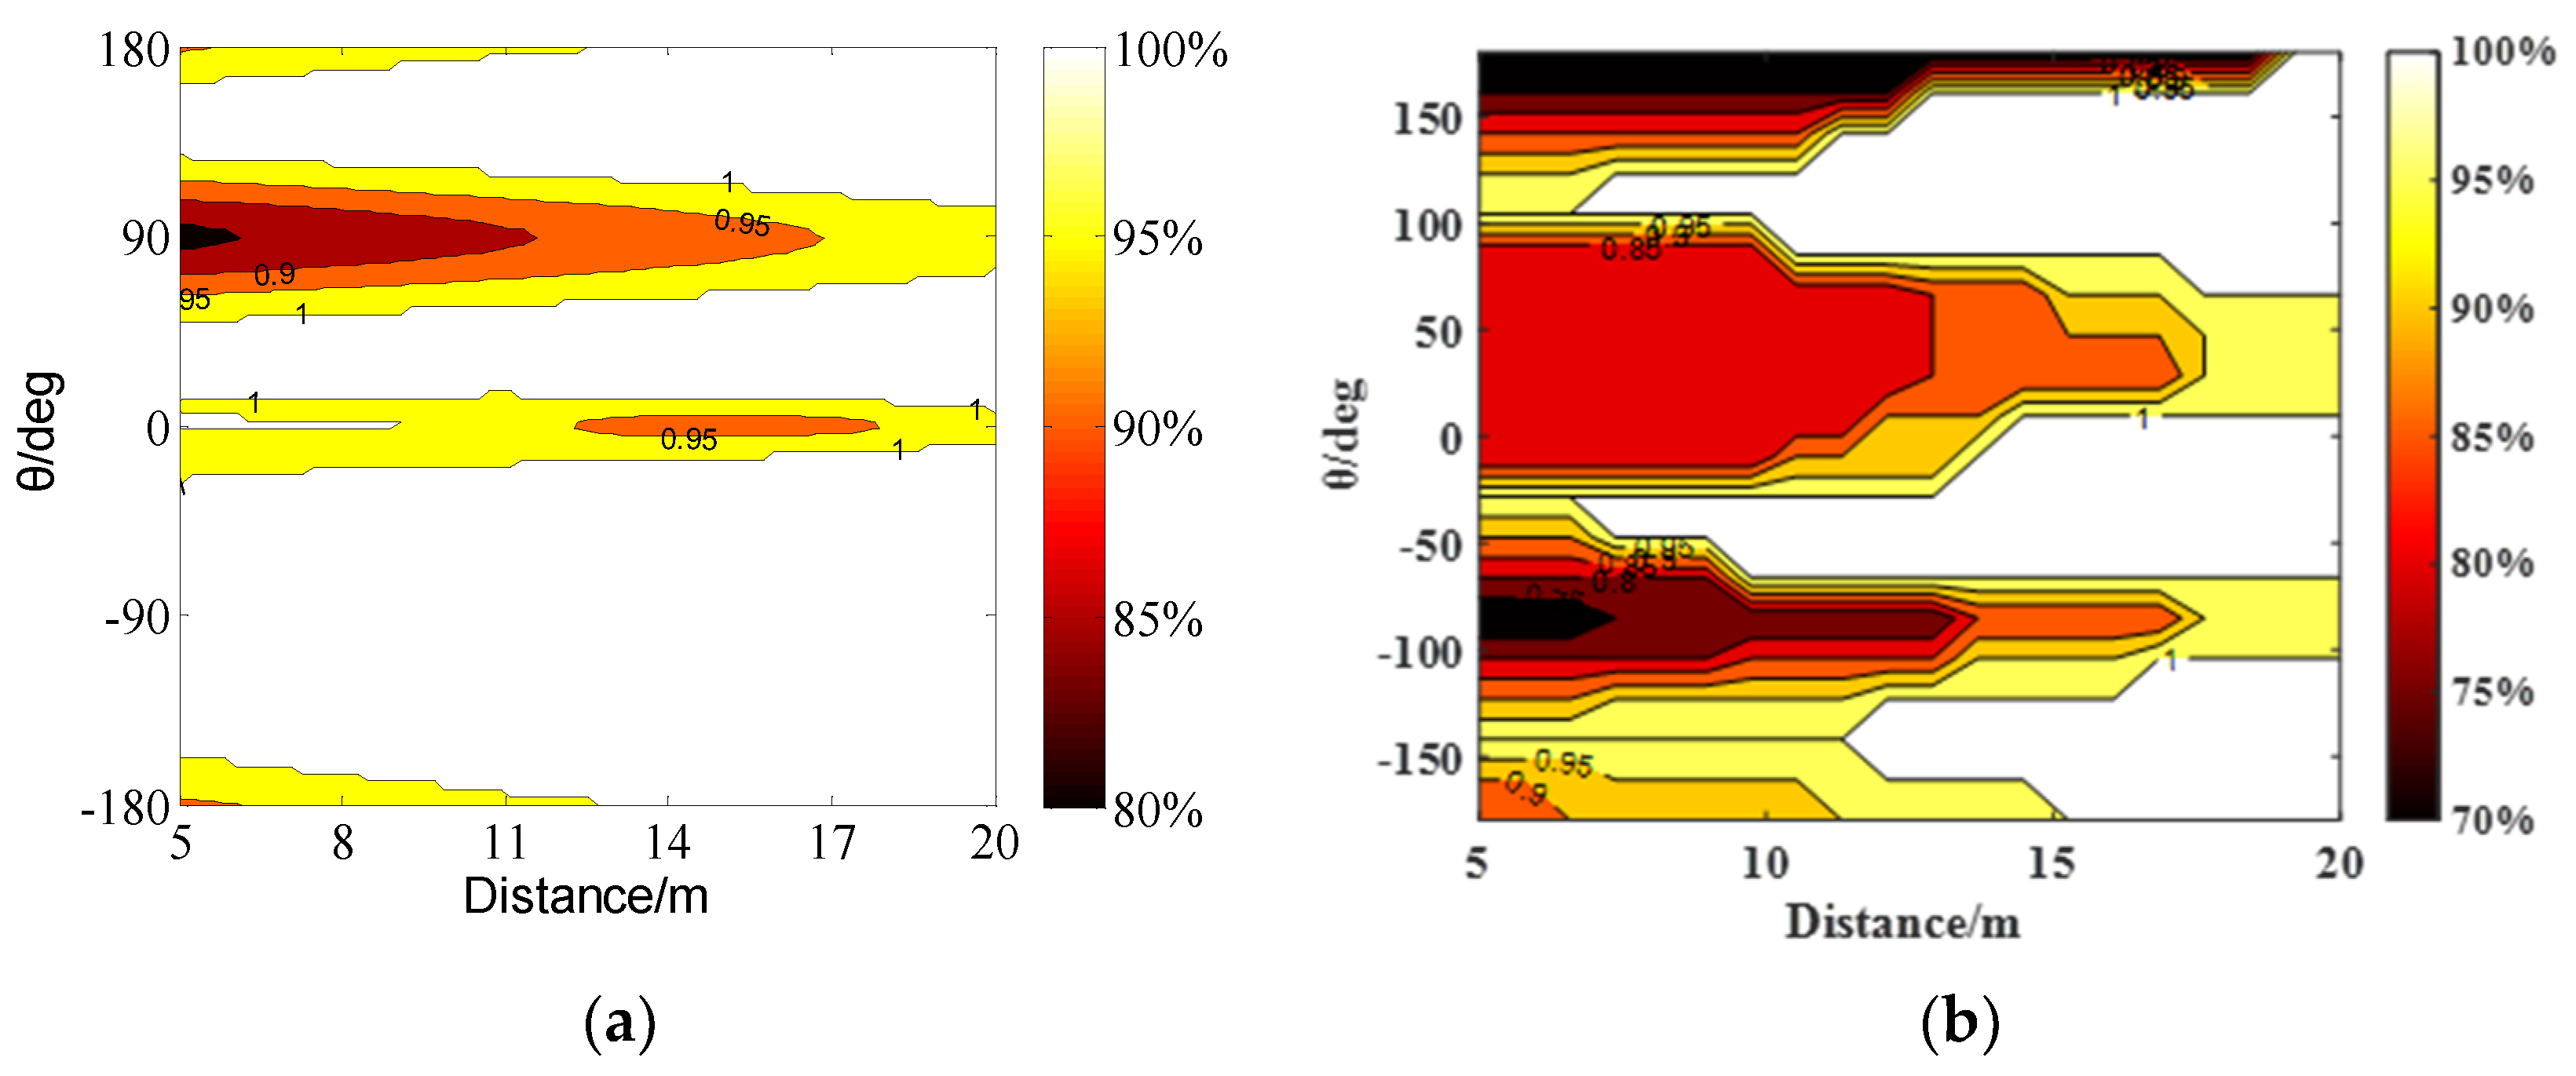
Decwave UWB chips were used for providing receiving signal phase information. Combined with the DOA information, localization was achieved with a standard deviation of less than 10 cm. The system operates as follows: the turntable first rotates a full circle to identify and then track the maximum radiation direction of the tag antenna and align the normal vector of the anchor antennas to it. The phase difference between the UWB signals received by the two anchor antennas are extracted and processed by the two low-cost UWB chips. Subsequently, the TOF between the tag and anchor antennas is obtained. Through data processing, accurate DOA and range estimation is established. Finally, the self-balancing two-wheeled vehicle locates the object and tracks it. The rotation of the turntable allows the anchor antennas to always set
θ to approximately 90° and aligns the maximum radiation direction of the tag and anchor antennas.
Figure 11 shows that this alignment further improves the DOA estimation accuracy and reliability because the DOA estimation precision is relatively high when
θ is small.
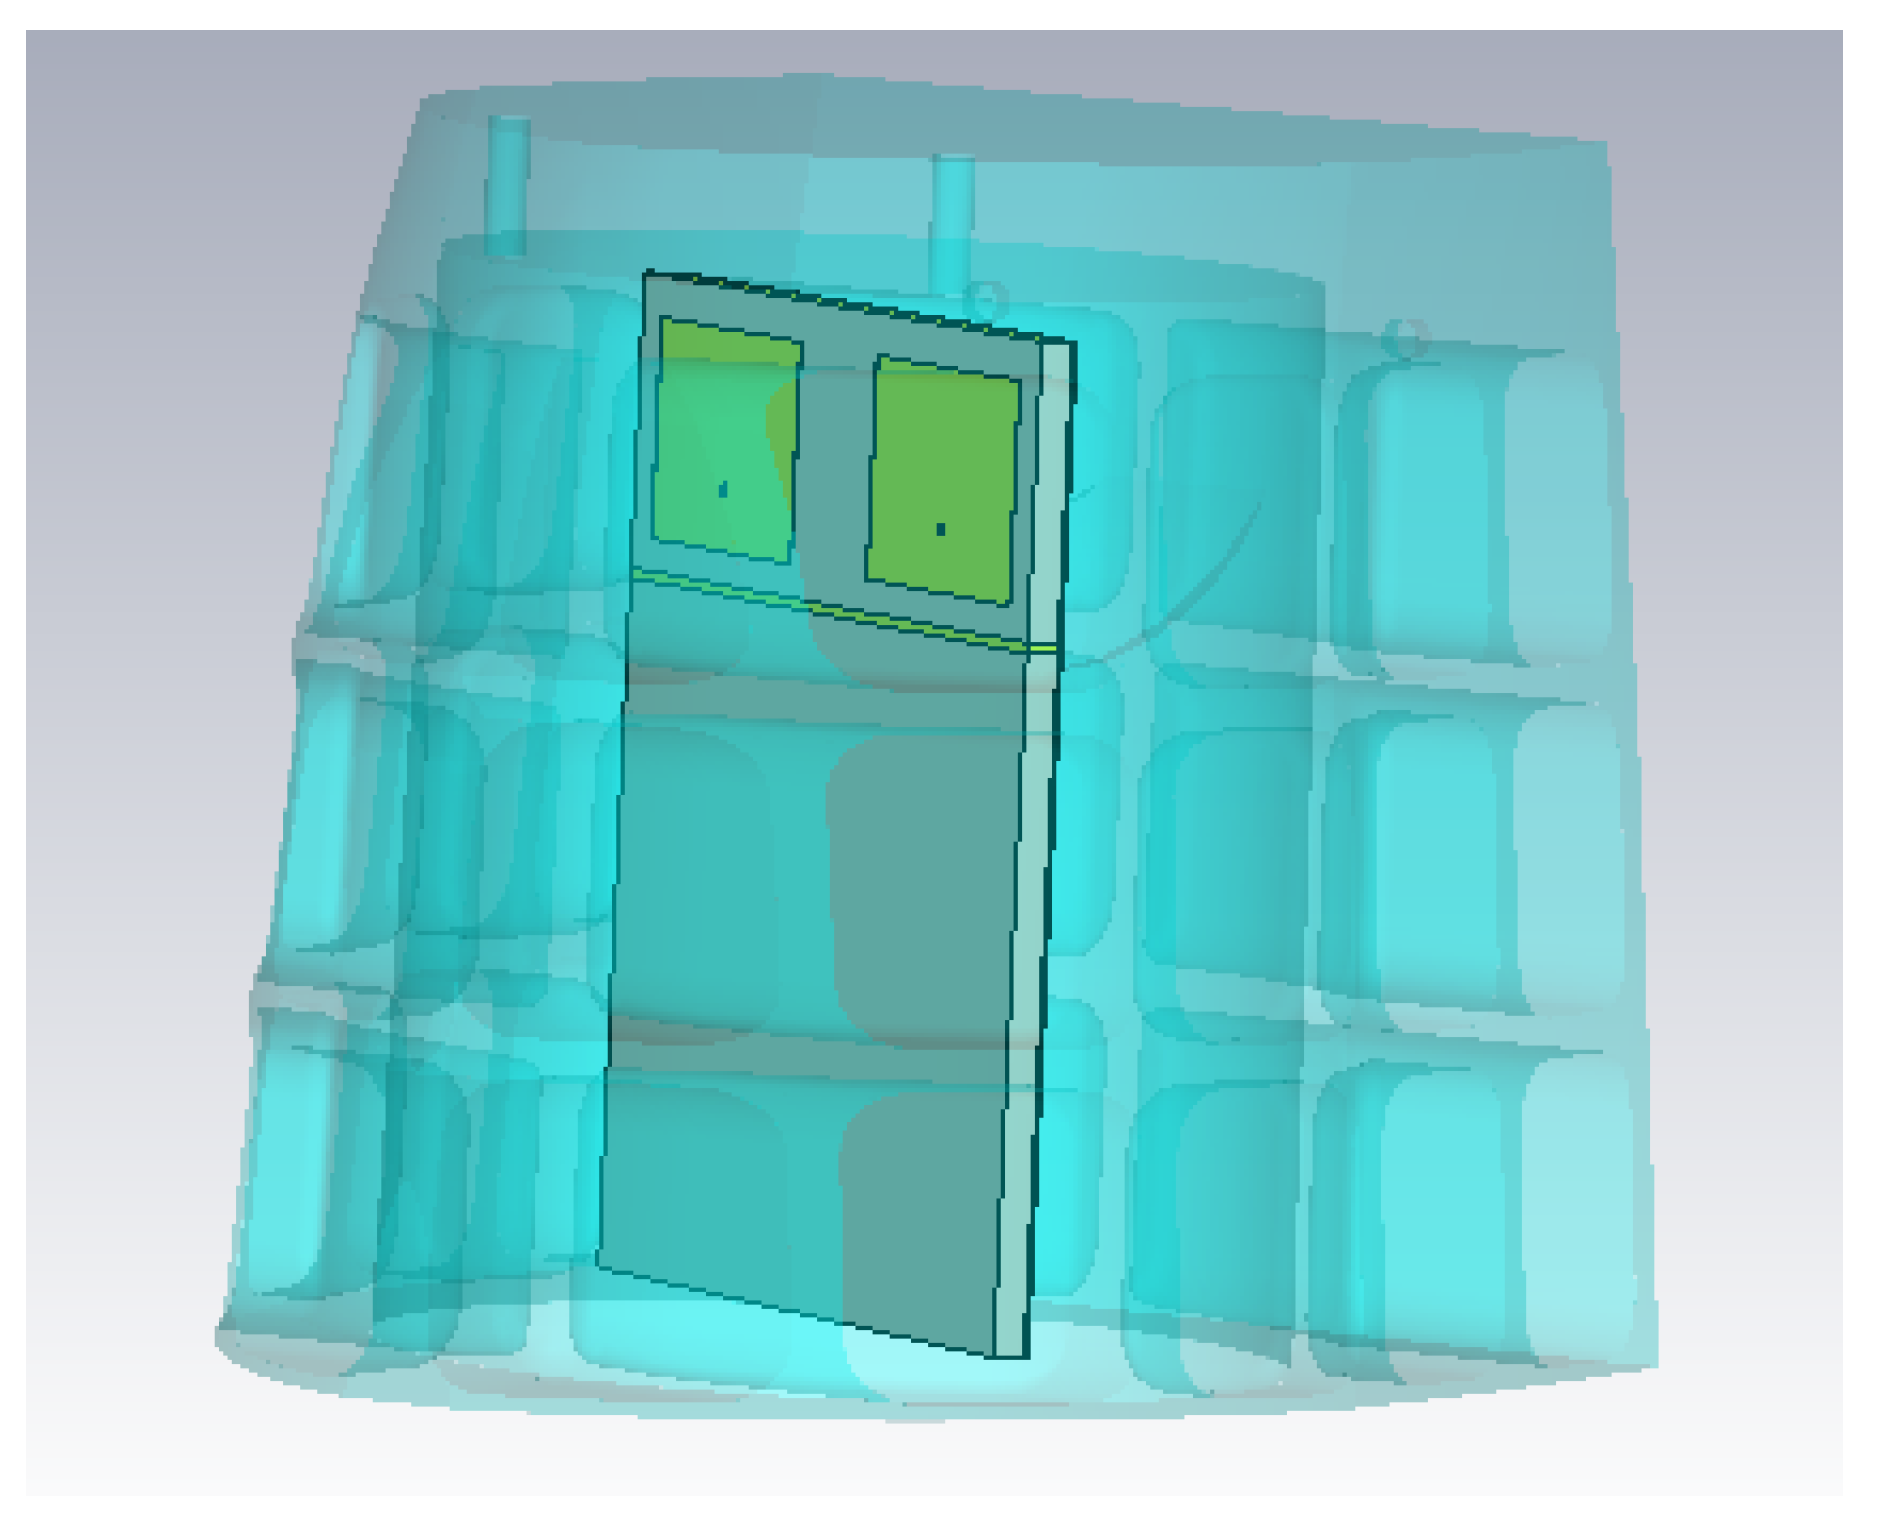
Figure 15 shows that, in practical application, the mechanical supporting structure covering the proposed anchor antennas is inhomogeneous. This material inhomogeneity and cover effect not only degraded the XPD of the anchor antennas, but also introduced an additional phase difference into the received signals.
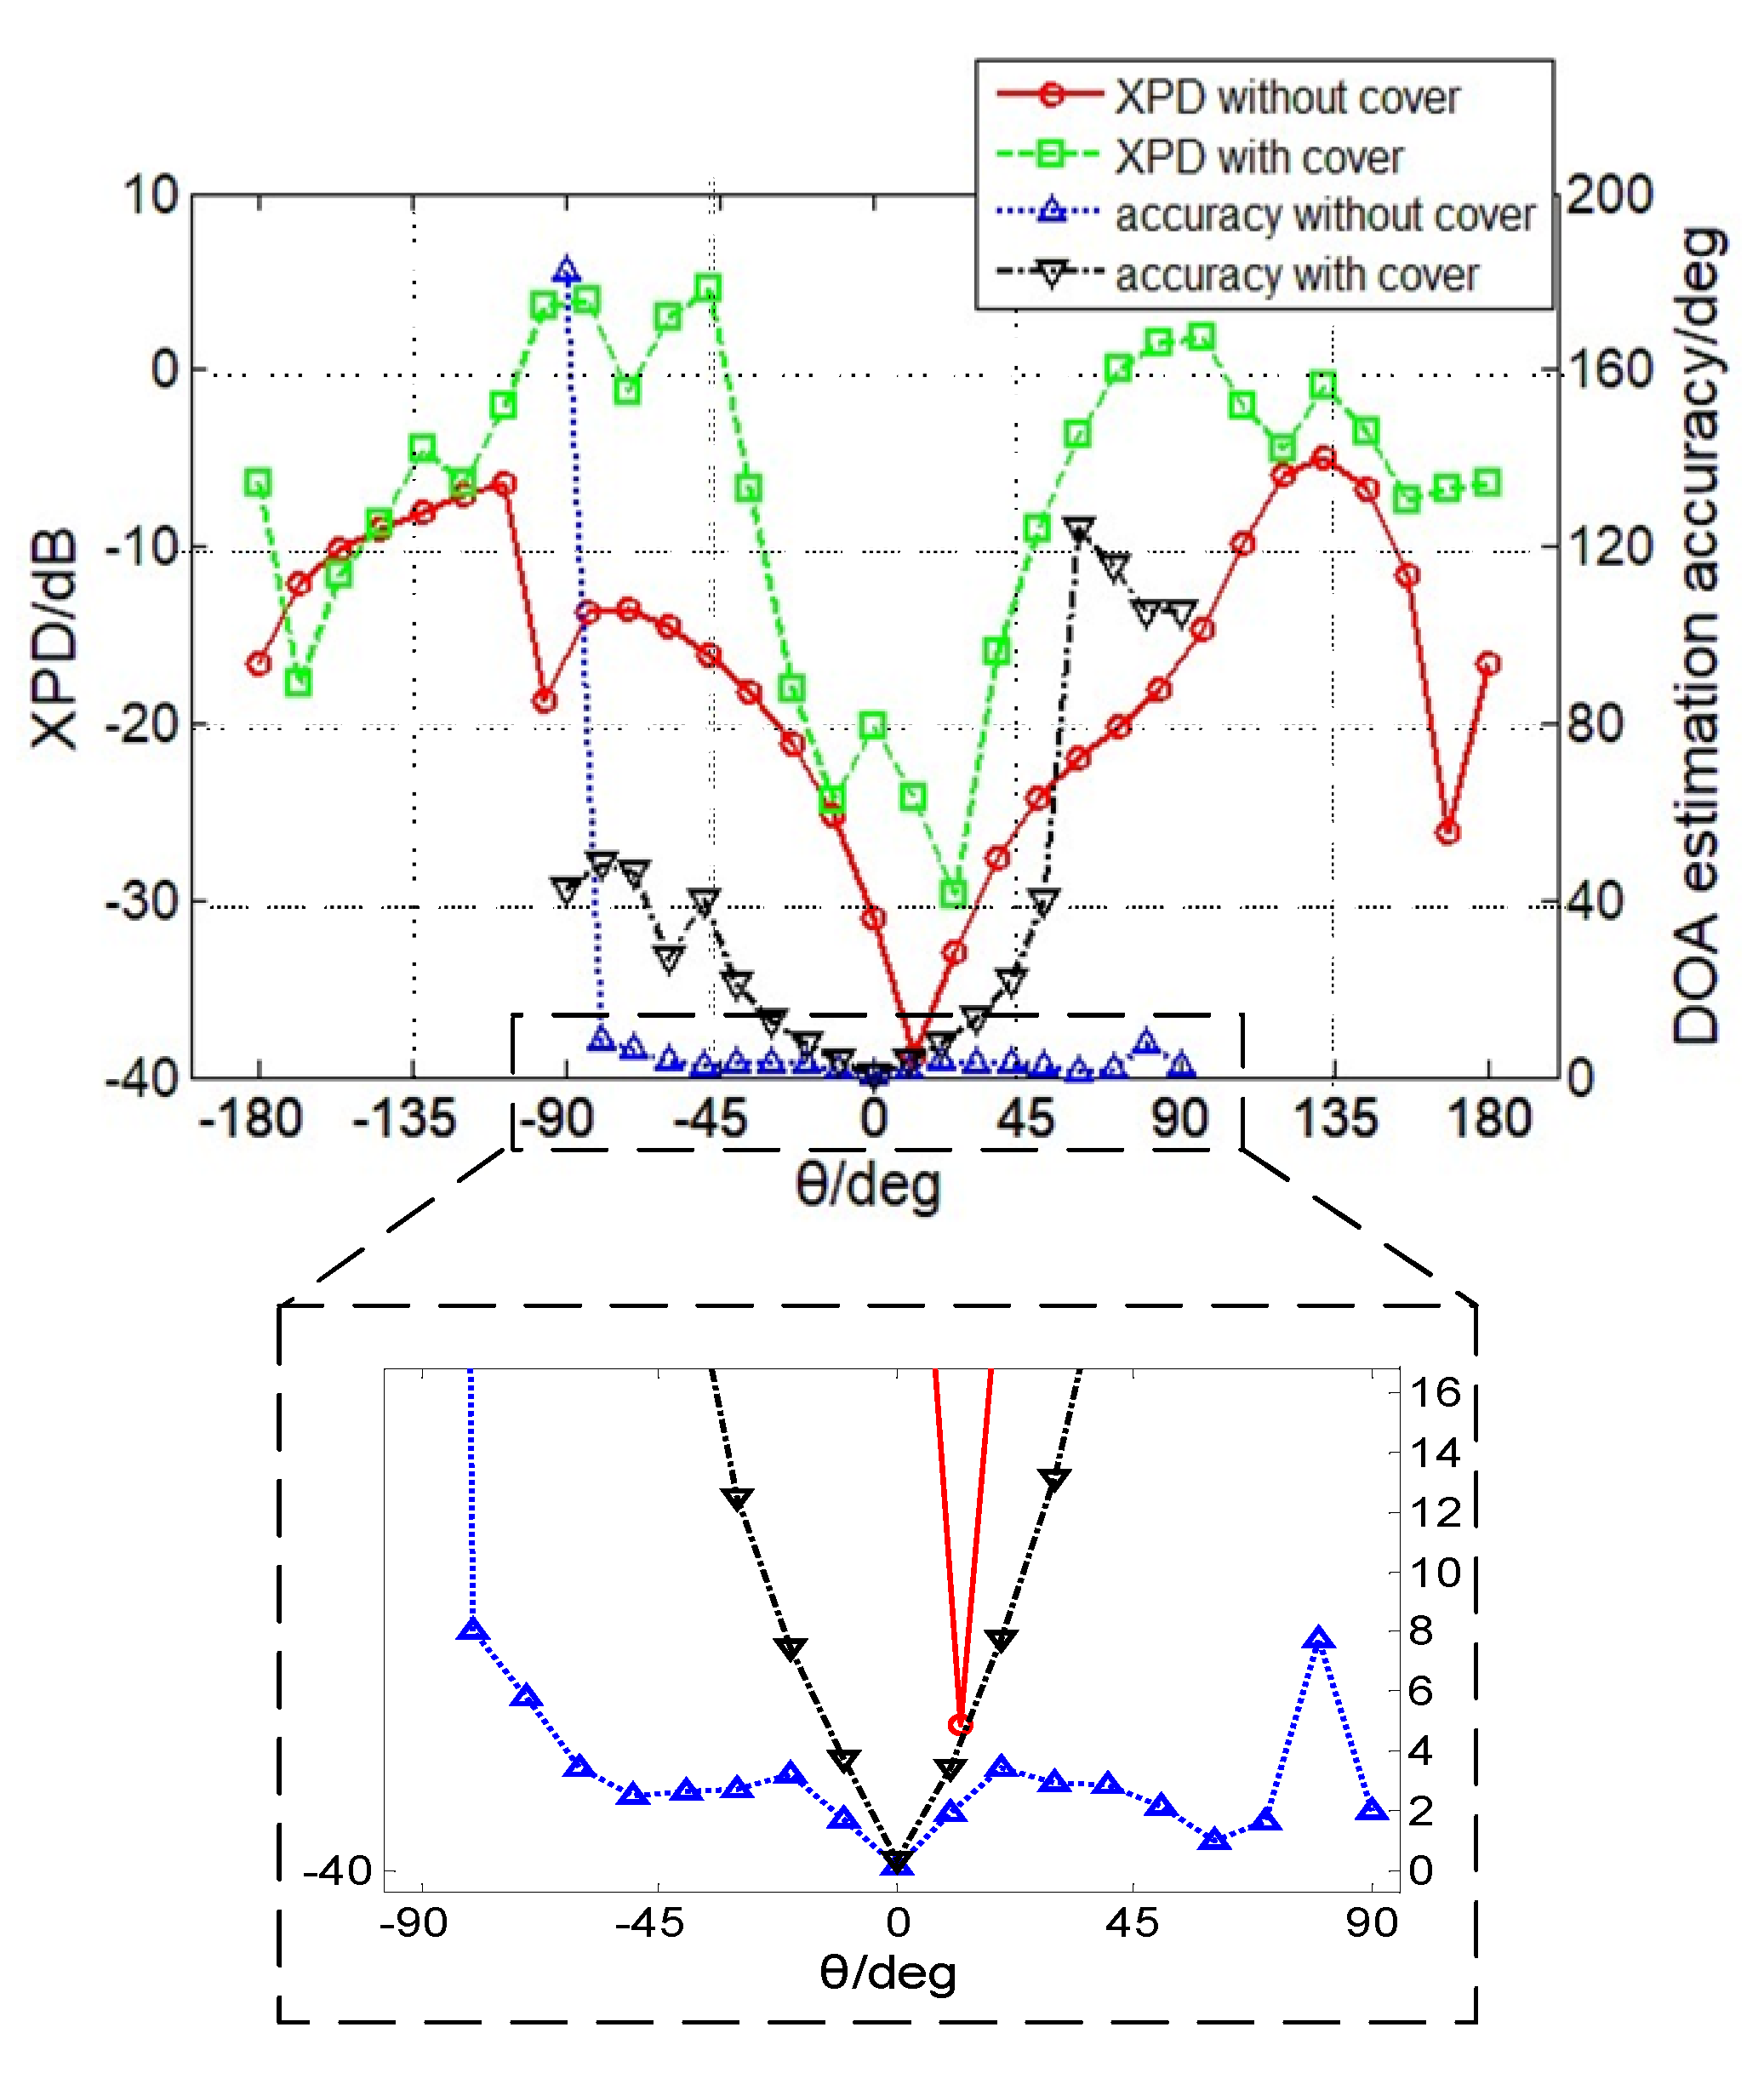
Figure 16 shows that, with the cover, the azimuth angular range (
θ) corresponding to the XPD of higher than −15 dB was reduced to ±25°. Although the DOA estimation accuracy over this range was reduced to 10°, it was still high around the
θ of 0°. Therefore, a high polarization purity while using the turntable allowed the DOA estimation accuracy of the proposed anchor antennas to be insensitive to the mechanical supporting structure. This ensured the reliability of the positioning system.
4. DOA Estimation Algorithm
This section presents the proposed correlation matching algorithm for the DOA estimation with a pre-stored phase-difference data set. It also discusses a least-squares method for calibrating the pre-stored data set.
Figure 14 shows the topology of anchor antennas with two linearly polarized receiving nodes. The high front-to-back ratio of the anchor antennas enables capturing the signals of the incoming wave in the front semicircle without an ambiguous solution in the back semicircle. The phase difference extracted from the receiving signal is related to the azimuth angle (
θ) and elevation angle (
γ).
The arriving wavefront denoted by
is expressed as
where
is the position vector and
is the propagation vector of the plane wave. As shown in
Figure 14, the components of propagation
projected on a Cartesian coordinate system can be written as
Thus, the phase difference between the two anchor antennas is
where
d is the baseline length of anchor antennas,
is the position vector of the baseline, and
λ is the wavelength of an incoming wave in free space.
The anchor antenna installed in a prototype is first tested at a distance of 10 m to obtain a set of Φ in the front semicircle. This data set is stored in the memory of the Decawave UWB chips as the reference data for the correlation matching algorithm. The pre-stored data set of Φ can be expressed as
where
i = 0, 1–180,
γ0 is a constant altitude DOA in the test, and
θi is the azimuth DOA under pre-test, chosen as
However, Φ
1,i differs from the actual one, owing to the mechanical and electrical tolerance in the mass production process. These errors can be divided into the azimuth DOA deviation, Δ
θ, and phase-difference deviation, ΔΦ, as
where Δ
θr, Δ
θt, and Δ
θo denote the azimuth DOA deviation caused by rotation error, turntable tilting, and others, respectively. ΔΦ
θ, ΔΦ
c, and ΔΦ
o denote the phase-difference deviation caused by azimuth DOA, channels inconsistency, and others, respectively. Therefore, Equation (5) can be rewritten to represent the corrected Φ
1,i as
To minimize the errors of Δ
θ and ΔΦ in the phase-difference measurement, a least-squares method is used in calibrating Φ
1,i. Let Φ
2,j be the measured phase difference in calibration that has the same
γ0 as Φ
1,i. The calibration algorithm can be expressed as
where
j = 0, 1, …, 180, and
θj is the tested azimuth DOA in calibration, chosen as
Since testing all of the values of
θj is time consuming in mass production, only three values of
θj are selected for calibration. Furthermore, an important region lies near the anchor antennas’ normal vector, where it is aligned to the tag’s maximum radiation direction after the turntable’s first rotation. Hence, the angles of −30°, 0, and 30° are chosen for calibration, that is,
With the three tested θj, the least-squares algorithm was run. First, Δθ and ΔΦ were solved from Equation (10). Equation (9) was then used as a new reference data set for the correlation matching algorithm.
Notably,
γ equals
γ0 during the calibration, while
γ is changeable due to different operating distances and the tag’s main lobe deflection. Thus, Δ
γ was introduced to represent the altitude DOA deviation into phase measurement. Other errors from the environments (e.g., reflection, blocking, and antenna coupling) are more complex and dynamic. Therefore, the actual measured phase difference can be expressed as
where
evn denotes the variable corresponding to environments and ΔΦ (
evn) denotes the phase-difference deviation caused by the environments.
Not considering ΔΦ (
evn), we divided Φ
3,I by Φ
1,i and obtained the following expression:
To make Φ
3,i linearly related to Φ
1,i,
γ0 is controlled to be around 0 in the prototype testing. Thus, Equation (14) can be reduced to
The cos (Δγ) is a scale factor between Φ3,i and Φ1,i, which can be eliminated by the correlation matching algorithm.
Rather than matching Φ
2,i individually, the (2
K+1) Φ
3,m+k values are simultaneously compared with the pre-stored set of (2
K + 1) values Φ
2,n+k, where –
K <
k <
K and
m,
n∈{
K, 1, 180 −
K}. Since the turntable rotated once to roughly establish the tag’s maximum radiation direction (that is, DOA) and align the anchor antennas’ normal vector to it, the index,
m, is determined as 90 because it has minimal DOA estimation errors. The correlation matching algorithm is as follows:
where
and
The estimated DOA was determined as the middle value of the (2
K+1) matched
θn+kSince the phase errors are caused by production imperfection, the altitude DOA and complicated environments are significantly reduced by the least-squares algorithm and correlation matching algorithm. Therefore, the PDOA-based localization can perform reliably in practical applications.


