
High-Power-Factor LC Series Resonant Converter Operating Off-Resonance with Inductors Elaborated with a Composed Material of Resin/Iron Powder


 ,
,  ,
,  ,
, 
Abstract
:1. Introduction
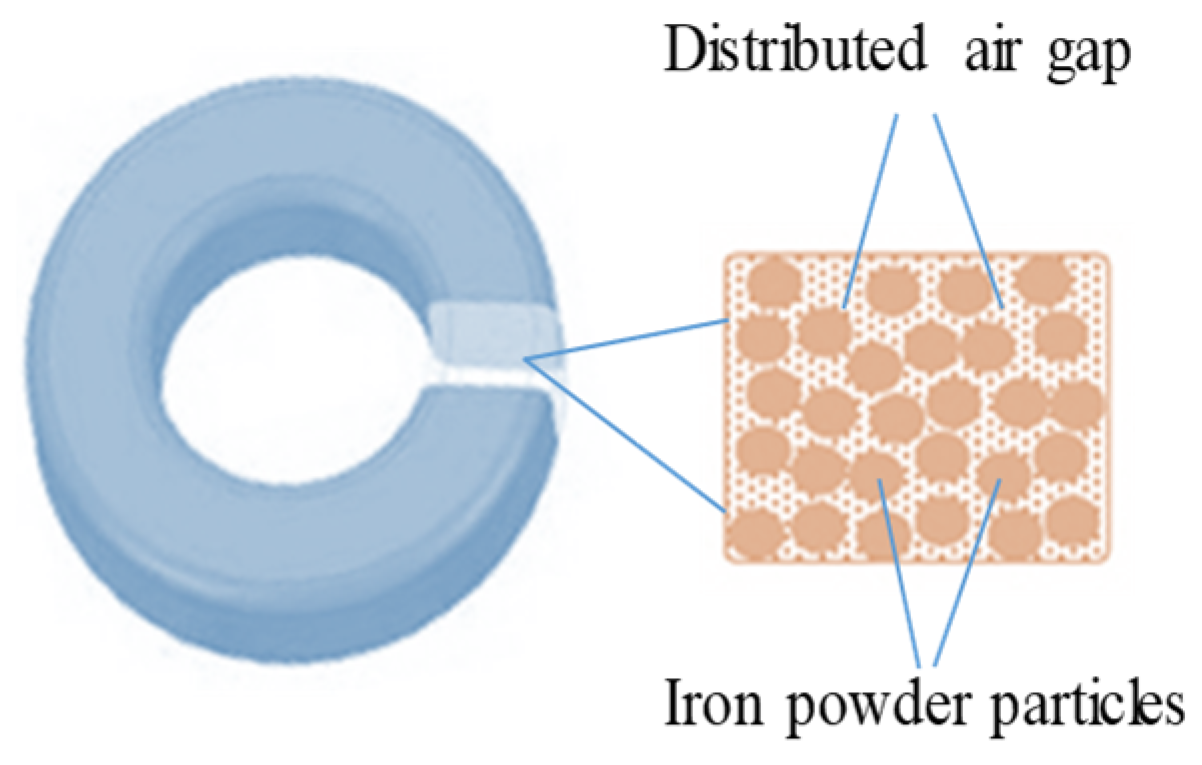
2. Development of the Resin/Iron Powder Composite Core
2.1. Good Magnetic and Mechanical Properties
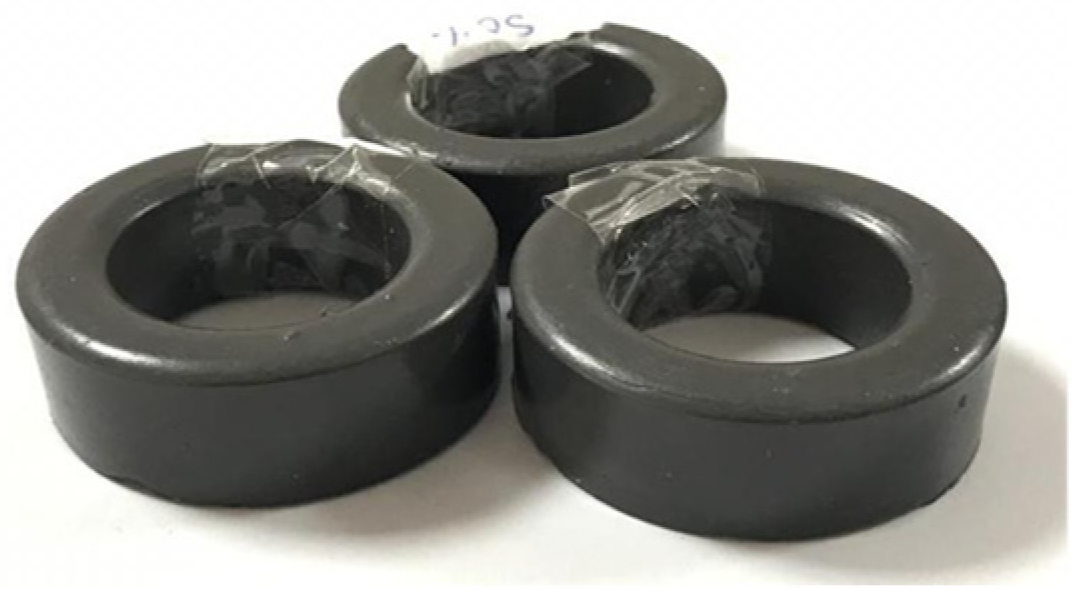
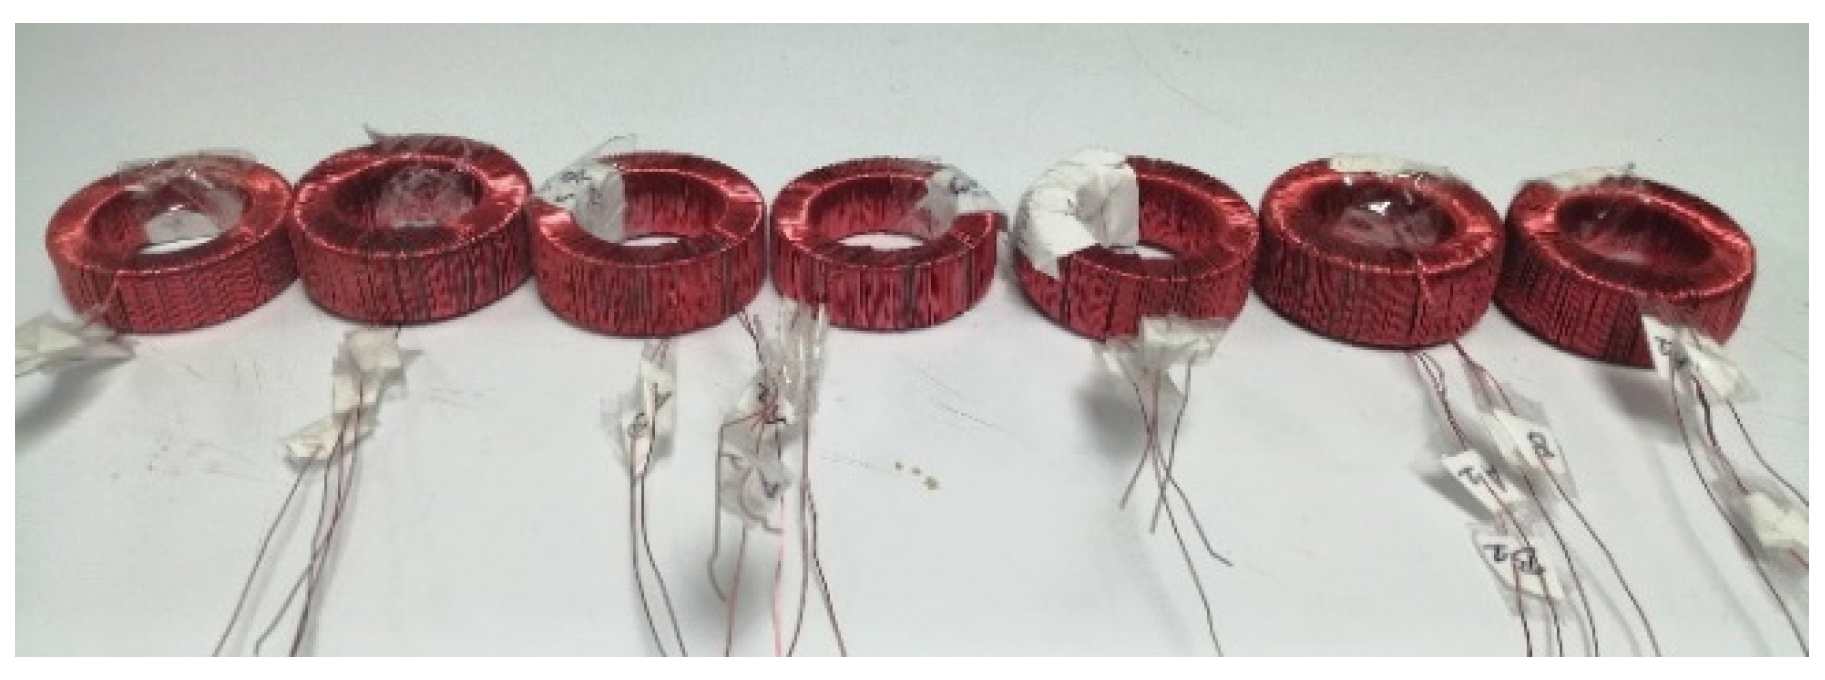
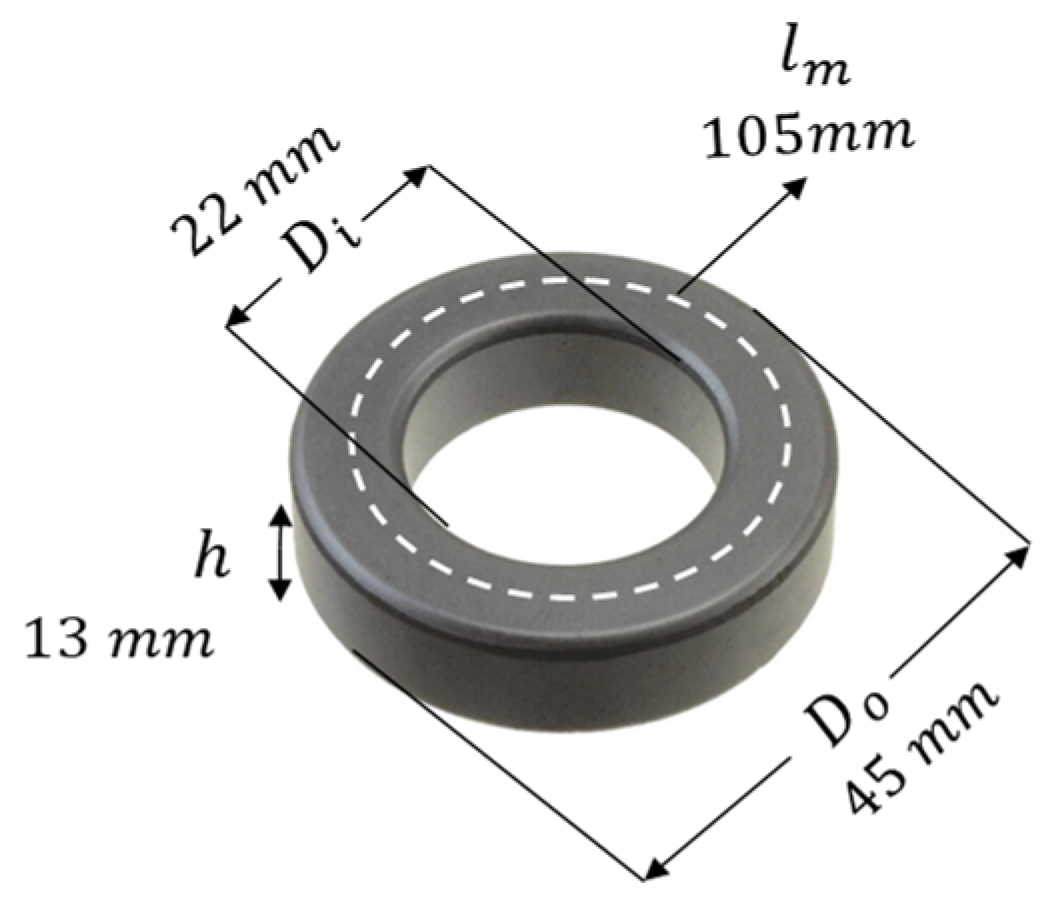
2.2. Manufacturing of the Proposed Toroidal Core
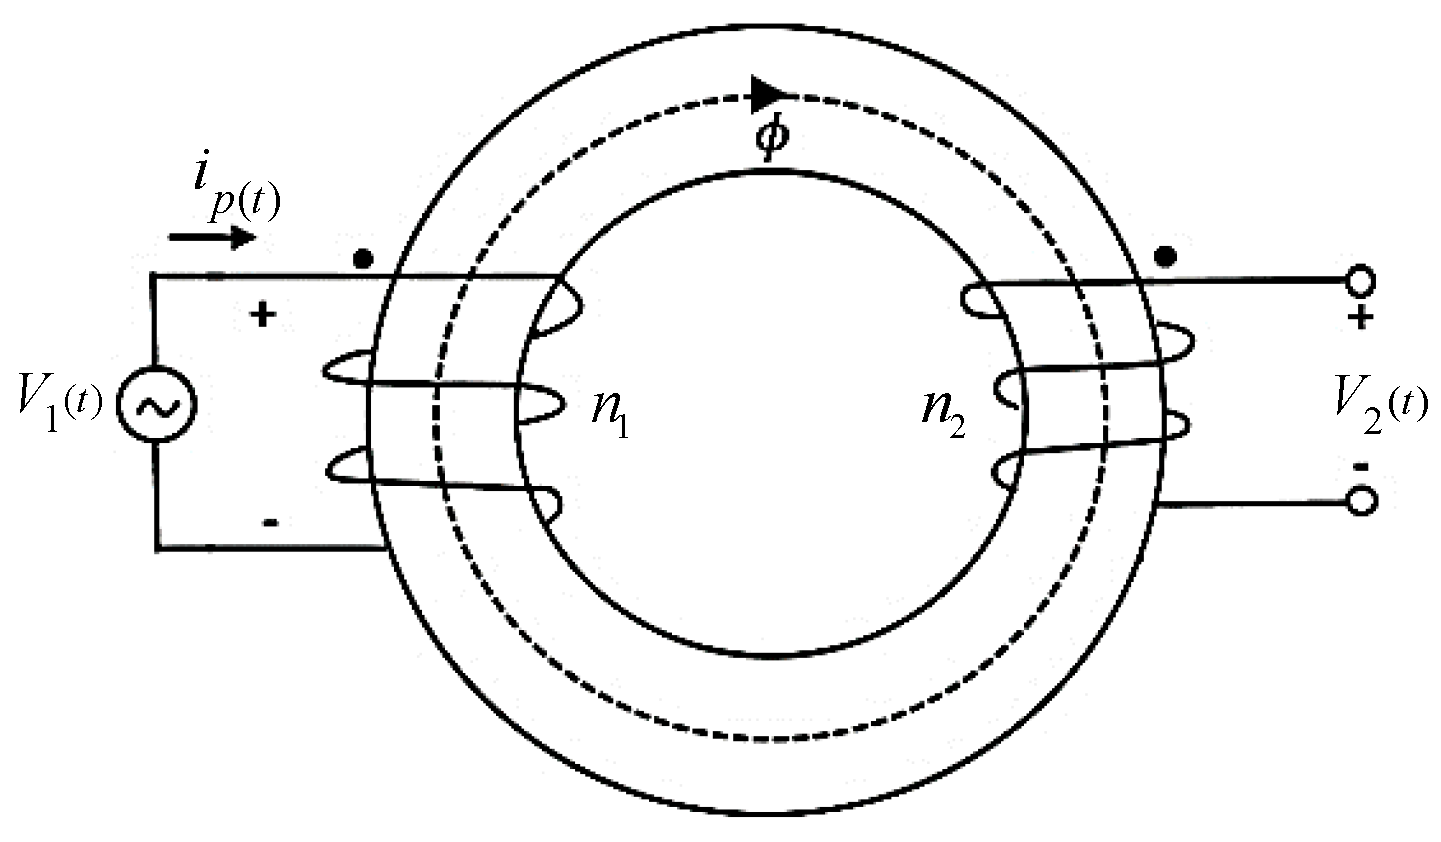
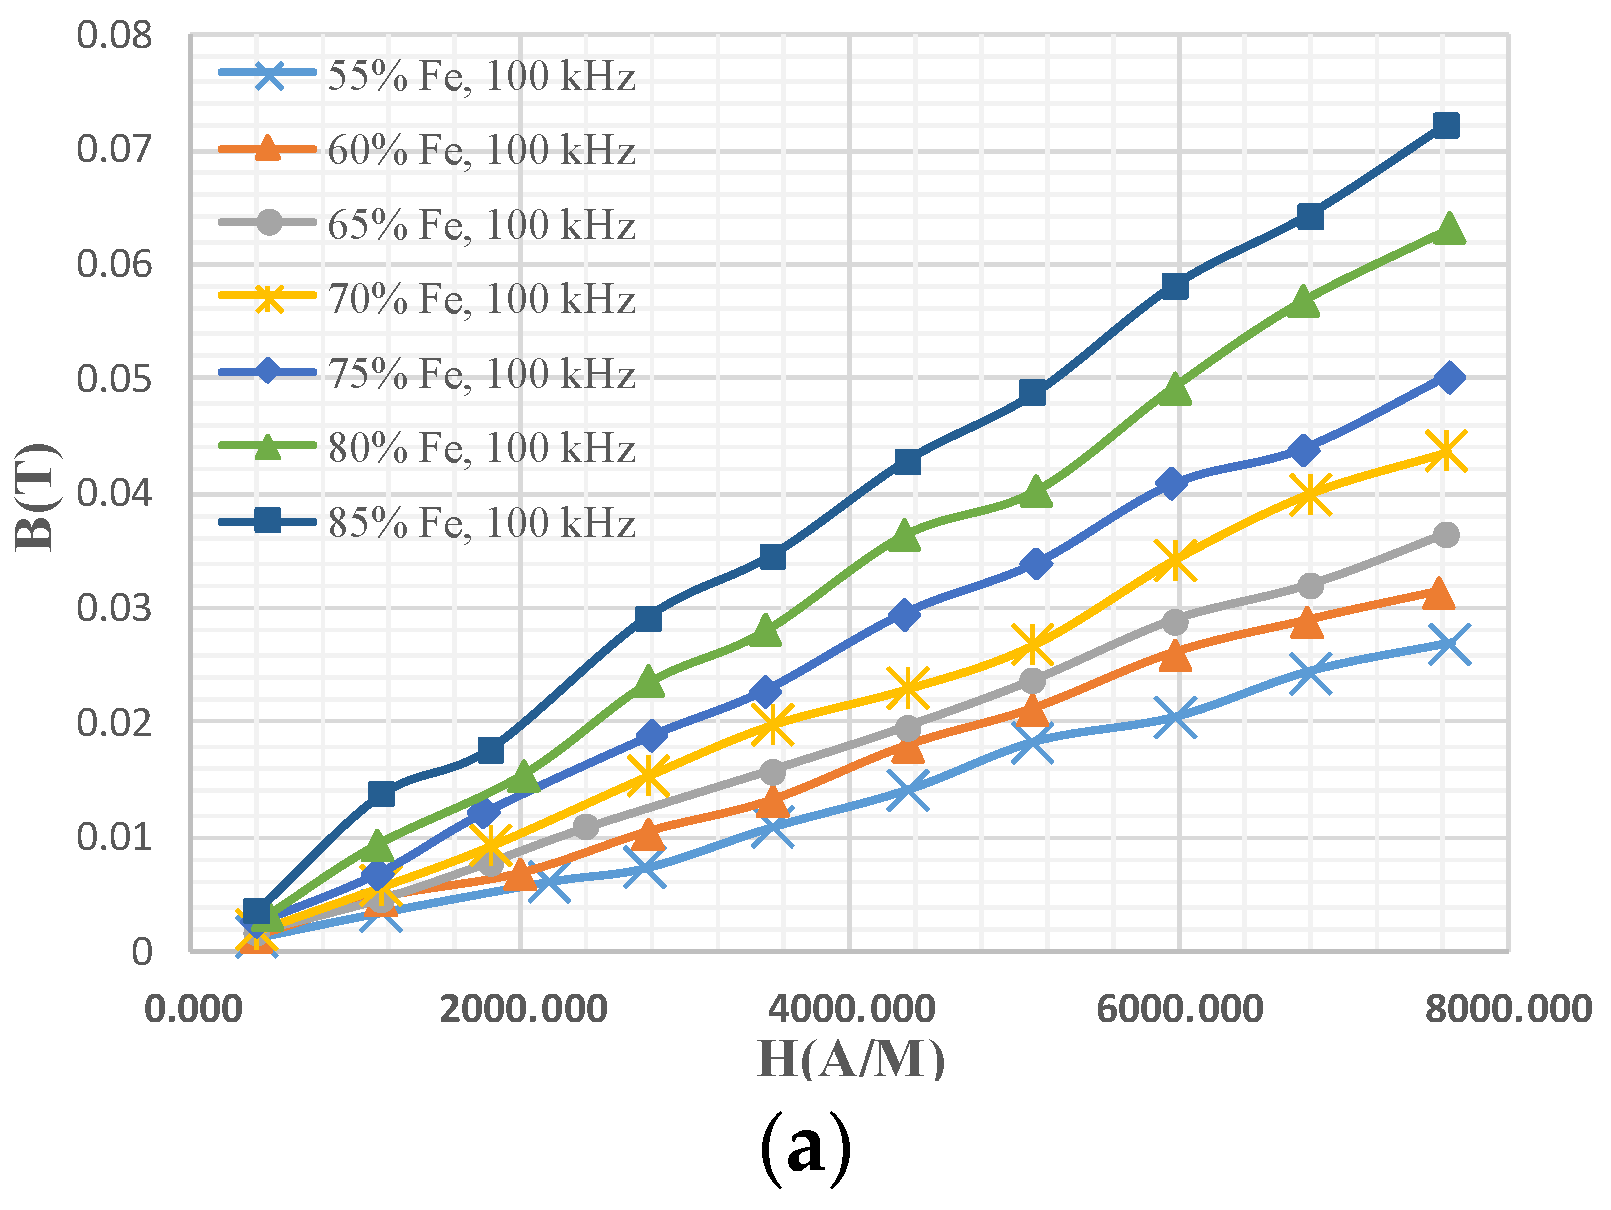
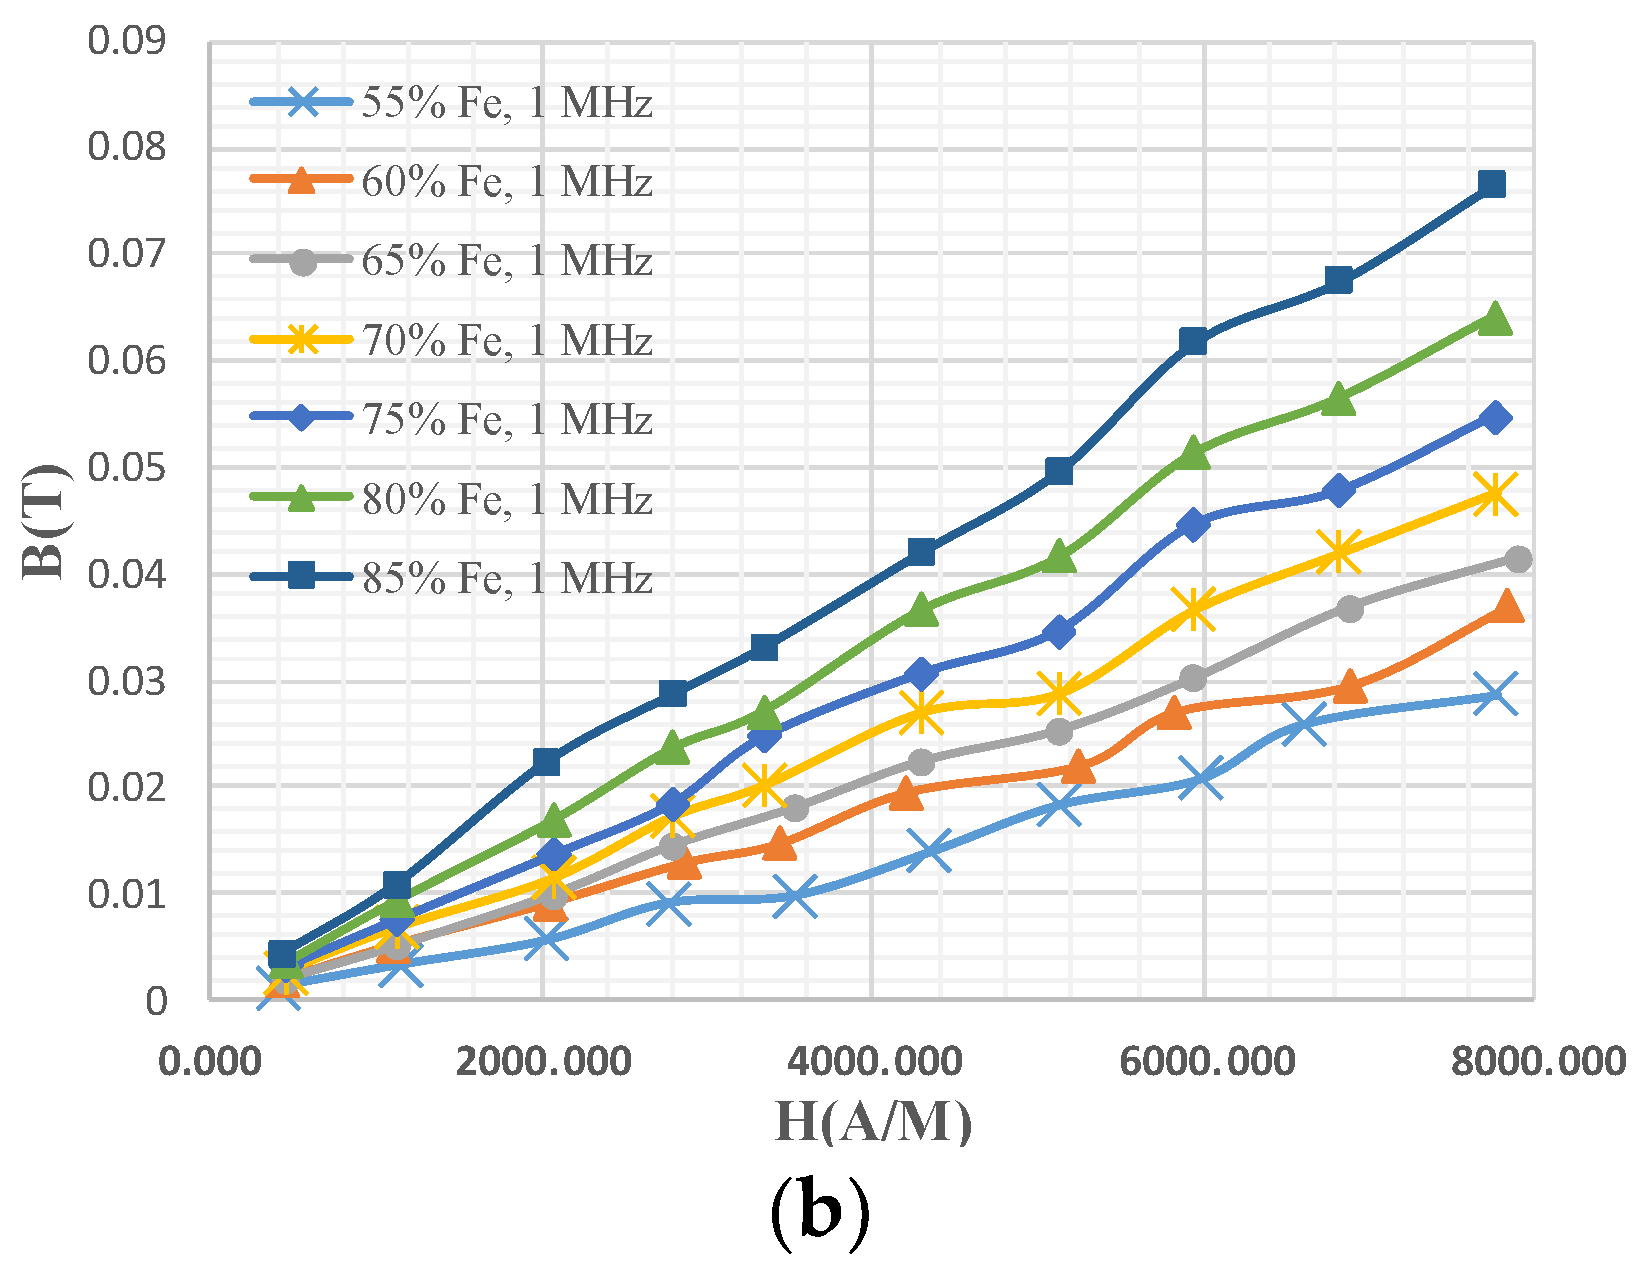
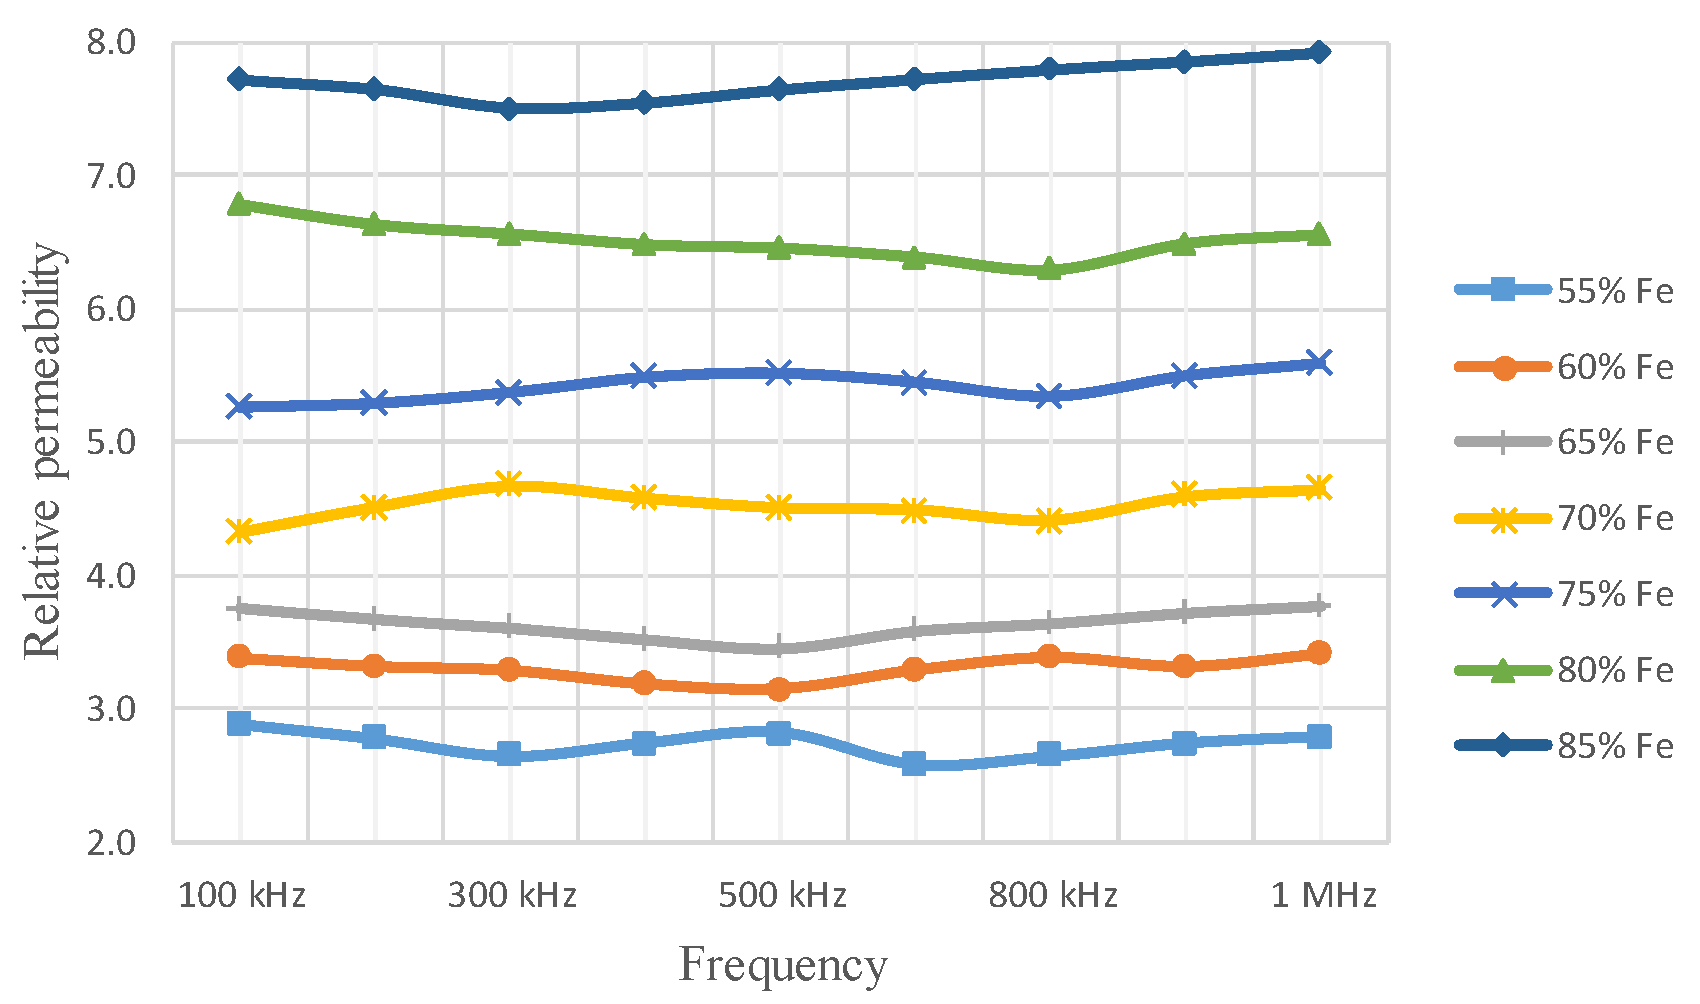
3. Determination of the Permeability of the Magnetic Cores with the Proposed Material
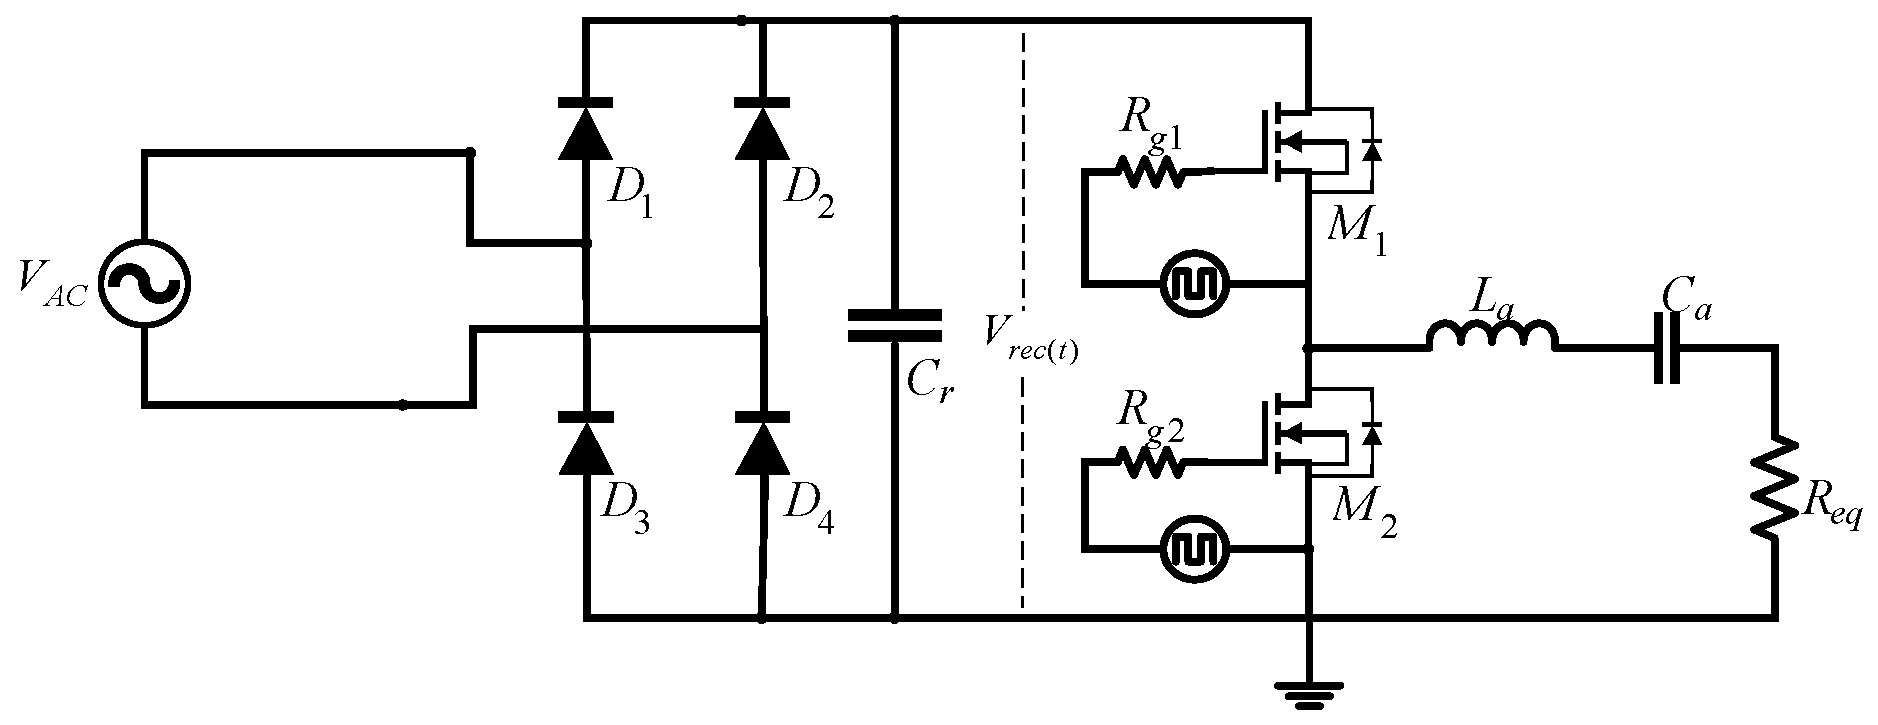
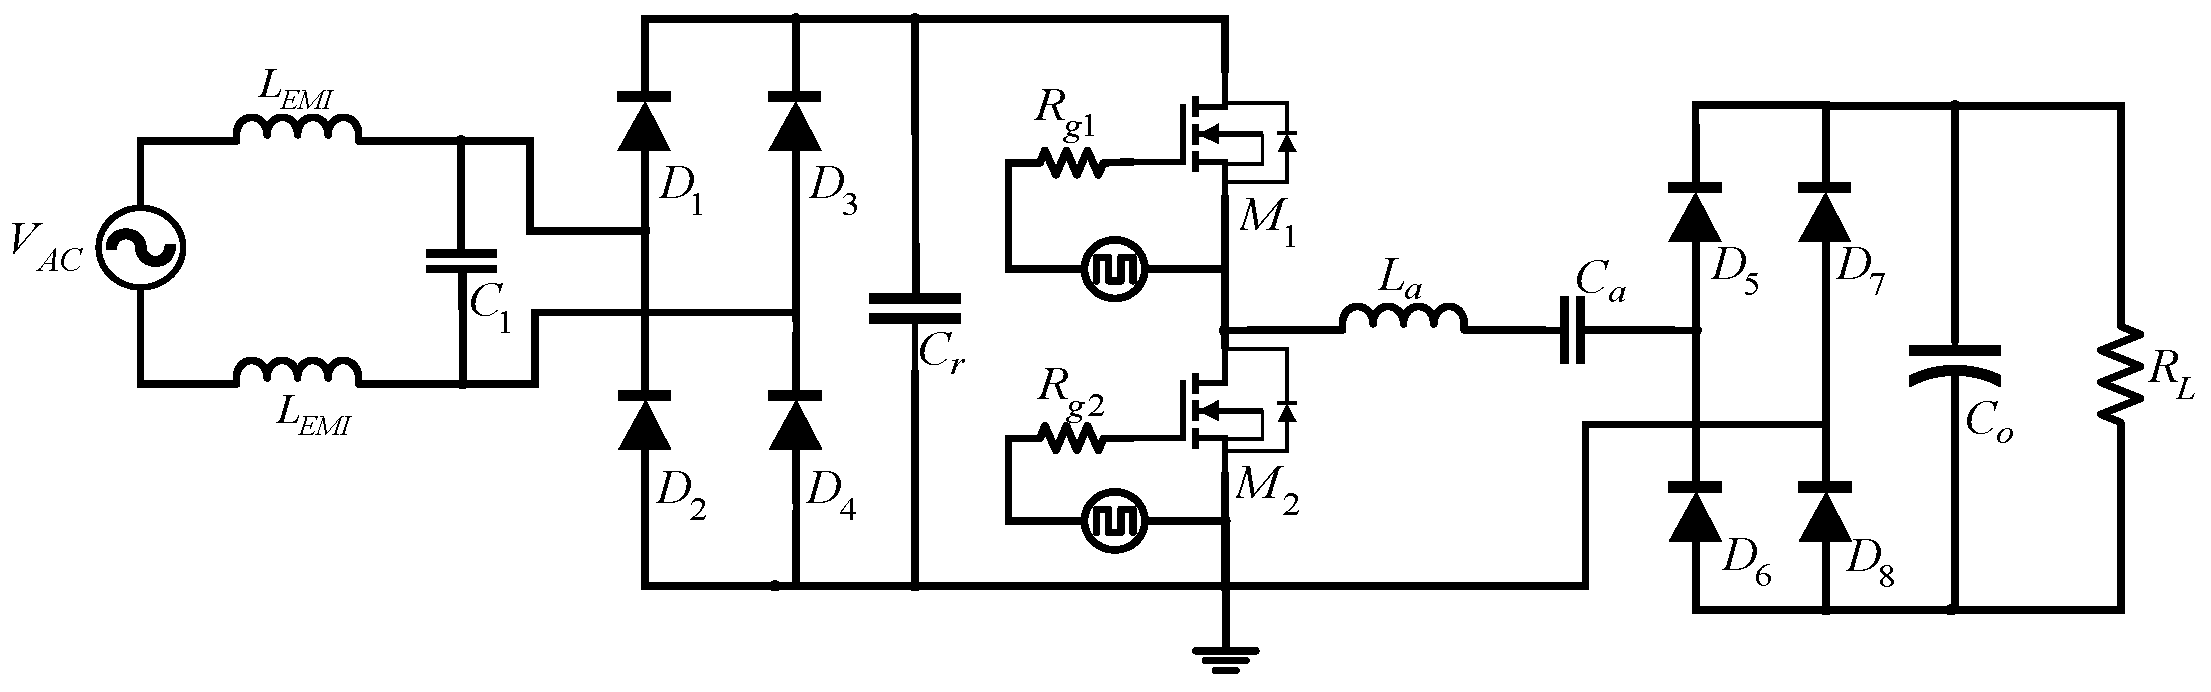
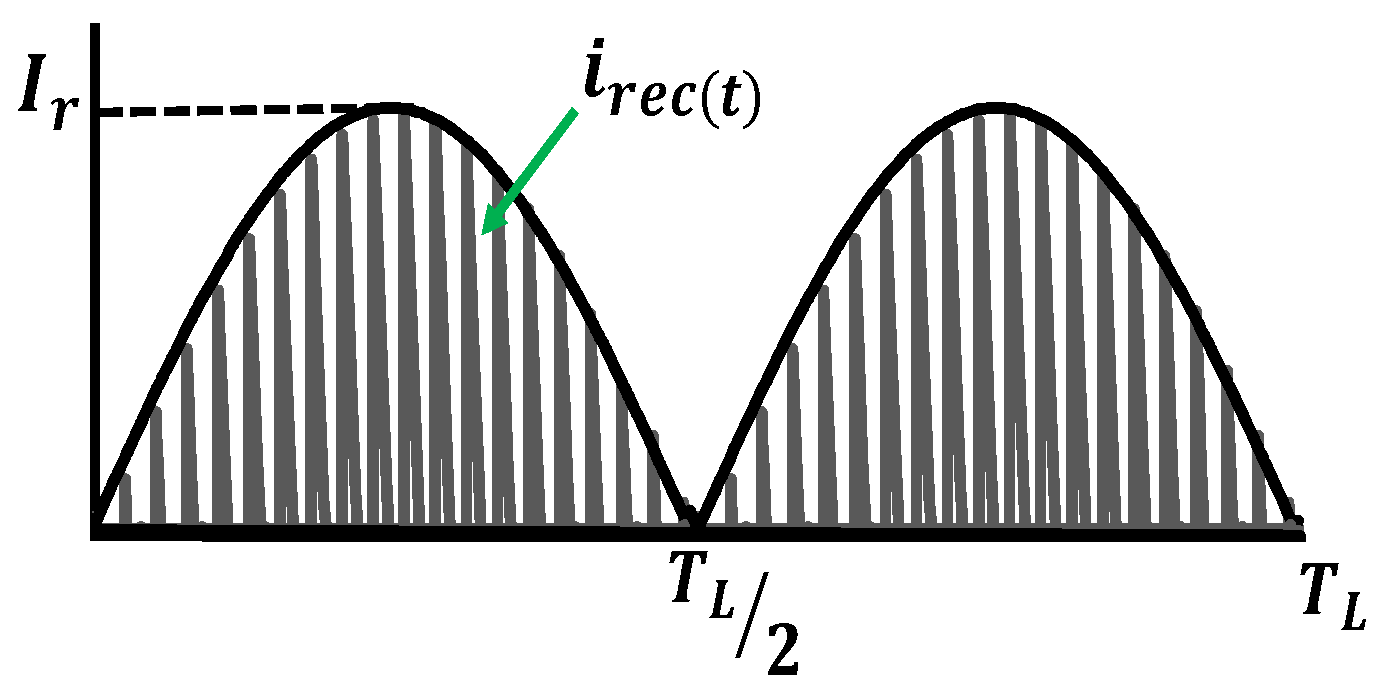
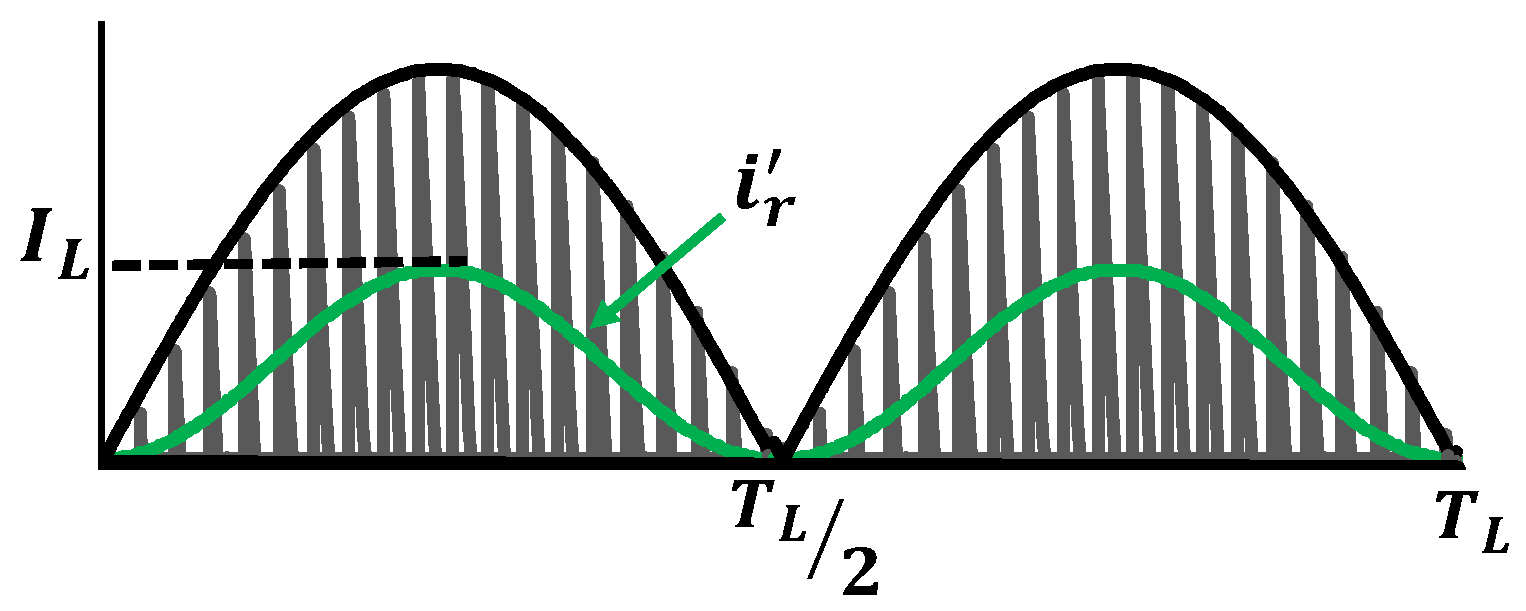
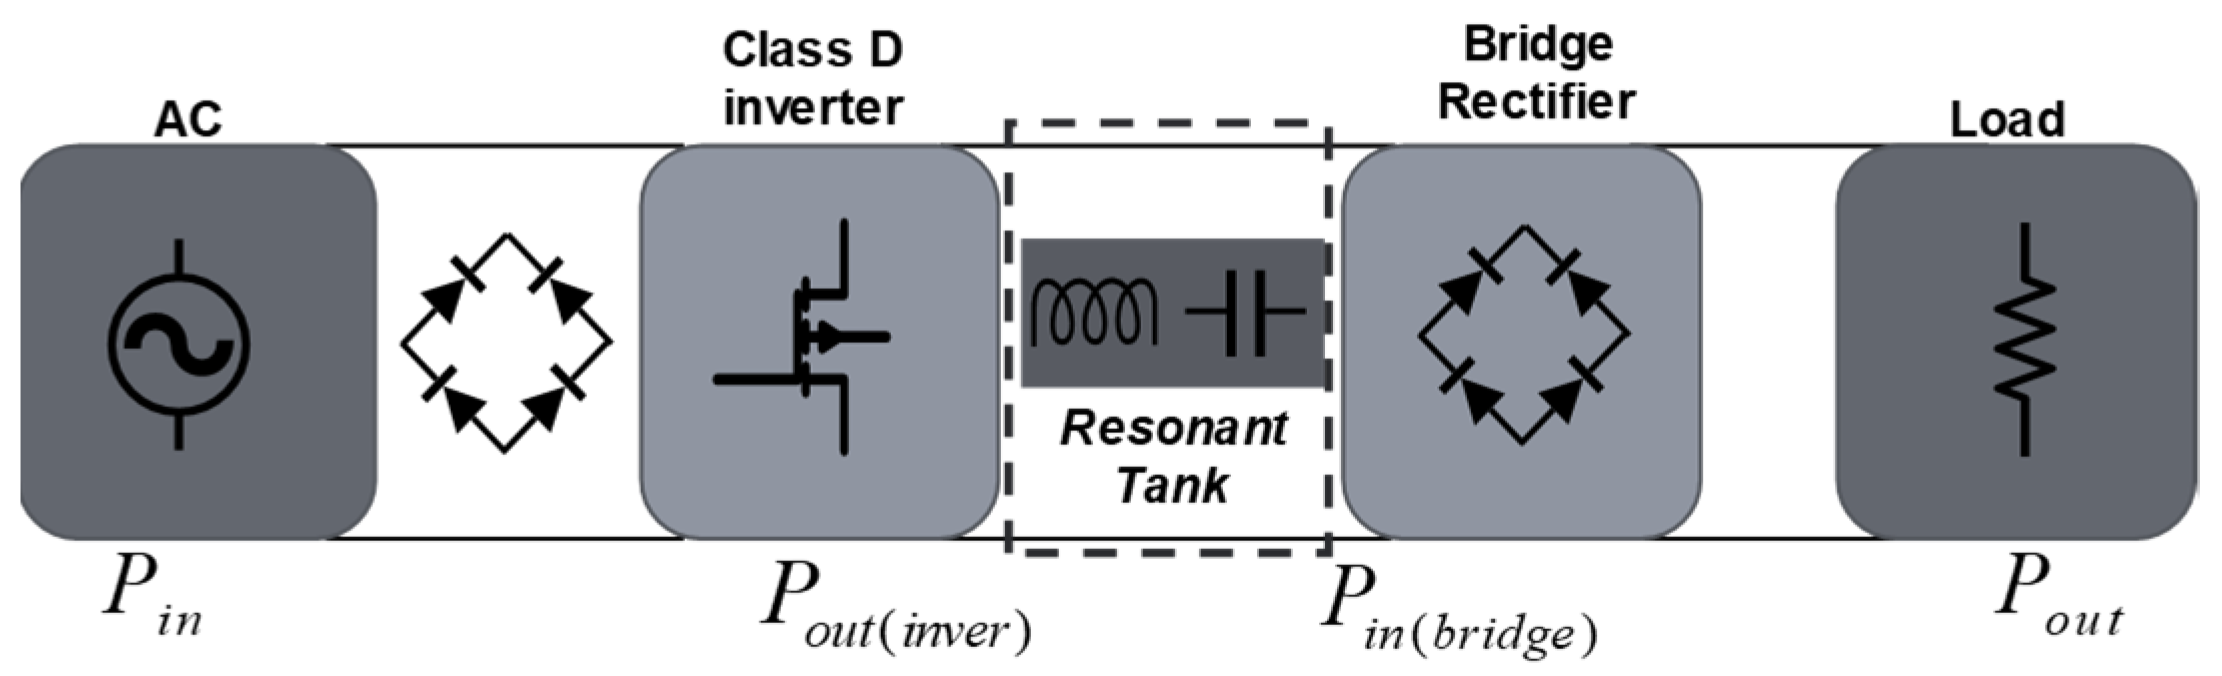
4. Analysis of the Circuit
Power Factor Correction
5. Design Methodology
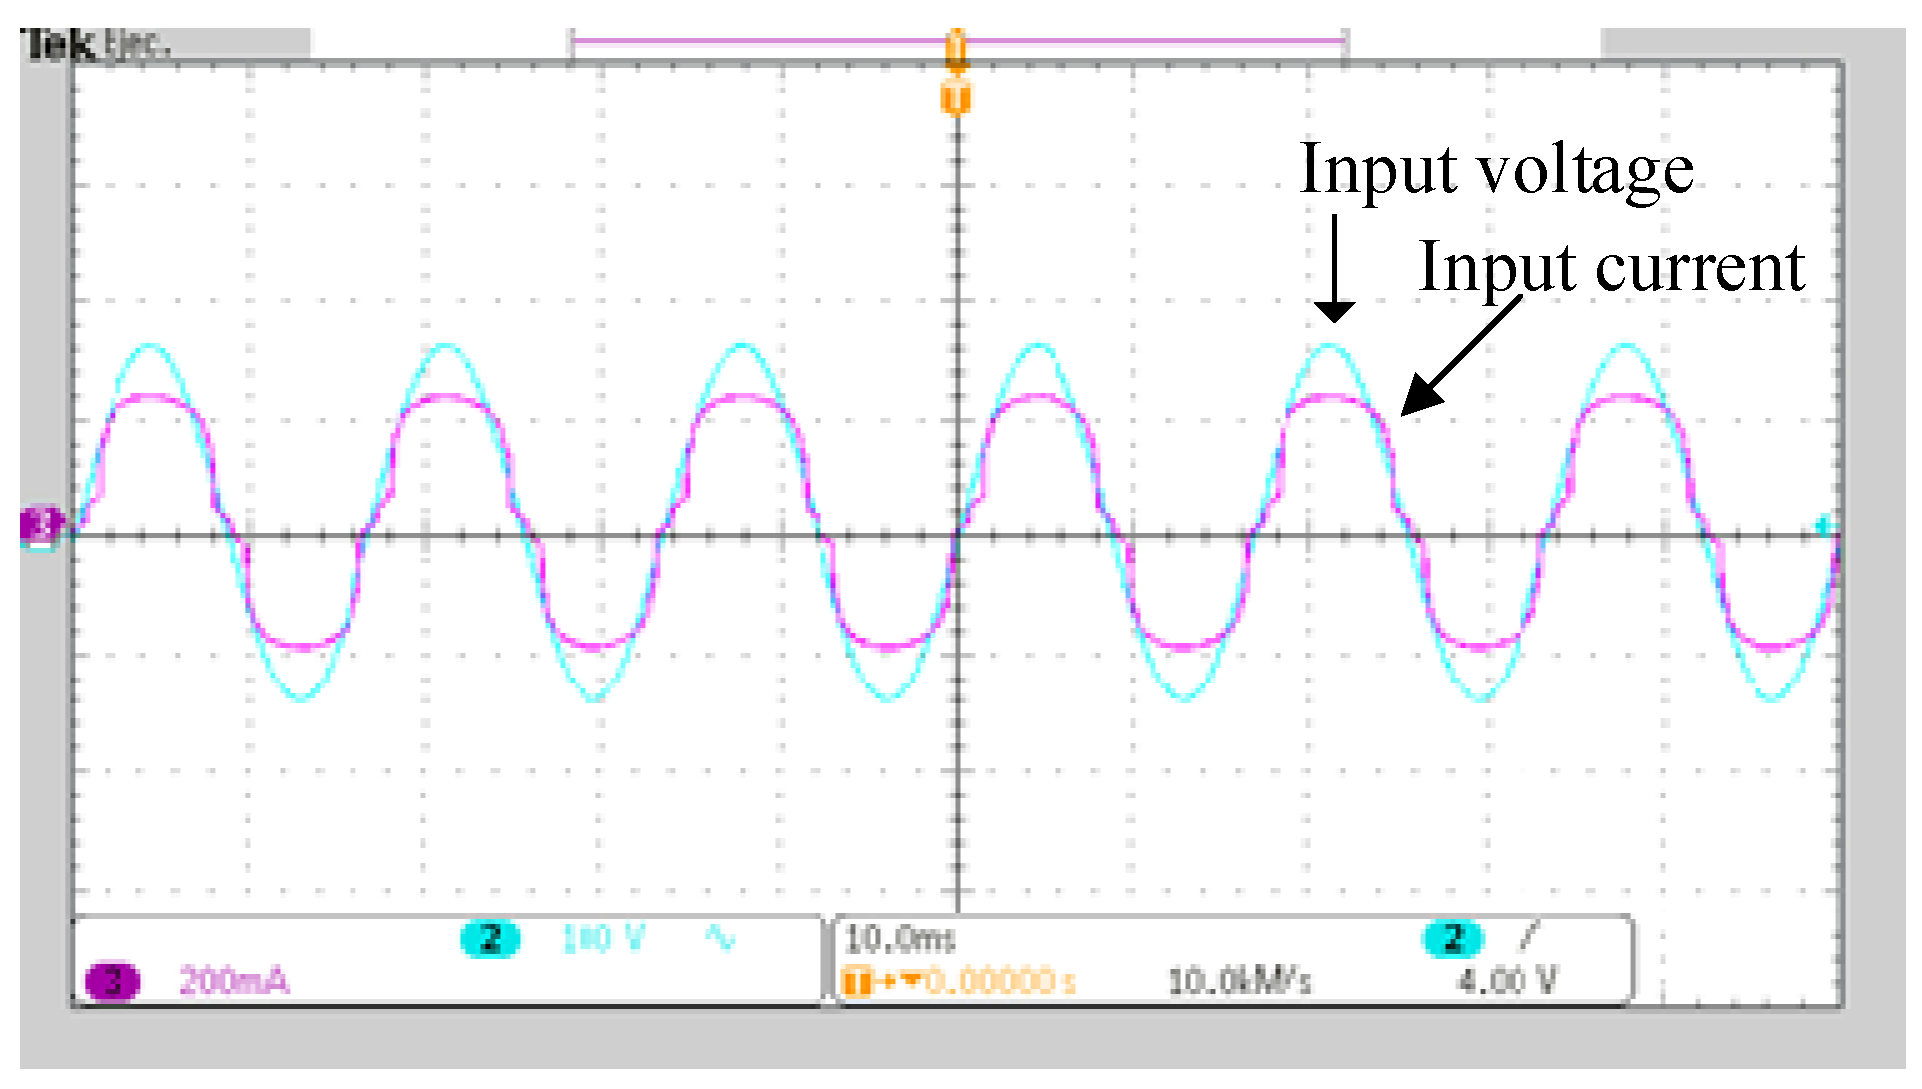
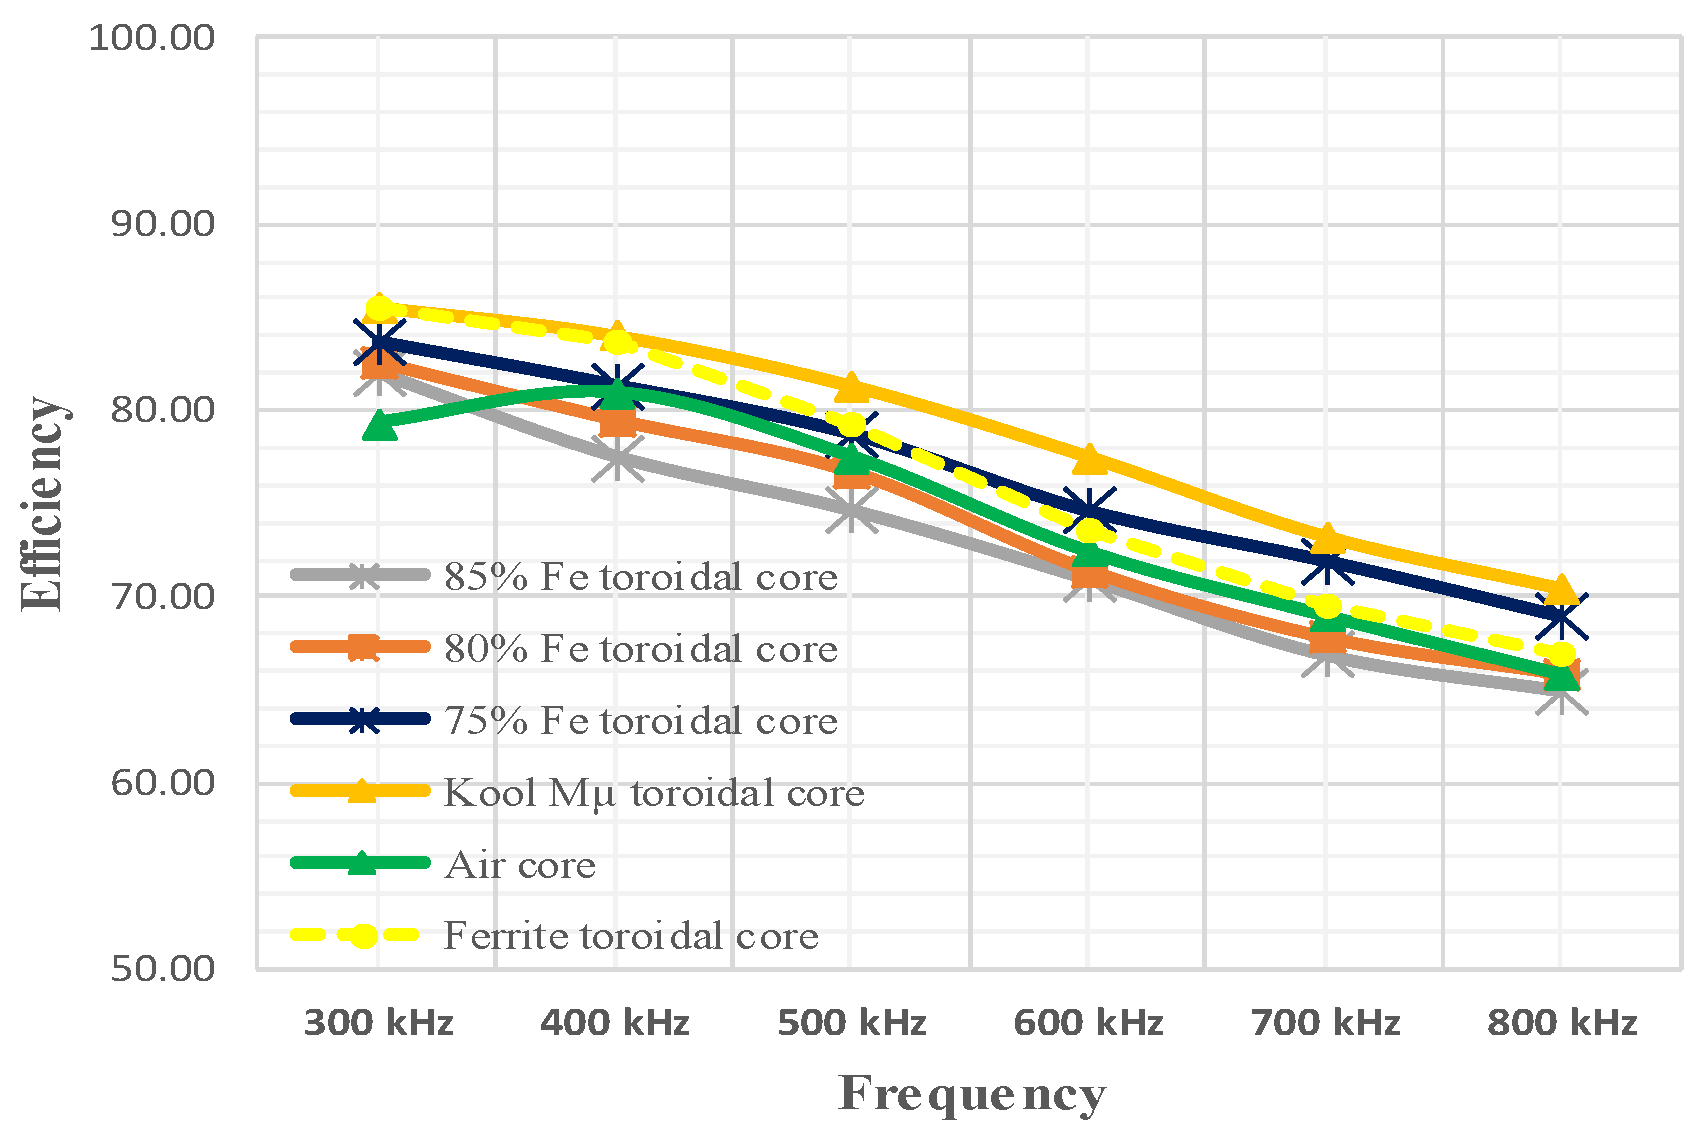
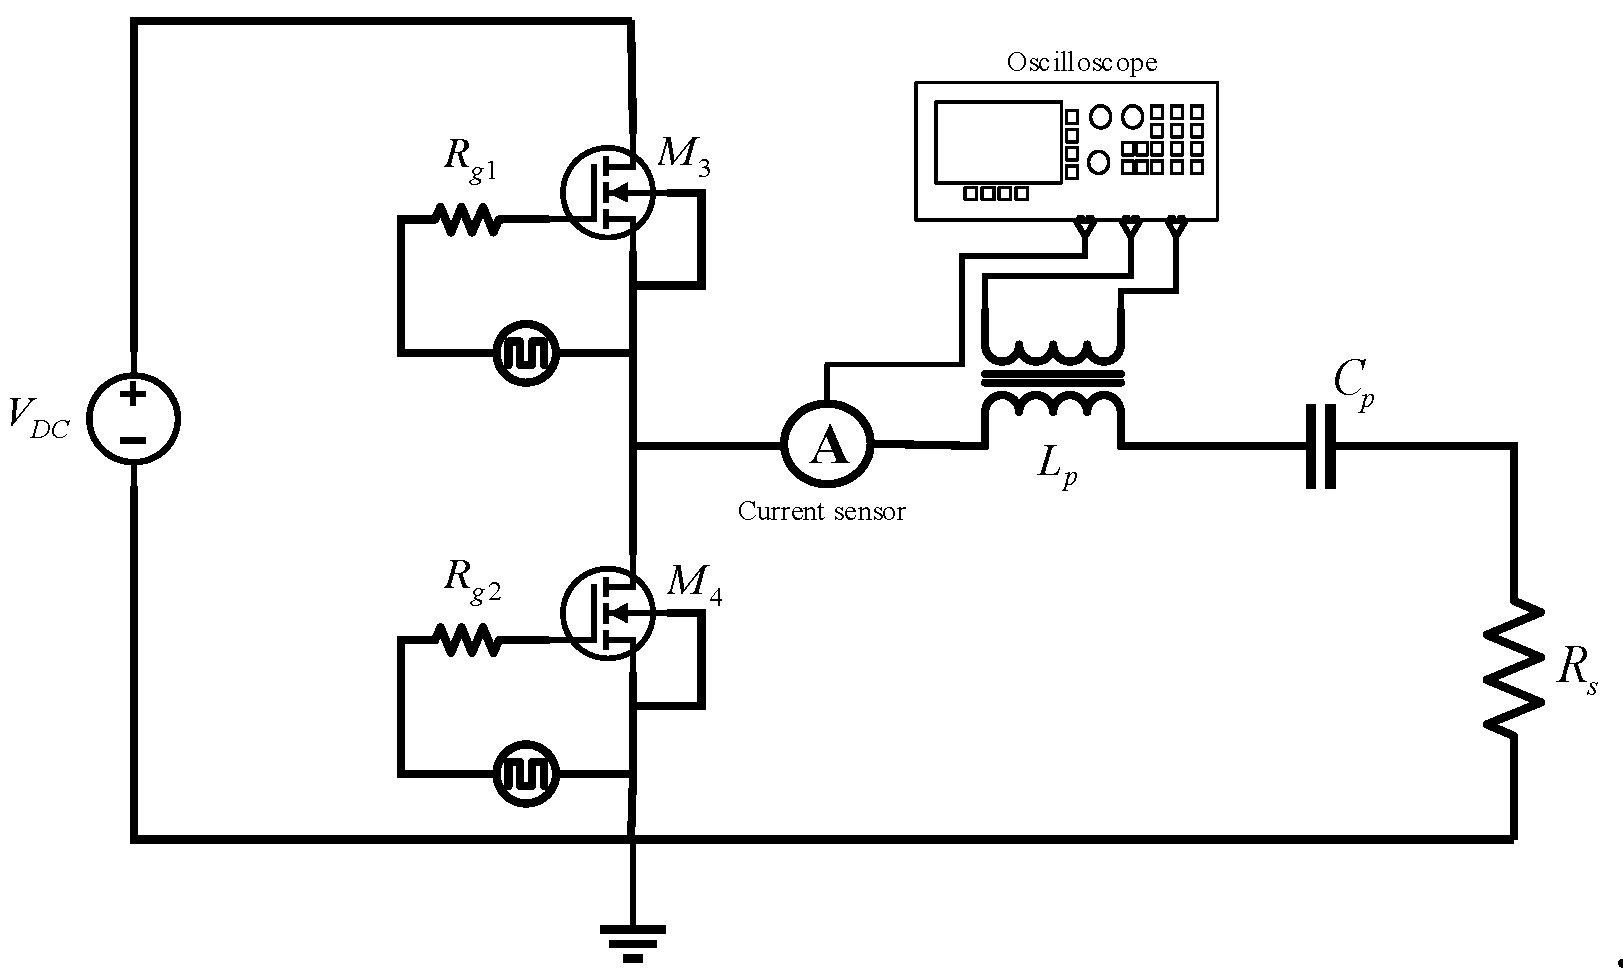
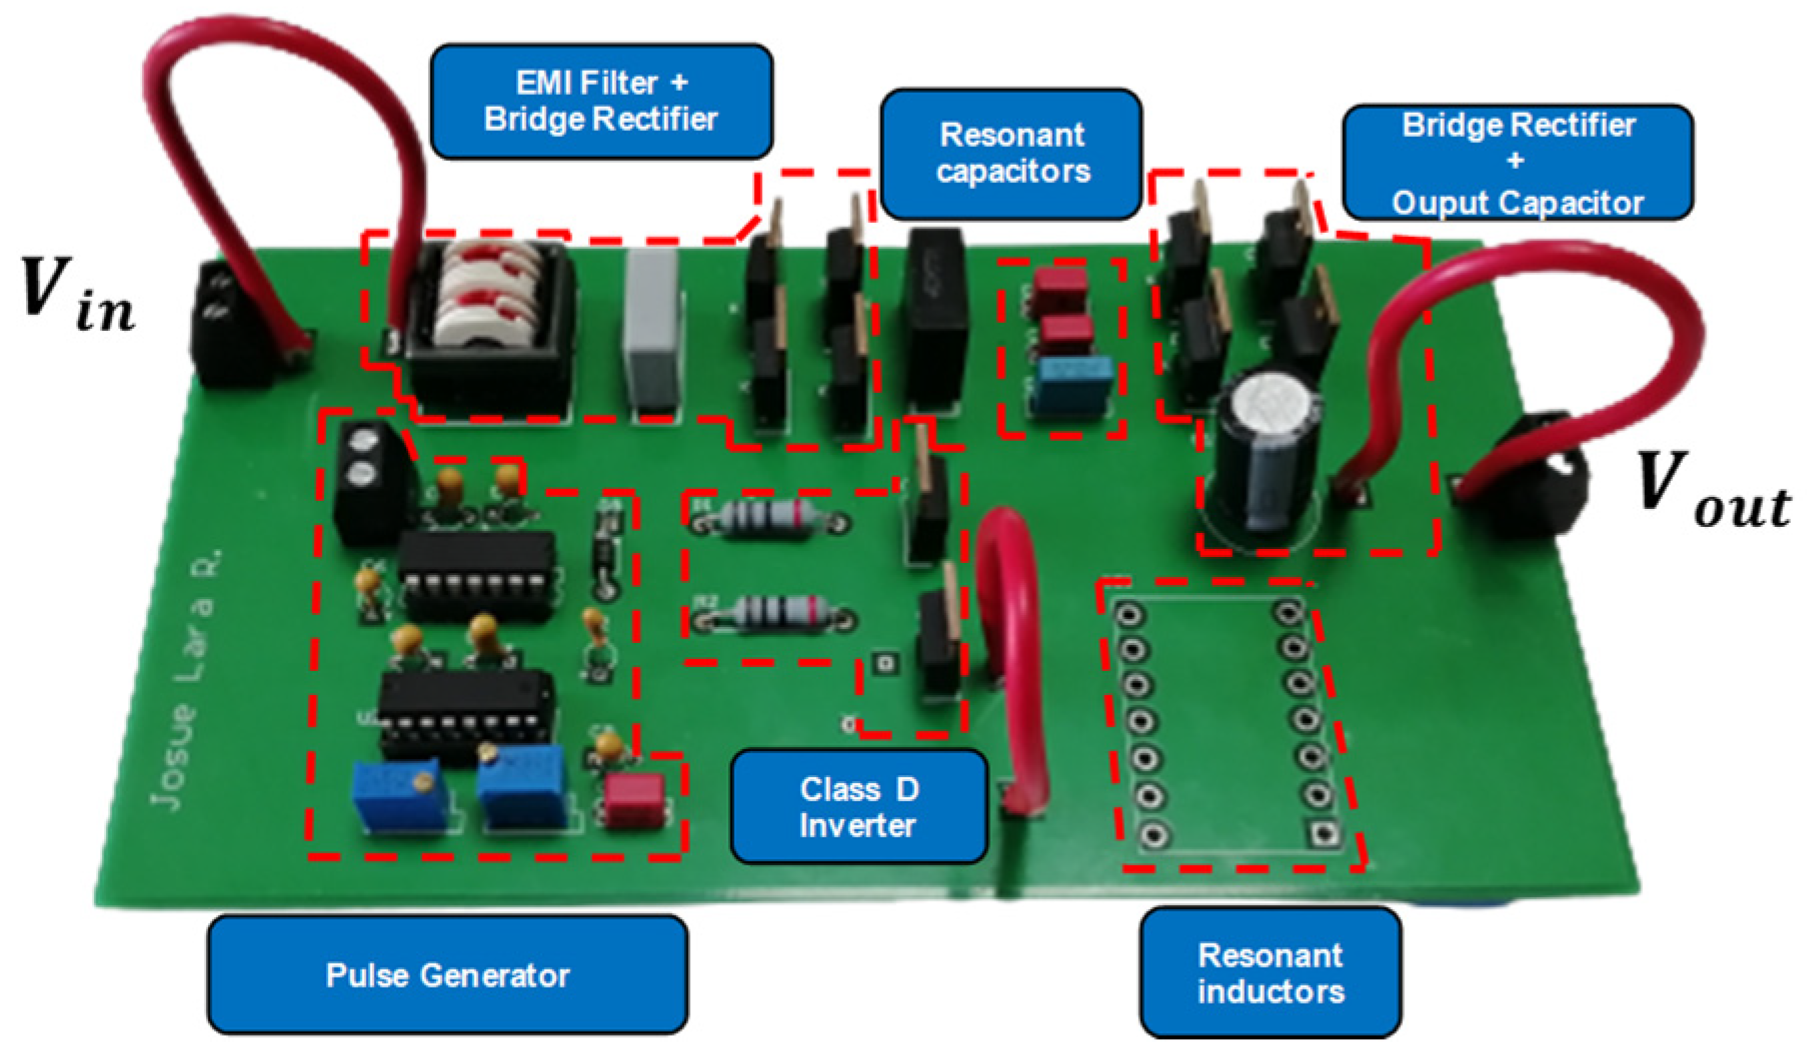
6. Simulation and Experimental Results
6.1. Simulation of the Circuit
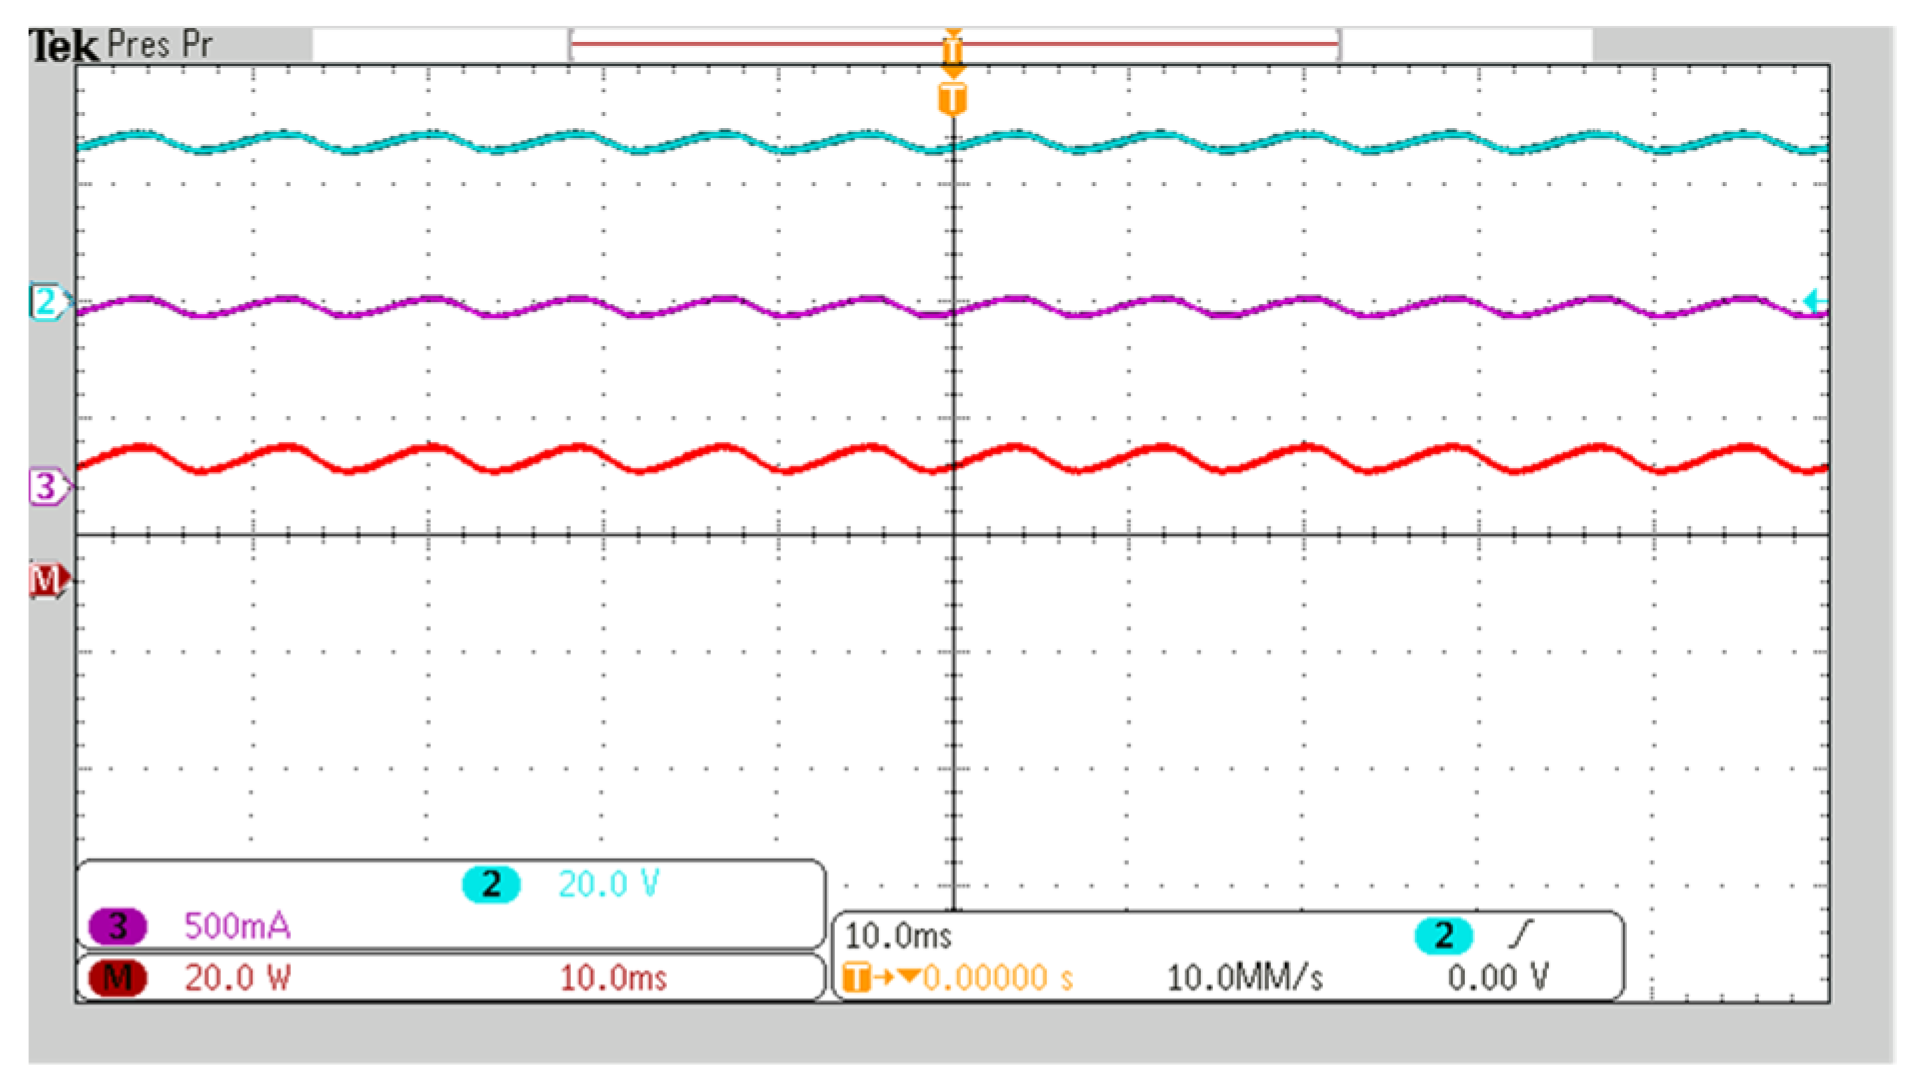
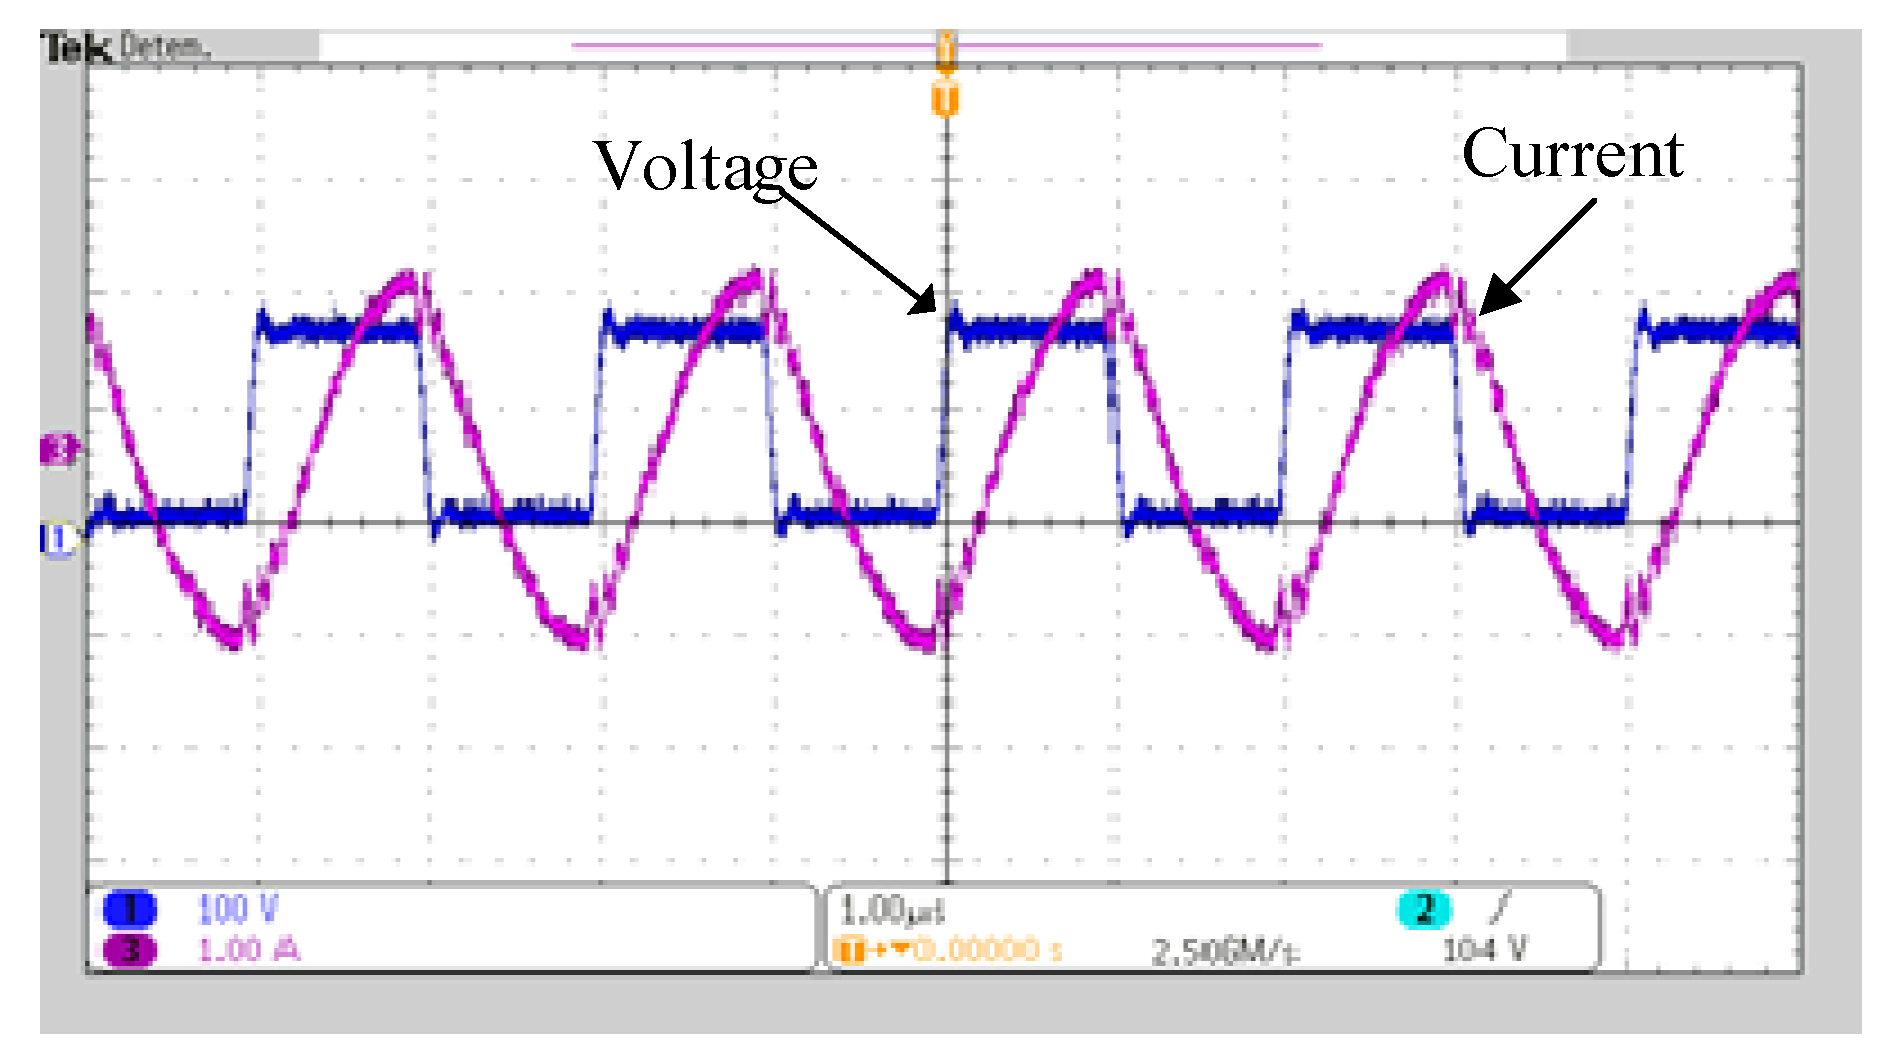
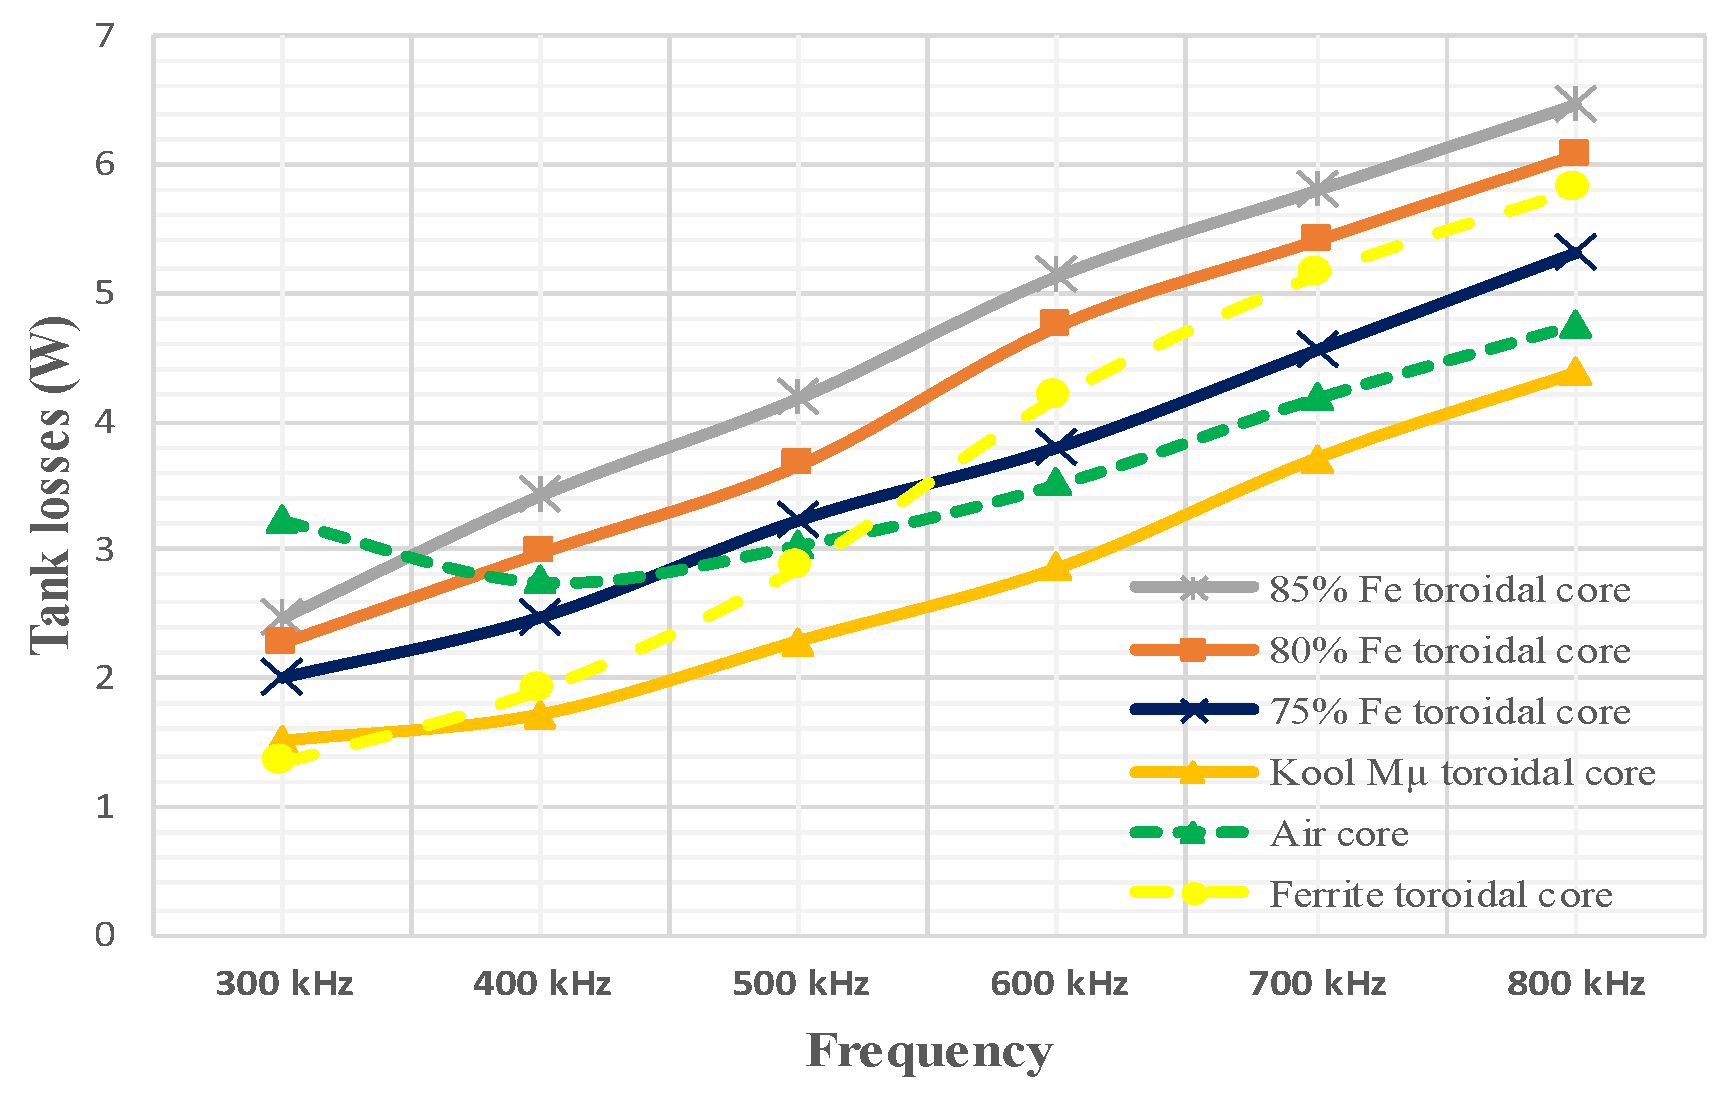
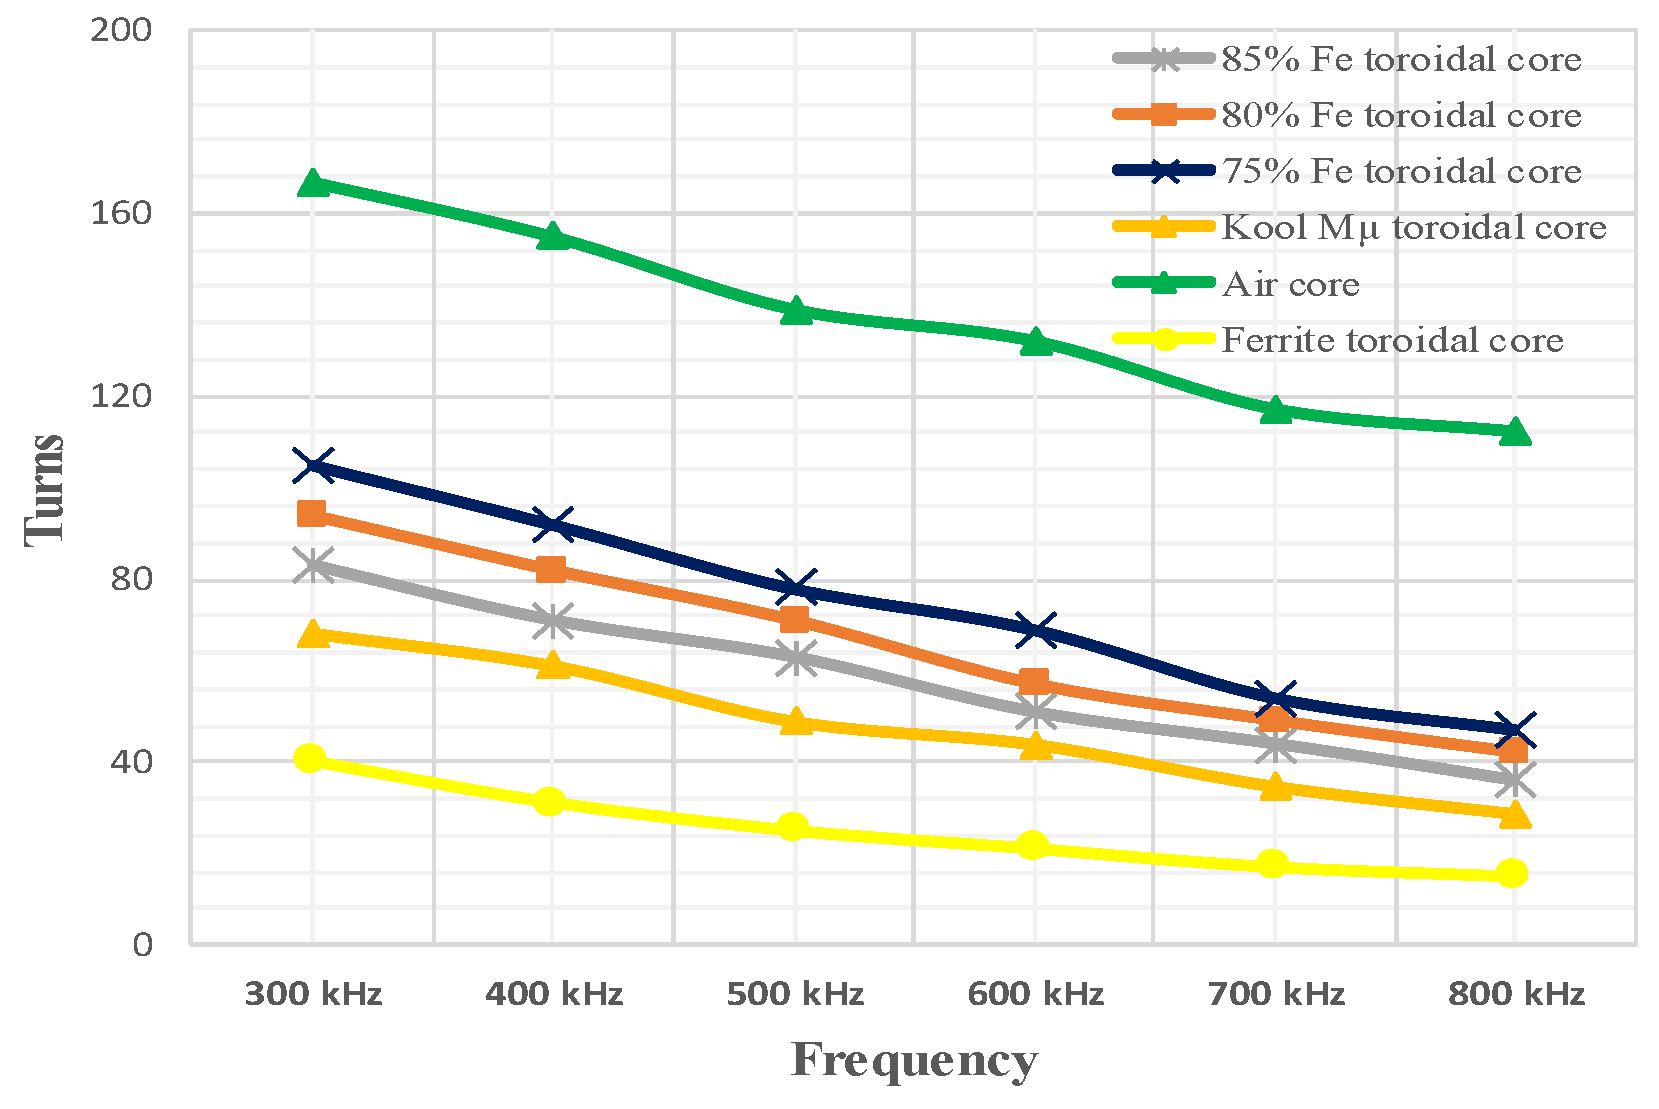
6.2. Experimental Results
7. Conclusions
Author Contributions
Funding
Data Availability Statement
Conflicts of Interest
References
- Millan, J.; Godignon, P.; Perpina, X.; Perez-Tomas, A.; Rebollo, J. A Survey of Wide Bandgap Power Semiconductor Devices. IEEE Trans. Power Electron. 2013, 29, 2155–2163. [Google Scholar] [CrossRef]
- Gutiérrez-Oliva, D.; Colmenar-Santos, A.; Rosales-Asensio, E. A Review of the State of the Art of Industrial Microgrids Based on Renewable Energy. Electronics 2022, 11, 1002. [Google Scholar] [CrossRef]
- Chen, C.; Chen, Y.; Tan, Y.; Fang, J.; Luo, F.; Kang, Y. On the Practical Design of a High Power Density SiC Single-Phase Uninterrupted Power Supply System. IEEE Trans. Ind. Inform. 2017, 13, 2704–2716. [Google Scholar] [CrossRef]
- Mortazavizadeh, S.A.; Palazzo, S.; Amendola, A.; De Santis, E.; Di Ruzza, D.; Panariello, G.; Sanseverino, A.; Velardi, F.; Busatto, G. High Frequency, High Efficiency, and High Power Density GaN-Based LLC Resonant Converter: State-of-the-Art and Perspectives. Appl. Sci. 2021, 11, 11350. [Google Scholar] [CrossRef]
- Abbasi, M.; Lam, J. A modular SiC-based step-up converter with soft-switching-assisted networks and internally coupled high-voltage-gain modules for wind energy system with a medium-voltage DC-grid. IEEE J. Emerg. Sel. Top. Power Electron. 2019, 7, 798–810. [Google Scholar] [CrossRef]
- Ashique, R.H.; Salam, Z.; Maruf, H.; Shihavuddin, A.; Islam, T.; Rahman, F.; Kotsampopoulos, P.; Fayek, H.H. A Comparative Analysis of Soft Switching Techniques in Reducing the Energy Loss and Improving the Soft Switching Range in Power Converters. Electronics 2022, 11, 1062. [Google Scholar] [CrossRef]
- Ogura, K.; Chandhaket, S.; Kolhe, M.L.; Sakphrom, S.; Mekhilef, S. Simple Lossless Inductive Snubbers-Assisted Series Load Resonant Inverter Operating under ZCS-PDM Scheme for High-Frequency Induction Heating Fixed Roller. Appl. Sci. 2022, 12, 1122. [Google Scholar] [CrossRef]
- Shen, W.; Wang, F.; Boroyevich, D.; Iv, C.W.T. High-Density Nanocrystalline Core Transformer for High-Power High-Frequency Resonant Converter. IEEE Trans. Ind. Appl. 2008, 44, 213–222. [Google Scholar] [CrossRef]
- Simizu, S.; Ohodnicki, P.R.; McHenry, M.E. Metal Amorphous Nanocomposite Soft Magnetic Material-Enabled High Power Density, Rare Earth Free Rotational Machines. IEEE Trans. Magn. 2018, 54, 8202505. [Google Scholar] [CrossRef]
- Liu, J.; Dong, Y.; Zhu, Z.; Zhao, H.; Pang, J.; Wang, P.; Zhang, J. Fe-Based Amorphous Magnetic Powder Cores with Low Core Loss Fabricated by Novel Gas–Water Combined Atomization Powders. Materials 2022, 15, 6296. [Google Scholar] [CrossRef] [PubMed]
- Jiang, C.; Li, X.; Ghosh, S.S.; Zhao, H.; Shen, Y.; Long, T. Nanocrystalline Powder Cores for High-Power High-Frequency Power Electronics Applications. IEEE Trans. Power Electron. 2020, 35, 10821–10830. [Google Scholar]
- Rodriguez-Sotelo, D.; Rodriguez-Licea, M.A.; Araujo-Vargas, I.; Prado-Olivarez, J.; Barranco-Gutiérrez, A.-I.; Perez-Pinal, F.J. Power Losses Models for Magnetic Cores: A Review. Micromachines 2022, 13, 418. [Google Scholar] [CrossRef] [PubMed]
- Wang, D.; Zhang, J.; Cui, S.; Bie, Z.; Song, K.; Zhu, C.; Matveevich, M.I. Modern Advances in Magnetic Materials of Wireless Power Transfer Systems: A Review and New Perspectives. Nanomaterials 2022, 12, 3662. [Google Scholar] [CrossRef] [PubMed]
- Sun, T.; Raj, P.M.; Min, J.; Wu, Z.; Sharma, H.; Takahashi, T.; Takemura, K.; Yun, H.; Carobolante, F.; Tummala, R. Magnetic Materials and Design Trade-Offs for High Inductance Density, High-Q and Low-Cost Power and EMI Filter Inductors. In Proceedings of the 2016 IEEE 66th Electronic Components and Technology Conference (ECTC), Las Vegas, NV, USA, 31 May–3 June 2016; Volume 2016, pp. 374–379. [Google Scholar] [CrossRef]
- Meere, R.; Wang, N.; O’Donnell, T.; Kulkarni, S.; Roy, S.; O’Mathuna, S.C. Magnetic-Core and Air-Core Inductors on Silicon: A Performance Comparison up to 100 MHz. IEEE Trans. Magn. 2011, 47, 4429–4432. [Google Scholar] [CrossRef]
- Zhang, S.; Chen, D.; Bai, B. Study of a High-Power Medium Frequency Transformer Using Amorphous Magnetic Material. Symmetry 2022, 14, 2129. [Google Scholar] [CrossRef]
- Ruiz, D.; Ortíz, J.; Moreno, E.; Fuerte, C.; Venegas, V.; Vargas, A.; Vergara, H. Ferrites and Nanocrystalline Alloys Applied to DC–DC Converters for Renewable Energies. Appl. Sci. 2022, 12, 709. [Google Scholar] [CrossRef]
- Zhang, X.; Han, R.; Li, F.; Pan, X.; Chu, Z. Design and Analysis of Magnetic Shielding Mechanism for Wireless Power Transfer System Based on Composite Materials. Electronics 2022, 11, 2187. [Google Scholar] [CrossRef]
- Kauder, T.; Hameyer, K. Performance Factor Comparison of Nanocrystalline, Amorphous, and Crystalline Soft Magnetic Materials for Medium-Frequency Applications. IEEE Trans. Magn. 2017, 53, 8401504. [Google Scholar] [CrossRef]
- Yoshida, R.; Kitajima, J.; Sakae, T.; Sato, M.; Mizuno, T.; Shimoda, Y.; Kubota, A.; Wada, S.; Kichiji, T.; Kumagai, H. Effect of Magnetic Properties of Magnetic Composite Tapes on Motor Losses. Energies 2022, 15, 7991. [Google Scholar] [CrossRef]
- Górecki, K.; Detka, K.; Kaczerski, K. The Influence of the Transformer Core Material on the Characteristics of a Full-Bridge DC-DC Converter. Energies 2022, 15, 6160. [Google Scholar] [CrossRef]
- Dobák, S.; Beatrice, C.; Tsakaloudi, V.; Fiorillo, F. Magnetic Losses in Soft Ferrites. Magnetochemistry 2022, 8, 60. [Google Scholar] [CrossRef]
- Pandey, R.; Singh, B. A power-factor-corrected LLC resonant converter for electric vehicle charger using Cuk converter. IEEE Trans. Ind. Appl. 2019, 55, 6278–6286. [Google Scholar] [CrossRef]
- Gao, W.; Gao, J.; Wu, X.; Zhou, B. Power Factor Calculation Method for the Rectifier Which AC Side Connected CRM LCL Resonant Converter. In Proceedings of the IEEE PELS Workshop on Emerging Technologies: Wireless Power Transfer (Wow), Montreal, QC, Canada, 3–7 June 2018; pp. 1–5. [Google Scholar] [CrossRef]
- Barg, S.; Ammous, K.; Mejbri, H.; Ammous, A. An Improved Empirical Formulation for Magnetic Core Losses Estimation Under Nonsinusoidal Induction. IEEE Trans. Power Electron. 2016, 32, 2146–2154. [Google Scholar] [CrossRef]
- Shokrollahi, H.; Janghorban, K. Soft magnetic composite materials (SMCs). J. Mater. Process. Technol. 2007, 189, 1–12. [Google Scholar] [CrossRef]
- Sunday, K.J.; Taheri, M.L. Soft magnetic composites: Recent advancements in the technology. Met. Powder Rep. 2017, 72, 425–429. [Google Scholar] [CrossRef]
- Hsiang, H.-I.; Wu, L.-C.; Chen, C.-C.; Lee, W.-H. Power Molding Inductors Prepared Using Amorphous FeSiCrB Alloy Powder, Carbonyl Iron Powder, and Silicone Resin. Materials 2022, 15, 3681. [Google Scholar] [CrossRef]
- Pošković, E.; Franchini, F.; Ferraris, L. Effect of the Insulating Layer on the Properties of SMC Inductors. Appl. Sci. 2022, 12, 8756. [Google Scholar] [CrossRef]
- Long, H.; Wu, X.; Lu, Y.; Zhang, H.; Hao, J. Effect of Polyimide-Phosphating Double Coating and Annealing on the Magnetic Properties of Fe-Si-Cr SMCs. Materials 2022, 15, 3350. [Google Scholar] [CrossRef]
- Shokrollahi, H.; Janghorban, K. The effect of compaction parameters and particle size on magnetic properties of iron-based alloys used in soft magnetic composites. Mater. Sci. Eng. B 2006, 134, 41–43. [Google Scholar] [CrossRef]
- Wu, Y.; Dong, Y.; Yang, M.; Jia, X.; Liu, Z.; Lu, H.; Zhang, H.; He, A.; Li, J. Effect of Annealing Process on Microstructure and Magnetic Properties of FeSiBPCNbCu Nanocrystalline Soft Magnetic Powder Cores. Metals 2022, 12, 845. [Google Scholar] [CrossRef]
- Yan, L.; Yan, B.; Peng, L. Microstructure and Magnetic Properties of Grain Boundary Insulated Fe/Mn0.5Zn0.5Fe2O4. Soft Magn. Compos. Mater. 2022, 15, 1859. [Google Scholar]
- ASTM A772/A772M-00; Standard Test Method for AC Magnetic Permeability of Materials Using Sinusoidal Current. ASTM International: West Conshohocken, PA, USA, 2016.
- Kazimierczuk, M.K.; Czarkowski, D. Resonant Power Converters; John Wiley & Sons: Hoboken, NJ, USA, 2012. [Google Scholar]
- Alatai, S.; Salem, M.; Alhamrouni, I.; Ishak, D.; Bughneda, A.; Kamarol, M. Design Methodology and Analysis of Five-Level LLC Resonant Converter for Battery Chargers. Sustainability 2022, 14, 8255. [Google Scholar] [CrossRef]
- Wu, L.; Wang, J.; Liu, Z.; Zhang, S. Analysis and design of lc series converter considering effect of parasitic components. In Proceedings of the IEEE 2012 International Conference on Computer Distributed Control and Intelligent Environmental Monitoring, Zhangjiajie, China, 5–6 March 2012; pp. 126–130. [Google Scholar]
- Mounika, D.; Porpandiselvi, S. ADC controlled half-bridge LC series resonant converter for LED lighting. In Proceedings of the 2017 2nd IEEE International Conference on Communication and Electronics Systems (ICCES), Coimbatore, India, 19–20 October 2017; pp. 1037–1042. [Google Scholar]
- Erickson, R.W.; Maksimovic, D. Fundamentals of Power Electronics; Springer Science & Business Media: Berlin/Heidelberg, Germany, 2007. [Google Scholar]
- Marcos-Pastor, A.; Vidal-Idiarte, E.; Cid-Pastor, A.; Martinez-Salamero, L. Minimum DC-Link Capacitance for Single-Phase Applications with Power Factor Correction. IEEE Trans. Ind. Electron. 2019, 67, 5204–5208. [Google Scholar] [CrossRef]
- Muneer, A.; Fayyaz, A.; Iqbal, S.; Jabbar, M.W.; Qaisar, A.; Farooq, F. Single Stage Active Power Factor Correction Circuit for Street LED Light with Battery Backup. Eng. Proc. 2022, 12, 69. [Google Scholar] [CrossRef]


| Parameter | Description | Value |
|---|---|---|
| Vin | Input voltage | 127 VRMS |
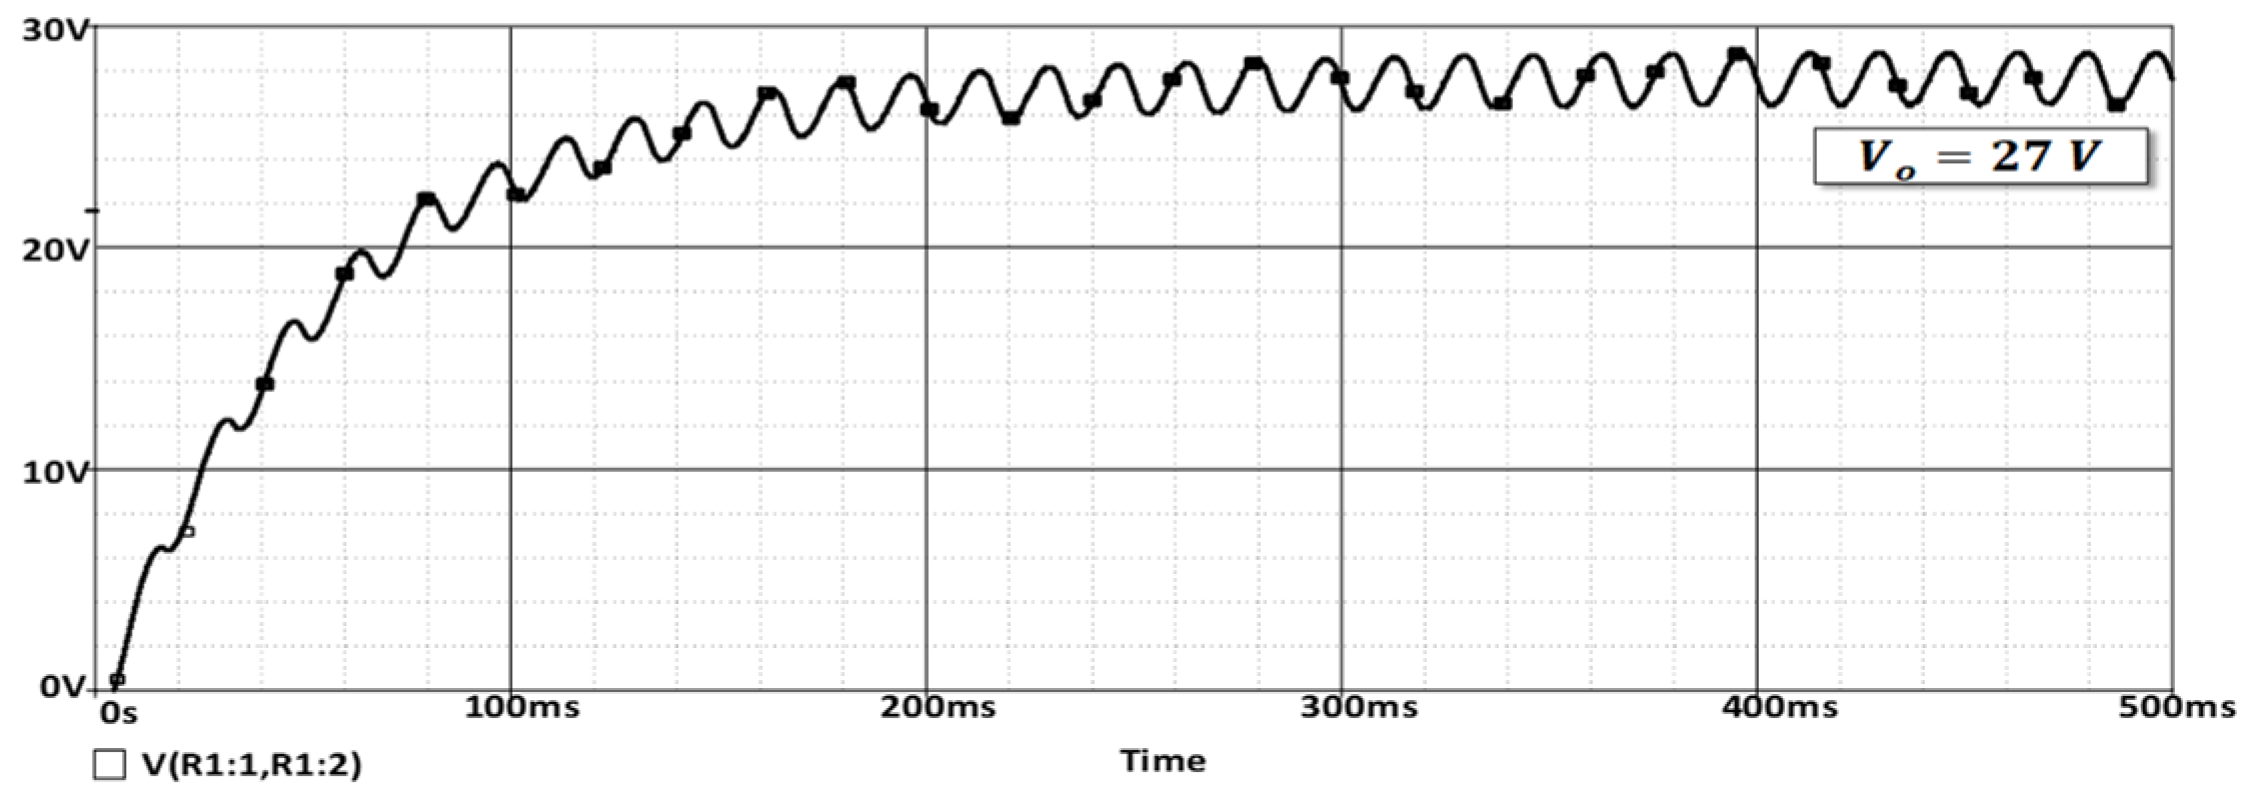
| Vout | Output voltage | 27 Volts |
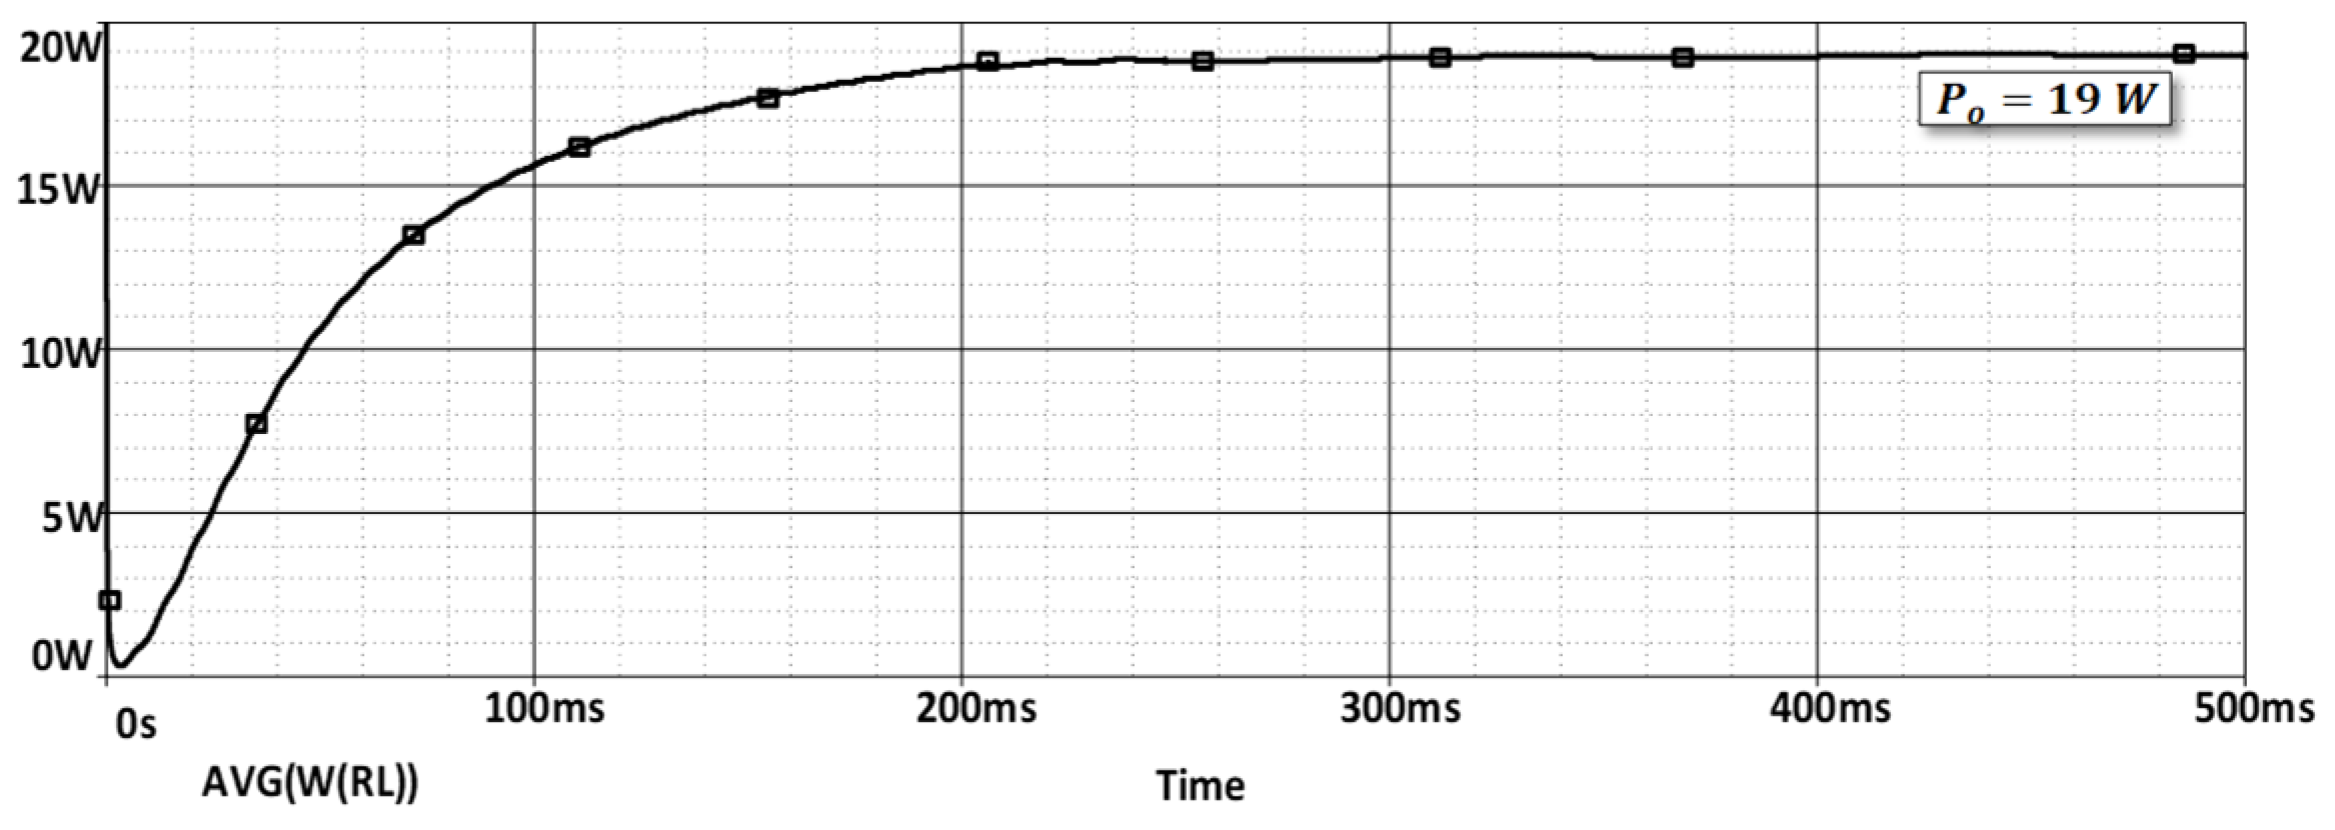
| Po | Output power | 19 Watts |
| fsw | Switching Frequency | 300–800 kHz |
| Parameter | Description | Equation | Value |
|---|---|---|---|
| RL | Load | 38 Ω | |
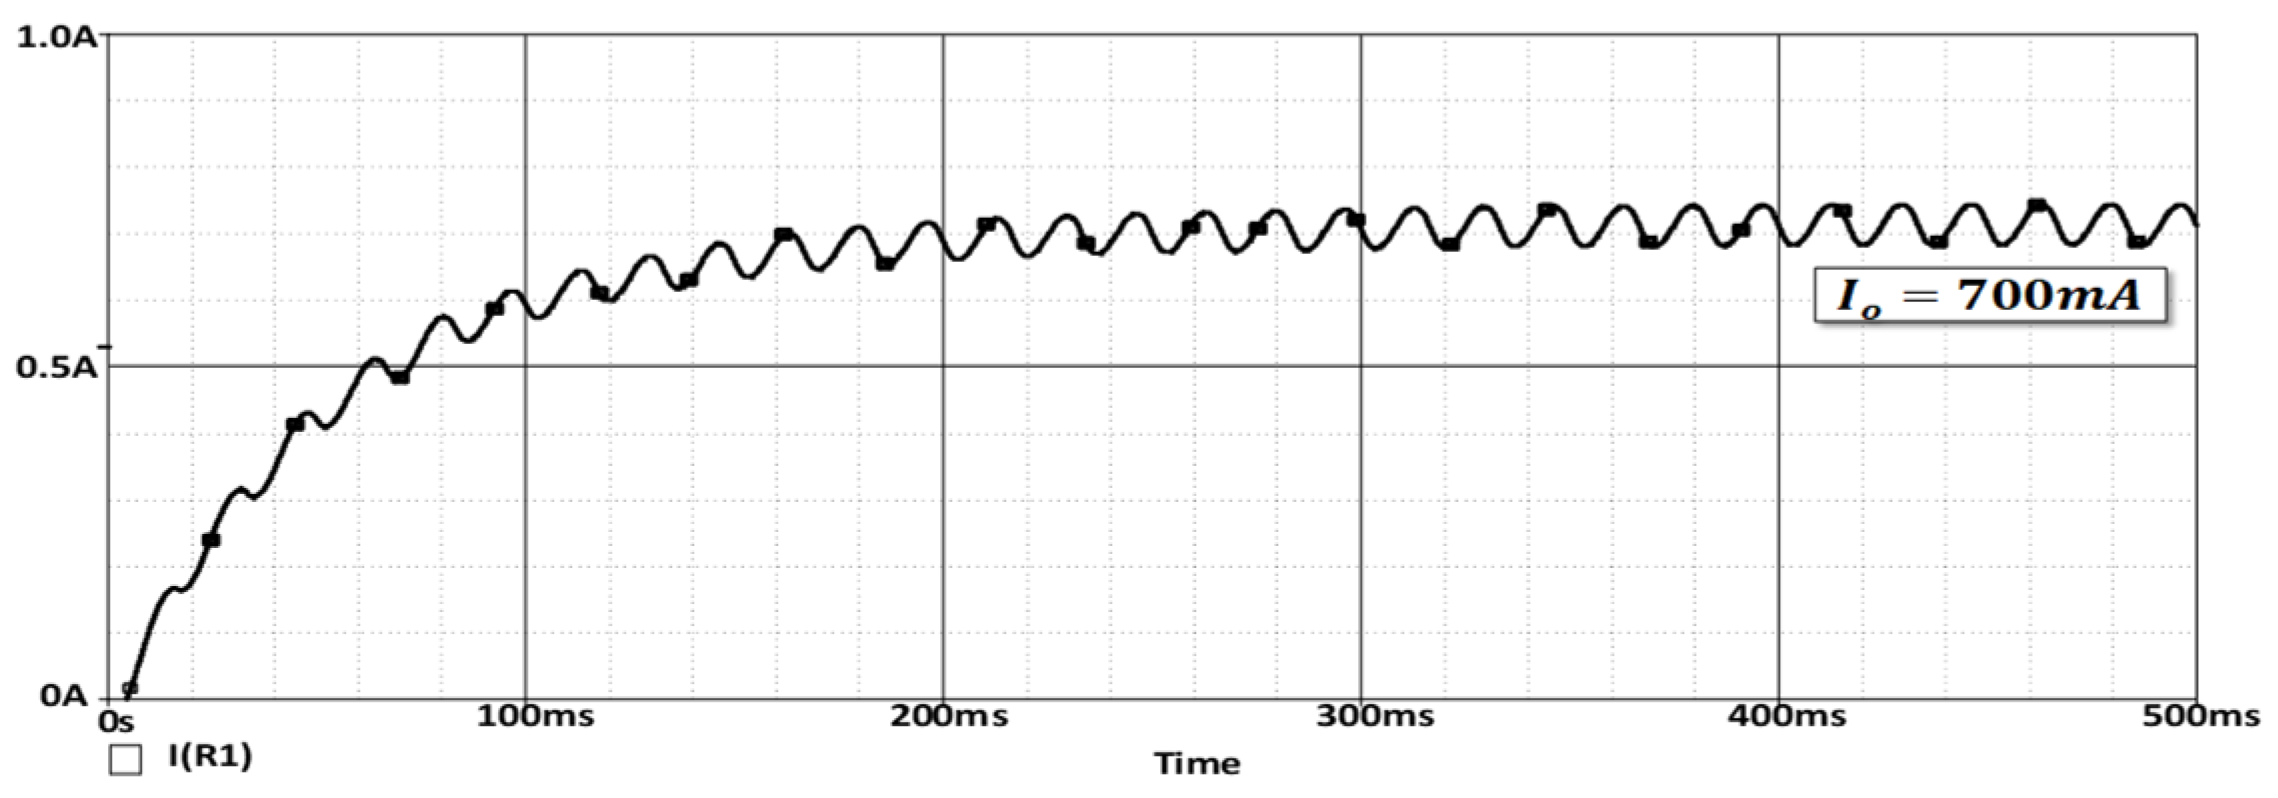
| Io | Output current | 720 mA | |
| Ir | Maximum resonant tank current | 1.60 A | |
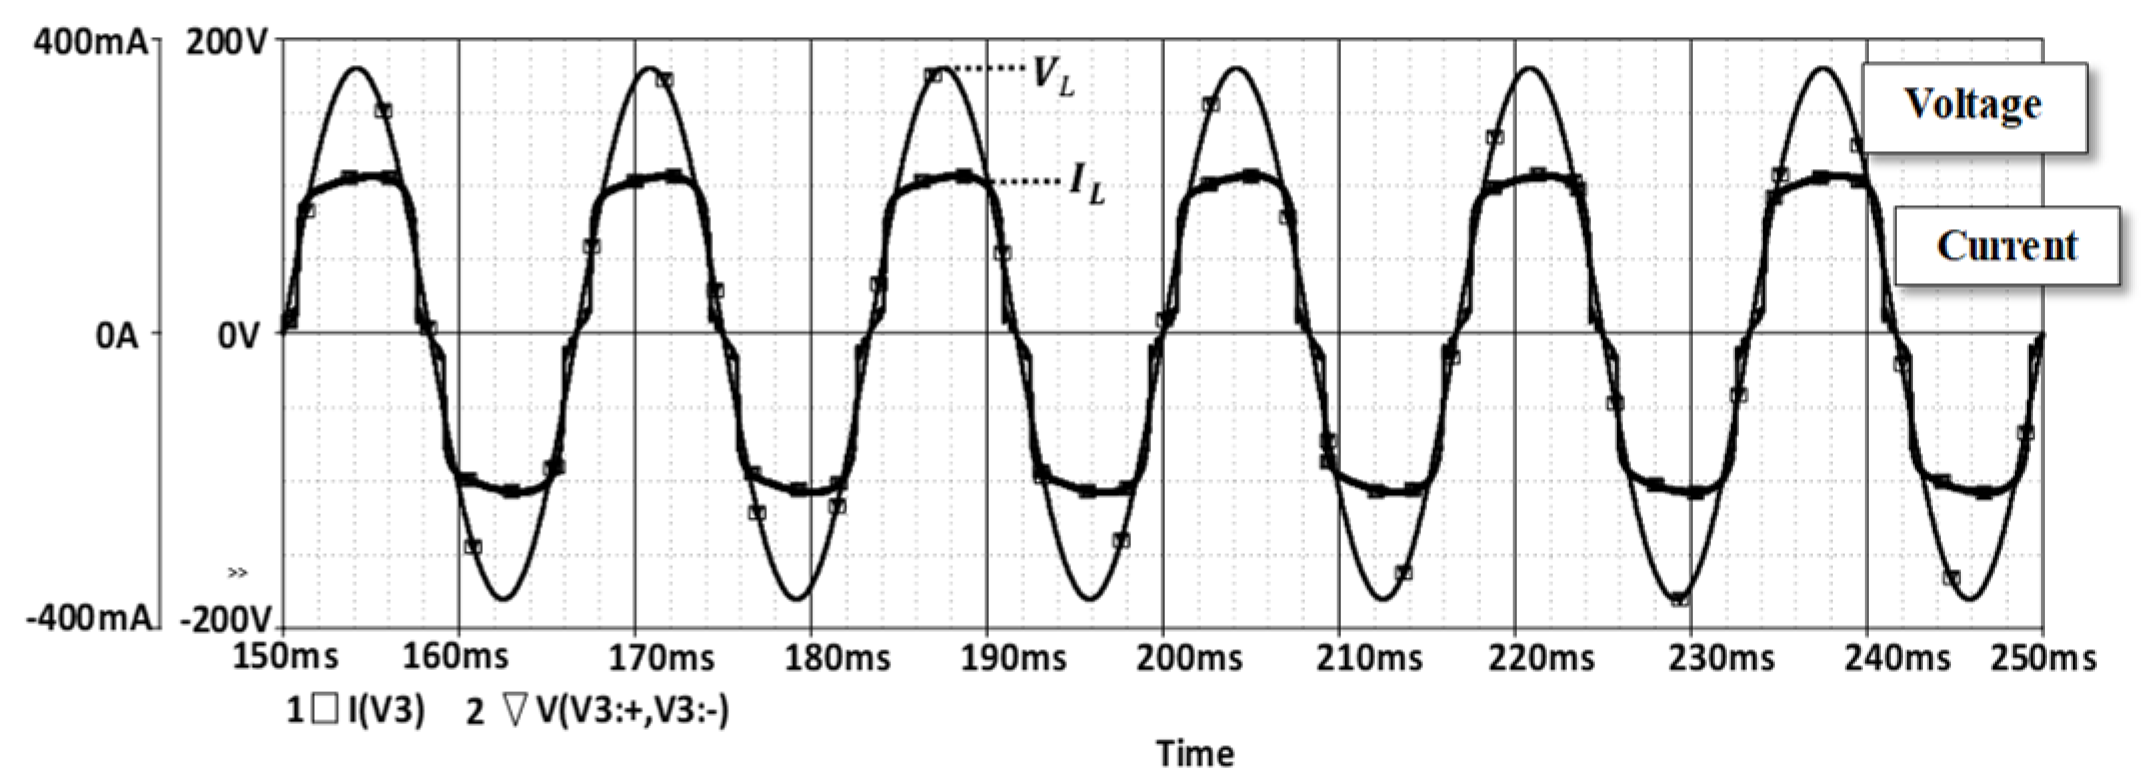
| IL | High-frequency average current | 200 mA | |
| Cr | Freewheeling capacitor | 154 nF | |
| nreq | Rectifier efficiency | 0.96 | |
| Req | Equivalent resistance | 29.16 Ω | |
| Q | Quality factor | 4 | |
| L1 | Complementary inductor in resonance | 37 µH | |
| Lout | Complementary off-resonance inductor | 20.76 µH | |
| La | Resonant inductor | 57.76 µH | |
| Ca | Resonant capacitor | 2.73 nF | |
| PF | Power factor | ≈100% |
| Inductor | THD | Power Factor |
|---|---|---|
| 85% Fe | 14.46 | 98.97 |
| 80% Fe | 14.53 | 98.96 |
| 75% Fe | 14.67 | 98.94 |
| Ferrite | 14.39 | 98.98 |
| Kool Mµ | 14.46 | 98.97 |
| Air | 19.50 | 98.15 |
Publisher’s Note: MDPI stays neutral with regard to jurisdictional claims in published maps and institutional affiliations. |
© 2022 by the authors. Licensee MDPI, Basel, Switzerland. This article is an open access article distributed under the terms and conditions of the Creative Commons Attribution (CC BY) license (https://creativecommons.org/licenses/by/4.0/).
Share and Cite
Lara-Reyes, J.; Ponce-Silva, M.; Cortés-García, C.; Lozoya-Ponce, R.E.; Parrilla-Rubio, S.M.; García-García, A.R. High-Power-Factor LC Series Resonant Converter Operating Off-Resonance with Inductors Elaborated with a Composed Material of Resin/Iron Powder. Electronics 2022, 11, 3761. https://doi.org/10.3390/electronics11223761
Lara-Reyes J, Ponce-Silva M, Cortés-García C, Lozoya-Ponce RE, Parrilla-Rubio SM, García-García AR. High-Power-Factor LC Series Resonant Converter Operating Off-Resonance with Inductors Elaborated with a Composed Material of Resin/Iron Powder. Electronics. 2022; 11(22):3761. https://doi.org/10.3390/electronics11223761
Chicago/Turabian StyleLara-Reyes, Josué, Mario Ponce-Silva, Claudia Cortés-García, Ricardo Eliu Lozoya-Ponce, Susana Magaly Parrilla-Rubio, and Alán Rafael García-García. 2022. "High-Power-Factor LC Series Resonant Converter Operating Off-Resonance with Inductors Elaborated with a Composed Material of Resin/Iron Powder" Electronics 11, no. 22: 3761. https://doi.org/10.3390/electronics11223761
APA StyleLara-Reyes, J., Ponce-Silva, M., Cortés-García, C., Lozoya-Ponce, R. E., Parrilla-Rubio, S. M., & García-García, A. R. (2022). High-Power-Factor LC Series Resonant Converter Operating Off-Resonance with Inductors Elaborated with a Composed Material of Resin/Iron Powder. Electronics, 11(22), 3761. https://doi.org/10.3390/electronics11223761