1. Introduction
The advancement of the automobile technology has led to a corresponding increase in the number of electronics devices used to enhance the performance of smart vehicles. Some of these devices include electronics sensors. Some sensors can detect vehicular movements across a lane without a lane change signal, whereas others can detect movements of oncoming cars in the driver’s blind spot. There are reverse cameras that can detect rear objects that could pose as obstacles, and front sensors that can initiate a gradual decrease in speed if the sensor observes that a nearby car is getting too close. The number of these sensors in smart cars has been on the rise as manufacturers continue to design smarter vehicles by adding more features.
Traditionally, these sensors communicate using the controller area network bus (CANBUS) technology. The CANBUS system has its limitations in the number of sensors that can be added in conjunction with the signal integrity issues that can occur during data transfer. The addition of more nodes could produce bottlenecks in the current traditional system. This paper proposes a solution that takes advantage of virtualization. The virtualized CANBUS system operates in a controlled environment with parallel access to the Ethernet technology. Only limited works have been carried out in the area of using both the Ethernet and CANBUS for data communication in smart cars, and the traffic flow patterns are most often treated independently.
We propose an approach that integrates both technologies in addition to the usage of smart nodes that can dynamically determine the most effective data path to the destination. They allow for the architecture to scale to different bandwidths. This virtualized hybrid development will be able to handle a larger amount of sensors and greater processing speed, with smart controllers that help to make decisions and gain faster access to the central database, which is enabled by the intelligent node architecture. Future smart cars will be able to measure different parameters, run different algorithms, and make multiple decisions all in a shorter time frame with better accuracy.
The motivations for this study include overcoming the limitations currently experienced by the CANBUS technology in the area of data capacity and speed, and the limitations in the maximum number of sensors that can be deployed. The key contributions include providing network virtualization under a hybrid network architecture that can seamlessly switch between the CANBUS and the Ethernet. The proposed solution not only increases the data communication capacity but also greatly reduces the network management complexity by creating simpler virtual topologies among communicating nodes. In addition, the proposed solution is backward compatible with existing components, and creates an opportunity for future smart cars.
The following sections of this paper are organized as follows:
Section 2 describes the related research in the field, and
Section 3 discusses the concept and the architecture of the proposed solution.
Section 4 describes system prototyping and the experimental setup.
Section 5 describes the laboratory tests and results.
Section 6 discusses key issues for industry adoption.
Section 7 describes the conclusion, the value, and the future works of the proposed method.
2. Related Research
The following subsections cover the background of CANBUS operations, the Ethernet, network virtualization, and the relationships of the technologies used.
2.1. CANBUS Operations
CANBUS is the key serial messaging protocol widely used for communication in automobiles [
1]. It was originally developed by a German company called Bosch for automobile and vehicular industries [
2]. CANBUS is easy to set up and inexpensive, and it operates with a very stable and simple technology [
3]. The protocols used by CANBUS are compatible with several other applications and programs, and can interface with other hardware [
4]. The CANBUS protocol runs in the same layer that corresponds the physical and data layers [
5]. This has led to the development of many CANBUS-based protocols that are used for several different purposes. A serial CANBUS uses the carrier sense multiple access/collision resolution technology when accessing the communication bus. It should be stated that control over the queuing policies cannot be guaranteed inside the communication stacks of the electronics control units (ECUs) [
6]. Research was conducted on how to encrypt the CANBUS data messages, which explored the usage of a digital signature based on the ECDSA algorithm to protect data exchanged during communications over the CANBUS [
7].
2.2. CANBUS Applications
CANBUS systems have been used for testing and developing event-triggered solutions over time-triggered designs [
8] and the analysis of distributed control systems in avionics systems [
9]. Devices connected to the CANBUS were used to measure the body movement with a prosthetic limb sensor [
10]. The CANBUS was used in orientation tools in research on how to assist the visually impaired. It has some advantages for redundant systems and data integrity, with a sophisticated error-detecting mechanism [
11]. The technology was used to research the behavior of drivers, as it relates to fuel consumption [
12]. A low-cost open-source CAN system was used to test the possibility of using it as a teaching aid [
13]. The CANBUS system was used to solve the problem of a long-range monitor for a rotary drilling rig using an inclinometer [
14]. Another relevant usage includes application in automotive safety based on dual-camera systems [
15].
CANintellisIDS focuses on the combination of a convolutional neural network (CNN) and the attention-based gated recurrent unit model, with the capacity to detect both single and mixed intrusion attacks on a CANBUS, thereby enhancing the security of the CANBUS data path [
16]. Several other papers applied the usage of CNN and deep-learning-based road distress visual inspection and single-class detection-based deep learning approach systems for the identification of road safeties. They complemented the expected improvement in the functionality of the future smart cars not only in the internal workings for data communication, but in the states of the roads on which these future smart cars would move on [
17,
18]. The road health inspection through the automated machine learning or AutoML technology was discussed in [
19]. These papers focused more on the complementary importance of the ability of the future smart cars to detect the state of the roads in which they move on with the right sensors and little supervision, but they did not focus on the internal communication operations of the future smart vehicles. All of these show the usability and relevance of the CANBUS technology in the industry.
2.3. Ethernet and CANBUS
Ethernet technology has the advantage of using both shielded cables to reduce the susceptibility to interference and a copper wiring system, which has a longer life expectancy. A wired Ethernet can only be tapped when there is physical access to the cable. The 100 m limitation would not be an issue in a vehicular environment.
There is a limited amount of research on the usage of the Ethernet in conjunction with the CANBUS. W. Chen et al. discussed how to extend the local area network (LAN) over the CANBUS using wired devices to extend the connectivity of the inputs to the network [
20]. The low setup cost of the CANBUS has led to the convenience of its quick diagnostics and popular usage for real-time analysis for diverse simulations [
21]. A combination of the Ethernet and CANBUS was used to create a control system based on data exchange to measure the large amount of real-time information between mounted devices and different control nodes in autonomous underwater vehicles [
22]. Siddiqui proposed a secure means of communication over the CANBUS [
23].
One related work, where CANBUS and Ethernet technologies were both used, was performed by Ziebinski et al. [
24]. In this research a USB/CAN converter was used to convert the real-time signals flowing from a short range light detection and ranging (LiDAR) device to receive live signals passing through the converter [
25]. An Ethernet protocol for industrial real-time communication was developed to support traffic with industrial real-time applications over non-real-time LAN technology [
26]. Research was carried out using Ethernet technology for data acquisition distribution for small animal PET scanners [
27]. The closest research on using the Ethernet inside cars was conducted with the possibility of having an Ethernet backbone of exchanging data with the traditional CANBUS [
28]. It is worth mentioning TTEthernet, which is an Ethernet protocol specified by TTTech. This is a time-triggered Ethernet protocol recommended for usage in automobiles and aerospace [
29].
Another related work involves the curve-aware model predictive control trajectory work conducted for an automated guided vehicle (AGV) over on-road, in-door, and in agricultural land, which emphasizes the importance of accuracy in tracking and directing AGVs. This relies on a continuous communication with the environment, which enhances the accuracy of the trajectory tracking of the AGV devices as it moves, but falls short of an enhanced means of data feedback between the sensors and the AGV [
30].
Table 1 gives a summary of some recent related works.
2.4. Network Virtualization
Network virtualization is an important technology in the future of networking. It allows multiple virtual networks to run in a shared but isolated space or infrastructure [
31], which enhances the usage of the available infrastructure with the ability to prioritize the processes. The application of network virtualization is becoming popular in the provision of cloud network services, a solution for the limitations experienced with the deployment of a virtual local area network (VLANS), which has been a traditional way to isolate network services [
32]. It is used in the software-defined network to provide a formidable solution that allows for scalability and reduces the difficulty in network management. The Docker container engine in [
33] was used to create the network virtualization environment. The idea of using network virtualization opened up many doors for effective services to be more easily deployed and scoped to handle a higher level of threat on sophisticated network attacks [
34]. In the Docker portion, a container was created to handle error messages that show up if the high-bandwidth network path is unavailable. This will be easier to detect because specific resources for high-bandwidth communication and low-bandwidth communication are allocated as the occasion demands.
2.5. Software-Defined Network
Software-defined networking (SDN) is a solution that separates the traditional switching system into three components: the management plane, the control plane, and the data plane. The controller systems can either operate in a centralized mode where all of the data pass through one central controller, or in a distributed mode, where the traffics are routed through several controllers.
Lightweight SDN (LSDN) is a form of SDN for a resilient real-time IoT-based architecture on the optimization of the control functions. It proposes an optimal SDN architecture and virtualization functions. The study shows that this LSDN performed better than the centralized general SDN on real-time IoT, with excellent QoS measurements in terms of the control overhead, latency, and delivery ratio on real-time IoT (RT-IoT) [
35]. The lightweight virtualization SDN technology, which was found to be a better option for virtualization over the traditional hypervisor-based virtualization, was used in the virtualization process for the isolation of different services [
36]. A container-based lightweight virtualization proven to work properly with the CANBUS system was proposed [
37]. It has the capacity to make priority-based decisions by handling multiple inputs. The lightweight SDN is a good fit for the development of future in-vehicle communication platforms.
3. Concept and Architecture
3.1. Significance of Proposed Work
In this section, we explain the advantages of this proposed work in detail. It overcomes some of the challenges and limitations when designing future smart cars. This proposed solution is both backward compatible with current and older smart cars and forward compatible with new features, such as dual data pathways using CANBUS and Ethernet virtualization. The introduction of virtualization with smart nodes at the edges, intelligent switch nodes, and traffic analyzers for data transportation and the control of the bandwidth application makes this proposed work significant.
None of the earlier papers have suggested the option of the application of virtualizing the data passage process. In our approach, the controllers will have the ability to migrate all data traffic through an intelligent traffic analyzer and reroute to any of the available pathways should any of the data buses fail. We also propose bandwidth conservation when data are received, along with a virtualized alert system should there be an error or a constraint in the availability of resources to process the transferred data. This proposed work features smart nodes that carry out preliminary actions on the data types before passing on to the traffic analyzer through a data path for proper processing. The virtualized roles of the systems help us to determine how resources can be moved between the low and high-bandwidth demand processes.
3.2. System Architecture
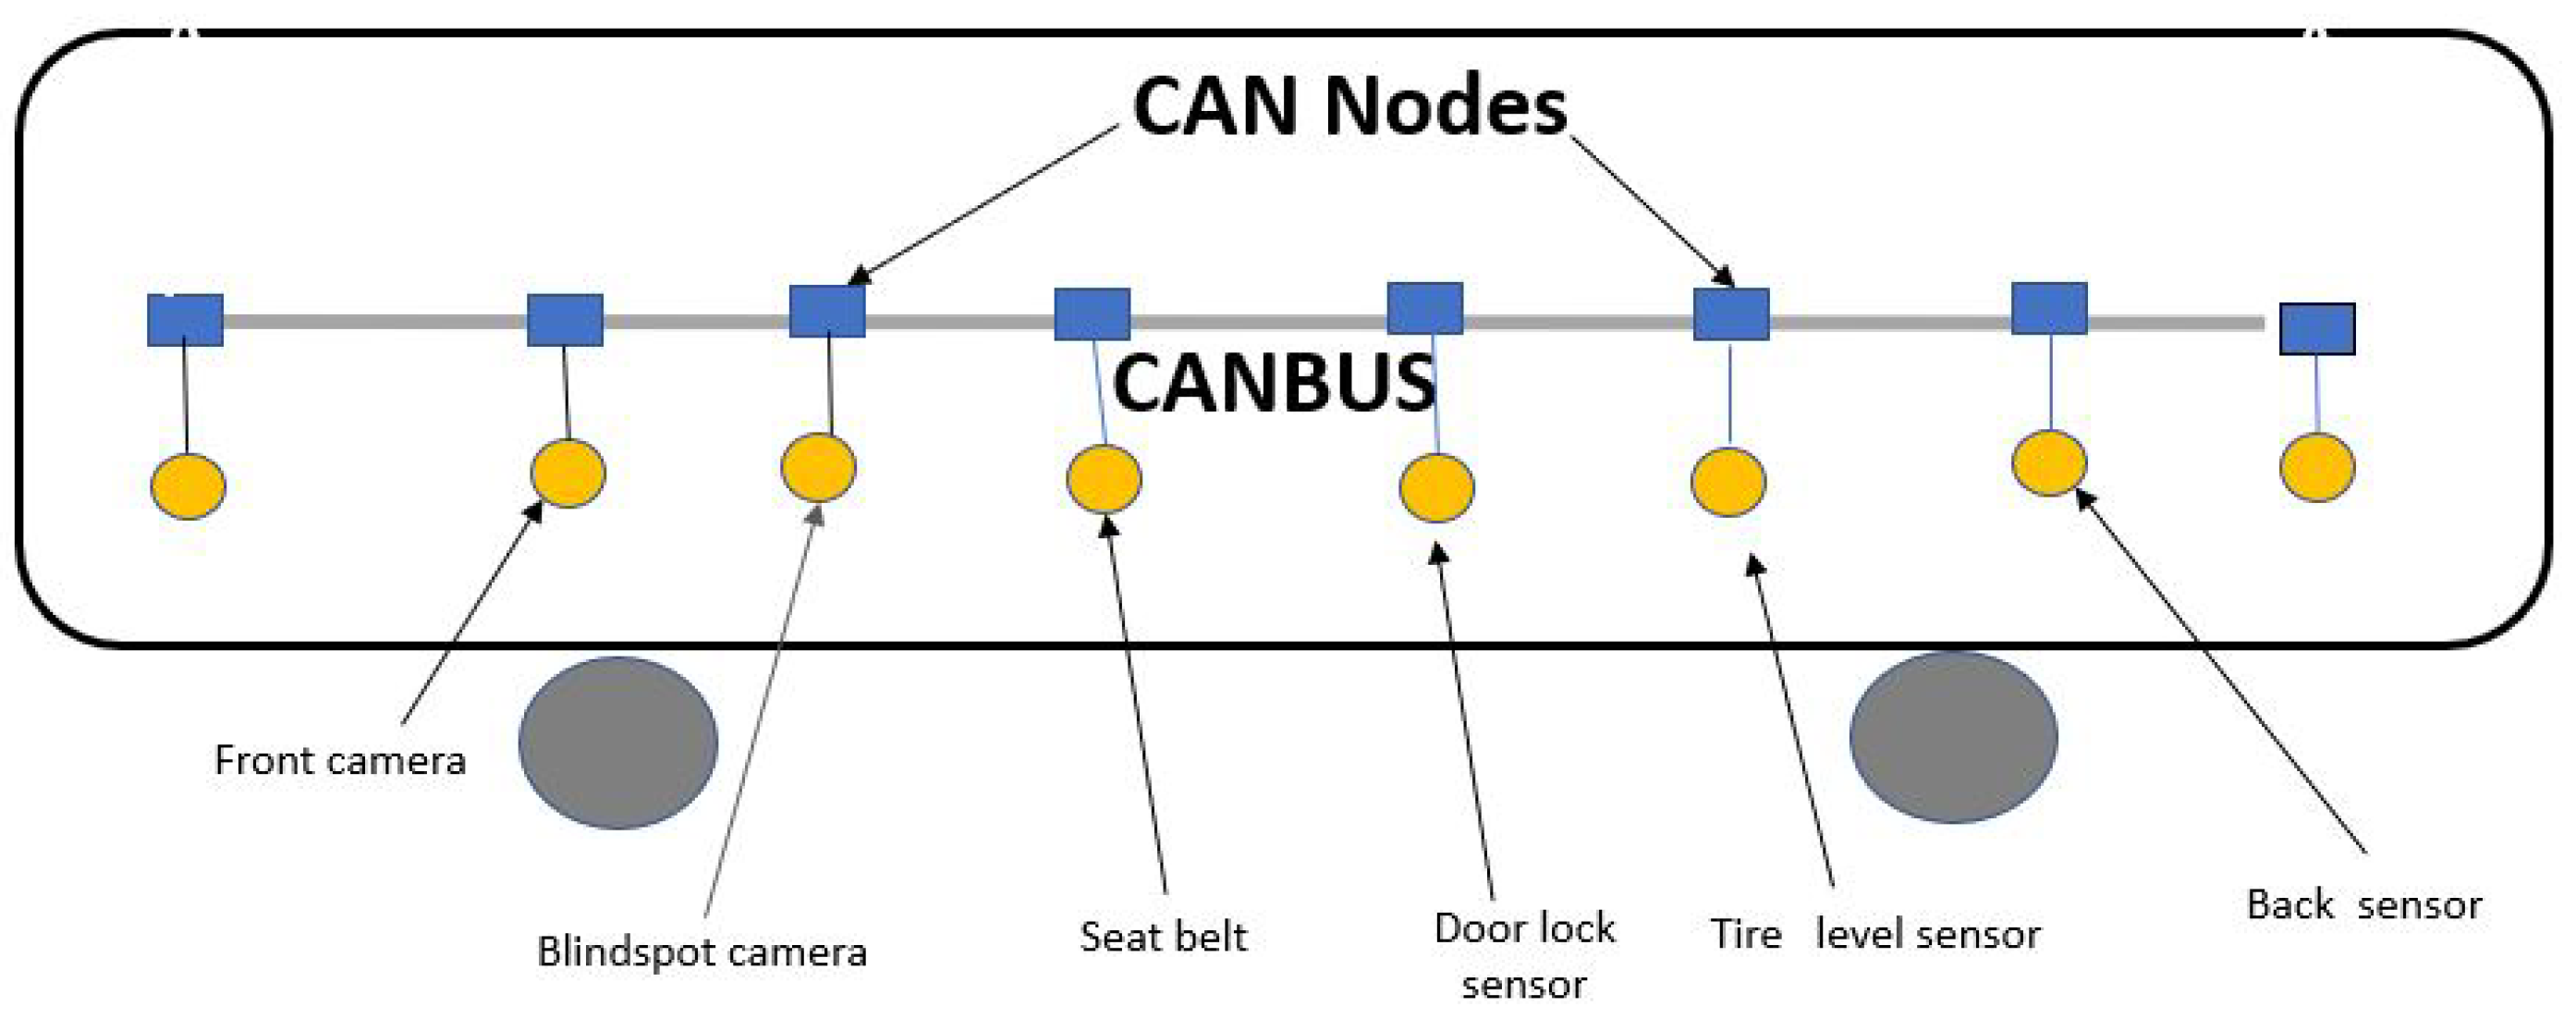
In this section, we explain the proposed system architecture, which takes advantage of the virtualization policy to isolate the processes. Existing papers on Ethernet usage in smart cars do not consider the possibility of smart nodes in a virtualized environment. The diagram in
Figure 1 shows a typical traditional CANBUS layout.
It was observed that there were limitations with the connection setup due to the frequency with which access can be granted on the CANBUS. We argue that the introduction of the Ethernet option will overcome the limitations of the CANBUS. We propose a systematic mechanism that takes into consideration the types of data, priority of data, and the data bandwidth requirements using intelligent switch controllers in a virtualized environment.
Since virtualization helps to isolate different levels of priority and resource demands, the traffic analyzer will also sense resource limitations that could trigger a delay, a shut down, or a reduction in resource availability. It will re-assign resources from low-priority activities or processes to high-bandwidth or high-priority processes, enabling them to run smoothly.
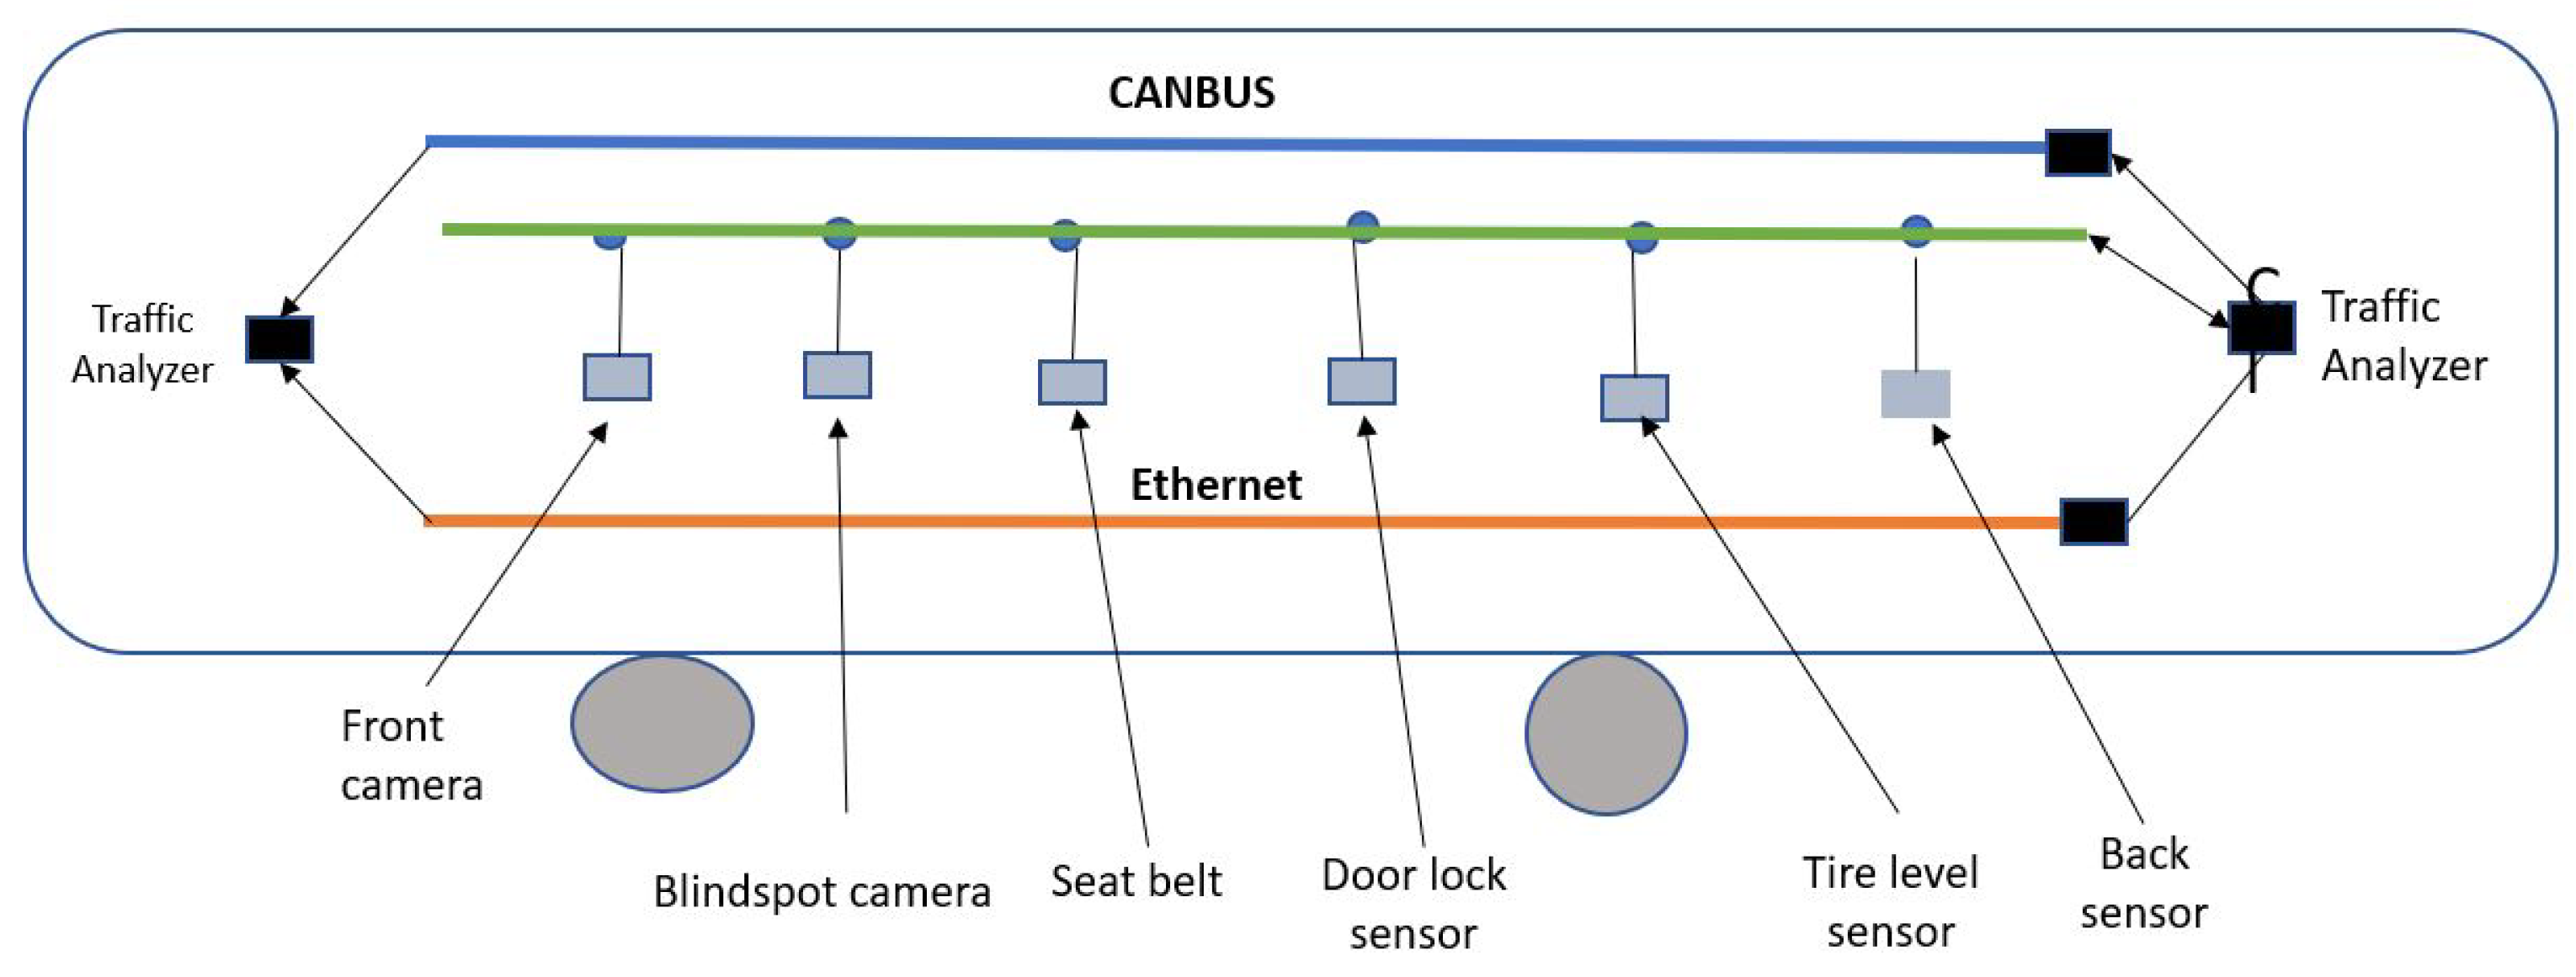
Figure 2 below shows the proposed virtualized dual architecture with the smart nodes connected.
3.3. Functional Layers
This section focuses on the functional layers proposed in this paper. Each layer contains devices that handle different events, which, in turn, enable the proposed architecture to operate smoothly. The modular architecture through this virtualized concept ensures that a breakdown in one layer or a module does not bring down the entire system.
3.3.1. Hardware Layer
The hardware layer contains the hardware devices supporting the architecture. All of the hardware devices operate at this level, where the network devices are located. Data can be received and passed onto other layers for further processing.
3.3.2. Operating System
This layer runs all of the required programs and support applications for virtualization, network testings, and processing for routing data traffic. We recommend the usage of the Docker container engine for the virtualization environment, which is a popular container based on the Linux container. It creates a virtualization environment that enables the application of several stand-alone Unix systems. It has a faster startup system, which a traditional virtual machine does not have, and can run the program directly from a host independent of the host systems. The smart controller can take advantage of this virtualization to isolate faults in different hardware hosts running a lower-level operating system and decide how to allocate resources to different processes based on demands. There is a host operating system (OS) running on the testing hardware. Running on top of this OS are the test applications used to capture different data traffic loads running through the CANBUS or the Ethernet data path.
3.3.3. Sensor Input Layer
This layer contains all of the sensors and the media through which information is received into the smart nodes for processing. This will include the cameras, brake applicators, blindspot camera, and many other sensors in a smart car. Data produced by sensors are then passed along to the data bus through interface connections that also allow for data to be tracked as they move into the smart nodes.
3.3.4. Controller Layer
This layer has the smart nodes of the traffic analyzer. The smart nodes have built-in cards that allow them to perform a quick analysis of the data received. The traffic analyzers are responsible for a high level of data and information analysis, such as deciding the priority of the the data, how many processors are needed, and where the information should be passed. The analyzer decides whether data should be sent to the CANBUS or the Ethernet and backs this up with the right amount of resources. In general, data meant for the CANBUS are primarily routed to the low-bandwidth data pathway, whereas the bandwidth-intensive data are routed towards the high-bandwidth path.
3.3.5. Output Layer
This is the layer that handles the responses or outcomes of all of the data received after being processed and analyzed. There is a functional controller that receives the processed data flowing in from both data paths with necessary attributes.
3.4. Component Structure
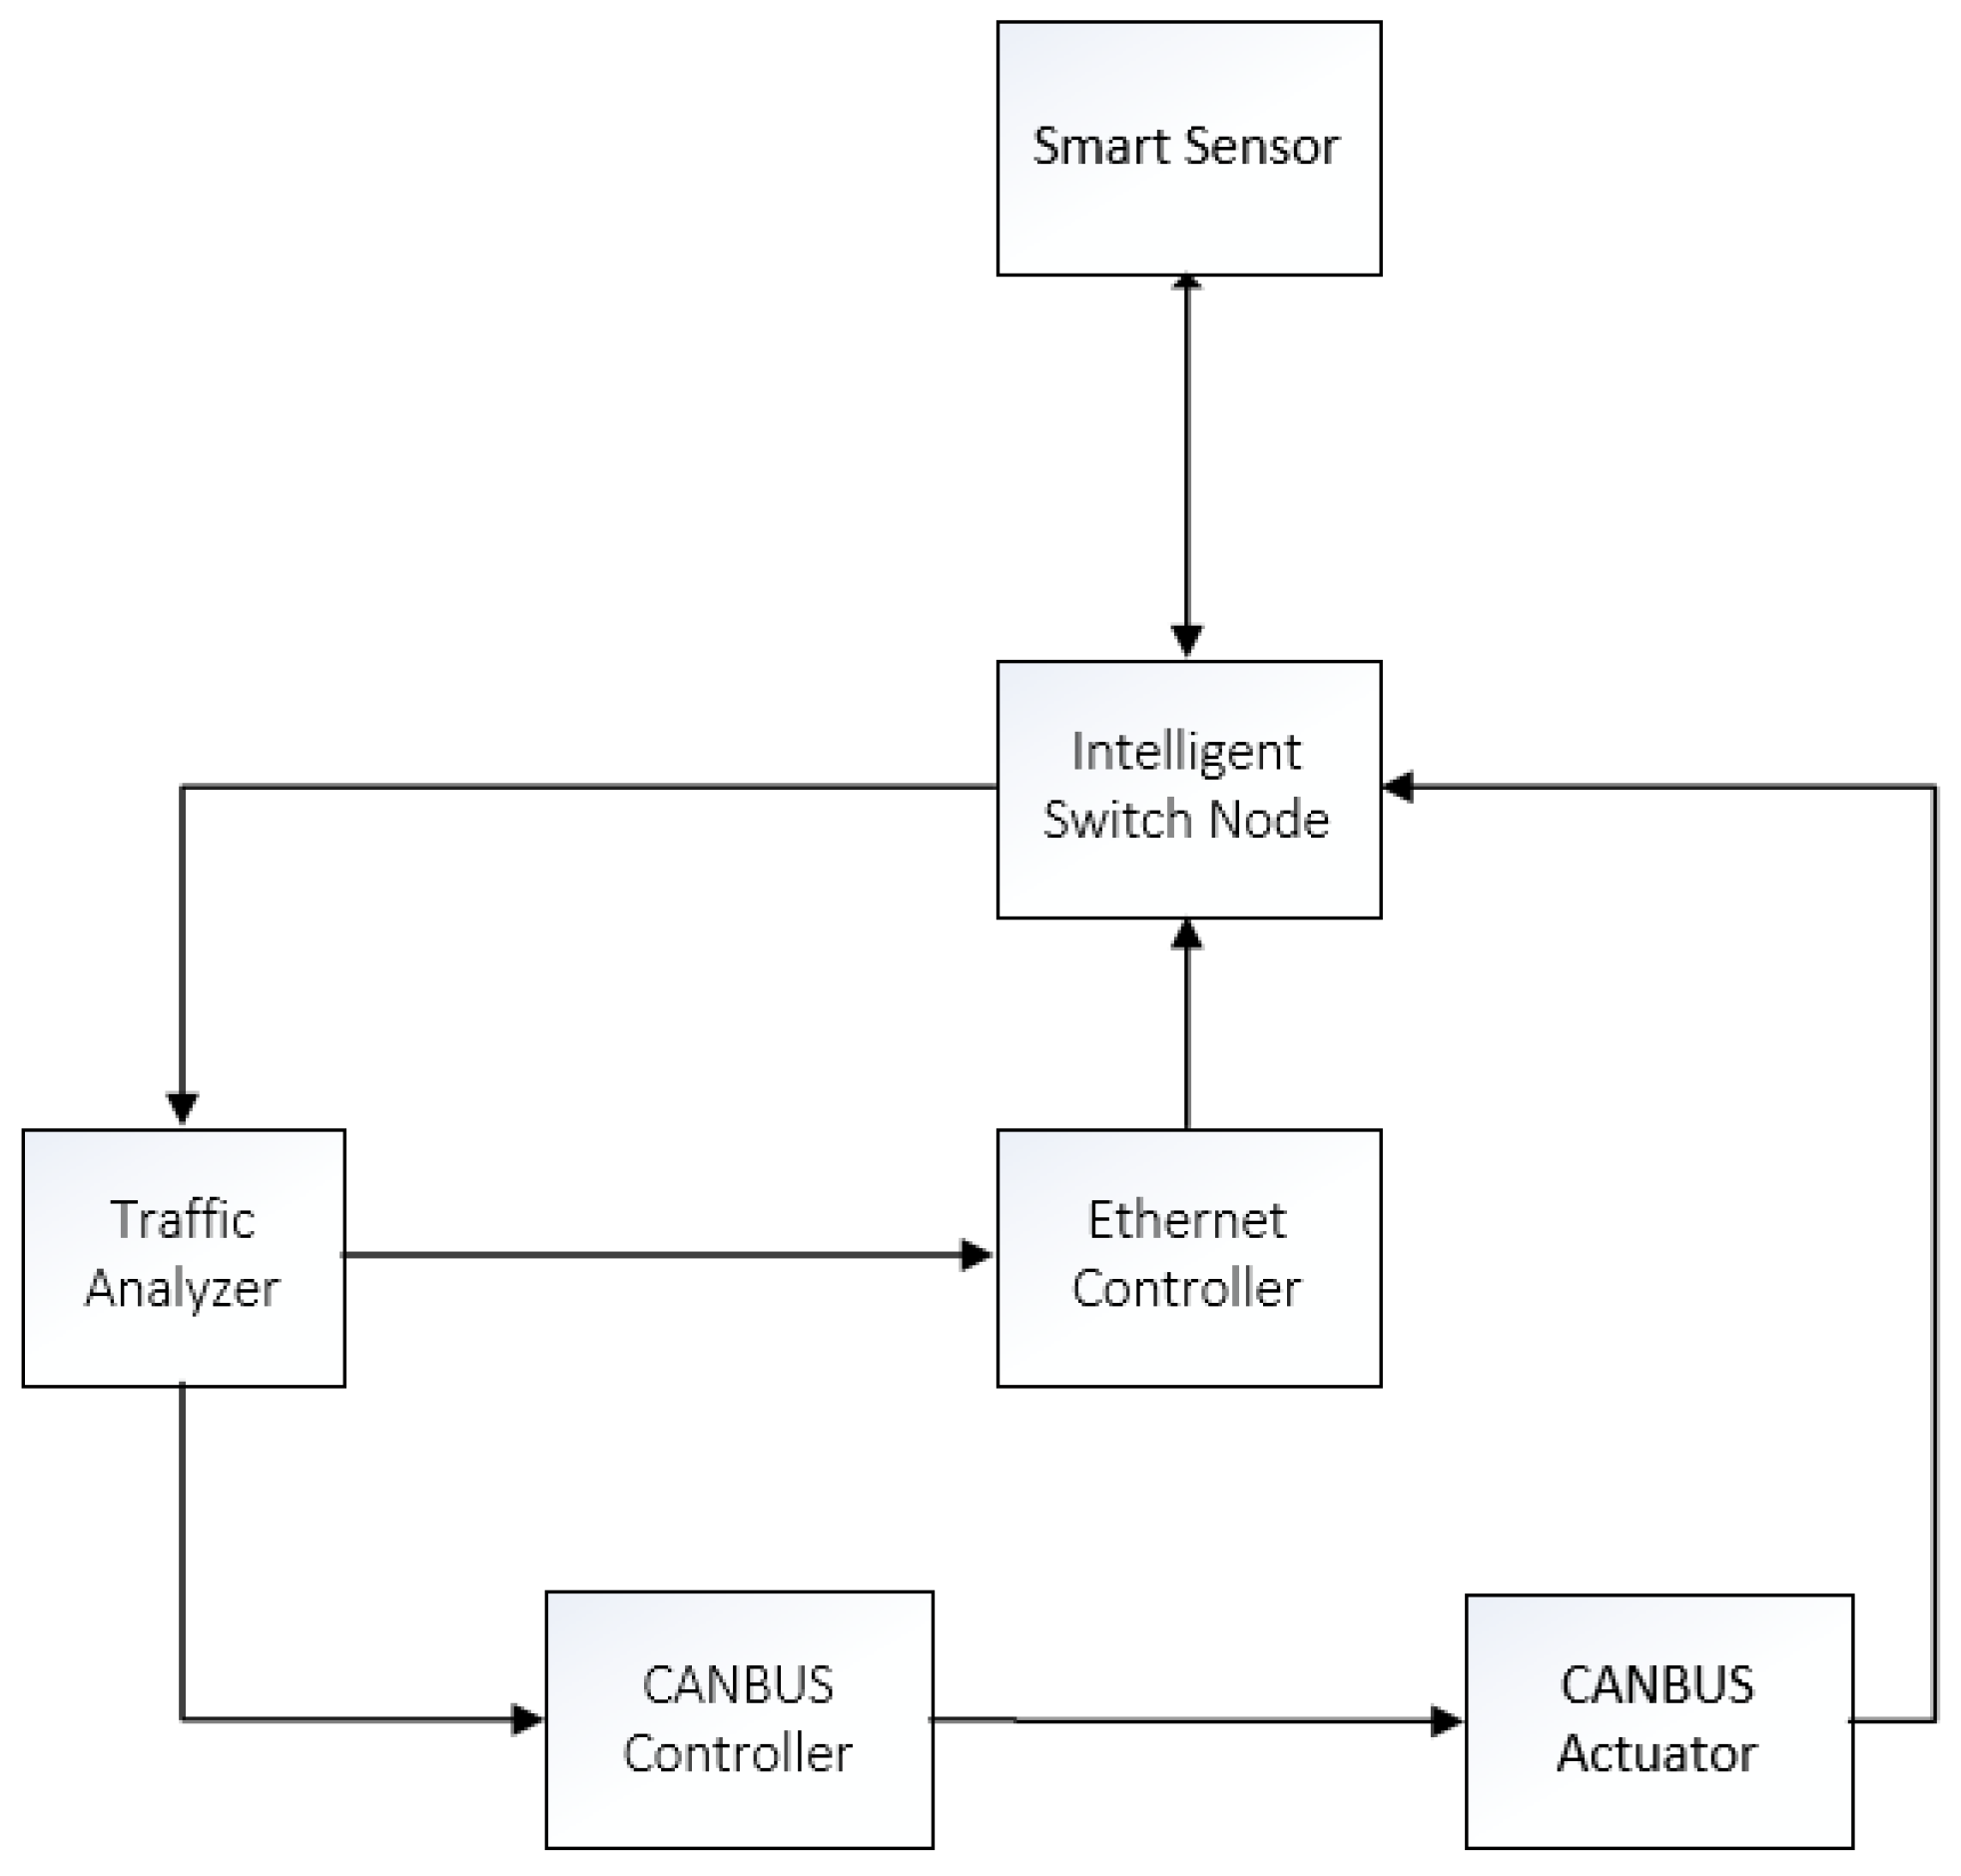
Figure 3 shows the component structure of the proposed architecture. The components are explained in detail as follows.
Smart Sensor: A smart sensor is a regular sensor integrated with embedded processors to perform configuration and data processing functions. It has default settings for the smart sensor pre-loaded on it. The smart sensor will send a message to the intelligent switch node to notify it of the current status of the new sensor that is just being triggered or turned on. Once configuration data are sent to the intelligent switch, the smart sensor starts to forward collected data to the intelligent node continuously without altering the content.
Intelligent Switch Node: This switch node receives notifications from the traffic analyzer, such as the bandwidth requirements, data packet sizes, and the signature of the sensor that owns the data. It also receives message alerts from the controllers if the alert level is high, medium, or regular.
Traffic Analyzer: This detects the traffic pattern change and modifies the path configuration in the right direction. It has connections to both Ethernet and CANBUS data paths, which give it the ability to monitor traffic appropriately. The traffic analyzer checks constantly to see if both data paths are available. If any of the data path is down, it will route all of the traffic to the available path regardless of the bandwidth requirement. The traffic analyzer is also responsible for checking the data size and the number of processors needed for a particular process. It not only passes the data to the available data bus, but also ensures that the right resources are available when needed. If the low-bandwidth path is congested or overloaded, the traffic analyzer will check the high-bandwidth Ethernet path to see what processes are continuously running and decide if data on the CANBUS path can be sent to the Ethernet path.
Ethernet Controller: The Ethernet controller manages data destined for the Ethernet interface. Typically, high-bandwidth traffic routed to the Ethernet data path is handled by the Ethernet controller.
CANBUS Controller: The CANBUS controller checks to ensure that the data are suitable for the CANBUS data path and have all of the necessary information. It passes this to the CANBUS actuator, which has access to the physical media.
CANBUS Actuator: This actuator is able to diagnose the data received on the controller. It can ensure that the packet sent is complete and notifies the module controller that there is traffic from a CANBUS data path, which helps the controller to know how to process the data. There are specific data signals that the actuator will send, which helps the controller to know the priority of the data coming in and how much processing power will be required.
4. System Prototyping and Experiment Setup
To demonstrate the proposed architecture, we carried out data traffic analysis using CANBUS and Ethernet setups. The data processes were isolated in such a way where a crash or corruption in one container will not affect other containers.
Two data paths were created to represent the CANBUS and the Ethernet paths, with hardware acting as both a smart node and an intelligent switch. The nodes have the capacity to connect directly to the sensors passing data through both paths simultaneously.
The built-in application for PICAN2 controller card and a USB/CANBUS converter cable were used to send and receive data between each CANBUS node. The Iperf program, which is an application used to check latency between two endpoints over a data path in a LAN, was used to measure the traffic performance for data transmission over the Ethernet. Each application has different capabilities to capture different features. This procedure ensures the possibility of having dual and independent data transmission paths between source and destination pairs.
The wired Ethernet acts as the primary transport link for high-bandwidth processes, whereas the CANBUS acts as the primary path for low-bandwidth traditional traffic. They both serve as backup paths for one another should any of the media go down. This paper evaluates the response times of both data paths and confirms the speed advantage of the proposed approach with large data sizes against the traditional CANBUS.
4.1. Setup Framework
The proposed hybrid architecture has the advantages of the Ethernet technology in the vehicular environment against the limitations of the node-to-node configuration in the CANBUS, with the ability to switch between data path lanes. For the convenience of lab testing, we used Raspberry Pi boards as our nodes due to their availability, adaptability, and compatibility. The Raspberry Pi boards cannot ordinarily communicate directly with a CANBUS network.
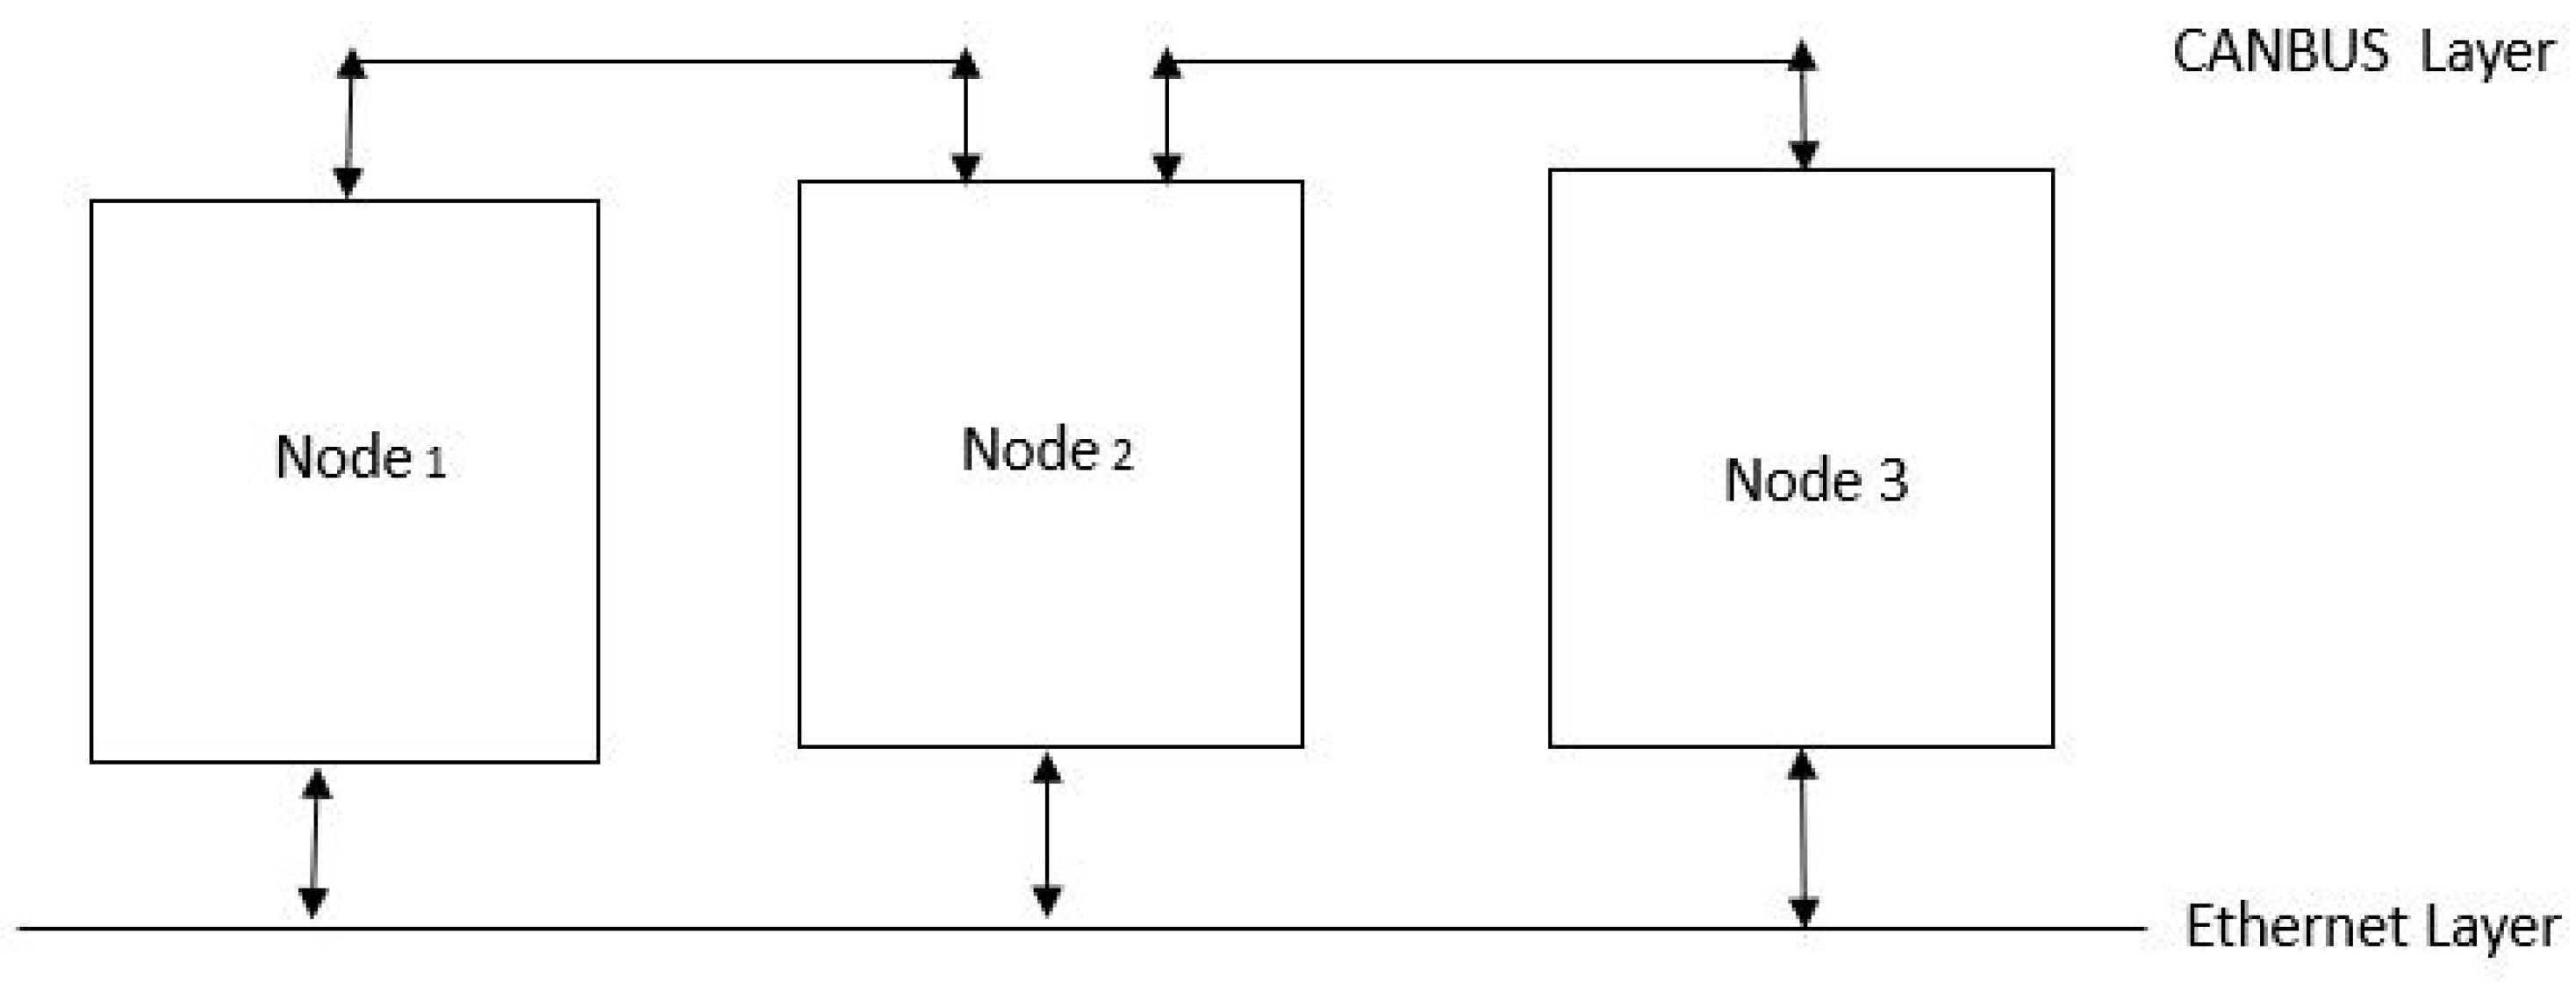
We set up a prototype testbed with nodes based on the architecture shown in
Figure 4. We used the Raspberry Pi as the hardware host for each of the nodes. Each node has dedicated software and hardware for connecting the CANBUS system and the Ethernet data bus. While the CANBUS was setup in a point-to-point mode, the Ethernet had a central switch which ensures that each host could talk directly with each other by routing traffic from the source to the destination through the switch.
A serial peripheral interface was used as a bridge between the CANBUS and the Raspberry Pi board. This involved a CAN controller supported by Linux/Raspbian with model MCP2515. We used a PiCAN2 CANBUS Board for Raspberry Pi 3. This came with a controller on-board, a high-speed SPI interface with standard and extended data remote frames, and a CAN connection via sub-D connector or a screw terminal. It had a built-in 120-ohm terminator, which was required at the endpoint of every CANBUS.
4.2. Input and Output Data Setup
The input layer included a node at the edge that formally initiated data in real time to the receiving node. The traffic could either go through the CANBUS or Ethernet path. This lab setup also supported an input from a real-life camera sensor sending data to the receiving node. The data were generated by initiating data packets from the sending nodes using the proprietary CAN traffic generator, with data being sent from one node to another over the CANBUS. The applications running on the nodes that were used for sending the data acted as the traffic analyzer, which decided whether to send traffic through the high-bandwidth data path or the low-bandwidth data path. The receiving node obtained the data information from the sending node through either the CANBUS or Ethernet data path, and forwarded it to the controller for further decision making.
The virtualized setup in the lab was deployed for the purpose of running different tests through different data pathways while monitoring the impacts on the bandwidths in each data path. The data packets sent were monitored to evaluate the impacts as the packet sizes were increased and data were transmitted. When different levels of traffic and congestion were created on both data paths, the data packets were monitored. This information helped the smart nodes and the traffic analyzers to have sufficient information to decide how to route different data messages in the prototype. The increase in the number of times that data were sent repeatedly helped to study the CPU power that may be required by the smart nodes and traffic analyzers. We also took advantage of the Iperf tool to extract the jitter behavior from the major parameters that were common to both data paths.
5. Experimental Results
This section focuses on the experimental results that were obtained based on the performances of the different traffic payload captures. The results have been separated into the CANBUS and Ethernet test result categories. The experimental results were run separately, but, in real life, the two technologies will run simultaneously. The virtualized smart node hides all of these details from the users and will operate automatically.
5.1. CANBUS Test Results
This section focuses on the results obtained from the CANBUS in the lab during data load performance traffic testing and the implications of the result. Different packet loads were sent at different times and the behavior of these loads were captured as they passed through CANBUS data paths based on the available bandwidths.
Each data passed from the source to the destination had a timestamp and a CAN ID attached to it, which helped us to identify specific data. The loads of data packets passed across were classified into low, medium, and high.
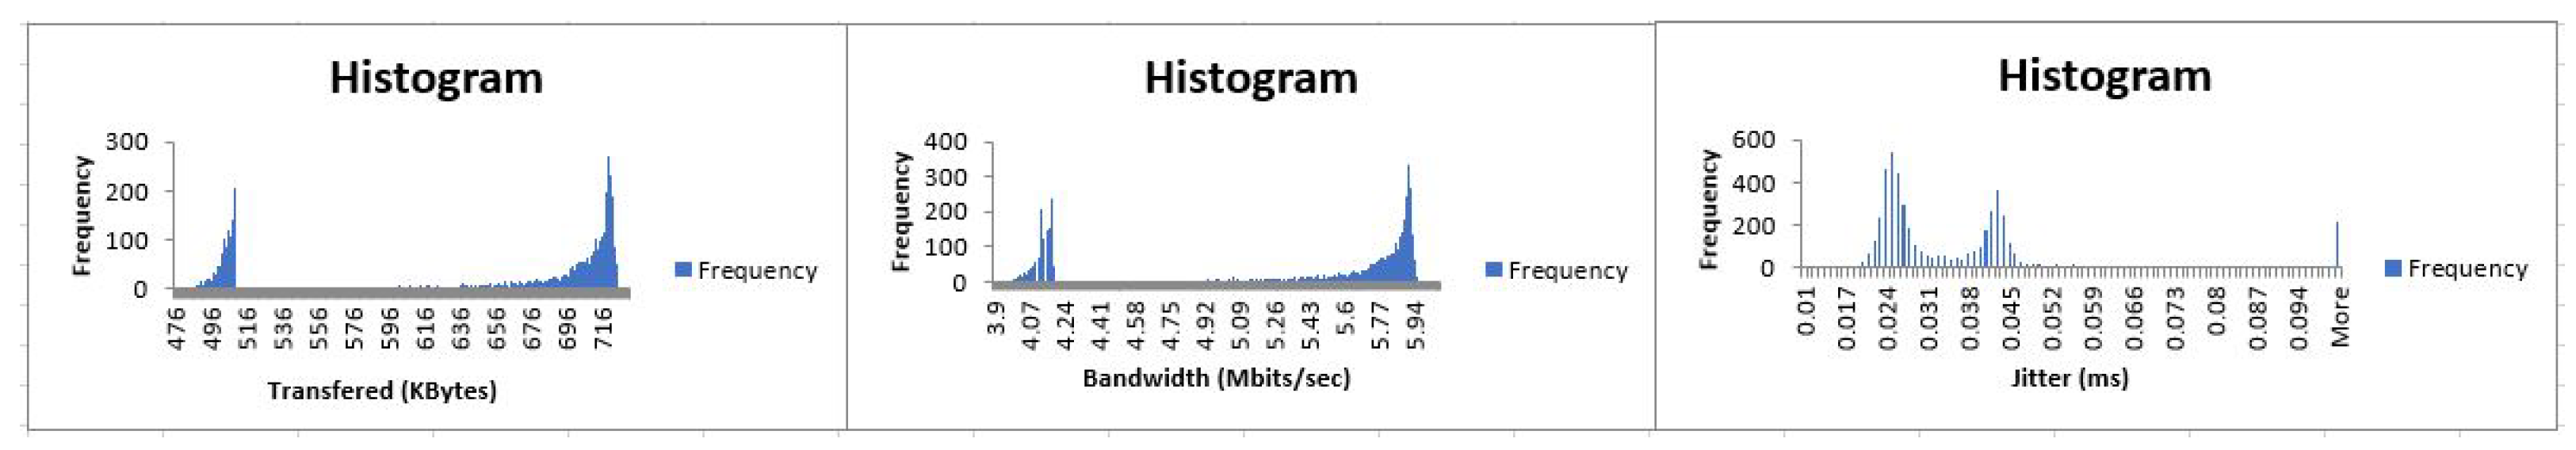
5.2. Case 1—Low Data Packet Load
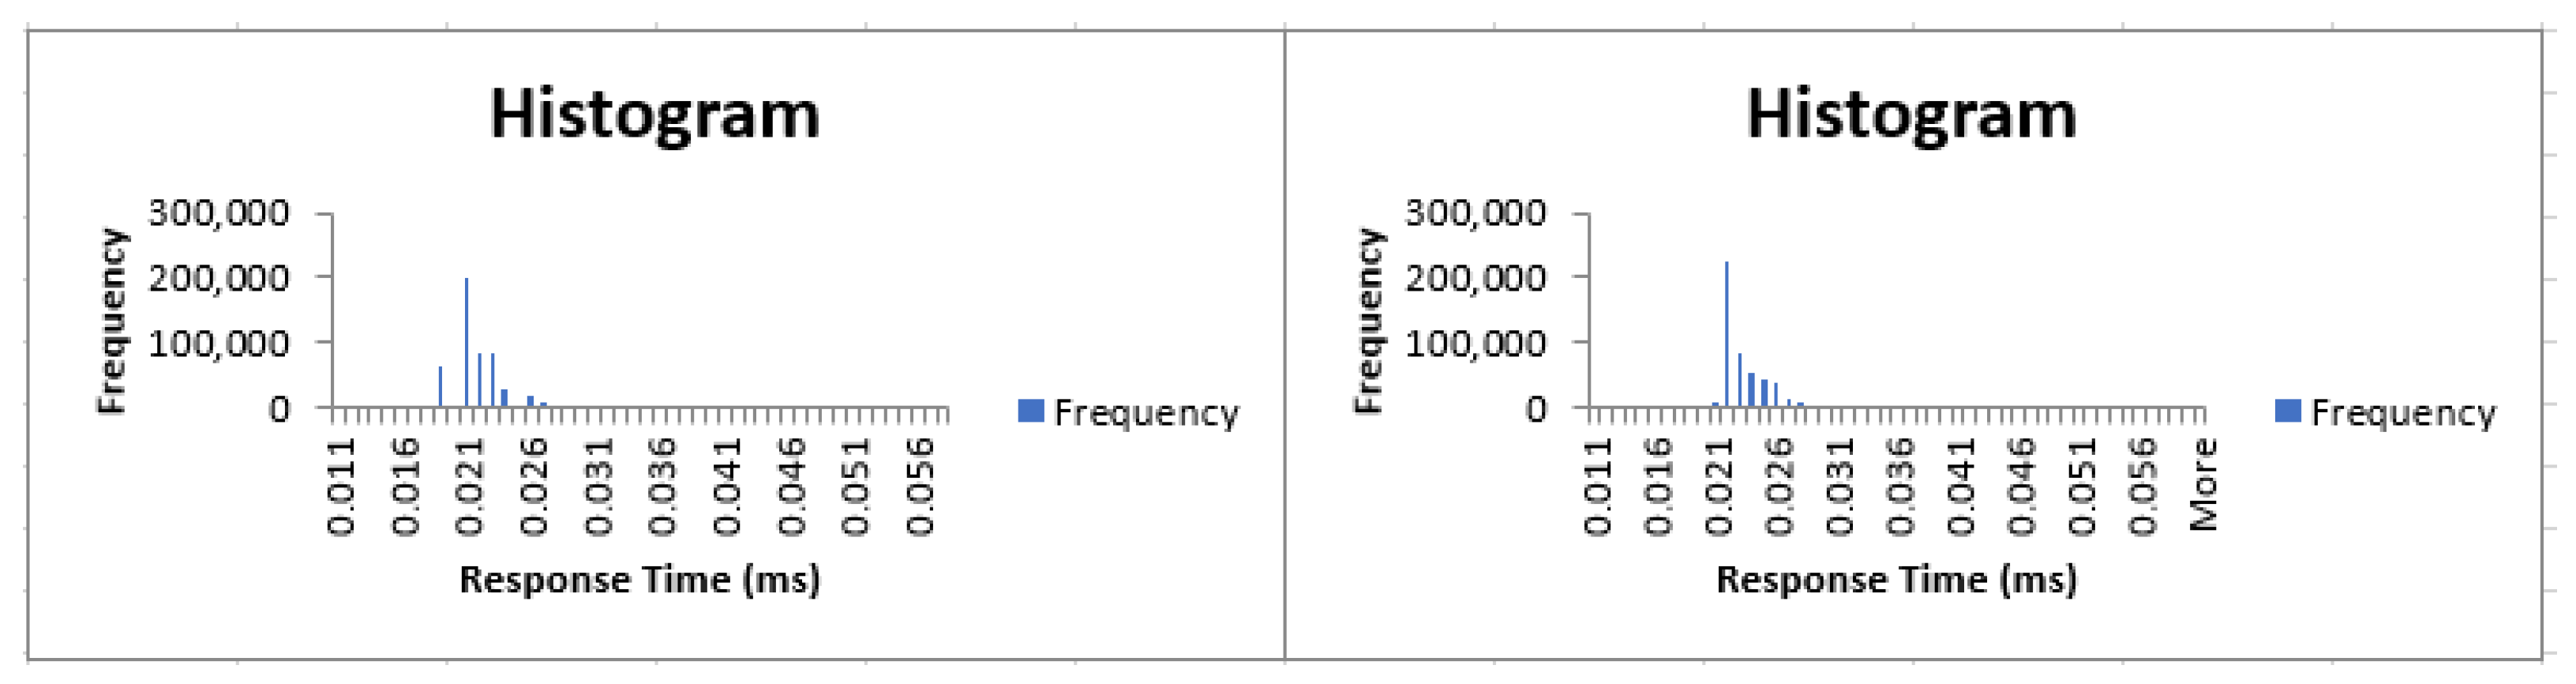
From the histogram results shown in
Figure 5, we observed that all of the packets were able to make it through to the destination with good response times from both sources when low data loads were sent repeatedly, with approximately 50% showing a response time of 0.021 ms and 0.022 ms. This shows that, when data loads are low, we are able to pass these low data loads through the CANBUS data paths to the destination with a good performance.
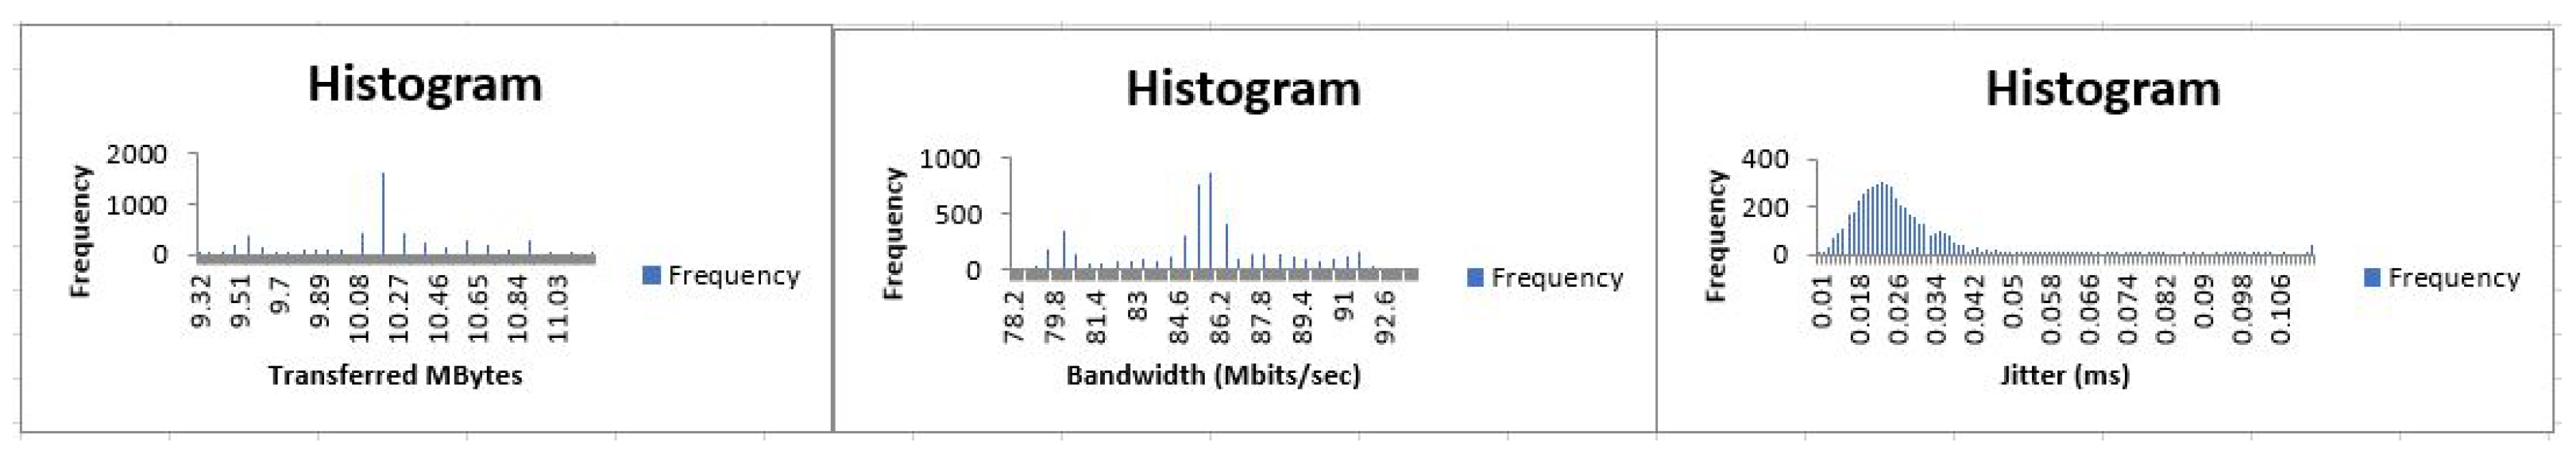
5.3. Case 2—Medium Data Packet Load
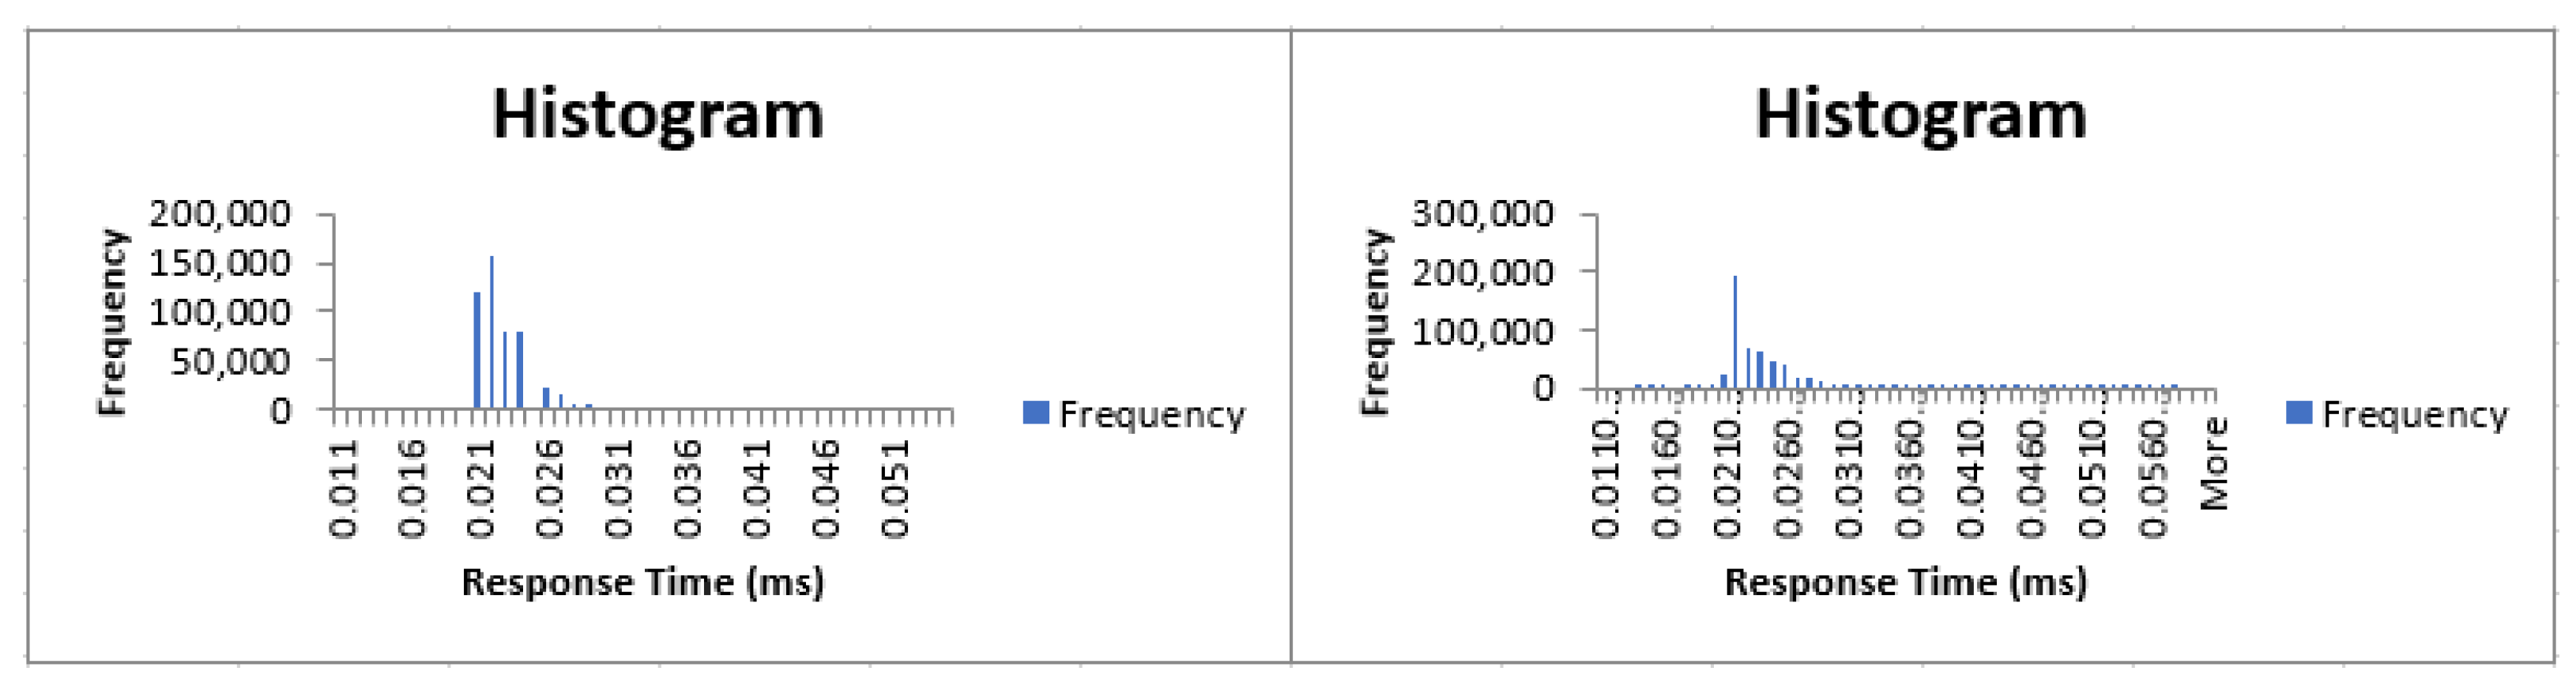
Figure 6 shows a similar traffic pattern as observed in
Figure 6, where all of the data load made it through to the destination. Due to the increase in the data load, we see that a lower percentage of traffic recorded a response time of 0.22 ms. This further confirms that, when data packets loads were slightly increased and sent through the CANBUS, the backward compatible usage of the CANBUS technology creates the need for a hybrid architecture.
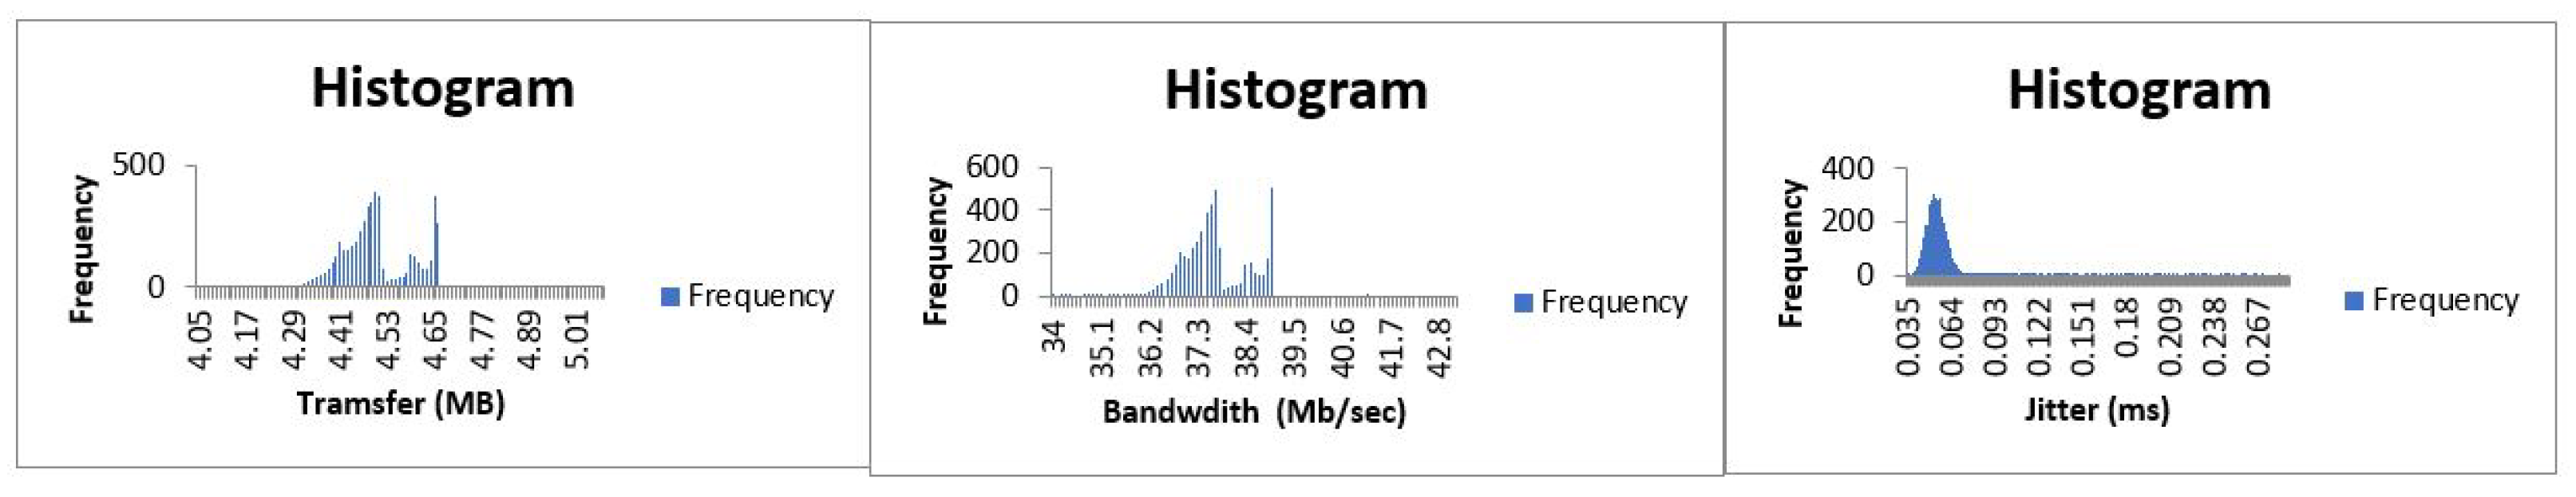
5.4. Case 3—High Data Packet Load
Figure 7 shows that the traffic response time changed again when a high traffic load was sent over the CANBUS data path. This test showed that, when the maximum allowable traffic data load was sent over the CANBUS data path, the response time increased to 0.023 ms, and it jumped to 0.03 ms when the number of times that it was sent was doubled as observed in the histogram. This shows the limitation in the capacity of the CANBUS and opened the door for the inclusion of a faster data communication path that can handle a higher amount of traffic load to minimize the bottleneck.
In summary, the response time used to transmit data increased as the traffic load increased and the response time also increased as the number of times that the data were sent from the source to the destination increased. If the maximum data rate for the CANBUS system is 1 Mb/s, then the degree of the processing delay will increase as the data size and the number of times sent grows. The greater the amount of delay introduced, the greater the tendency for an erroneous or inaccurate result to be recorded. This creates a necessity for a high data rate architecture. This speed limitation is resolved with the introduction of the Ethernet option and virtualization.
5.5. Ethernet Test Results
The second phase of the experimental test is the Ethernet portion of the lab experiment. The same number of nodes was used to represent sensors sending data to node 2. The nodes were all connected to an eight-port 100 Mb/s Ethernet switch. The available bandwidth or data rate can be increased with the usage of higher-speed switches.
The Iperf application created an opportunity to have a more detailed in-depth view of the traffic pattern after reaching the destination, where they were captured in a file with the timestamp of when the traffic was sent and when it arrived.
The data traffic interaction with the Docker application was used to create a virtualized environment that ensured that the data being passed did not leak into a different area by chance. The same parameters used in
Section 5.1 to represent the low, medium, and high data traffic load were used.
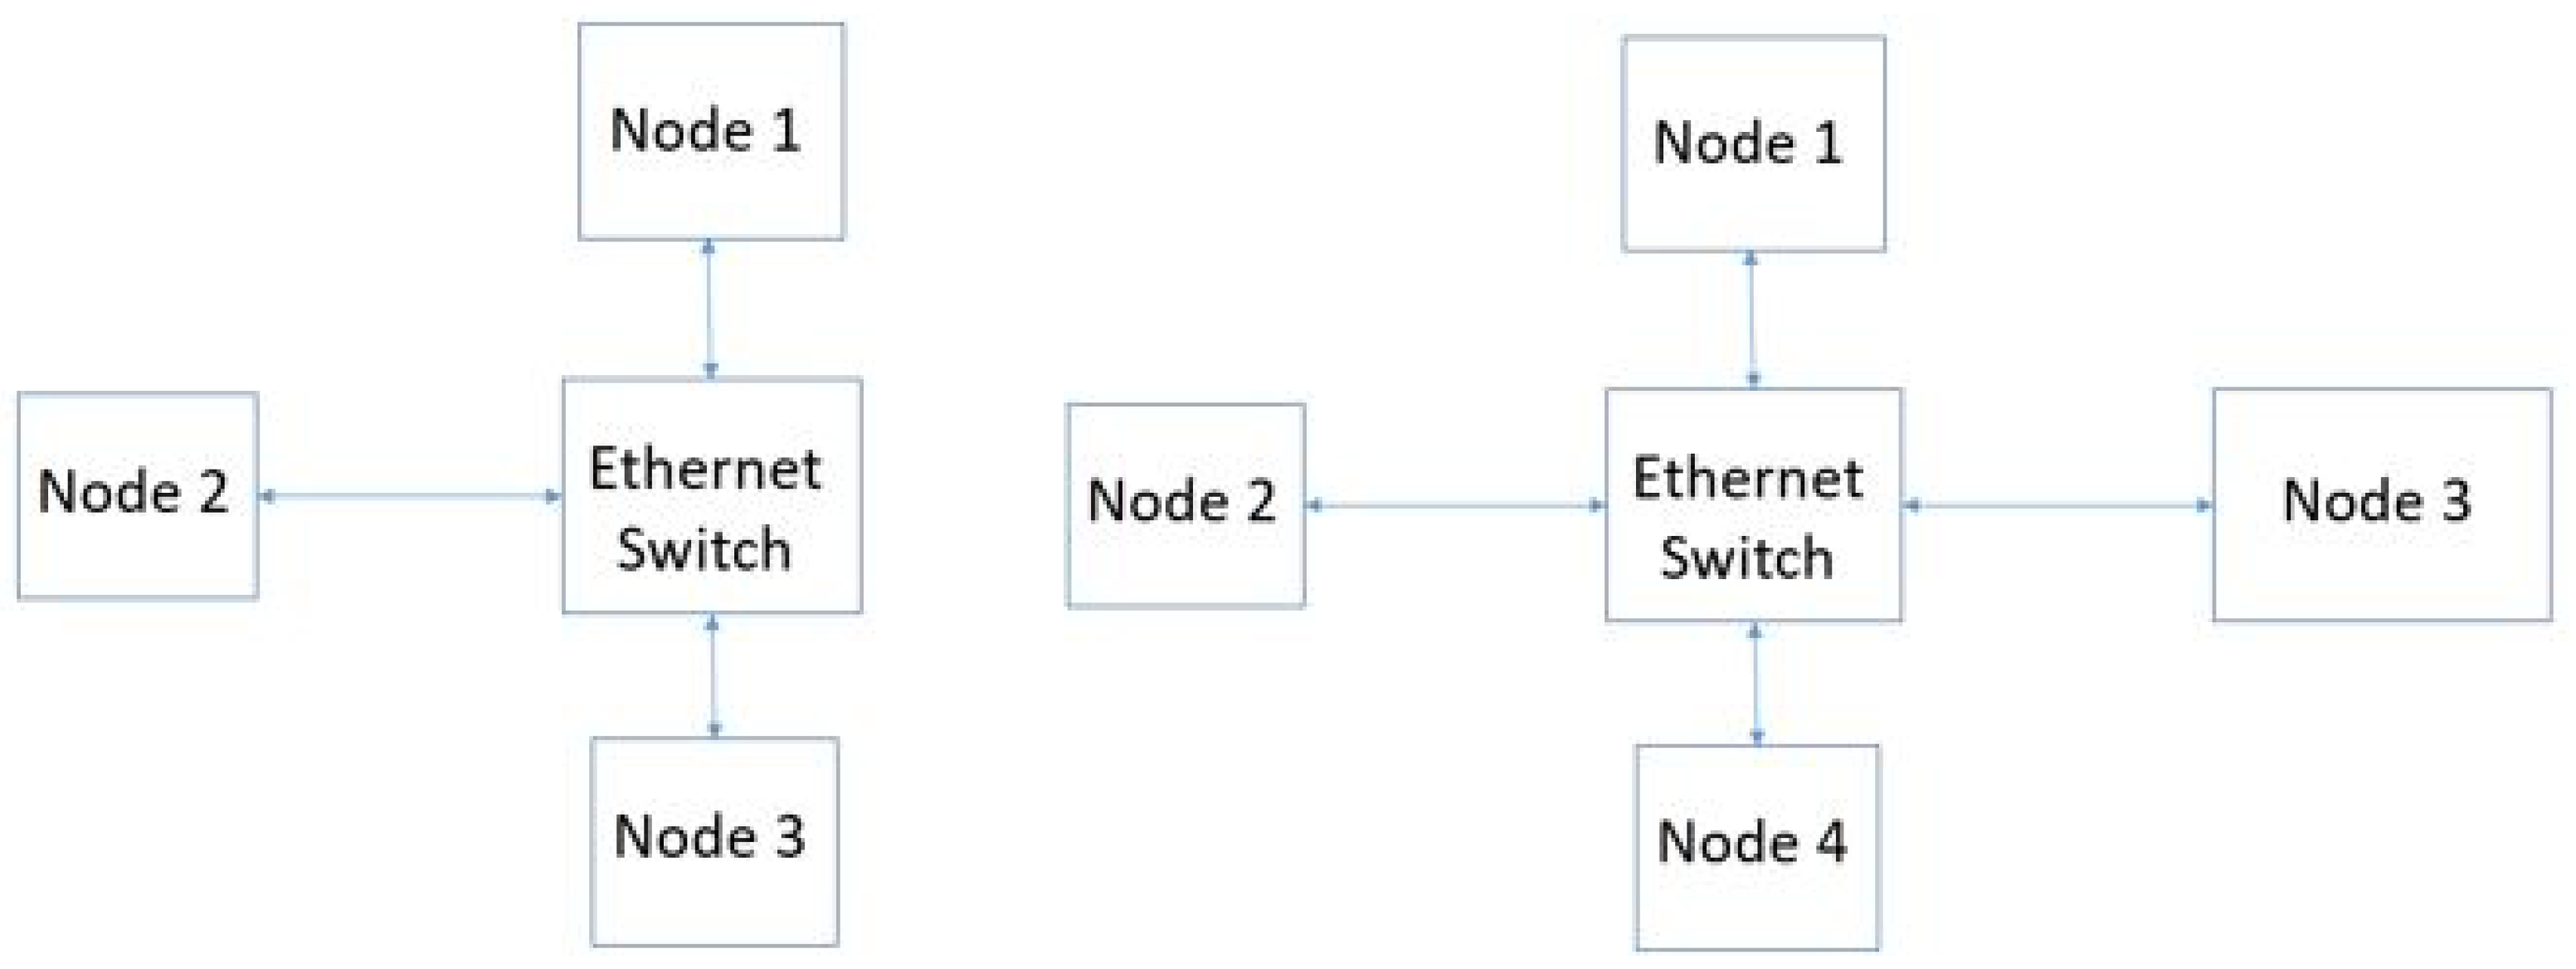
All of the nodes were connected to the intelligent switch. The communication between each node was automatically set up as a mesh connection, where the nodes can talk to each other through the switch.
Figure 8 shows a high-level diagram of the Ethernet logical connection. The number of nodes could be increased to as many as might be needed, as long as the intelligent switch has the capacity to handle the number of ports needed for each node. The network virtualization process allows logical network topology to be set up among a large number of communicating nodes. This greatly reduces the system complexity and ensures proper isolation in the event of the failure of any particular node.
The smart nodes and the traffic analyzers in the proposed solution were installed towards the receiving node operating system, which represents an interface card that is backward compatible with the CANBUS data path. The smart nodes use the Ethernet technology as the primary means of communication for high-bandwidth demand traffic or application due to its capacity.
The lab application used to monitor and record the data traffic allowed us to vary the timing and size of the packets, buffer sizes, and the allocated bandwidth on both the sending and receiving Ethernet ports. This helped the traffic analyzer and the switch controller to work together and make proper decisions on resource allocation on the virtualized platform.
Several variations in data sizes were used to test the performance of the data behavior in three different categories of low, medium, and high data loads. The following sections show the outputs of the results when different data sizes were passed between nodes over the Ethernet data bus.
5.6. Case 1—Low Data Packet Load
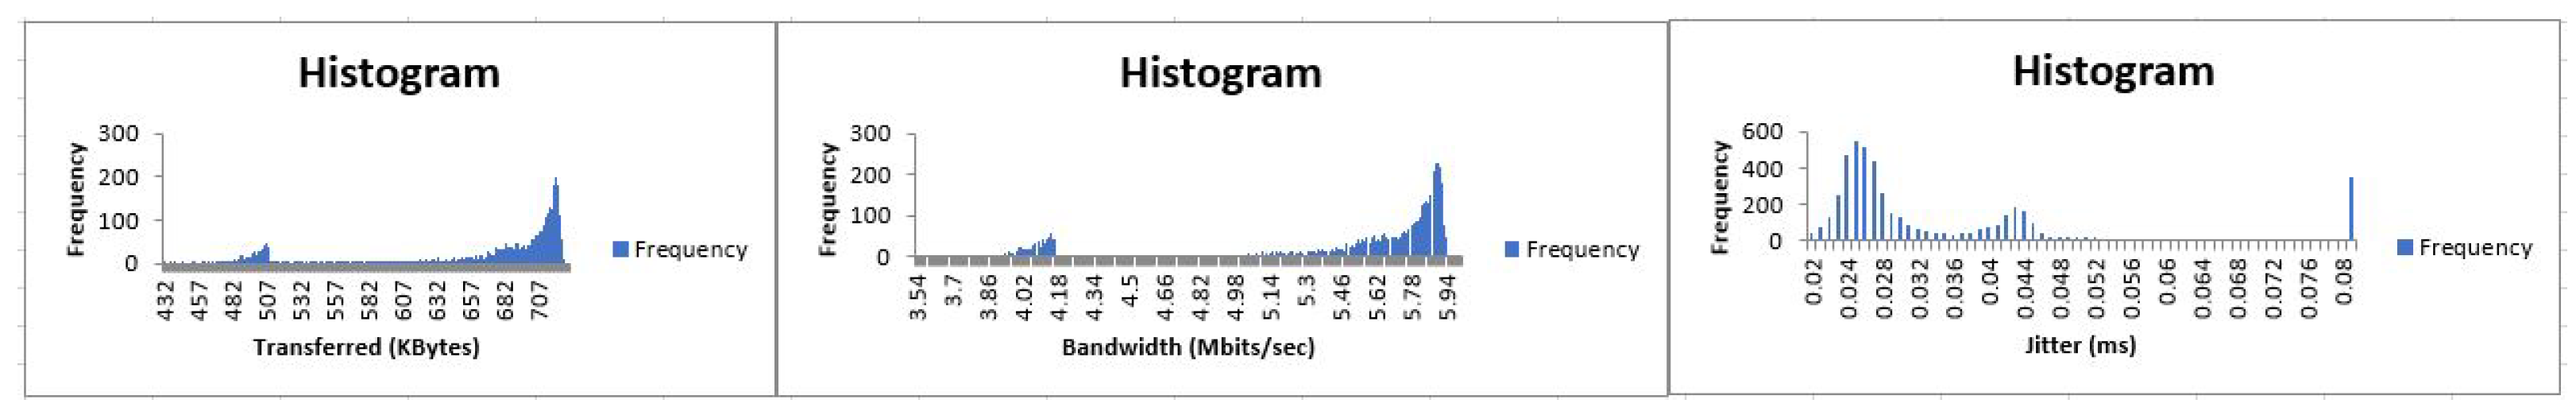
The traffic pattern observed is shown in
Figure 9 and
Figure 10. The traffic patterns observed in
Figure 9 and
Figure 10 gave us a summary of what happened when a low traffic load was passed across a high-capacity data path. This is normally the type of traffic that should be passed through a CANBUS because the load is very low. We observed that, when the low-traffic load was passed through the Ethernet pathway continuously, it used up only approximately 6 Mb/s out of the 100 Mb/s of available bandwidth, which showed that it had the capacity to redirect additional data from the CANBUS when needed. The flexibility of where the traffic can be routed to is one of the added advantages of this proposed solution.
5.7. Case 2—Medium Data Packet Load
The results obtained when the medium packet load was sent at a high repeated frequency from both nodes are shown in
Figure 11 and
Figure 12. As the data bandwidth consumption increased, jitters level remained the same when low data sizes were sent. This will help the traffic analyzer to be aware of the current available bandwidth and continuously route more traffic, ensuring that bottlenecks are avoided. The same data loads were sent from two different nodes and the same behaviors were observed.
5.8. Case 3—High Data Packet Load
In order to understand the response time of the Ethernet when the network operates close to its capacity, we injected traffic close to its total bandwidth. The results shown in
Figure 13 were observed. This implies that in the real life situation, with high data traffic coming from more sensors, the Ethernet technology will still be able to handle more traffic, even when it is at 80% of the network capacity. The traffic analyzer has the ability to observe this and will assign a heavy data payload to this pathway while keeping the CANBUS pathway for low data load traffic.
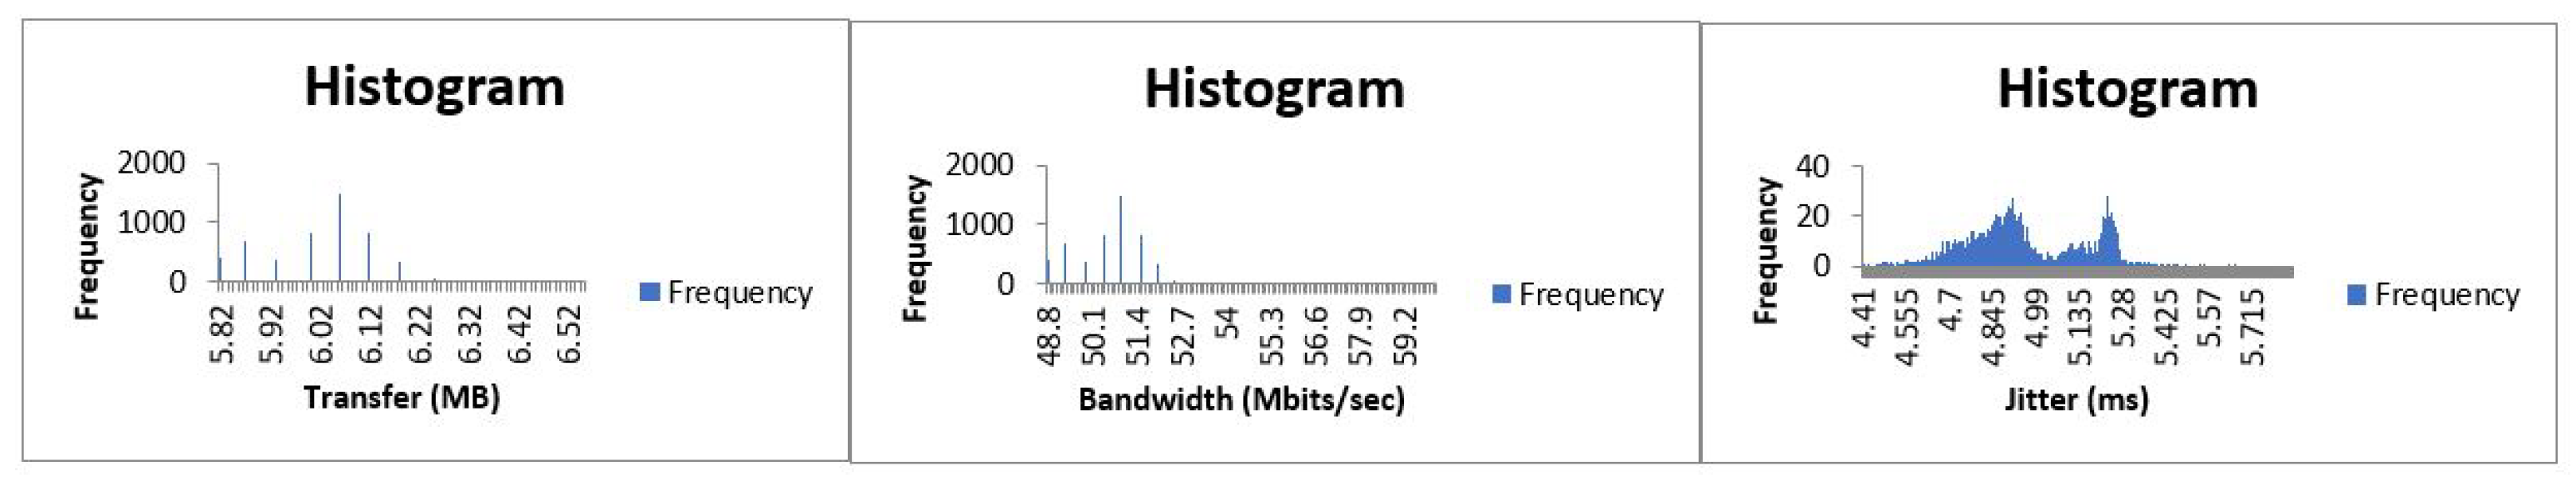
5.9. Case 4—Low Data Load and High Data Load from Different Nodes
Since low-load data likely share the Ethernet data path with high-load data in the architecture, it is important to understand the response times for both types of traffic when they are mixed. When a combination of low-load traffic and overloading traffic was sent from nodes 1 and 3, respectively, to the receiving node with a fixed bandwidth of 100 Mb/s,
Figure 14 and
Figure 15 show that a higher level of jitter from the node that sent overloading size data was observed compared to the node that sent low-load data. This means that low-load data still had a relatively low level of jitter and were not blocked by the presence of overloading data from other sources. The high jitter rate for the overloading data is an indication of what can happen when there is congestion in the data path in real life.
The smart controller and traffic analyzer do not have the capacity to increase the bandwidth of the intelligent switch, but they can either slow down the amount of data being transferred at a particular time over the data paths so as to reduce the loss in data packets or increase the processing power for processes that require it in the virtualized mode based on the amount of jitters observed. We observed a bandwidth utilization of approximately 5.9 Mb/s out of the 100 Mb/s when a low traffic load was sent with negligible jitter. Even when the high data load was sent, which, for the purpose of this experiment, represents a high data traffic load within the scope of the maximum available bandwidth, the jitter level only increased to 5.45 ms with approximately 97% of the total bandwidth utilized. All of this information will be used by the traffic analyzer to route specific data through specific routes.
The key observations is that the Ethernet technology will create more room to add more sensors. This not only indicates that a greater data load can be passed, but also that it can be passed at a minimal data loss, creating more opportunities for more sensors to be added to the architecture. The traffic analyzer will always access the data path usage and availability to determine how to handle extra traffic that might occur due to the increase in the sensor nodes, ensuring bottleneck avoidance.
The two technologies running in dual ports have their advantages. While the CANBUS is sufficient with low-bandwidth data, the Ethernet will create a better performance with high-bandwidth processes. The detailed technology proposed in this solution has access to both technologies in a virtualized environment and creates a solution that will enhance the data traffic performance.
6. Discussion
From the experimental processes and results, we observed that the usage of virtualization brought several advantages, such as isolating the processes from one another in addition to reducing the network provisioning times. Virtualization ensures that components are partitioned into several isolated sections. A fault in one segment or area will not affect the rest of the system or bring the whole system down. In addition, network security can be enhanced in the proposed approach due to the usage of virtualization. This will eventually translate into a reduction in the cost required for software development. If these technicalities are not considered to improve the communication system in a vehicle, the usage of CANBUS might create a bottleneck due to its limitations, which could also cripple the addition of new sensors and limit the data transferred at a given time.
For the industry to benefit from this proposed solution, first, the production of smart nodes needs to be taken into consideration. These are sensors with microprocessors built in to store and pre-process data received before sending them out to any of the data paths. Second, there needs to be an intelligent switch that handles the switching of traffic between the dual-path nodes.
Third, the traffic analyzer checks the data size or data rate and decides which data path is best suited for the onward transmission to the destination. There is a need for advanced load balancing algorithms to route the traffic to the proper data path based on the data load. Fourth, in order to take advantage of the full virtualization concept in the simplest form, we recommend the lightweight SDN virtualization technology for the vehicular environment.
The other industrial consideration for the final product is the backward compatibility with older vehicles using only the CANBUS technology, and the industry will work towards the full incorporation of the Ethernet technology in future vehicles. The transition period will be a hybrid situation that allows for both the Ethernet and the virtualized CANBUS technology to function together.
The intelligent switch mentioned above can easily be fitted into the compartment of a car for the cable connectivity. The proposed solution will enable the car industry to ensure that more sensors can be deployed in the car system and larger data sizes can be processed at faster speeds with minimal data loss at an improved safety rate. Some of the challenges that will be experienced include the integration of both data paths in such a way that each sensor or node has access to both of the paths and data. This includes having multiple interfaces that can connect to both data paths. The cost of eventually changing the CANBUS system to the hybrid solution should be taken into consideration.
7. Conclusions
We identified the possible challenges caused by using the CANBUS system alone as a means of data transportation in smart cars. We explained the advantages that the proposed virtualization solution brings. Furthermore, we showed how the combination of both technologies in a virtualized environment creates a solution that not only resolves the challenges of the CANBUS but also takes advantage of the speed of the Ethernet technology and switching capability, as well as the virtualization, which ensures that a breakdown in any part of the architectures does not bring down the entire system.
We showed in this proposed solution how we can take advantage of both technologies through routing low-load traffic through the CANBUS, along with traditional sensors, while directing a high-bandwidth traffic load through the Ethernet to allow for more sensors to be built into the vehicular system.
There is still much more work that can be carried out with respect to extending the data pathways, not just within the vehicles, but beyond the physical boundaries of the vehicle, such as communicating with external base stations, wireless networks, and even virtualization servers in a data center to retain data for deeper analysis and sharing purposes.


