Article

Estimation of the Energy Consumption of an All-Terrain Mobile Manipulator for Operations in Steep Vineyards

Faculty of Electrical Engineering and Computing, University of Zagreb, Unska 3, 10000 Zagreb, Croatia
*
Author to whom correspondence should be addressed.
Electronics 2022, 11(2), 217; https://doi.org/10.3390/electronics11020217
Submission received: 9 December 2021 / Revised: 3 January 2022 / Accepted: 4 January 2022 / Published: 11 January 2022
(This article belongs to the Special Issue Control of Mobile Robots)

Abstract

:
A heterogeneous robotic system that can perform various tasks in the steep vineyards of the Mediterranean region was developed and tested as part of the HEKTOR—Heterogeneous Autonomous Robotic System in Viticulture and Mariculture—project. This article describes the design of hardware and an easy-to-use method for evaluating the energy consumption of the system, as well as, indirectly, its deployment readiness level. The heterogeneous robotic system itself consisted of a flying robot—a light autonomous aerial robot (LAAR)—and a ground robot—an all-terrain mobile manipulator (ATMM), composed of an all-terrain mobile robot (ATMR) platform and a seven-degree-of-freedom (DoF) torque-controlled robotic arm. A formal approach to describe the topology and parameters of selected vineyards is presented. It is shown how Google Earth data can be used to make an initial estimation of energy consumption for a selected vineyard. On this basis, estimates of energy consumption were made for the tasks of protective spraying and bud rubbing. The experiments were conducted in two different vineyards, one with a moderate slope and the other with a much steeper slope, to evaluate the proposed estimation method.

1. Introduction

The applications of robotics in agriculture are developing dynamically and robots in agriculture represent a significant share in the class of professional service robots [1,2]. In viticulture, the situation is similar. There are more and more robotic solutions for performing specific tasks in the vineyard, of which monitoring and management of the vineyard stand out, for example, in terms of monitoring the health of the plants, vegetation, fruit ripening, quality of irrigation and more. Unmanned aerial vehicles, usually operated by a licensed operator–pilot, are used to monitor the condition of the entire vineyard from the air [3]. Mobile vehicles and farm machinery allow crops to be more accurately monitored in close proximity [4].
The use of robotic systems for the task of protective spraying in agriculture is an increasingly researched topic [5,6,7,8,9]. Oberti et al. detected disease-affected areas on grape leaves in multispectral images and applied the spraying agent to those spots [7,8]. Precise positioning of the spray nozzle was achieved with a custom-built robotic manipulator. In [5], Berenstein et al. present an autonomous ground vehicle designed to treat entire canopies of trees in vineyards. The vehicle was equipped with multiple spray nozzles and a foliage detection algorithm was used to determine which nozzles were active and when. In [6], the performance of an autonomous vineyard spraying system is evaluated on differently positioned spray targets of different sizes. Robotic systems that would perform manipulative tasks such as removing shoots from the vine trunk, i.e., in direct contact with the trunk, are not yet available to farmers. The reasons for this are quite simple and understandable; because, for the deployment readiness level to be satisfactory, the operation of such systems must be autonomous, the system must move by itself around the vineyard, understand the environment in which it is moving and plan and execute an autonomous mission in the vineyard.
The condition of the vineyard changes according to the natural growth cycle of the vines and differs significantly in spring, summer or autumn. Vineyards yield better when they face the sun and the amount of sun each vine receives determines the quality of the grapes, thus the quality of the final product, usually wine. Therefore, vineyards are usually planted on slopes, with a slope of 30% or more being desirable [10]. Particularly noteworthy are the newly planted vineyards in the Mediterranean region, some of which are located on extremely steep terrain and exceed a slope of 60%. A vineyard with a greater slope than 10.5% can be considered steep and labor-intensive, because the machines in the vineyard can only work up to a slope of 10.5% (6 degrees) [10].
The heterogeneous robotic system (Figure 1) being developed as part of the HEKTOR—Heterogeneous Autonomous Robotic System in Viticulture and Mariculture—project consists of a lightweight autonomous unmanned aerial vehicle that performs aerial vineyard observation and 3D mapping and provides the basis for successful navigation and task execution (protective spraying and bud rubbing) of the ground-based all-terrain mobile manipulator (ATMM) (Figure 2) along vineyard rows [11,12]. The ATMM performs selective spraying of vines with protective agents against diseases and pests to optimize spraying and minimize soil contamination in the vineyard. Protective spraying on steep terrain is very hard physical work for a person, where breathing is made difficult by wearing a protective mask and it is easy to trip on uneven terrain. Bud rubbing is a simple, important and very time consuming task. It consists of rubbing the lower part of the vines by hand and removing the shoots and buds that are just beginning to grow. It is also a physically demanding job, even more difficult than spraying because of the need to bend down to carry it out [13,14]. Unnecessary shoots are removed by hand by tapping and pulling out in order to save water and energy needed for quality fruit and vine canopy development. Spraying operations are repeated several times and begin in the spring; bud rubbing is an operation that takes place in the spring when the vine vegetation has begun to develop.
The energy consumption of the mobile robotic system has been studied by several authors, but none of them has addressed missions with manipulation tasks. In [15,16], the authors present a prediction of mission energy for unmanned ground vehicles and its validation. In [17], the authors present the modeling and power measurement of an omnidirectional mobile robot and extend it for slopes in [18]. Performance modeling of a four-wheeled mobile robot is shown in [19]. Performance modeling of a tracked mobile robot on solid terrain is presented in [20].
The authors in the presented related work describe and develop a general vehicle-based model for energy estimation and prediction. However, in this work, the authors focus on energy consumption estimation specifically for vineyards with steep slopes.
The novelty described in the paper is a formal description of a vineyard configuration (layout) extended by a set of parameters related to individual vineyard elements and the vineyard as a whole. Such a description leads to the additional originality of the work, a methodology that allows the energy consumption of the robotic system to be estimated based on this formal description and the input data collected before the pure application of the described robotic system. The main advantage of our approach is that the end user can estimate the duration and energy requirements for robotic operations in the desired vineyard before visiting the vineyard. Additionally, two experiments where the proposed methodology was demonstrated are presented.
The paper is organized as follows: First, the heterogeneous robotic system HEKTOR is described and measures representing the achieved efficiency of the robotic system are defined. Next, features of landscape vineyards are presented, which play a key role in the formal description of their topological parameters. Then, a formal description of a vineyard is presented using an example of a vineyard section intended for testing the robotic system. The methodology for estimating the energy consumption of the robotic system based on the proposed formal description of the vineyard is presented. The experimental validation of the proposed methodology for estimating the energy consumption is presented. The paper concludes with comments on the obtained results and presents ideas for future work.

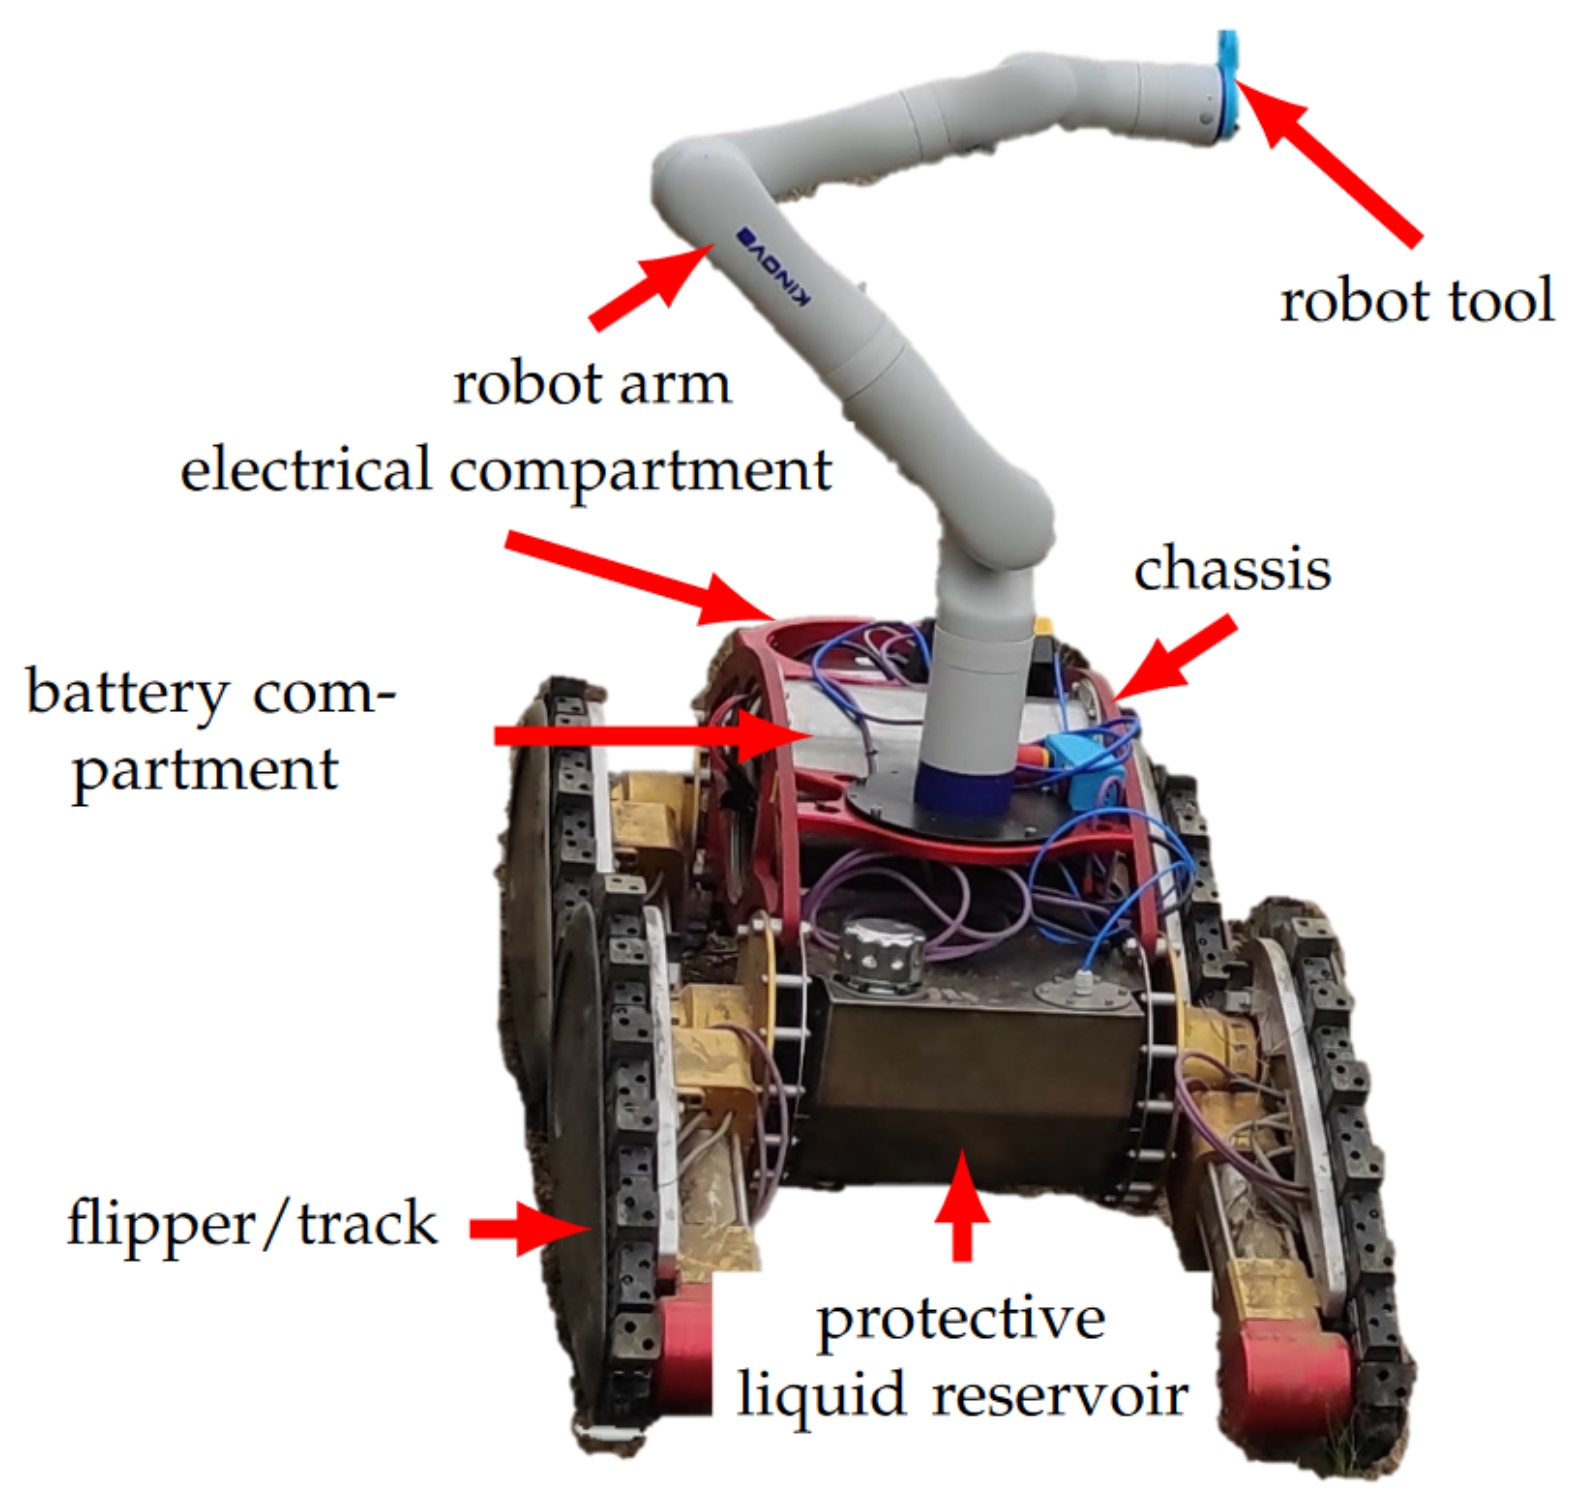
2. Heterogeneous Robotic System HEKTOR

The ATMM shown in Figure 2 had an operational autonomy of more than four hours and a payload capacity of more than 200 kg, with the ability to negotiate difficult sloping terrain. The LAAR had a flight autonomy of 30 min while carrying multiple sensors, such as a multispectral camera, a 4K camera and a light detection and ranging (LIDAR) device. Wireless communication among ATMM, LAAR and ground control was envisioned. A dedicated transmitter was planned in order to establish a functional long-range wireless local area network (WLAN). Since a robot operating system (ROS) is a standard in the robotics community nowadays, a multimaster_fkie was used for communication between different robots [21].

Measures of Robot System Efficiency

Table 1 shows some of the requirements of the HEKTOR project that ATMM and LAAR must meet in order to ensure safe robotic movements in rough terrain and to safely perform various tasks under rather adverse operating conditions in very steep and rough terrain. A major reason for using tracks instead of wheels was to operate on slopes up to 60%. Other design goals were easy maintenance, low energy consumption, multifunctionality and flexible expandability of the robot.
Under normal circumstances, the introduction of a HEKTOR system in terms of efficiency would aim for the system to perform at least as well as or better than a human worker. Where the efficiency of a robotic system is worse than that of a human, the robotic system must have an advantage in the endurance of the task or the better quality of the work performed. This is not easy to achieve, of course; the goal of developing a heterogeneous robotic system is to bring its efficiency as close as possible to the desired level.
Table 1 shows that most of the requirements imposed on ATMMs are quantified and, consequently, efficiency can be more easily measured and evaluated. The most important is certainly the evaluation that indicates how fast and well the robotic system can perform the tasks and with what quality the tasks are performed.
The following questions may be asked for a particular vineyard:
(a)
Spraying:
-
How many vines can be sprayed in a robotic operation before a new tank must be filled with protective liquid?
-
How many vines can be sprayed in a robot deployment before a new battery charge is required?
-
What is the saving in protective liquid when the selective spraying is performed versus uniform?
-
What is the ratio of the effect of the robotic system compared to humans?
-
How much does the slope of the terrain affect the total number of vines sprayed and battery consumption?
(b)
Bud rubbing:
-
What is the average time required per vine to perform the task and how does it relate to human time requirements?
-
How many vines can be processed before the next battery charge?
-
How does the slope of the terrain affect the number of vines worked and battery consumption?
The most important thing for the end user of robotic technology is how fast the robot performs the selected tasks and the quality and cost of that work in terms of energy consumption, safety and required logistical support. Vineyards are usually located outside urban areas (Figure 3), so battery life is of utmost importance.

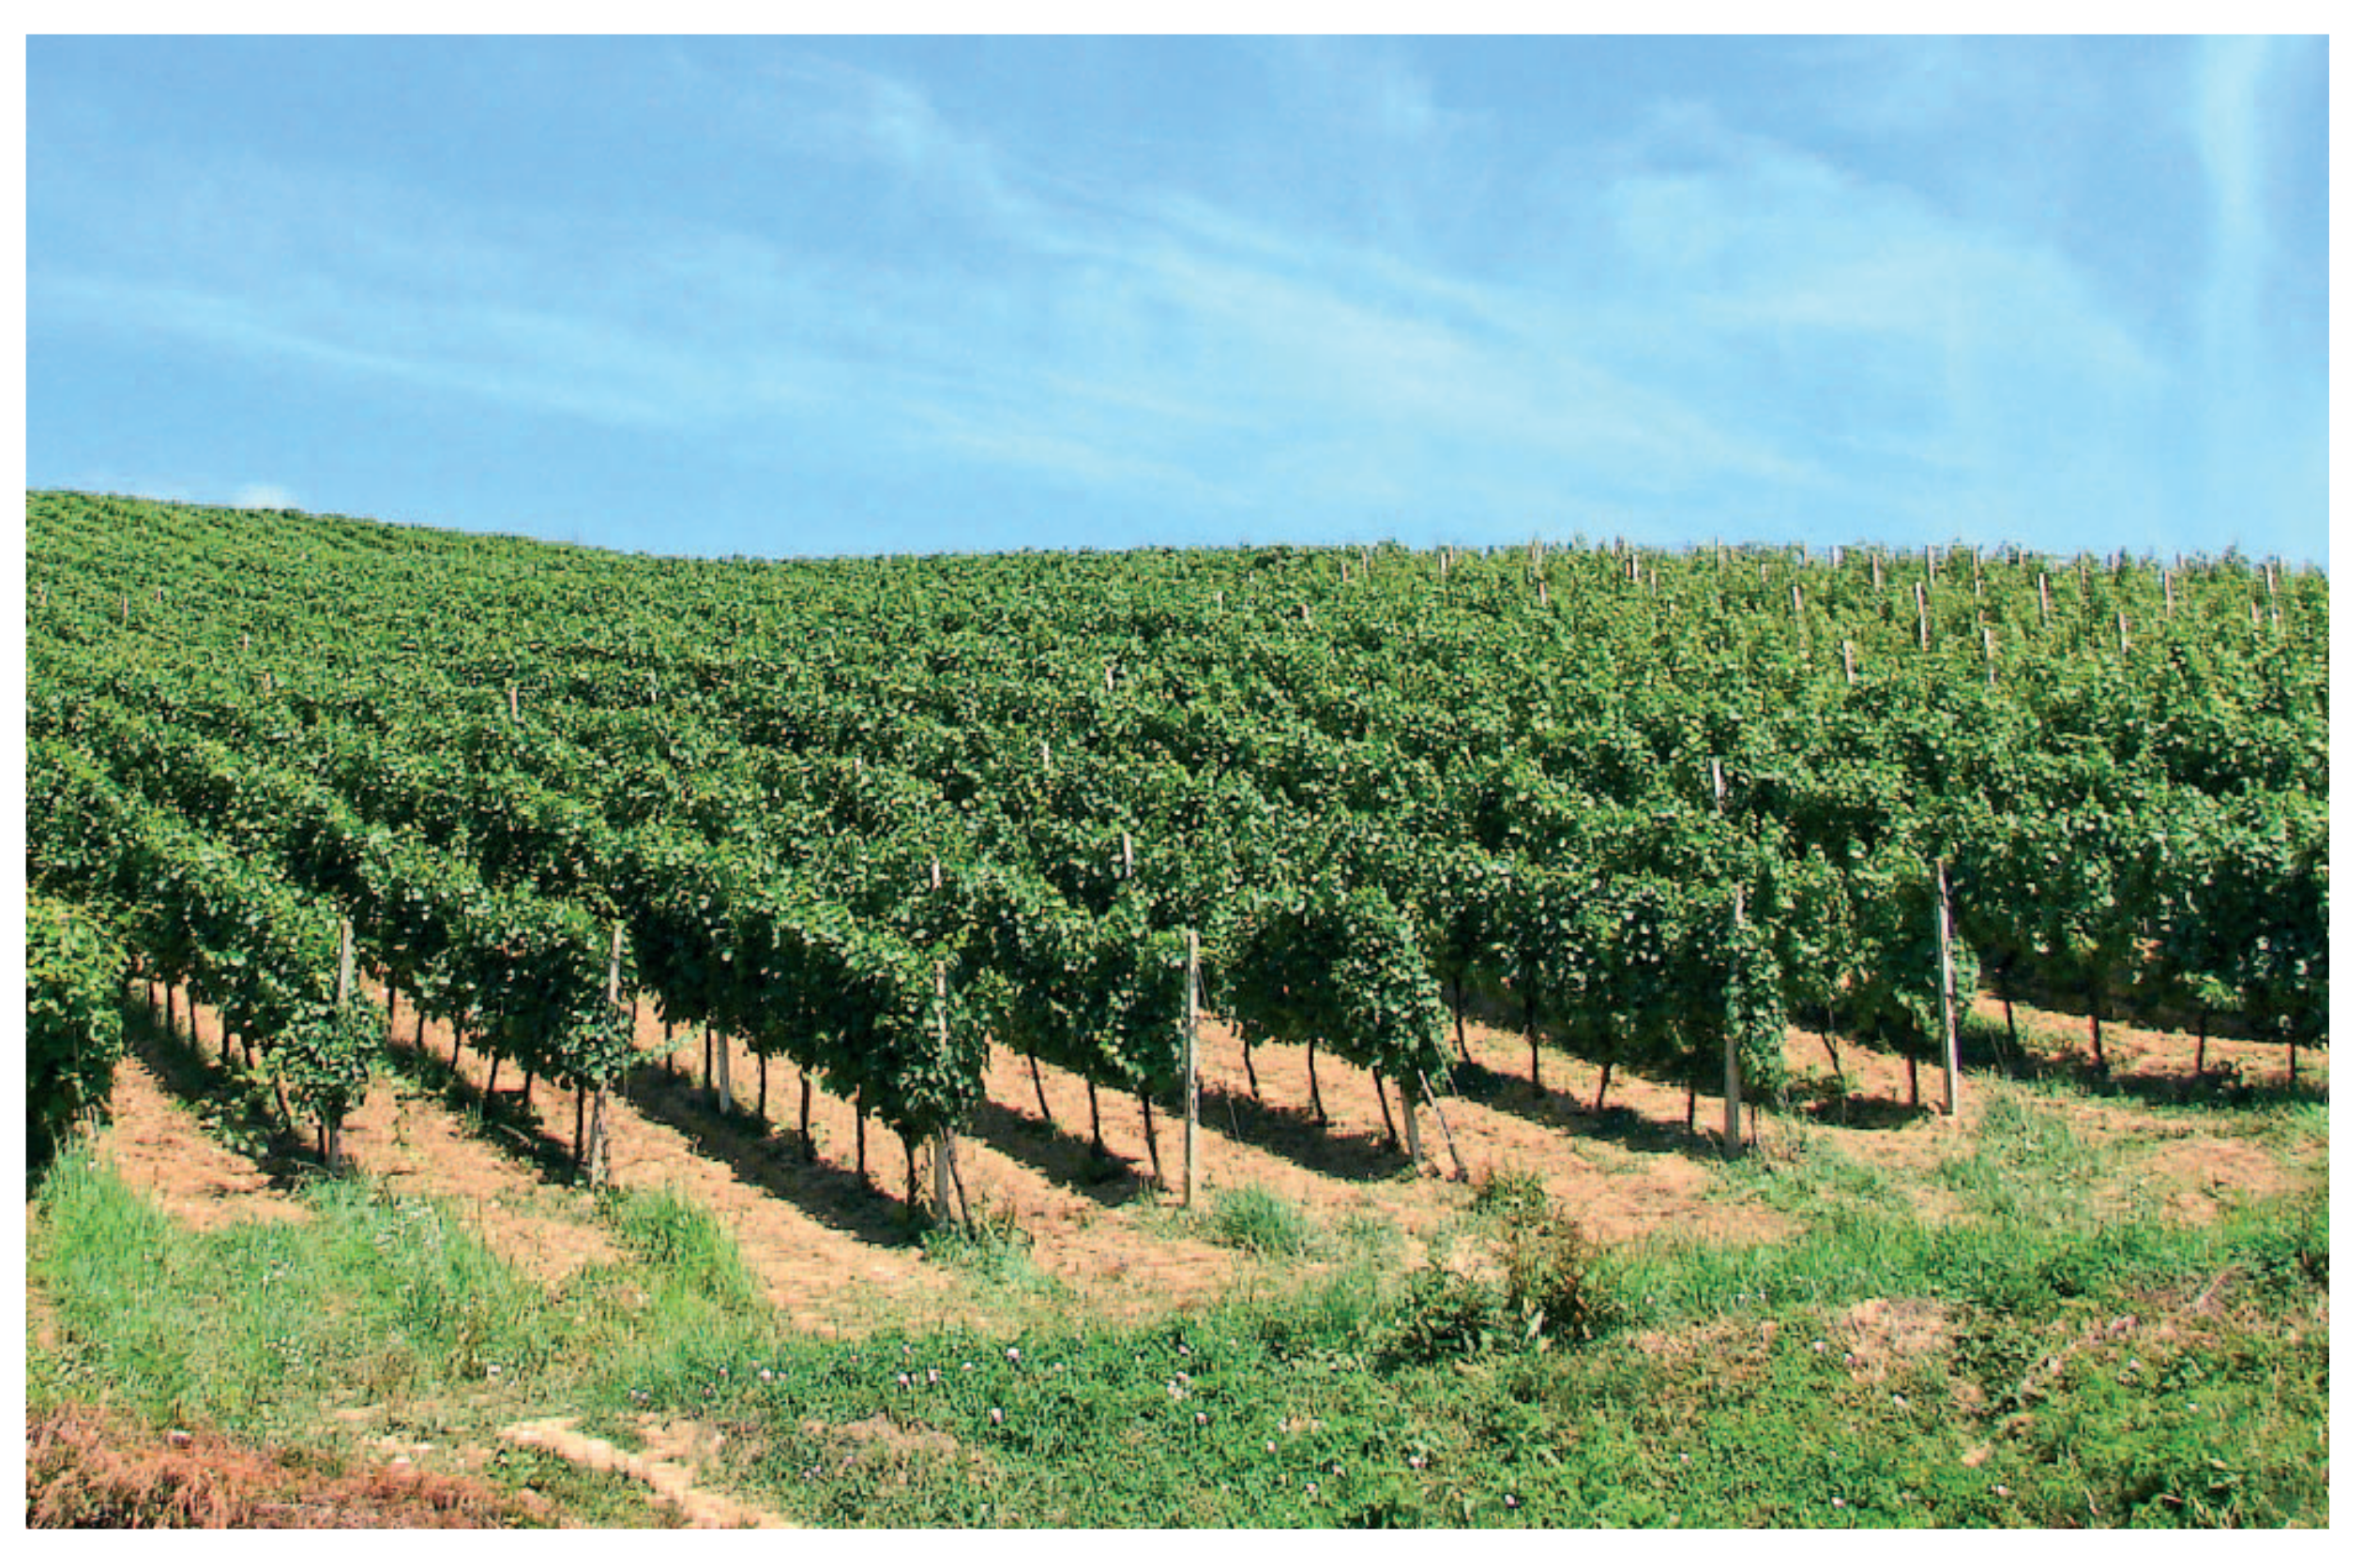
3. Features of Landscaped Vineyards

In general, all cultivated vineyards are topologically very similar and can be formally described in such a way that their description is completely unambiguous. The creation of a new vineyard requires that the general rules governing are followed [10]:
  • Selection of a favorable geographical location;
  • Planting of the vines is regularly organized in rows;
  • Where the nature of the terrain allows it, the vines are planted in a row at regular intervals;
  • The rows of vines are planted at intervals that allow good sunlight to reach the vines and easy access to each vine when work needs to be performed in the vineyard;
  • In a landscaped vineyard, the greatest possible morphological uniformity of individual vines is established in terms of plant height and width (Figure 4);
  • In modern vineyards, concrete columns and wire joints and supports are used to shape the crowns of vines (Figure 5).
In other words, the topology of the vineyard is adapted to the terrain on which it is located. Most often, the rows are oriented so that they run in the direction of the slope of the terrain, but there are also those whose rows are oriented perpendicularly to the slope. At the same time, the slopes of the terrain can be very different, from flat to extremely steep.
Next comes a formal description of the topology of the vineyard and the definition of all the important parameters of the vineyard, on the basis of which formal answers to the above questions can be sought.

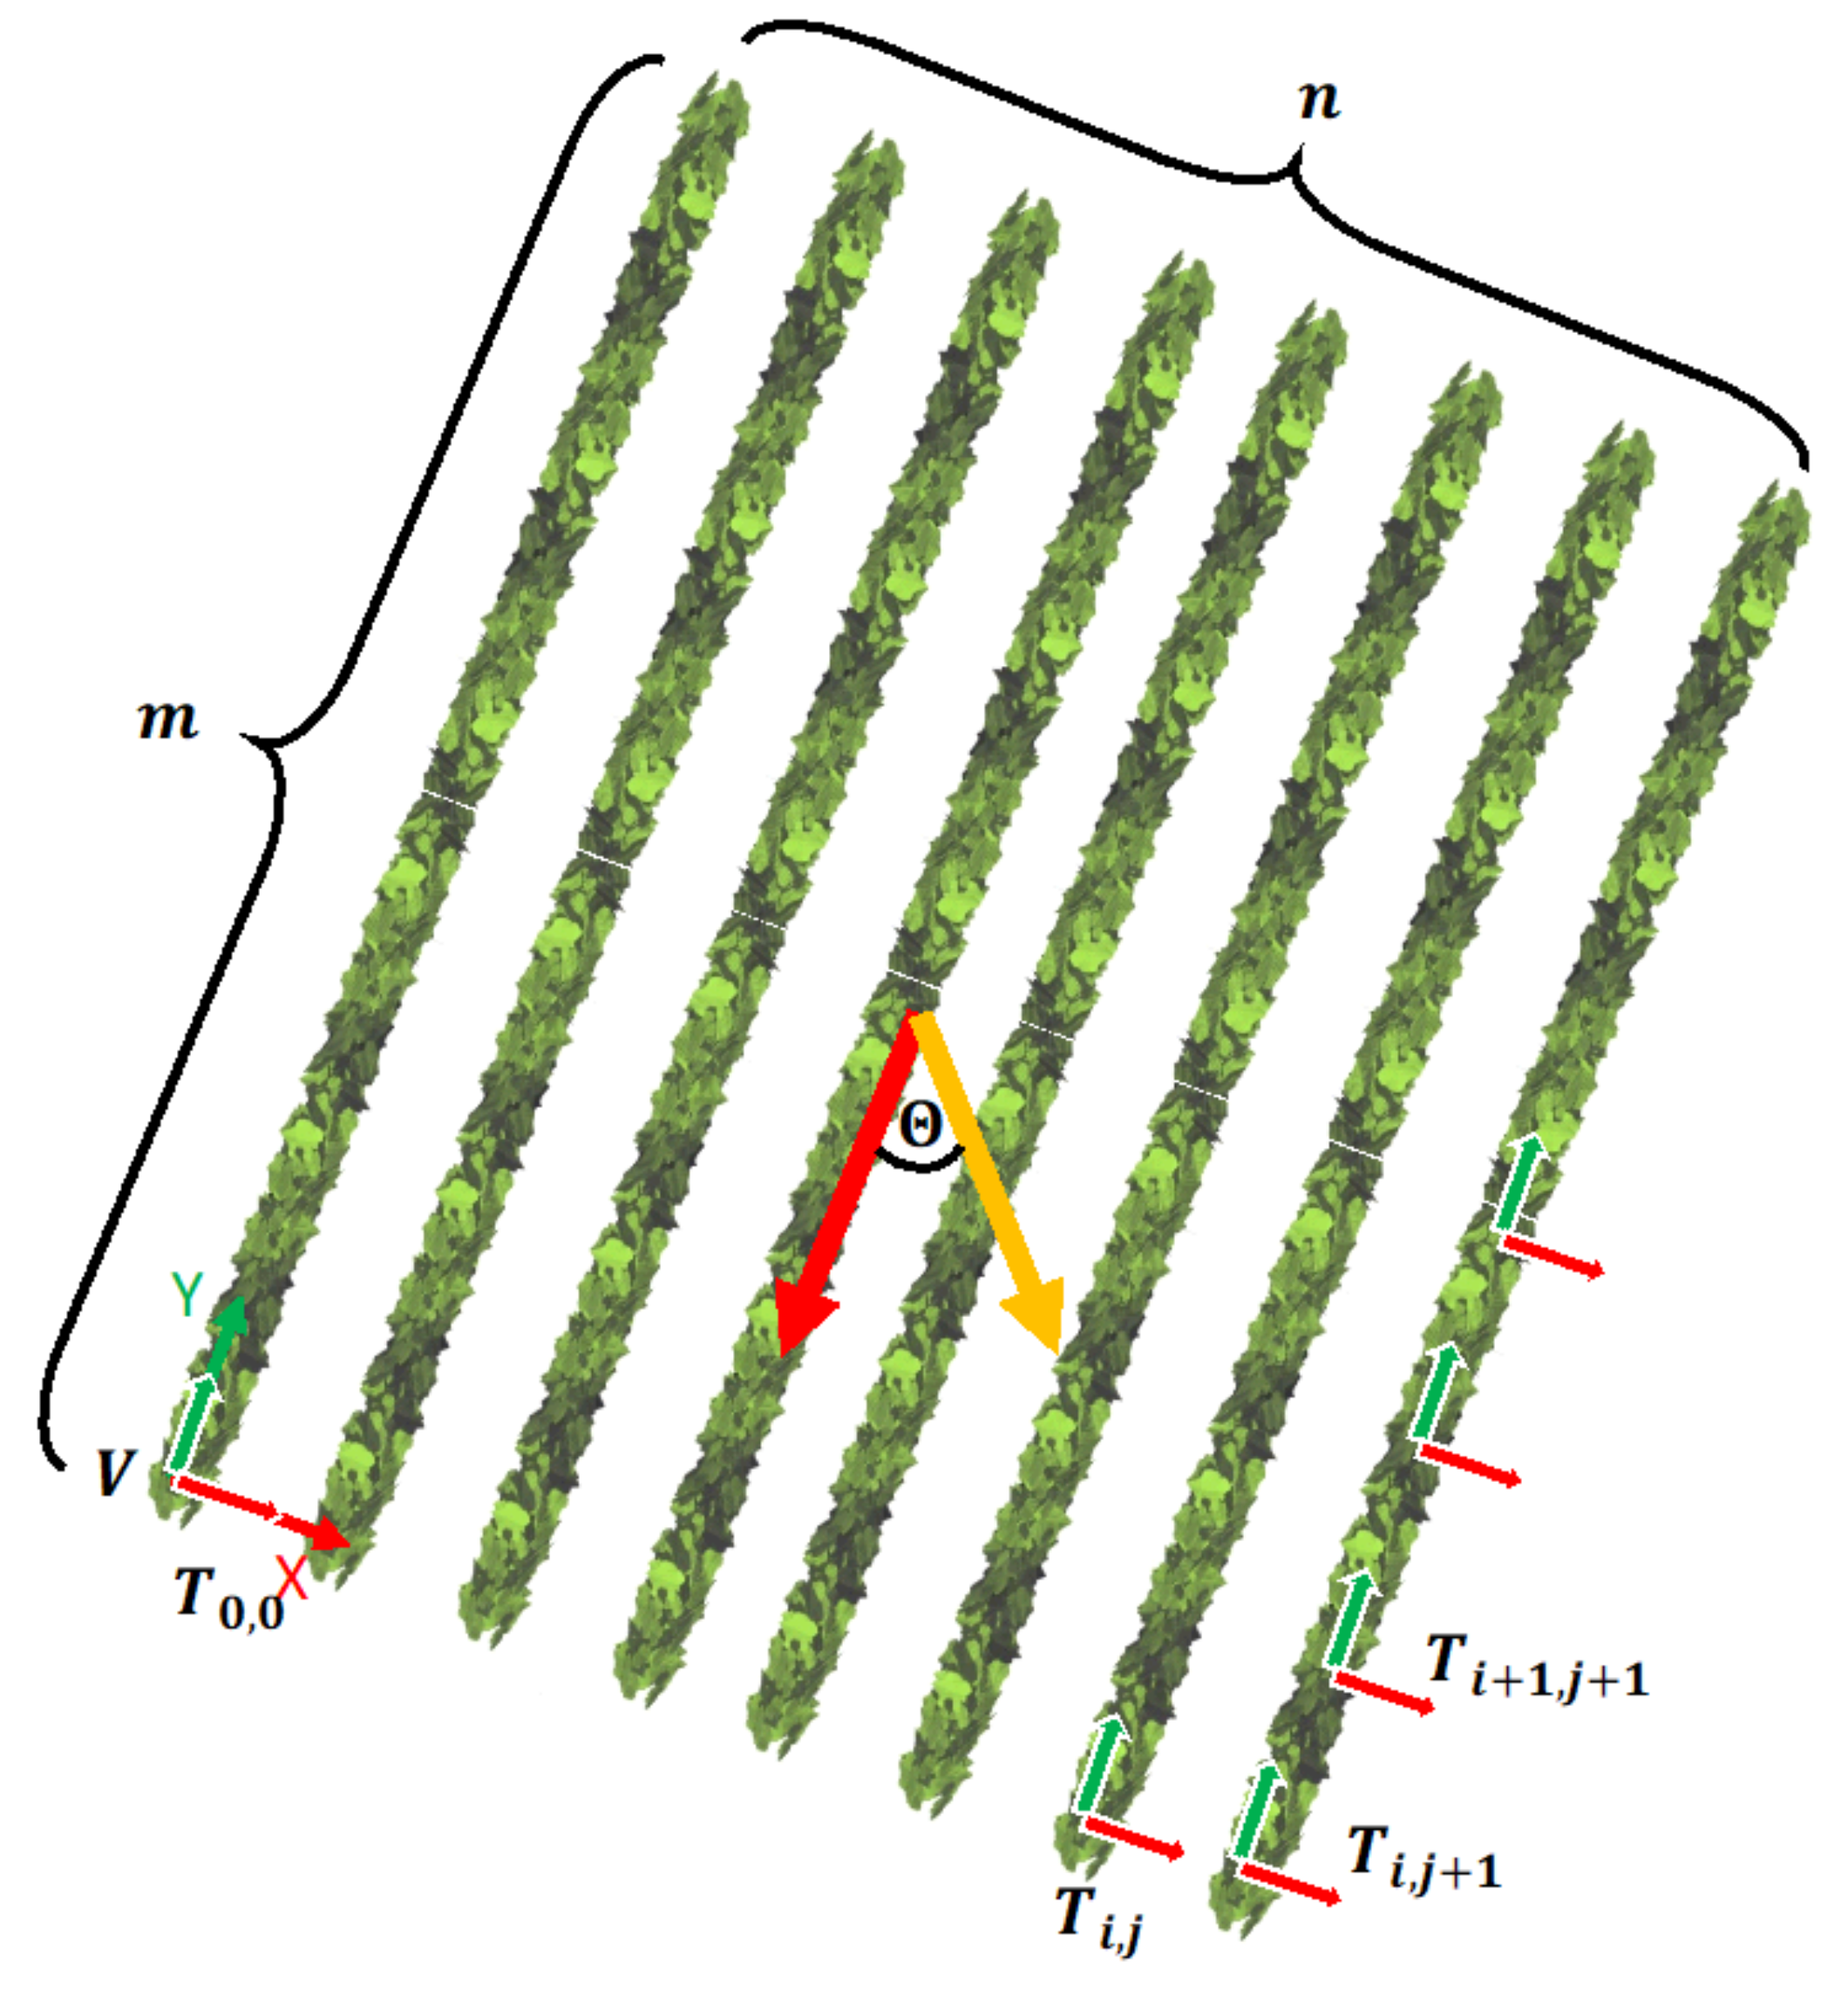
Formal Description of Vineyard

Looking at the structure of a vineyard shown in Figure 3, one notices that it is made up of separate parts with clearly visible boundaries. The most common reason of such vineyard layout is the terrain configuration and unimpeded access for cultivation workers.
Let us choose a pentagonal section of the Jazbina vineyard located at the edge of a forest (see Figure 6a), as an illustrative example to demonstrate a proposed formal modeling approach for vineyards. The map of this vineyard section displayed in Google Maps provides information about the respective total area and perimeter of the pentagon as follows: A J = 2206.70   m 2 , P J = 190.46 m. Let us denote, by V, this single, well-defined vineyard segment. All created vineyards have a certain number of rows r i , i [ 1 , n ] , each containing a certain number of vines v i , j , i [ 1 , n ] , j [ 1 , m i ] , all planted within the boundaries of the vineyard. Each row r i has length l i . All vines v i , j in row r i have their trunks at some fixed topological coordinates T i , j = ( x i , j , y i , j , z i , j ) , i [ 1 , n ] , j [ 1 , m i ] . From the above, one can conclude that the vineyard is a semi-structured environment, which can be represented in the form of a matrix.
Such a matrix is complete if and only if all the rows have the same number of vines, which is the case for the environment shown in Figure 7. On the other hand, it is not the case for the layout shown in Figure 6a. One can clearly see that the rows in this layout have different lengths. In the case of a row with a different number of vines, the vineyard is modeled in a similar way. The longest row indicates the dimension of the matrix used to describe the vineyard. The remaining “unused” positions in the matrix are filled with zeros.
Let us denote the corridor between the two vine rows r i and r i + 1 by c i , i [ 1 , n 1 ] . In the created vineyards, the width of the corridor, denoted here as parameter w i , tends to be constant. The distance d i , j between the two adjacent vines v i , j and v i , j + 1 , which are in the same row r i , also tends to be constant in most cases. This can be disrupted by removing one of the diseased vines, but this does not change the essence of things.
Let us denote the slope of the terrain with an angle β . Depending on the slope variations, the parameter β also changes. Normally, vineyard rows are oriented either in the direction of the sloping terrain or perpendicular to it, but exceptions to this rule are not uncommon. Let us denote this angular deviation by θ (see Figure 7). In the case of parallel rows, θ represents a common parameter. If the two angles β and θ are known, it is possible to determine the slope of the terrain in the direction of the vine rows (see Figure 8).
α = arctan tan β tan θ
In the special case, when the vine rows are aligned along the slope direction, θ = 0 , the slope of the vine rows is equal to the slope angle, i.e., α = β .
The information needed for precise positioning of an autonomous robot when performing a task on a particular vine v i , j in a particular row r i is the location of the vine trunk T i , j and the slope angle in this row α i . To successfully perform the bud rubbing task, the mobile robot manipulator must be positioned next to the vine trunk so that the base of the robot arm is as close as possible to the vine trunk, but does not exceed the minimum safety distance d s .
For rubbing the buds, each trunk of the vine can be accessed from either of the two surrounding rows. Depending on the direction of inclination, a more favorable position can be selected. If the direction of the slope is not in the direction of the rows, the base of the manipulator is closer to the trunk if the vine is approached from the “upper” row.
When it comes to navigating an autonomous mobile robot along corridors and performing the tasks assigned to it, the prerequisites for precise positioning and execution are knowing the exact position of the vine trunk T i , j and the row slope angle α . As shown in Figure fig:vinelevat, the parameters h U and h L indicate the height from the base of the vine trunk to the top and bottom boundaries of the vegetation wall, respectively. The parameter L i , j describes the global positioning system (GPS)-based distance between the two adjacent vines, while the parameter V i , j 1 describes how far the vegetation of vine v i , j is from vine v i , j 1 .

4. Estimation of Robot System Energy Consumption

One purpose of estimating energy consumption is to determine the time and energy required for the robot to complete its tasks. Such estimation of energy consumption is of great importance for the practical implementation. One could simply input the parameters of the vineyard and calculate the estimated energy consumption, then let the robot perform the work until the battery needs to be recharged or replaced. The energy consumption estimation presented assumes that the robot has enough power to traverse all the slopes of a vineyard. The input values for the key variables and parameters used to estimate the robot system energy consumption can be found in Table 2. It is assumed that any supplier of robotic systems for viticulture can provide these data or that they can be determined experimentally. In ATMM, the instantaneous power consumption was taken from the data sheets of the devices used. P c includes the idle power consumption of the computer, two DC/DC converters and four EPOS 70/10 drives. The values of P c were verified by ATMM during the field test. P v m b and P a r m were experimentally determined by ATMM during a field test on a typical grass field.

4.1. Mission Energy Estimation

The energy consumed by the robotic system during each mission can be defined by
E = P ( t ) d t
where E is the total energy consumed and P ( t ) is the instantaneous power consumed by the robotic system at time t.
The power can be further divided among the different components as follows:
P ( t ) = P c + P m b + P a r m
where P c is the idle power consumed when the robot system is not moving, which includes the consumption of the central computer, sensors, communication system and motor drives in standby mode; and P m b and P a r m are the power consumed during motion of the mobile base and the robot arm, respectively.
The accurate power estimation of the motion of the mobile base P m b would require the knowledge of a large number of parameters of the drive system. They may include the terrain roughness, soil humidity, grass coverage etc. In the simplest case, one can take into account only two main parameters.
P m b = P m b f l a t + P m b s l o p e
where P m b f l a t is the power consumed by driving on the flat surface and P m b s l o p e is the additional power component caused by driving on the slope.
We can simplify the power P m b f l a t consumed by driving on the flat surface as follows:
P m b f l a t = { P v m b , for driving with speed v m b P t u r n , for turning in place
where P v m b is the power consumed during driving on the flat surface at constant speed v m b and P t u r n is average power consumed while turning in place.
The simplification (4) is justified by the assumption that the travel speed v m b and the acceleration of the mobile base a m b are constant. For navigation up the slope angle α , the additional power P m b s l o p e is given by
P m b s l o p e = v m b m g sin α
Therefore, the total power consumed by driving on the slope is
P m b = P m b f l a t + v m b m g sin α
It is difficult to determine the power consumed by a robot arm without knowing the exact trajectory. However, it can be assumed that the average power does not change dramatically during robot arm operation. Furthermore, it is assumed that the robot arm consumption is constant during the motion.
P a r m = P a r m a v g
where P a r m a v g stands for the average power consumed while the arm is moving.

4.2. Spraying

The robotic spraying of the vineyard consists of two activities that are repeated for each row, spraying through the row and changing the rows without spraying. Assuming a constant velocity during vineyard spraying, the energy required to spray between two adjacent vines in the same row at locations T i , j ( x i , j , y i , j , z i , j ) and T i , k ( x i , k , y i , k , z i , k ) is
E s i , j , k = ( P c + P a r m + P v m b + v m b m g sin α i , j , i , k ) d i , j , i , k v m b
where E s i , j , k is the energy required to spray between trunk T i , j and T i , k in row r i at constant velocity; d i , j , p , r is the distance between two trunks T i , j and T p , r , i.e.,
d i , j , p , r = ( x i , j x p , r ) 2 + ( y i , j y p , r ) 2 + ( z i , j z p , r ) 2
and α i , j , p , r is the slope from the trunk T i , j to the trunk T p , r , calculated by
α i , j , p , r = arcsin z p , r z i , j d i , j , p , r
When the robot comes from position T i , k to the end of the row at position T i , m i and wants to move in the new row from the trunk T i + 1 , m i + 1 to the trunk T i + 1 , r , it must perform the following actions: decelerate, make a turn, accelerate, travel the distance between two end points in the rows, decelerate and then turn again and accelerate again. If the periods of acceleration and deceleration are ignored, due to their short duration in relation to the driving and spraying itself, then the energy required for this maneuver is
E r i , i + 1 = E t u r n + E v m b + E t u r n
where
E t u r n = ( P c + P t u r n ) t t u r n E v m b = ( P c + P v m b + v m b m g sin α i , m i , i + 1 , m i + 1 ) t v m b t v m b = d i , m i , i + 1 , m i + 1 v m b

4.3. Bud Rubbing

For bud rubbing, the robot must drive to the trunk of the vine, then stop, use the arm to rub the buds and then drive back to the next trunk of the vine. If the periods of acceleration and deceleration are ignored again, the energy needed to travel between two trunks and complete the bud rubbing operation is
E b i , j , k = E v m b + E b r
where E v m b is as defined in (13) and E b r is the energy consumed during bud rubbing,
E b r = ( P c + P a r m ) t b r
The energy consumption for changing the rows for bud rubbing is performed in the same way as for spraying, which is shown in Equation (12).

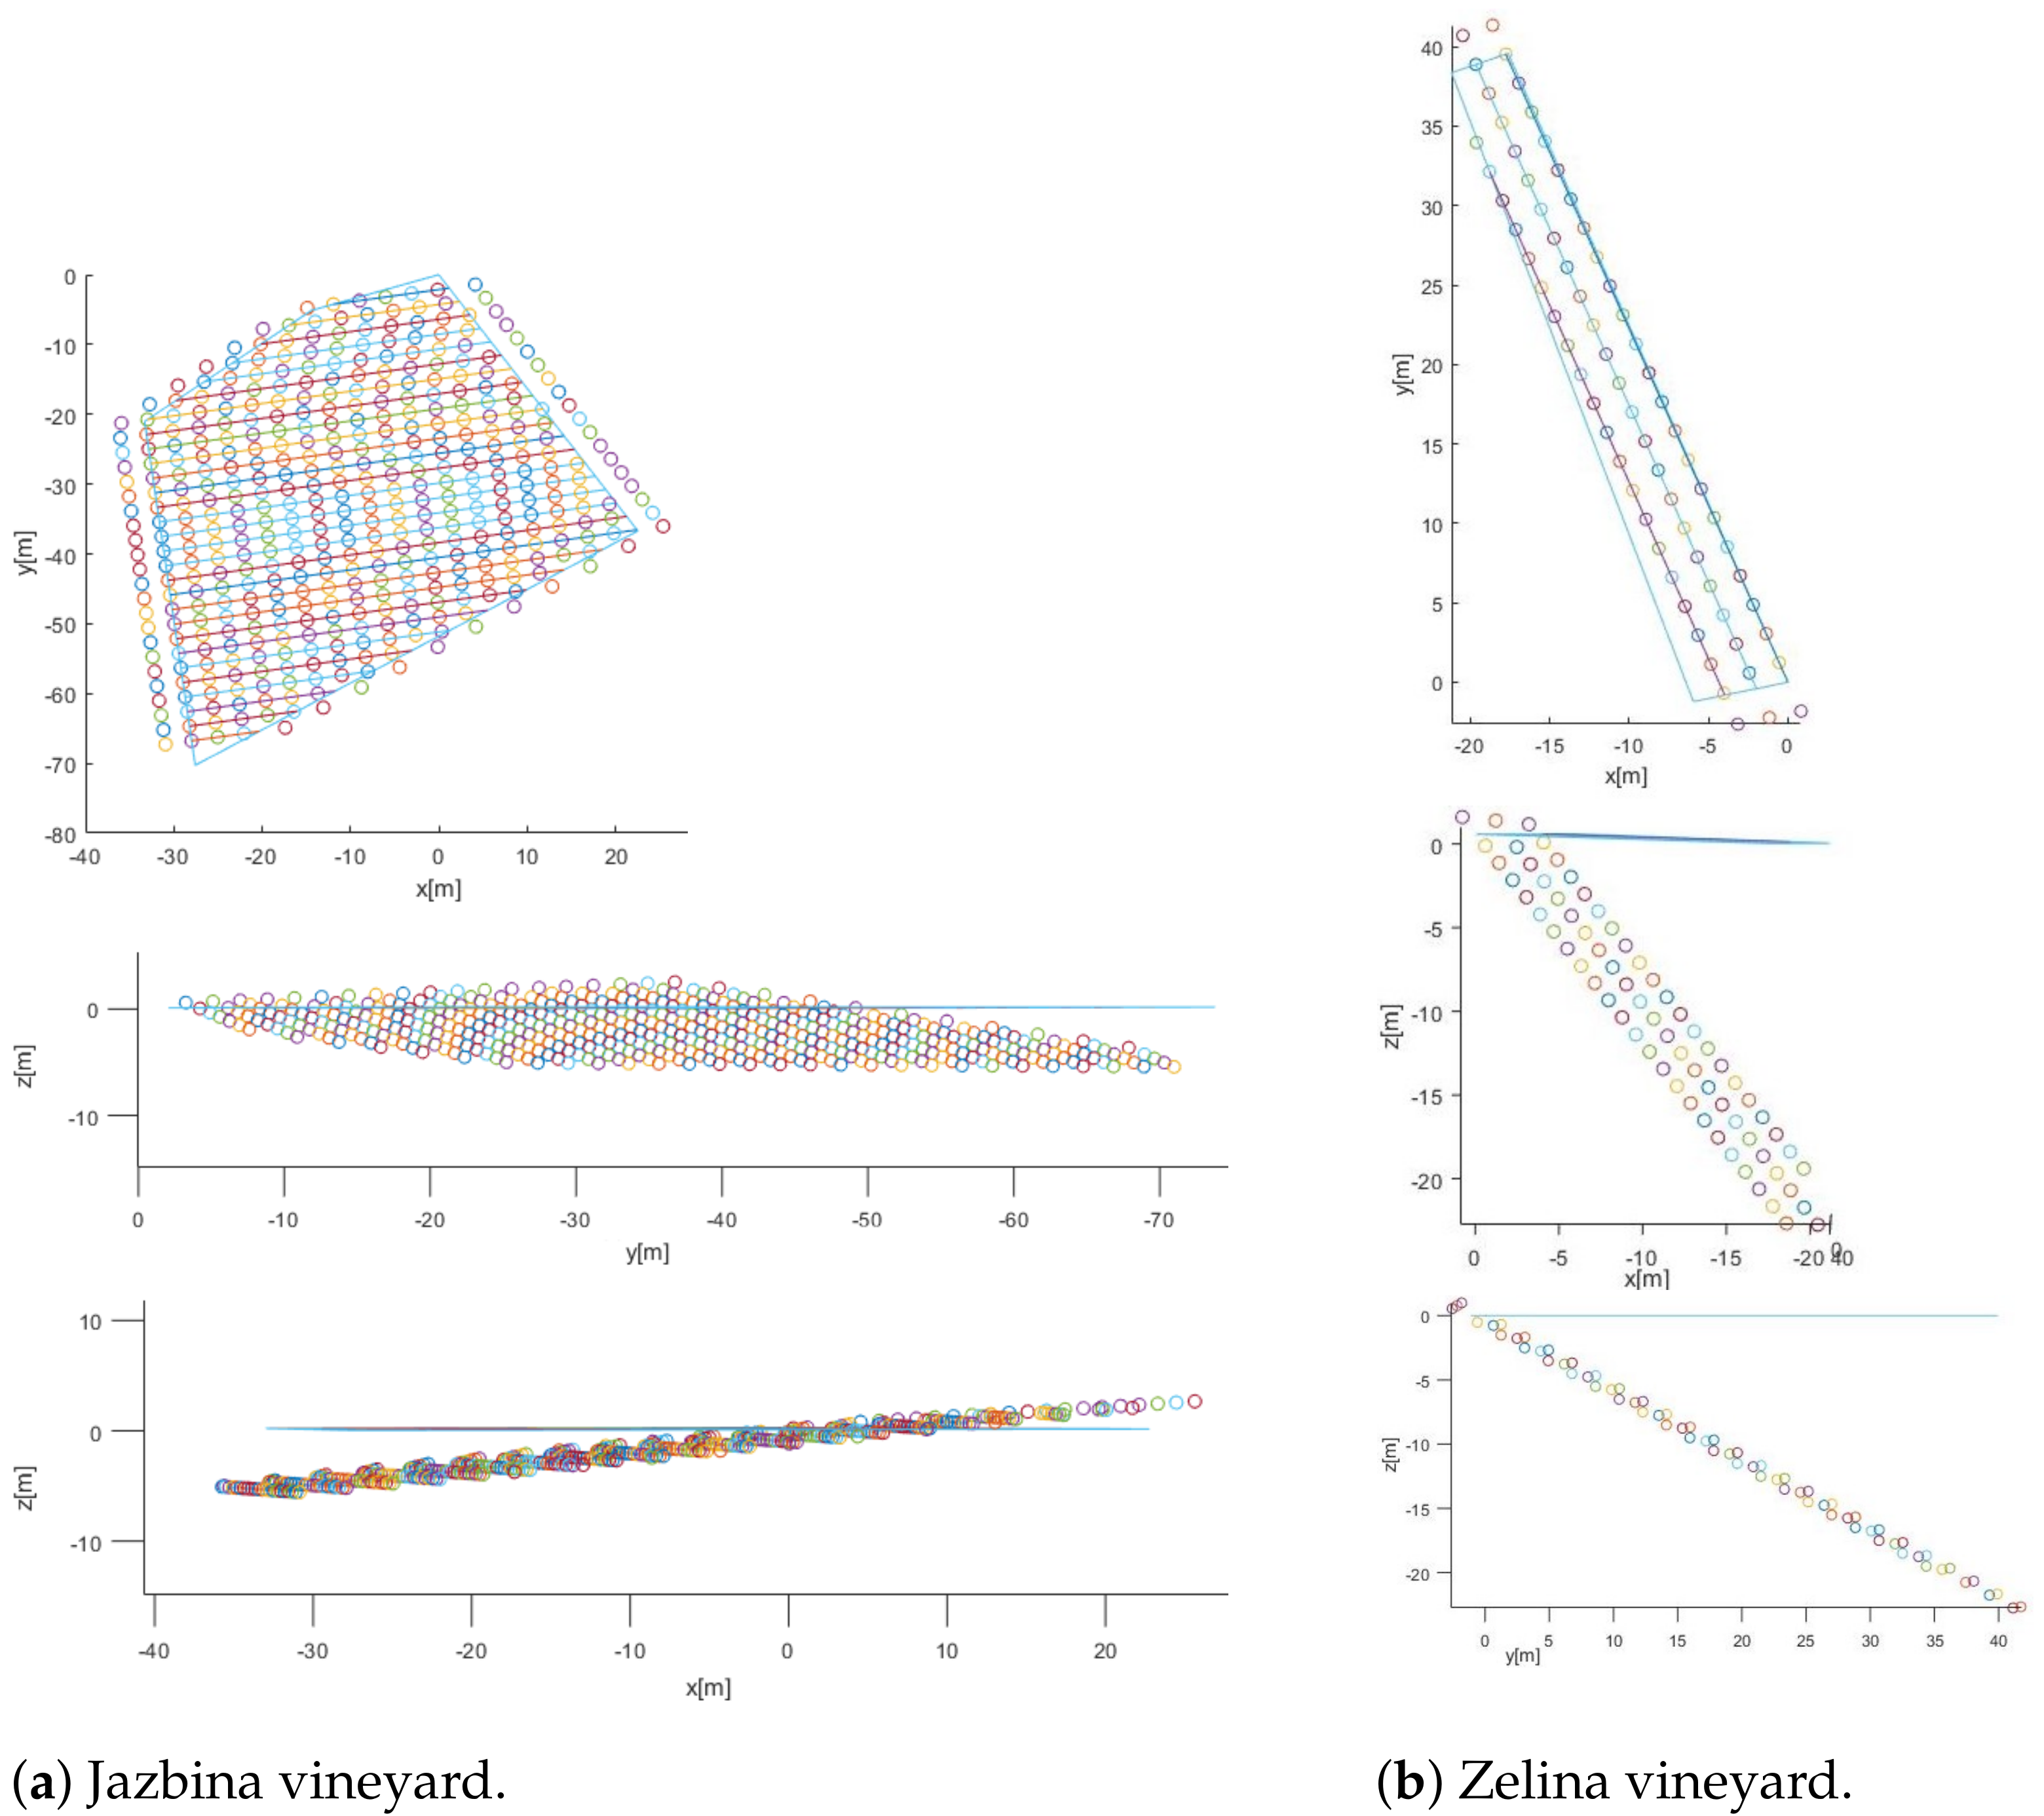
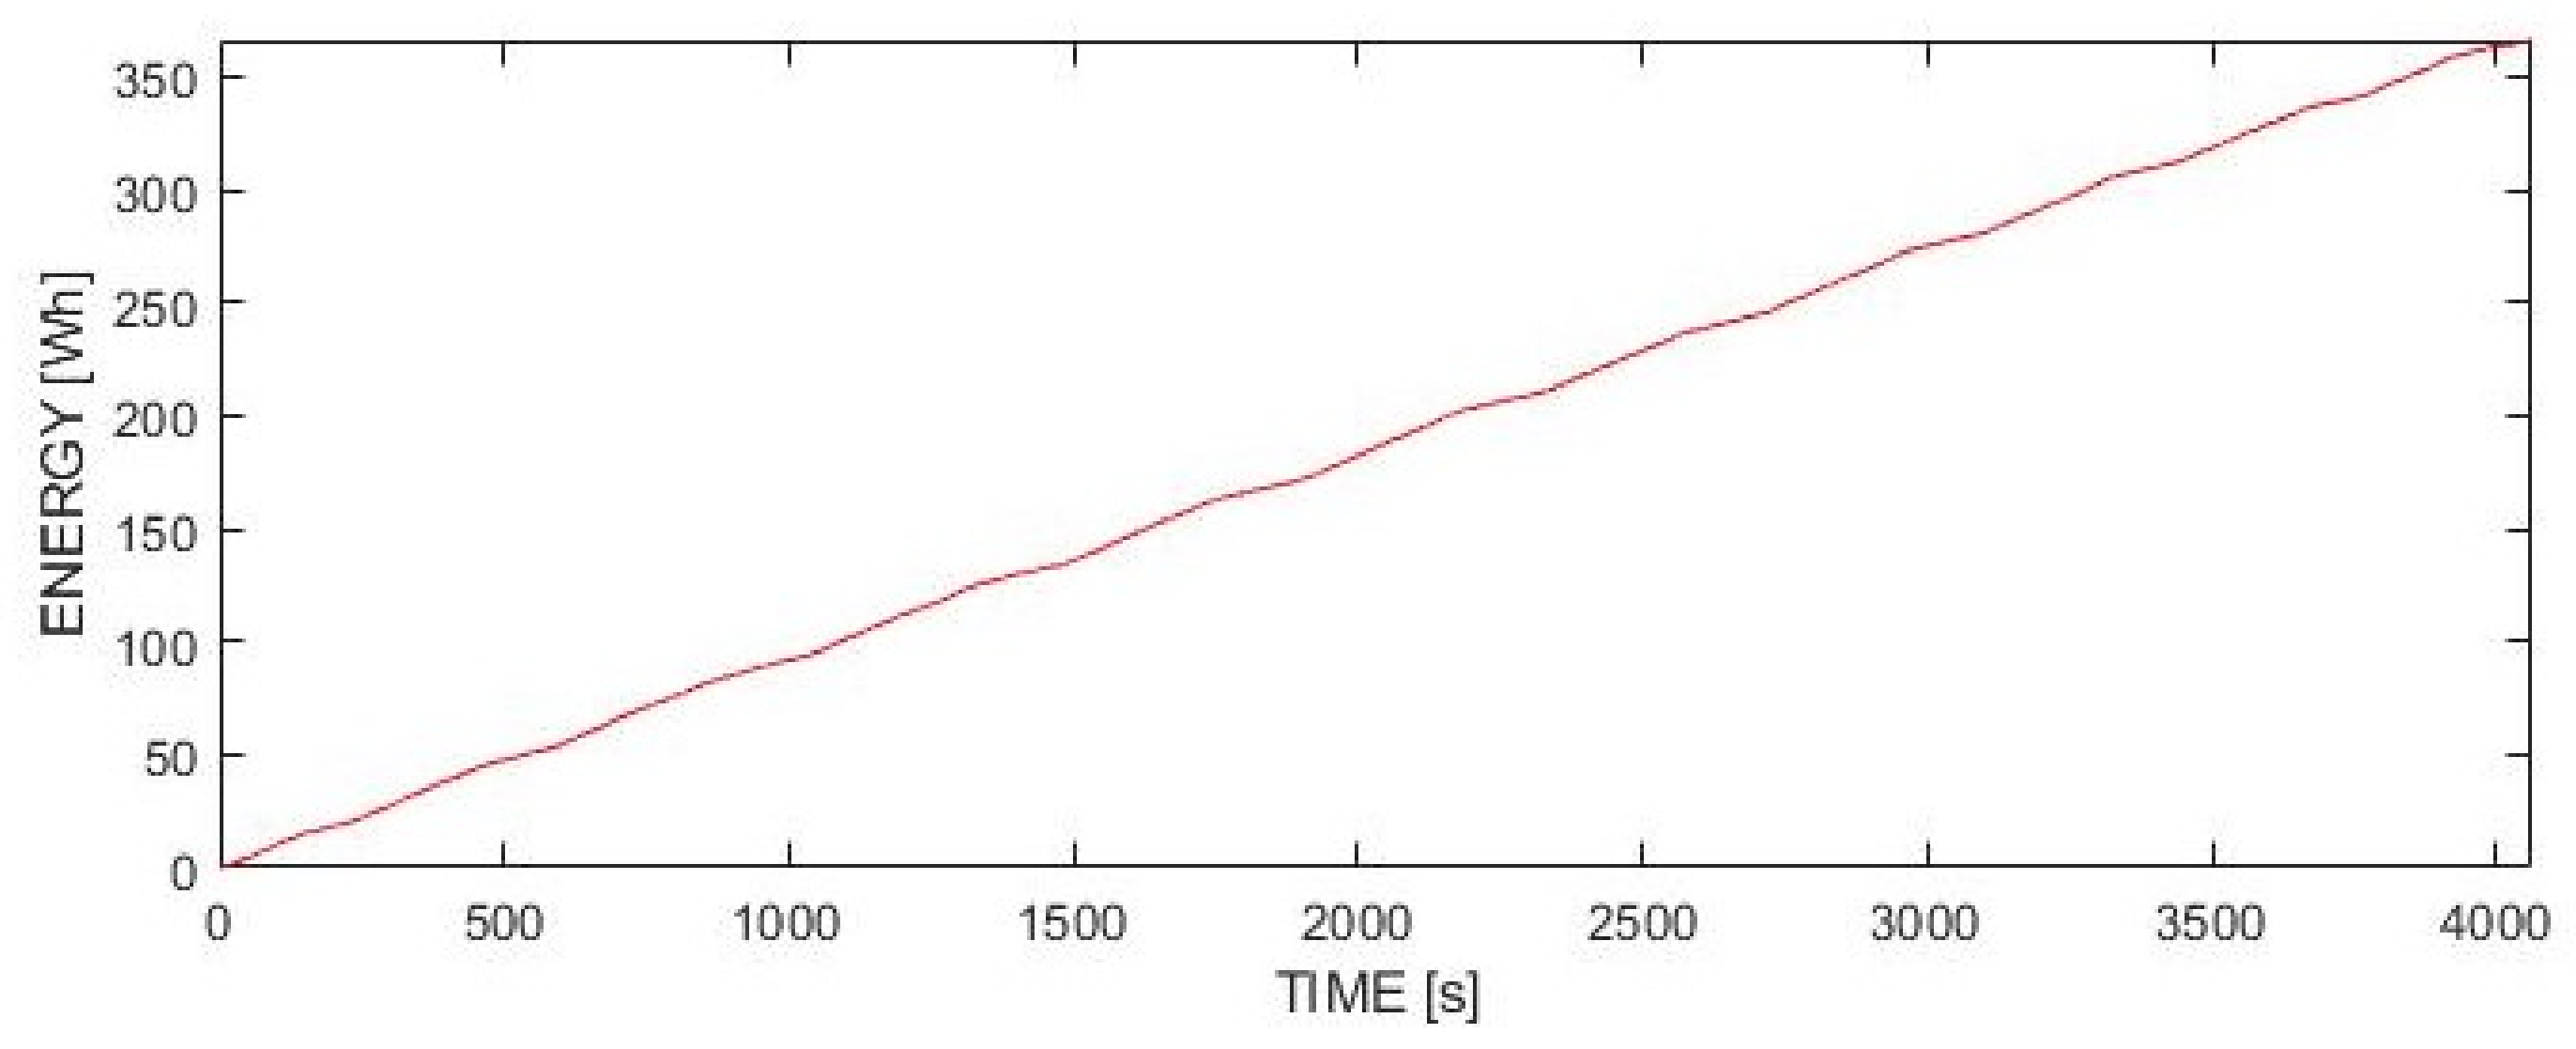
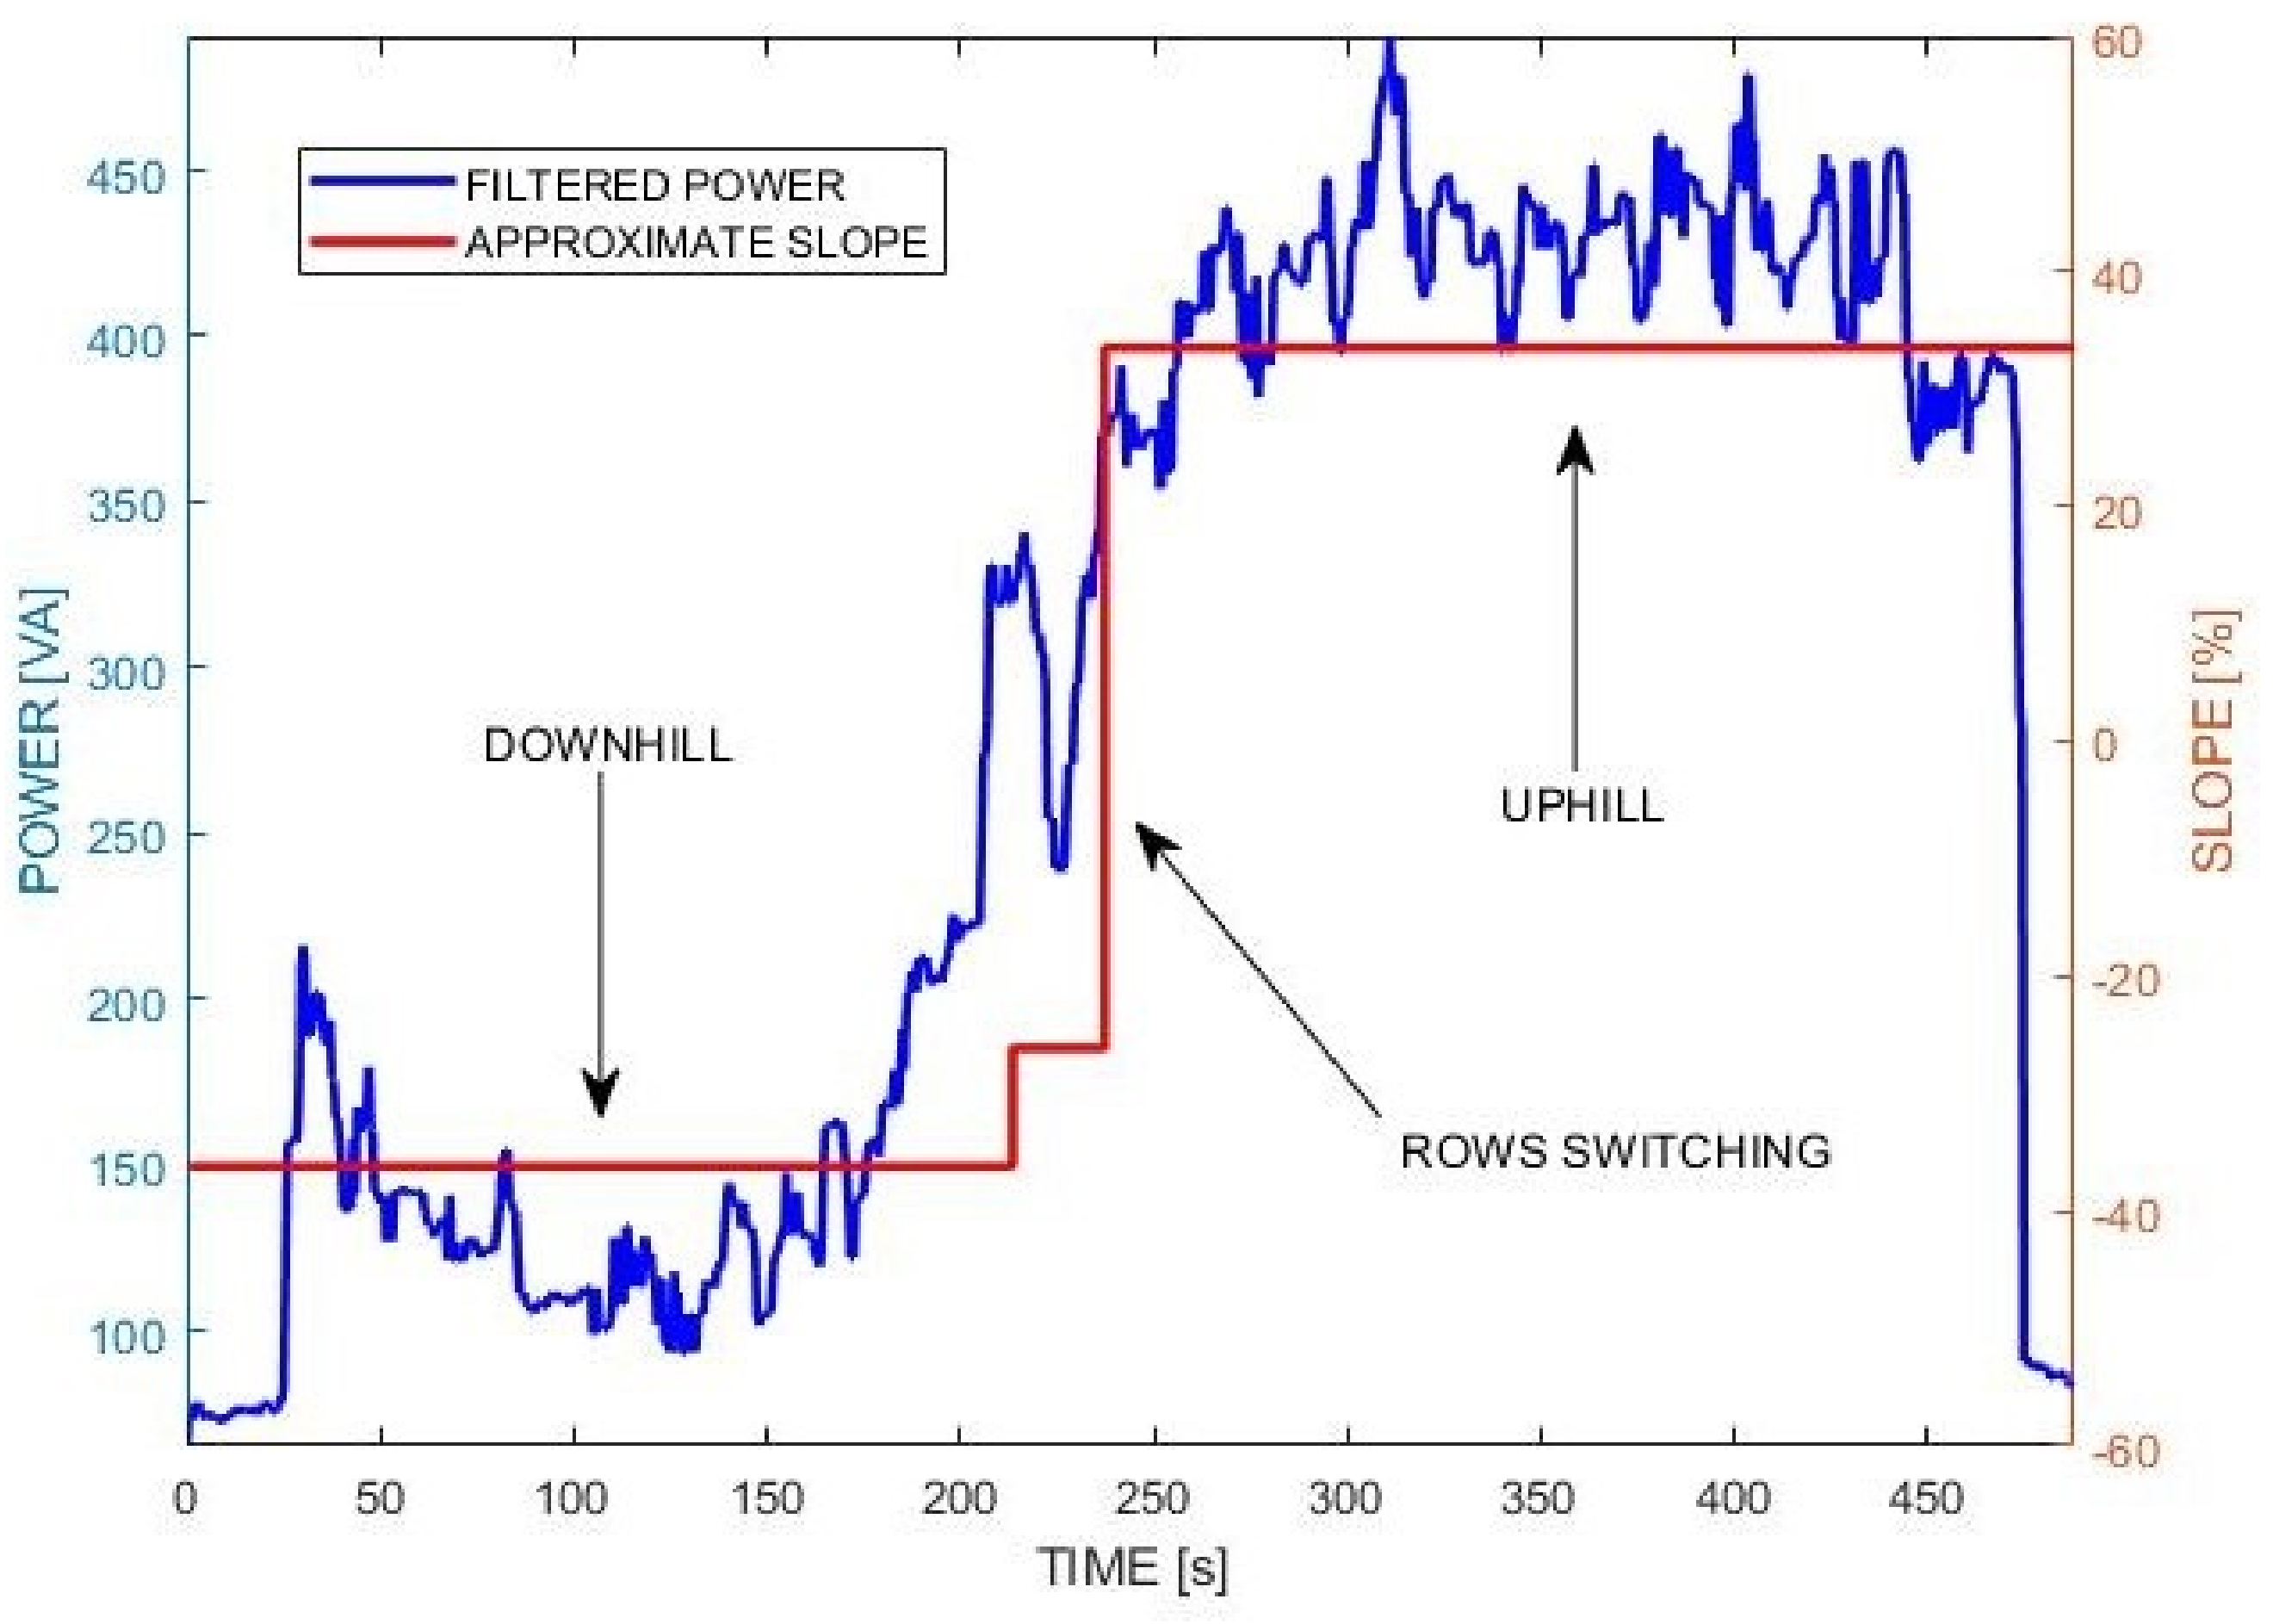
4.4. Energy Consumption Estimation for Operations in Jazbina Vineyard

Based on the locations of the GPS (Figure 6a), the topological 3D model of the Jazbina vineyard was created (Figure 9). Since the coordinates of the GPS include the edge of the vineyard, a model of a vine trunk was added to each row at the beginning and end of the row, representing the locations where the robot would change rows.
Table 3 lists the parameters for creating the vineyard model, including the distance d i , j between two trunks in a row; the distance w i between two rows; the direction of vine rows with respect to the slope (deviation angle θ ); and the terrain slope angle β .
Based on the model of the vineyard, it is possible to use Equations (2)–(15) to estimate the energy required for vineyard navigation, bud rubbing and spraying.
As for the estimates, it was assumed that the robot operated from one side only, i.e., each row was passed over only once. Additionally, it was assumed that the robot started at the beginning of one row, then moved to the second row; started there at the end of the row and moved to the beginning of this row; and then moved on to the next row. An estimation of power and energy consumption during the described movement was simulated based on a previously created 3D model of the vineyard. The calculation based on (2)–(15) was performed using a custom MATLAB code. The estimate of the power and energy consumption for spraying the whole vineyard is shown in Figure 10.
Using the model of the Jazbina vineyard, a path of 1024 m was estimated, consisting of 491 m uphill, 491 m downhill and 42 m for positioning to the next row. Assuming that the robot travel speed was constant, v m b = 0.4   m/s, the following estimated travel times were obtained:
  • t d h = 1227.5 s, total travel time downhill;
  • t u p = 1227.5 s, total travel time uphill;
  • t r s = 105 s, total time for changing to the next row.
Table 4 shows the estimated energy consumption for the different subsystems of the robot during vineyard navigation, spraying and bud rubbing. E c is the energy consumed when the robot system was not moving. This included the consumption of the central computer, sensors, communication system and motor drives in standby mode. E m b and E a r m are the energy consumed during the movement of the mobile base and the robot arm, respectively.

4.5. Energy Consumption Estimation for Operations in Zelina Vineyard

The Zelina vineyard (Figure fig:jazbinapolygonb) is a small but fairly steep vineyard. The area suitable for a steep-slope experiment is shown in Figure 6b, with an area of A B = 256   m 2 and a perimeter of P B = 99.86 m. It consisted of two rows of vines. Based on Google Earth data, the maximum slope was 21.1 degrees or 38.6%. The estimated distance that the robot had to travel was 103 m (50 m for each row and 3 m for changing rows). It was also found that the rows were not laid in the direction of maximum inclination. Therefore, there was an inclination of 5.0 degrees or 8.7% perpendicular to the row direction.
Given Equation (6), the vineyard parameters from Table 5 and the known data ( v m b = 0.4 m/s, m = 100 kg), the estimated navigation times were:
  • t d h = 125 s, total travel time downhill;
  • t u p = 125 s, total travel time uphill;
  • t r s = 7.5 s, total time for changing to the next row.
Using the above data, the energy consumption for a predefined path in the observed vineyard was estimated as
E t o t a l = E d o w n h i l l + E t u r n + E u p h i l l E t o t a l = t d h ( P v m b P m b s l o p e ) + t r s P v m b + 2 t t u r n P t u r n + t u h ( P v m b + P m b s l o p e ) + ( t d h + t u p + t r s ) ( P c + P a r m ) E t o t a l = 2375 Ws + 1200 Ws + 8460 Ws + 37625 Ws + 42978 Ws E t o t a l = 25.73 Wh .

4.6. Comments on the Accuracy of the Proposed Estimation Method

The estimated energy consumption and maximum power required to move the robot and perform the spraying and bud rubbing tasks were based on Google Earth data, ensuring the global applicability of the proposed estimation method. However, such estimation was only approximate, since the accuracy of the elevation representation in Google Earth is known to be not very high [22]. Google Earth measurements are based on satellite data and these measurements do not distinguish between vegetation and other obstacles on the ground, so all of these objects were included in the slope calculation. Moreover, the dryness of the soil in a vineyard, which is affected by changing weather conditions, can be expected to have a significant impact on energy consumption. Fortunately, the influence of soil texture should be secondary in Mediterranean vineyards located on steep karst terrain. Nevertheless, it was worthwhile to investigate experimentally, in the two selected vineyards, to what extent the experimentally measured results differed from the estimated ones.

5. Experimental Validation

An experimental validation was performed in both selected vineyard sites (Figure 6). As shown in Figure 11, the left vineyard had a moderate slope and the other one a much steeper slope, making both suitable for the objective evaluation of the proposed estimation method.

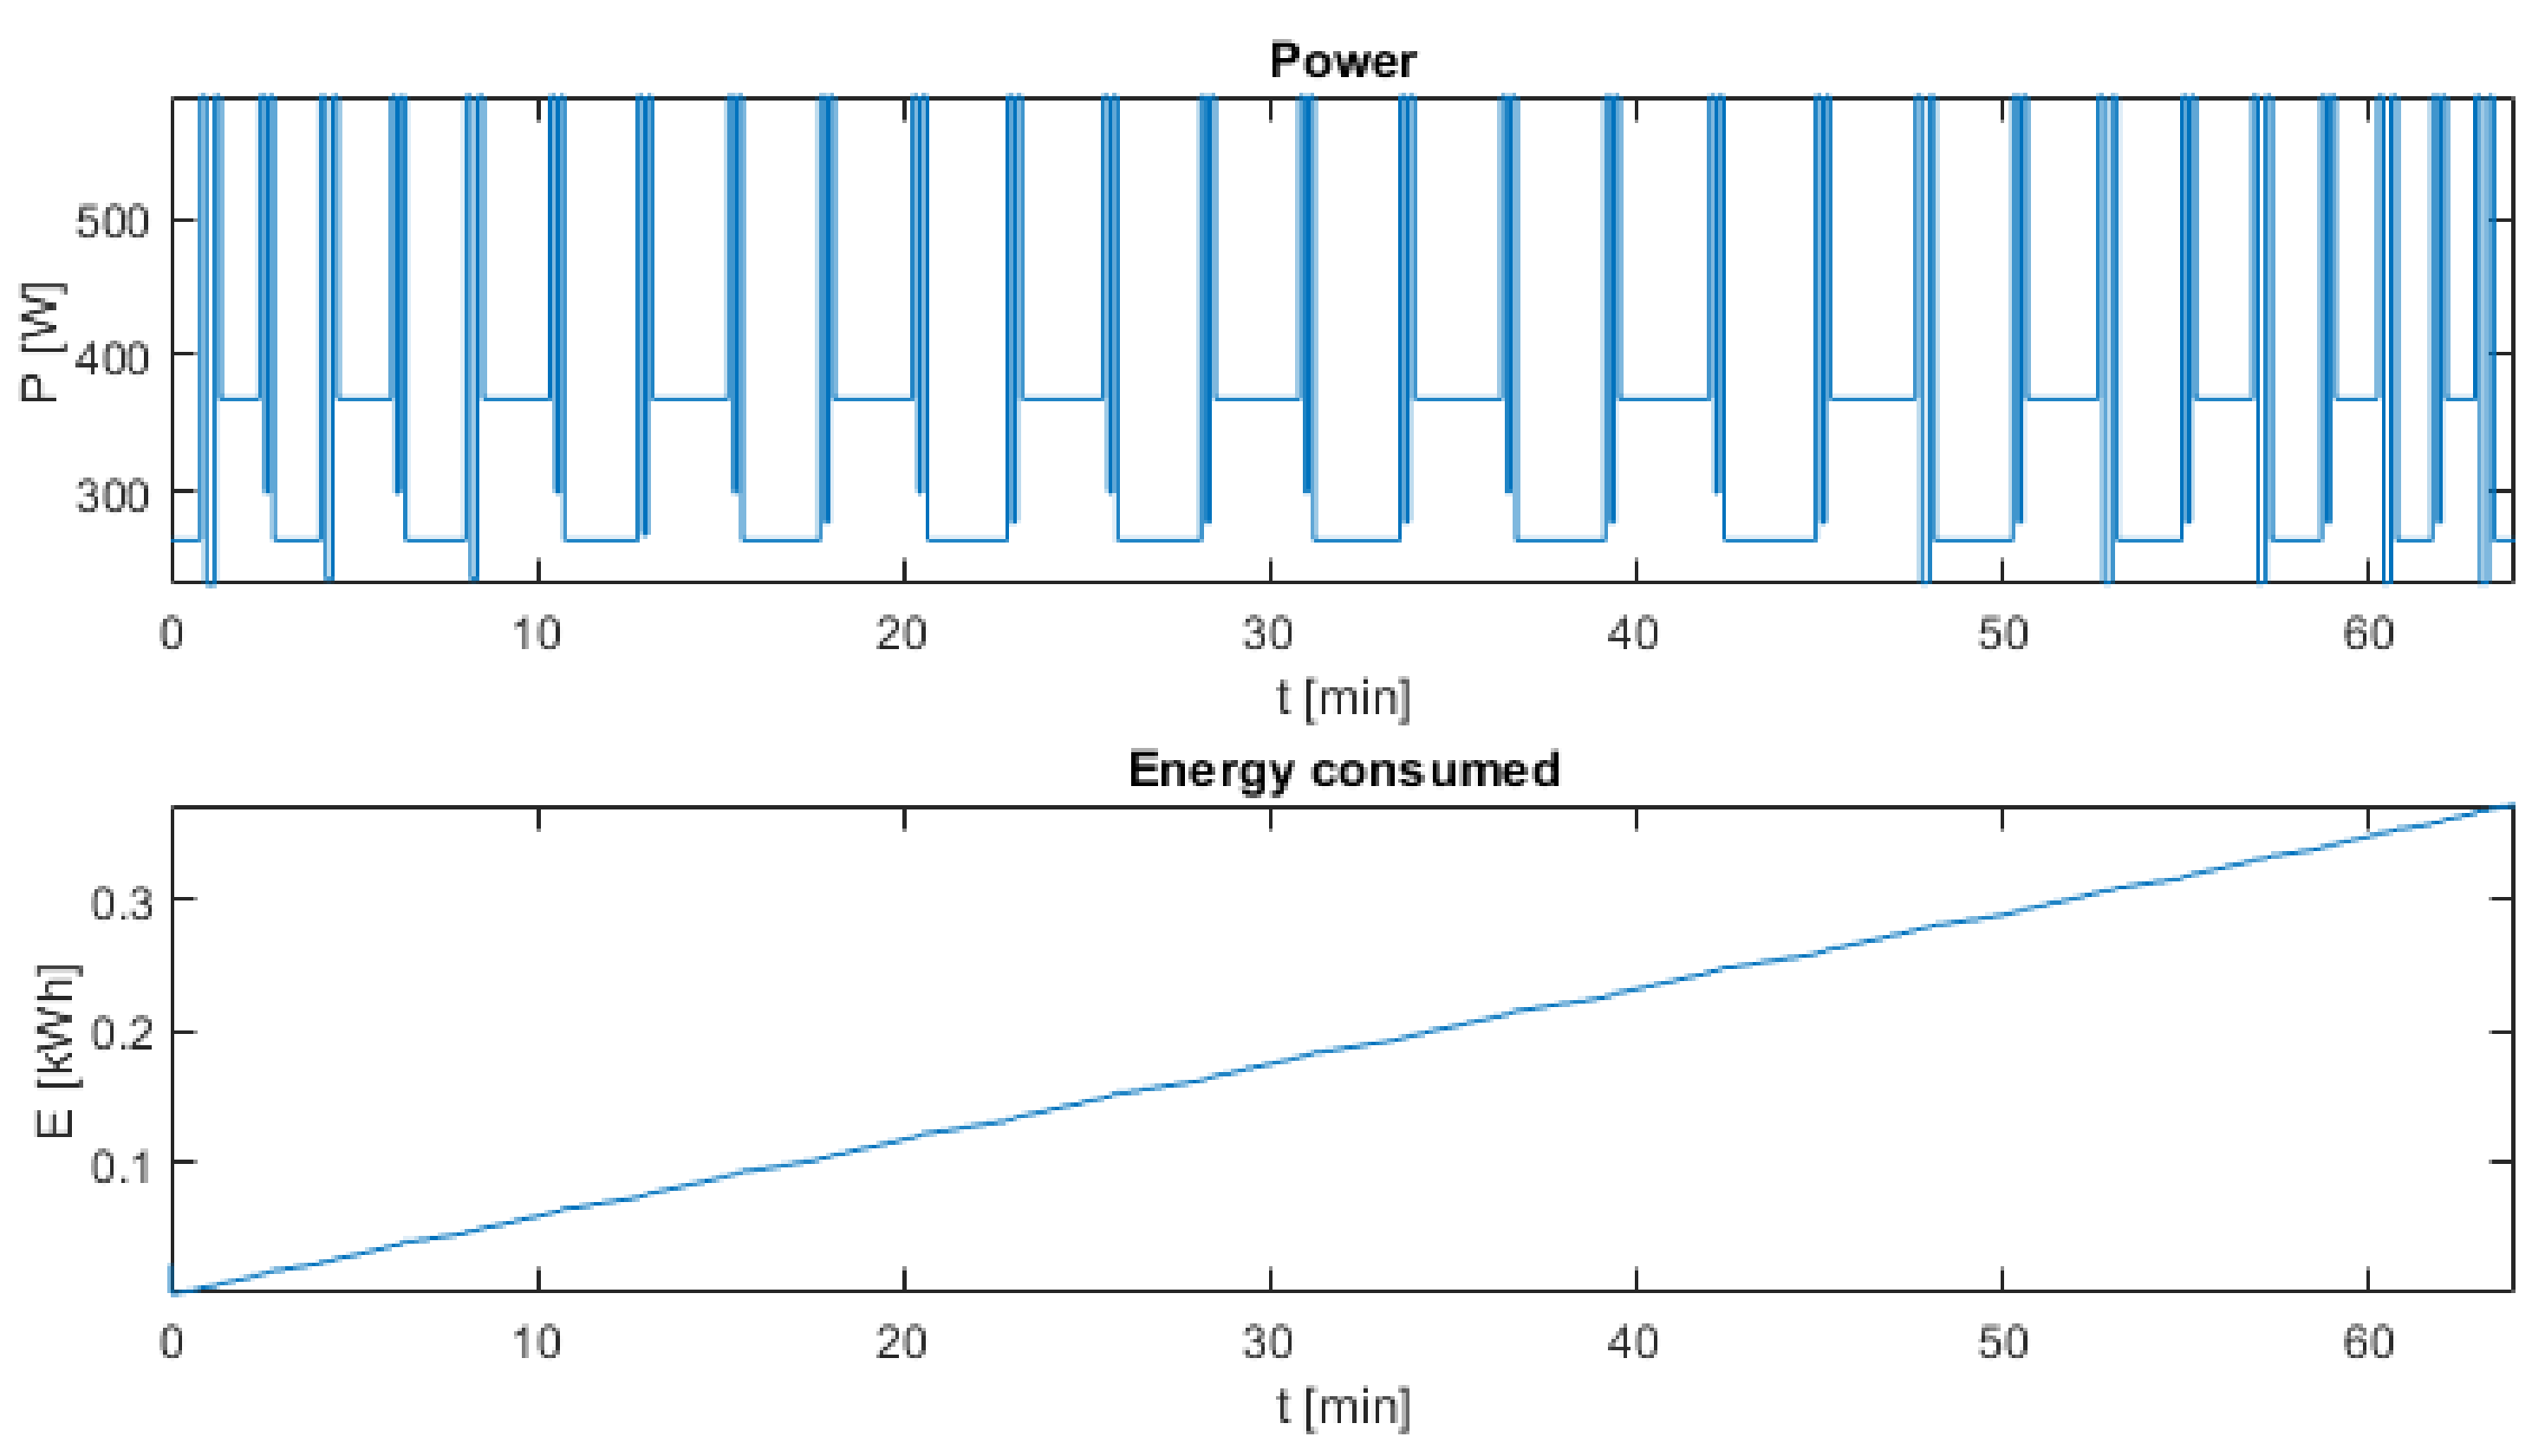
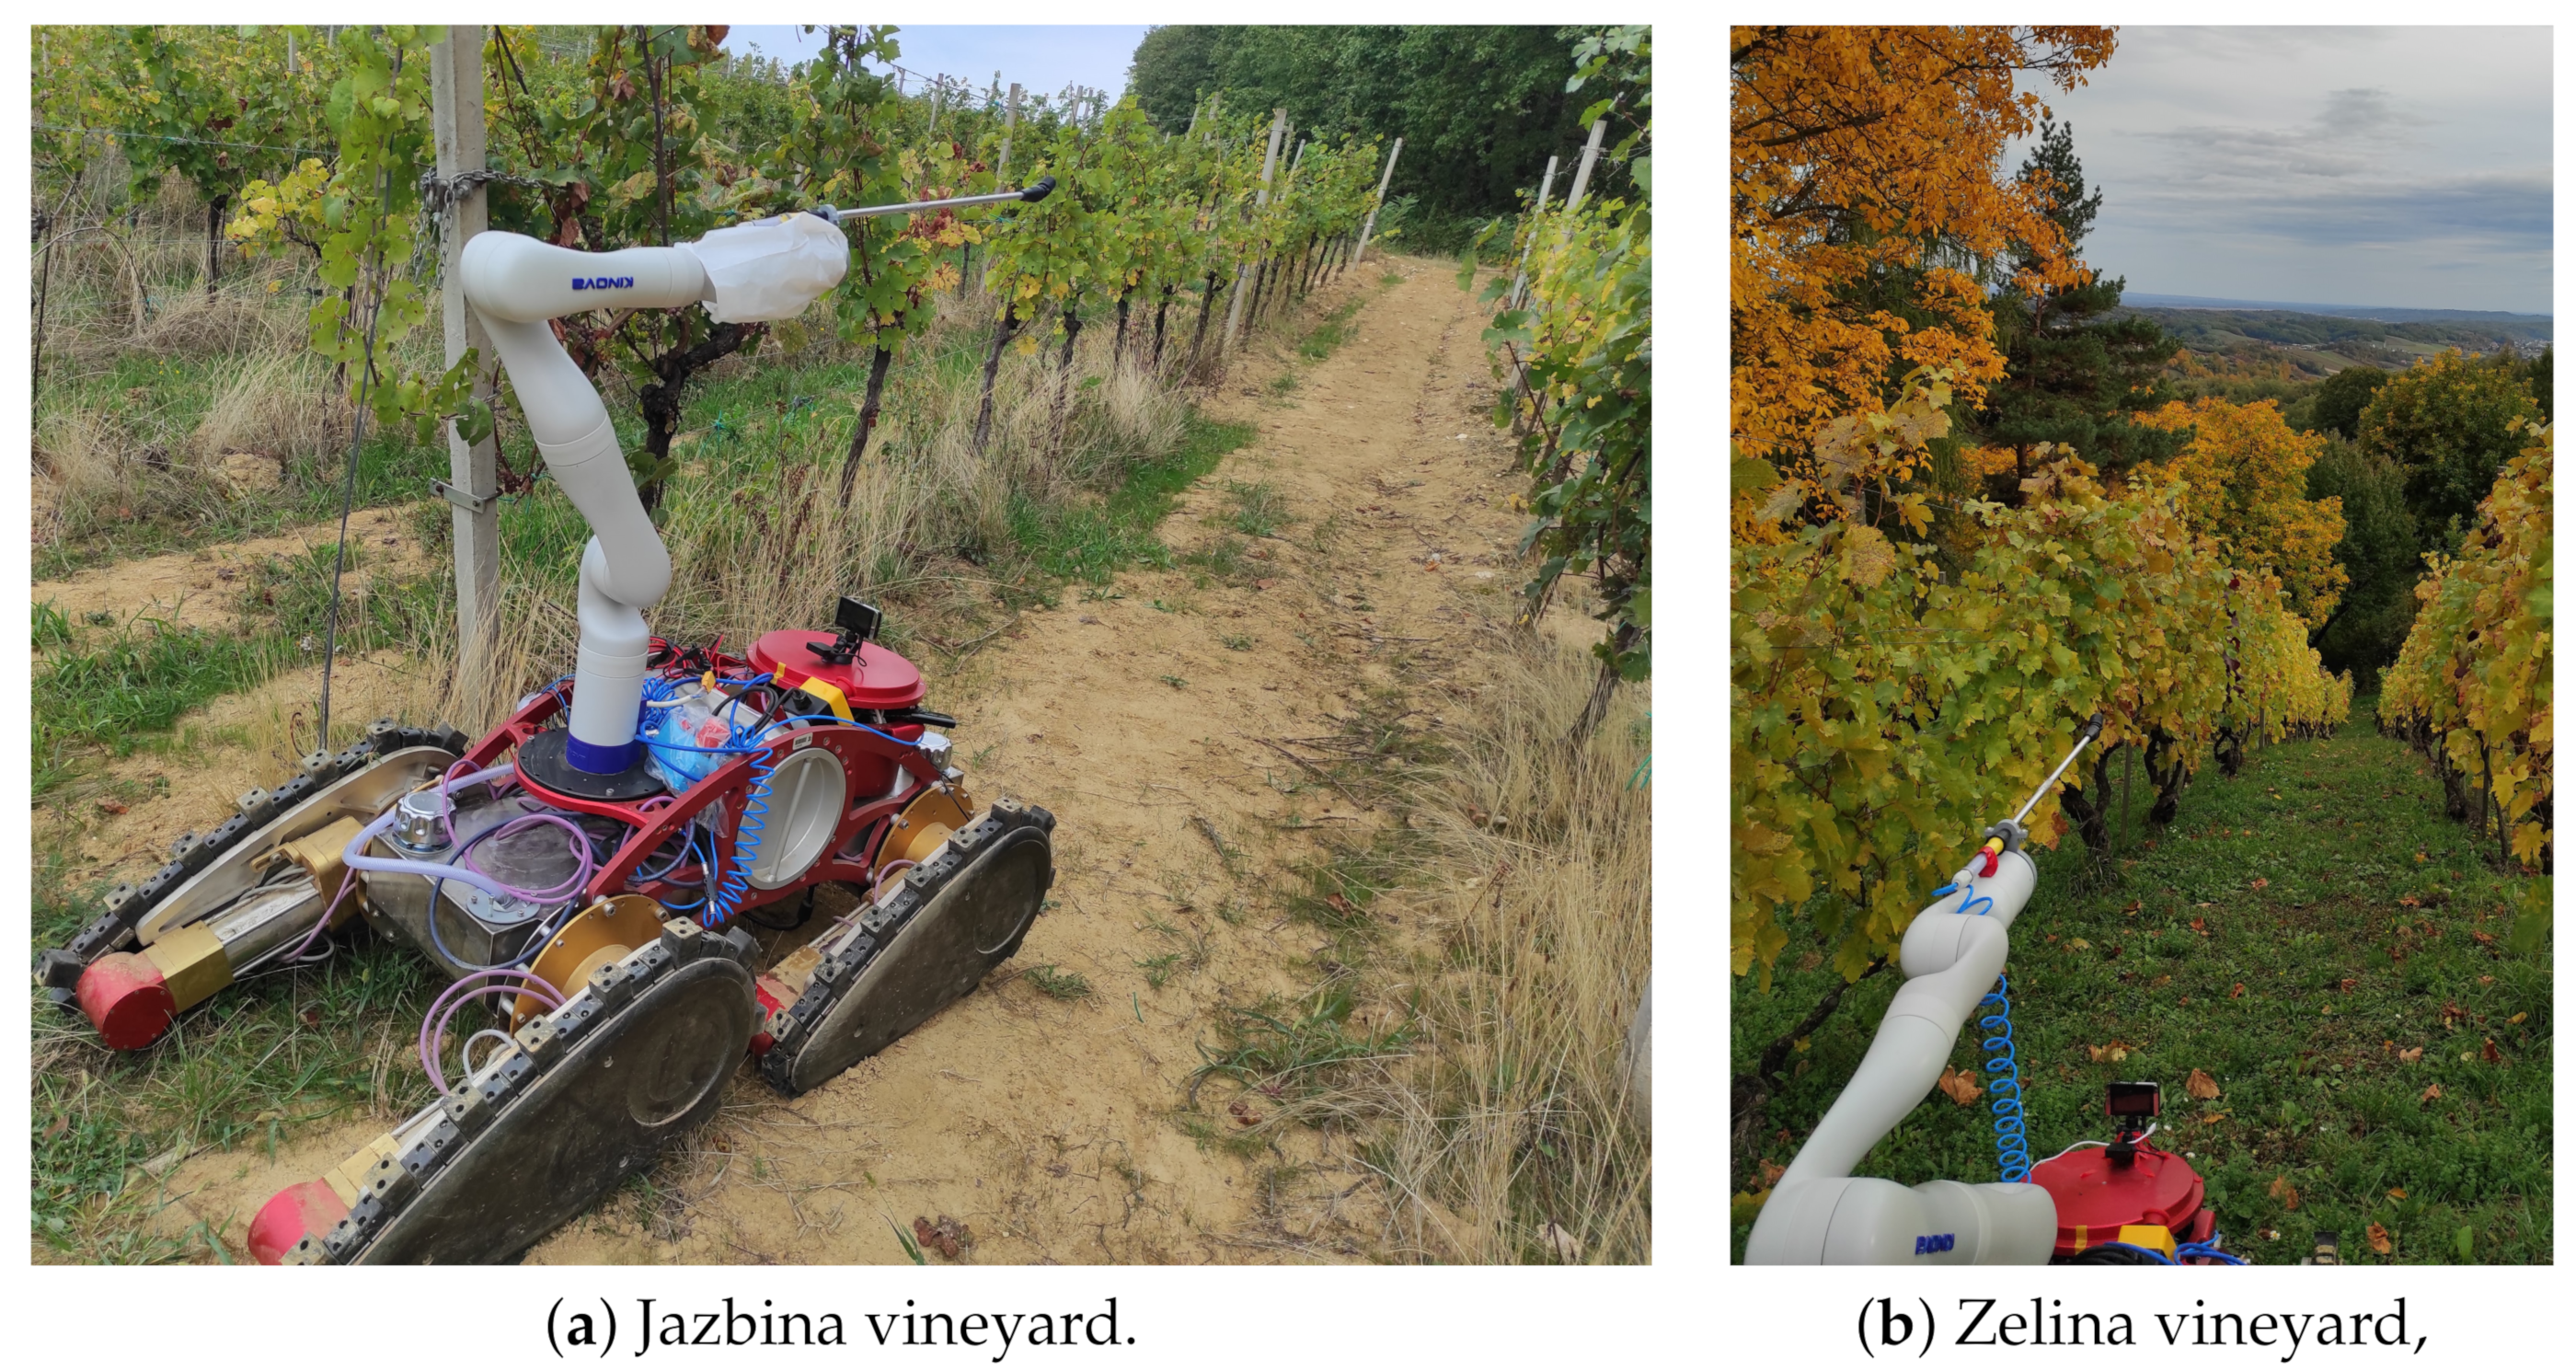
5.1. Jazbina Experiments

In the multiple experiments carried out in the Jazbina vineyard, measurements of power consumption when driving on the flat ground showed that consumption could increase by 40% depending on when it had last rained, from 180 W in dry weather conditions to 250 W when it had rained a few days ago. These differences occur because the dryness of the soil affects the performance of the robot tracks [23]. This means that the estimation of energy consumption must be calculated for the most unfavorable terrain conditions and then a heuristic correction factor can be introduced in the calculation of consumption depending on the actual type of terrain. For vineyards on hard, rocky terrain, this coefficient will always be close to one.
From the shape of the power consumption curve in Figure 12, it can be seen that 400 W was needed for uphill travel and about 250 W for downhill travel. Both values of these measurements are higher than the estimated values of 233 W and 131 W, respectively. Integrated over the duration of the experiment, a total energy of 0.365 kWh was consumed during the drive through the entire vineyard, as shown in Figure 13.
Since the GPS measurement in the Z axis is not as precise as the GPS measurement in the XY plane, a static pressure sensor for altitude measurement was used. The dependence of the altitude change in a simple model of an isothermal atmosphere is given [24] by
Δ h = h h 0 = k T m g 0 ( ln P ln P 0 )
where
  • h ( m ) , measured altitude;
  • h 0 ( m ) , first measured altitude, initial value;
  • g 0 = 9.80665 ( m s 2 ) , gravitational acceleration constant;
  • T ( K ) , standard temperature;
  • k = 1.38 × 10 23 ( J d e g ) , Boltzmann’s constant;
  • m = 4.76 × 10 26 ( K g ) , average mass of atoms;
  • P 0 ( P a ) , static pressure (pressure at start point);
  • P ( P a ) , measured static pressure.
Static pressure and standard temperature data on the day and at the time of the experiment were obtained from historical data of the Croatian Meteorological and Hydrological Service. Since only the relative change in altitude was relevant during the experiment, the first recorded data point was defined as altitude zero.

5.2. Zelina Experiments

On the steep vineyard in Zelina, the starting point was located in the upper part of the vineyard. The measurements of the robot motion during the experiment on the steep slope of the vineyard are shown in Figure 14. Power consumption is shown in Figure 15. The results show that, again, power consumption was higher than estimated.
The actual slope was measured later during the experiment. It was found that the actual slope of the terrain was 27.6 degrees or 52.3%, along the row in the middle part of the row (where the slope was greatest). It should be noted that the slope values obtained from Google Earth, the robot and the ground measurements are different. GPS data of the robot position in the XY plane drifted when the robot moved. Therefore, the recorded path was slightly longer than the actual path of the robot, resulting in a lower slope. Therefore, an average slope was determined. Since it was known that the robot moved forward in a straight line, in Figure 14 and Figure 16 a linear approximation of the robot’s path is shown. Based on these data, an average inclination angle for the entire row was determined. In Figure 15, the power consumption is plotted against the average slope during the experiment.
As can be seen in Table 6, the average measured power consumption of 341 W in the Jazbina vineyard, which is less inclined than the Zelina vineyard, was higher than expected and higher than the average measured power consumption in another, steeper vineyard (284 W).
The only reason for this is that the terrain of the first vineyard is much more uneven than that of the second vineyard. Table 7 shows that the estimation error of the average total power, total task duration and total energy consumed were rather small (7.56%, 24.63% and 18.97% for Jazbina; and 18.11%, 43.21% and 33.25% for the Zelina vineyard, respectively).
Moreover, the accuracy of slope estimation seems to be rather poor for the Jazbina and Zelina vineyards (109.52% and 26.20%, respectively). This large difference may be attributed to the limited inherent accuracy of Google Earth data for surface slopes. Furthermore, all estimates in this study were based on the nominal power consumed by the system.

5.3. Future Work

In the near future, a large number of experiments is planned on steep Adriatic vineyards (located on the Korcula island and Peljesac peninsula), in order to test the whole system.
Future work includes the creation of a topological model of the vineyards using an LAAR. It is expected that such a model of the vineyard will have lower elevation errors. On the other hand, the use of Google Earth data allows the end user to estimate the time and energy required for vineyard spraying without visiting the vineyard and performing an LAAR survey of the field. Moreover, it would be possible to extend the proposed solution to scenarios with multiple robots. A single LAAR would be sufficient to provide data to multiple ATMM robots, which would then spray the entire vineyard. These ATMMs could communicate with each other and perform the tasks together [25,26,27]. Such a solution would be particularly interesting for situations where vineyard rows vary in length and the time required to spray a single vineyard row can vary greatly. The decision of which row to spray would have a significant impact on the time required to navigate and spray the entire vineyard.

6. Conclusions

The goal of the research study within the HEKTOR project is to develop a heterogeneous robotic system for working in steep vineyards, initially focusing on autonomous movement and performing the tasks of selective spraying of vines and bud rubbing. If one wants to successfully use robotic systems in viticulture, these must be convincing in terms of speed and quality of execution of these tasks. Moreover, the robots used must offer a sufficiently long autonomy for the execution of the tasks, which is directly related to the energy consumption and the maximum power that such a system can provide.
If one tries to put themselves in the role of a winegrower, the decision to accept a robotic system to perform these tasks depends mainly on whether it is possible to estimate in advance how much work the robotic system can do on a single battery charge. In this context, it is important to be able to estimate how often a battery needs to be changed or recharged in order to know how much total time is required to perform the planned task. If it can be demonstrated that a robotic system can cover 8 h of operation with one or two charges, such a system would become attractive.
Thanks to the existence of applications such as Google Earth, which provides information about individual locations on Earth in terms of their position and altitude, it is possible to obtain data for each vineyard location to create an initial 3D model of the vineyard. In order to use these data for task planning and robot navigation, a formal method to describe the structure of a vineyard, which is also necessary for estimating energy consumption, is presented in this paper.
Based on this initial description and the 3D model of a vineyard, it is possible to estimate the energy consumption for spraying and bud rubbing by the developed HEKTOR robotic system. Due to the known inaccuracy of the estimation based on Google Earth data, two different vineyards in Croatia were selected to test the method for estimating the energy consumption for a specific vineyard robotic system. The presented measurement of the energy consumption of the robot travel and task performance was validated and the results showed that the measurements and estimates are in the same order of magnitude. The influence of soil texture must also be considered as a possible cause of increased energy consumption.
The next steps include improving the method of building the vineyard model based on the information collected by the LAAR, in order to get the maximum out of the heterogeneous robotic system.
A major source of error in the proposed estimation was the initial measurement of the slope angle. An LAAR survey of the vineyard would provide more reliable data on the slope of the vineyard than Google Earth, whose data are based on satellite measurements. On the other hand, the proposed method allows the end user to estimate the time and energy required to navigate and spray vineyards without visiting the vineyard. This ensures that the task does not fail due to energy depletion.
A large number of experiments are planned on selected vineyards on the Adriatic coast (Korcula island, Peljesac peninsula). On this basis, further improvement of the method for estimating energy consumption is expected.

Author Contributions

Conceptualization, Z.K. and G.V.; methodology, Z.K. and G.V.; software, I.H. and G.V.; validation, I.H., G.V. and Z.K.; investigation, I.H., G.V. and Z.K.; data curation, I.H.; writing—original draft preparation, I.H., G.V. and Z.K.; writing—review and editing, I.H., G.V. and Z.K.; visualization, I.H. and G.V.; supervision, Z.K.; project administration, Z.K. All authors have read and agreed to the published version of the manuscript.

Funding

The research work presented in this article was supported by the project Heterogeneous Autonomous Robotic System in Viticulture and Mariculture (HEKTOR) financed by the European Union through the European Regional Development Fund—The Competitiveness and Cohesion Operational Programme (KK.01.1.1.04.0041).

Data Availability Statement

The data that support the findings of this study are available on request from the corresponding author.

Conflicts of Interest

The authors declare no conflict of interest.

References

  1. Gonzalez-de Santos, P.; Fernández, R.; Sepúlveda, D.; Navas, E.; Emmi, L.; Armada, M. Field Robots for Intelligent Farms—Inhering Features from Industry. Agronomy 2020, 10, 1638. [Google Scholar] [CrossRef]
  2. Duckett, T.; Pearson, S.; Blackmore, S.; Grieve, B.; Chen, W.H.; Cielniak, G.; Cleaversmith, J.; Dai, J.; Davis, S.; Fox, C.; et al. Agricultural Robotics: The Future of Robotic Agriculture. arXiv 2018, arXiv:1806.06762. [Google Scholar]
  3. Miller, I.J.; Schieber, B.; Bey, Z.D.; Benner, E.; Ortiz, J.D.; Girdner, J.; Patel, P.; Coradazzi, D.G.; Henriques, J.; Forsyth, J. Analyzing crop health in vineyards through a multispectral imaging and drone system. In Proceedings of the 2020 Systems and Information Engineering Design Symposium (SIEDS), Charlottesville, VA, USA, 24 April 2020; pp. 1–5. [Google Scholar] [CrossRef]
  4. Arnó, J.; Escolà, A.; Vallès, J.M.; Llorens, J.; Sanz, R.; Masip, J.; Palacín, J.; Rosell-Polo, J.R. Leaf area index estimation in vineyards using a ground-based LiDAR scanner. Precis. Agric. 2013, 14, 290–306. [Google Scholar] [CrossRef] [Green Version]
  5. Berenstein, R.; Shahar, O.B.; Shapiro, A.; Edan, Y. Grape clusters and foliage detection algorithms for autonomous selective vineyard sprayer. Intell. Serv. Robot. 2010, 3, 233–243. [Google Scholar] [CrossRef]
  6. Berenstein, R. The use of agricultural robots in crop spraying/fertilizer applications. In Robotics and Automation for Improving Agriculture; Burleigh Dodds Science Publishing: Cambridge, UK, 2019; pp. 109–136. [Google Scholar] [CrossRef]
  7. Oberti, R.; Marchi, M.; Tirelli, P.; Calcante, A.; Iriti, M.; Hočevar, M.; Baur, J.; Pfaff, J.; Schütz, C.; Ulbrich, H. Selective spraying of grapevine’s diseases by a modular agricultural robot. J. Agric. Eng. 2013, 44. [Google Scholar] [CrossRef]
  8. Oberti, R.; Marchi, M.; Tirelli, P.; Calcante, A.; Iriti, M.; Tona, E.; Hočevar, M.; Baur, J.; Pfaff, J.; Schütz, C.; et al. Selective spraying of grapevines for disease control using a modular agricultural robot. Biosyst. Eng. 2016, 146, 203–215. [Google Scholar] [CrossRef]
  9. De Soto, M.G.; Emmi, L.; Perez-Ruiz, M.; Aguera, J.; de Santos, P.G. Autonomous systems for precise spraying—Evaluation of a robotised patch sprayer. Biosyst. Eng. 2016, 146, 165–182. [Google Scholar] [CrossRef]
  10. Jackson, R.S. 5—Site Selection and Climate. In Wine Science, 3rd ed.; Jackson, R.S., Ed.; Food Science and Technology; Academic Press: Cambridge, MA, USA, 2014; pp. 239–269. [Google Scholar] [CrossRef]
  11. Hektor. Available online: https://hektor.fer.hr/ (accessed on 27 September 2021).
  12. Goričanec, J.; Kapetanović, N.; Vatavuk, I.; Hrabar, I.; Vasiljević, G.; Gledec, G.; Stuhne, D.; Bogdan, S.; Orsag, M.; Petrović, T.; et al. Heterogeneous autonomous robotic system in viticulture and mariculture—Project overview. In Proceedings of the 2021 16th International Conference on Telecommunications (ConTEL), Zagreb, Croatia, 30 June–2 July 2021; pp. 181–188. [Google Scholar] [CrossRef]
  13. Meyers, J.M.; Miles, J.A.; Tejeda, D.G.; Faucett, J.; Janowitz, I.; Weber, E.; Smith, R.; Garcia, L. Priority Risk Factors for Back Injury in Agricultural Field Work: Vineyard Ergonomics. J. Agromed. 2002, 8, 39–54. [Google Scholar] [CrossRef]
  14. McCauley, L.A.; Anger, W.K.; Keifer, M.; Langley, R.; Robson, M.G.; Rohlman, D. Studying Health Outcomes in Farmworker Populations Exposed to Pesticides. Environ. Health Perspect. 2006, 114, 953–960. [Google Scholar] [CrossRef] [PubMed] [Green Version]
  15. Sadrpour, A.; Jin, J.; Ulsoy, A.G. Mission energy prediction for unmanned ground vehicles. In Proceedings of the IEEE International Conference on Robotics and Automation, Saint Paul, MN, USA, 14–18 May 2012; pp. 2229–2234. [Google Scholar] [CrossRef]
  16. Sadrpour, A.; Jin, J.; Ulsoy, A.G. Experimental validation of mission energy prediction model for unmanned ground vehicles. In Proceedings of the American Control Conference, Washington, DC, USA, 17–19 June 2013; pp. 5960–5965. [Google Scholar] [CrossRef]
  17. Hou, L.; Zhang, L.; Kim, J. Energy modeling and power measurement for mobile robots. Energies 2019, 12, 27. [Google Scholar] [CrossRef] [Green Version]
  18. Hou, L.; Zhou, F.; Kim, K.; Zhang, L. Practical model for energy consumption analysis of omnidirectional mobile robot. Sensors 2021, 21, 1800. [Google Scholar] [CrossRef] [PubMed]
  19. Chuy, O.; Collins, E.G.; Yu, W.; Ordonez, C. Power modeling of a skid steered wheeled robotic ground vehicle. In Proceedings of the IEEE International Conference on Robotics and Automation, Kobe, Japan, 12–17 May 2009; pp. 4118–4123. [Google Scholar] [CrossRef]
  20. Morales, J.; Martínez, J.L.; Mandow, A.; García-Cerezo, A.J.; Pedraza, S. Power consumption modeling of skid-steer tracked mobile robots on rigid terrain. IEEE Trans. Robot. 2009, 25, 1098–1108. [Google Scholar] [CrossRef]
  21. multimaster_fkie—ROS Wiki. Available online: https://wiki.ros.org/multimaster_fkie (accessed on 8 December 2021).
  22. El-Ashmawy, K.L. Investigation of the Accuracy of Google Earth Elevation Data. Artif. Satell. 2016, 51, 89–97. [Google Scholar] [CrossRef] [Green Version]
  23. Mocera, F.; Somà, A.; Nicolini, A. Grousers Effect in Tracked Vehicle Multibody Dynamics with Deformable Terrain Contact Model. Appl. Sci. 2020, 10, 6581. [Google Scholar] [CrossRef]
  24. Bolanakis, D.E.; Kotsis, K.T.; Laopoulos, T. Temperature influence on differential barometric altitude measurements. In Proceedings of the 2015 IEEE 8th International Conference on Intelligent Data Acquisition and Advanced Computing Systems: Technology and Applications (IDAACS), Warsaw, Poland, 24–26 September 2015; Volume 1, pp. 120–124. [Google Scholar] [CrossRef]
  25. Zhang, F.; Leonard, N.E. Cooperative Filters and Control for Cooperative Exploration. IEEE Trans. Autom. Control 2010, 55, 650–663. [Google Scholar] [CrossRef] [Green Version]
  26. Luo, S.; Kim, J.; Parasuraman, R.; Bae, J.H.; Matson, E.T.; Min, B.C. Multi-robot rendezvous based on bearing-aided hierarchical tracking of network topology. Ad Hoc Netw. 2019, 86, 131–143. [Google Scholar] [CrossRef]
  27. Luo, S.; Kim, J.; Min, B.C. Asymptotic Boundary Shrink Control with Multirobot Systems. IEEE Trans. Syst. Man Cybern. Syst. 2022, 52, 591–605. [Google Scholar] [CrossRef]
Figure 1. An artist’s view of a heterogeneous robotic system for work in viticulture, consisting of a light autonomous aerial robot and an all-terrain mobile manipulator.
Electronics 11 00217 g001
Figure 2. Design of an all-terrain mobile manipulator (ATMM) consisting of an all-terrain mobile robot (ATMR) driven by four independently controlled flippers/tracks and a 7 DoF robot arm.
Electronics 11 00217 g002
Figure 3. Layout of the Jazbina vineyard, Faculty of Agriculture, University of Zagreb.
Electronics 11 00217 g003
Figure 4. Morphological uniformity of individual vines in terms of height and width.
Electronics 11 00217 g004
Figure 5. The use of concrete columns and wire joints and supports for vine rows.
Electronics 11 00217 g005
Figure 6. Two vineyards that were selected for conducting experiments to validate the proposed energy consumption assessment method. (a) The section of the Jazbina vineyard taken as an example for formal description of a vineyard. The GPS coordinates of the vertices of the vineyard pentagon were obtained from the Google Maps application: A 1 ( 45.855934 , 16.006050 ) , A 2 ( 45.855604 , 16.006341 ) , A 3 ( 45.855302 , 16.005694 ) , A 4 ( 45.855745 , 16.005620 ) and A 5 ( 45.855888 , 16.005864 ) . (b) Section of the Zelina vineyard. The steepest part of the vineyard, where the experiments took place, is marked. GPS coordinates of the vertices: A 1 ( 45.960515 , 16.220710 ) , A 2 ( 45.960871 , 16.220513 ) , A 3 ( 45.960882 , 16.220559 ) , A 4 ( 45.960526 , 16.220787 ) .
Electronics 11 00217 g006
Figure 7. The example of a vineyard layout with a uniform length of the vine rows, meaning that each row contains the same number of planted vines.
Electronics 11 00217 g007
Figure 8. The example of the elevation model of a vineyard planted on a sloping terrain.
Electronics 11 00217 g008
Figure 9. Topological 3D model of Jazbina (a) and Zelina (b) vineyards based on the coordinates of GPS shown in the caption of Figure 6.
Electronics 11 00217 g009
Figure 10. Estimated power and energy consumption during spraying of Jazbina vineyard, based on topological 3D model (Figure 9).
Electronics 11 00217 g010
Figure 11. ATMM at the starting points before the experiments to measure power consumption.
Electronics 11 00217 g011
Figure 12. Power consumption during the experiment in the Jazbina vineyard. Higher power consumption (about 400 VA) corresponds to uphill navigation, while lower consumption corresponds to downhill navigation. A jump in power consumption can be observed during the turning manoeuvre at the end of a row. During downhill navigation, energy recovery may occur. The power consumption during the last three rows of the Jazbina vineyard experiment is highlighted. A turn in place is circled. It can be seen that the robot turns by 90° at the end of the row and moves to the next row (power consumption between the circled parts). A similar increase in power consumption by a factor of two can be observed at each transition between uphill and downhill navigation.
Electronics 11 00217 g012
Figure 13. Energy consumption during experiments in Jazbina vineyard.
Electronics 11 00217 g013
Figure 14. Path followed by the robot in the vineyard with steep slope. The X and Y positions were obtained from GPS and the altitude was calculated by the static pressure sensor (blue). The approximate path is shown in red.
Electronics 11 00217 g014
Figure 15. Filtered consumed power (blue) over time with average slope angle (red) during work in the Zelina steep slope vineyard. A segment of the vineyard navigation is zoomed in.
Electronics 11 00217 g015
Figure 16. Elevation profile with average profile for downhill, row change and uphill navigation, in red and magenta, right scale. Current slope and average slope for navigation downhill, between rows and uphill, in blue and cyan, left scale.
Electronics 11 00217 g016
Table 1. The list of selected HEKTOR system requirements.
HEKTOR System Requirements for Viticulture Scenarios
Terrain characteristicsATMM should function on slopes from 0 to 60%, on rocky, earthy or grass terrain.
Vineyard sizeThe estimated vineyard size for application of the HEKTOR system without human intervention is 1 ha, with an average planting height of 1.5 m and row spacing of 1.2–2 m.
Permissible flying heightAerial survey of vineyards should be carried out at a height of at least 10 m above the height of the plantation. When mapping vineyards, the maximum height depends on the area of the vineyard (≤30 m).
Reliable communicationThe operator’s system should communicate reliably with the HEKTOR system at a distance of 150 m.
ATMM LocalizationATMM should know its position in space with an accuracy of 10 cm.
Spraying efficiencyATMM should treat plantations with a speed of at least 0.7 m/s at a slope of up to 30%.
Bud rubbing efficiencyThe system shall achieve a bud rubbing rate of at least 20 vines per hour.
Battery capacityThe battery source should have at least the capacity of 48 V × 26 Ah.
Peak powerThe power source should provide a peak power of 2000 W.
Table 2. Input values of key robot system variables and parameters used for energy consumption estimation.
Input ValueNominal ValuesDescription
v m b (m/s)0.4defined driving speed of the mobile base
a m b (m/s 2 )1defined acceleration of the mobile base
P c (W)120constant power consumed in idle state
P v m b (W)160power used when mobile base moved with v m b
P t u r n (W)470average power when turning the mobile base in place
P a r m (W)36average power used by the robot arm
m (kg)100weight of the robot system
t b r (s)30average time needed for bud rubbing
t t u r n (s)9average time needed to turn in place by 90 degrees
Table 3. Parameters used for Jazbina vineyard model creation.
d i , j (m) w i (m) θ (deg) β (deg)
32.1010.0
Table 4. Estimated energy consumed by different systems during vineyard navigation, spraying and bud rubbing.
ComponentE (kWh) DrivingE (kWh) SprayingE (kWh) Bud Rubbing
E c 0.10210.12800.4963
E m b 0.17960.22640.1711
E a r m 0.03060.03121.8130
Total0.31230.38562.4804
Table 5. Parameters used for Zelina vineyard model creation.
d i , j (m) w i (m) θ (deg) β (deg)
13521.1
Table 6. Energy consumed during the experiments.
JazbinaZelina
Consumed energy385 Wh38.5 Wh
Battery usage30.1%3.1%
Average power341 W284 W
Table 7. Comparison of estimated and measured values.
ParameterJazbinaZelina
EstimatedMeasuredEstimatedMeasured
Slope17.6%
(10.0 degrees)
8.4%
(4.8 degrees)
38.6%
(21.1 degrees)
52.3%
(27.6 degrees)
Average total power366.9 W341.1 W335.8 W284.3 W
Total duration51.1 min67.8 min4.6 min8.1 min
Total consumed energy312.3 Wh385.4 Wh25.7 Wh38.5 Wh
Publisher’s Note: MDPI stays neutral with regard to jurisdictional claims in published maps and institutional affiliations.

