
A Novel Distributed Ledger Technology Structure for Wireless Sensor Networks Based on IOTA Tangle


Abstract
:1. Introduction
2. Background and Related Work
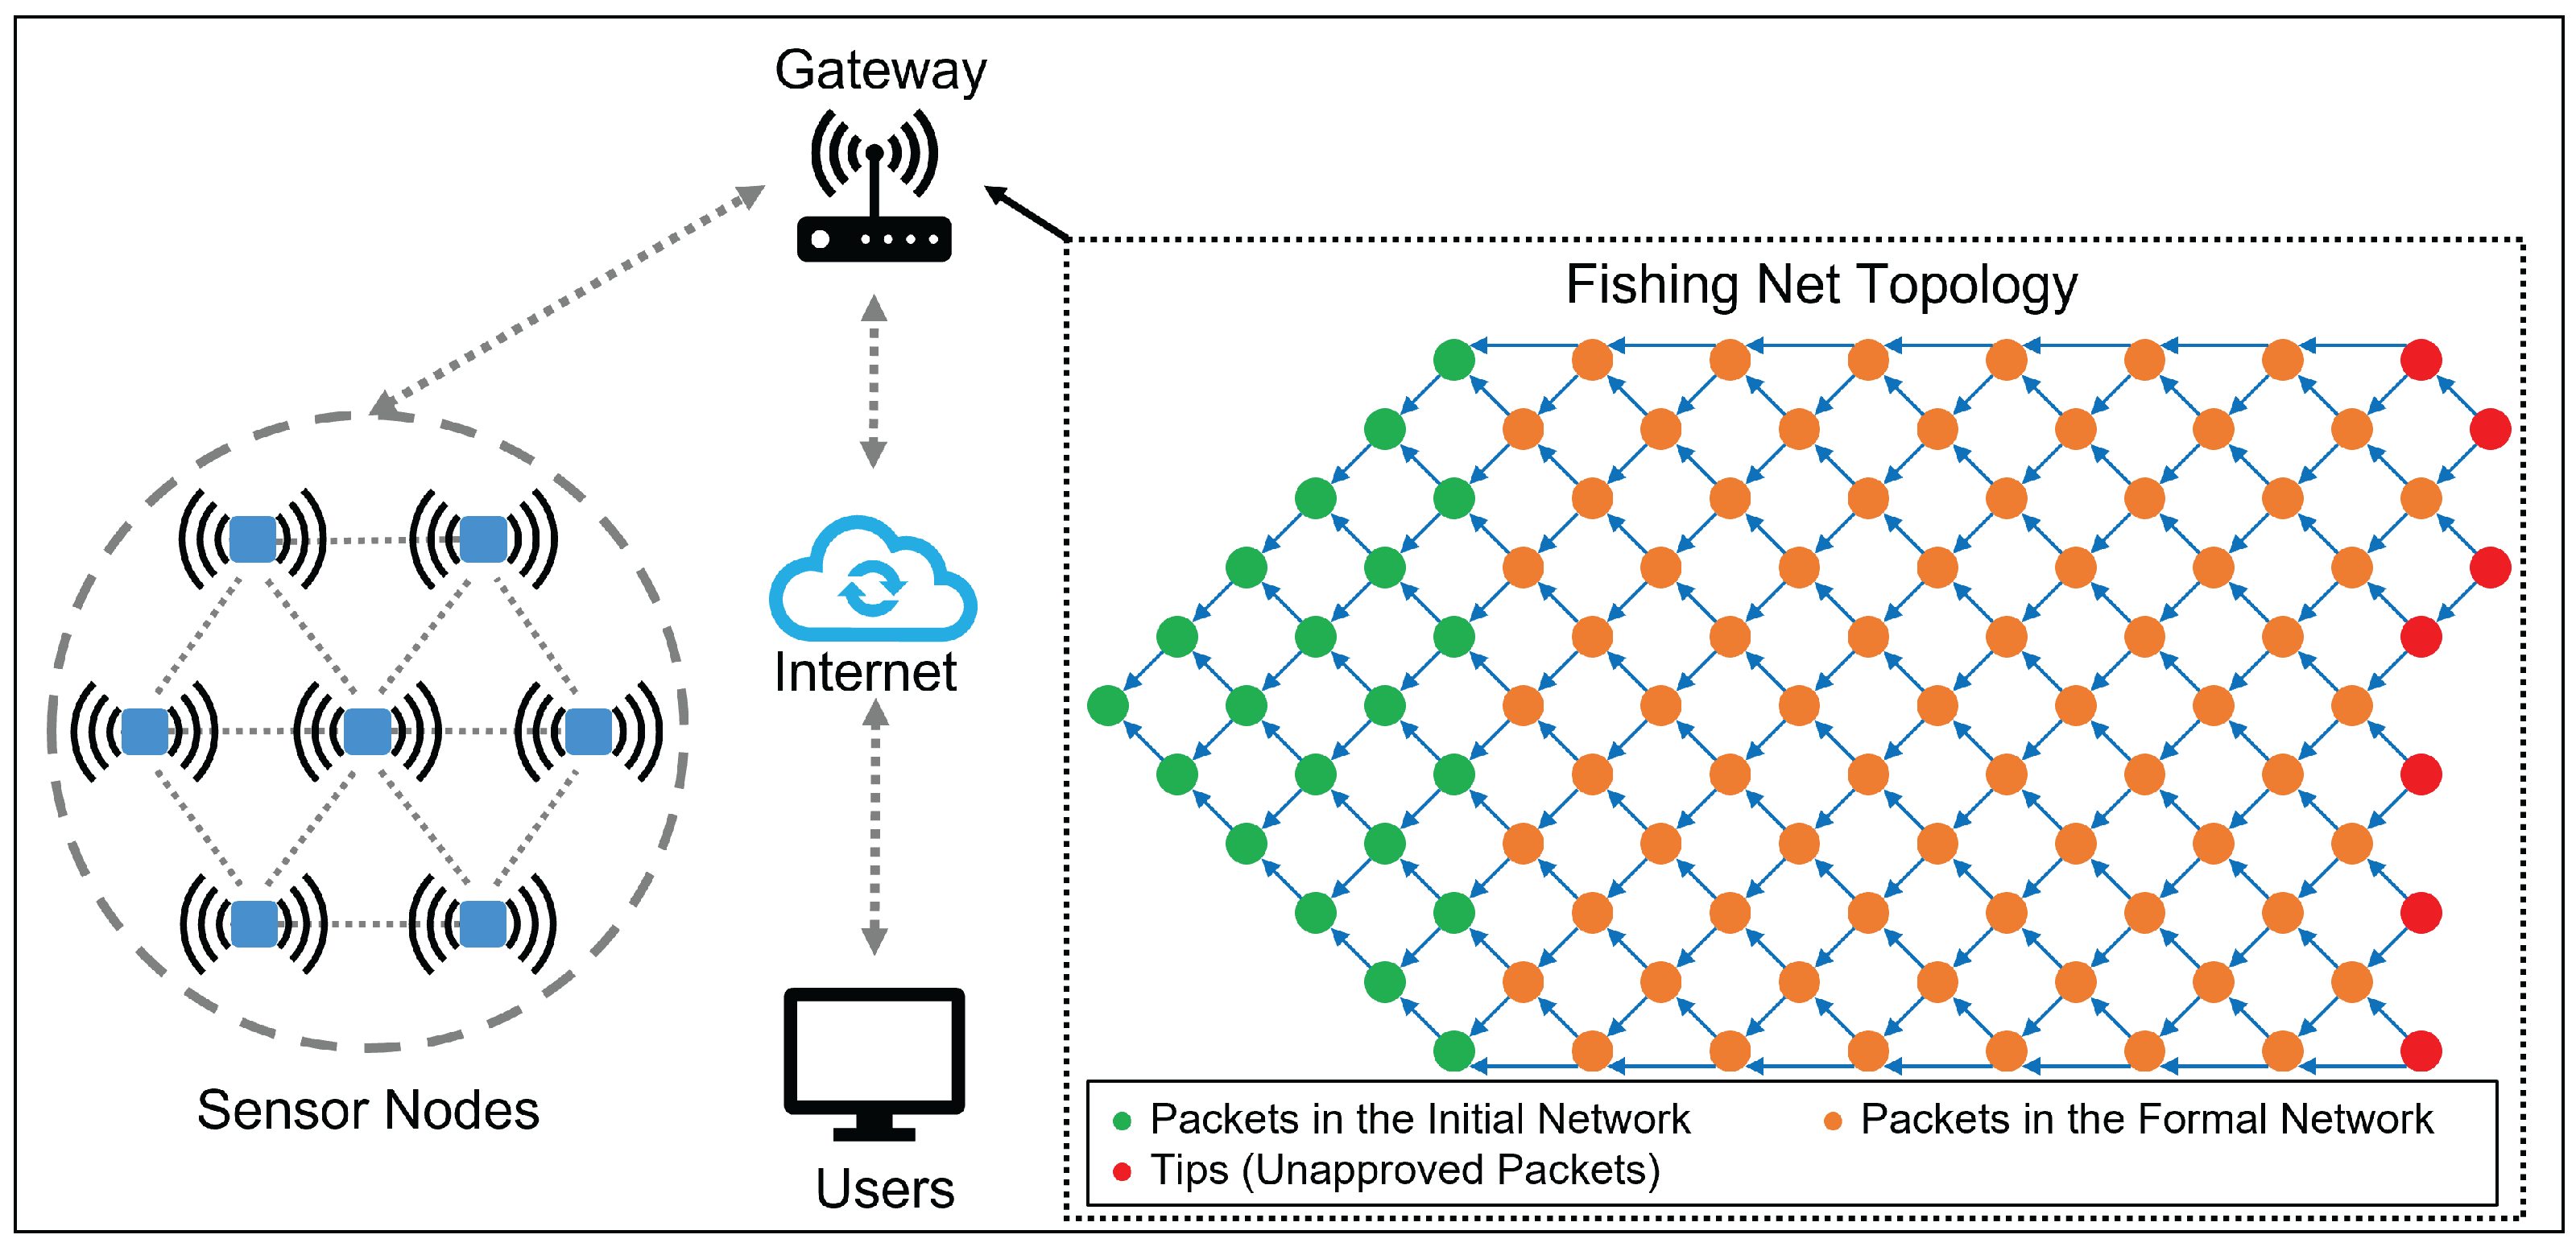
2.1. Wireless Sensor Networks
2.2. Internet of Things
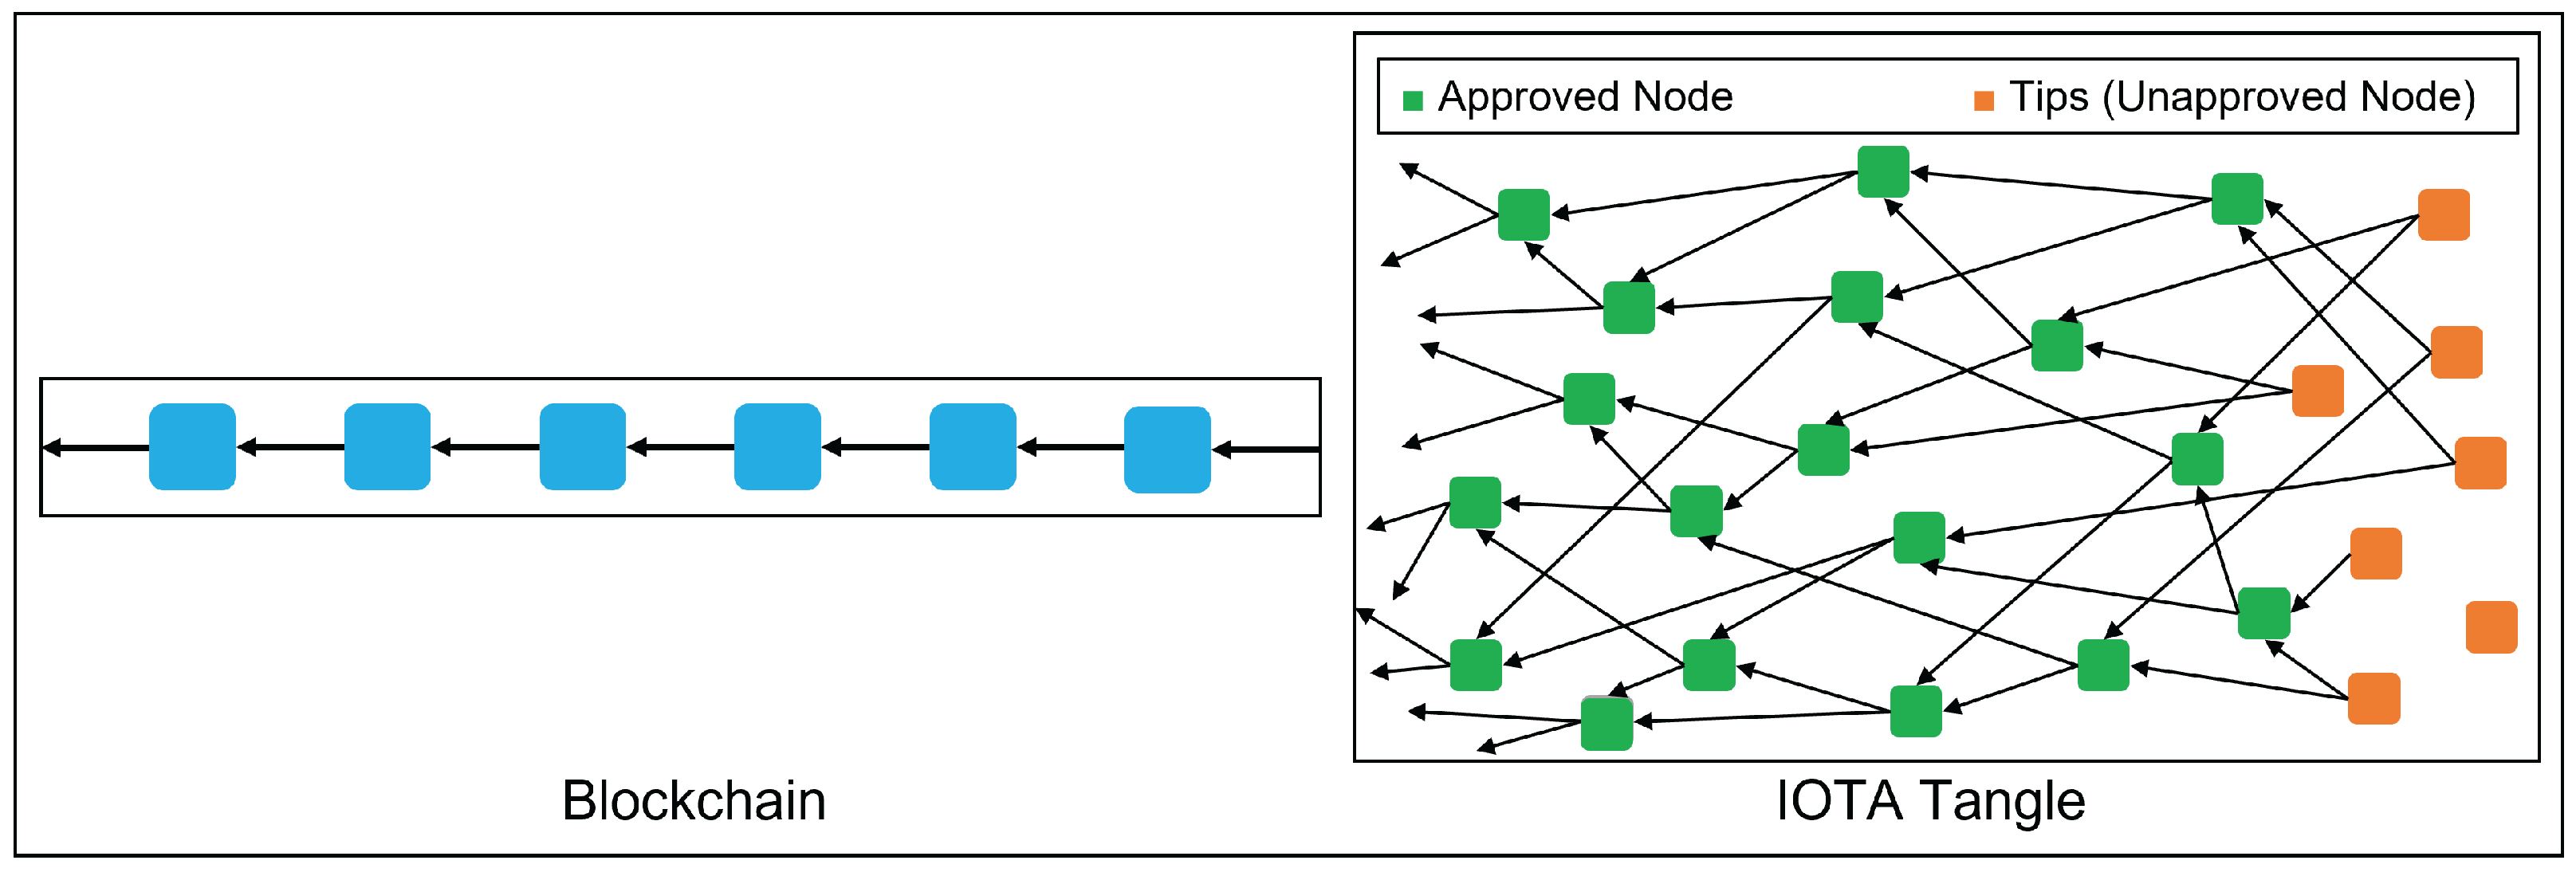
2.3. Distributed Ledger Technology and Blockchain
2.4. IOTA Tangle
2.5. Related Work
2.6. Problem Definition
3. Methodology
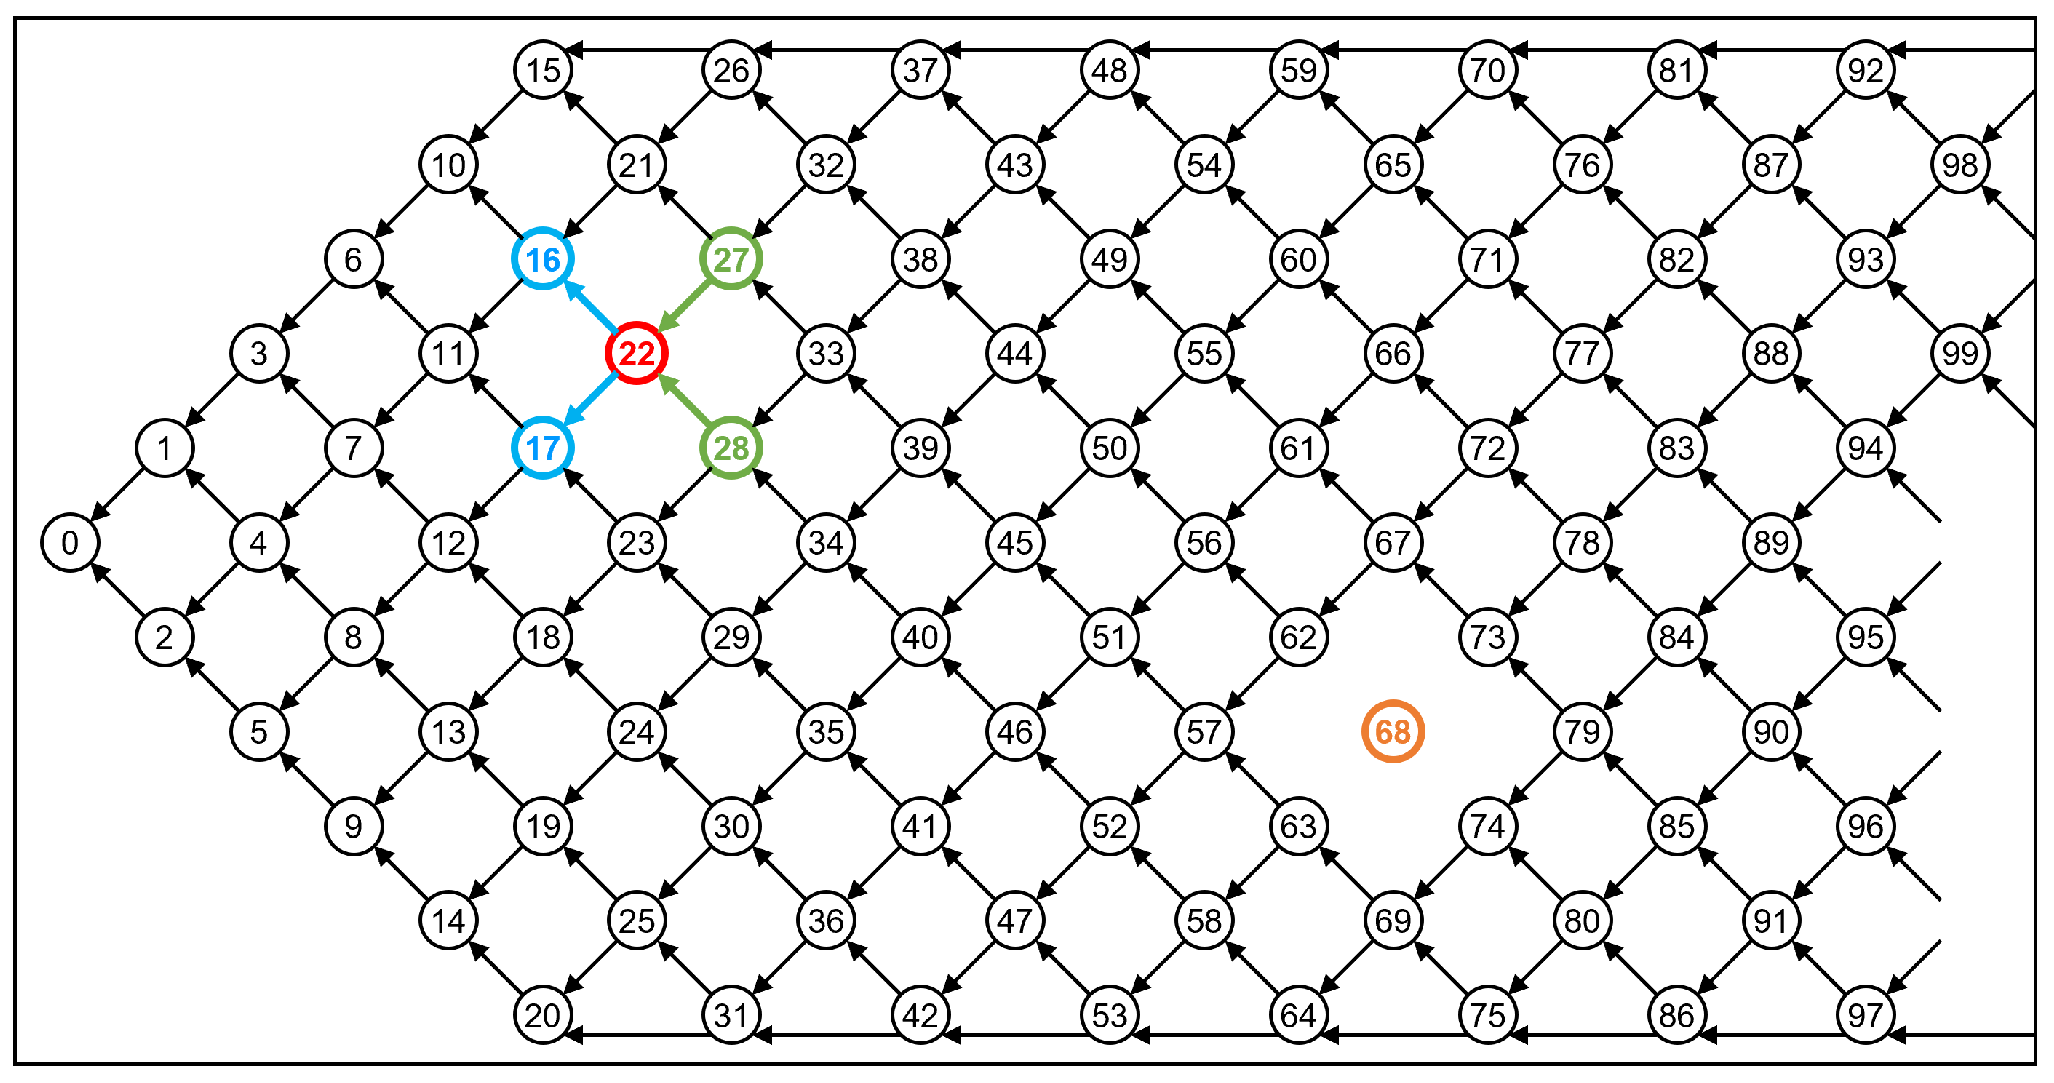
3.1. Fishing Net Topology
3.2. Terminology
3.2.1. Rate
3.2.2. Layer
3.2.3. Initial Network
3.2.4. Formal Network
3.3. FNT Node
3.3.1. FNT Node Structure
3.3.2. Tips and Approvers
3.4. FNT Node Detach
3.5. Tip Selection Algorithms
3.5.1. Tip Selection Algorithm in the Initial Network
3.5.2. Tip Selection Algorithm in the Formal Network
4. Results and Discussion
4.1. Compare with the Tangle
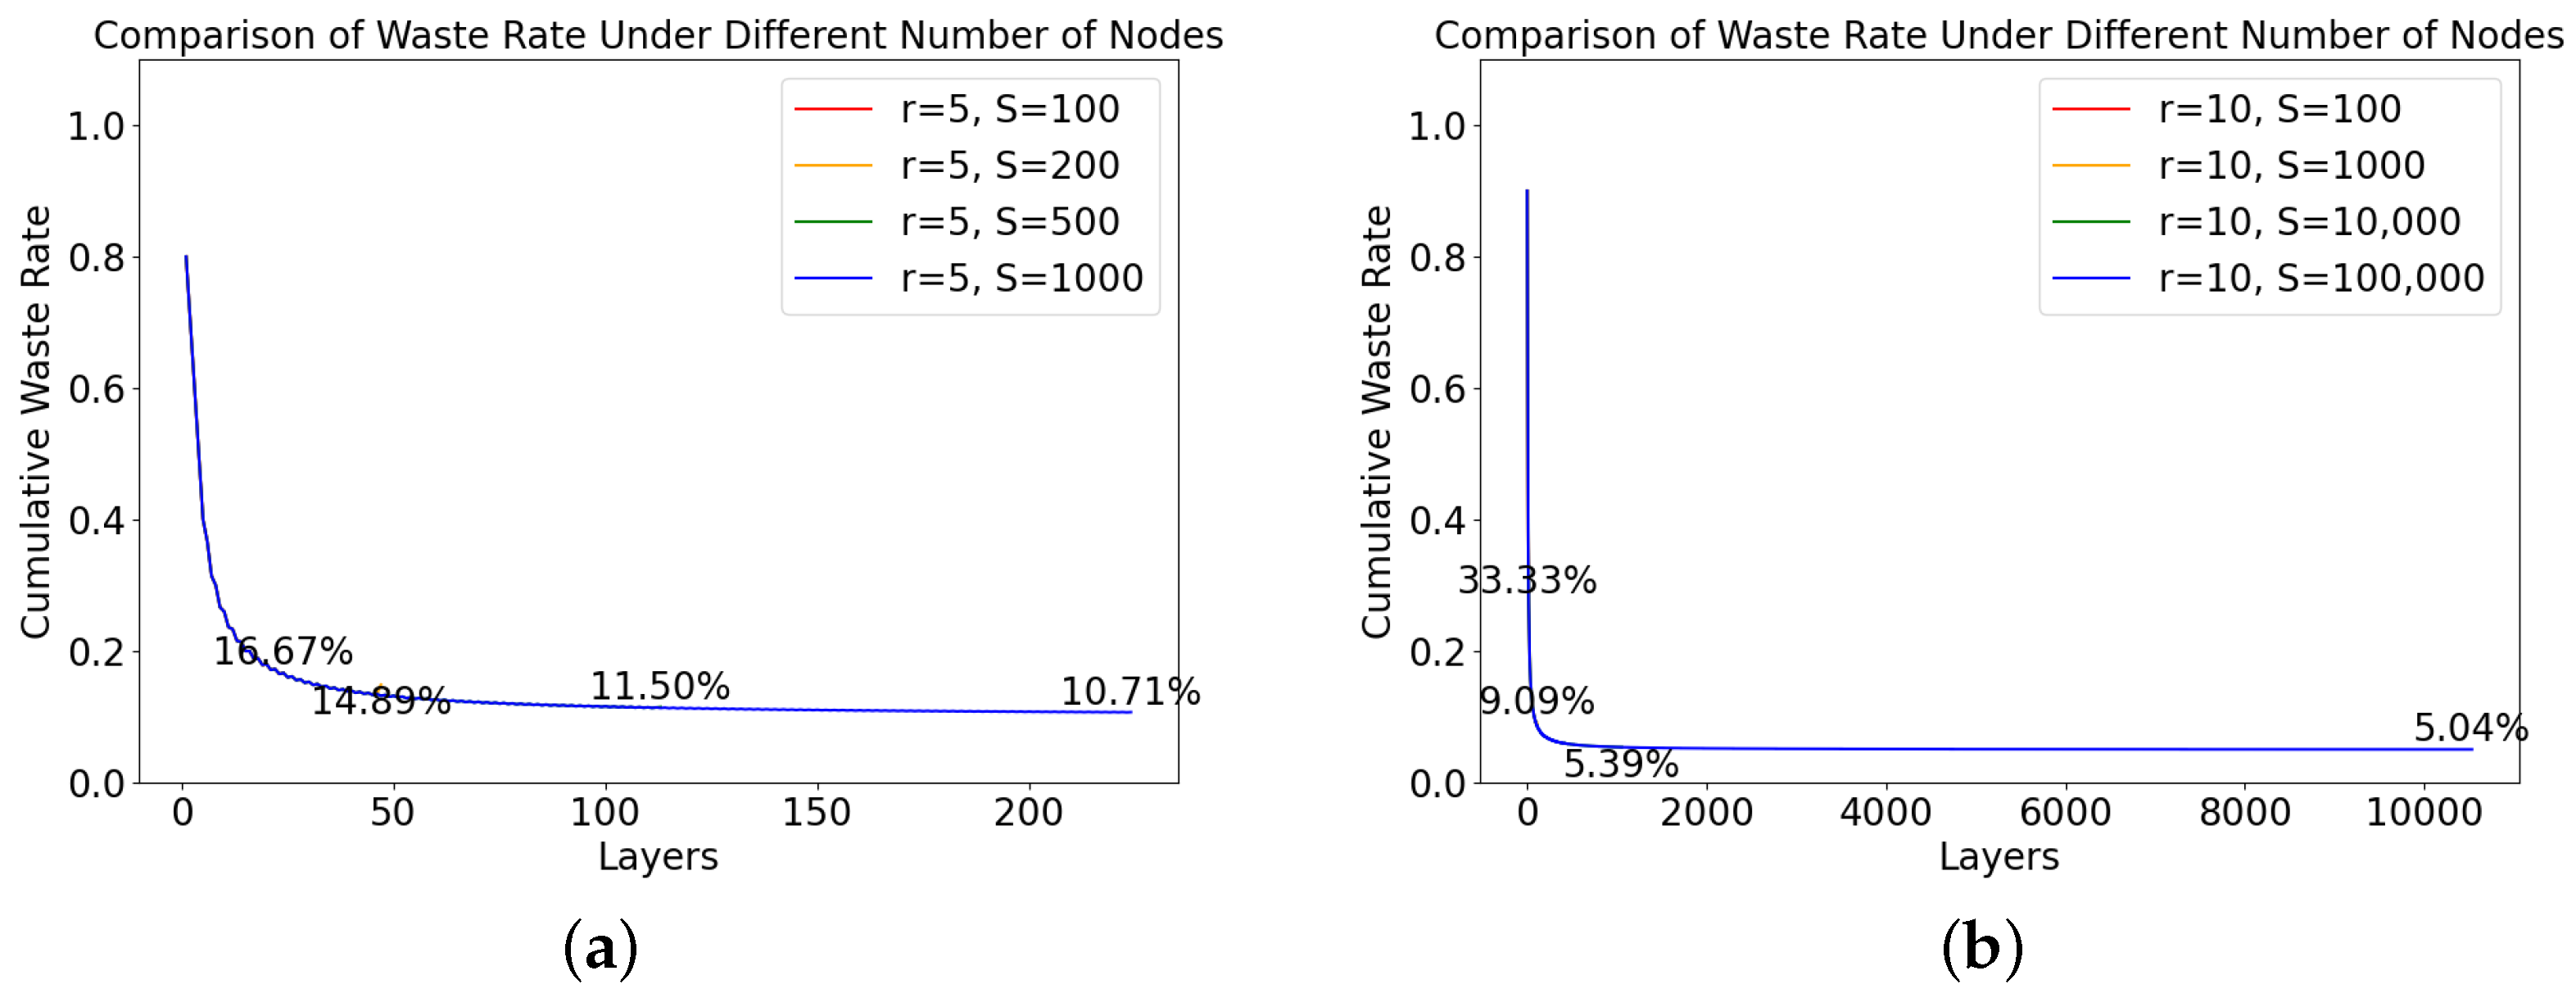
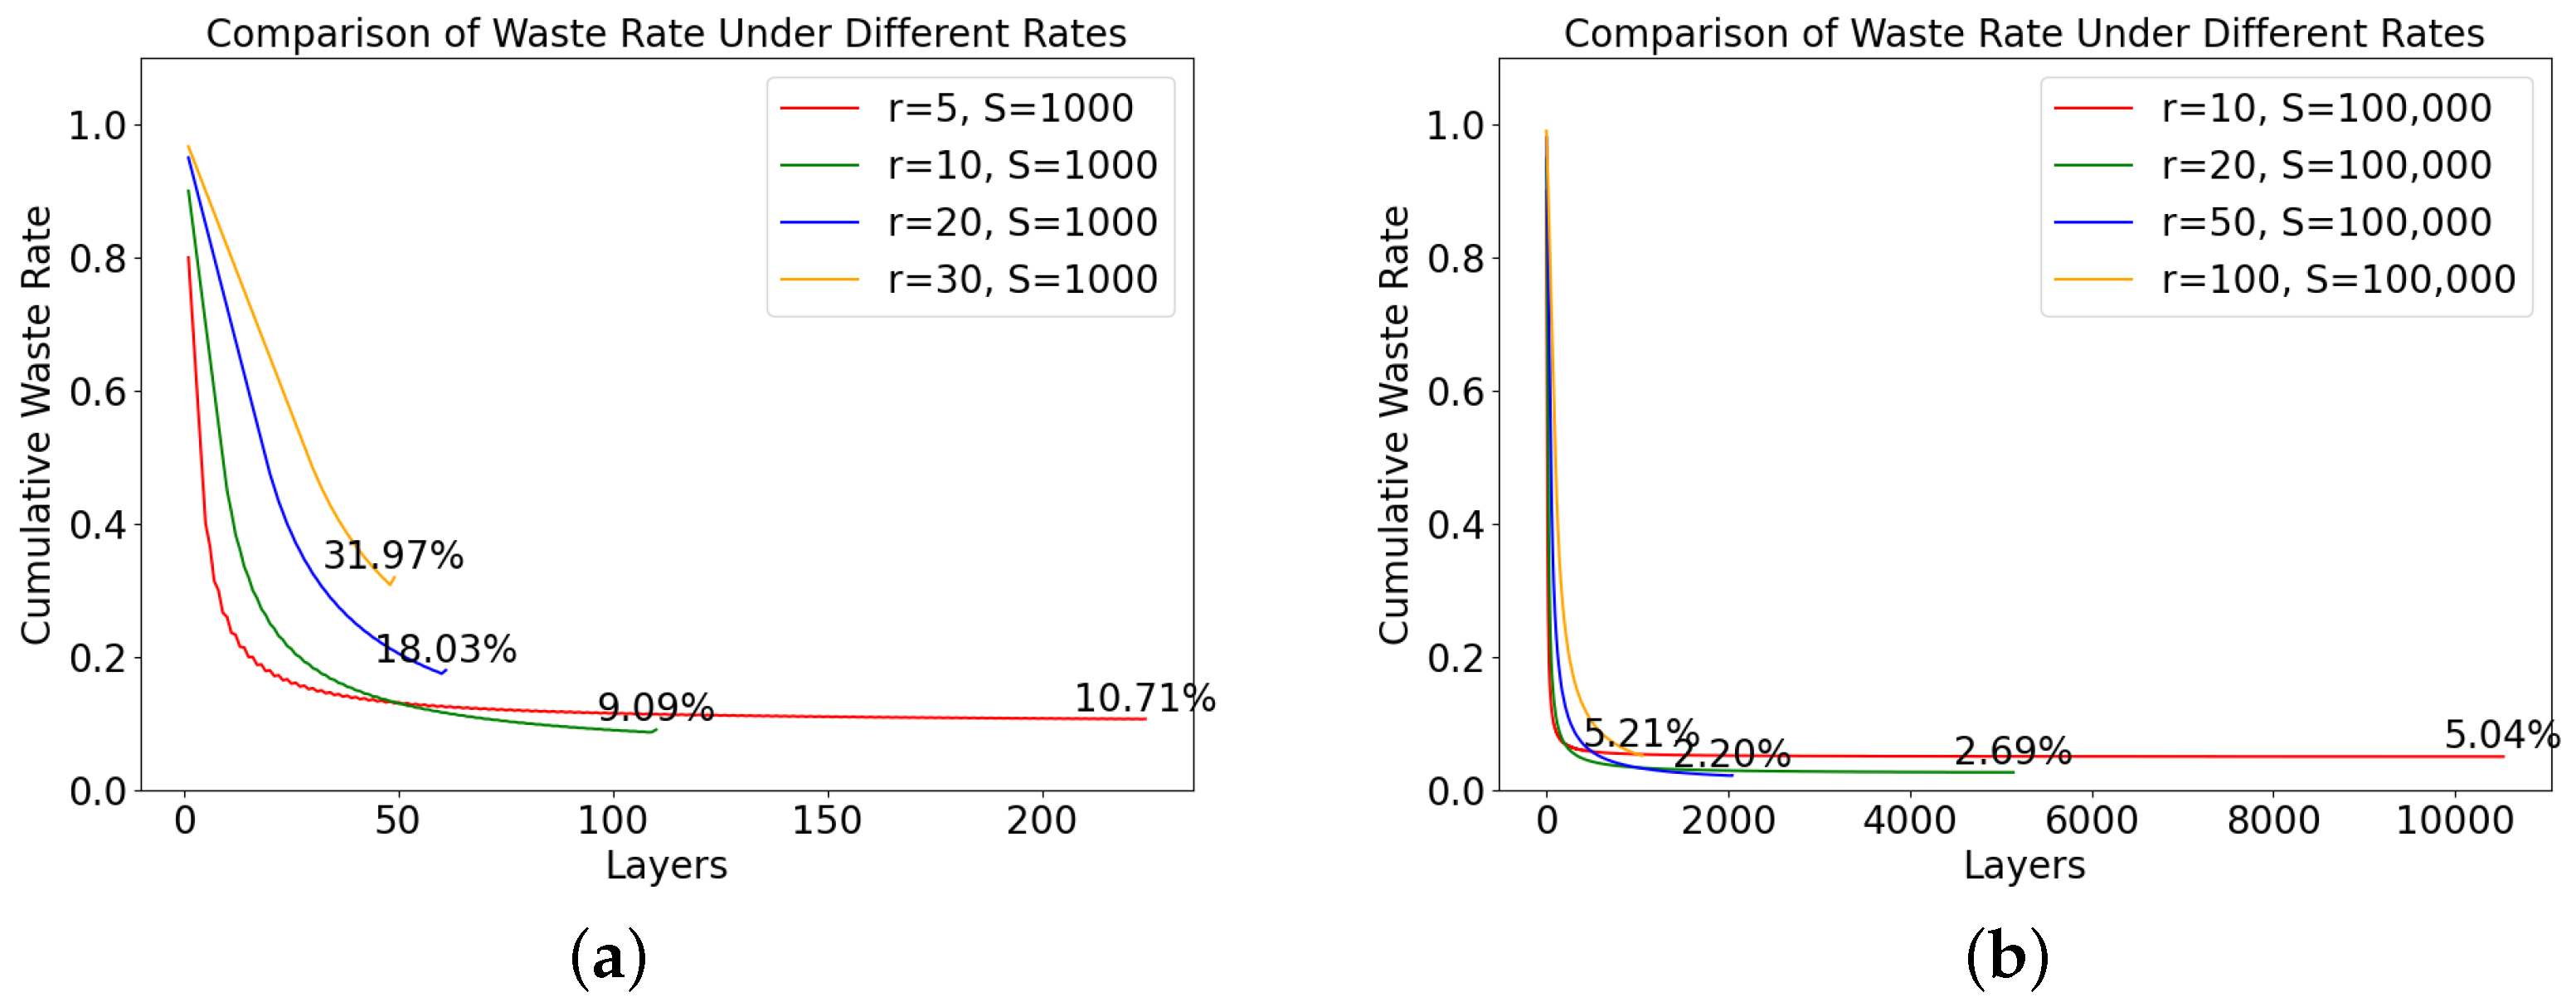
4.2. Waste Rate
4.3. Results
5. Conclusions and Recommendations
Author Contributions
Funding
Institutional Review Board Statement
Informed Consent Statement
Data Availability Statement
Conflicts of Interest
References
- Singh, M.K.; Amin, S.I.; Imam, S.A.; Sachan, V.K.; Choudhary, A. A Survey of Wireless Sensor Network and its types. In Proceedings of the 2018 International Conference on Advances in Computing, Communication Control and Networking (ICACCCN), Greater Noida, India, 12–13 October 2018; pp. 326–330. [Google Scholar] [CrossRef]
- Suciu, G.; Nădrag, C.; Istrate, C.; Vulpe, A.; Ditu, M.C.; Subea, O. Comparative Analysis of Distributed Ledger Technologies. In Proceedings of the 2018 Global Wireless Summit (GWS), Chiang Rai, Thailand, 25–28 November 2018; pp. 370–373. [Google Scholar] [CrossRef]
- Antal, C.; Cioara, T.; Anghel, I.; Antal, M.; Salomie, I. Distributed ledger technology review and decentralized applications development guidelines. Future Internet 2021, 13, 62. [Google Scholar] [CrossRef]
- Bouras, M.A.; Lu, Q.; Zhang, F.; Wan, Y.; Zhang, T.; Ning, H. Distributed ledger technology for eHealth identity privacy: State of the art and future perspective. Sensors 2020, 20, 483. [Google Scholar] [CrossRef] [PubMed] [Green Version]
- Bhandary, M.; Parmar, M.; Ambawade, D. A Blockchain Solution based on Directed Acyclic Graph for IoT Data Security using IoTA Tangle. In Proceedings of the 2020 5th International Conference on Communication and Electronics Systems (ICCES), Coimbatore, India, 10–12 June 2020; pp. 827–832. [Google Scholar] [CrossRef]
- Shabandri, B.; Maheshwari, P. Enhancing IoT Security and Privacy Using Distributed Ledgers with IOTA and the Tangle. In Proceedings of the 2019 6th International Conference on Signal Processing and Integrated Networks (SPIN), Noida, India, 7–8 March 2019; pp. 1069–1075. [Google Scholar] [CrossRef]
- Khalil, N.; Abid, M.R.; Benhaddou, D.; Gerndt, M. Wireless sensors networks for Internet of Things. In Proceedings of the 2014 IEEE Ninth International Conference on Intelligent Sensors, Sensor Networks and Information Processing (ISSNIP), Singapore, 21–24 April 2014; pp. 1–6. [Google Scholar] [CrossRef] [Green Version]
- Numan, M.; Subhan, F.; Khan, W.Z.; Hakak, S.; Haider, S.; Reddy, G.T.; Jolfaei, A.; Alazab, M. A Systematic Review on Clone Node Detection in Static Wireless Sensor Networks. IEEE Access 2020, 8, 65450–65461. [Google Scholar] [CrossRef]
- Zawaideh, F.; Salamah, M. An efficient weighted trust-based malicious node detection scheme for wireless sensor networks. Int. J. Commun. Syst. 2019, 32, e3878. [Google Scholar] [CrossRef]
- Ram Prabha, V.; Latha, P. Fuzzy trust protocol for malicious node detection in wireless sensor networks. Wirel. Pers. Commun. 2017, 94, 2549–2559. [Google Scholar] [CrossRef]
- Zia, T.; Zomaya, A. Security Issues in Wireless Sensor Networks. In Proceedings of the 2006 International Conference on Systems and Networks Communications (ICSNC’06), Tahiti, French Polynesia, 29 October–3 November 2006; p. 40-40. [Google Scholar] [CrossRef]
- Salau, A.O.; Marriwala, N.; Athaee, M. Data security in wireless sensor networks: Attacks and countermeasures. In Mobile Radio Communications and 5G Networks; Springer: Berlin/Heidelberg, Germany, 2021; pp. 173–186. [Google Scholar]
- Du, X.; Chen, H.-H. Security in wireless sensor networks. IEEE Wirel. Commun. 2008, 15, 60–66. [Google Scholar] [CrossRef]
- binti Mohamad Noor, M.; Hassan, W.H. Current research on Internet of Things (IoT) security: A survey. Comput. Netw. 2019, 148, 283–294. [Google Scholar] [CrossRef]
- Da Xu, L.; He, W.; Li, S. Internet of things in industries: A survey. IEEE Trans. Ind. Inform. 2014, 10, 2233–2243. [Google Scholar]
- Zanella, A.; Bui, N.; Castellani, A.; Vangelista, L.; Zorzi, M. Internet of Things for Smart Cities. IEEE Internet Things J. 2014, 1, 22–32. [Google Scholar] [CrossRef]
- Porkodi, R.; Bhuvaneswari, V. The internet of things (IOT) applications and communication enabling technology standards: An overview. In Proceedings of the 2014 International Conference on Intelligent Computing Applications, Coimbatore, India, 6–7 March 2014; pp. 324–329. [Google Scholar]
- Elijah, O.; Rahman, T.A.; Orikumhi, I.; Leow, C.Y.; Hindia, M.N. An Overview of Internet of Things (IoT) and Data Analytics in Agriculture: Benefits and Challenges. IEEE Internet Things J. 2018, 5, 3758–3773. [Google Scholar] [CrossRef]
- Adamu, A.A.; Wang, D.; Salau, A.O.; Ajayi, O. An integrated IoT system pathway for smart cities. Int. J. Emerg. Technol. 2020, 11, 1–9. [Google Scholar]
- Salau, A.O.; Chettri, L.; Bhutia, T.K.; Lepcha, M. IoT based smart digital electric meter for home appliances. In Proceedings of the 2020 International Conference on Decision Aid Sciences and Application (DASA), Sakheer, Bahrain, 8–9 November 2020; pp. 708–713. [Google Scholar]
- Rana, A.K.; Salau, A.O.; Sharma, S.; Tayal, S.; Gupta, S. Internet of Things: Energy, Industry, and Healthcare; CRC Press: Boca Raton, FL, USA, 2021. [Google Scholar]
- Farahani, B.; Firouzi, F.; Luecking, M. The convergence of IoT and distributed ledger technologies (DLT): Opportunities, challenges, and solutions. J. Netw. Comput. Appl. 2021, 177, 102936. [Google Scholar] [CrossRef]
- Akhtar, Z. From blockchain to hashgraph: Distributed ledger technologies in the wild. In Proceedings of the 2019 International Conference on Electrical, Electronics and Computer Engineering (UPCON), Aligarh, India, 8–10 November 2019; pp. 1–6. [Google Scholar]
- Chatterjee, R.; Chatterjee, R. An Overview of the Emerging Technology: Blockchain. In Proceedings of the 2017 3rd International Conference on Computational Intelligence and Networks (CINE), Odisha, India, 28 October 2017; pp. 126–127. [Google Scholar] [CrossRef]
- Zheng, Z.; Xie, S.; Dai, H.; Chen, X.; Wang, H. An Overview of Blockchain Technology: Architecture, Consensus, and Future Trends. In Proceedings of the 2017 IEEE International Congress on Big Data (BigData Congress), Honolulu, HI, USA, 25–30 June 2017; pp. 557–564. [Google Scholar] [CrossRef]
- Viriyasitavat, W.; Hoonsopon, D. Blockchain characteristics and consensus in modern business processes. J. Ind. Inf. Integr. 2019, 13, 32–39. [Google Scholar] [CrossRef]
- Abou Jaoude, J.; George Saade, R. Blockchain Applications – Usage in Different Domains. IEEE Access 2019, 7, 45360–45381. [Google Scholar] [CrossRef]
- Li, X.; Jiang, P.; Chen, T.; Luo, X.; Wen, Q. A survey on the security of blockchain systems. Future Gener. Comput. Syst. 2020, 107, 841–853. [Google Scholar] [CrossRef] [Green Version]
- Guo, F.; Xiao, X.; Hecker, A.; Dustdar, S. Characterizing IOTA Tangle with Empirical Data. In Proceedings of the GLOBECOM 2020-2020 IEEE Global Communications Conference, Taipei, Taiwan, 7–11 December 2020; pp. 1–6. [Google Scholar] [CrossRef]
- Silvano, W.F.; Marcelino, R. Iota Tangle: A cryptocurrency to communicate Internet-of-Things data. Future Gener. Comput. Syst. 2020, 112, 307–319. [Google Scholar] [CrossRef]
- Kusmierz, B.; Staupe, P.; Gal, A. Extracting Tangle Properties in Continuous Time via Large-Scale Simulations. Technical Report. Working Paper. 2018. Available online: https://assets.ctfassets.net/r1dr6vzfxhev/4T4IAlxk9ym0eWco0UoQIQ/90094e746745b89253eb3636b4ad1597/Extracting_Tangle_Properties_in_Continuous_Time_via_Large_Scale_Simulations_V2.pdf (accessed on 10 May 2022).
- Hao, Y.; Li, Y.; Dong, X.; Fang, L.; Chen, P. Performance Analysis of Consensus Algorithm in Private Blockchain. In Proceedings of the 2018 IEEE Intelligent Vehicles Symposium (IV), Changshu, China, 26–30 June 2018; pp. 280–285. [Google Scholar] [CrossRef]
- Zhou, Z.; Li, R.; Cao, Y.; Zheng, L.; Xiao, H. Dynamic Performance Evaluation of Blockchain Technologies. IEEE Access 2020, 8, 217762–217772. [Google Scholar] [CrossRef]
- Fan, C.; Ghaemi, S.; Khazaei, H.; Musilek, P. Performance Evaluation of Blockchain Systems: A Systematic Survey. IEEE Access 2020, 8, 126927–126950. [Google Scholar] [CrossRef]
- Schueffel, P. Alternative Distributed Ledger Technologies Blockchain vs. Tangle vs. Hashgraph-A High-Level Overview and Comparison. Tangle vs. Hashgraph-A High-Level Overview and Comparison (15 December 2017). 2017. Available online: https://papers.ssrn.com/sol3/papers.cfm?abstract_id=3144241 (accessed on 28 June 2022).
- Ali, M.S.; Vecchio, M.; Pincheira, M.; Dolui, K.; Antonelli, F.; Rehmani, M.H. Applications of Blockchains in the Internet of Things: A Comprehensive Survey. IEEE Commun. Surv. Tutor. 2019, 21, 1676–1717. [Google Scholar] [CrossRef]
- Pincheira, M.; Vecchio, M. Towards Trusted Data on Decentralized IoT Applications: Integrating Blockchain in Constrained Devices. In Proceedings of the 2020 IEEE International Conference on Communications Workshops (ICC Workshops), Dublin, Ireland, 7–11 June 2020; pp. 1–6. [Google Scholar] [CrossRef]
- Pincheira, M.; Vecchio, M.; Giaffreda, R. Benchmarking Constrained IoT Devices in Blockchain-Based Agri-Food Traceability Applications. In International Congress on Blockchain and Applications; Springer: Berlin/Heidelberg, Germany, 2021; pp. 212–221. [Google Scholar]
- Pincheira, M.; Vecchio, M.; Giaffreda, R.; Kanhere, S.S. Exploiting constrained IoT devices in a trustless blockchain-based water management system. In Proceedings of the 2020 IEEE International Conference on Blockchain and Cryptocurrency (ICBC), Toronto, ON, Canada, 2–6 May 2020; pp. 1–7. [Google Scholar] [CrossRef]
- Worlu, C.; Jamal, A.A.; Mahiddin, N.A. Wireless sensor networks, internet of things, and their challenges. Int. J. Innov. Technol. Explor. Eng. 2019, 8, 556–566. [Google Scholar]
- Nghia, M. TangleSimulator. 2018. Available online: https://github.com/minh-nghia/TangleSimulator (accessed on 10 May 2022).


| Features | Blockchain Technology | IOTA Tangle |
|---|---|---|
| Decentralized | Yes | Yes |
| Distributed | Yes | Yes |
| Tamper-proof | Yes | Yes |
| Scalability | Low | High |
| Latency | High | Low |
| Mining Process | Yes | No |
| Transaction Fee | Yes | No |
| Processing Time | Long | Short |
| Efficiency (transactions per second) | 3–4 | 500–800 |
| Suitable Transaction Type | General Transactions | Small Transactions |
| Transaction Validation | Miner | Self-validation |
| Throughput | Low | High |
| Resource Requirements | High | Low |
| Consensus (Proof of Work) | SHA256-Hash | Check Tangle Tips |
| Openness | Public Ledger | Public Ledger |
| WR | S = 100 | S = 1000 | S = 10,000 | S = 100,000 | S = 1,000,000 |
|---|---|---|---|---|---|
| r = 5 | 16.2791% | 10.6700% | 10.0674% | 10.0067% | 10.0007% |
| r = 6 | 18.1548% | 9.4203% | 8.4432% | 8.3443% | 8.3344% |
| r = 10 | 32.1429% | 8.6538% | 5.3785% | 5.0380% | 5.0038% |
| r = 15 | 51.0549% | 11.9210% | 4.2667% | 3.4275% | 3.3428% |
| r = 20 | 65.1786% | 17.3729% | 4.2240% | 2.6752% | 2.5175% |
| r = 25 | 74.7097% | 23.8835% | 4.7388% | 2.2809% | 2.0282% |
| r = 30 | 81.0897% | 30.7512% | 5.6302% | 2.0779% | 1.7079% |
| r = 50 | 92.3846% | 55.0000% | 11.6071% | 2.1739% | 1.1187% |
| r = 100 | 98.0100% | 83.1356% | 33.2215% | 5.1478% | 0.9852% |
| r = 120 | 98.6130% | 87.6753% | 41.6959% | 7.0010% | 1.1168% |
| r = 150 | 99.1101% | 91.7631% | 52.7646% | 10.2910% | 1.4275% |
| r = 200 | 99.4987% | 95.2043% | 66.5268% | 16.7362% | 2.1867% |
| r = 500 | 99.9198% | 99.2040% | 92.5725% | 55.5011% | 11.1605% |
| r = 600 | 99.9443% | 99.4461% | 94.7246% | 64.2388% | 15.2818% |
| r = 700 | 99.9591% | 99.5926% | 96.0704% | 70.9763% | 19.6909% |
| r = 800 | 99.9687% | 99.6879% | 96.9642% | 76.1599% | 24.2439% |
| r = 900 | 99.9753% | 99.7533% | 97.5865% | 80.1737% | 28.8196% |
| r = 1000 | 99.9800% | 99.8001% | 98.0363% | 83.3139% | 33.3222% |
Publisher’s Note: MDPI stays neutral with regard to jurisdictional claims in published maps and institutional affiliations. |
© 2022 by the authors. Licensee MDPI, Basel, Switzerland. This article is an open access article distributed under the terms and conditions of the Creative Commons Attribution (CC BY) license (https://creativecommons.org/licenses/by/4.0/).
Share and Cite
Zhang, H.; Zaman, M.; Stacey, B.; Sampalli, S. A Novel Distributed Ledger Technology Structure for Wireless Sensor Networks Based on IOTA Tangle. Electronics 2022, 11, 2403. https://doi.org/10.3390/electronics11152403
Zhang H, Zaman M, Stacey B, Sampalli S. A Novel Distributed Ledger Technology Structure for Wireless Sensor Networks Based on IOTA Tangle. Electronics. 2022; 11(15):2403. https://doi.org/10.3390/electronics11152403
Chicago/Turabian StyleZhang, Hongwei, Marzia Zaman, Brian Stacey, and Srinivas Sampalli. 2022. "A Novel Distributed Ledger Technology Structure for Wireless Sensor Networks Based on IOTA Tangle" Electronics 11, no. 15: 2403. https://doi.org/10.3390/electronics11152403
APA StyleZhang, H., Zaman, M., Stacey, B., & Sampalli, S. (2022). A Novel Distributed Ledger Technology Structure for Wireless Sensor Networks Based on IOTA Tangle. Electronics, 11(15), 2403. https://doi.org/10.3390/electronics11152403