Abstract
With the development of the Internet of Things technology, higher requirements are put forward for the positioning accuracy of objects. This paper presents an indoor fusion positioning algorithm based on the 5th Generation Mobile Communication Technology (5G), which effectively solves two problems. The first is that fingerprint positioning is susceptible to environmental changes and results in inaccurate fingerprint matching. The second is the problem of the hyperbolic positioning algorithm based on the line-of-sight fluctuating too much in complex indoor environments. This paper uses a 5G flexible subcarrier interval of Orthogonal Frequency Division Multiplexing (OFDM) to significantly reduce the time delay error of Time Of Arrival (TOA), and an improved genetic algorithm and the weighted hyperbolic algorithm are used to estimate the optimal position coordinates. In the offline database establishment stage of fingerprint positioning, the Channel State Information-reference signal (CSI-RS) of multiple-beam sets provides high-dimensional information for subsequent training and prediction. The online stage cooperates with the improved residual network model to make predictions. Finally, the positioning information and the error distribution function generated by the two positioning processes are simultaneously used as the input of the Kalman filter to obtain the precise position coordinates. The simulation results show that in complex indoor scenes where line-of-sight propagation and non-line-of-sight propagation paths are mixed, the accuracy of this method can reach below 0.82 m. Thus, the positioning accuracy is significantly improved compared with other methods, which can meet most indoor scene positioning needs.
1. Introduction
The use of modern smart devices often requires high precision positioning information. In complex indoor environments, the positioning accuracy is reduced due to Global Positioning System (GPS) signal attenuation. The current mainstream indoor positioning technologies mainly include indoor positioning systems based on Bluetooth, radar, computer vision and WIFI [1]. Among them, due to the limitation of the speed and coverage of the Bluetooth signal, the Bluetooth-based indoor positioning system cannot be widely used [2], and the cost of the radar-based indoor positioning system is too high. However, the 5th Generation Mobile Communication Technology (5G)-based positioning method benefits from its service-based network architecture, ultra-dense cell planning, flexible carrier selection and beamforming technology; hence, it can adapt to complex indoor scenes [3,4]. For example, the literature [5] designs and implements a 5G-based wireless optical positioning system, using wireless optical measurement technology, which can obtain position estimates through multilateral calculations and then put the positioning data into 5G wireless frames for transmission. El Boudani et al. [6] proposed a 5G indoor positioning model based on Deep Learning-based CooperaTive Architecture (DELTA), which surpassed traditional machine learning methods such as K-means and Support Vector Machines (SVM) [7,8]. The positioning accuracy of the algorithm is stable within 1.5 m. However, these algorithms all use a single beam to collect sample points, which cannot meet the real environment’s complex and changeable indoor scenes. At the same time, only a single algorithm is used, which cannot meet the algorithm’s robustness.
The algorithm proposed in this paper uses ultra-dense networking, Massive Multiple Input Multiple Output (MIMO) and hybrid beamforming technology in 5G to enhance the reference signal quality of the hyperbolic positioning algorithm while reducing the Time Of Arrival (TOA) delay error. The weighted hyperbolic algorithm of the improved genetic algorithm [9] improves the accuracy of hyperbolic positioning. The multi-beam Channel State Information-reference signal (CSI-RS) provides more high-dimensional information for sample features and improves the information richness of the fingerprint positioning database. The Kalman filter of the fusion algorithm enhances the overall algorithm’s positioning accuracy and improves the positioning algorithm’s robustness.
2. Algorithmic Framework
The main steps of the algorithm proposed in this paper are shown in Figure 1, which are fingerprint algorithm, hyperbolic algorithm and Kalman filter fusion algorithm.
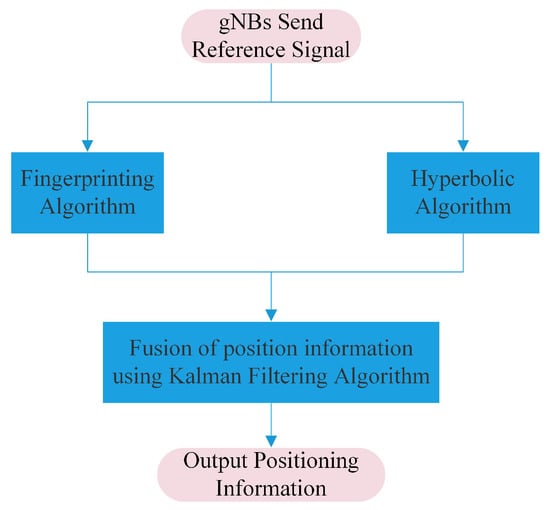
Figure 1.
Schematic diagram of the main steps of the algorithm.
The system flow chart of the indoor positioning method proposed in this paper is shown in Figure 2, which mainly includes three parts: multiple base stations simultaneously transmit multi-beams, including CSI-RS and the Positioning Reference Signal (PRS). The first part uses the fingerprint positioning algorithm to calculate a corresponding set of position coordinates. The User Equipment (UE) measures the CSI-RS signal of the 5G downlink channel and combines the CSI-RS measurement value matrix to obtain a single fingerprint sample. The second part uses the ultra-high Sub-Carrier Spacing (SCS) of 5G to reduce the TOA delay. Then, we calculate the Reference Signal Time Difference (RSTD) value between gNodeBs (gNBs) and use the weighted hyperbolic algorithm based on the improved genetic algorithm to calculate another set of location coordinates. Finally, we use the existing two sets of coordinates and the corresponding distance error probability density distribution function, and then, we use the Kalman filter algorithm to obtain a more accurate fusion positioning result as the final positioning coordinate point. In addition, there is a significant improvement in the algorithm’s robustness.
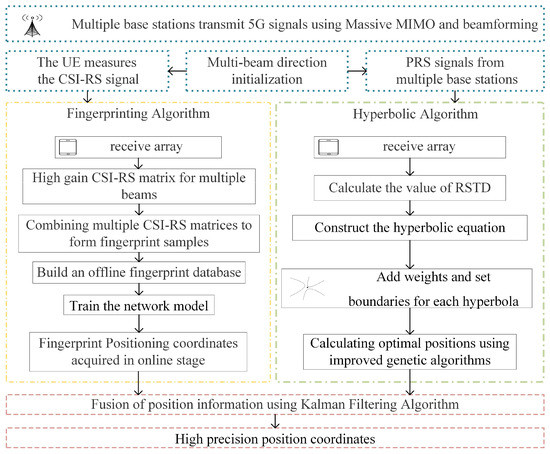
Figure 2.
System flow chart.
3. Multi-Beam Fingerprinting Algorithm
The fingerprint positioning in the algorithm in this paper is mainly divided into two stages. The first stage is the offline stage, which is used to build the CSI-RS signal multi-beam fingerprint database used for model training and verification; the second stage is the online positioning stage. In the related indoor positioning technologies, the traditional fingerprint positioning method usually uses fingerprint positioning based on WIFI. Still, the WIFI fingerprint positioning technology is limited by the performance of the WIFI repeater in the current indoor environment. Therefore, there are disadvantages, such as insufficient bandwidth, low signal gain, small coverage, and poor real-time performance. The WIFI fingerprint indoor positioning method may have a large positioning error when the indoor environment is relatively complex. At the same time, when there are too many positioning devices, there will be insufficient bandwidth so that it cannot be applied to many existing indoor positioning scenarios in many cases. In addition, traditional wireless communication, such as Long-Term Evolution (LTE), etc., due to the antenna power and problems such as transmission distance, will have a large attenuation in the indoor environment [10], so the LTE signal can hardly meet the positioning needs indoors. Because of the disadvantages of the above two methods, this paper uses the multi-beam fingerprint positioning method based on 5G. It uses the high-gain millimeter-wave signal brought by the dense array beamforming technology in the 5G signal to lay the foundation for the high-quality signal required for indoor positioning. Secondly, the multi-beam set CSI-RS enriches the sample fingerprint information, improving the model’s accuracy and achieving the effect of accurate positioning. At the same time, thanks to the deployment of 5G ultra-dense cells, the receiver can receive signals from multiple transmitters. The continuity of the signal is ensured while obtaining a large amount of useful information.
3.1. Construction of Fingerprint Database in Offline Phase
In the first stage, an offline fingerprint database was first constructed. In collecting database sample points, uniform sampling or random sampling can be used. Large-scale and small-scale fading usually occurs in 5G signals during wireless transmission. In order to add information to fingerprint samples and try to simulate the transmission process of 5G signals in the real environment, large-scale fading is added to the free space propagation model.
The large-scale fading of the channel is generally manifested as path loss and shadow fading [11], where the logarithmic path loss model simulates the path loss model, and the free space path loss without considering the system loss can be expressed as:
where and are the gain of the transmitting antenna and the receiving antenna, respectively, is the signal wavelength, and d is the distance between the transmitting antenna and the receiving antenna.
This paper improves the classic logarithmic distance loss model to obtain the shadow fading model. When considering the difference in the surrounding environment, the shadow fading model can be expressed as:
where n is the path loss index that changes with the environment, is the received power reference near-earth distance, and is a Gaussian distributed random variable with zero mean.
After the 5G signal passes through the MIMO scattering channel [3], large-scale fading is added to improve the resolution of fingerprint information and the independence of a single fingerprint sample.
When transmitting signals, to facilitate the analysis of fingerprint samples in the online positioning phase, empty data packets may be transmitted; the resources grid only contains reference signals such as CSI-RS and does not contain data information. In the generation stage of the CSI-RS signal, the CSI-RS signal is a pseudo-random sequence generated based on the Gold sequence [3], and the initialized pseudo-random sequence is obtained as follows:
Among them, is the time slot sequence number in the radio frame, l is the OFDM symbol index in the time slot, and is the high-level parameter used for mobile measurement.
However, accurate beamforming can not be performed without obtaining accurate UE position information at this time. However, when the gNB position is fixed, the approximate area of the indoor environment can be known, so the direction of the multi-beam needs to be initialized; that is, the direction of the antenna array is initialized vector. After beam scanning, add the steering vector to the antenna to realize the initialization distribution of the Massive MIMO beam, is the value of the steering vector of each antenna:
where k is the number of the antenna in the array, and is the initial angle of each antenna.
After the initialization of the multi-beam direction is completed, a single fingerprint sample point is constructed by measuring the CSI-RS contained in the multi-beam of multiple gNBs. The UE measures the CSI-RS signal after receiving the multi-beam information transmitted by a base station, including channel measurement, interference measurement, L1-RSRP measurement, etc., and it obtains the matrix below.
where m represents the number of beams received by the UE. Then, the matrices of different gNBs are received in turn, and after combination, the required single fingerprint sample point is obtained, and the form of fingerprint sample data and label can be obtained:
Among them, n is the number of gNBs, is the s-th fingerprint sample, is the position label of the s-th fingerprint sample, is the shear coordinate, and is the ordinate coordinate.
To sum up, the samples of the fingerprint database are based on millimeter-wave technology and dense array hybrid beamforming and combine multi-base station and multi-beam CSI-RS signals after measuring by UE to be located.
3.2. Network Model Training and Online Positioning Phase
In the online positioning process of the second stage of fingerprint positioning, the device first collects a single fingerprint sample. While collecting fingerprint information, the nearest gNB is selected to receive the multi-beam CSI-RS signal with the device point as the center. Select the top n beams with the largest impulse response amplitude in a single base station, and put the collected fingerprint samples into the trained network model to predict the position coordinates of the fingerprint positioning.
Because it needs to meet the real-time performance of indoor positioning, the fingerprint samples in this article are not complicated. It is necessary to pay attention to the problem of overfitting or even the disappearance of gradients when simple data are input into the deep network. Therefore, this paper chooses the ResNet-18-based network structure because the residual block in ResNet provides a direct connection operation from the network’s input layer to the output layer, reducing the path length of gradient propagation and curbing the gradient problem disappearance.
Figure 3 below shows the network structure in fingerprint positioning. The network structure of ResNet-18 [12] is mainly improved to make it more suitable for training and predicting fingerprint samples in this algorithm. In the last residual error, a new module containing batch normalization and a fully connected layer is added after the block to prevent overfitting and output localization information.
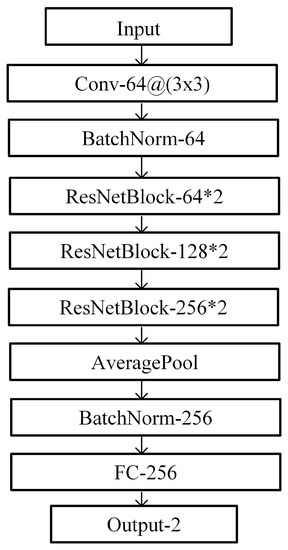
Figure 3.
The improved ResNet network structure in this paper.
4. Weighted Hyperbolic Positioning Algorithm Based on Improved Genetic Algorithm
The hyperbolic positioning algorithm makes up for the deficiency of the fingerprint positioning method. In the case of large changes in the scene, the fingerprint positioning method mentioned above may decrease the matching degree between the fingerprint samples collected in the online phase and the fingerprint database, resulting in a decrease in the prediction accuracy of the network model. The positioning process of the hyperbolic positioning method is shown in Figure 4.
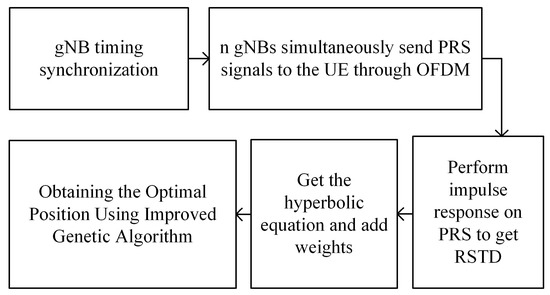
Figure 4.
Hyperbolic positioning procedure.
The 5G signal makes it easier to achieve signal synchronization under ultra-low time delay, thereby improving the measurement accuracy of TOA. At the same time, 5G can realize the flexible adjustment of SCS in the OFDM modulation process, and the maximum support of the sub-carrier spacing of 240 kHz can be seen in Table 1.

Table 1.
Application performance of SCS in different frequency bands.
As can be seen, with the improvement of SCS in the millimeter-wave frequency band, the mobility, phase noise, and signal delay are greatly improved, and the problem of low coverage can be solved by the ultra-dense networking of 5G. In addition, beamforming technology and ultra-dense networking allow 5G to send and receive PRS signals with extremely high quality during communication.
At the same time, firstly, 5G’s maximum 240 kHz SCS can reduce the OFDM sampling interval, increase sampling points, and reduce sampling error; Secondly, a larger SCS means that more PRS symbols can be transmitted with the same amount of time-domain resources, thus ensuring less latency; thirdly, OFDM can use the orthogonality of subcarriers to reduce interference between subchannels, thereby converting frequency selective fading to flat fading, which can prevent the delay spread from a single channel to the whole, thereby reducing the overall delay. After obtaining (n is the number of gNBs) hyperbolic equations composed of the reference gNB and the adjacent gNB, this algorithm reduces the error caused by finding the best estimation point. An improved genetic algorithm was used to obtain the optimal positioning coordinates.
4.1. Weighted Hyperbolic Positioning
RSTD is the relative timing difference of the reference signal (PRS) between the neighboring gNB and the reference gNB. The long arm a and the short arm b of a set of hyperbolic equations are derived from the RSTD value:
where r is the distance between two gNBs, and is converted from timing difference to distance difference. The hyperbolic equation can be obtained by using the long and short arms. The hyperbolic positioning is shown in Figure 5. The four gNBs contain a reference gNB, and three hyperbolic equations are established, respectively, through RSTD.
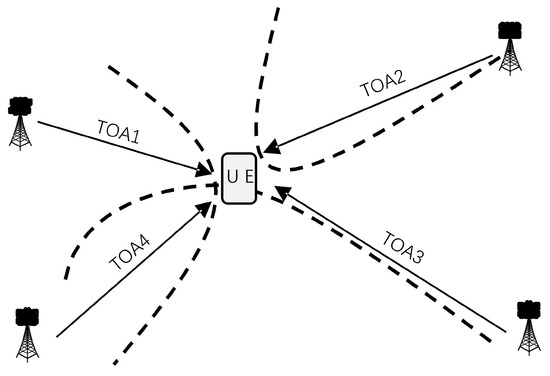
Figure 5.
Hyperbolic positioning diagram.
Through experiments, it is found that the hyperbolic positioning errors of UE are different at different positions, so this algorithm introduces a weight to each set of hyperbolas, and this weight represents the contribution to the positioning accuracy. Therefore, the equation for solving the optimal positioning coordinates can be expressed in the following form:
Among them, n represents the number of hyperbolas, represents the weight of each group of hyperbolas, d is a function of distance, represents the coordinates to be positioned, respectively, and represents the horizontal and vertical coordinates of the first group of hyperbolas. Then, we use the improved genetic algorithm to solve the optimal positioning coordinates.
4.2. Improved Genetic Algorithm for Positioning Coordinate Determination
After obtaining the hyperbolic equation, the key is how to estimate the precise positioning coordinates. The traditional method discretizes the hyperbolic equation and then traverses each discrete point to obtain the optimal position coordinates [13]. Still, since this method is often limited to the influence of the discretization interval, the accuracy is reduced, and a large amount of computing power is consumed. Therefore, this paper proposes a weighted hyperbolic positioning algorithm based on an improved genetic algorithm. The improved genetic algorithm adds the nonlinear programming process on the original basis, making up for the lack of the genetic algorithm to find the optimal local solution.
The positioning errors of the UE at different positions are shown in Figure 6. Manual intervention is carried out according to the positioning distance error, the upper and lower thresholds of the weights are set, and the improved genetic algorithm is used to calculate the optimal positioning coordinates and the of group of hyperbolas.
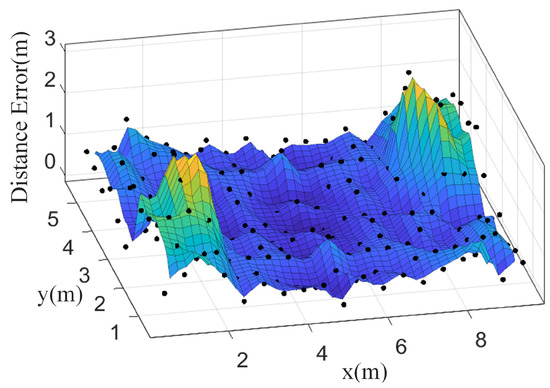
Figure 6.
Positioning Error Map.
After entering the genetic algorithm, the selection operation of the genetic algorithm uses the roulette method, and the crossover operation selects the real number crossover. The mutation operation is shown in Formula (9).
Among them, , represents the maximum distance and minimum distance between the current UE position and multiple sets of hyperbolas, g is the iteration number of the current algorithm, is the maximum evolution number, and r is a random number between the interval . Setting a suitable mutation operation equation can ensure the diversity of samples and reduce the possibility of falling into local optimum.
The genetic algorithm itself has an upper limit of capability. It is necessary to use the nonlinear programming algorithm provided by Formula (10) to perform local optimization to make up for the insufficient upper limit of the genetic algorithm capability and then continue to search for the optimal local solution as a new sample iterate.
where x is the input of position information, H is the intermediate transfer matrix, and C is the offset matrix.
5. Kalman Filter Positioning Information Fusion
When the positioning results of the fingerprint positioning algorithm and the hyperbolic positioning algorithm are known, the distance error probability density function of the positioning results of the two algorithms is known simultaneously. Then, the Kalman filter algorithm can be used to fuse the positioning results of the two to reduce errors caused by external factors. As an algorithm optimally estimates the system state by observing the input data and using the linear system state equation, the Kalman filter is very suitable as the main algorithm for positioning coordinate fusion to solve the above problems. The problem to be solved by the fusion work can be formulated as a mathematical model that minimizes the distance error:
where S represents the input signal, and represent the distance error probability density distribution of the hyperbolic method and the fingerprint method, respectively, and and are the predicted coordinates calculated by the hyperbolic method and the fingerprint method, respectively.
In traditional methods, the motion state of the UE or the relative distance between the UE coordinate points in continuous time is used as the input of the Kalman filter. However, in most indoor positioning scenarios, the position information does not have a strong temporal correlation in the indoor positioning process. We cannot obtain the UE’s motion state equation, so this algorithm uses the UE’s different positioning coordinates and distances under the two positioning methods. The error is used as the input of the Kalman filter, and the linear relationship between the two is constructed to obtain accurate position information.
From the hyperbolic positioning method, we have determined to obtain the discrete position positioning error data under the hyperbolic positioning method and use Formula (12) for fitting. The fitted function is the probability density distribution function of the distance error.
where is the three-dimensional linear interpolation function [14], is the coefficient of the function. Using the same method, the distance error probability density distribution function of the fingerprint, the positioning method can be obtained. Then, the error of the two methods and the relative position of the UE to be located are used as the input of the Kalman filter to fuse the positioning information.
The input and output of hyperbolic positioning are shown in Formula (13), where is the hyperbolic position coordinate, , and is the error of the corresponding position of the UE at time , which is obtained by using the error density function .
According to Formula (14), the prediction matrix (state transition matrix) of the hyperbolic positioning method is obtained,
The acquisition and update rules of the covariance matrix are shown in Formula (15), and is the covariance matrix of the corresponding position at time with respect to and .
Similarly, the prediction matrix and covariance matrix of the fingerprint positioning method are obtained. At the same time, the Kalman gain is calculated as the ratio of hyperbola square covariance to the sum of squares covariance of the two methods. Using the Kalman gain, hyperbolic and fingerprint positioning results are fused and updated according to the method shown in Formula (16).
The final positioning result is continuously updated according to Formula (17) to obtain the optimal result; the error approaches 0.
After the positioning information of the two methods is fused by Kalman filtering, the minimum error within the allowable error range can be obtained, but the error can only approach 0, and the most accurate position coordinates can be obtained at this time.
6. Experimental Results and Analysis
In simulation experiments, an office scene and a villa scene with multiple obstacles are used to test the proposed algorithm. The first four subsections are based on the bedroom scene for experiments and analysis, and the last subsection uses the villa scene to fully verify the robustness and superiority of the proposed algorithm.
The simulation platform is the Matlab platform + Pytorch. The Matlab version is 2021B, the PyTorch version is 1.9.1+cuda11.1, the computer hardware platform is Intel(R) Core(TM) i5- 7200U CPU @ 2.50 GHz, the memory is 8 GB, and the graphics card is Tesla K80 (11 GB video memory). Other parts are completed on the Matlab platform, except for the construction, training, and prediction of the fingerprint positioning network.
6.1. Simulation Structure of the Bedroom Scene
The scene contains both line-of-sight and non-line-of-sight propagation paths, which can be used to verify the effectiveness of the fusion algorithm in this paper. The signal will produce more severe multipath interference and shadow fading in this scenario. This scenario can prove that the algorithm can still achieve better positioning accuracy under the multiple interferences of complex scenarios.
The experimental simulation data in this paper are all carried out on the Matlab platform. Assume that the room model’s length, width, and height are 10 m, 6 m, and 2 m, respectively. The house wall material is brick, the floor material is wood, and the base stations are distributed around the house. At the same time, the influence of the macro base station on the received signal is not considered because the macro base station is far away from the receiving device. The interference effect of the macro base station can be removed through a specific filtering algorithm.
The three-dimensional structure of the simulated structure is shown in Figure 7. In this experiment, the four micro base stations built are distributed in the four corners of the building.
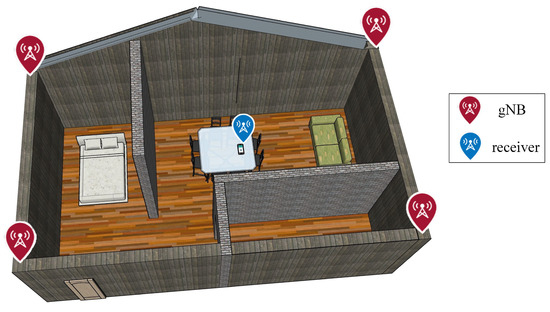
Figure 7.
Schematic diagram of the 3D structure of the bedroom scene.
6.2. Hyperbolic Positioning Algorithm
In the hyperbolic positioning process, as the power of the noise is increased, this line-of-sight-based method will reduce the accuracy with the decrease of the signal-to-noise ratio and the interference of multipath propagation. At the same time, because different values of SCS in 5G will cause different degrees of sampling errors, the hyperbolic positioning algorithm is used alone in the experiment, using the signal-to-noise ratio and SCS of the UE received signal as variables for comparison experiments. Figure 8 below shows the error of hyperbolic positioning in different SCS and SNR environments.
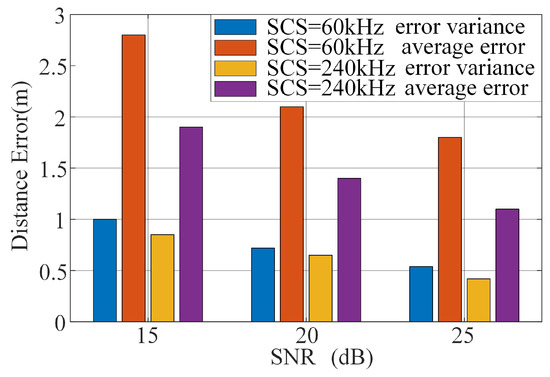
Figure 8.
Comparison of hyperbolic positioning errors under different SCS and SNR.
It can be seen that both SCS and the signal-to-noise ratio have a positive feedback effect on the final positioning accuracy. Larger OFDM sub-carrier spacing can be used in the millimeter-wave frequency band to ensure a higher sampling rate. In the experiment, white Gaussian noise was added to reduce the signal-to-noise ratio for comparative experiments. The experimental results show that the proposed hyperbolic positioning algorithm has higher accuracy than the traditional positioning method based on the visible propagation path.
At the same time, in order to verify the improvement of the improved genetic algorithm and the weighted hyperbolic algorithm on the positioning accuracy, the proposed algorithm is compared with the improved genetic algorithm and the traditional algorithm, and three algorithms are used for 200 sample points respectively. The cumulative error curve is shown in Figure 9.
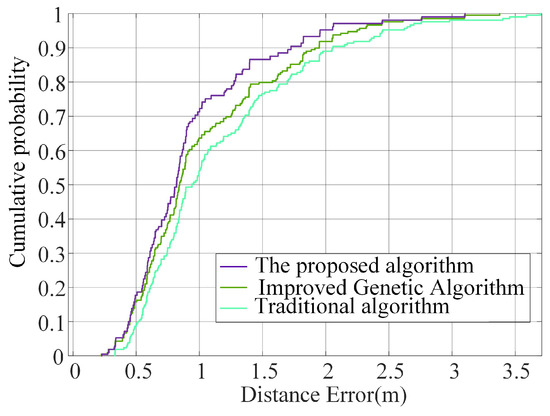
Figure 9.
Comparison of different line-of-sight path-based positioning algorithms.
The use of the improved genetic algorithm is still due to the different distance errors generated by base stations with different distances, resulting in different contributions of the corresponding hyperbola to the final positioning accuracy, and higher accuracy cannot be achieved. The weighted hyperbolic algorithm based on the improved genetic algorithm solves this problem and achieves higher positioning accuracy.
6.3. Fingerprint Positioning Algorithm
The establishment of the fingerprint database in the offline phase is shown in Figure 10. The figure shows the situation that the UE receives four base station signals. In actual cases, the 5G communication system will establish dense network nodes, thereby forming the deployment of ultra-dense cells, enriching the amount of information in the fingerprint sample. The sampling interval of fingerprint samples in the fingerprint positioning algorithm is 0.1 m. In an office environment with a length of 10 m and a width of 6 m, the fingerprint sample database contains 6000 sample points.
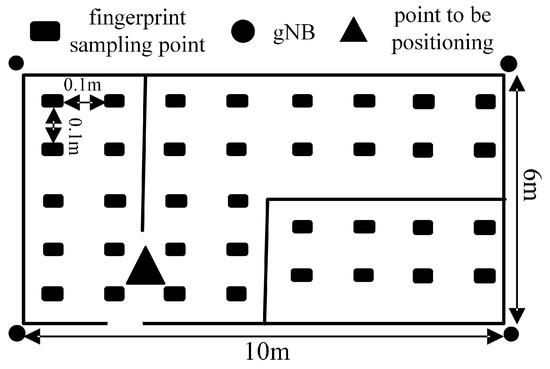
Figure 10.
Schematic diagram of fingerprint sample collection in room scene.
In using the fingerprint positioning algorithm alone, selecting the model is essential. This algorithm mainly considers the following four network models: SVM, Multi-Layer Perceptron (MLP), Convolutional Neural Network (CNN), and Residual Network (ResNet). Based on the advantages and disadvantages of SVM, MLP, and CNN, the improved ResNet-18 is selected as the network model of the fingerprint algorithm.
In the experiment using the fingerprint positioning algorithm alone, the fingerprint database is divided into the training set and test set according to 80%. At the same time, several sets of comparative experiments were carried out with other network models. The mean square loss function was employed in all of the loss functions. The final experimental results are shown in Table 2.
Table 2.
The performance of different models on the test set.
It can be seen from Table 2 that the proposed network model is the most suitable because it has higher accuracy, better generalization performance, and lower model complexity. The improved ResNet in this paper is used as the fingerprint positioning stage. At the same time, the ResNet model in this algorithm can ensure lower prediction delays.
To further verify that the multi-beam CSI-RS signal in the proposed algorithm can provide rich information for fingerprints and at the same time prove that the fixed beam initialization can improve the accuracy of fingerprint positioning, Figure 11 shows the accumulation of positioning errors when 12 beams, four beams, and a single beam are used as fingerprint samples in the case of beam fixed initialization and random initialization.
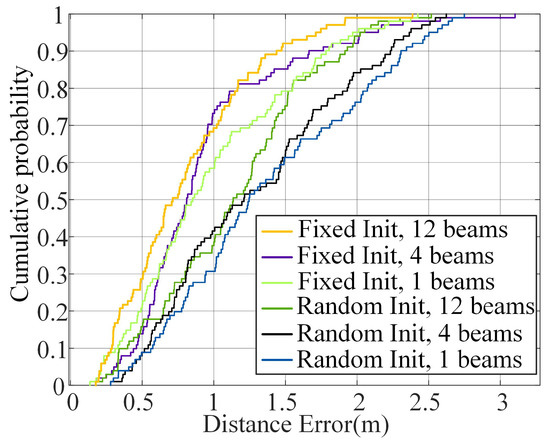
Figure 11.
Comparison of fingerprint algorithms under the initialization method and different numbers of beams.
It can be seen that the multi-beam fingerprint CSI-RS fingerprint can significantly improve the prediction accuracy when the beam direction is fixed and initialized.
6.4. Fusion of Fingerprint and Hyperbolic Algorithm in Bedroom Scene
During fusion positioning, the UE to be positioned first collects the fingerprint information of the current position and then inputs the fingerprint information into the trained network to predict the position coordinates of the fingerprint positioning. At the same time, using the feedback of the PRS signal, we execute the hyperbolic positioning algorithm to obtain another set of location coordinates. Finally, the two sets of coordinates and the corresponding distance error probability density distribution function are used as the input of the Kalman filter to perform Kalman filtering to obtain accurate two-dimensional position information. The experiment found that under 5G communication, the multi-beam set fingerprint can still achieve high positioning accuracy within the non-visible distance range in a complex environment. Still, the fingerprint algorithm will produce the problem of range error in fingerprint matching when the environment changes significantly. The proposed hyperbolic positioning algorithm has high accuracy under the visible distance. Still, there is a problem that the accuracy will be reduced due to the multipath propagation phenomenon when there is severe occlusion. However, the distance error probability density distribution function of the two algorithms has high independence, which means that the two algorithms can complement each other. The fusion of the two algorithms will significantly improve the positioning accuracy.
In the simulation experiment, the algorithm of this paper is executed at the same random position in each experiment. Each group has 180 sampling points, and a total of eight experiments are carried out. Finally, the average value was used to calculate the cumulative probability of distance error. The results are shown in Table 3 and Figure 12.
Table 3.
Comparison of positioning errors.
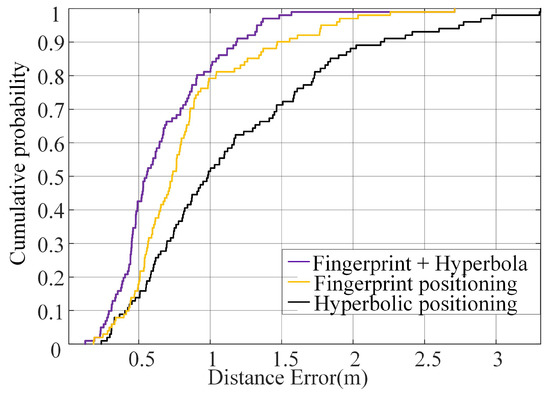
Figure 12.
Comparison of the cumulative probability distribution of errors.
Combining Figure 12 with Table 2, in Table 3, it can be seen that in complex indoor scenes such as offices, a severe multipath effect will decrease the positioning accuracy of hyperbolic positioning. However, the positioning situation of fingerprint positioning in complex scenes is relatively good. Still, when the indoor environment changes, the channel information of the changed position may change to a certain extent, resulting in errors in matching fingerprint information. However, after the two positioning results are fused by Kalman filter, the overall positioning accuracy was greatly optimized.
As shown in Figure 13, comparative experiments were performed by simultaneously changing the number and location of gNBs. The experiment with only three gNBs was used as control group 1, the experiment with four randomly distributed gNBs was used as control group 2, and the experiment with six gNBs with uniform distribution was used as control group 3. The final positioning results are shown in Table 4.
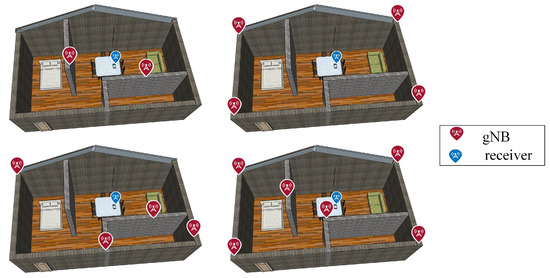
Figure 13.
Schematic representation of different numbers and distributions of gNBs.
Table 4.
Positioning errors of base stations with different numbers and distributions.
It can be seen that whether the distribution of gNB is random or regular does not have too much influence on the final positioning result, but it will change the positioning error distribution of the fingerprint algorithm and hyperbolic algorithm. However, using fewer gNBs means lower fingerprint sample resolution, so the positioning accuracy of the fingerprint positioning method will decrease slightly. Meanwhile, the hyperbolic positioning is affected by the number of gNBs. The more gNBs, the more the number of hyperbolic constraint equations, and the higher the accuracy. However, after the 5G ultra-dense network deployment is completed, the number of gNBs is sufficient. To ensure the positioning delay, an appropriate number of base stations should be used.
To further verify the algorithm’s effectiveness, we set a moving trajectory in the indoor environment and use the proposed algorithm to make predictions.
It can be seen from Figure 14 that the proposed algorithm can be used to locate the moving target accurately. At the same time, because the SCS of 240 kHz is used to suppress the slight doppler effect caused by relative displacement, and because there is basically no high-speed movement in an indoor environment, this algorithm can suppress much doppler shift.
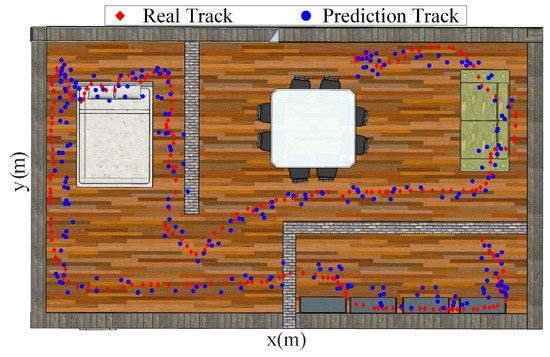
Figure 14.
The trajectory prediction of the mobile device by the proposed algorithm.
The comparison results between the positioning algorithm in this paper and the algorithm of multi-point positioning using wireless optical technology on the 5G platform in the literature [5] and the 5G indoor positioning algorithm based on DELTA in the literature [6] are shown in Table 5.
Table 5.
Errors and time-consuming comparisons with other existing methods.
It can be seen that compared with the other two algorithms, the algorithm in this paper has a significant improvement in both the average error and the maximum error, which proves that the algorithm in this paper has good positioning accuracy. The algorithm in this paper is also superior to the other two algorithms in robustness.
At the same time, the complexity of the algorithm is analyzed. The network model proposed in this paper takes into account the prediction accuracy and low model complexity. Convolutional layers and fully connected layers are less than 15 layers, and the amount of computation is small. In addition, the time complexity of the improved genetic algorithm in the hyperbolic algorithm is calculated. When the initial position population size is , the time complexity of the genetic algorithm is less than , so the fingerprint algorithm has a faster calculation speed than the hyperbolic algorithm; at the same time, the two algorithms are calculated in parallel, and only the running time of the hyperbolic algorithm needs to be considered.
In addition, the Kalman filter algorithm has high computational efficiency. When the dimension of the state matrix is , the time complexity of calculating the Kalman gain can reach . Therefore, the overall complexity is less than , and the time consumption of positioning can also meet the requirements of low latency. The positioning method in the literature [5] still relies on multi-point positioning in general, and the overall complexity is close to , but it also involves the selection of visible light sources, so the positioning time is slightly higher than the algorithm. Without considering the establishment process of the 5G platform in the literature [6], its calculation amount is mainly consumed in the calculation of the network model. The overall network structure is similar to MLP. It adopts a two-way three-hidden layer structure, and the number of hidden layer units is about 300, so the positioning stage takes more time.
6.5. Fusion of Fingerprint and Hyperbolic Algorithms in Villa Scene
As shown in Figure 15, the experimental scene is replaced with a villa scene, and a courtyard and a hut without a base station are added in this scene to test the positioning effect in this scene with occlusion and lack of base stations.
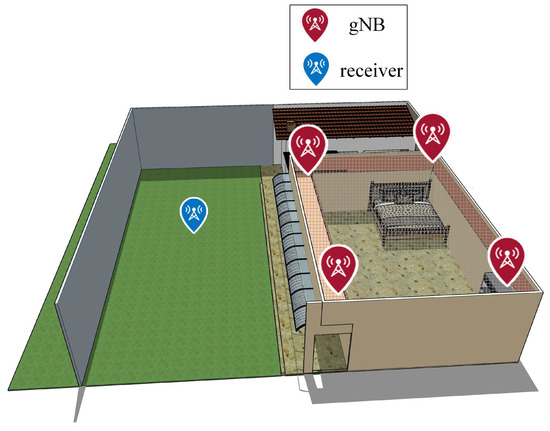
Figure 15.
Three-dimensional (3D) schematic diagram of villa scene.
At the same time, because the scene becomes larger, 500 sampling points are used, a total of eight experiments are carried out, and the average distance error is used as the final result. At the same time, we keep the four gNBs unchanged, so that it can be compared with the previous bedroom scene.
As shown in Table 6, the proposed algorithm is still applicable in the villa scene with outdoor venues. At the same time, because the occlusion of the independent hut is serious, it is basically regarded as a non-line-of-sight scene, so the positioning accuracy is lower than that of the main house and courtyard, but it can still reach the m-level positioning accuracy. At the same time, it can be seen that the localization algorithm proposed in this paper can provide high localization accuracy in relatively small bedroom scenes and villa scenes with courtyards and independent cottages.
Table 6.
Positioning errors in different areas of the villa.
Meanwhile, in order to demonstrate the robustness of the proposed algorithm, an incomplete control group is used for experiments, and only the last six data in each single fingerprint sample are retained. Then, we test the positioning accuracy of the fingerprint positioning method and the overall fusion algorithm when using incomplete and complete CSI, respectively. The result is shown in Figure 16.
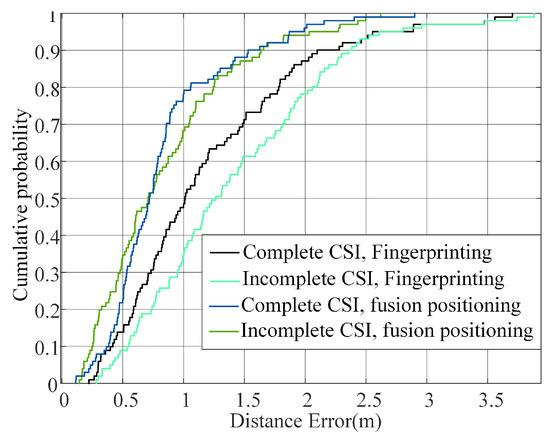
Figure 16.
Cumulative error curves in both algorithms using complete or incomplete CSI.
It can be seen from the figure that when the CSI information of the fingerprint sample is missing, the resolution of a single fingerprint sample should be reduced, and the positioning accuracy of the fingerprint positioning method will be reduced to a certain extent, but at this time, the hyperbolic positioning still maintains a high accuracy. Therefore, the overall positioning accuracy is not affected too much, which once again proves the robustness and overall superiority of the algorithm.
7. Conclusions
This paper proposes an indoor fusion positioning algorithm based on 5G communication technology, which combines the fingerprint positioning method and the hyperbolic positioning method using Kalman filtering. This algorithm utilizes beamforming technology and appropriate subcarrier spacing in 5G to enhance the reference signal quality of the hyperbolic positioning algorithm while reducing the TOA delay error accuracy. Multiple beams provide more high-dimensional information for fingerprint sample features and improve the information richness of the fingerprint positioning database; the Kalman filter fusion algorithm improves the robustness of the overall algorithm. The fingerprint and hyperbolic algorithms alone are significantly improved in the algorithm testing stage compared with the traditional method. At the same time, the experimental results of two experimental scenarios show that the Kalman filter algorithm is used to fuse the two algorithms, and the final positioning accuracy reaches about 0.8 m. Compared with the 5G-based positioning algorithms in recent years, the proposed algorithm meets the high-precision positioning requirements. The algorithm’s robustness in this paper is significantly improved compared with other algorithms. After the widespread deployment of 5G equipment and the opening of the mm wave frequency band, this method can meet the vast majority of indoor positioning application scenarios.
Author Contributions
Conceptualization, Z.G. (Zhiqiang Geng) and J.Y.; methodology, Z.G. (Zhiqiang Geng) and J.Y.; software, Z.G. (Zhiqiang Geng) and H.C.; validation, Z.G. (Zhiqiang Geng) and H.C.; formal analysis, Z.G. (Zhiqiang Guo) and J.Y.; investigation, Z.G. (Zhiqiang Geng); resources, Z.G. (Zhiqiang Guo) and J.Y.; data curation, Z.G. (Zhiqiang Geng); writing—original draft preparation, Z.G. (Zhiqiang Geng); writing—review and editing, J.Y. and L.L.; visualization, Z.G. (Zhiqiang Geng) and H.C.; supervision, J.Y. and Z.G. (Zhiqiang Guo); project administration, J.Y. and Z.G. (Zhiqiang Guo); funding acquisition, J.Y. and Z.G. (Zhiqiang Guo). All authors have read and agreed to the published version of the manuscript.
Funding
This work was supported by the National Key Research and Development Project of China (2020YFB1710800), the National Nature Science Foundation of China (Grant No. 51879211).
Acknowledgments
The authors would like to thank the anonymous reviewers for their very competent comments and helpful suggestions.
Conflicts of Interest
The authors declare no conflict of interest.
Abbreviations
The following abbreviations are used in this manuscript:
| 5G NR | 5th Generation Mobile Communication Technology New Radio |
| OFDM | Orthogonal Frequency Division Multiplexing |
| TOA | Time Of Arrival |
| CSI-RS | Channel State Information-reference signal |
| GPS | Global Positioning System |
| DELTA | Deep Learning-based CooperaTive Architecture |
| SVM | Support Vector Machines |
| MIMO | Multiple Input Multiple Output |
| UE | User Equipment |
| SCS | Sub Carrier Spacing |
| RSTD | Reference Signal Time Difference |
| gNBs | gNodeBs |
| LTE | Long-Term Evolution |
References
- Poulose, A.; Han, D. Hybrid Deep Learning Model Based Indoor Positioning Using Wi-Fi RSSI Heat Maps for Autonomous Applications. Electronics 2021, 10, 2. [Google Scholar] [CrossRef]
- Didi, S.; Vitaliy, K.; Ranjeeta, M. Tracking a moving user in indoor environments using Bluetooth low energy beacons. J. Biomed. Inform. 2019, 98, 103288. [Google Scholar]
- Afif, O.; Jose, F.; Monserrat, P.M. 5G Mobile and Wireless Communications Technology, 3rd ed.; People’s Posts and Telecommunications Press: BeiJing, China, 2017; pp. 22–44. [Google Scholar]
- Carlson, E.K. New Standards Release Sets Stage for 5G Future. Engineering 2021, 7, 3. [Google Scholar] [CrossRef]
- Lina, S.; Dayu, S. 5G Internet of Radio Light Positioning System for Indoor Broadcasting Service. Trans. Broadcast. 2020, 66, 534–544. [Google Scholar]
- Boudani, B.; Kanaris, L. Implementing Deep Learning Techniques in 5G IoT Networks for 3D Indoor Positioning: DELTA (DeEp Learning-Based Co-operaTive Architecture). Sensors 2020, 20, 5495. [Google Scholar] [CrossRef] [PubMed]
- Amir, A.; Maryam, A.; Mohammad, M. Adaptive Explicit Kernel Minkowski Weighted K-means. Inf. Sci. 2022, 584, 503–518. [Google Scholar]
- Hao, Z.; Yan, Y. Endpoints-Clipping CSI Amplitude for SVM-Based Indoor Localization. Sensors 2019, 19, 3689. [Google Scholar] [CrossRef] [PubMed] [Green Version]
- Ade, M.; Bhalge, P.A. The Enhanced Genetic Algorithms for the Optimization Design. Int. J. Eng. Tech. Res. 2015, 3, 5. [Google Scholar]
- Yi, S.J.; Chun, S.D.; Lee, Y.D.; Park, S.J.; Jung, S.H. Radio Protocols for LTE and LTE-Advanced; John Wiley & Sons Singapore Pte. Ltd.: Singapore, 2012; pp. 151–158. [Google Scholar]
- Ozdogan, O.; Bjornson, E.; Larsson, E. Intelligent Reflecting Surfaces: Physics, Propagation, and Pathloss Modeling. IEEE Wirel. Commun. Lett. 2019, 9, 581–585. [Google Scholar] [CrossRef] [Green Version]
- He, K.; Zhang, X. Deep Residual Learning for Image Recognition. In Proceedings of the 2016 IEEE Conference on Computer Vision and Pattern Recognition, Las Vegas, NV, USA, 27–30 June 2016; pp. 770–778. [Google Scholar]
- Yujie, W.; Burcu, A. A vision and learning-based indoor localization and semantic mapping framework for facility operations and management. Autom. Constr. 2019, 107, 102915. [Google Scholar]
- Isaac, A. Scattered data interpolation methods for electronic imaging systems: A survey. J. Electron. Imaging 2002, 11, 157–176. [Google Scholar]
Publisher’s Note: MDPI stays neutral with regard to jurisdictional claims in published maps and institutional affiliations. |
© 2022 by the authors. Licensee MDPI, Basel, Switzerland. This article is an open access article distributed under the terms and conditions of the Creative Commons Attribution (CC BY) license (https://creativecommons.org/licenses/by/4.0/).