Abstract
With an improvement in the performance of radio telescopes, the number of pulsar candidates has increased rapidly, which makes selecting valuable pulsar signals from the candidates challenging. It is imperative to improve the recognition efficiency of pulsars. Therefore, we solved this problem from the perspective of intelligent image processing and a deep neural network model AR_Net was proposed in this paper. A single time–phase-subgraph or frequency-phase-subgraph was used as the judgment basis in the recognition model. The convolution blocks can be obtained by combining the attention mechanism module, feature extractor and residual connection. Then, different convolution blocks were superimposed to constitute the AR_Net to screen pulsars. The attention mechanism module was used to calculate the weight through an additional feedforward neural network and the important features in the sample were identified by weight, so the ability of the model to learn pivotal information was improved. The feature extractor was used to gain the high-dimensional features in the samples and the residual connection was introduced to alleviate the problem of network degradation and intensify feature reuse. The experimental results show that AR_Net has higher F1-score, recall and accuracy, and our method produces a competitive result compared with previous methods.
1. Introduction
The sky survey project receives mysterious signals from the vast starry sky through undifferentiated scanning mode. Scientists further analyze these signals in order to discover unknown celestial bodies and break new research ground on the universe gradually. Pulsar is one of the major research objects in astrophysics. Because of distinctive characteristics and a wide combination with other fields in astronomy, the discovery of pulsars had an important impact on the fields of physics, astronomy, chemistry and so on. Finding new pulsars by launching the sky survey observation project has been a popular topic since the first pulsar was discovered. In recent years, tens of thousands of candidate samples were produced by the pulsar survey project. Some data obtained by the PMPS sky survey [1] were processed to produce 30,000 pulsar candidate samples. The total number of candidate samples captured by the GBT telescope [2] is more than 1.2 million. There are 14 million candidate samples produced by the HTRU sky survey [3]. The FAST telescope [4,5] captured more than 10 million candidates before May 2018. Since then, a FAST 19-beam receiver has been installed, generating more than one million pulsar candidates per night. Screening pulsars is undoubtedly a difficult and heavy workload in the face of such a large number of candidate samples. Thus, improving the search efficiency of pulsar has important research value and significance.
The signal data collected by the radio telescope need a series of processing, such as refuse radio frequency interference (RFI), remove dispersion management (DM) and fast Fourier transform (FFT), then candidate signals can be obtained. Researchers further analyze the candidate data to screen out pulsars. In the initial stage of the development of the telescope, the amount of candidate sample data obtained by the sky survey project is relatively small, and the demand can be met by manually checking the candidate signal. With the development of telescope hardware equipment and the improvement in technology, the number of captured samples has increased sharply. To save manpower, researchers began to optimize the search method by developing software tools and they also designed artificial features to describe pulsars, such as width of the pulse profile, S/N of the folded pulse profile and others. The increasing number of candidates spawned many visualization tools, such as REAPER [6] and RUNVIEW [7], which can visually display important pulsar data. A more powerful graphic toolkit, JREAPER [8], was proposed, which can provide a score for each pulsar candidate according to parameters and sort them. This idea brings hope to the prospect of analyzing candidates without manual inspection. The use of visualization tools reduces the number of candidates to be checked, which provides convenience, but researchers still need to spend a lot of time on screening. The possibility of human error would be increased due to fatigue and candidate samples with weak signals misclassified easily. Then, Bates et al. [9] and Eatough et al. [10] trained an artificial neural network (ANN) with artificial feature data for classification. Morello et al. [11] designed the SPINN classifier. The method for introducing a neural network has achieved some results, but the discrimination ability of the model is affected by the limited training data, and it is easy to miss the pulsars with atypical characteristics. Lee et al. [12] took the artificial feature as the evaluation factor of a pulsar signal, calculated the evaluation factor by constructing a function to obtain the score and then sorted it according to the score. Mohamed [13] proposed a fuzzy k-nearest neighbor (Fuzzy KNN) classification algorithm, which uses differentiated artificial statistical features to calculate the membership value of each sample. Such methods can be operated online and have high calculating speed, but the generalization ability of the model is poor. Lyon et al. [14] proposed a recognition algorithm that is a Gaussian–Hellinger very fast decision tree (GH-VFDT). Tan et al. [15] improved the GH-VFDT method, the pulsar screening problem is changed into a three-classification problem (pulsar, RFI, noise) and the artificial features are extended. An integrated classifier based on five decision tree models is proposed, where better results are obtained. This kind of method based on machine learning has some defects, because subjective factors are added in the process of designing artificial features. Neural networks have developed in the field of image processing, especially the convolutional neural network (CNN) [16], which is a variant of a feed-forward neural network and it is a powerful model for solving classification problems. Pulsar search methods are constantly updated. Zhu et al. [17] did not try to redefine and simplify features but solved the problem through the idea of image recognition. This idea reduces the possible tendency of matching according to the pre-designed pattern, reduces the dependence of the classifier on artificial information and begins to pay attention to the details of judging subgraph species directly. They designed an integrated system, PICS, to screen pulsars, and the ANN, CNN, support vector machine (SVM) and logistic regression (LR) algorithms were embedded in the system. Since the impressive classification accuracy of CNN, and many advanced networks have been designed using CNNs, such as ResNet [18], Wang et al. [19] improved the PICS system and the PICS-ResNet system was proposed. The model is easier to converge in the training process and has better classification performance by replacing CNN with ResNet. However, such methods need four kinds of subgraphs as the basis for discrimination. The model is complex and needs to rely on a large number of label samples. Guo et al. [20] proposed a novel method, which only uses the two-dimensional subgraph, with obvious features as the judgment basis. The discriminant features were extracted by DCGAN and SVM was used to classify according to the feature data. Although it gave full play to the advantages of a deep neural network model, the model is complex and has difficulty in training. Liu et al. [21] proposed ResNet with two-type residual connections, which also uses only two-dimensional subgraphs. By contrast, the recall, accuracy and F1-score are improved, but the effect of the model needs to be further improved. Compared with the other models, the methods based on neural networks have advantages because these methods avoid being influenced by human factors and reduce the number of features. A neural network for image processing has gradually become a hot topic in the field of pulsar recognition and it is also the focus of research in this paper.
In recent years, researchers have introduced the selective attention mechanism [22] of human vision into deep learning. It is one of the technologies with the greatest potential in deep learning in recent years. Considering this, a deep convolution neural network model, AR_Net, is proposed in this paper for screening pulsars. The attention mechanism is introduced and the important features in the sample are identified through the attention weight of space and channel, so the model can extract more key information. In addition, the residual connection realizes the cross-layer characteristic transmission, which further optimizes the performance of the network. The experimental results show that this method can effectively improve the efficiency of pulsar recognition.
2. AR_Net Model
Pulsar recognition tasks are more challenging than other object recognition tasks. By contrast, the characteristics of pulsar candidate samples are not so vivid and prominent. However, compared with the negative samples, the positive samples have prominent local characteristics. In addition, there are some similarities between the features of positive and negative samples. In this case, low-dimensional shallow features cannot provide enough information to distinguish positive and negative samples. Therefore, designing a deep network that can focus on extracting more prominent features is helpful to improve the performance of the pulsar recognition model. Based on neural network technology, a convolutional neural network model integrating channel attention mechanism, spatial attention mechanism and residual connection is proposed in this paper. The structure of the network model is shown in Figure 1.
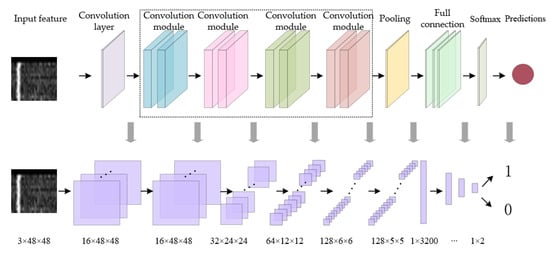
Figure 1.
AR_Net structure.
The superposition of all convolution modules is shown in the dotted box in Figure 1. Each convolution module is stacked twice to form a group. The information is extracted by the first group of convolution modules; the size of the obtained vector remained unchanged. After the vector passed through the second group of convolution modules, the number of channels was increased by two-times and the size was reduced by one-half. The new vector was output as the input of the next module. The calculation process of the third and fourth convolution modules is similar to that of the second convolution module. Differentiated deep high-dimensional information is gradually extracted from the original feature map by the model, which is conducive to making more accurate judgments.
The structure of the convolution module is shown in Figure 2. A feature was input and the weight of a channel dimension is calculated by the channel attention module; then the original input vector is weighted by point multiplication. Following the previous steps, a weight of spatial dimension was obtained, which was calculated by the spatial attention module. Similarly, the original input data are weighted by point multiplication. During the self-learning process of the two lightweight attention modules, the feature information that should be emphasized was obtained and the useless feature information was suppressed. The redefined features were input into the feature extraction module for calculation to further extract high-dimensional and deep-level information. The deep network has powerful image processing capability. After all, previous research has shown that a degree of functional degradation will occur in the saturated condition. In this paper, the residual connection is introduced into the convolution module to identity mapping; that is, the residual connection is added after the attention module and the feature extraction module to form the residual learning unit. The transfer of vectors is realized in cross-layer architecture; thus, the features are enhanced, so the performance of the model is improved.
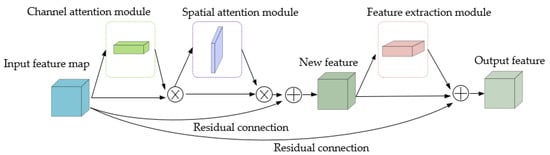
Figure 2.
Convolution module structure.
The feature extractor is shown in Figure 3. This module performs convolution, normalization and nonlinear operations on the input vector. Each feature extraction module has two convolution layers with convolution kernel of size 3 × 3 and the number of channels is variable. Further, the batchnorm2d operations are always added behind the convolution layer to normalize the data, which reduces the instability of network performance caused by too large a value before ReLU. Different convolution module groups set different channel numbers. With the superposition of modules, high-dimensional information is gradually extracted by the model.
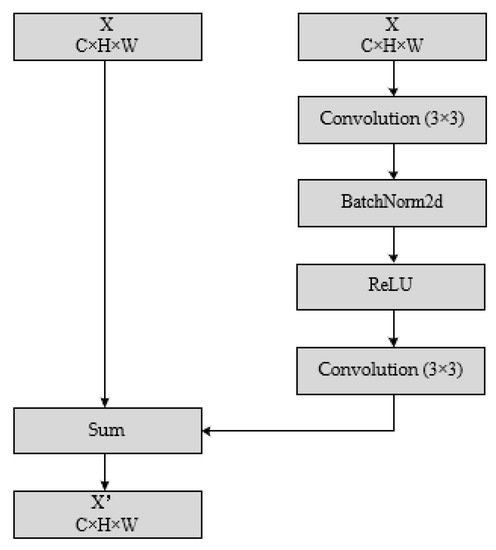
Figure 3.
Feature extraction module structure.
The structure of the channel attention module is shown in Figure 4. Given an intermediate feature map , the module took two branches for calculation. One of them performed global max pooling to obtain a feature map with size of , and the size of the feature map was changed to by the shared convolution network layer. The other performed global average pooling to obtain a feature map with size of , and the size was also changed to . Then, two parts of the output maps were summed element by element, and the results are nonlinearly activated by sigmoid function. The weight with size of was obtained. Finally, important information is marked with weight. The shared network layer is shown in the dotted box in Figure 4. It includes a convolution layer with convolution kernel size of 1×1, the number of channels was and a convolution layer with convolution kernel size of 1×1; the number of channels was C, where this 16. In short, the channel attention is computed as:
where denotes the sigmoid function, denotes convolution and denotes new map after weighting. Note that the weights of the shared convolution network layer weights, and , are shared for both inputs.
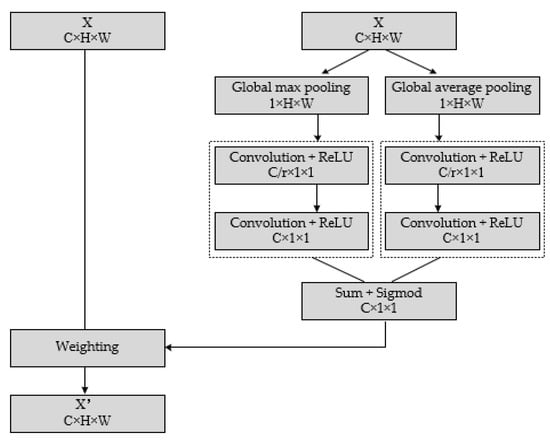
Figure 4.
Channel attention module structure.
The structure of the spatial attention module is shown in Figure 5. Given an intermediate feature map . Global average pooling and global max pooling were performed, respectively. The input feature map was reduced to two parts of the new feature map and with size of . The map is extended by concatenating and . Then, the map was compressed by a convolution layer with convolution kernel size of 3 × 3 and the number of channels was 1. The results are nonlinearly activated by the sigmoid function. The weight with size of was obtained. Finally, important information is marked with weight. The channel attention is computed as:
where denotes convolution and denotes new map after weighting.
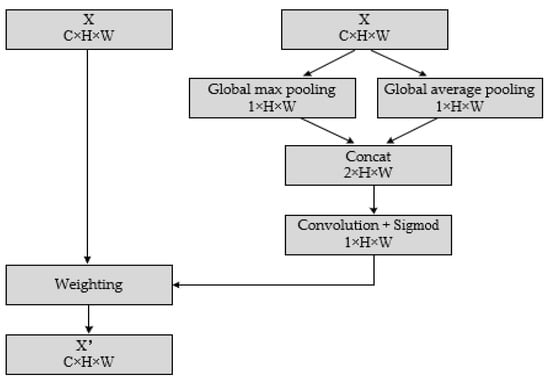
Figure 5.
Spatial attention module structure.
3. Experiments and Result Analysis
3.1. Features and Dataset
The features used in the existing pulsar recognition methods are shown in Table 1. The subjective factors and limitations exist in the empirical features and statistic features, and numerous features were required. The image features are automatically extracted by the convolution neural network when we solve the problem on angle of intelligent image processing, which can avoid being influenced by human factors and reduces the number of features. At the initial stage of development, the researchers designed an integrated model to extract the features of four subgraphs. The integrated model is complex. After that, the model is continuously optimized, and only a single subgraph is used as the judgment basis. The model is simpler and the number of features is smaller, meaning more advantages for the task of processing massive data.

Table 1.
The features used in different classifiers.
After professional software processing, pulsar candidate signals are converted into images that contain four subgraphs. Among them, the pulse profile subgraph and dispersion curve subgraph are one-dimensional images. The time–phase subgraph and frequency–phase subgraph are two-dimensional images with richer discriminant information, which is more conducive to pulsar recognition, so they are the best choice for training models.
PMPS-26k pulsar candidate datasets are investigated in our experiments. PMPS-26k is an artificially identified pulsar candidate dataset obtained from reprocessing all the data from the PMPS sky survey, which contains 2000 positive examples that are obtained from real pulsars, 2000 negative samples that are obtained from non-pulsar signals and 20,000 negative samples that are obtained from RFI. The labelled data were randomly split into three folds: training, validation and testing, with proportions of 30 percent, 30 percent and 40 percent, respectively. We resized all the examples into images with a size of 48 × 48 pixels. Each example had a time–phase subgraph and a frequency–phase subgraph.
3.2. Evaluation Metrics
In essence, pulsar recognition is a binary classification problem. The real pulsar signals are a positive sample, which get most of the attention, and other signals are negative samples, which should be refused. Therefore, we set the evaluation index according to the confusion matrix. The binary classification confusion matrix is defined as in Table 2. The evaluation metrics we adopt for the pulsar candidate classification task here include Precision, Recall and F-score.
Table 2.
Binary classification confusion matrix.
3.3. Implementation
A computer with CPU Intel(R)Core(TM)i7-9700F 3.00 GHz was used. The experiment used one single graphics card of NVIDIA GeForce GTX 1660 Ti when using the Pytorch framework on the python3.7 platform. Further, the training task occupied 8 GB of memory. During the experiment, the parameter setting of the model and the calculation process are as follows. There is a pulsar candidate subgraph with a size of 48 × 48 pixels. Due to the size of the input feature map being small, the size of all convolution kernels was set as 3×3. Feature maps were extracted by a convolution layer and the number of channels is 16, hence, the obtained map has a size of 16 × 48 × 48. Then, the feature map was calculated by convolution modules, the first group, the second group, the third group and the fourth group, and the number of channels was 16, 32, 64 and 128, respectively. The result with a size of 128 × 6 was reduced to one with a size of 128 × 5 × 5 by average pooling. The purpose of introducing a pooling layer is to retain larger response values and decrease resolution. Generally, the size of the pooling kernel is also set to a smaller value; 2 × 2 is in common use. Then, the feature map is extended to 1 × 3200 before calculating by the full connection layer. After calculating by three full connection layers, a feature map with a size of 1 × 2 was used for classification by softmax. Finally, the prediction of pulsar samples by the model was output. Experimental parameter setting is as follows. If the value of the Batch_Size is large, the model easily encounters local minimization; if the value of the Batch_Size is small, the randomness will be greater and the training effect will be better. It is necessary to make an adjustment according to the current task to obtain the best value, and it is usually set as the N-th power of 2. After many experiments, it is found that if Batch_Size is set as 16, the result is the best. The value of the learning rate is crucial, the parameters are initialized randomly at the beginning of training and the learning rate is set to 0.001, so the model can regulate the parameters rapidly. During the training process, the learning rate is dynamically adjusted, changing to one-tenth of the original value each time, and the optimal parameters are gradually found. The training results of the model show that when the training iterations reach 100, the fitting effect is good and there is almost no change in later training. Consequently, the value of epochs is set as 100. The cross-entropy-loss function is used to describe the error between the target and the predictions. Moreover, an Adam optimizer [23] was used in the training process. The AR_Net models are trained for the time–phase subgraph and the frequency–phase subgraph.
3.4. Results and Analysis
To explore the impact of the added attention mechanism on the network classification ability, we will compare the models with and without the added attention mechanism by taking the curves for loss and accuracy in validation. As shown in Figure 6, A_Net denotes the model without an attention mechanism and the accuracy of AR_Net is higher in comparison. The attention mechanism provides a set of effective solutions that can extract more important information for the current task from a great deal of information, pay high attention and ignore other irrelevant information to improve the accuracy of the model.
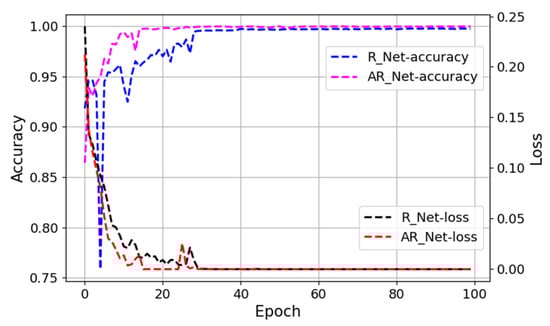
Figure 6.
Curve of loss and accuracy on validation (effects of adding attention mechanism to the model).
The experimental results, below, further confirm the advantages of the residual structure in this paper. The curves for loss and accuracy in the validation are shown in Figure 7. A denotes the model that contains the residual structure in our previous work [22]. The results show that the structure in this paper is more helpful to improve the accuracy of the model. A residual connection is added behind the feature extraction module, which intensifies feature reuse.
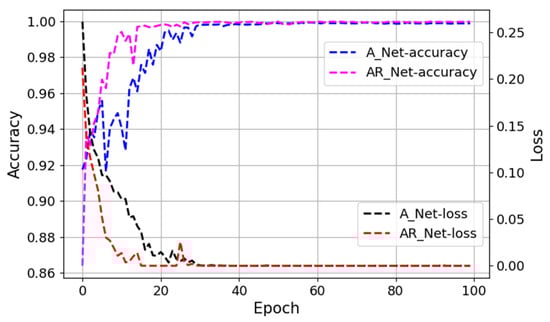
Figure 7.
Curve of loss and accuracy on validation (effects of residual structure on the model).
The experimental results on the PMPS-26k dataset are shown in Table 3. The results with the suffix “-ints” in the table are obtained by experiments on the time–phase subgraph and the results with the suffix “-bands” in the table are obtained by experiments on the frequency–phase subgraph. Taking the experimental results with the suffix of “-bands” as an example to take detailed analysis, RBF-SVM takes 24 principal components obtained from the principal component analysis (PCA) of input images as the features, and these principal components are adopted to train the RBF-SVM classifier. In the experiments, CNN denotes the network architecture used in the previous work [17]. The performance of the CNN method is better than the RBF+SVM method. In the DCGAN+SVM method [20], the deep discriminator was trained to extract the high-dimension features in the two-dimensional subgraph of pulsar candidates. The recall, accuracy and F1-score of DCGAN+SVM are higher than those of the CNN method. The ResNet method [21] based on residual network is relatively simple, without an additional SVM classifier, achieving an F1-score of 0.912 and an accuracy of 0.955, which were higher than those of the DCGAN+SVM method. However, the recall is 0.873, which is 0.018 lower than that of the DCGAN+SVM method. The AR_Net method was proposed in this paper, which achieved an F1 score of 0.9981, recall of 0.9988 and accuracy of 0.9975. Compared with the DCGAN+SVM method, F1-score, recall and accuracy are significantly improved. Further, compared with the suboptimal ResNet method, F1-score is increased by 0.0861, the recall rate is increased by 0.1258 and the accuracy is increased by 0.0425. Furthermore, taking all the results of experiments on the time–phase subgraph as an example, the recall, accuracy and F1-score of the AR_Net method are better than other methods. Under the background of large test set accounting for 40% of the total data, the comprehensive performance of the AR model proposed in this paper is better. In short, in the identification task, the AR_ Net model can ensure that the real pulsar samples are not missed furthest, which is more suitable for pulsar search. It further shows that the deep network integrating residual connection and attention mechanism is more helpful in the pulsar classification task.
Table 3.
Evaluations of different models on the PMPS-26k dataset.
4. Conclusions and Discussion
The deep convolution neural network model AR_Net, which combined an attention mechanism and residual connection, was proposed to identify pulsars in this paper. Comprehensive experimental results show that AR_Net can distinguish positive samples and negative samples of pulsars more accurately.
There are one or more dark vertical bars in the time–phase subgraph and frequency–phase subgraph of conventional pulsar positive samples. From an overall point of view, pulsar signals have the phenomenon of pulse drift and the signals of some frequency channels become worse due to the influence of interstellar media. It is worth noting that convolution neural networks can directly analyze two-dimensional images, but signals with varying degrees of variation will affect the performance of neural networks. In this case, the high-dimensional features extracted by the convolution neural network are more helpful to distinguish pulsars and interference signals. The module that can identify the key information that is introduced into the model, which can further reduce the influence of the model on the pulse drift and distortion of the target area in the image. In addition, the two-part residual connection also optimizes the performance of the model. The work in this paper is of significance for finding positive pulsar samples from the massive pulsar candidate samples obtained from the modern radio telescope sky survey project. In addition, the network structure of ResNet has, indeed, achieved amazing results, but by comparison, the AR_Net model is more helpful in extracting crucial information. For image data with fuzzy features and prominent local features, such as pulsar subgraphs, the network structure of AR_Net has more advantages and the accuracy is higher, so it is worth popularizing to similar image processing tasks.
However, the feature image required in the model training process needs to be normalized and the parameters of the model need to be further reduced. Moreover, to a certain extent, the efficiency of the neural network recognition model depends on the integrity of the labeled dataset. The existing dataset lacks a large number of labeled positive sample data. In the future, an unsupervised learning algorithm should be designed to alleviate the dependence of the model on label data.
Author Contributions
Conceptualization, Q.Y., Y.W. and X.Z.; formal analysis, Q.Y., Y.W. and X.Z.; data curation, Q.Y., Y.W. and X.Z.; writing—original draft preparation, Y.W. and J.Z. All authors have read and agreed to the published version of the manuscript.
Funding
The Joint Research Fund in Astronomy, Grant Numbers: U2031136, under cooperative agreement between the NSFC and CAS. The National Key Research and Development Program of China, Grant Numbers: 2018AAA0100203.
Data Availability Statement
The data underlying this article are available at http://www.atnf.csiro.au/research/pulsar/pmsurv/.
Acknowledgments
We thank the anonymous reviewers for their constructive feedback.
Conflicts of Interest
The authors declare no conflict of interest.
References
- Manchester, R.N.; Lyne, A.G.; Camilo, F.; Bell, J.F.; Kaspi, V.M.; D’mico, N.; McKay, N.P.F.; Crawford, F.; Stairs, I.H.; Possenti, A.; et al. The Parkes multi-beam pulsar survey- Observing and data analysis systems, discovery and timing of 100 pulsars. Mon. Not. R. Astron. Soc. 2001, 328, 17–35. [Google Scholar] [CrossRef]
- Boyles, J.; Lynch, R.S.; Ransom, S.M.; Stairs, I.H.; Lorimer, D.R.; McLaughlin, M.A.; Hessels, J.W.; Kaspi, V.M.; Kondratiev, V.I.; Archibald, A.; et al. The green bank telescope 350 MHz drift-scan survey-Survey observations and the discovery of 13 pulsars. Astrophys. J. 2012, 763, 36. [Google Scholar] [CrossRef]
- Champion, D.J.; Petroff, E.; Kramer, M.; Keith, M.J.; Bailes, M.; Barr, E.D.; Bates, S.D.; Bhat, N.D.R.; Burgay, M.A.R.T.A.; Burke-Spolaor, S.; et al. Five new fast radio bursts from the HTRU high-latitude survey at Parkes: First evidence for two-component bursts. Mon. Not. R. Astron. Soc. 2016, 460, L30–L34. [Google Scholar] [CrossRef]
- Nan, R.; Li, D.; Jin, C.; Wang, Q.; Zhu, L.; Zhu, W.; Zhang, H.; Yue, Y.; Qian, L. The five-hundred-meter aperture spherical radio telescope (FAST) project. Int. J. Mod. Phys. D 2011, 20, 989–1024. [Google Scholar] [CrossRef]
- Jiang, P.; Yue, Y.; Gan, H.; Yao, R.; Li, H.; Pan, G.; Sun, J.; Yu, D.; Liu, H.; Tang, N.; et al. Commissioning progress of the FAST. Sci. China Phys. Mech. Astron. 2019, 62, 1–22. [Google Scholar] [CrossRef]
- Faulkner, A.J.; Stairs, I.H.; Kramer, M.; Lyne, A.G.; Hobbs, G.; Possenti, A.; Lorimer, D.R.; Manchester, R.N.; McLaughlin, M.A.; D‘Amico, N.; et al. The parkes multibeam pulsar survey–V. Finding binary and millisecond pulsars. Mon. Not. R. Astron. Soc. 2004, 355, 147–158. [Google Scholar] [CrossRef]
- Burgay, M.; Joshi, B.C.; D’Amico, N.; Possenti, A.; Lyne, A.G.; Manchester, R.N.; McLaughlin, M.A.; Kramer, M.; Camilo, F.; Freire, P.C.C. The parkes high-latitude pulsar survey. Mon. Not. R. Astron. Soc. 2006, 368, 283–292. [Google Scholar] [CrossRef]
- Keith, M.J.; Eatough, R.P.; Lyne, A.G.; Kramer, M.; Possenti, A.; Camilo, F.; Manchester, R.N. Discovery of 28 pulsars using new techniques for sorting pulsar candidates. Mon. Not. R. Astron. Soc. 2009, 395, 837–846. [Google Scholar] [CrossRef][Green Version]
- Bates, S.D.; Bailes, M.; Barsdell, B.R.; Bhat, N.D.R.; Burgay, M.; Burke-Spolaor, S.; Champion, D.J.; Coster, P.; D’Amico, N.; Jameson, A.; et al. The high time resolution universe pulsar survey—VI. An artificial neural network and timing of 75 pulsars. Mon. Not. R. Astron. Soc. 2012, 427, 1052–1065. [Google Scholar] [CrossRef]
- Eatough, R.P.; Molkenthin, N.; Kramer, M.; Noutsos, A.; Keith, M.J.; Stappers, B.W.; Lyne, A.G. Selection of radio pulsar candidates using artificial neural networks. Mon. Not. R. Astron. Soc. 2010, 407, 2443–2450. [Google Scholar] [CrossRef]
- Morello, V.; Barr, E.D.; Bailes, M.; Flynn, C.M.; Keane, E.F.; van Straten, W. SPINN: A straightforward machine learning solution to the pulsar candidate selection problem. Mon. Not. R. Astron. Soc. 2014, 443, 1651–1662. [Google Scholar] [CrossRef]
- Lee, K.J.; Stovall, K.; Jenet, F.A.; Martinez, J.; Dartez, L.P.; Mata, A.; Lunsford, G.; Cohen, S.; Biwer, C.M.; Rohr, M.; et al. PEACE: Pulsar evaluation algorithm for candidate extraction–a software package for post-analysis processing of pulsar survey candidates. Mon. Not. R. Astron. Soc. 2013, 433, 688–694. [Google Scholar] [CrossRef]
- Mohamed, T. Pulsar selection using fuzzy knn classifier. Future Comput. Inform. J. 2018, 3, 1–6. [Google Scholar] [CrossRef]
- Lyon, R.J.; Stappers, B.W.; Cooper, S.; Brooke, J.M.; Knowles, J.D. Fifty years of pulsar candidate selection: From simple filters to a new principled real-time classification approach. Mon. Not. R. Astron. Soc. 2016, 459, 1104–1123. [Google Scholar] [CrossRef]
- Tan, C.M.; Lyon, R.J.; Stappers, B.W.; Cooper, S.; Hessels, J.W.T.; Kondratiev, V.I.; Michilli, D.; Sanidas, S. Ensemble candidate classification for the LOTAAS pulsar survey. Mon. Not. R. Astron. Soc. 2018, 474, 4571–4583. [Google Scholar] [CrossRef]
- LeCun, Y.; Bottou, L.; Bengio, Y.; Haffner, P. Gradient-based learning applied to document recognition. Proc. IEEE 1998, 86, 2278–2324. [Google Scholar] [CrossRef]
- Zhu, W.W.; Berndsen, A.; Madsen, E.C.; Tan, M.; Stairs, I.H.; Brazier, A.; Lazarus, P.; Lynch, R.; Scholz, P.; Stovall, K.; et al. Searching for pulsars using image pattern recognition. Astrophys. J. 2014, 781, 117–129. [Google Scholar] [CrossRef]
- He, K.; Zhang, X.; Ren, S.; Sun, J. Deep residual learning for image recognition. In Proceedings of the IEEE Conference on Computer Vision and Pattern Recognition, Las Vegas, NV, USA, 27–30 June 2016; pp. 770–778. [Google Scholar]
- Wang, H.; Zhu, W.; Guo, P.; Li, D.; Feng, S.; Yin, Q.; Miao, C.; Tao, Z.; Pan, Z.; Wang, P.; et al. Pulsar candidate selection using ensemble networks for FAST drift-scan survey. Sci. China Phys. Mech. Astron. 2019, 62, 1–10. [Google Scholar] [CrossRef]
- Guo, P.; Duan, F.; Wang, P.; Yao, Y.; Yin, Q.; Xin, X.; Li, D.; Qian, L.; Wang, S.; Pan, Z.; et al. Pulsar candidate classification using generative adversary networks. Mon. Not. R. Astron. Soc. 2019, 490, 5424–5439. [Google Scholar] [CrossRef]
- Liu, G.; Li, Y.; Bao, Z.; Yin, Q.; Guo, P. Pulsar identification based on variational autoencoder and residual network. In Proceedings of the 2021 11th International Conference on Intelligent Control and Information Processing (ICICIP), Dali, China, 3–7 December 2021; pp. 188–194. [Google Scholar]
- Woo, S.; Park, J.; Lee, J.Y.; Kweon, I.S. CBAM: Convolutional block attention module. In Proceedings of the European Conference on Computer Vision (ECCV), Munich, Germany, 8–14 September 2018; pp. 3–19. [Google Scholar]
- Kingma, D.P.; Ba, J. Adam: A method for stochastic optimization. arXiv 2014, arXiv:1412.6980. [Google Scholar]
Publisher’s Note: MDPI stays neutral with regard to jurisdictional claims in published maps and institutional affiliations. |
© 2022 by the authors. Licensee MDPI, Basel, Switzerland. This article is an open access article distributed under the terms and conditions of the Creative Commons Attribution (CC BY) license (https://creativecommons.org/licenses/by/4.0/).