Article

Defect Detection for Metal Base of TO-Can Packaged Laser Diode Based on Improved YOLO Algorithm

1
School of Mechanical Engineering, Jiangnan University, Wuxi 214122, China
2
Jiangsu Key Laboratory of Advanced Food Manufacturing Equipment and Technology, Wuxi 214122, China
*
Author to whom correspondence should be addressed.
Electronics 2022, 11(10), 1561; https://doi.org/10.3390/electronics11101561
Submission received: 6 April 2022 / Revised: 1 May 2022 / Accepted: 10 May 2022 / Published: 13 May 2022
(This article belongs to the Section Optoelectronics)

Abstract

:
Defect detection is an important part of the manufacturing process of mechanical products. In order to detect the appearance defects quickly and accurately, a method of defect detection for the metal base of TO-can packaged laser diode (metal TO-base) based on the improved You Only Look Once (YOLO) algorithm named YOLO-SO is proposed in this study. Firstly, convolutional block attention mechanism (CBAM) module was added to the convolutional layer of the backbone network. Then, a random-paste-mosaic (RPM) small object data augmentation module was proposed on the basis of Mosaic algorithm in YOLO-V5. Finally, the K-means++ clustering algorithm was applied to reduce the sensitivity to the initial clustering center, making the positioning more accurate and reducing the network loss. The proposed YOLO-SO model was compared with other object detection algorithms such as YOLO-V3, YOLO-V4, and Faster R-CNN. Experimental results demonstrated that the YOLO-SO model reaches 84.0% mAP, 5.5% higher than the original YOLO-V5 algorithm. Moreover, the YOLO-SO model had clear advantages in terms of the smallest weight size and detection speed of 25 FPS. These advantages make the YOLO-SO model more suitable for the real-time detection of metal TO-base appearance defects.

1. Introduction

Laser diode (LD), also known as a semiconductor laser, is widely used in the field of optical communication. As the most common means of the coaxial package in the LD industry, the TO-can package has been wildly used in the field of low-power laser packages [1,2,3]. As shown in Figure 1, the metal base is an important part of a TO-can, used to connect pins and luminous semiconductors. Thus, the thickness of the metal base directly affects the parasitic capacitance generated by the pin and metal base [4]. On the other hand, the metal cap with an optical lens is welded on the metal base by a resistance-welding machine under nitrogen protection. It indicates that the metal base has an impact on the coaxial package errors, which in turn affects the coupling efficiencies of high-speed LD modules. This places a high demand on the surface accuracy of the metal base.
However, due to the manufacturing process and the production environment, the metal base of the TO-can packaged laser diode (metal TO-base) inevitably has defects such as patches, rust, and scratches. These defects not only have damage to the aesthetic degree but also affect their performance and service life [5]. Therefore, detecting the appearance defects of the metal TO-base in the manufacturing process is of great significance to ensure the high quality of the parts.
The traditional manual defect detection is subjective and has problems such as easily missed detection, high cost, and low efficiency, making it difficult to meet the demand of enterprises for production efficiency [6]. With the development of machine vision technology, automatic appearance defect detection means were introduced into the manufacture of mechanical products. The early machine vision detection techniques include traditional image processing methods (e.g., HOG [7], SIFT [8], HARR [9], among others) and machine learning methods based on hand-crafted features [10]. However, these methods are susceptible to factors such as the shape, size, location, and external environment of the target object, making them difficult to be applied to practical projects on a large scale [11].
In recent years, deep learning based on a convolutional neural network (CNN) has been the main research direction in the fields of image classification [12], object detection [13], and semantic segmentation [14]. Object detection algorithms have been widely used in many areas, such as self-driving technologies [15], facial recognition [16], and surveillance and security [17]. However, compared to other computer vision applications, the method based on deep learning has not been used on a large scale for appearance defect detection for mechanical products in industrial applications. We believe that there are two reasons for this: (I) in contrast to other areas of computer vision, there are very few large public databases for appearance defect detection for mechanical products [18]; (II) the size of the defects to be detected in mechanical products varies widely. Taking the metal TO-base in this study as an example, there are a large number of small-target defects. The currently commonly used target detection networks based on deep learning have poor detection accuracy for small targets.
In order to overcome these problems and apply the computer vision technology to industrial production actually, a method of defect detection for the metal base of TO-can packaged laser diode based on an improved YOLO network is proposed in this study. The main work can be summarized as follows:
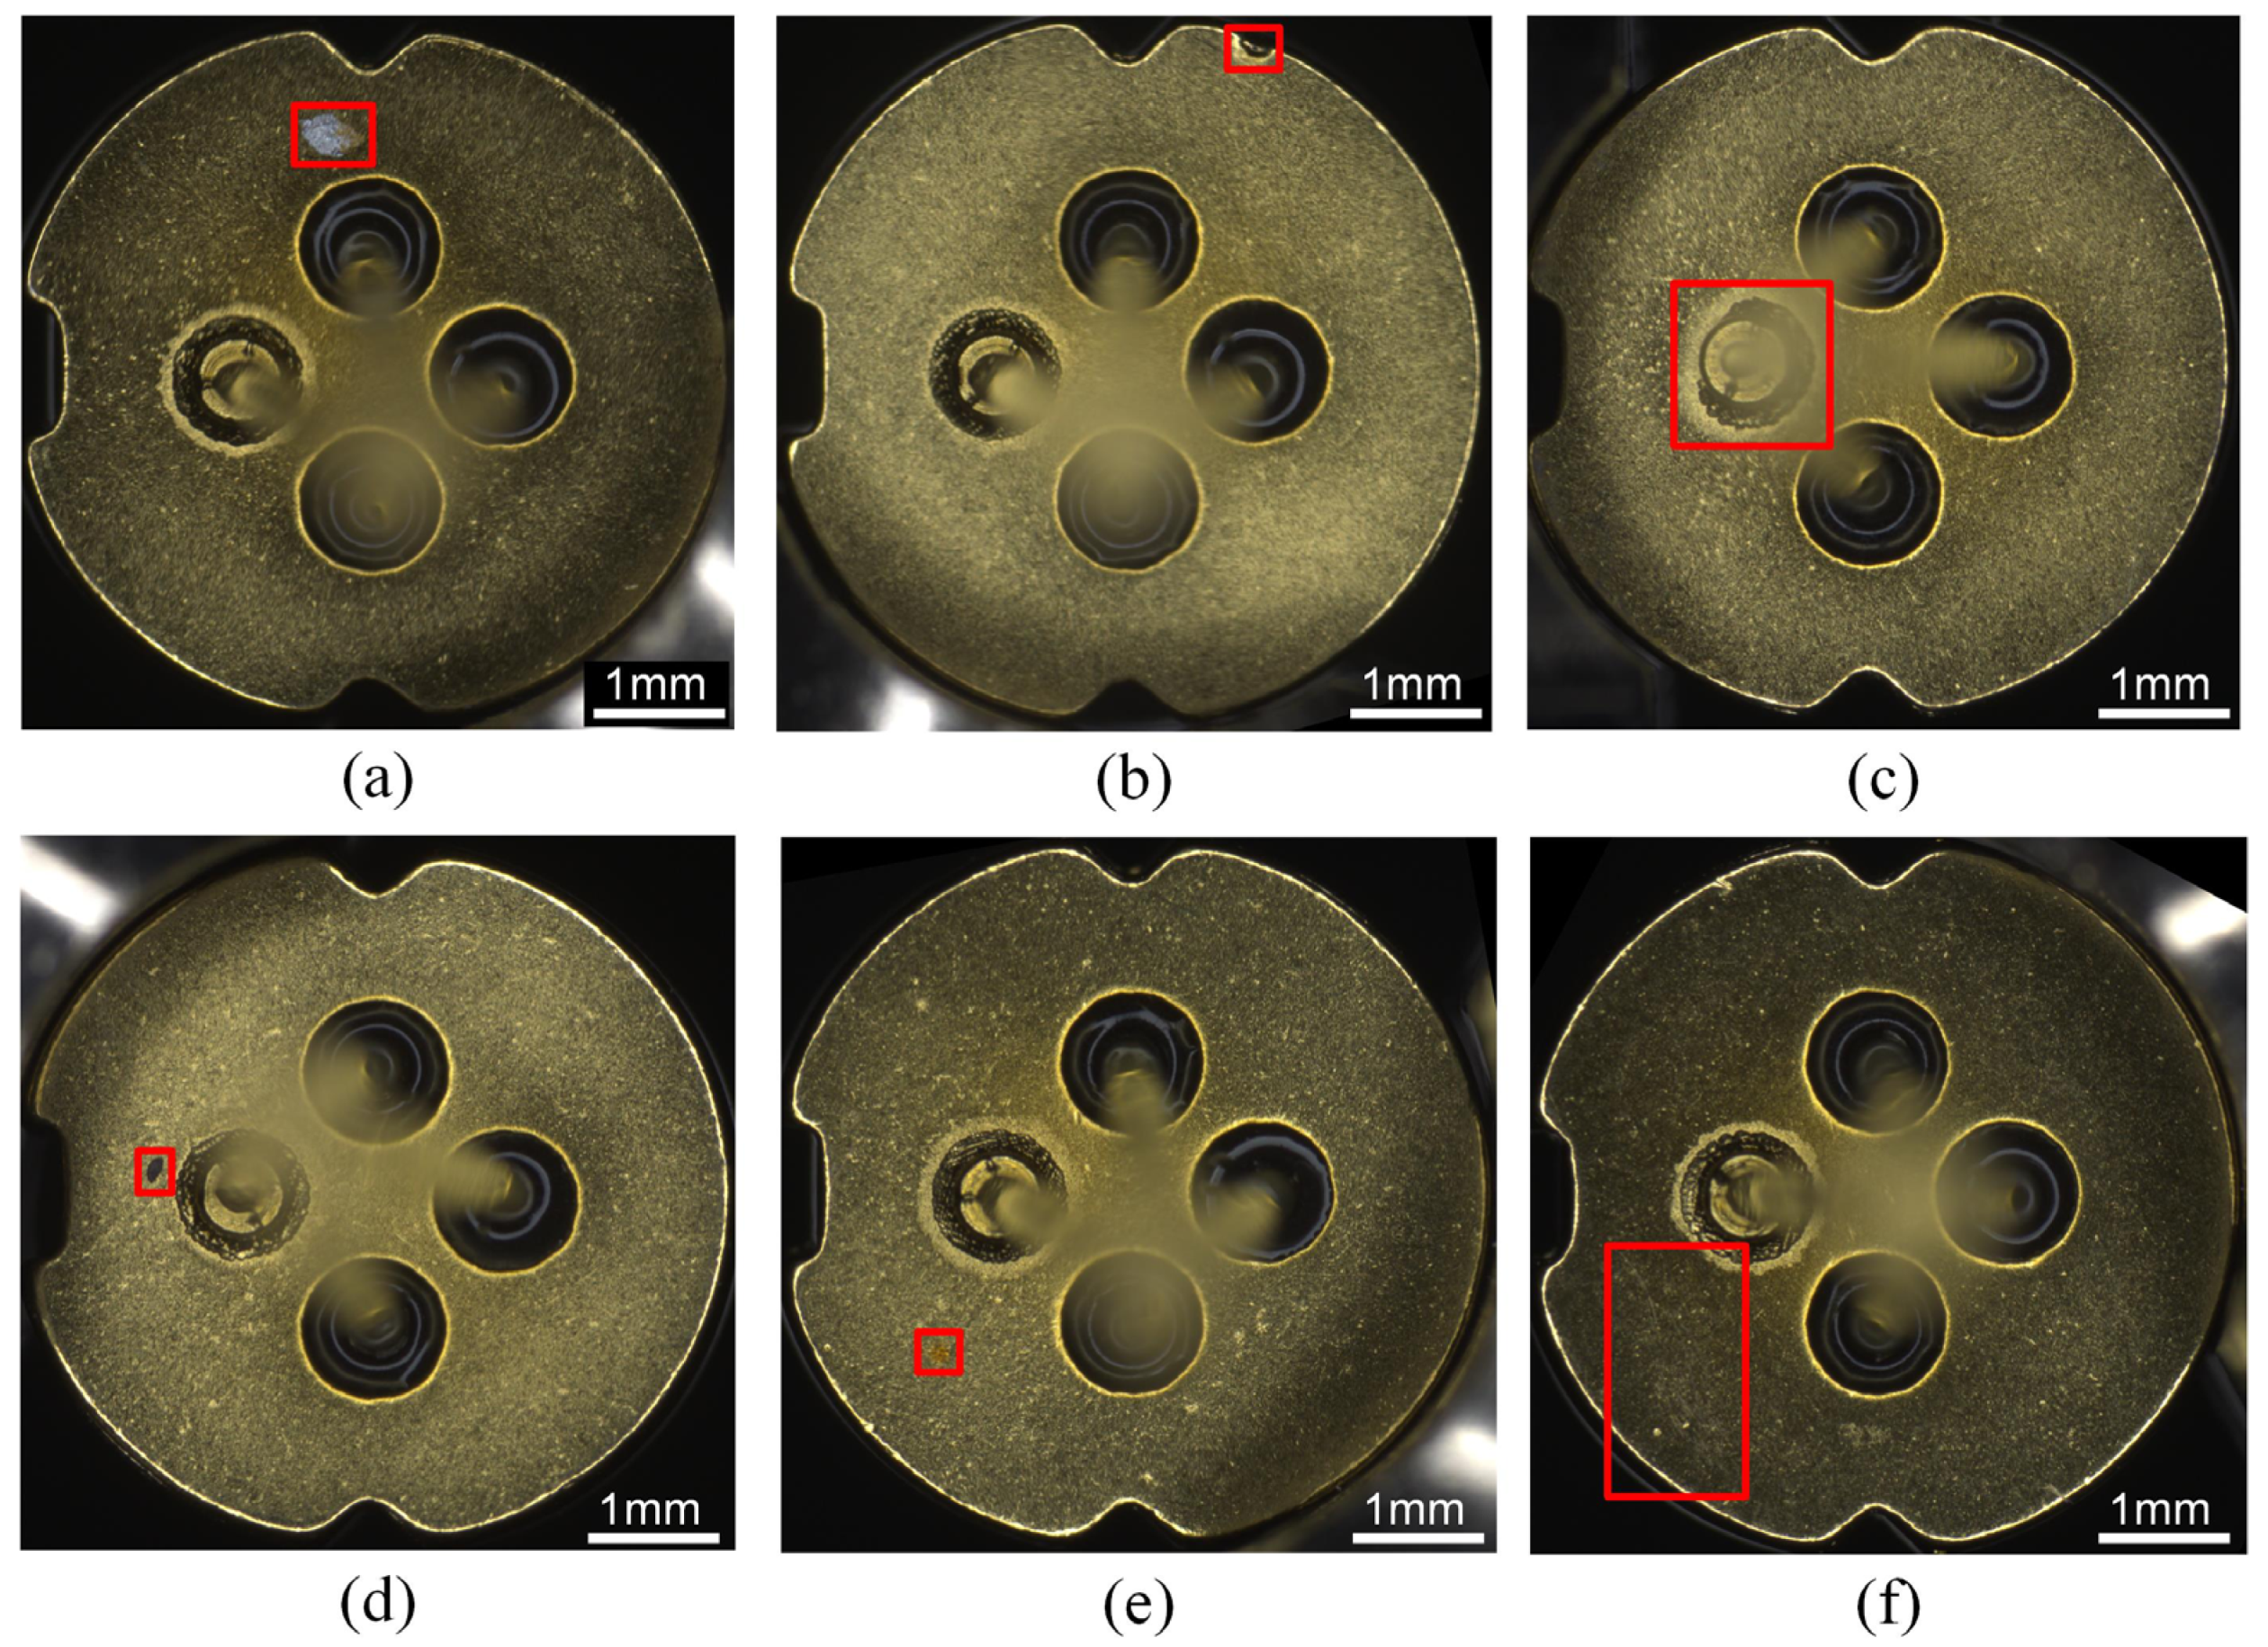
  • Building image dataset. On the basis of obtaining metal TO-base appearance defect images, we used Labelme open-source tool to label the appearance defects in the image and built a dataset for metal TO-base appearance defects.
  • Proposing a metal TO-base defect detection model called YOLO-SO based on the YOLO-V5 framework. According to the characteristics of the metal TO-base dataset, the model’s structure was developed from three aspects, including convolutional block attention mechanism (CBAM), random-paste-mosaic (RPM) small-target data augmentation, and optimization of anchor box clustering algorithm.
  • Training and testing the YOLO-SO model. The training of the YOLO-SO model was implemented based on Pytorch and the high-performance GPU computing platform, and the performance of the YOLO-SO model was tested and evaluated on the test dataset. This study also compared the improved YOLO-V5 model with the already existing state-of-the-art object detection algorithms and demonstrated the effectiveness of the modified model.

2. Related Work

Current mainstream object detection methods based on deep learning can be divided into two categories: candidate region-based deep learning object detection algorithm and regression-based deep learning object detection algorithm.
Candidate region-based detection algorithm, also known as two-stage algorithms, has high detection accuracy. This method firstly generates candidate regions on the input image and then classifies and regresses the target in the candidate regions. The representative algorithms are the R-CNN series algorithm [19,20,21], FPN [22], etc. Xu et al. [23] proposed a multi-stage balanced R-CNN (MSB R-CNN) for defect detection based on Cascade R-CNN and adopted deformable convolution in different stages of the backbone network. Zhang et al. [24] use an improved Faster R-CNN algorithm to detect solder joint defects in the connectors. However, this type of method has a long detection time for a single image and cannot be applied to real-time detection.
Regression-based detection algorithm, also known as the one-stage method, locates and classifies the target directly by end-to-end method with high speed, mainly including SSD [25] and YOLO series algorithm [26,27,28]. By transforming the object detection problem into an end-to-end regression problem to obtain the bounding box coordinates and category confidence, this method is highly versatile and accurate, which makes the detection speed of the model greatly improved and suitable for real-time detection. Zhao et al. [29] proposed an automatic detection method called multi-stage pipeline for defect detection (MPDD) for electric multiple units key components. Duan et al. [30] proposed a method for the recognition of casting defects based on improved YOLO v3. Liu et al. [31] proposed the modified YOLO-tiny for insulator (MTI-YOLO) network for insulator detection in complex aerial images. In order to improve the detection accuracy of different sizes of insulators, a structure of multi-scale feature fusion and the spatial pyramid pooling model are adopted to the network. With the continuous improvement of the network, the accuracy of the first-stage detection algorithm has been gradually improved.
It can be inferred from the above research that the biggest problem of current defect detection methods for mechanical products is the contradiction between detection accuracy and detection speed. In order to achieve real-time detection while improving detection accuracy, especially for small targets, we focused on the YOLO-V5 object detection algorithm based on the deep neural network, combined with the attention mechanism and small object data augmentation method, and proposed a defect detection method for metal TO-base.

3. Materials and Methods

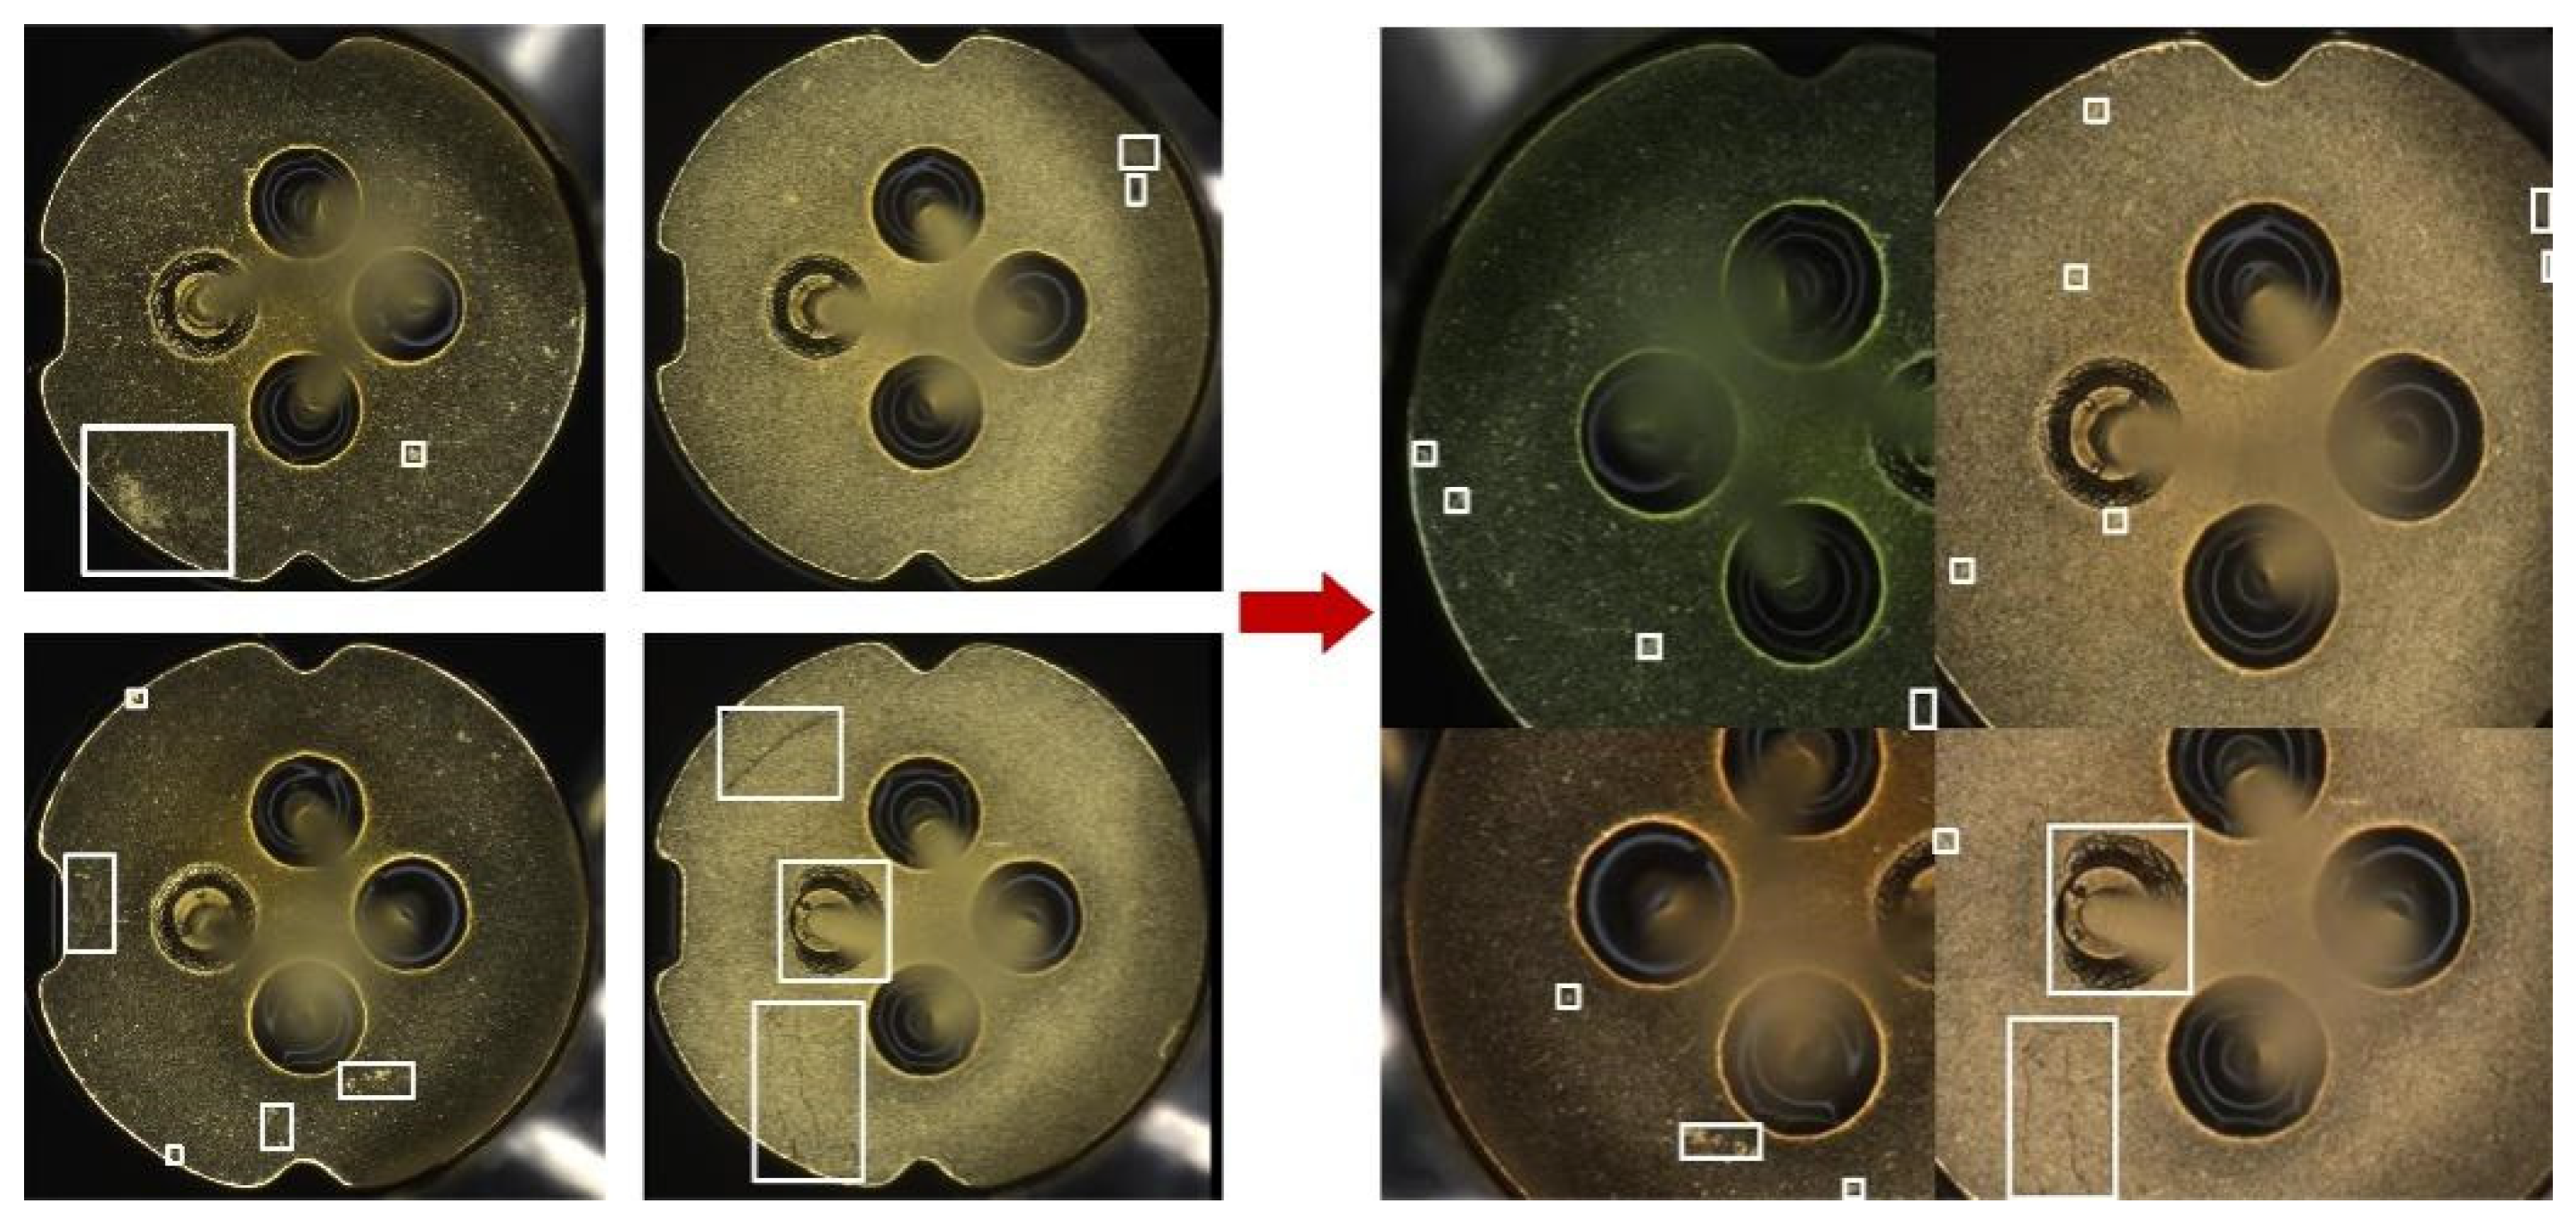
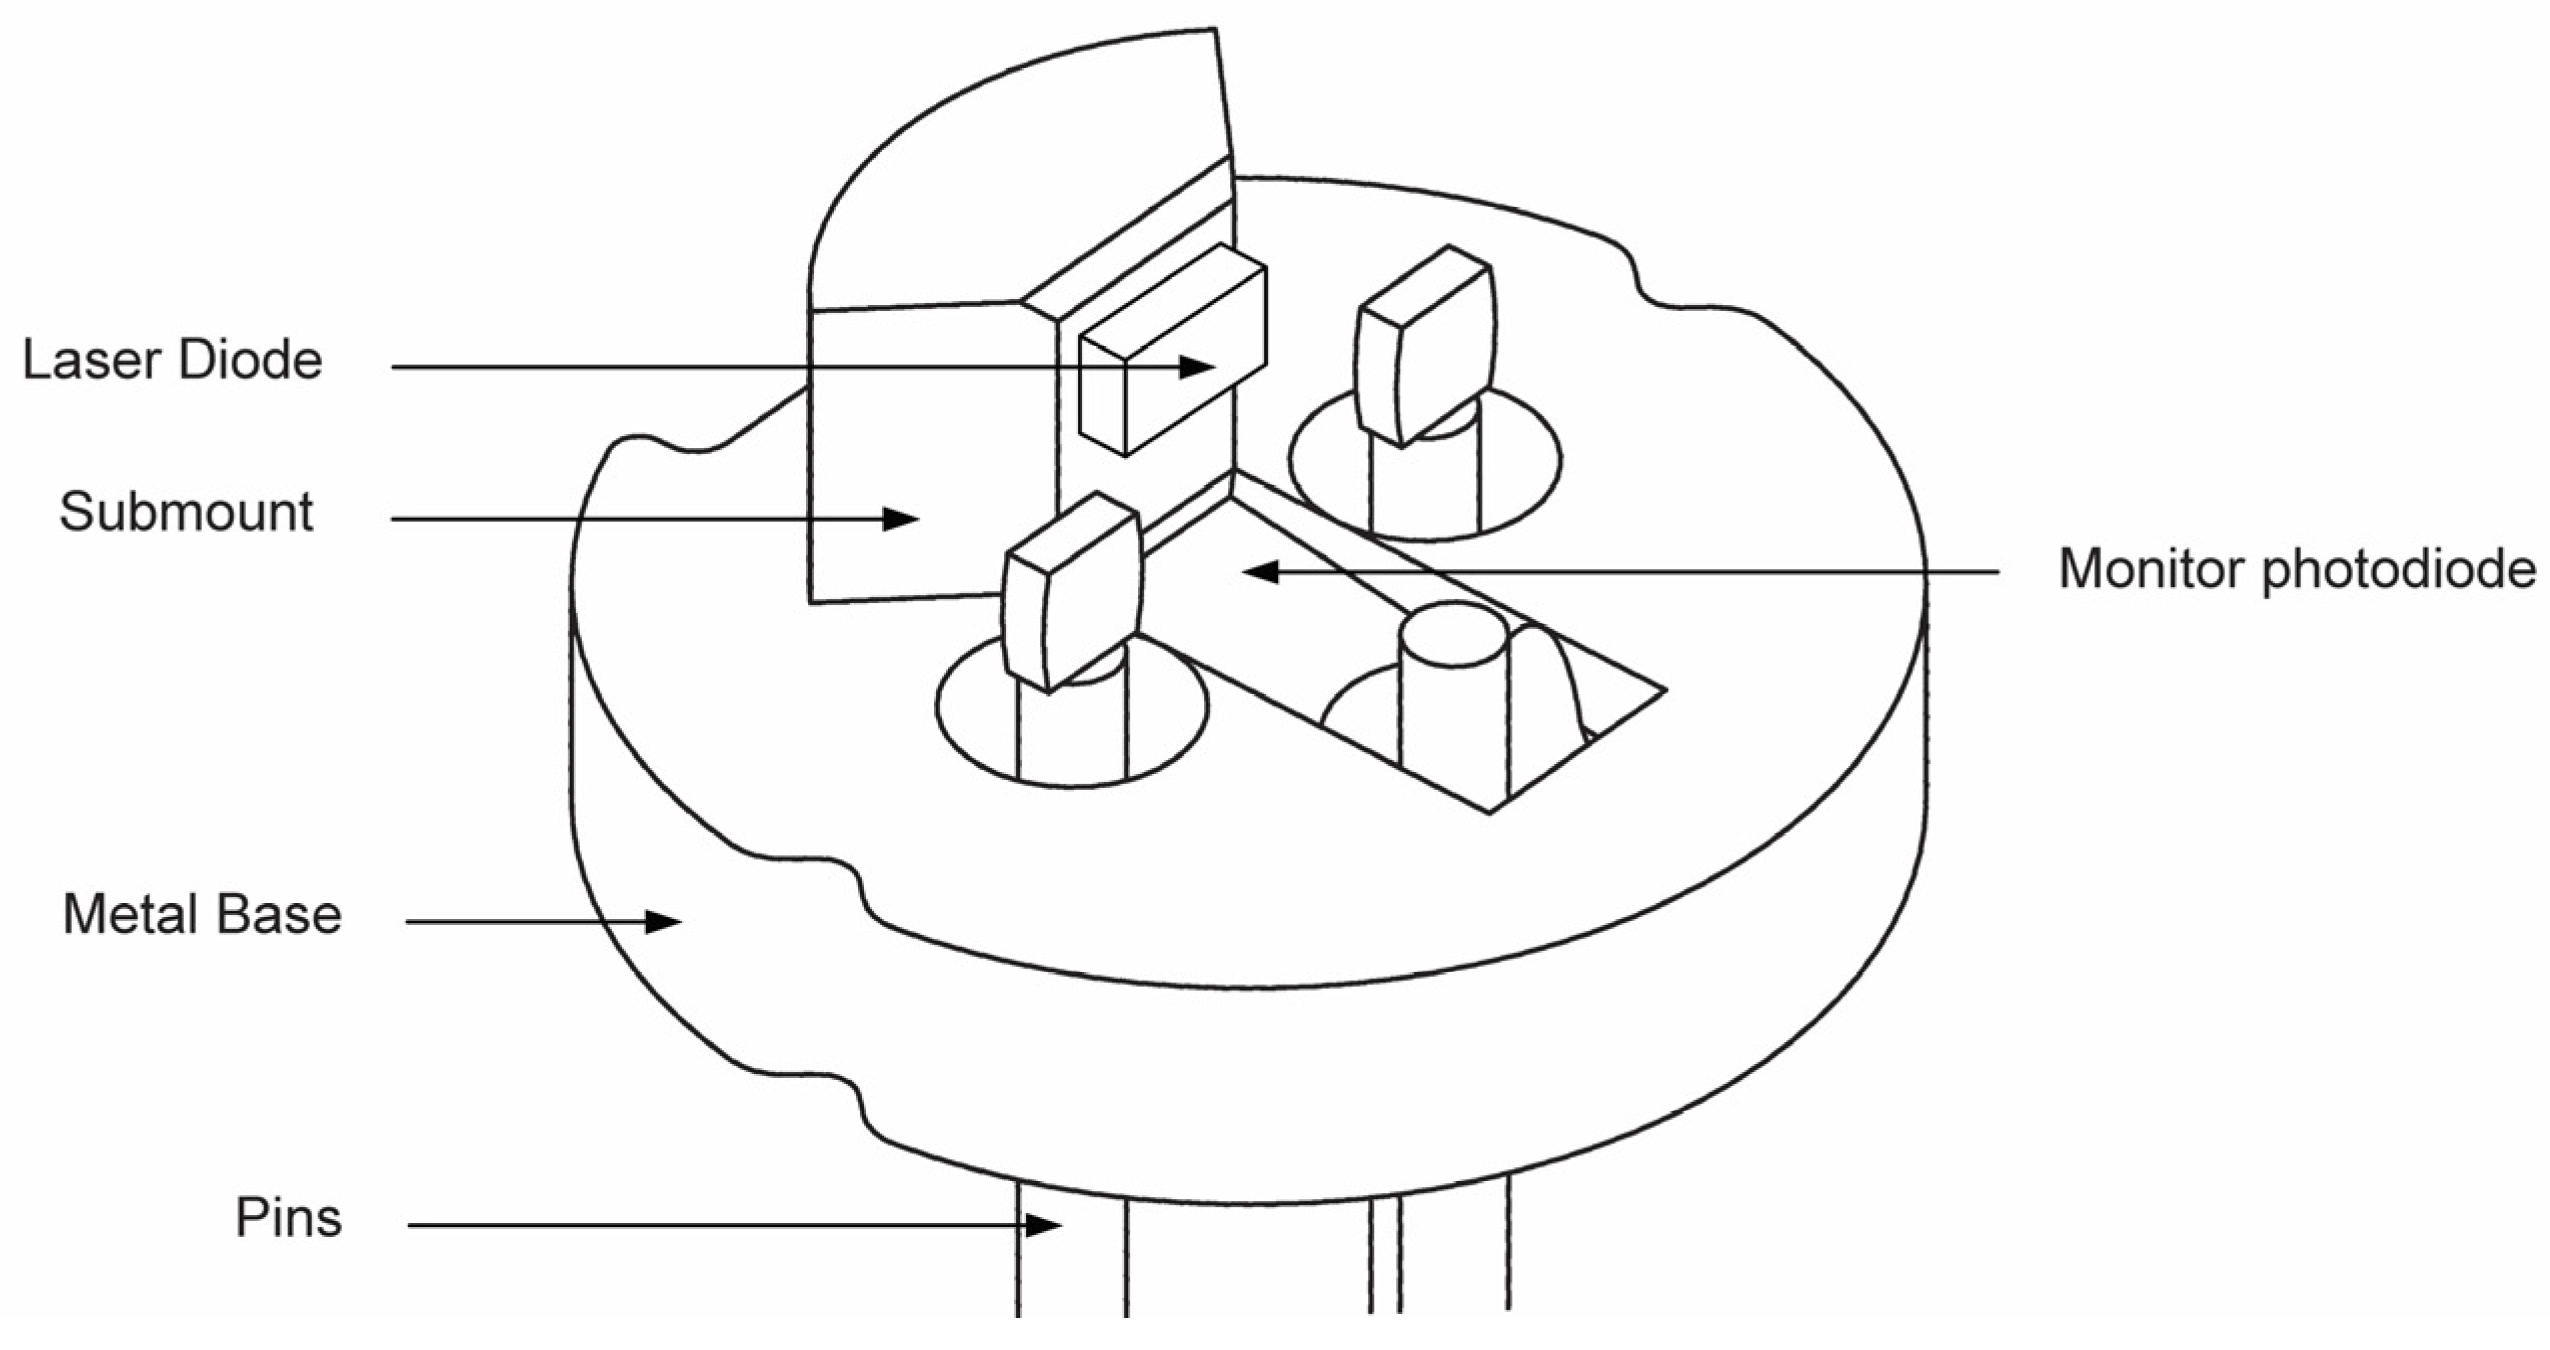
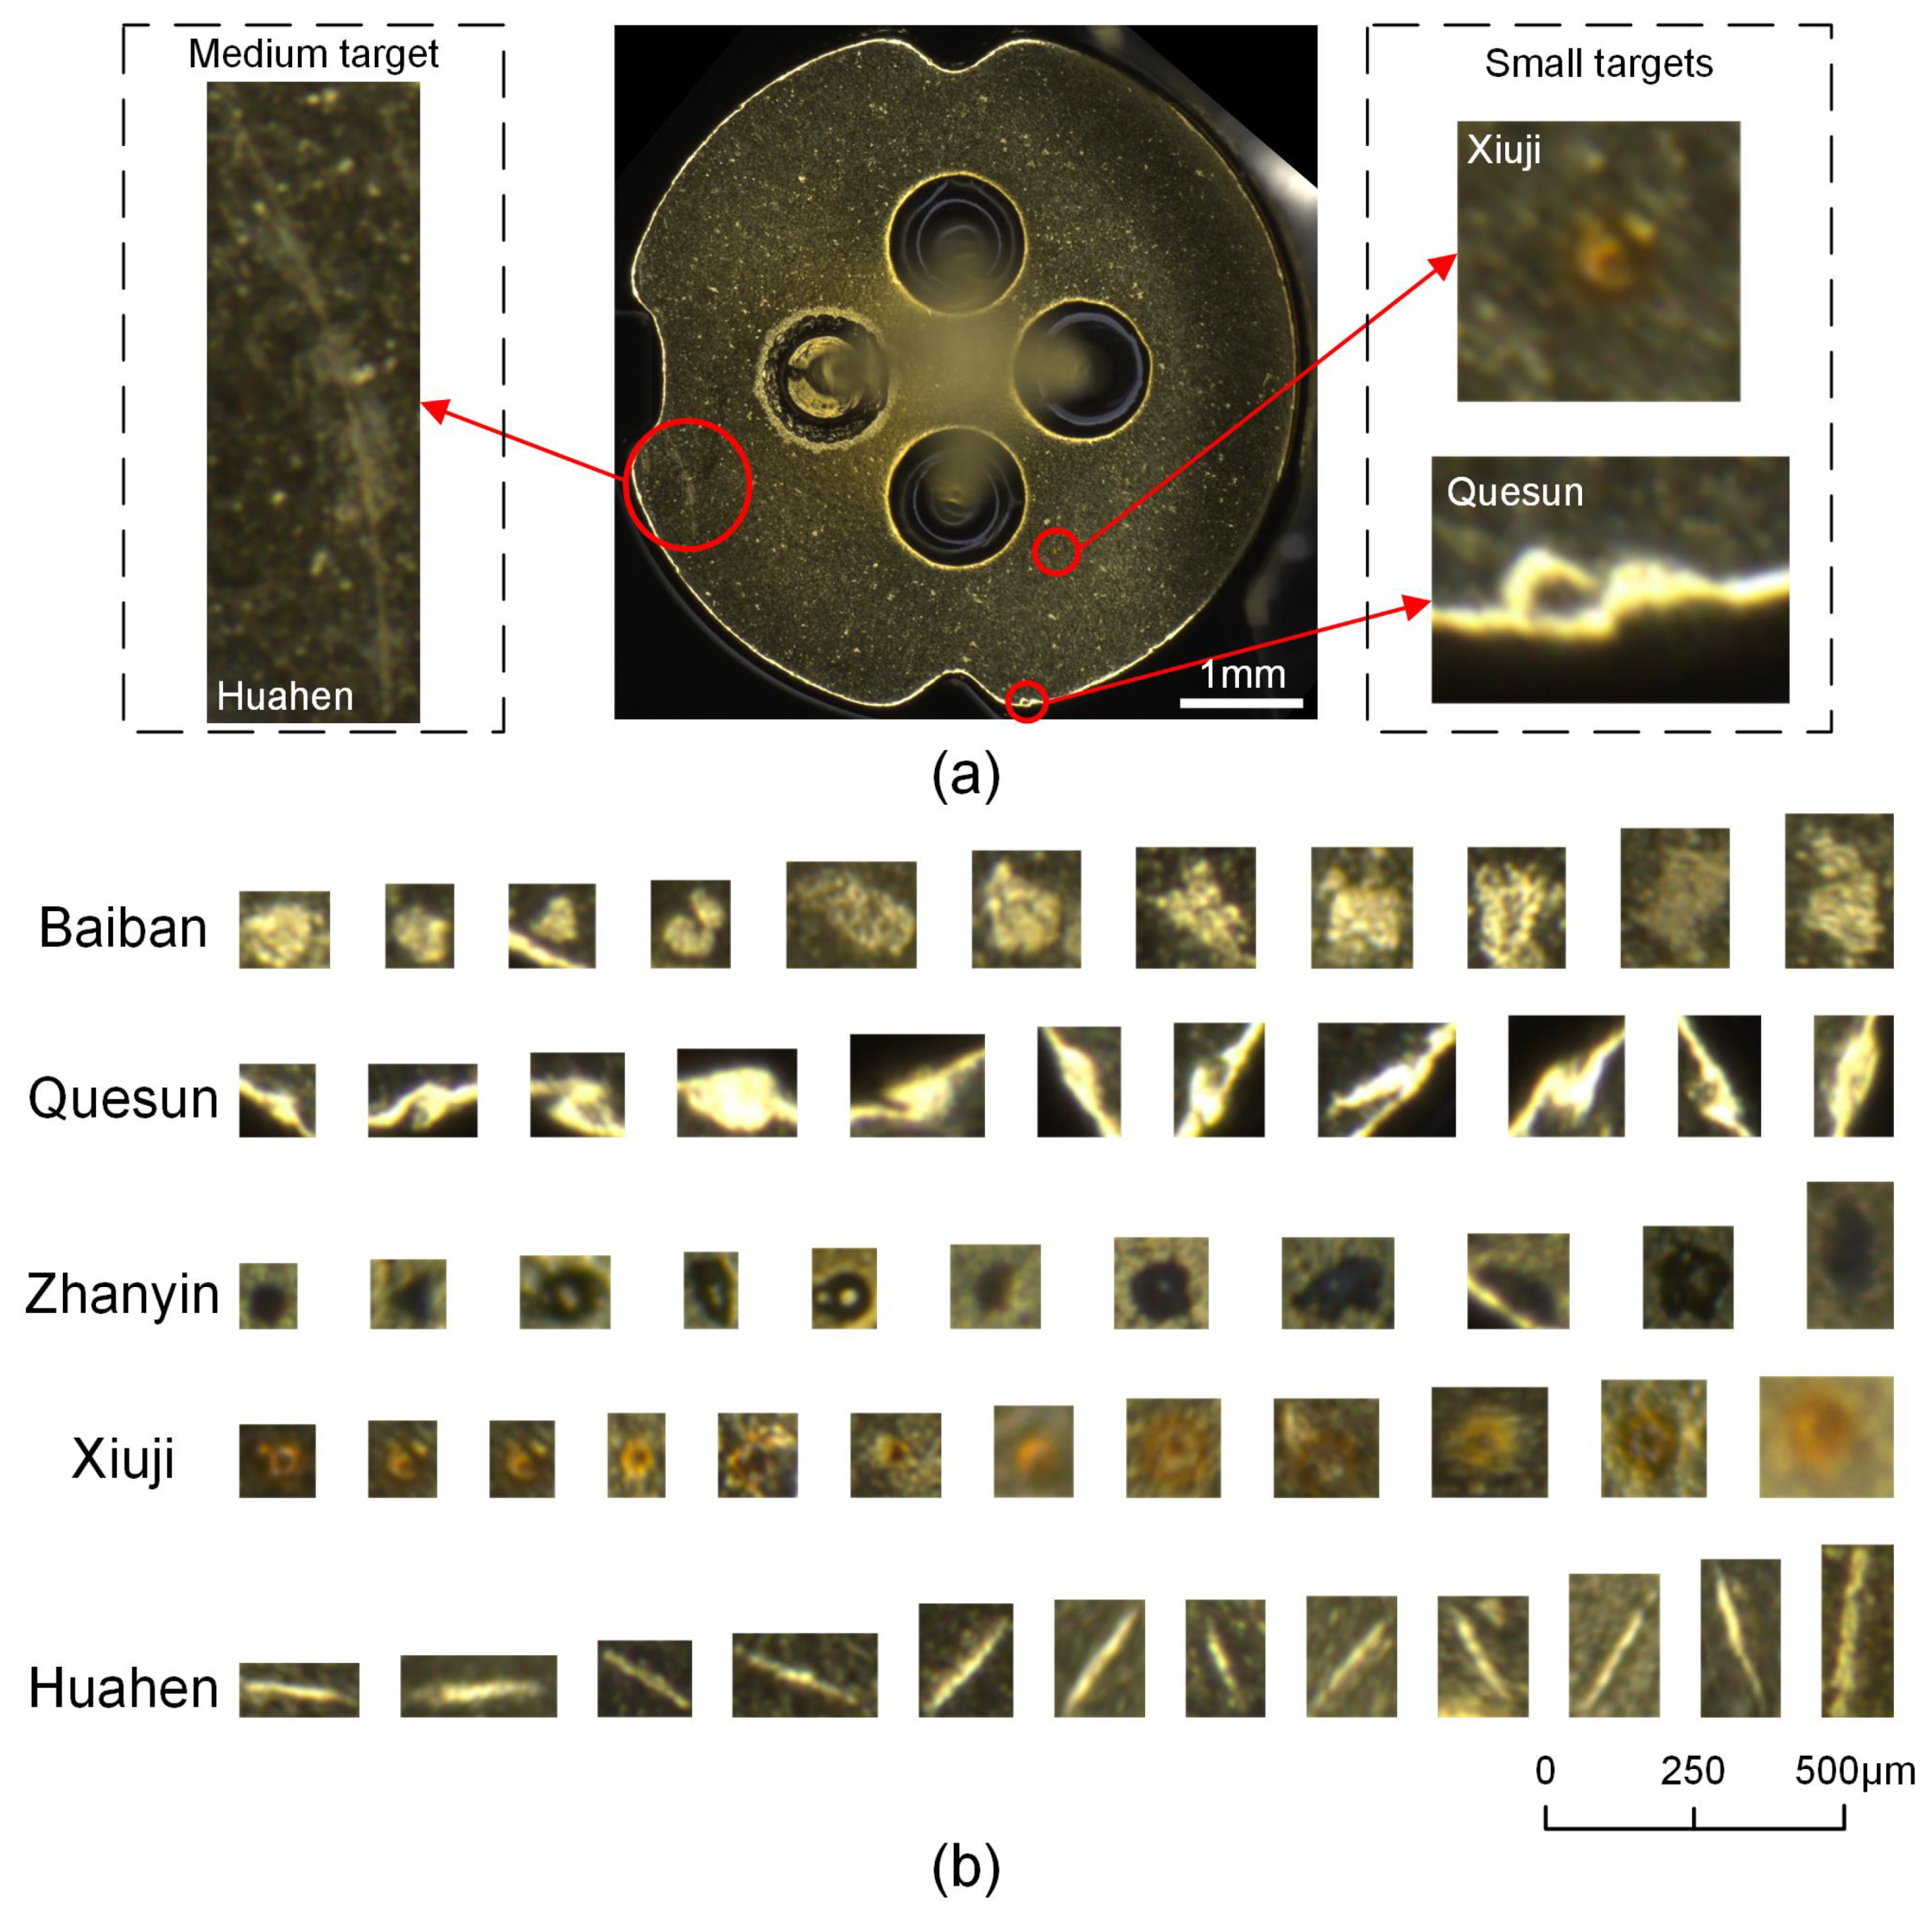
3.1. Metal TO-Base Defect Dataset

At present, there are few complete public datasets in the field of defect detection of mechanical products, so the metal TO-base defect dataset in this paper is self-made. Images were obtained from 5.6 mm outer diameter metal TO-base defect samples in a semiconductor laser manufacturer. A total of 1051 original images were obtained using an industrial camera. Since the number of defect samples is much less than normal samples in the process of TO-base production, and the data distribution of each type of defect is not uniform, data augmentation is used to increase the number of image defects. It could expand the number of images and avoid the model overfitting. The images were horizontally flipped, ±15° rotated, and brightness adjusted, resulting in a total of 1500 available metal TO-base defect images, 250 images of each type. The dataset was split in a ratio of 8:1:1 as follows: 1200 images for training, 150 images for validation, and 150 images for testing.
As shown in Figure 2, six types of defect labels were identified according to the common type of metal TO-base defects: Baiban, Quesun, Yinbujun, Zhanyin, Xiuji, and Huahen. Among them, Baiban may reduce the corrosion resistance of the surface of the metal TO-base, which in turn leads to the appearance of Xiuji. Due to the uneven bonding of Yinbujun, the reliability of the bonding will be affected, leading to bonding failure. All these defects will eventually lead to stress concentration, fatigue fracture of the product, and eventual package failure. These defects in each image were manually labeled using the open-source image annotation tool Labelme, with the minimum external rectangle of the target as the ground truth box.

3.2. Method

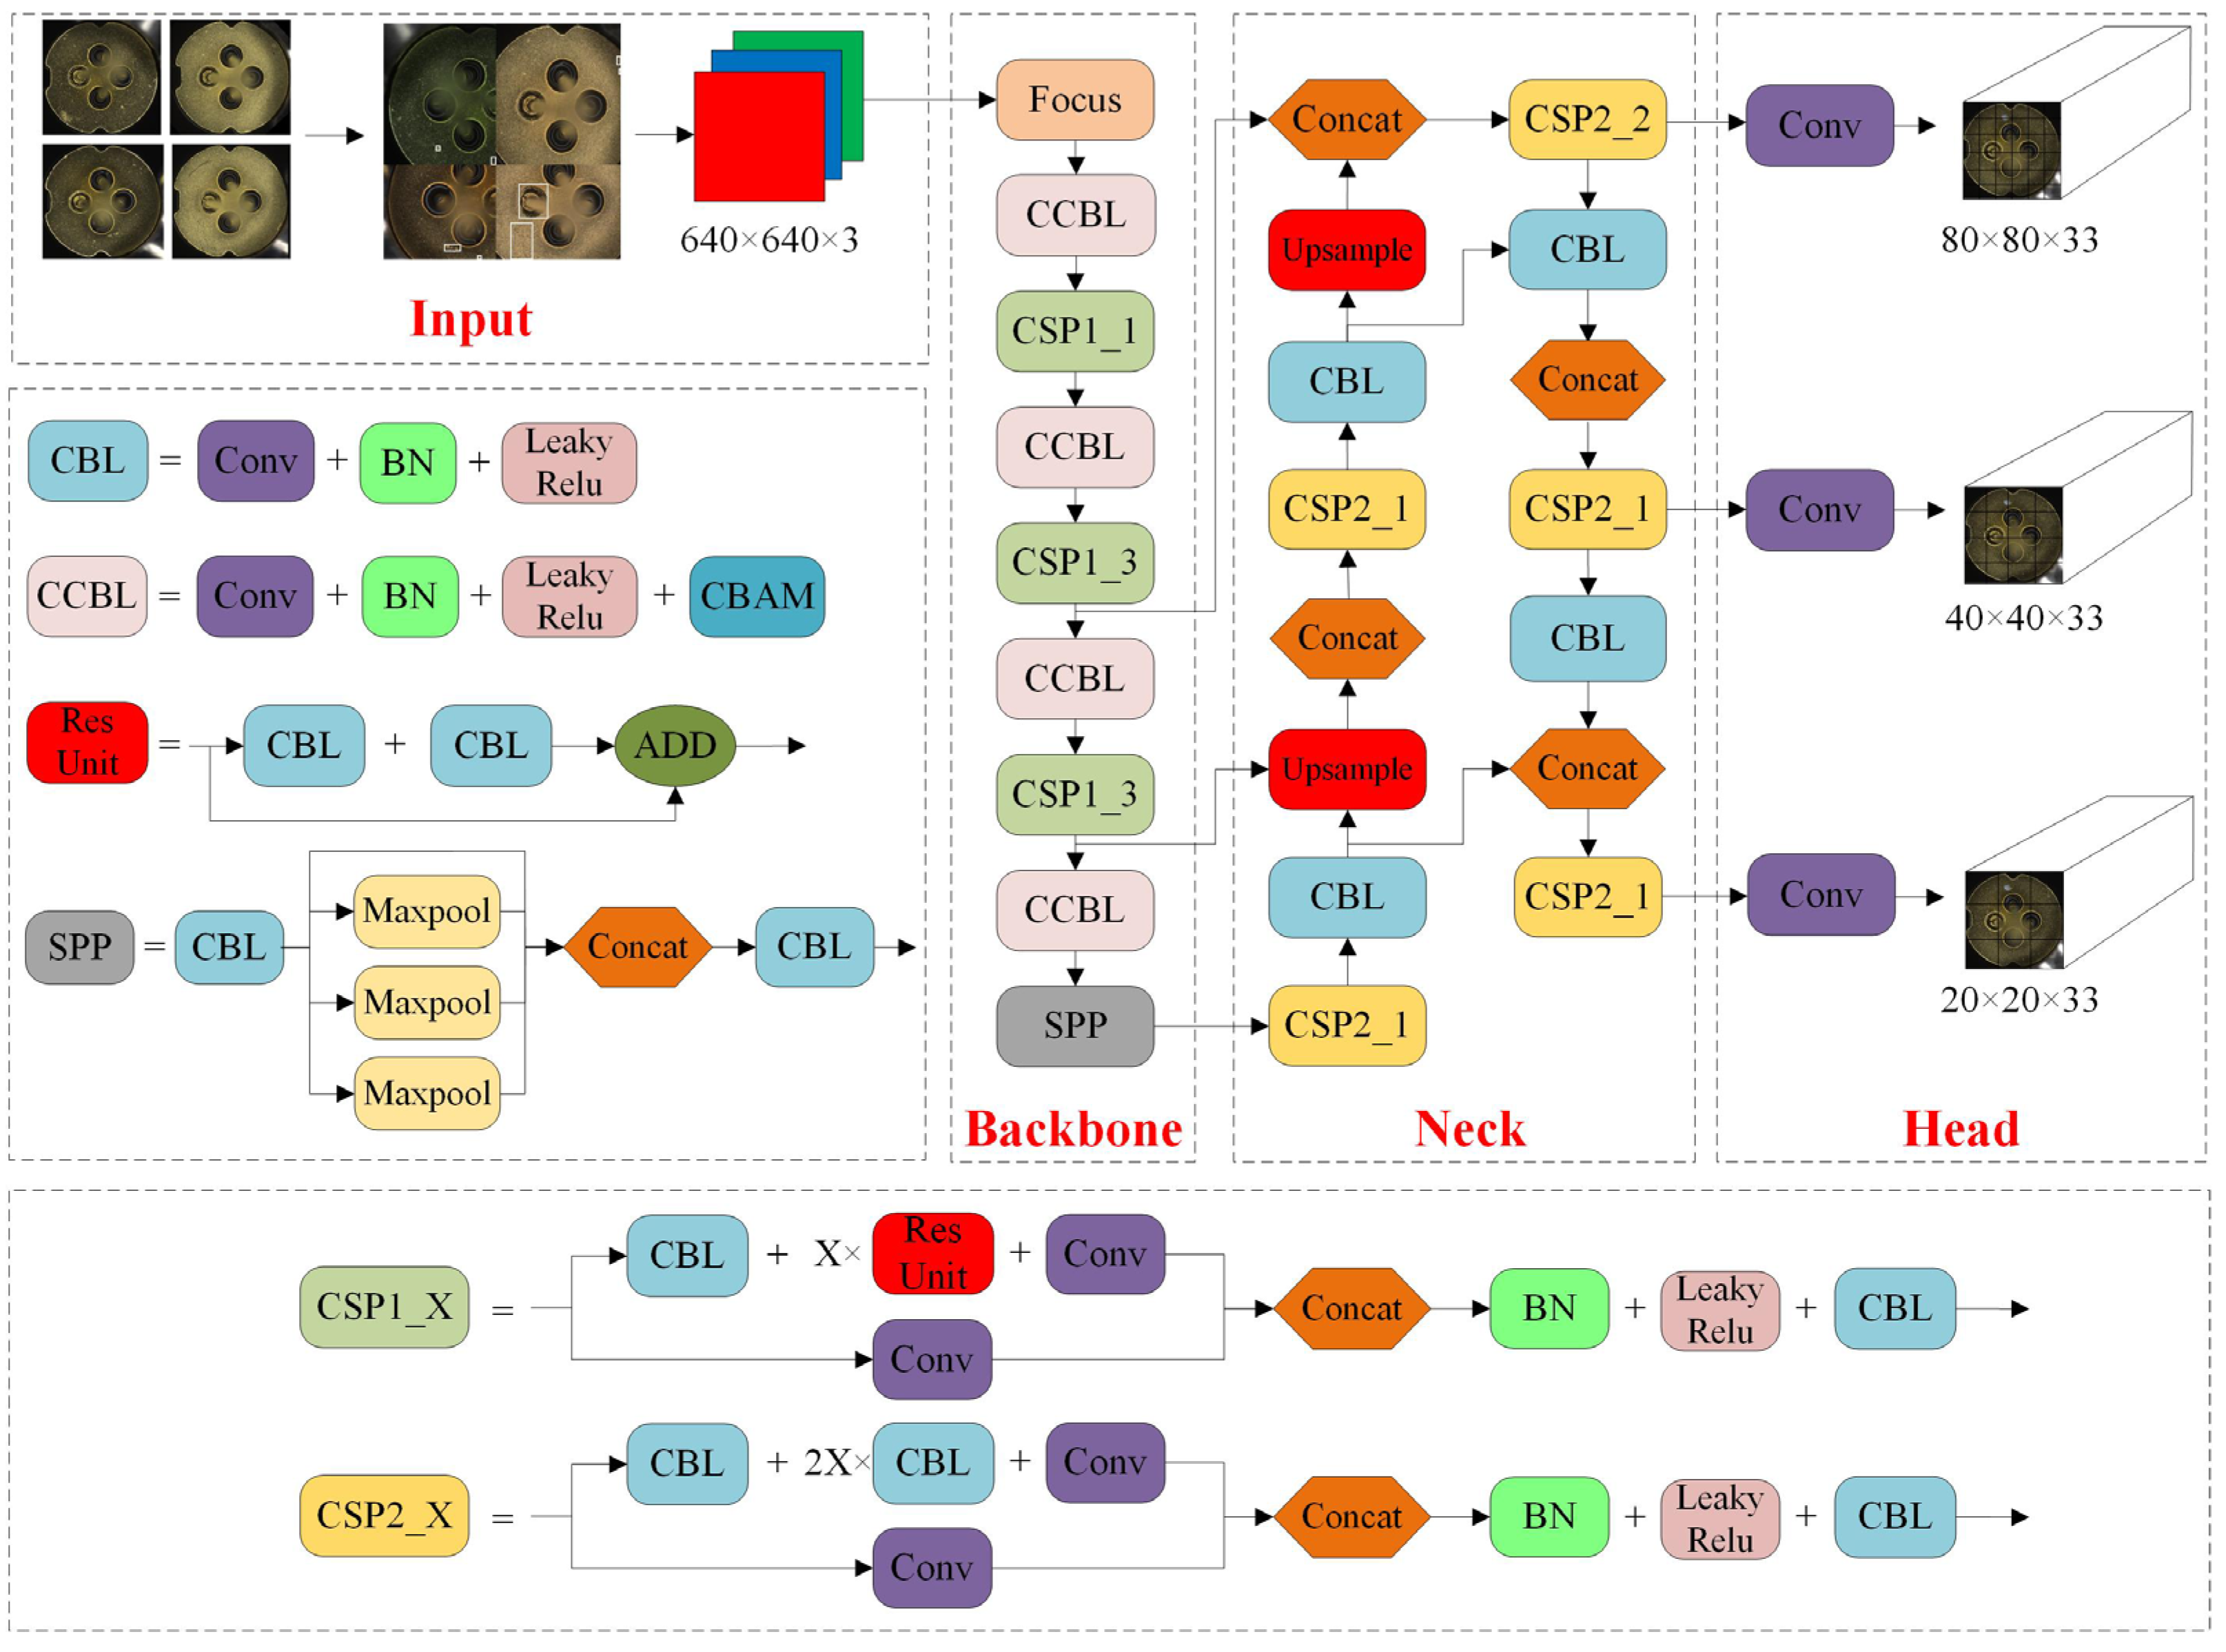
3.2.1. Structure of YOLO-SO Network

YOLO-V5 algorithm is a one-stage object detection algorithm based on regression that transforms image data information into the location and category information of the target object through deep convolutional neural networks. It can achieve high detection accuracy while ensuring real-time detection. Figure 3 shows the structure of the YOLO-SO defect detection model based on the YOLO-V5 algorithm, which consists of four parts: Input, Backbone, Neck, and Head.
The Backbone feature extraction network of the YOLO-SO model uses CSPDarknet-53, which draws on the cross-stage partial network [32] to incorporate three CSP modules based on Darknet53. The CBL module is the minimum structure of the feature extraction network, consisting of a convolutional layer, a batch normalization layer, and a Leaky ReLU activation function for extracting the input image features. Based on CSPDarknet-53, the Backbone was improved by adding a convolutional block attention mechanism (CBAM) to enhance feature extraction. Figure 4 shows the mechanism of the CBAM module, which consists of a channel attention module (CAM) and a spatial attention module (SAM). CAM module focuses on the channels with the main characteristics of the target, while the SAM module pays attention to spatial locations and determines where the main information of the target is located in the feature channel. CBAM module can improve the detection accuracy of the model with almost no increase in model computation.
The final defect detection is performed in the part of the Head, where the YOLO-SO algorithm outputs class probabilities and the relative position of the bounding box. YOLO-V5 algorithm divides the input image into S × S grids, and each grid detects the target where the central point is located within it. The prediction results of the output bounding box are expressed as (x, y, w, h, C), in which x and y represent the coordinates of the central point of the boundary box, w and h represent the width and height of the bounding box, and C is the confidence of the prediction result. The coordinates of the bounding box are obtained from the linear regression fine-tuning (translation and scale scaling) of the preset anchor box size, and the conversion formula is:
{ x = σ ( t x ) × 2 0.5 + c x y = σ ( t y ) × 2 0.5 + c y w = a w ( 2 σ ( t w ) ) 2 h = a h ( 2 σ ( t h ) ) 2 ,
where σ is the Sigmoid activation function; t x and t y denote the distance between the center coordinate of the bounding box and the upper left point coordinate of the grid; c x and c y denote coordinates of the upper left point of the grid where the anchor box is located; t w and t h denote the scaling factor for width and height of bounding box and anchor box; a w and a h are the width and height of the anchor box.

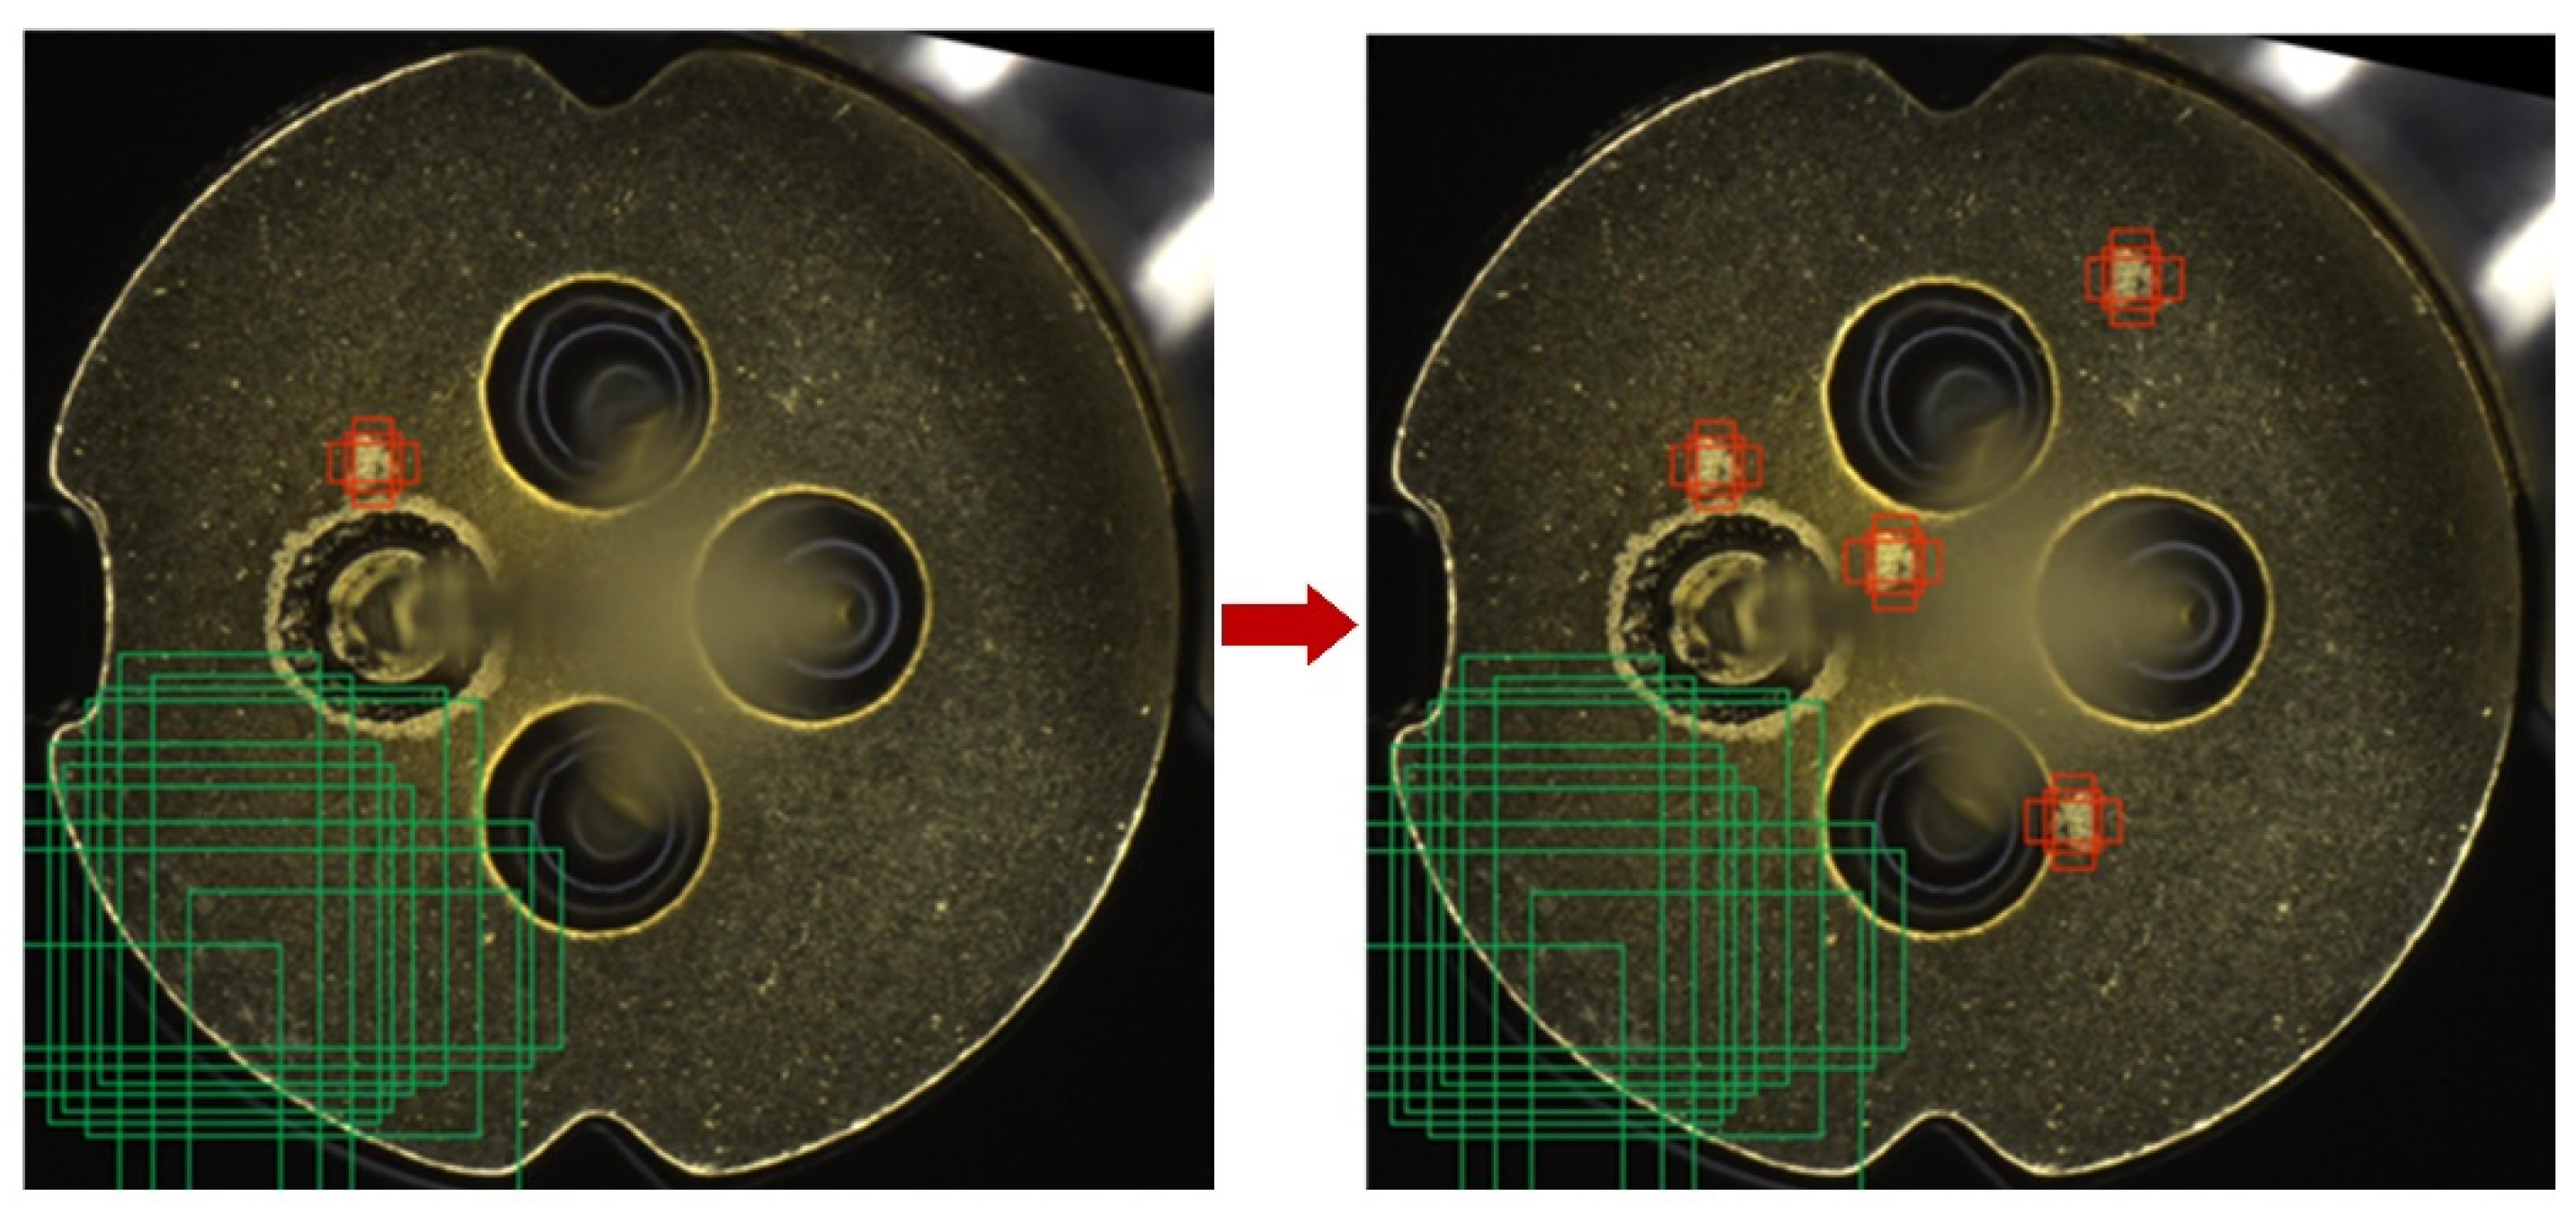
3.2.2. RPM Data Augmentation

In the task of appearance defect detection for metal TO-base, there are a large number of small-target defects in the collected images. There is a big difference between the detection performances of current object detection networks for small targets and large targets. Therefore, although the direct use of the YOLO-V5 algorithm can realize the detection of metal TO-base defects, the detection accuracy is relatively low, especially for the detection of small targets. To improve the detection accuracy of the model for small targets, the random-paste-mosaic (RPM) data augmentation method is proposed to improve the YOLO-V5 algorithm in this study.
Small targets can be divided into two types according to the definition: absolute small targets and relative small targets. The absolute small target is defined as a target smaller than 32 × 32 pixels in the MS COCO dataset. Relative small target refers to the ratio of the target frame to the original image, as defined in Equation (2), δ s < 3% is considered a relative small target.
S gt = w gt × h gt w img × h img ,
where S gt represents the ratio of grand truth box to the original image; w gt and h gt donate the width and height of the ground truth box; w img and h img donate the width and height of the images.
There are two reasons for the poor detection effect of the YOLO-V5 network on small targets: (I) The distribution of small targets in the dataset is unbalanced. In many cases, only a few images contain small objects, causing the detection model to focus more on large and medium targets. (II) The small area occupied by small targets and the lack of diversity in their locations lead to the fact that the number of anchor boxes matched to small targets is lower than that of large and medium targets. Therefore, under the anchor box mechanism of the YOLO-V5 algorithm, the contribution of small targets to the loss function and the detection accuracy of the model for small targets is low. As shown in Figure 5, the number of anchor boxes matched by small target defects is increased by copying and pasting small targets on the image.
By increasing the number of small target labels in the dataset through the RPM data augmentation method, the number of anchors matched by small targets increases, which can improve the contribution of small targets to the loss function calculation during training. Eventually, the detection accuracy of the model for small targets is improved. The specific steps are shown in Algorithm 1.
Algorithm 1: Random-Paste-Mosaic (RPM) Small-Target Data Augmentation Algorithm
Input: Images in the training dataset
Output: Batch Size Enter the picture size
(1) Input the dataset into the neural network to obtain the labels in each image, ensuring that each image has corresponding labels for the defects and no damaged files;
(2) Filter the labels and extract small-target labels according to Equation (2);
(3) Crop and save the filtered small targets in image format to the small-target database;
(4) Select n small-target images randomly from the small-target database for random transformations, including ±20% scaling, ±15° rotation, flipping, and brightness change;
(5) Paste the transformed small-target images c times at random positions of the image in the training dataset while avoiding the overlap with the original defect labels;
(6) Generate the new defect image and label and replace the original one;
(7) Repeat steps (4) to Step (6) until all images in the training dataset complete the random-paste small-target data augmentation operation;
(8) Select four images randomly from the training dataset for mosaic data augmentation.
By adding the RPM module during training, the YOLO-SO algorithm not only increases the number of small objects in an image but also improves the training speed of the network and reduces the memory requirement of the model. Figure 6 presents the process of the RPM data augmentation method. After pasting small-target labels on the dataset, the module randomly calls 4 images for random scaling, random cropping, and random color space adjustments. After stitching the transformed images by placing them in 4 directions: top-left, bottom-left, bottom-right, and top-right, the algorithm combines the image with the ground truth box.

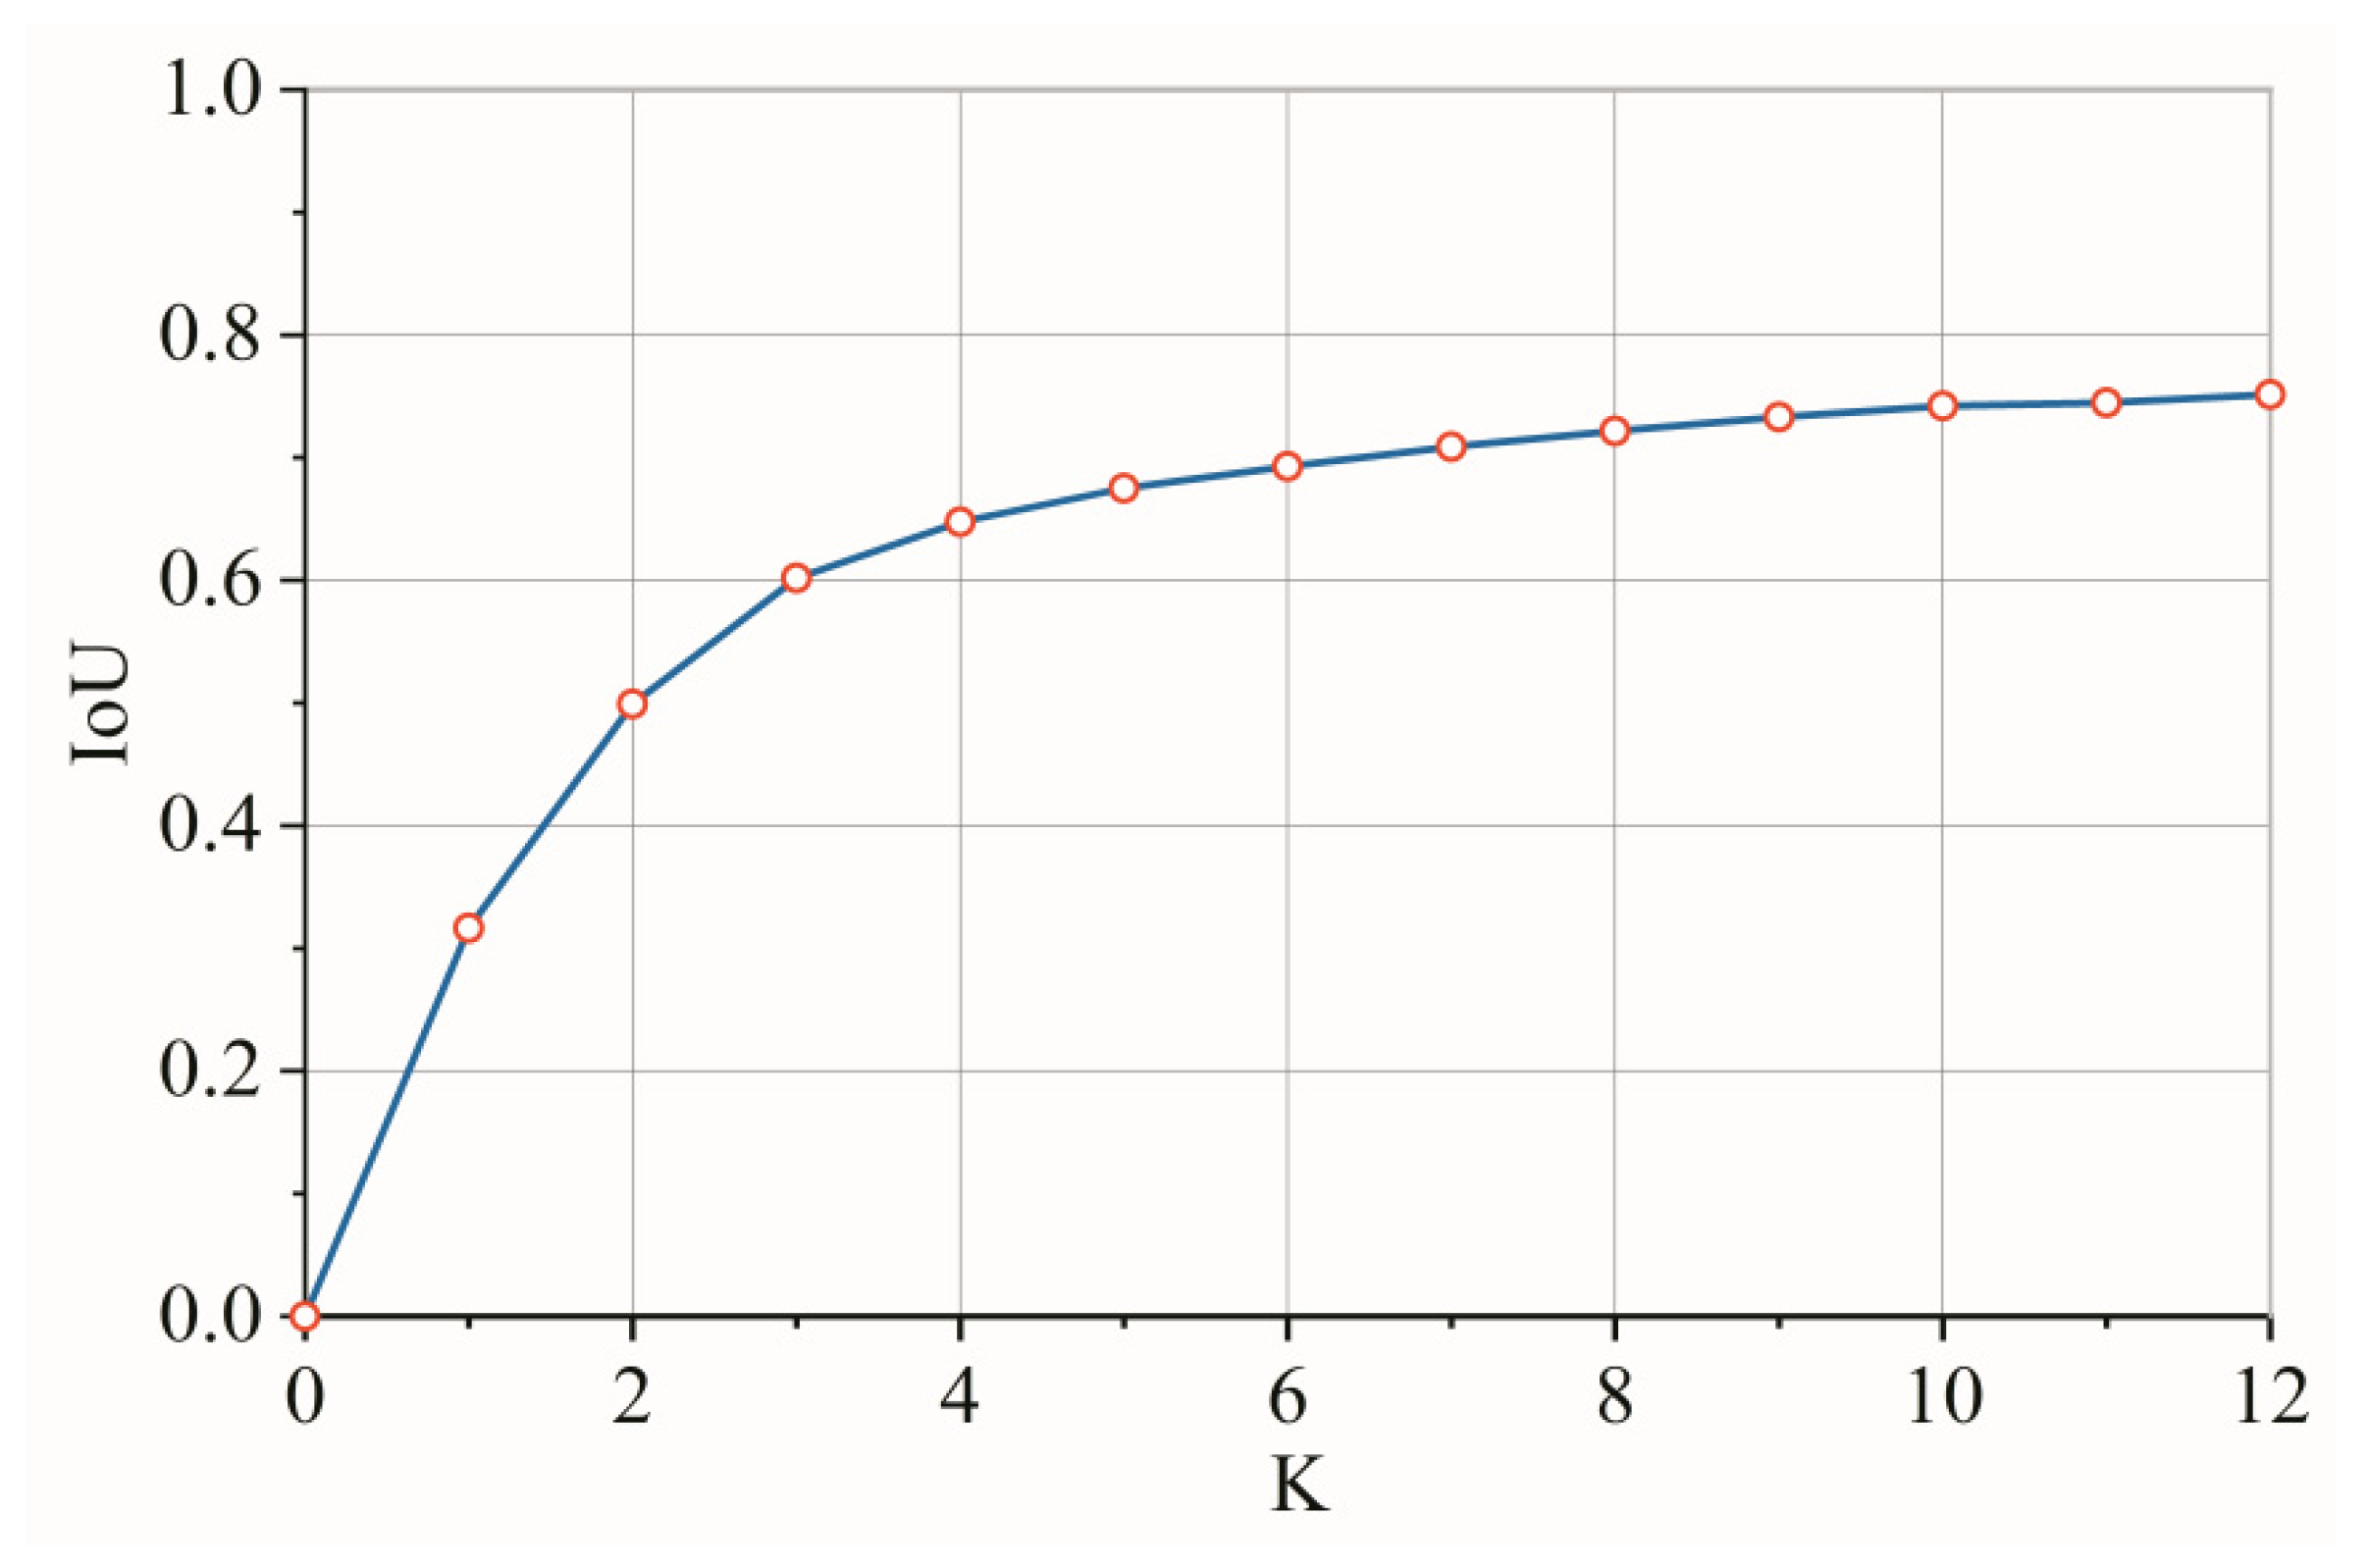
3.2.3. K-Means++ Clustering Algorithm

To efficiently predict the bounding boxes of different scales, the YOLO-V5 algorithm uses the anchor box mechanism to realize the regression and positioning quickly and accurately. Appropriate anchor boxes can reduce the loss value and calculation amount and improve the speed and accuracy of object detection. The original YOLO-V5 anchor boxes were obtained by the K-means clustering algorithm in 20 classes of the Pascal VOC dataset and 80 classes of the MS COCO dataset. A total of 9 initial anchor box sizes are set to assign to feature maps of corresponding sizes to construct the detection ability for targets of different sizes.
Since the K clustering centers of the K-means clustering algorithm are selected randomly, the K-means algorithm is sensitive to the initial values and has randomness, which is not conducive to finding the global optimal solution. According to the disadvantages of the K-means algorithm, the K-means++ algorithm is used to optimize the anchor box for the appearance defect dataset of metal TO-base. As shown in Algorithm 2, The K-means++ algorithm allows the initial clustering centers to be as far away from each other as possible, rather than being generated randomly.
Algorithm 2: K-Means++ Clustering Algorithm
Input: Labels in the training dataset
Output: K anchor boxes
(1) Randomly select a sample from the training data set as the initial clustering center;
(2) Calculate the shortest distance between each sample in the training dataset and the existing clustering center and the probability of being selected as the next clustering center. Select the sample with the highest probability as the next clustering center. Distance (D) and probability (P) are calculated as:
D = 1 IoU ( b o x , c e n ) (3)
P = D ( x ) 2 i = 1 n D ( x i ) 2 (4)
where box refers to the size of the rectangular box; cen refers to the center of the rectangular box; IoU is the intersection over union of two rectangular boxes.
(3) Repeat step (2) until the K clustering centers are selected;
(4) Calculate the distance to the K cluster centers for each sample in the training set and divide it into the class corresponding to the clustering center with the smallest distance;
(5) Recalculate the clustering centers according to the division results according to Equation (5);
C i = 1 | C i | x C i x (5)
(6) Repeat steps (4) and (5) until the clustering center position is no longer changed and the final cluster center is output.

4. Experimental Results and Analysis

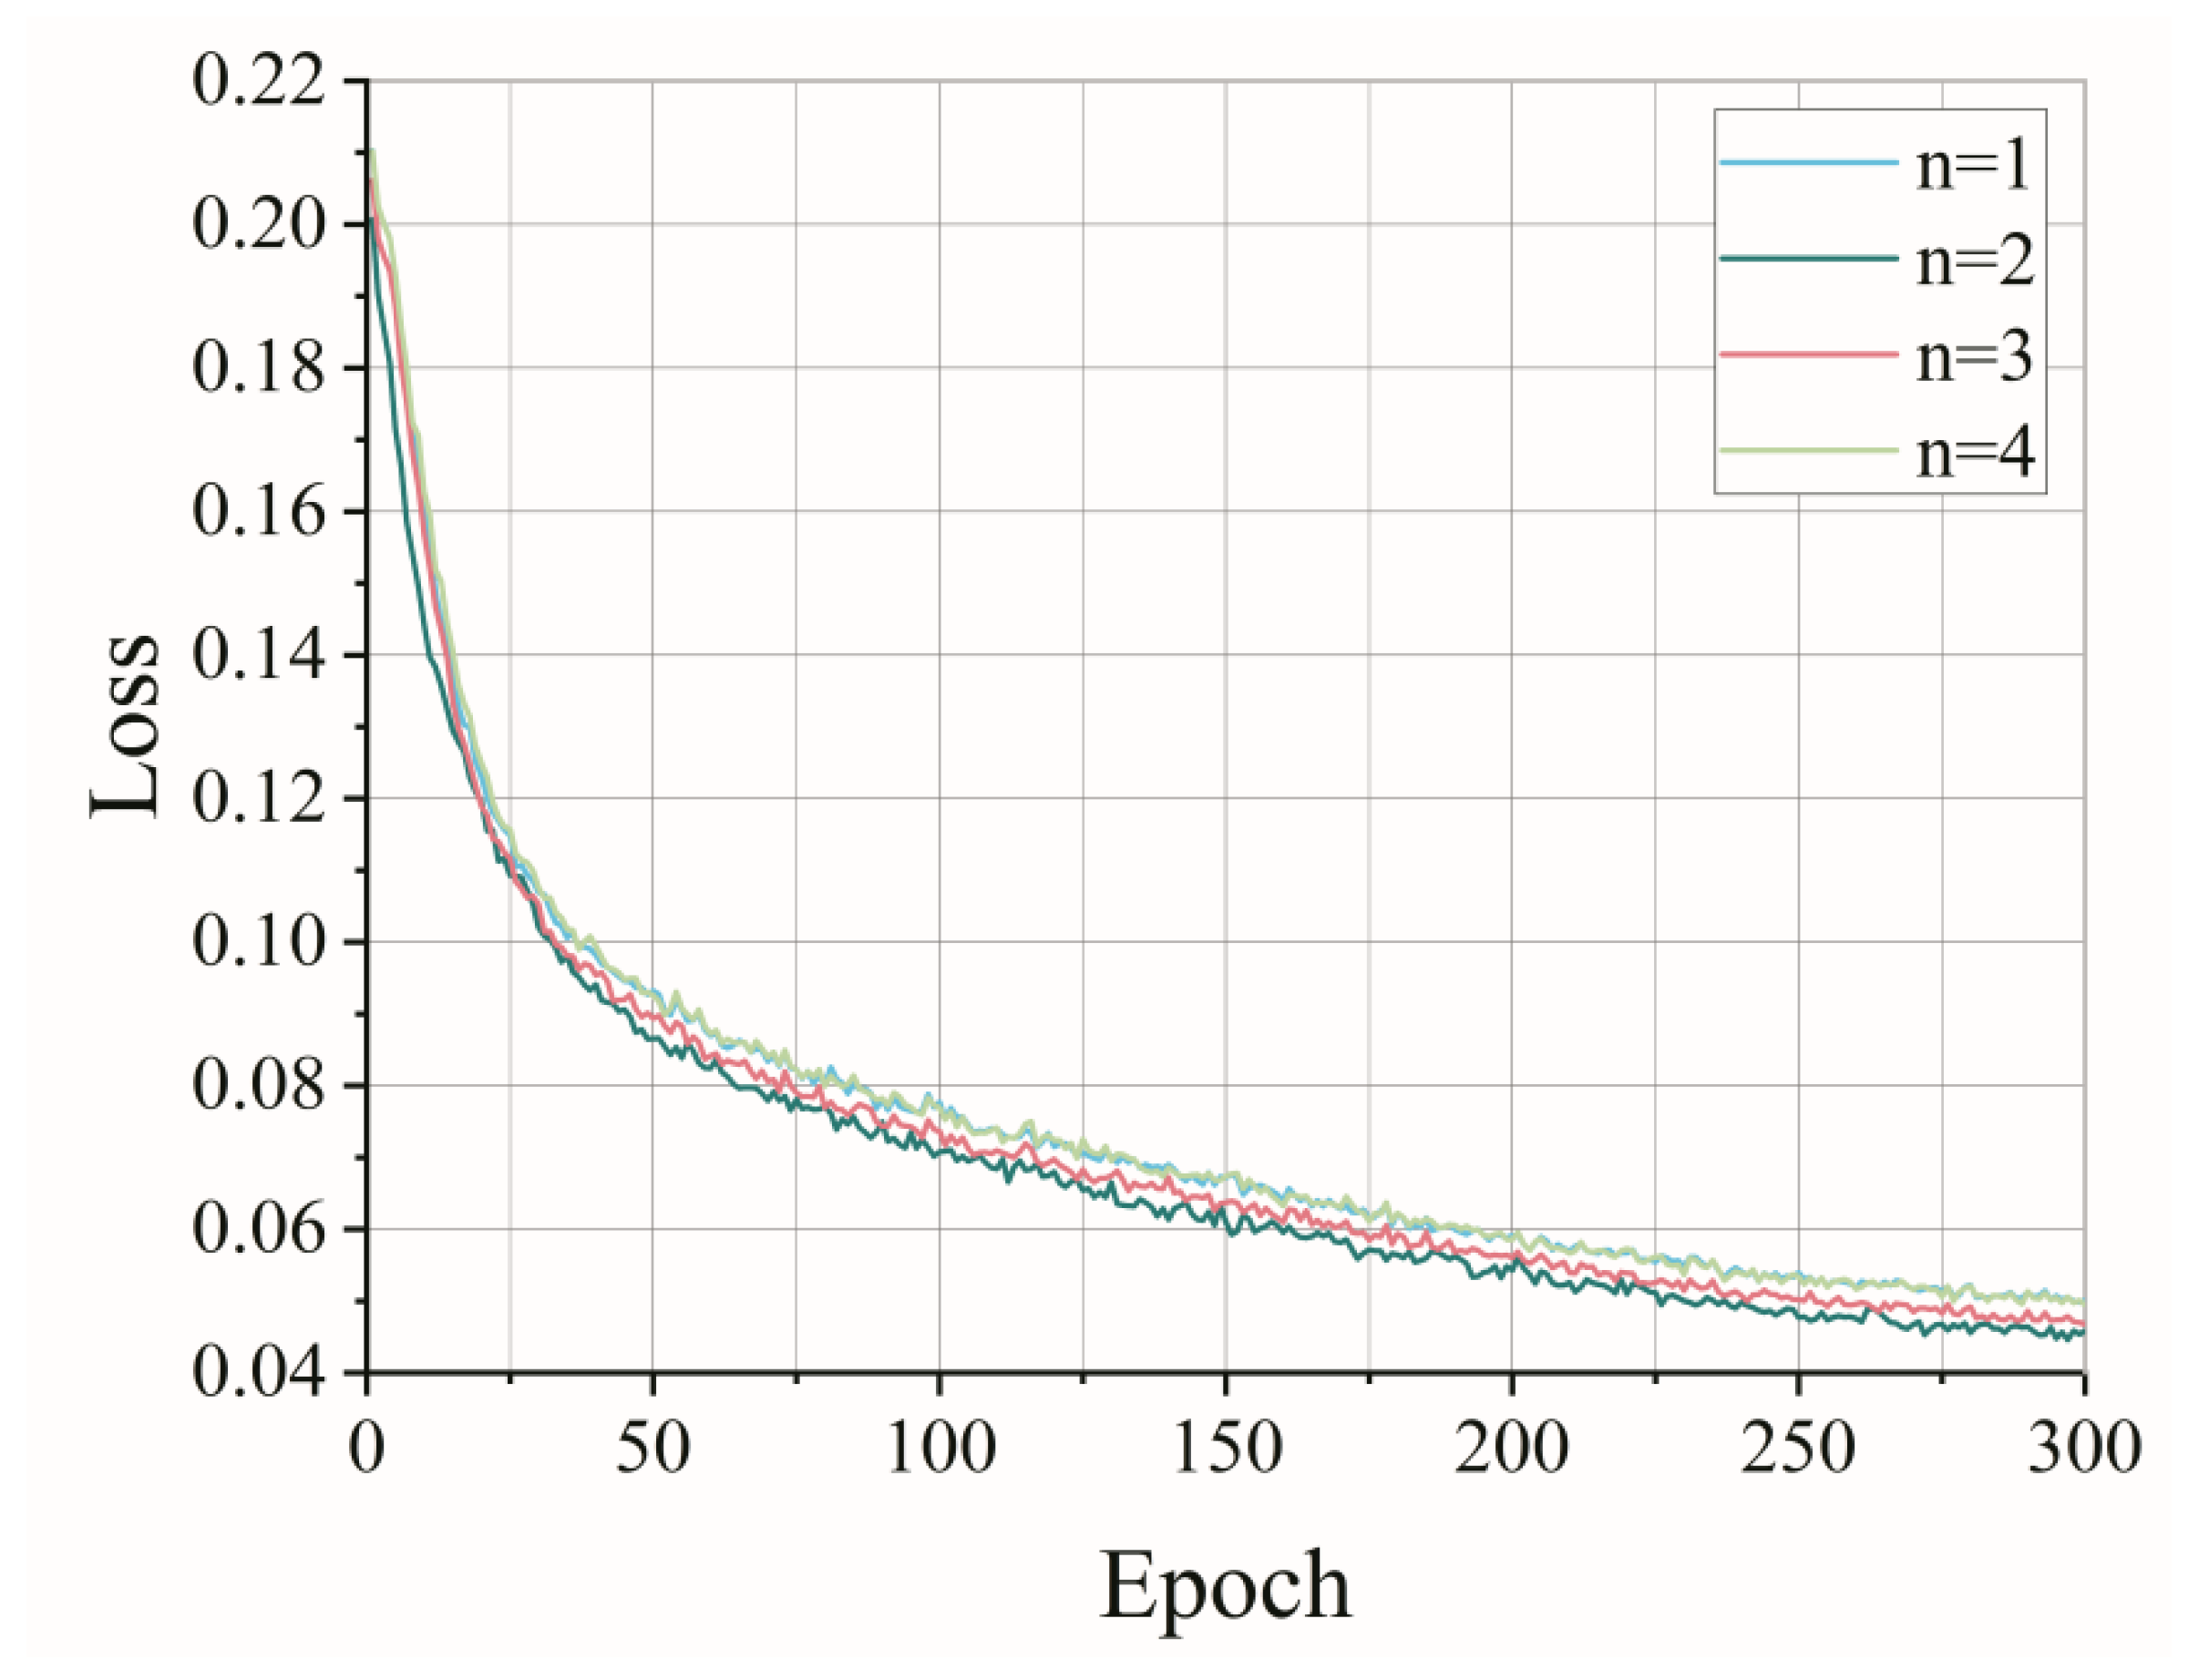
4.1. Experiments and Parameter Determination

All experiments were conducted based on the Pytorch deep learning framework with the programming language of Python. The hardware is configured with an Intel (R) Core (TM) i7-10750H CPU @ 2.60 GHz, 16 GB of RAM, an NVIDIA GeForce GTX 1650Ti (4GB) GPU, and a Windows 10 (64-bit) operating system. The main training parameters are listed in Table 1.
As shown in Figure 7, the small-target defects in the metal TO-base appearance defect dataset were cropped according to Equation (2) and saved to the small-target database. Since there are only medium target labels in the Yinbujun category, there are only five categories in the small-target database. In order to enrich the diversity of the dataset and increase the number of small-target labels, n small-target images were randomly selected from the small-target database and pasted once on each image at a time. Figure 8 shows the relationship between the number of small targets (n) in the RPM data augmentation module and the loss value of YOLO-SO during training. It can be seen that when n = 2, the loss function decreases faster, and the loss value is lowest. Therefore, two small targets are chosen to be pasted onto each image at each time.
In this paper, the K-means++ algorithm is used to cluster the mental TO-base appearance defect dataset. The relationship between the average intersection-over-union (IoU) and the number of anchor boxes K is shown in Figure 9. Since the curve tends to converge when the number of anchor boxes K is taken as 9, K = 9 is selected and the new cluster anchor boxes are obtained as follows: (11,12), (17,15), (15,23), (24,28), (28,53), (40,21), (41,35), (65,74), and (128,134). Table 2 shows the correspondence between the size of anchor boxes and feature maps.
For sufficient comparative experiments, five sets of ablation experiments were designed to evaluate the detection effect of the optimized algorithm in this paper. The original YOLO-V5 algorithm was trained by adding the RPM data augmentation module, CBAM module, and K− Means++ clustering algorithm. Finally, the YOLO-SO algorithm with all modules added was trained and tested on a test set.

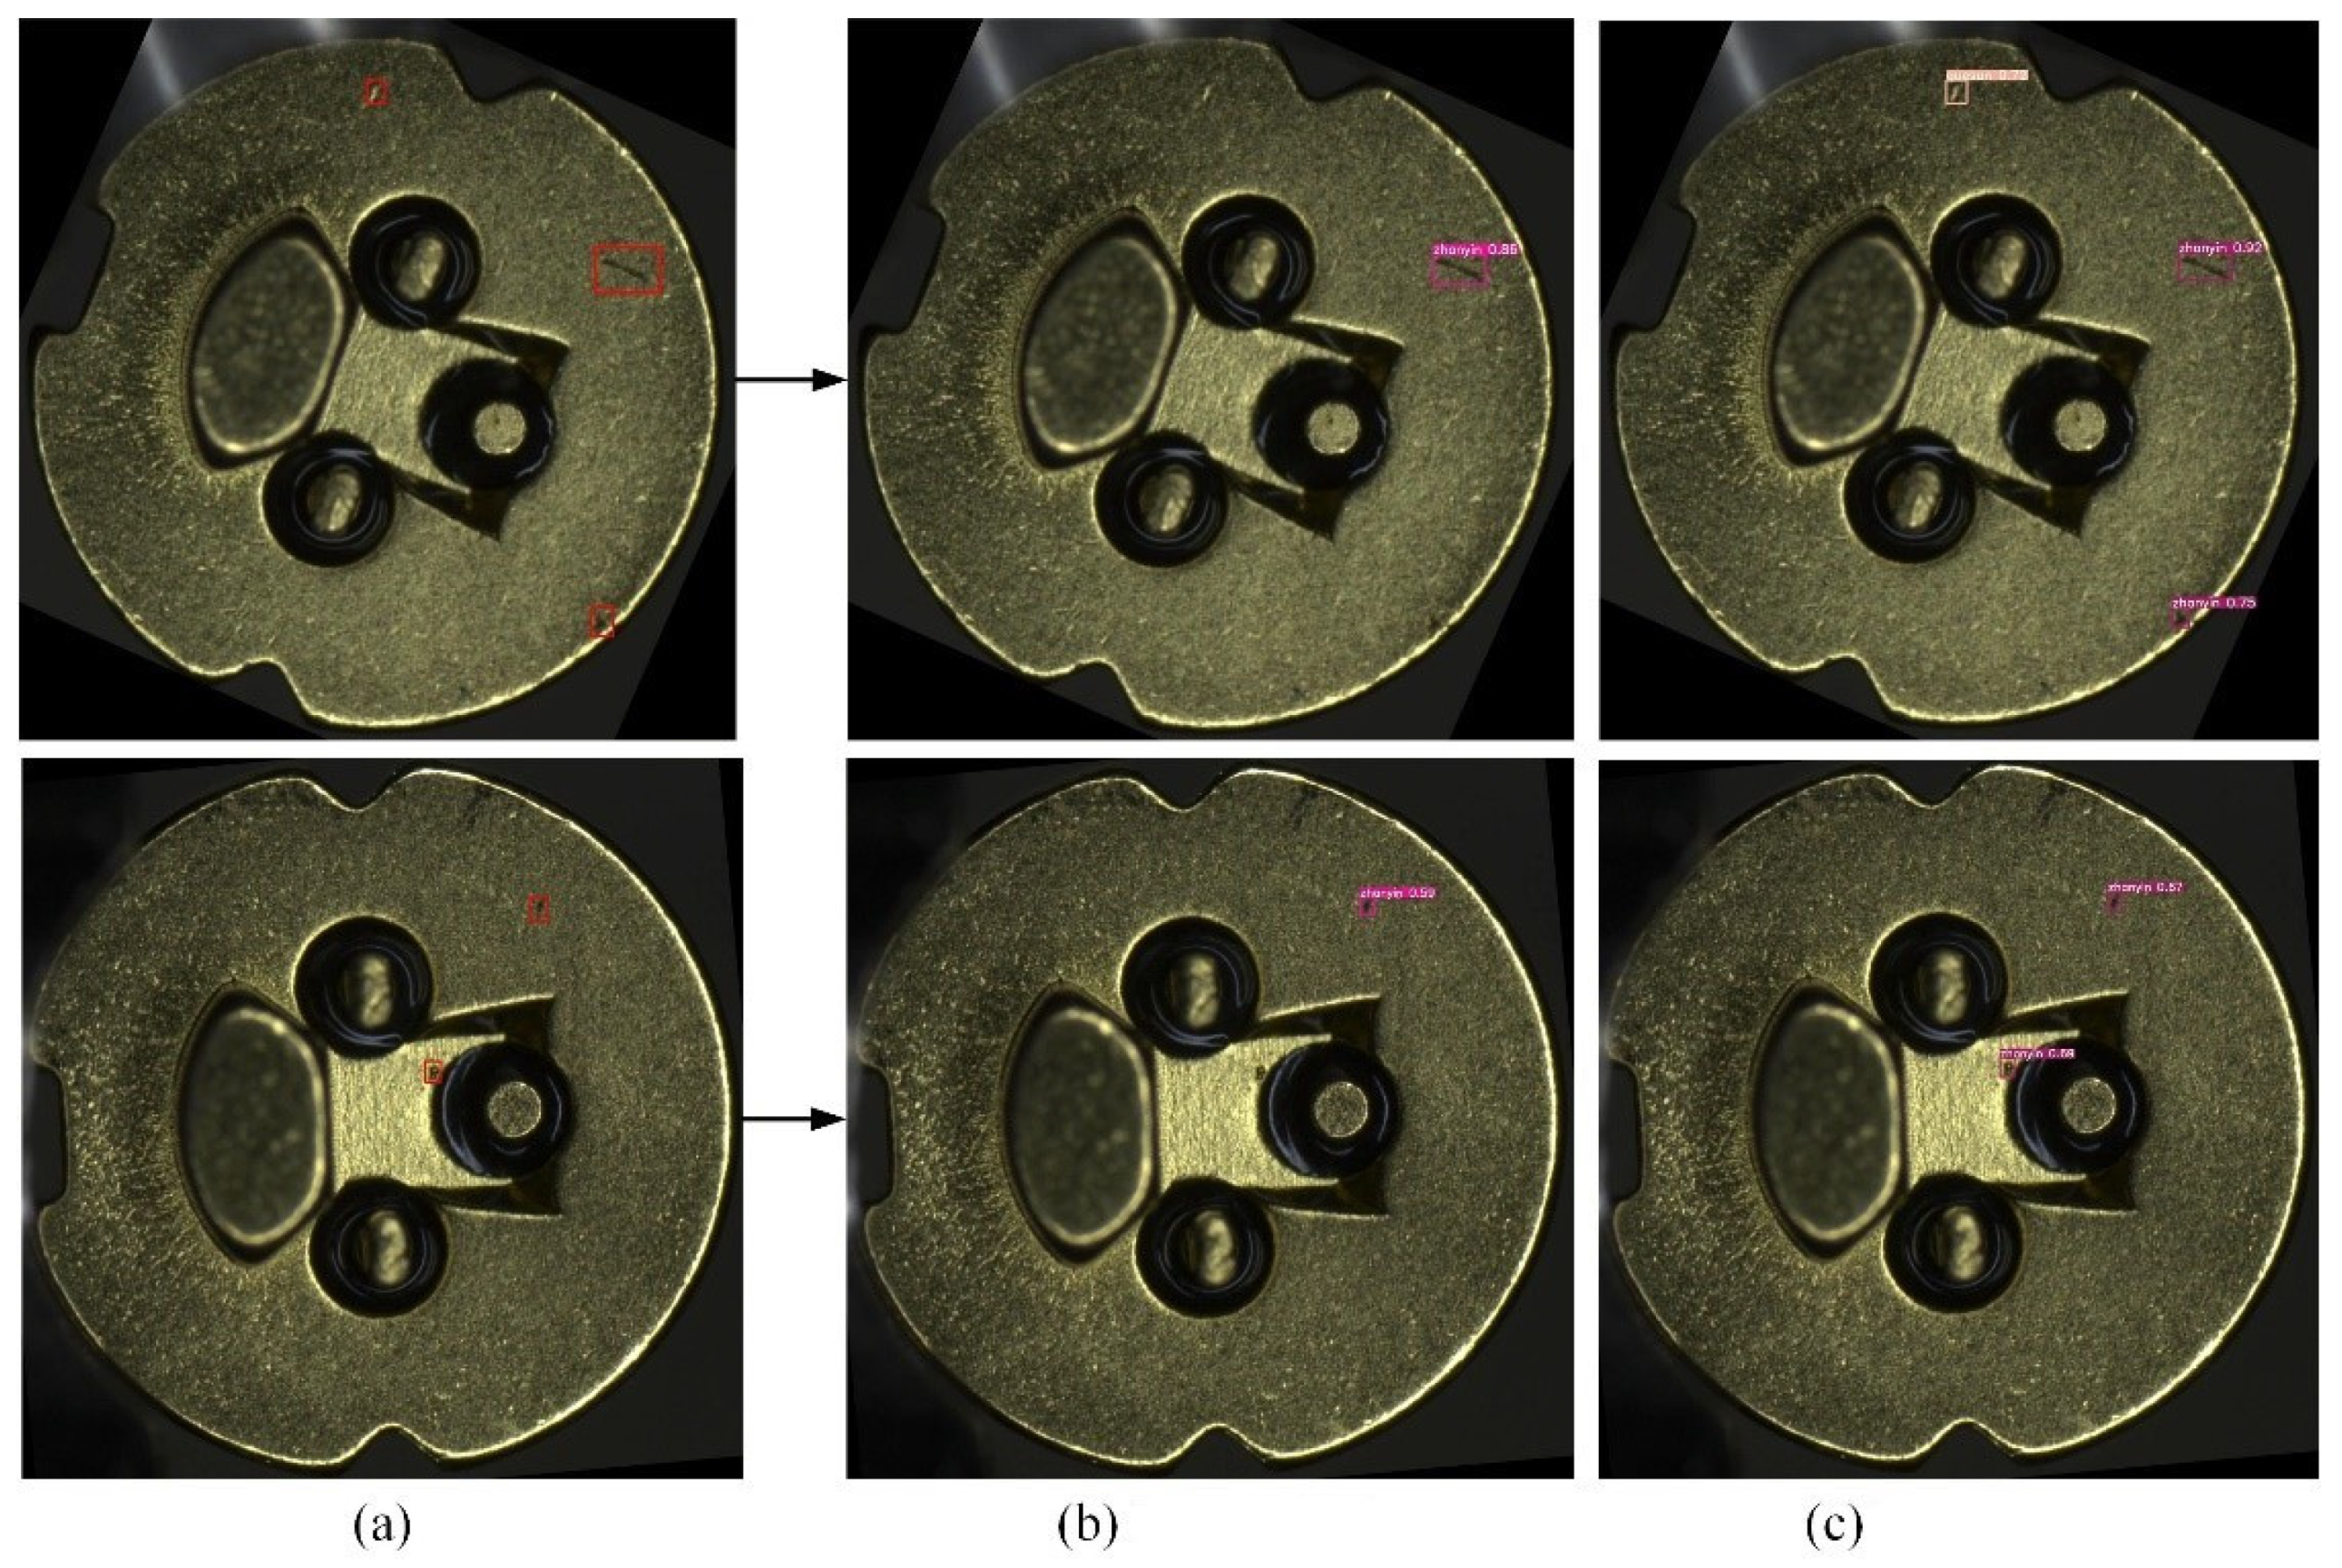
4.2. Evaluation and Analysis of Model Performance

In order to evaluate the feasibility of the proposed method, the improvement points were analyzed one by one through ablation experiments, and then, the performance was compared with the mainstream algorithm. The mAP (mean average precision), FPS (frames per second), and weight size in megabytes (MB) were used as the main evaluation indicators for the detection performance of the algorithm.
The definitions of precision (Pr) and recall (Re) are given in Equations (6) and (7), respectively.
P r = T P T P + F P ,
R e = T P T P + F N ,
where TP refers to the number of true-positive samples; FP refers to the number of false-positive samples; FN refers to the number of false-negative samples.
Average precision (AP) is a comprehensive metric for evaluating the detection accuracy of individual categories. As defined in Equation (8), it is calculated by the enclosed area of the precision–recall (P–R) curve and coordinate axis. The mean average precision (mAP), which is the mean value of the AP for each class, is defined in Equation (9):
A P = 0 1 p ( r ) d r ,
m A P = 1 n i = 0 n A P i ,
where p(r) refers to the P–R curve plotted by precision and recall values; n is the number of defect classes, n = 6 was taken in this experiment.
After the training, the test dataset was used for the comparative test. In total, 150 images to be detected in the test dataset were input into the trained model for testing, and the results are shown in Table 3. As can be seen from the comparison results, the mAP value using the K-means++ clustering algorithm is 80.1%, 1.6% over the original YOLO-V5 using K-means, indicating that the K-means++ algorithm can act as an optimized clustering center, strengthen localization and improve the detection accuracy of the algorithm. The mAP of the CBAM module is 1.3 percentage points higher than the original YOLO-V5 model, and the RPM data augmentation method is improved by 4.3%. The YOLO-SO model improves the mAP by 5.5 percent when compared to the original YOLO-V5 algorithm. Through ablation experiments, the feasibility of YOLO-SO model is verified.
Figure 10 shows the detection results of the origin YOLO-V5 model and YOLO-SO model. It can be clearly seen that the YOLO-SO model has a better detection effect of metal TO-base, especially for small defect targets, indicating that the improved model can effectively reduce the probability of missed detection. Moreover, compared to the origin YOLO-V5 model, the YOLO-SO model has higher accuracy in the prediction box.
In order to further verify the effectiveness, YOLO-SO model was compared with Faster R-CNN, SSD, YOLO-V3, YOLO-V4, and the original YOLO-V5 algorithm with default parameters. Considering the actual production requirements, three aspects of detection performance, weight size, and detection speed were used as the measures. The experimental results are shown in Table 4. It could be found that compared with the other four object detection algorithms and the original YOLO-V5 model, the YOLO-SO model has higher accuracy and faster detection speed. On the basis of the highest detection accuracy with mAP value of 84%, the average frame rate of the YOLO-SO model reaches 25 FPS, which meets the real-time requirement. What’s more, a smaller weight size gives it the potential to be deployed on embedded devices.
In addition, the trained YOLO-SO model was tested on another type of metal TO-base. Since the sample size of this type is relatively small, with only 96 images, it was not trained separately but directly used for testing. Figure 11 shows the visualization results. The experiment demonstrates that the improved YOLO-SO model is not only more accurate in detecting metal TO-base but also has strong robustness and certain generalizability.

5. Conclusions

In this paper, an improved YOLO-V5 model named YOLO-SO is proposed for defect detection of metal TO-base. In order to realize real-time and accurate detection, the YOLO-V5 algorithm was improved by adding CBAM attention mechanism, RPM small-object data augmentation module, and K-means++ clustering algorithm. The experimental findings showed that the proposed YOLO-SO model achieves an accuracy of 84% for mAP value. Through the comparison of experimental results between the proposed YOLO-SO model and other object detection networks such as Faster R-CNN, SSD, and YOLO-V4, it can be demonstrated that the strategy proposed in this study can improve the detection accuracy effectively. Meanwhile, the detection speed of 25 FPS makes the YOLO-SO model possible to apply to the industrial production of real-time defect detection.
In the next work, we aim to further improve the detection speed and accuracy of the YOLO-SO model. Moreover, there are some defects with only a small number of images that need to be detected. Although data augmentation can solve this problem to some extent, few-shot defect detection is one of our next research directions.

Author Contributions

Conceptualization, J.L. and X.Z. (Xingfei Zhu); Data curation, J.L.; Formal analysis, J.L., X.Z. (Xingfei Zhu), and X.Z. (Xingyu Zhou); Funding acquisition, S.Q. and J.Y.; Investigation, J.L., X.Z. (Xingfei Zhu), and X.Z. (Xingyu Zhou); Methodology, J.L. and X.Z. (Xingfei Zhu); Project administration, J.Y.; Resources, X.Z. (Xingfei Zhu) and J.Y.; Software, J.L.; Supervision, X.Z. (Xingyu Zhou) and J.Y.; Validation, J.L. and X.Z. (Xingfei Zhu); Visualization, J.L.; Writing—original draft, J.L.; Writing—review and editing, J.Y. All authors have read and agreed to the published version of the manuscript.

Funding

This research was funded by the National Natural Science Foundation of China, grant number 51775244, and Jiangsu Key Laboratory of Advanced Food Manufacturing Equipment and Technology, grant number FMZ201901.

Institutional Review Board Statement

Not applicable.

Informed Consent Statement

Not applicable.

Data Availability Statement

Not applicable.

Conflicts of Interest

The authors declare no conflict of interest.

References

  1. Chien, H.T.; Lee, D.S.; Ding, P.P.; Chiu, S.L.; Chen, P.H. Disk-shaped miniature heat pipe (DMHP) with radiating micro grooves for a to can laser diode package. IEEE Trans. Compon. Packag. Technol. 2003, 26, 569–574. [Google Scholar] [CrossRef]
  2. Wu, Y.L.; Zhang, A.C.; Chun, J.; Li, S.Y. Simulation and experimental study of laser hammering for laser diode packaging. IEEE Trans. Compon. Packag. Technol. 2007, 30, 163–169. [Google Scholar] [CrossRef]
  3. Shih, T.T.; Lin, M.C.; Cheng, W.H. High-Performance Low-Cost 10-Gb/s Coaxial DFB Laser Module Packaging by Conventional TO-Can Materials and Processes. IEEE J. Sel. Top. Quantum Electron. 2006, 12, 1009–1016. [Google Scholar] [CrossRef]
  4. Shih, T.T.; Tseng, P.H.; Chen, H.W.; Tien, C.C.; Wu, S.M.; Cheng, W.H. Low-Cost TO-Can Header for Coaxial Laser Modules in 25-Gbit/s Transmission Applications. IEEE Trans. Compon. Packag. Manuf. Technol. 2011, 1, 557–565. [Google Scholar] [CrossRef]
  5. Tandon, N.; Choudhury, A. A review of vibration and acoustic measurement methods for the detection of defects in rolling element bearings. Tribol. Int. 1999, 32, 469–480. [Google Scholar] [CrossRef]
  6. Li, M.; Jia, J.; Lu, X.; Zhang, Y. A Method of Surface Defect Detection of Irregular Industrial Products Based on Machine Vision. Wirel. Commun. Mob. Comput. 2021, 2021, 6630802. [Google Scholar] [CrossRef]
  7. Dalal, N.; Triggs, B. Histograms of oriented gradients for human detection. In Proceedings of the 2005 IEEE Computer Society Conference on Computer Vision and Pattern Recognition (CVPR’05), San Diego, CA, USA, 20–25 June 2005. [Google Scholar]
  8. Lowe, D.G. Object recognition from local scale-invariant features. In Proceedings of the Seventh IEEE International Conference on Computer Vision, Kerkyra, Greece, 20–27 September 1999. [Google Scholar]
  9. Papageorgiou, C.P.; Oren, M.; Poggio, T. General framework for object detection. In Proceedings of the Sixth International Conference on Computer Vision, Mumbai, India, 7 January 1998. [Google Scholar]
  10. Yang, J.; Li, S.; Wang, Z.; Dong, H.; Wang, J.; Tang, S. Using Deep Learning to Detect Defects in Manufacturing: A Comprehensive Survey and Current Challenges. Materials 2020, 13, 5755. [Google Scholar] [CrossRef]
  11. Lv, X.; Duan, F.; Jiang, J.J.; Fu, X.; Gan, L. Deep Metallic Surface Defect Detection: The New Benchmark and Detection Network. Sensors 2020, 20, 1562. [Google Scholar] [CrossRef] [Green Version]
  12. Sultana, F.; Sufian, A.; Dutta, P. Advancements in Image Classification using Convolutional Neural Network. In Proceedings of the 2018 Fourth International Conference on Research in Computational Intelligence and Communication Networks (ICRCICN), Kolkata, India, 22–23 November 2018. [Google Scholar]
  13. Zhou, X.; Wei, G.; Fu, W.L.; Du, F. Application of deep learning in object detection. In Proceedings of the 2017 IEEE/ACIS 16th International Conference on Computer and Information Science (ICIS), Wuhan, China, 24–26 May 2017. [Google Scholar]
  14. Shelhamer, E.; Long, J.; Darrell, T. Fully Convolutional Networks for Semantic Segmentation. IEEE Trans. Pattern Anal. Mach. Intell. 2017, 39, 640–651. [Google Scholar] [CrossRef]
  15. Grigorescu, S.; Trasnea, B.; Cocias, T.; Macesanu, G. A survey of deep learning techniques for autonomous driving. J. Field Robot. 2020, 37, 362–386. [Google Scholar] [CrossRef]
  16. Zhang, K.; Zhang, Z.; Li, Z.; Qiao, Y. Joint Face Detection and Alignment Using Multitask Cascaded Convolutional Networks. IEEE Signal Processing Lett. 2016, 23, 1499–1503. [Google Scholar] [CrossRef] [Green Version]
  17. Wu, D.; Wang, C.; Wu, Y.; Wang, Q.C.; Huang, D.S. Attention Deep Model with Multi-Scale Deep Supervision for Person Re-Identification. IEEE Trans. Emerg. Top. Comput. Intell. 2021, 5, 70–78. [Google Scholar] [CrossRef]
  18. Mery, D. Aluminum Casting Inspection using Deep Object Detection Methods and Simulated Ellipsoidal Defects. Mach. Vis. Appl. 2021, 32, 72. [Google Scholar] [CrossRef]
  19. Girshick, R.; Donahue, J.; Darrell, T.; Malik, J. Rich Feature Hierarchies for Accurate Object Detection and Semantic Segmentation. In Proceedings of the 2014 IEEE Conference on Computer Vision and Pattern Recognition, Columbus, OH, USA, 23–28 June 2014. [Google Scholar]
  20. Girshick, R. Fast R-CNN. In Proceedings of the 2015 IEEE International Conference on Computer Vision (ICCV), Santiago, Chile, 7–13 December 2015. [Google Scholar]
  21. Ren, S.; He, K.; Girshick, R.; Sun, J. Faster R-CNN: Towards Real-Time Object Detection with Region Proposal Networks. IEEE Trans. Pattern Anal. Mach. Intell. 2017, 39, 1137–1149. [Google Scholar] [CrossRef] [PubMed] [Green Version]
  22. Lin, T.Y.; Dollár, P.; Girshick, R.; He, K.; Hariharan, B.; Belongie, S. Feature Pyramid Networks for Object Detection. In Proceedings of the 2017 IEEE Conference on Computer Vision and Pattern Recognition (CVPR), Honolulu, HI, USA, 21–26 July 2017. [Google Scholar]
  23. Xu, Z.H.; Lan, S.W.; Yang, Z.J.; Cao, J.Z.; Wu, Z.Z.; Cheng, Y.Q. MSB R-CNN: A Multi-Stage Balanced Defect Detection Network. Electronics 2021, 10, 1924. [Google Scholar] [CrossRef]
  24. Zhang, K.H.; Shen, H.K. Solder Joint Defect Detection in the Connectors Using Improved Faster-RCNN Algorithm. Appl. Sci. 2021, 11, 576. [Google Scholar] [CrossRef]
  25. Liu, W.; Anguelov, D.; Erhan, D.; Szegedy, C.; Reed, S.; Fu, C.-Y.; Berg, A.C. SSD: Single Shot MultiBox Detector. In Proceedings of the European Conference on Computer Vision (ECCV), Amsterdam, The Netherlands, 11–14 October 2016. [Google Scholar]
  26. Redmon, J.; Divvala, S.; Girshick, R.; Farhadi, A. You Only Look Once: Unified, Real-Time Object Detection. In Proceedings of the 2016 IEEE Conference on Computer Vision and Pattern Recognition (CVPR), Las Vegas, NV, USA, 27–30 June 2016. [Google Scholar]
  27. Redmon, J.; Farhadi, A. YOLO9000: Better, Faster, Stronger. In Proceedings of the 2017 IEEE Conference on Computer Vision and Pattern Recognition (CVPR), Honolulu, HI, USA, 21–26 July 2017. [Google Scholar]
  28. Redmon, J.; Farhadi, A. YOLOv3: An Incremental Improvement. arXiv 2018, arXiv:1804.02767. [Google Scholar]
  29. Zhao, B.; Dai, M.; Li, P.; Xue, R.; Ma, X. Defect Detection Method for Electric Multiple Units Key Components Based on Deep Learning. IEEE Access 2020, 8, 136808–136818. [Google Scholar] [CrossRef]
  30. Duan, L.; Yang, K.; Ruan, L. Research on Automatic Recognition of Casting Defects Based on Deep Learning. IEEE Access 2021, 9, 12209–12216. [Google Scholar] [CrossRef]
  31. Liu, C.; Wu, Y.; Liu, J.; Han, J. MTI-YOLO: A Light-Weight and Real-Time Deep Neural Network for Insulator Detection in Complex Aerial Images. Energies 2021, 14, 1426. [Google Scholar] [CrossRef]
  32. Wang, C.-Y.; Liao, H.-Y.M.; Yeh, I.-H.; Wu, Y.-H.; Chen, P.-Y.; Hsieh, J.-W. CSPNet: A New Backbone that Can Enhance Learning Capability of CNN. arXiv 2019, arXiv:1911.11929. [Google Scholar]
Figure 1. TO-can package of LD.
Electronics 11 01561 g001
Figure 2. Six typical appearance defect images and labels of metal TO-base. (a) Baiban: patchy defects on the plated surface; (b) Quesun: defective parts; (c) Yinbujun: uneven bonding of conductive silver paste; (d) Zhanyin: conductive silver paste contaminates the surface; (e) Xiuji: flaky or dotted rust on the surface; (f) Huahen: scratches greater than 1mm in length or 0.03 mm in depth.
Electronics 11 01561 g002
Figure 3. Structure of YOLO-V5s network.
Electronics 11 01561 g003
Figure 4. Structure of CBAM module.
Electronics 11 01561 g004
Figure 5. Schematic illustration of anchors matching the ground truth objects.
Electronics 11 01561 g005
Figure 6. RPM data augmentation.
Electronics 11 01561 g006
Figure 7. Example of small-target defects: (a) on the original image; (b) stored in the small-target database.
Electronics 11 01561 g007
Figure 8. Loss curve with the number of RPM paste.
Electronics 11 01561 g008
Figure 9. Average IoU varying with the number of anchor boxes.
Electronics 11 01561 g009
Figure 10. Examples of detection results from (a) original YOLO-V5 algorithm (b) YOLO-SO algorithm.
Electronics 11 01561 g010
Figure 11. Detection results of another type of metal TO-base: (a) ground truth box; (b) predictions of YOLO-V5; (c) predictions of YOLO-SO.
Electronics 11 01561 g011
Table 1. Training parameters of YOLO-SO.
ParametersValue
WeightYolov5s.pt
Batch size8
Origin learning rate0.01
Epochs300
Momentum0.937
Non-maximum suppression (NMS)0.6
Table 2. Correspondence between anchor boxes and feature maps.
Feature Map Size (Pixels × Pixels)Detection ObjectAnchor Box Size (Pixels × Pixels)
Original YOLO-V5Original YOLO-V5
20 × 20Large target10 × 13, 16 × 30, 33 × 2311 × 12, 17 × 15, 15 × 23
40 × 40Medium target30 × 61, 62 × 45, 59 × 11924 × 28, 28 × 53, 40 × 21
80 × 80Small target116 × 90, 156 × 98, 373 × 32641 × 35, 65 × 74, 128 × 134
Table 3. Ablation experiment of YOLO models.
ModelPr (%)Re (%)mAP (%)
Baseline88.675.078.5
Baseline + K-means++87.575.480.1
Baseline + CBAM87.475.779.8
Baseline + RPM89.280.282.8
Baseline + RPM + CBAM + K-means++91.977.884.0
Table 4. Result evaluation of different object detection models.
ModelAP (%)mAP (%)FPSWeight Size (MB)
BaibanQuesunYinbujunZhanyinXiujiHuahen
Faster R-CNN62.975.810061.165.056.370.26315.2
SSD45.050.893.342.557.615.350.819105.0
YOLO-V351.376.694.775.164.943.367.611235.2
YOLO-V459.878.196.076.682.547.673.49244.5
YOLO-V567.080.599.580.187.456.578.52413.7
YOLO-SO74.483.999.582.292.771.684.02513.8
Publisher’s Note: MDPI stays neutral with regard to jurisdictional claims in published maps and institutional affiliations.

